Embed Size (px)
Citation preview

INCORPORATING APPENDIX 4D30 JUNE 2020
For
per
sona
l use
onl
y
CONTENTS
On the cover The Woodside operated North West Shelf Project’s Karratha Gas Plant.
About WoodsideWoodside led the development of the LNG industry in Australia and is applying this same pioneering spirit to solving future energy challenges.
Overview 3
Financial summary 4
Base business 7
Developments 8
Sustainability 10
Governance 11
Half-Year Financial Statements 12
Shareholder information 21
Inside cover Storage facilities at the Woodside operated Pluto LNG.
For more information about Woodside’s assets and activities, visit: www.woodside.com.au/about-us
Appendix 4DResults for announcement to the market
More information on page 20
US$ million
Revenue from ordinary activities Decreased 16%1 to 1,907
Net loss for the period attributable to equity holders of the parent
Decreased 1,071%1 to 4,067
Underlying net profit after tax2 Decreased 28%1 to 303
Free cash flow2 Decreased 70%1 to 264
Interim dividend – fully franked 26 US cps H1 2020
Record date for determining entitlements to the dividend 25 August 2020
1. Comparisons are to the half-year ended 30 June 2019.2. These are non-IFRS measures that are unaudited but derived from auditor reviewed Half-Year Financial
Statements. These measures are presented to provide insight into Woodside’s performance. Refer to pages 4 and 5 for details.
For
per
sona
l use
onl
y
Woodside Petroleum Ltd | Half-Year Report 2020 Overview | 3
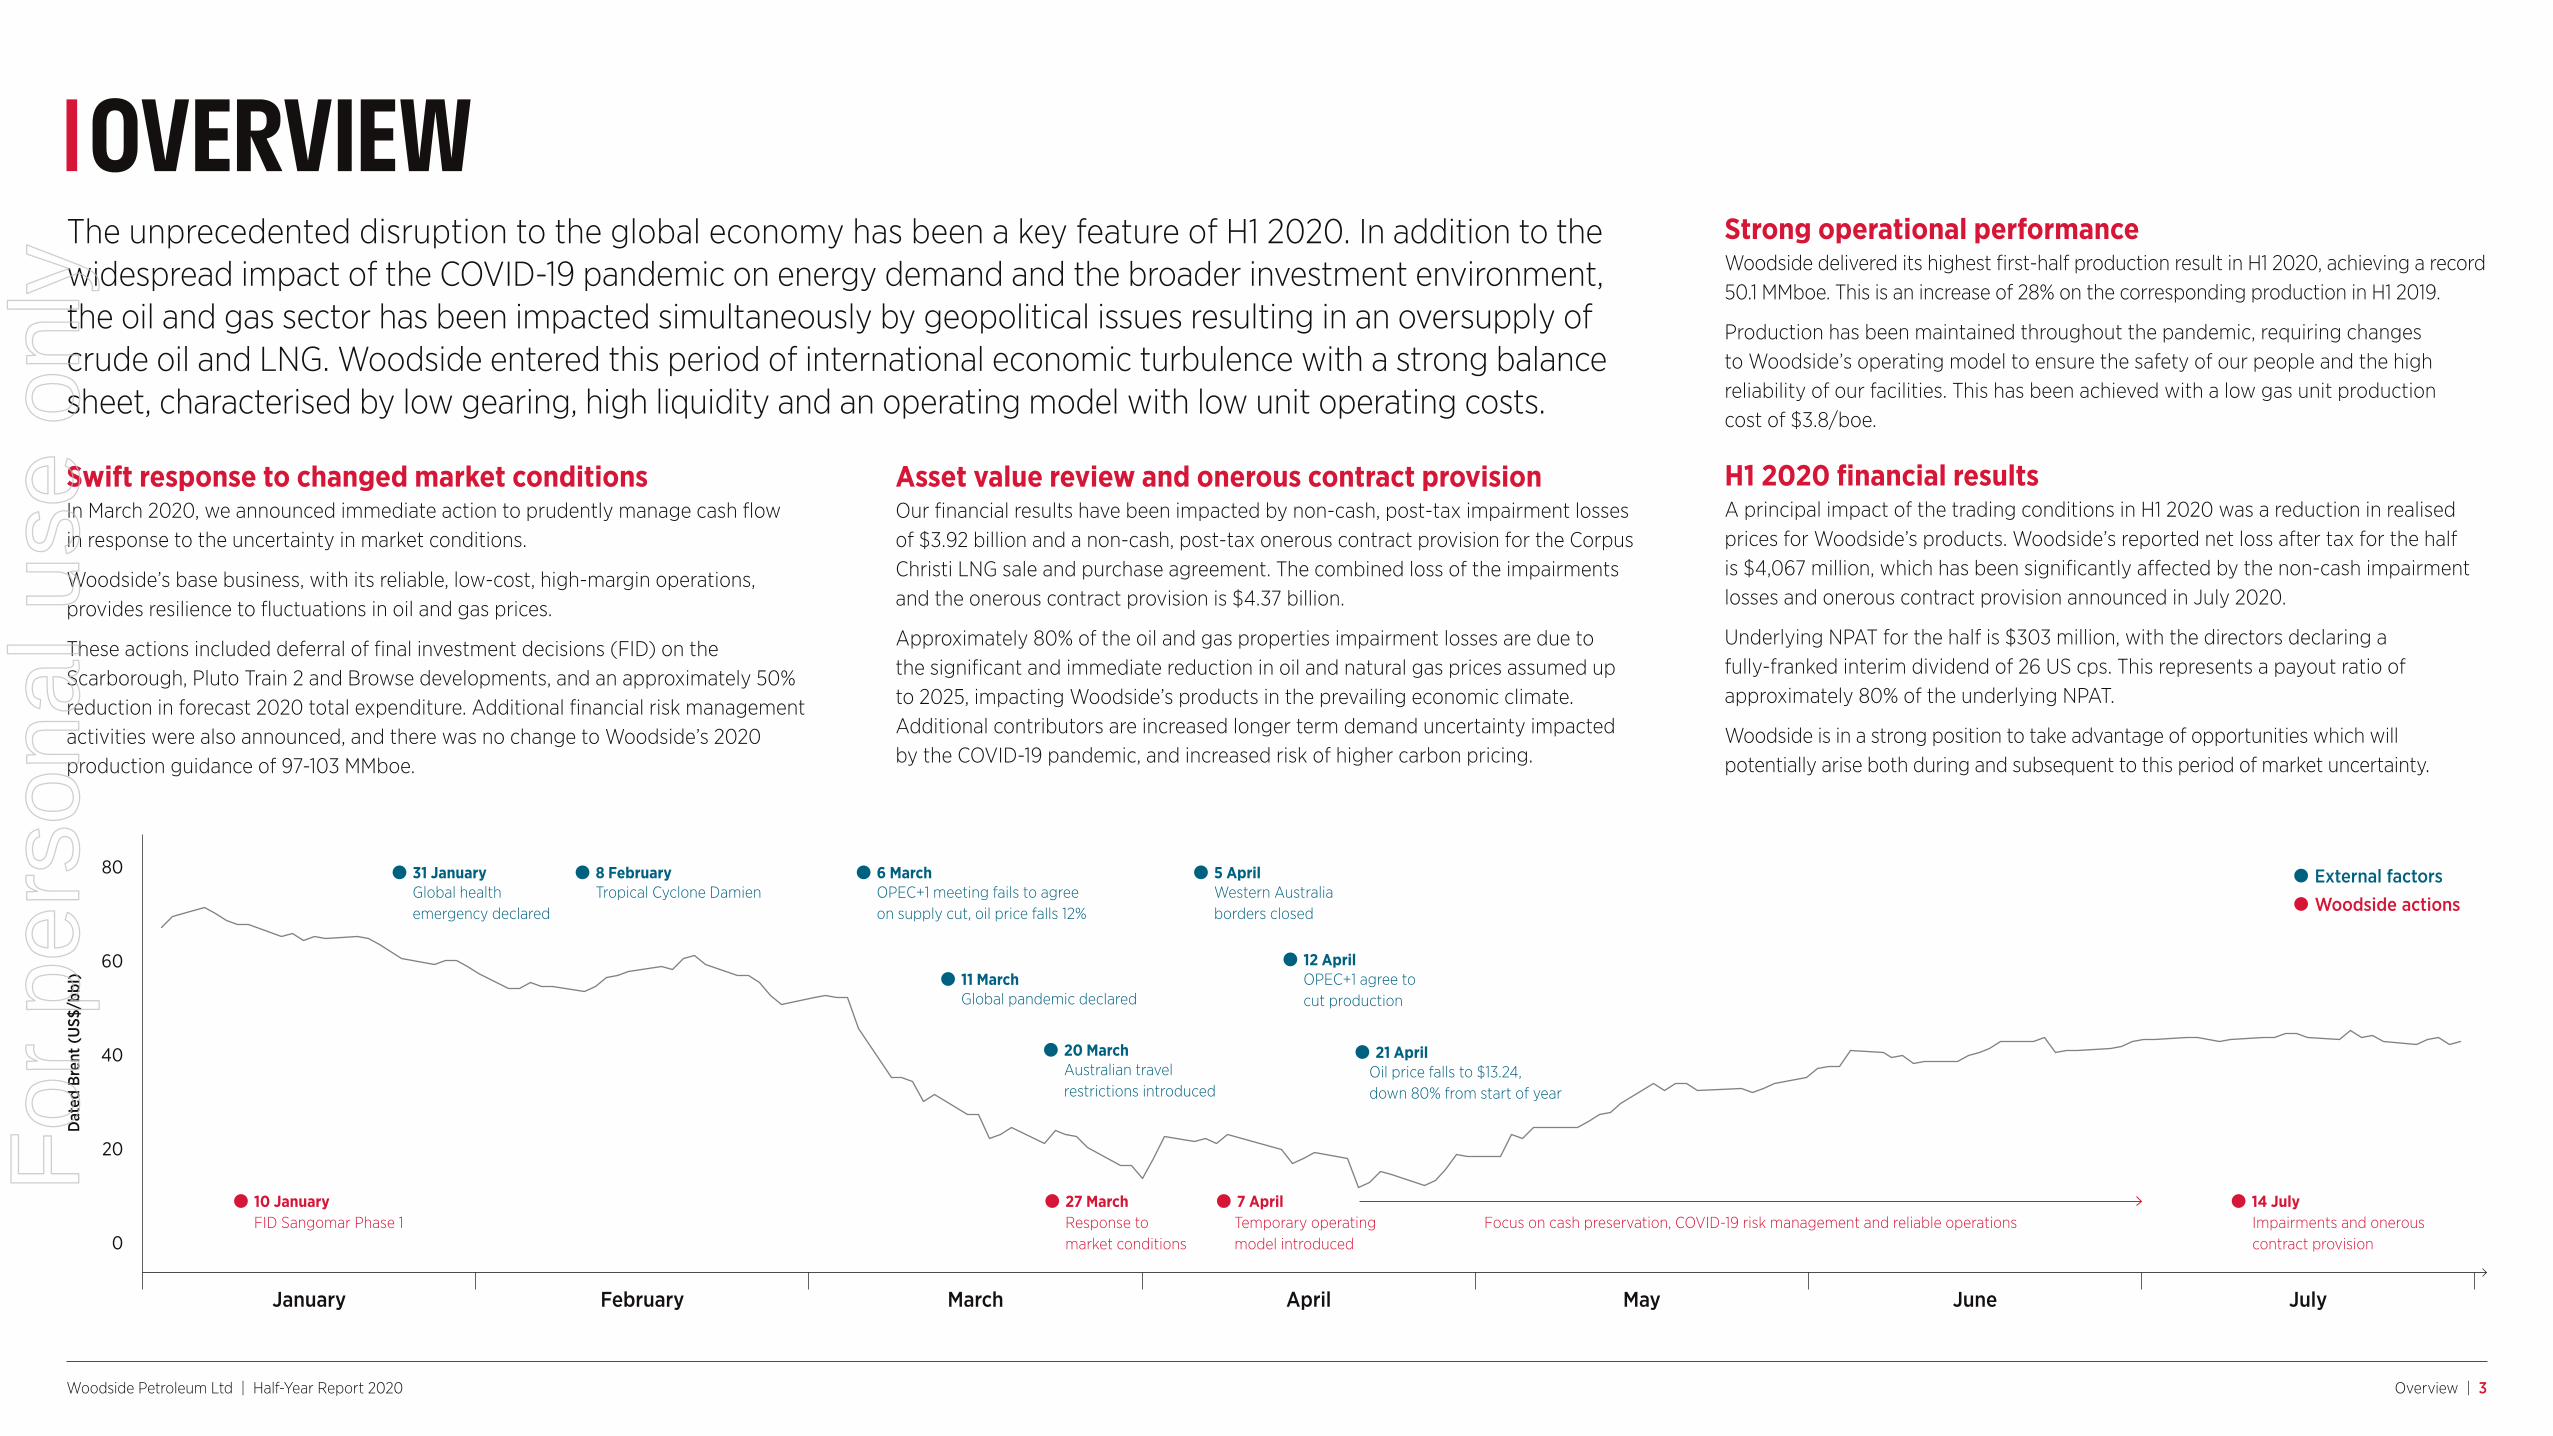
OVERVIEWThe unprecedented disruption to the global economy has been a key feature of H1 2020. In addition to the widespread impact of the COVID-19 pandemic on energy demand and the broader investment environment, the oil and gas sector has been impacted simultaneously by geopolitical issues resulting in an oversupply of crude oil and LNG. Woodside entered this period of international economic turbulence with a strong balance sheet, characterised by low gearing, high liquidity and an operating model with low unit operating costs.
Swift response to changed market conditionsIn March 2020, we announced immediate action to prudently manage cash flow in response to the uncertainty in market conditions.
Woodside’s base business, with its reliable, low-cost, high-margin operations, provides resilience to fluctuations in oil and gas prices.
These actions included deferral of final investment decisions (FID) on the Scarborough, Pluto Train 2 and Browse developments, and an approximately 50% reduction in forecast 2020 total expenditure. Additional financial risk management activities were also announced, and there was no change to Woodside’s 2020 production guidance of 97-103 MMboe.
Asset value review and onerous contract provisionOur financial results have been impacted by non-cash, post-tax impairment losses of $3.92 billion and a non-cash, post-tax onerous contract provision for the Corpus Christi LNG sale and purchase agreement. The combined loss of the impairments and the onerous contract provision is $4.37 billion.
Approximately 80% of the oil and gas properties impairment losses are due to the significant and immediate reduction in oil and natural gas prices assumed up to 2025, impacting Woodside’s products in the prevailing economic climate. Additional contributors are increased longer term demand uncertainty impacted by the COVID-19 pandemic, and increased risk of higher carbon pricing.
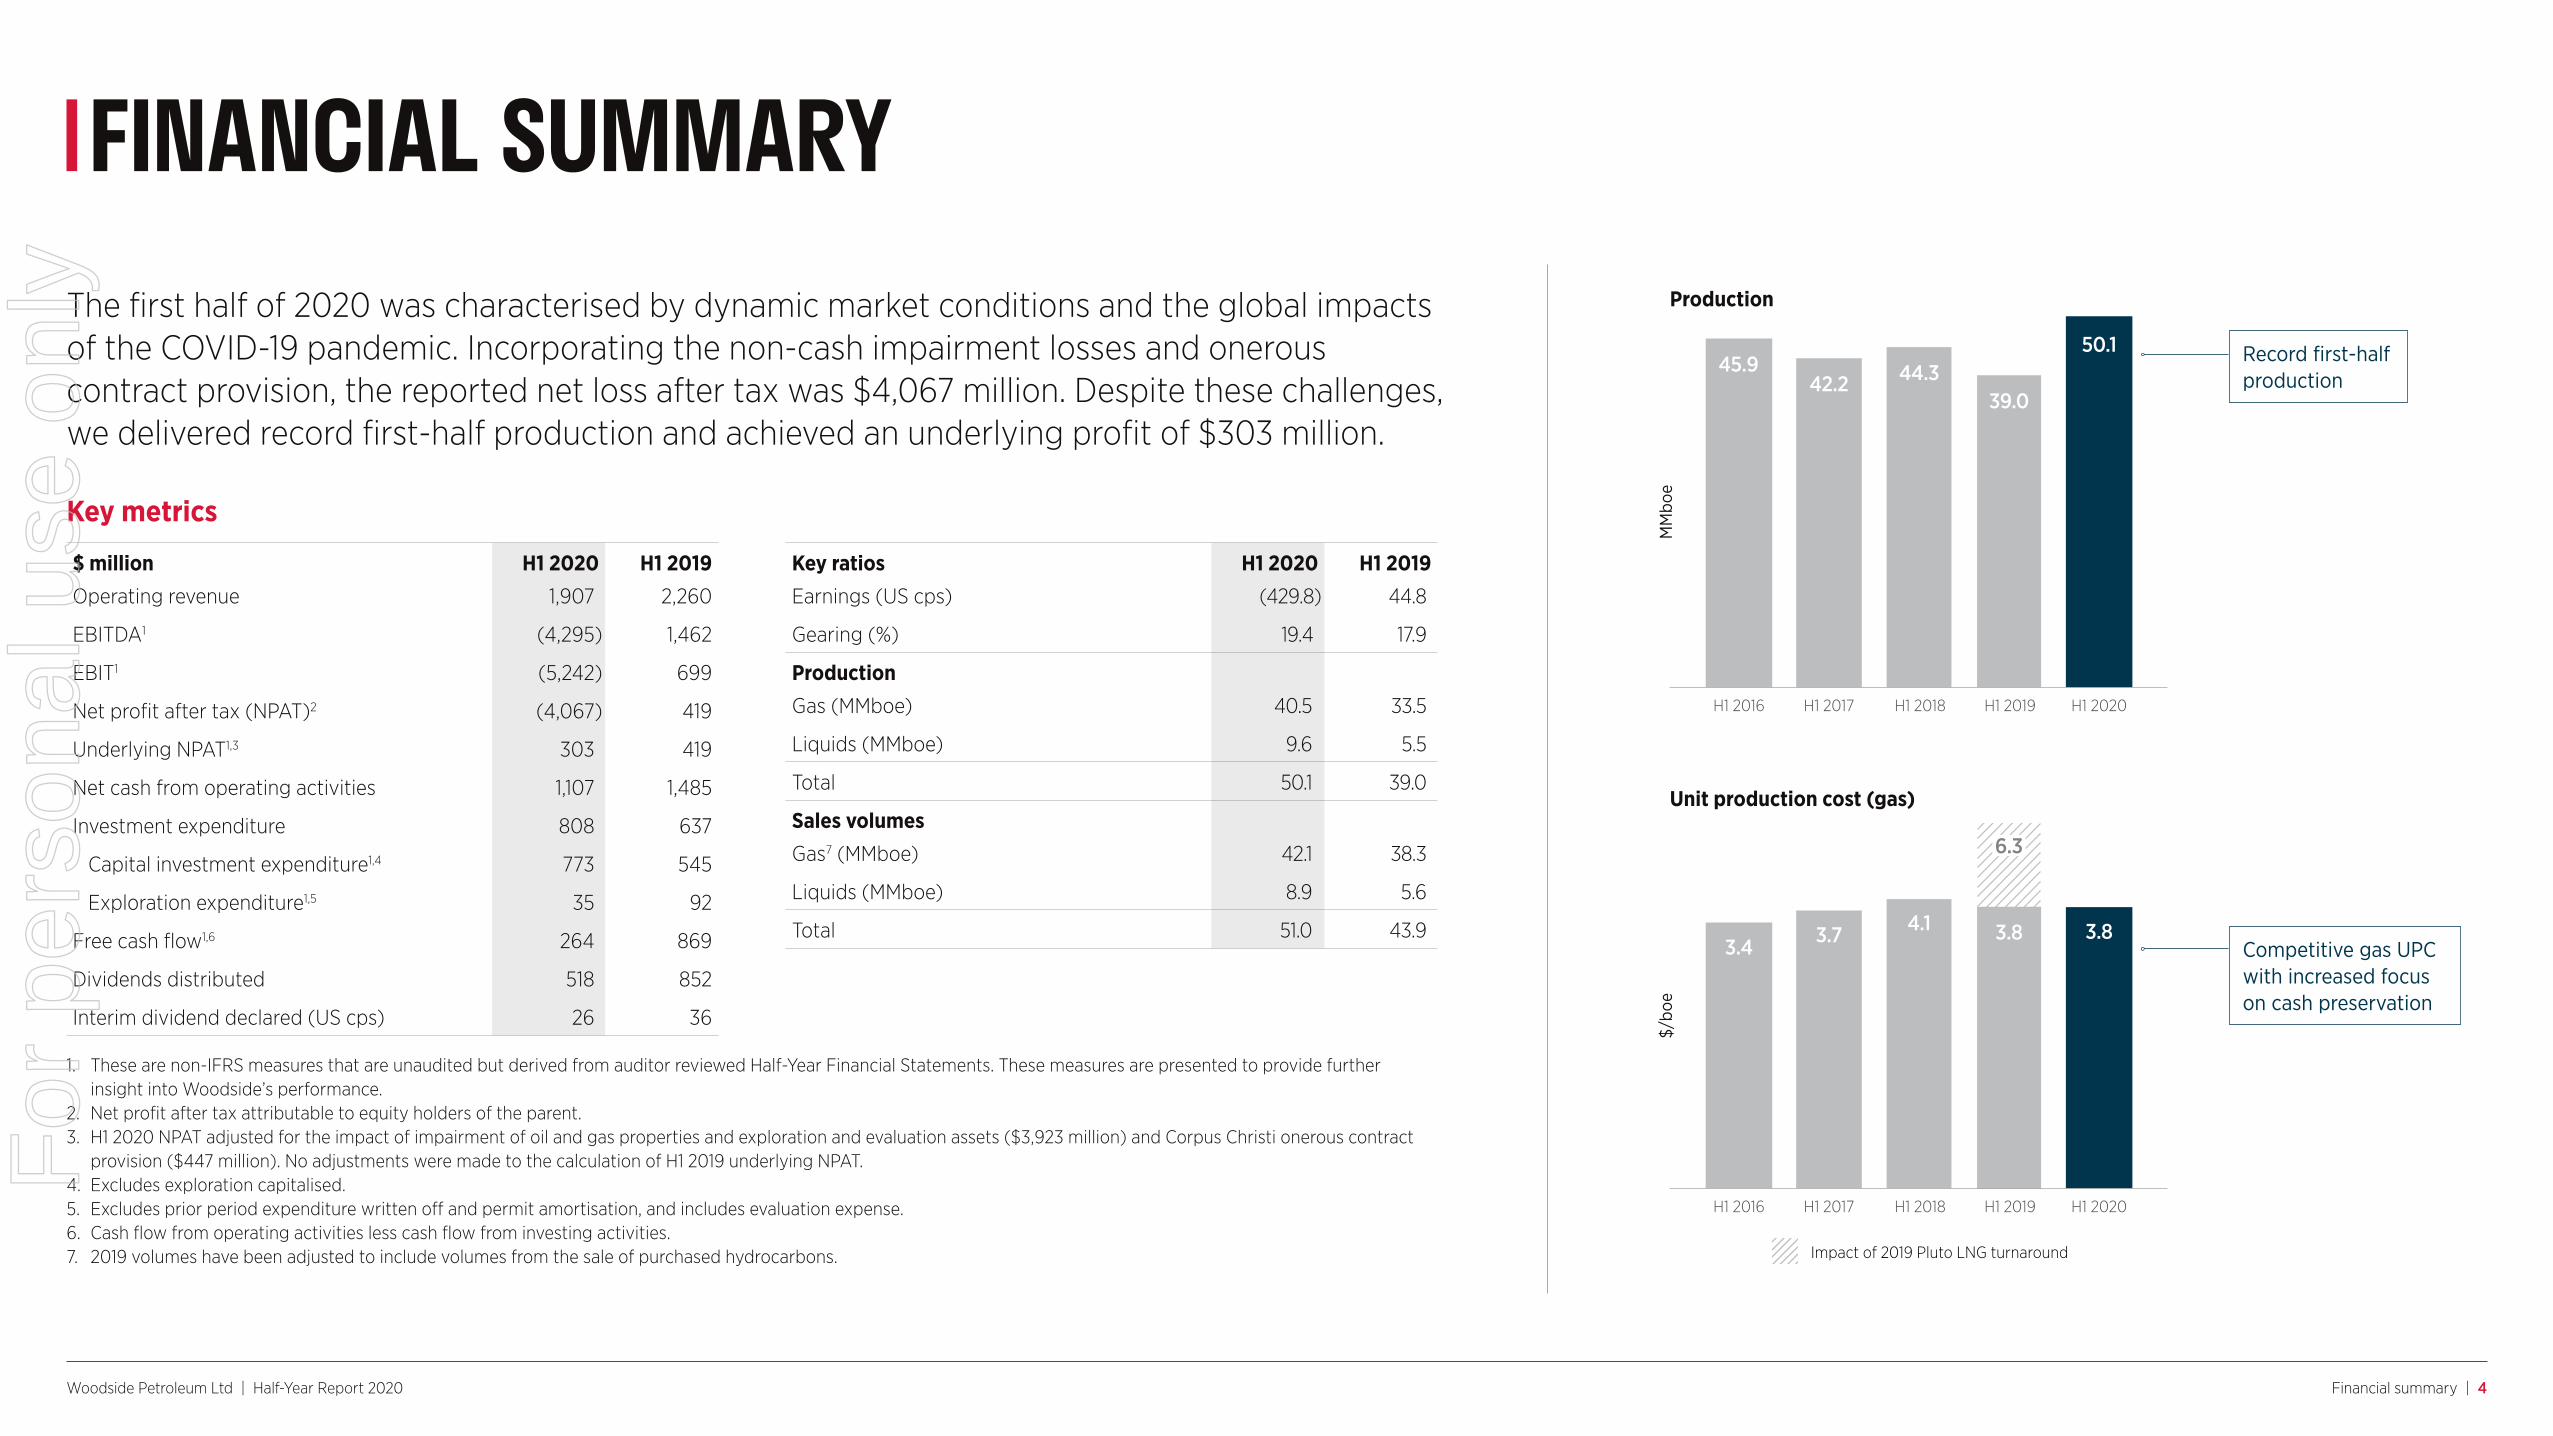
Strong operational performanceWoodside delivered its highest first-half production result in H1 2020, achieving a record 50.1 MMboe. This is an increase of 28% on the corresponding production in H1 2019.
Production has been maintained throughout the pandemic, requiring changes to Woodside’s operating model to ensure the safety of our people and the high reliability of our facilities. This has been achieved with a low gas unit production cost of $3.8/boe.
H1 2020 financial resultsA principal impact of the trading conditions in H1 2020 was a reduction in realised prices for Woodside’s products. Woodside’s reported net loss after tax for the half is $4,067 million, which has been significantly affected by the non-cash impairment losses and onerous contract provision announced in July 2020.
Underlying NPAT for the half is $303 million, with the directors declaring a fully-franked interim dividend of 26 US cps. This represents a payout ratio of approximately 80% of the underlying NPAT.
Woodside is in a strong position to take advantage of opportunities which will potentially arise both during and subsequent to this period of market uncertainty.
External factors
Dat
ed B
rent
(U
S$/b
bl)
80
60
40
20
0
Woodside actions
January February March April May June July
31 JanuaryGlobal health emergency declared
8 FebruaryTropical Cyclone Damien
6 MarchOPEC+1 meeting fails to agree on supply cut, oil price falls 12%
11 MarchGlobal pandemic declared
5 AprilWestern Australia borders closed
12 AprilOPEC+1 agree to cut production
21 AprilOil price falls to $13.24, down 80% from start of year
20 MarchAustralian travel restrictions introduced
FID Sangomar Phase 110 January 27 March
Response to market conditions
7 AprilTemporary operating model introduced
14 JulyImpairments and onerous contract provision
Focus on cash preservation, COVID-19 risk management and reliable operations
For
per
sona
l use
onl
y
Woodside Petroleum Ltd | Half-Year Report 2020 Financial summary | 4
FINANCIAL SUMMARY
Key metrics
$ million H1 2020 H1 2019Operating revenue 1,907 2,260
EBITDA1 (4,295) 1,462
EBIT1 (5,242) 699
Net profit after tax (NPAT)2 (4,067) 419
Underlying NPAT1,3 303 419
Net cash from operating activities 1,107 1,485
Investment expenditure 808 637
Capital investment expenditure1,4 773 545
Exploration expenditure1,5 35 92
Free cash flow1,6 264 869
Dividends distributed 518 852
Interim dividend declared (US cps) 26 36
Key ratios H1 2020 H1 2019Earnings (US cps) (429.8) 44.8
Gearing (%) 19.4 17.9
ProductionGas (MMboe) 40.5 33.5
Liquids (MMboe) 9.6 5.5
Total 50.1 39.0
Sales volumesGas7 (MMboe) 42.1 38.3
Liquids (MMboe) 8.9 5.6
Total 51.0 43.9
1. These are non-IFRS measures that are unaudited but derived from auditor reviewed Half-Year Financial Statements. These measures are presented to provide further insight into Woodside’s performance.
2. Net profit after tax attributable to equity holders of the parent.3. H1 2020 NPAT adjusted for the impact of impairment of oil and gas properties and exploration and evaluation assets ($3,923 million) and Corpus Christi onerous contract
provision ($447 million). No adjustments were made to the calculation of H1 2019 underlying NPAT.4. Excludes exploration capitalised.5. Excludes prior period expenditure written off and permit amortisation, and includes evaluation expense.6. Cash flow from operating activities less cash flow from investing activities.7. 2019 volumes have been adjusted to include volumes from the sale of purchased hydrocarbons.
The first half of 2020 was characterised by dynamic market conditions and the global impacts of the COVID-19 pandemic. Incorporating the non-cash impairment losses and onerous contract provision, the reported net loss after tax was $4,067 million. Despite these challenges, we delivered record first-half production and achieved an underlying profit of $303 million.
Production
MM
boe
H1 2016
45.9
H1 2017
42.2
H1 2018
44.3
H1 2019
39.0
H1 2020
50.1 Record first-halfproduction
H1 2016
3.4
H1 2017
3.7
H1 2018
4.1
H1 2019
Impact of 2019 Pluto LNG turnaround
6.3
3.8
H1 2020
3.8
Unit production cost (gas)
$/bo
e
Competitive gas UPC with increased focus on cash preservation
For
per
sona
l use
onl
y
Woodside Petroleum Ltd | Half-Year Report 2020 Financial summary | 5
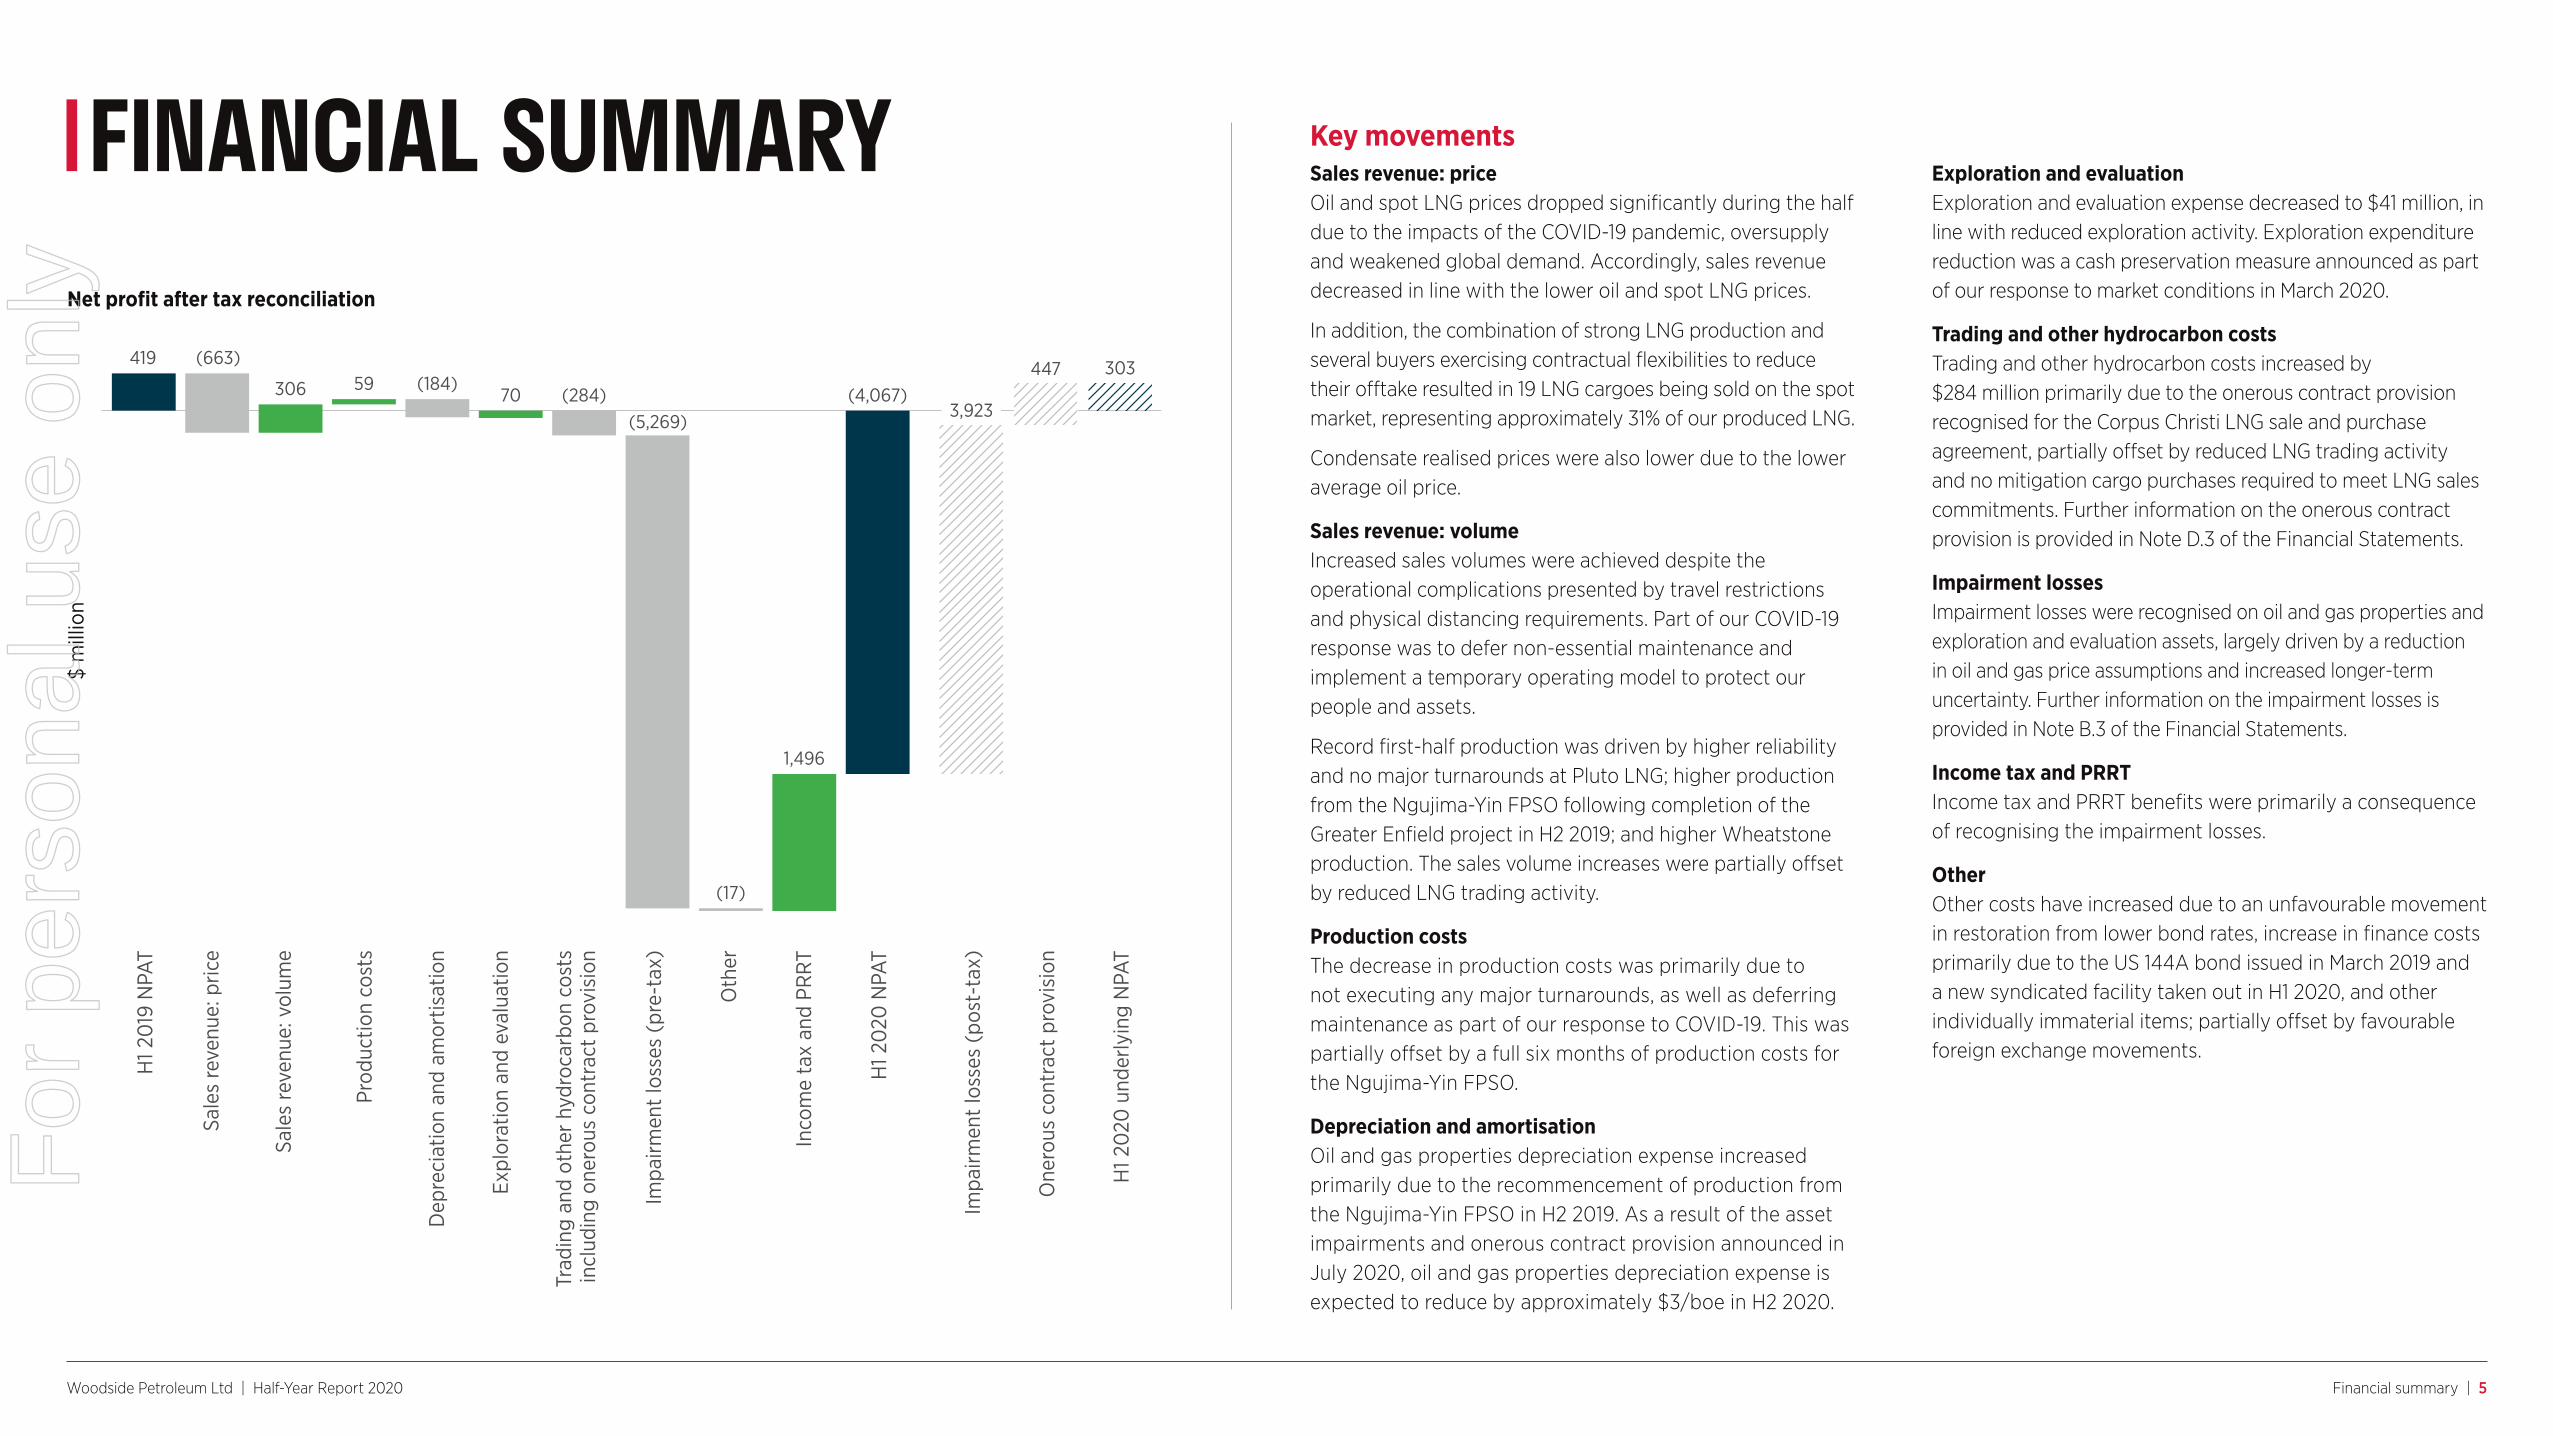
FINANCIAL SUMMARY Key movementsSales revenue: priceOil and spot LNG prices dropped significantly during the half due to the impacts of the COVID-19 pandemic, oversupply and weakened global demand. Accordingly, sales revenue decreased in line with the lower oil and spot LNG prices.
In addition, the combination of strong LNG production and several buyers exercising contractual flexibilities to reduce their offtake resulted in 19 LNG cargoes being sold on the spot market, representing approximately 31% of our produced LNG.
Condensate realised prices were also lower due to the lower average oil price.
Sales revenue: volumeIncreased sales volumes were achieved despite the operational complications presented by travel restrictions and physical distancing requirements. Part of our COVID-19 response was to defer non-essential maintenance and implement a temporary operating model to protect our people and assets.
Record first-half production was driven by higher reliability and no major turnarounds at Pluto LNG; higher production from the Ngujima-Yin FPSO following completion of the Greater Enfield project in H2 2019; and higher Wheatstone production. The sales volume increases were partially offset by reduced LNG trading activity.
Production costsThe decrease in production costs was primarily due to not executing any major turnarounds, as well as deferring maintenance as part of our response to COVID-19. This was partially offset by a full six months of production costs for the Ngujima-Yin FPSO.
Depreciation and amortisationOil and gas properties depreciation expense increased primarily due to the recommencement of production from the Ngujima-Yin FPSO in H2 2019. As a result of the asset impairments and onerous contract provision announced in July 2020, oil and gas properties depreciation expense is expected to reduce by approximately $3/boe in H2 2020.
Exploration and evaluationExploration and evaluation expense decreased to $41 million, in line with reduced exploration activity. Exploration expenditure reduction was a cash preservation measure announced as part of our response to market conditions in March 2020.
Trading and other hydrocarbon costsTrading and other hydrocarbon costs increased by $284 million primarily due to the onerous contract provision recognised for the Corpus Christi LNG sale and purchase agreement, partially offset by reduced LNG trading activity and no mitigation cargo purchases required to meet LNG sales commitments. Further information on the onerous contract provision is provided in Note D.3 of the Financial Statements.
Impairment lossesImpairment losses were recognised on oil and gas properties and exploration and evaluation assets, largely driven by a reduction in oil and gas price assumptions and increased longer-term uncertainty. Further information on the impairment losses is provided in Note B.3 of the Financial Statements.
Income tax and PRRTIncome tax and PRRT benefits were primarily a consequence of recognising the impairment losses.
OtherOther costs have increased due to an unfavourable movement in restoration from lower bond rates, increase in finance costs primarily due to the US 144A bond issued in March 2019 and a new syndicated facility taken out in H1 2020, and other individually immaterial items; partially offset by favourable foreign exchange movements.
Net profit after tax reconciliation
$ m
illio
n
H1 2
019
NPA
T
Prod
uctio
n co
sts
Sale
s re
venu
e: p
rice
Expl
orat
ion
and
eval
uatio
n
Dep
reci
atio
n an
d am
ortis
atio
n
Trad
ing
and
othe
r hy
droc
arbo
n co
sts
incl
udin
g on
erou
s co
ntra
ct p
rovi
sion
Oth
er
Sale
s re
venu
e: v
olum
e
Impa
irmen
t lo
sses
(pr
e-ta
x)
Inco
me
tax
and
PRR
T
H1 2
020
NPA
T
Impa
irmen
t lo
sses
(po
st-t
ax)
One
rous
con
trac
t pr
ovis
ion
H1 2
020
und
erly
ing
NPA
T
(4,067)3,923
447 303419
1,496
7059306
(17)
(5,269)(284)
(184)(663)
For
per
sona
l use
onl
y
Woodside Petroleum Ltd | Half-Year Report 2020 Financial summary | 6
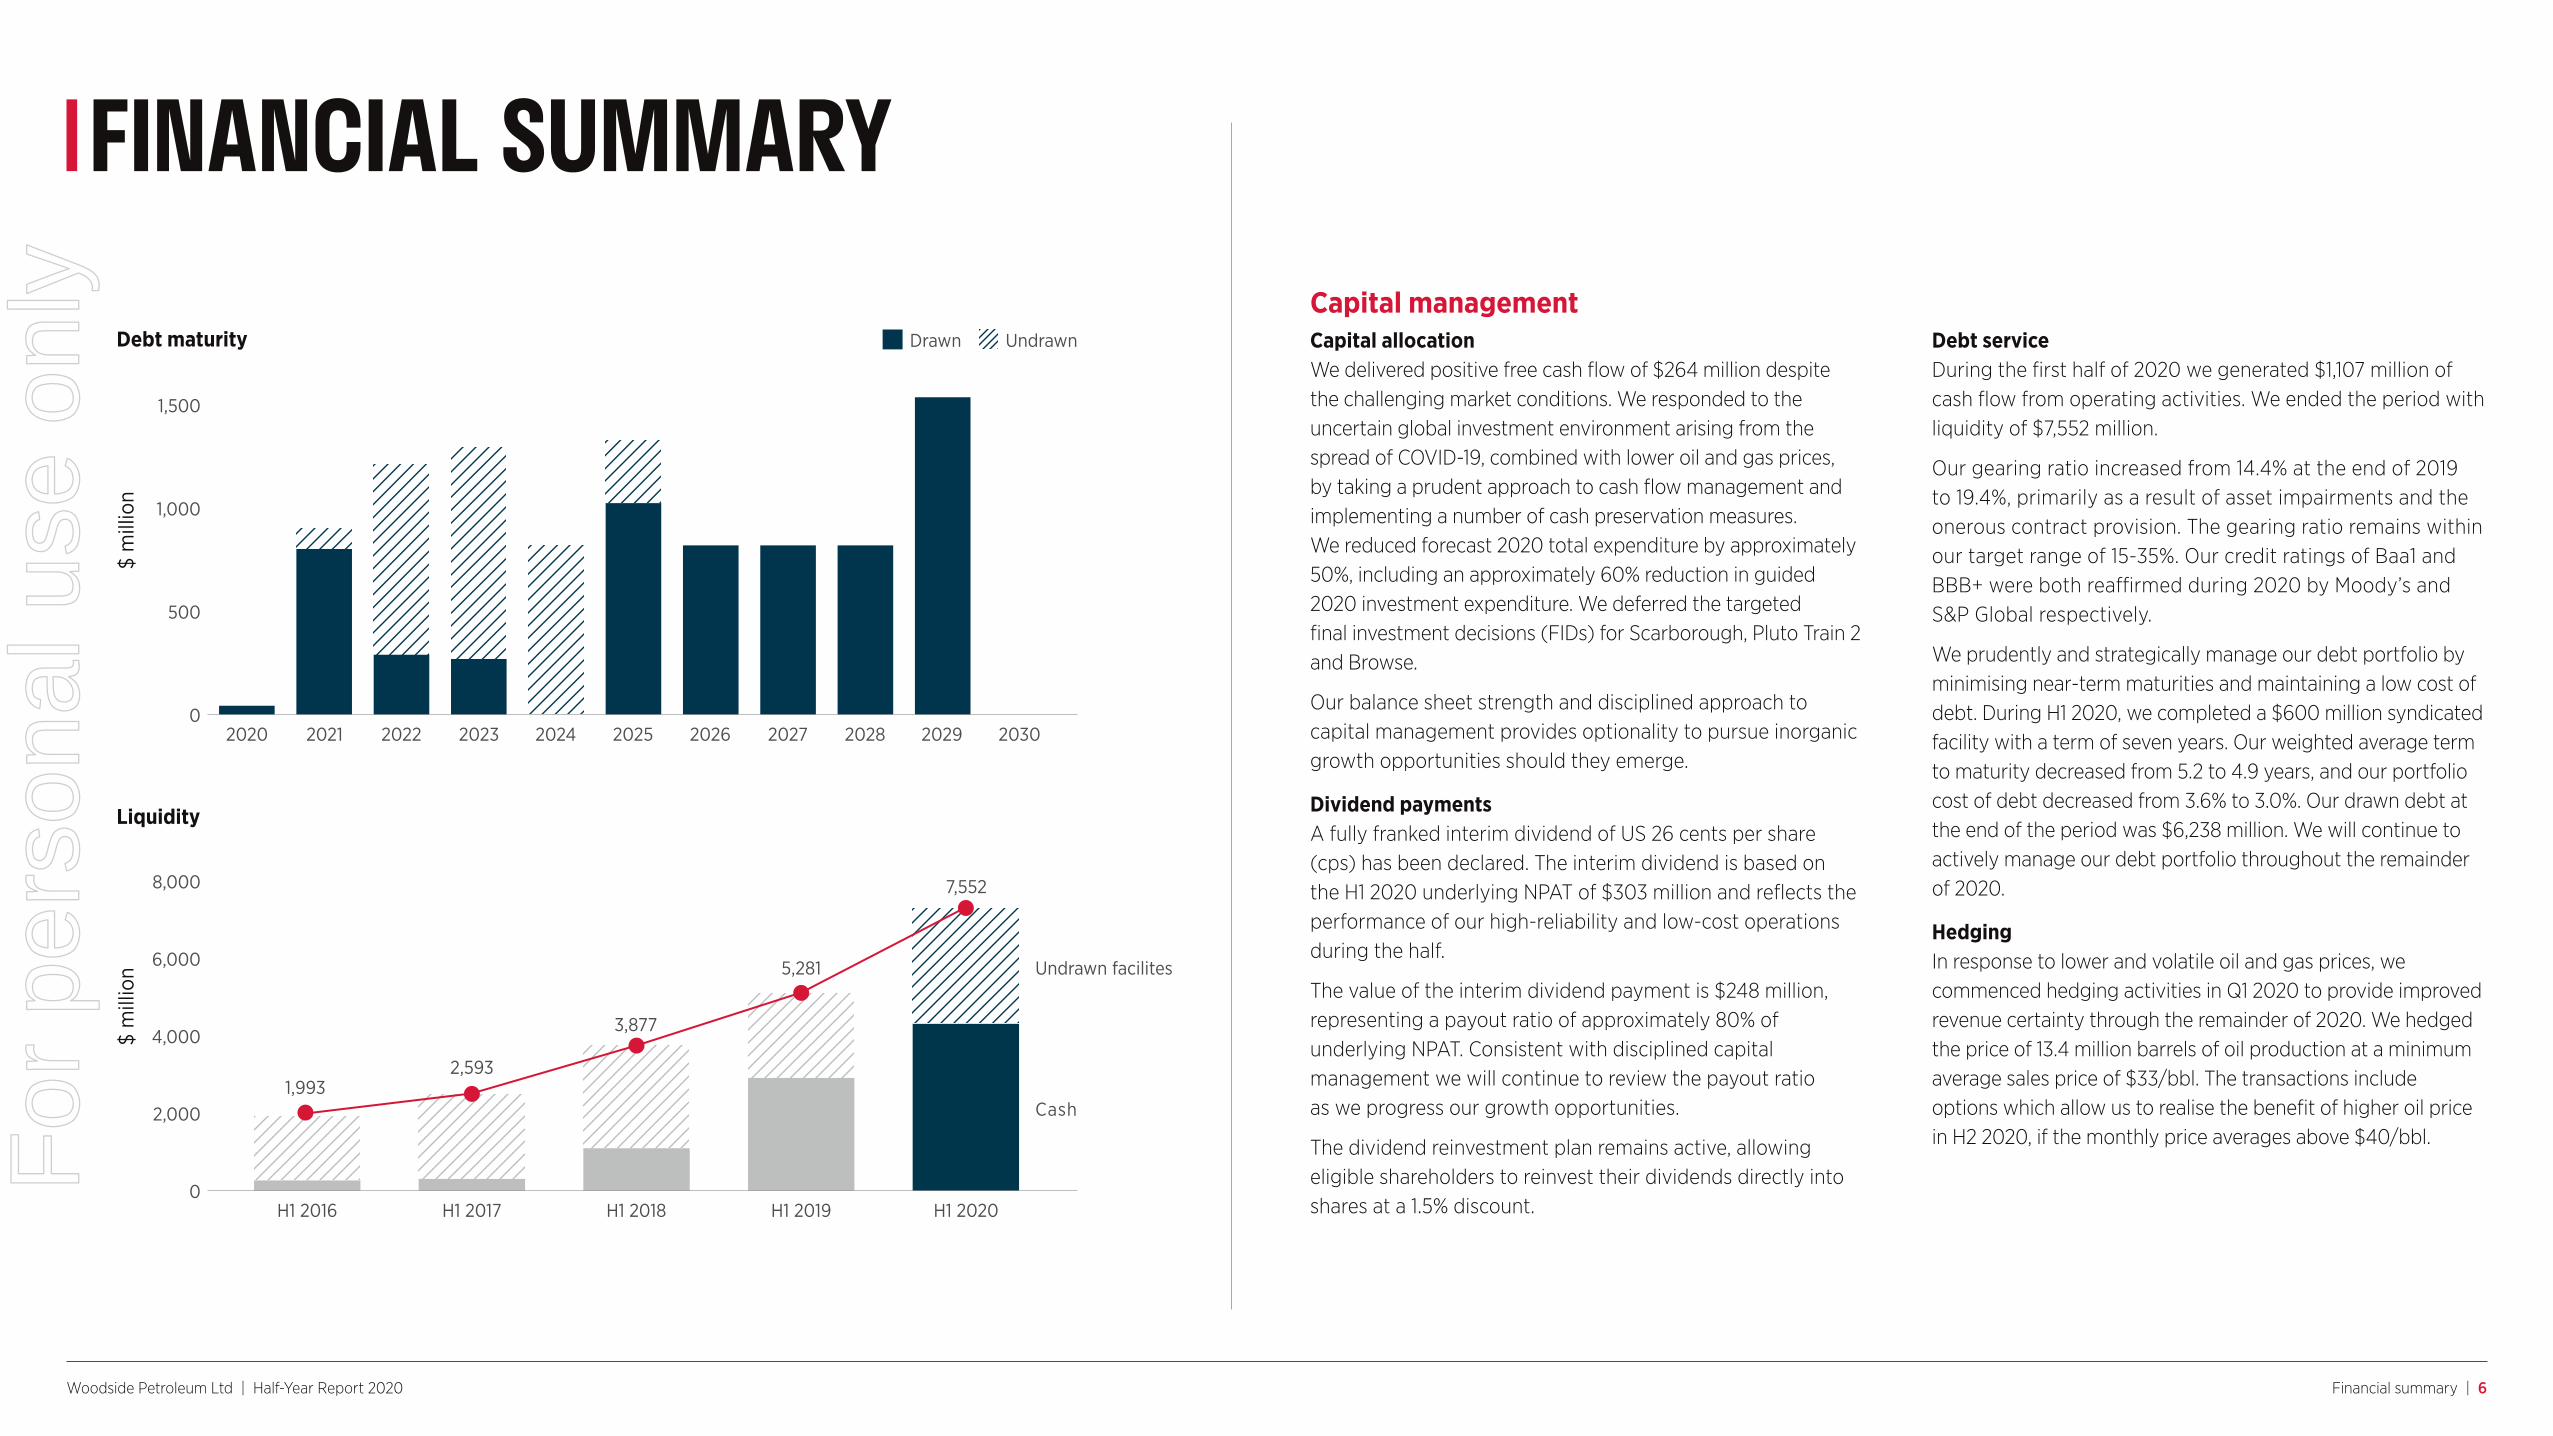
FINANCIAL SUMMARYCapital managementCapital allocationWe delivered positive free cash flow of $264 million despite the challenging market conditions. We responded to the uncertain global investment environment arising from the spread of COVID-19, combined with lower oil and gas prices, by taking a prudent approach to cash flow management and implementing a number of cash preservation measures. We reduced forecast 2020 total expenditure by approximately 50%, including an approximately 60% reduction in guided 2020 investment expenditure. We deferred the targeted final investment decisions (FIDs) for Scarborough, Pluto Train 2 and Browse.
Our balance sheet strength and disciplined approach to capital management provides optionality to pursue inorganic growth opportunities should they emerge.
Dividend paymentsA fully franked interim dividend of US 26 cents per share (cps) has been declared. The interim dividend is based on the H1 2020 underlying NPAT of $303 million and reflects the performance of our high-reliability and low-cost operations during the half.
The value of the interim dividend payment is $248 million, representing a payout ratio of approximately 80% of underlying NPAT. Consistent with disciplined capital management we will continue to review the payout ratio as we progress our growth opportunities.
The dividend reinvestment plan remains active, allowing eligible shareholders to reinvest their dividends directly into shares at a 1.5% discount.
Debt serviceDuring the first half of 2020 we generated $1,107 million of cash flow from operating activities. We ended the period with liquidity of $7,552 million.
Our gearing ratio increased from 14.4% at the end of 2019 to 19.4%, primarily as a result of asset impairments and the onerous contract provision. The gearing ratio remains within our target range of 15-35%. Our credit ratings of Baa1 and BBB+ were both reaffirmed during 2020 by Moody’s and S&P Global respectively.
We prudently and strategically manage our debt portfolio by minimising near-term maturities and maintaining a low cost of debt. During H1 2020, we completed a $600 million syndicated facility with a term of seven years. Our weighted average term to maturity decreased from 5.2 to 4.9 years, and our portfolio cost of debt decreased from 3.6% to 3.0%. Our drawn debt at the end of the period was $6,238 million. We will continue to actively manage our debt portfolio throughout the remainder of 2020.
HedgingIn response to lower and volatile oil and gas prices, we commenced hedging activities in Q1 2020 to provide improved revenue certainty through the remainder of 2020. We hedged the price of 13.4 million barrels of oil production at a minimum average sales price of $33/bbl. The transactions include options which allow us to realise the benefit of higher oil price in H2 2020, if the monthly price averages above $40/bbl.
$ m
illio
n
20200
500
1,000
1,500
20262023 2029
Drawn Undrawn
2021 20272024 20302022 20282025
Debt maturity
$ m
illio
n
H1 2016 H1 2017 H1 2018 H1 2019 H1 20200
8,000
6,000
4,000
2,000
Liquidity
1,9932,593
3,877
5,281
7,552
Cash
Undrawn facilites
For
per
sona
l use
onl
y
Woodside Petroleum Ltd | Half-Year Report 2020 Base business | 7
BASE BUSINESSPluto LNGWoodside achieved outstanding production performance at Pluto LNG, delivering 22.1 MMboe of production (Woodside share) in the first half of 2020. This was an increase of 56% compared to the first half of 2019, which was impacted by Pluto LNG’s first major turnaround.
This record first-half outcome was due to strong reliability and the improvements delivered during the 2019 turnaround. Leveraging the facility’s remote operation capabilities, Woodside was able to safely achieve uninterrupted LNG production at Pluto LNG throughout Tropical Cyclone Damien, which passed over the facility in February 2020.
As part of our ongoing efforts to improve efficiency and reduce emissions, application of new technologies were trialled in the half, with positive results. These included fin-fan misting, which can improve facility performance during high ambient temperatures, and the operation of both boil-off compressors in parallel to increase LNG production and reduce flaring.
Drilling activities commenced in March 2020 for the Pyxis Hub project, which comprises the subsea tie-back of the Pyxis, Pluto North and Xena infill wells.
Progress continued on the Pluto water handling project, which involves the construction and installation of a water handling module on the Pluto platform to enable wet gas production from 2021. Lift of the module remains on target for H2 2020.
Woodside interest: 90%
Australia OilWoodside’s share of production from the Okha FPSO, which produces oil from the Cossack, Wanaea, Lambert and Hermes resources, was 0.5 MMboe. Production was down from 0.7 MMboe in the first half of 2019, primarily due to natural field decline.
Woodside’s share of production from the Ngujima-Yin FPSO, which produces oil from the Vincent and Greater Enfield resources, was 3.8 MMboe. Production recommenced in H2 2019 following the completion of the Greater Enfield project, which involved the subsea tieback of the Greater Enfield resources to the FPSO.
Woodside commenced re-drilling of the Laverda well during the period to support improved production from the facility.
Woodside interest: 33.33% Okha, 60% Ngujima-Yin
North West Shelf ProjectWoodside achieved strong production from the North West Shelf (NWS) Project in the first half of 2020, maintaining safe and reliable operations despite the impacts of Tropical Cyclone Damien and the COVID-19 pandemic. Woodside’s share of production was 16.5 MMboe.
To reduce operating expenditure and mitigate the COVID-19 transmission risk, we reduced the number of people on site and deferred non-essential maintenance activities. The planned turnaround schedule at Karratha Gas Plant (KGP) was amended, and the 2020 scope for life extension activities was reduced. A major turnaround involving LNG Train 3 is scheduled for September 2020.
A significant improvement project was delivered in H1 2020, to enable temporary remote operation of the offshore North Rankin Complex. This change will help mitigate the operational risks posed by COVID-19, and enable improved production performance during future cyclone seasons.
In July 2020, the NWS Project participants executed amendments to the joint venture governance documents enabling the processing of third party gas through the NWS Project facilities.
Woodside interest: 16.67%
WheatstoneWheatstone continued to deliver solid production performance, driven by good reliability. Woodside’s share of production was 7.2 MMboe.
Woodside interest: 13% Wheatstone, 65% Julimar-Brunello
Exploration As part of our response to market conditions, 2020 exploration expenditure was reduced significantly. Exploration activities planned in Australia, Myanmar, Republic of Korea and Ireland were deferred, including the planned Gemtree-A exploration well offshore north-west Australia and a 3D seismic survey offshore the Republic of Korea in Blocks 8 and 6-1N.
Committed exploration activities were executed as planned. Woodside completed seismic survey activities in Australia and Senegal in H1 2020 covering approximately 1,865 km2.
The Government of the Republic of the Congo confirmed Woodside’s participation in the production sharing contract (PSC) for the offshore block Marine XX. This supports our exploration strategy of focusing on opportunity capture in emerging basins with proven petroleum systems. The PSC has a one-well commitment that is due before the end of 2025.
Marketing, Trading & Shipping Woodside is navigating a challenging market environment by managing our existing long-term sales contracts and proactively optimising our LNG portfolio. We have worked with our customers to manage their changing requirements due to the demand volatility resulting from COVID-19.
Our Corpus Christi LNG offtake commenced in May 2020 and we are managing this commitment through our portfolio marketing approach and contractual flexibility. We elected not to lift three cargoes but have sold the majority of cargoes to be lifted under this contract for the remainder of the year.
Throughout the first half of 2020, we continued to engage with customers regarding contracts to underpin our future LNG growth projects.
Woodside’s equity domestic gas sales grew by 40% from H1 2019 to H1 2020. The conclusion of the remaining NWS jointly marketed domestic gas contracts provides more opportunities to expand our domestic gas business.
In the oil market, we have managed price volatility and other risks through discrete sales optimisation activities and utilisation of facility-based storage.
For
per
sona
l use
onl
y
Woodside Petroleum Ltd | Half-Year Report 2020 Developments | 8
Sangomar Field DevelopmentFinal investment decision was achieved in January 2020 for the Sangomar Field Development Phase 1 by the Rufisque Offshore, Sangomar Offshore and Sangomar Deep Offshore (RSSD) joint venture. Project execution activities have commenced in support of targeted first oil in 2023.
Early action was taken to proactively manage the emerging impacts of COVID-19 on the supply chain and project schedule. We worked with our contractors, the Government of the Republic of Senegal and the joint venture participants to optimise near-term spend whilst protecting the overall value of the investment.
We are working with the contractor to progress contracting and procurement activities and detailed engineering for the FPSO, including major topsides equipment fabrication.
A VLCC tanker was purchased by the FPSO contractor in February 2020 and is due to undergo tank inspection and cleaning in Q3 2020. Commencement of tanker modifications is targeted for Q4 2020. Manufacturing activities in relation to the subsea, umbilical, riser and flowlines (SURF) are progressing, and the subsea tree assembly works commenced in July 2020.
Purchase orders for long-lead items continue to be awarded in readiness for commencement of drilling operations, targeted for mid-2021. Preparation is underway in Senegal to support these activities.
Processing of the high definition 3D marine seismic data acquired in Q1 2020 is progressing as planned.
Subsequent to the half, Petrosen exercised an option to increase its participating interest from 10% to 18%. Woodside’s revised participating interest in the RSSD joint venture is 31.89%.
Woodside interest: 31.89%
Scarborough and Pluto Train 2 In response to the impacts of COVID-19, lower oil and gas prices and increased demand uncertainty, Woodside deferred the targeted FIDs for Scarborough and Pluto Train 2 from 2020 to H2 2021.
Engineering, commercial and regulatory work streams continued in support of Woodside’s revised targeted FIDs. Contractor work plans were updated in readiness for when investment conditions improve.
Woodside and BHP agreed to extend the validity of the tolling price for processing gas from the Scarborough offshore field at Pluto LNG, originally agreed in November 2019, until the end of 2020.
The Scarborough Offshore Project Proposal was accepted by the National Offshore Petroleum Safety and Environmental Management Authority in April 2020, securing the primary environmental approval for the offshore scope. Work has commenced on developing associated environment plans.
In February 2020, Woodside and BHP aligned their participating interests across the WA-1-R (Scarborough) and WA-62-R (North Scarborough) titles, resulting in Woodside holding a 73.5% interest and BHP holding a 26.5% interest in each title.
Applications were submitted to the regulator in February 2020 for production licences over the WA-1-R and WA-62-R titles. Retention lease renewal applications over the WA-61-R (Jupiter) and WA-63-R (Thebe) titles were submitted in May 2020.
Woodside interest: 73.5% Scarborough, 100% Pluto Train 2
Pluto-KGP Interconnector Work on the Pluto-KGP Interconnector continued in support of Woodside’s targeted ready for start-up (RFSU) date in 2022.
The pipeline licence and easement for the Pluto-KGP Interconnector were received by AGIG, the operator of the pipeline. In Q2 2020, Woodside commenced site works for the Interconnector at Pluto LNG and awarded a contract to WA-based engineering company Civmec Construction & Engineering Pty Ltd for the supply and fabrication of equipment within Pluto LNG.
Commencement of construction of the pipeline and associated facilities is targeted for H2 2020.
Commercial negotiations are ongoing in respect of the processing of accelerated gas from the Pluto fields at the NWS Project via the Interconnector and in relation to the construction of the Interconnector facilities.
Woodside interest: 100%
DEVELOPMENTS
Project execution activities commenced for Sangomar Field Development Phase 1.
For
per
sona
l use
onl
y
Woodside Petroleum Ltd | Half-Year Report 2020 Developments | 9
DEVELOPMENTSBrowseIn response to the current market conditions, Woodside’s targeted FID for Browse has been deferred. Woodside is targeting FID from 2023.
The Browse Joint Venture (BJV) is reviewing the development schedule and continues to progress all necessary commercial agreements and regulatory approvals to ensure Browse is well placed to progress as market conditions improve. The BJV has taken prudent capital management decisions to moderate project expenditure in the near-term given the external conditions arising from COVID-19 and lower oil and gas prices.
The Browse Draft Environmental Impact Statement/Environmental Review Document (EIS/ERD) Supplement is being finalised for submission following completion of the eight-week public comment period in February 2020.
In April 2020, production licence applications were submitted to the relevant State and Commonwealth regulators for the Calliance and Torosa fields, over the WA-28-R, WA-29-R, WA-30-R, WA-31-R, TR/5 and R2 titles. A retention lease renewal application was also submitted in relation to Brecknock, over the WA-32-R title. These applications are currently being assessed.
Woodside interest: 30.6%
NWS Project ExtensionThe purpose of the NWS Project Extension is to refurbish and extend the life of the NWS Project’s facilities, to support the processing of third-party gas in the coming decades.
The North West Shelf Gas Development (Woodside) Agreement Amendment Bill 2019 (WA) was passed by the Western Australian Parliament, extending the term of the North West Gas Development (Woodside) Agreement Act 1979 (WA) to 2059. The extension will enable the continued operation of KGP and allow the processing of gas from other fields through KGP.
We are progressing the NWS Project Extension Environmental Review Document (ERD) following completion of the eight-week public comment period in February 2020.
Woodside interest: 16.67%
Julimar-Brunello Phase 2Woodside commenced a multi-well drilling campaign for Julimar-Brunello Phase 2 in Q1 2020, following FID in Q4 2019. The project will develop gas from the Julimar reservoir as a subsea tieback to the existing Brunello infrastructure. At the end of the half, activities were on budget and on schedule.
Woodside interest: 65%
Greater Western Flank Phase 3Final investment decision was achieved in January 2020 for Greater Western Flank Phase 3, including Lambert Deep (GWF-3). GWF-3 is a subsea tieback development and supports continued, efficient commercialisation of NWS reserves. Execution of project activities commenced during H1 2020.
Woodside interest: 16.67%
MyanmarThe A-6 Development in Myanmar is targeting the development of natural gas from Block A-6 for sale to domestic and export markets. Woodside is working with the Block A-6 joint venture participants and the Government of Myanmar to progress the A-6 Development to front-end engineering design (FEED), following agreement of fiscal terms in late-2019. Negotiations are underway across commercial and marketing work streams. Technical work, including studies and surveys, continues.
The impacts of COVID-19 have delayed the planned exploration drilling campaign offshore Myanmar. Woodside is drilling operator, and worked with joint venture partners and contractors to develop and agree a suitable revised drilling program. Drilling is subject to government and joint venture approvals.
We are targeting H1 2021 for the start of drilling.
Woodside interest: 40% A-6 Development
For
per
sona
l use
onl
y
Woodside Petroleum Ltd | Half-Year Report 2020 Sustainability | 10
SUSTAINABILITYHSE performanceThe impacts of Tropical Cyclone Damien and COVID-19 in the first half of 2020 required a sustained, adaptive response across the organisation to support our people as they delivered safe and reliable operations.
Mental and physical health and wellbeing have been a critical focus, given the heightened exposure to psycho-social risks through these unprecedented times. We developed and implemented a Health & Wellbeing Framework, which was subsequently adopted nationally by industry bodies APPEA and Safer Together. To preserve longer-term HSE performance, we are working with our employees and contractors to mitigate the impact of cumulative fatigue. By aiming for a Perfect HSE Day every day, we remain focussed on the tasks at hand and pre-emptively manage risk.
Our record first-half production was achieved with strong health and safety performance, delivering our best recorded personal safety result.
Environment and climate changeFor the first half of 2020, we achieved a 6.2% improvement in energy efficiency performance against our 2016 baseline, positioning us well to meet our overall target of 5% over the 2016-2020 period by the end of 2020. High reliability has played a major role in this achievement. We are preparing to implement our new 2021-2025 target for an additional 5% improvement of our operating emissions intensity.
In May 2020, we commenced the first phase of native tree planting under our partnership with Greening Australia, which is expected to sequester approximately 700,000 tonnes of CO2 equivalent over 25 years. This supports our target to offset our global equity reservoir carbon emissions from 2021.
We continue to expand our carbon-related strategy and climate-related disclosure, in accordance with our aspiration to be net-zero for direct emissions by 2050. Our newly appointed Senior Vice President Climate is driving these efforts.
We commenced a review of our industry association memberships for alignment with our climate change positions. This review will be published in November 2020.
New energyWoodside continued to progress the development of markets and supply chains for our targeted future products, hydrogen and ammonia.
We signed an agreement in March 2020 with Japanese companies JERA Inc, Marubeni Corporation and IHI Corporation to undertake a joint study examining the large-scale export of hydrogen as ammonia to decarbonise coal-fired power generation in Japan.
The consortium received approval from Japan’s New Energy and Industrial Technology Development Organization (NEDO) for a feasibility study covering the entire hydrogen-as-ammonia value chain.
As part of the study, Woodside will be investigating the transition from blue to green hydrogen for export. Blue hydrogen is produced from natural gas using steam methane reforming, with related carbon management. Green hydrogen is produced by electrolysis of water, powered by renewable energy.
In both production processes hydrogen can be combined with nitrogen to form ammonia, enabling it to be shipped as a liquid. Ammonia does not produce any on-site carbon emissions when consumed in a power plant.
In July 2020, Woodside was shortlisted to apply for renewable hydrogen funding from the Australian Renewable Energy Agency for two projects.
Reconciliation Action PlanWoodside’s 2019 Reconciliation Action Plan (RAP) report was released during National Reconciliation Week in May 2020. The report reflects on our progress against our commitments to respect, relationships, opportunities and national leadership as outlined in our 2016-2020 Reconciliation Action Plan. It highlights our continued commitment to reconciliation, and achievements such as a 98% increase in contract awards to Indigenous businesses since 2016. In the first half of 2020 we commenced implementation of the two new enhanced benefits agreements with Traditional Owner groups in the Pilbara, which were signed in November 2019.
The report also features a nine-month pilot for a new pre-employment program, which prepares Indigenous people for ongoing employment. Eight Pilbara-based trainees will be the first group to graduate from the pilot program in 2020.
Woodside continues to participate in weekly coordination discussions with the National Indigenous Australians Agency to explore options to support Indigenous communities in response to COVID-19.
Community investmentWe finalised a social investment strategy and expanded benefits agreements with our Traditional Owner partners in the north-west region of Australia. We also launched a new Woodside community grants program across regional communities in March 2020. The program, which provides grants of up to A$5,000 to support local organisations, was used by City of Karratha groups to help rebuild after Tropical Cyclone Damien. Woodside is also supporting new initiatives with regional chambers of commerce which aim to build capability and capacity of regional businesses in our host communities.
COVID-19 Community FundThe Woodside COVID-19 Community Fund was established to support community organisations through the unprecedented challenges caused by the COVID-19 pandemic. Over A$4 million has already helped more than 60 not-for-profit organisations deliver humanitarian and health support within the communities where we are active. Almost A$2 million has been donated to organisations that support homelessness and women and children facing domestic violence.
Supporting local suppliersWe have taken steps to identify small, local and Indigenous businesses, shorten payment terms for new invoices received and expedite payment of pending invoices. Eighty-two suppliers have been identified and can benefit from our expedited payment terms. During the first half of 2020, these suppliers received over A$24 million in payments for goods and services.
ESG ratingsWe have maintained our ‘AAA’ leader rating in the Morgan Stanley Capital International (MSCI) Environment, Social and Governance (ESG) ratings for the sixth consecutive year. Woodside’s Sustainalytics ESG Risk Rating also improved, ranking us in the top 2% of oil and gas producers globally.
For
per
sona
l use
onl
y
Woodside Petroleum Ltd | Half-Year Report 2020 Governance | 11
GOVERNANCEThe directors of Woodside Petroleum Ltd present their report (including the review of operations set out on pages 3-10) together with the Financial Statements of the Group.
Board of directorsThe names of the directors in office during or since the end of the period are as follows:
Mr Richard Goyder, AO (Chairman)
Mr Peter Coleman (CEO and Managing Director)
Mr Larry Archibald
Mr Frank Cooper, AO
Ms Swee Chen Goh
Dr Christopher Haynes, OBE
Mr Ian Macfarlane
Ms Ann Pickard
Dr Sarah Ryan
Mr Gene Tilbrook.
Rounding of amountsThe amounts contained in this report have been rounded to the nearest million dollars under the option available to the Group under Australian Securities and Investments Commission (ASIC) Instrument 2016/191 dated 24 March 2016, unless otherwise stated.
Management assuranceConsistent with recommendation 4.2 of the ASX Corporate Governance Council’s Corporate Governance Principles and Recommendations (4th edition), before the adoption by the Board of the Half-Year Financial Statements 2020, the Board received written declarations from the Chief Executive Officer (CEO) and the Chief Financial Officer (CFO) that the financial records of the company have been properly maintained in accordance with section 286 of the Corporations Act 2001, and the company’s financial statements and notes comply with accounting standards and give a true and fair view of the consolidated entity’s financial position and performance for the financial period. The CEO and the CFO have also stated in writing to the Board that the statement relating to the integrity of Woodside’s financial statements is founded on a sound system of risk management and internal control that is operating effectively.
Auditor’s Independence DeclarationThe Auditor’s Independence Declaration, as required under section 307C of the Corporations Act 2001, is set out on this page and forms part of this report.
Signed in accordance with a resolution of the directors.
R J B Goyder, AO Chairman Perth, Western Australia 13 August 2020
Auditor’s Independence Declaration to the Directors of Woodside Petroleum LtdAs lead auditor for the review of the financial report of Woodside Petroleum Ltd for the half-year ended 30 June 2020, I declare to the best of my knowledge and belief, there have been:
a) no contraventions of the auditor independence requirements of the Corporations Act 2001 in relation to the review; and
b) no contraventions of any applicable code of professional conduct in relation to the review.
This declaration is in respect of Woodside Petroleum Ltd and the entities it controlled during the financial period.
Ernst & Young
T S Hammond Partner Perth, Western Australia 13 August 2020
A member firm of Ernst & Young Global Limited. Liability limited by a scheme approved under Professional Standards Legislation.
For
per
sona
l use
onl
y
Woodside Petroleum Ltd | Half-Year Report 2020 Half-Year Financial Statements | 12
for the half-year ended 30 June 2020
CONSOLIDATED INCOME STATEMENT
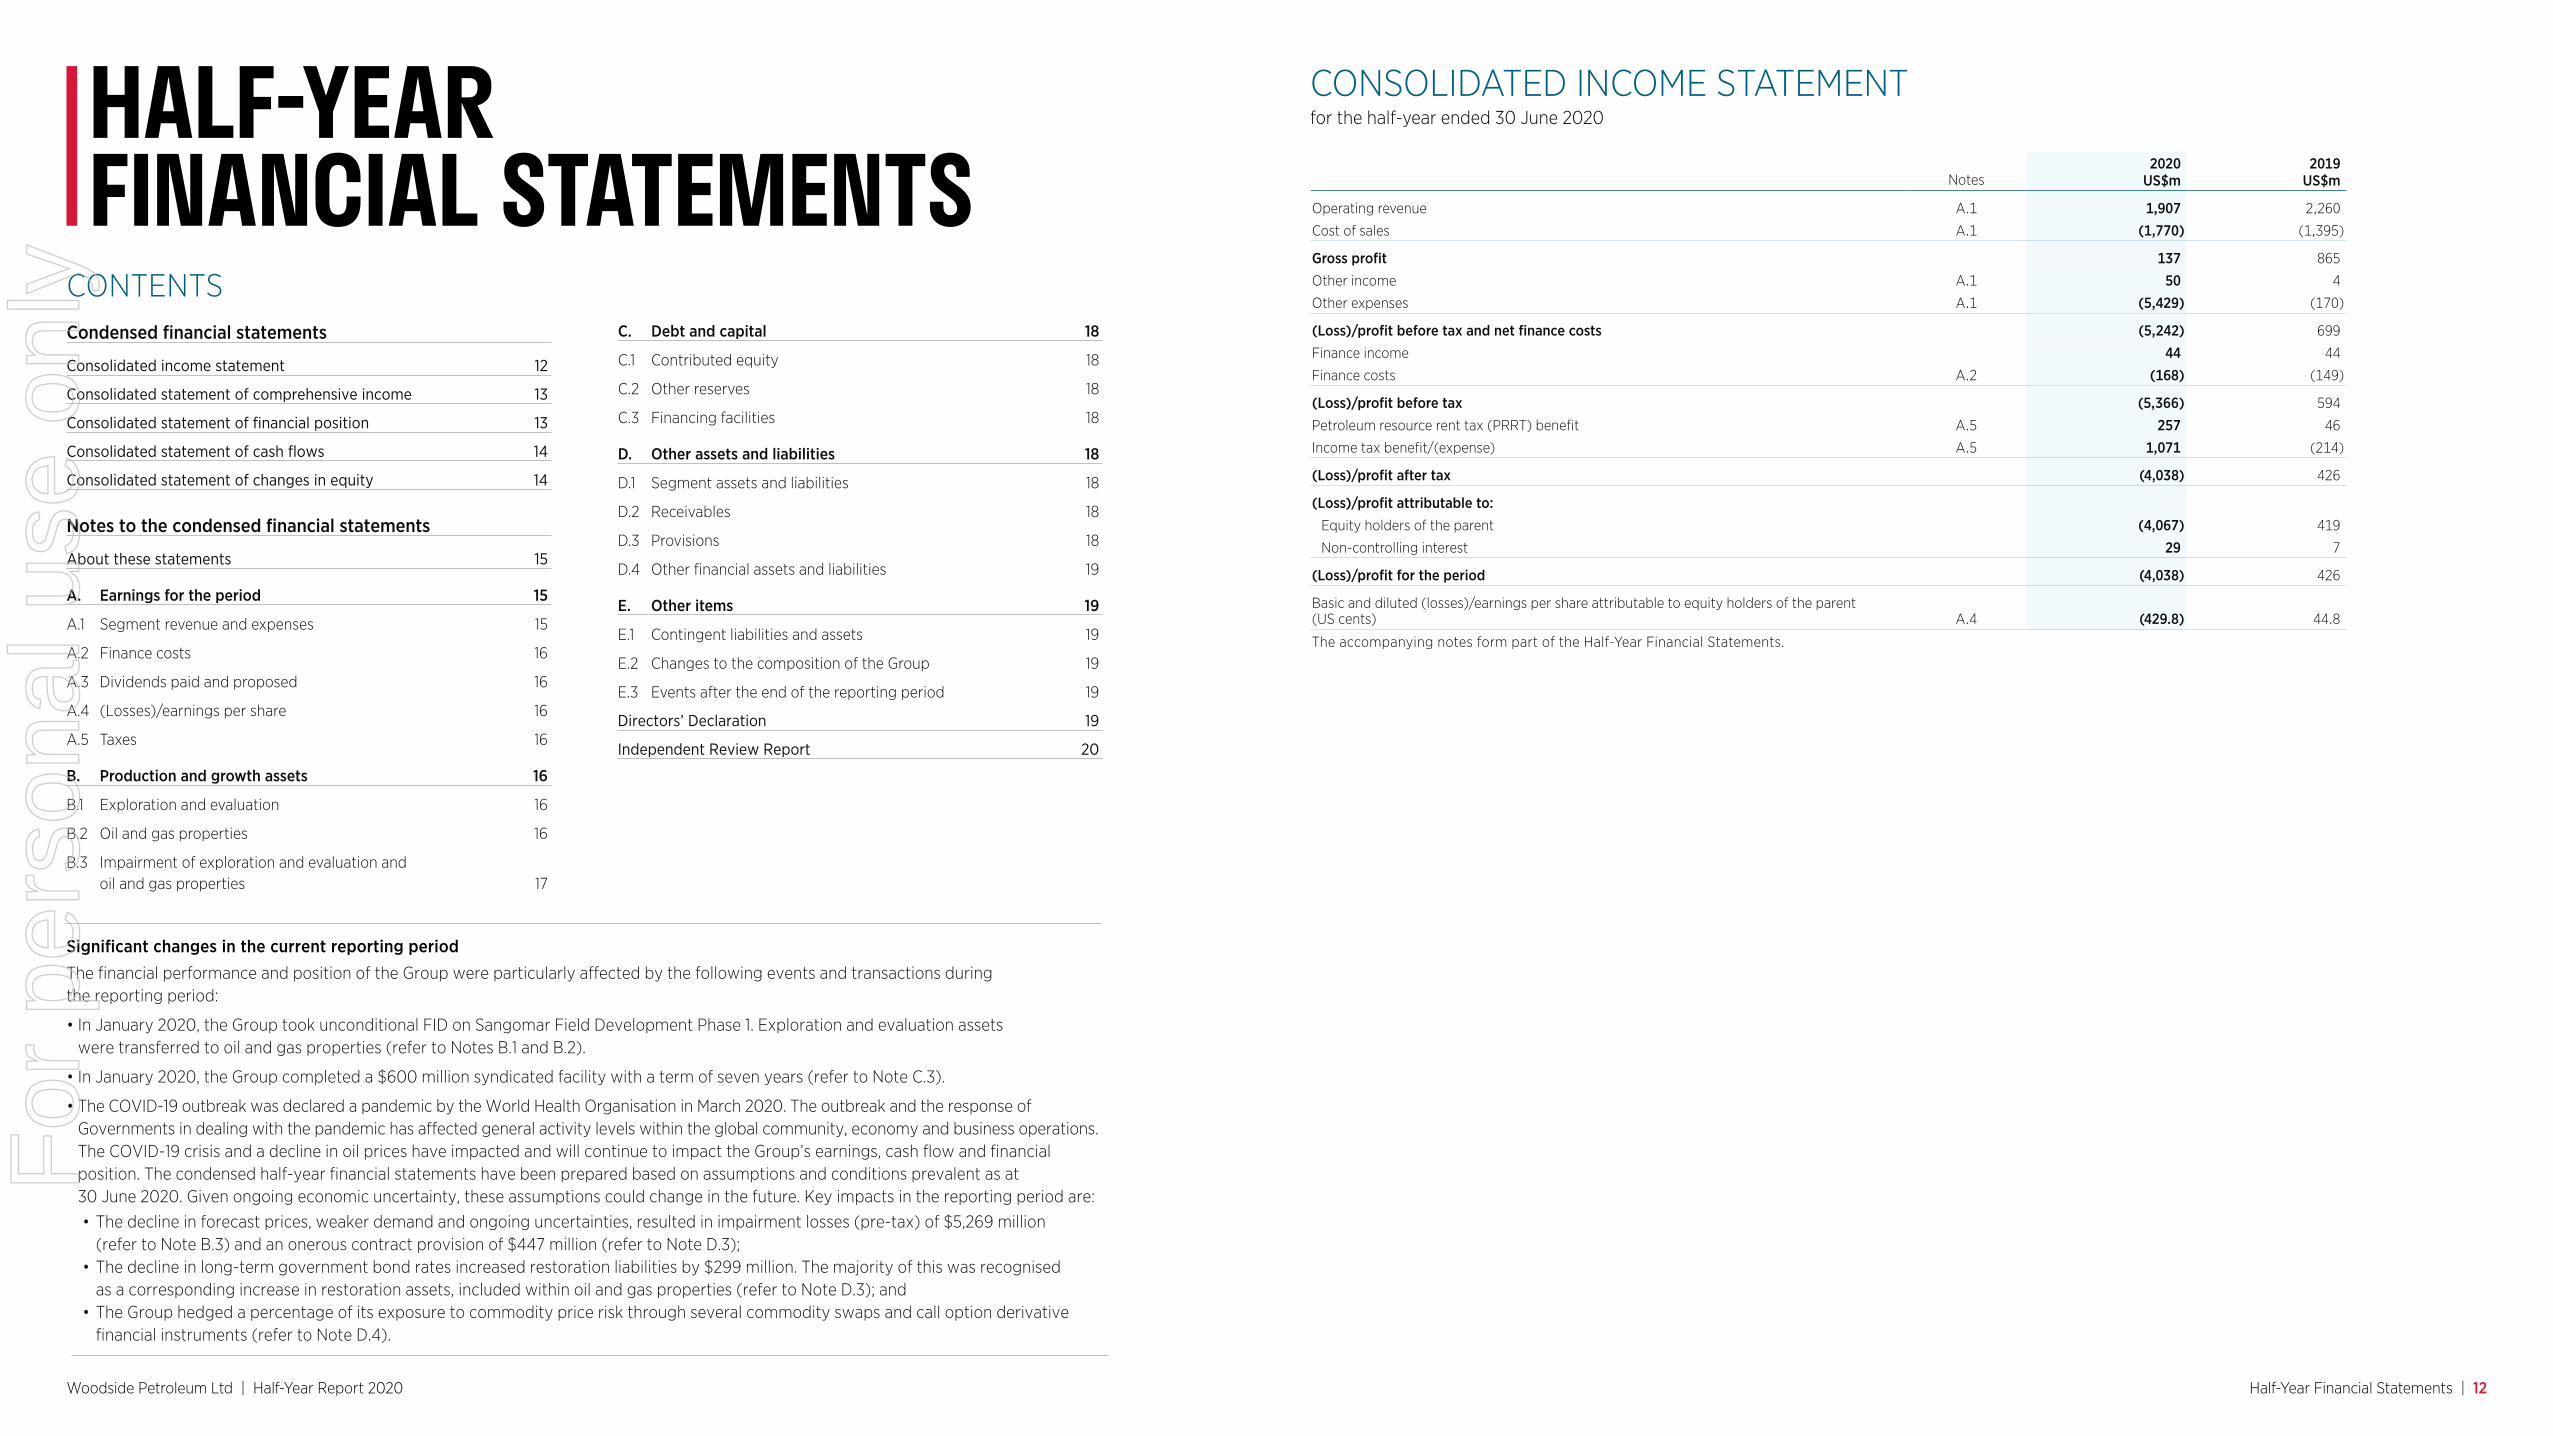
Significant changes in the current reporting periodThe financial performance and position of the Group were particularly affected by the following events and transactions during the reporting period:
• In January 2020, the Group took unconditional FID on Sangomar Field Development Phase 1. Exploration and evaluation assets were transferred to oil and gas properties (refer to Notes B.1 and B.2).
• In January 2020, the Group completed a $600 million syndicated facility with a term of seven years (refer to Note C.3).
• The COVID-19 outbreak was declared a pandemic by the World Health Organisation in March 2020. The outbreak and the response of Governments in dealing with the pandemic has affected general activity levels within the global community, economy and business operations.The COVID-19 crisis and a decline in oil prices have impacted and will continue to impact the Group’s earnings, cash flow and financial position. The condensed half-year financial statements have been prepared based on assumptions and conditions prevalent as at 30 June 2020. Given ongoing economic uncertainty, these assumptions could change in the future. Key impacts in the reporting period are:• The decline in forecast prices, weaker demand and ongoing uncertainties, resulted in impairment losses (pre-tax) of $5,269 million
(refer to Note B.3) and an onerous contract provision of $447 million (refer to Note D.3);• The decline in long-term government bond rates increased restoration liabilities by $299 million. The majority of this was recognised
as a corresponding increase in restoration assets, included within oil and gas properties (refer to Note D.3); and• The Group hedged a percentage of its exposure to commodity price risk through several commodity swaps and call option derivative
financial instruments (refer to Note D.4).
HALF-YEAR FINANCIAL STATEMENTS
Condensed financial statements
Consolidated income statement 12
Consolidated statement of comprehensive income 13
Consolidated statement of financial position 13
Consolidated statement of cash flows 14
Consolidated statement of changes in equity 14
Notes to the condensed financial statements
About these statements 15
A. Earnings for the period 15
A.1 Segment revenue and expenses 15
A.2 Finance costs 16
A.3 Dividends paid and proposed 16
A.4 (Losses)/earnings per share 16
A.5 Taxes 16
B. Production and growth assets 16
B.1 Exploration and evaluation 16
B.2 Oil and gas properties 16
B.3 Impairment of exploration and evaluation and oil and gas properties 17
C. Debt and capital 18
C.1 Contributed equity 18
C.2 Other reserves 18
C.3 Financing facilities 18
D. Other assets and liabilities 18
D.1 Segment assets and liabilities 18
D.2 Receivables 18
D.3 Provisions 18
D.4 Other financial assets and liabilities 19
E. Other items 19
E.1 Contingent liabilities and assets 19
E.2 Changes to the composition of the Group 19
E.3 Events after the end of the reporting period 19
Directors’ Declaration 19
Independent Review Report 20
CONTENTS
2020 2019 Notes US$m US$m
Operating revenue A.1 1,907 2,260
Cost of sales A.1 (1,770) (1,395)
Gross profit 137 865
Other income A.1 50 4
Other expenses A.1 (5,429) (170)
(Loss)/profit before tax and net finance costs (5,242) 699
Finance income 44 44
Finance costs A.2 (168) (149)
(Loss)/profit before tax (5,366) 594
Petroleum resource rent tax (PRRT) benefit A.5 257 46
Income tax benefit/(expense) A.5 1,071 (214)
(Loss)/profit after tax (4,038) 426
(Loss)/profit attributable to:Equity holders of the parent (4,067) 419
Non-controlling interest 29 7
(Loss)/profit for the period (4,038) 426
Basic and diluted (losses)/earnings per share attributable to equity holders of the parent (US cents) A.4 (429.8) 44.8
The accompanying notes form part of the Half-Year Financial Statements.
For
per
sona
l use
onl
y
Woodside Petroleum Ltd | Half-Year Report 2020 Half-Year Financial Statements | 13
CONSOLIDATED STATEMENT OF COMPREHENSIVE INCOME CONSOLIDATED STATEMENT OF FINANCIAL POSITIONfor the half-year ended 30 June 2020 as at 30 June 2020
2020 2019 US$m US$m
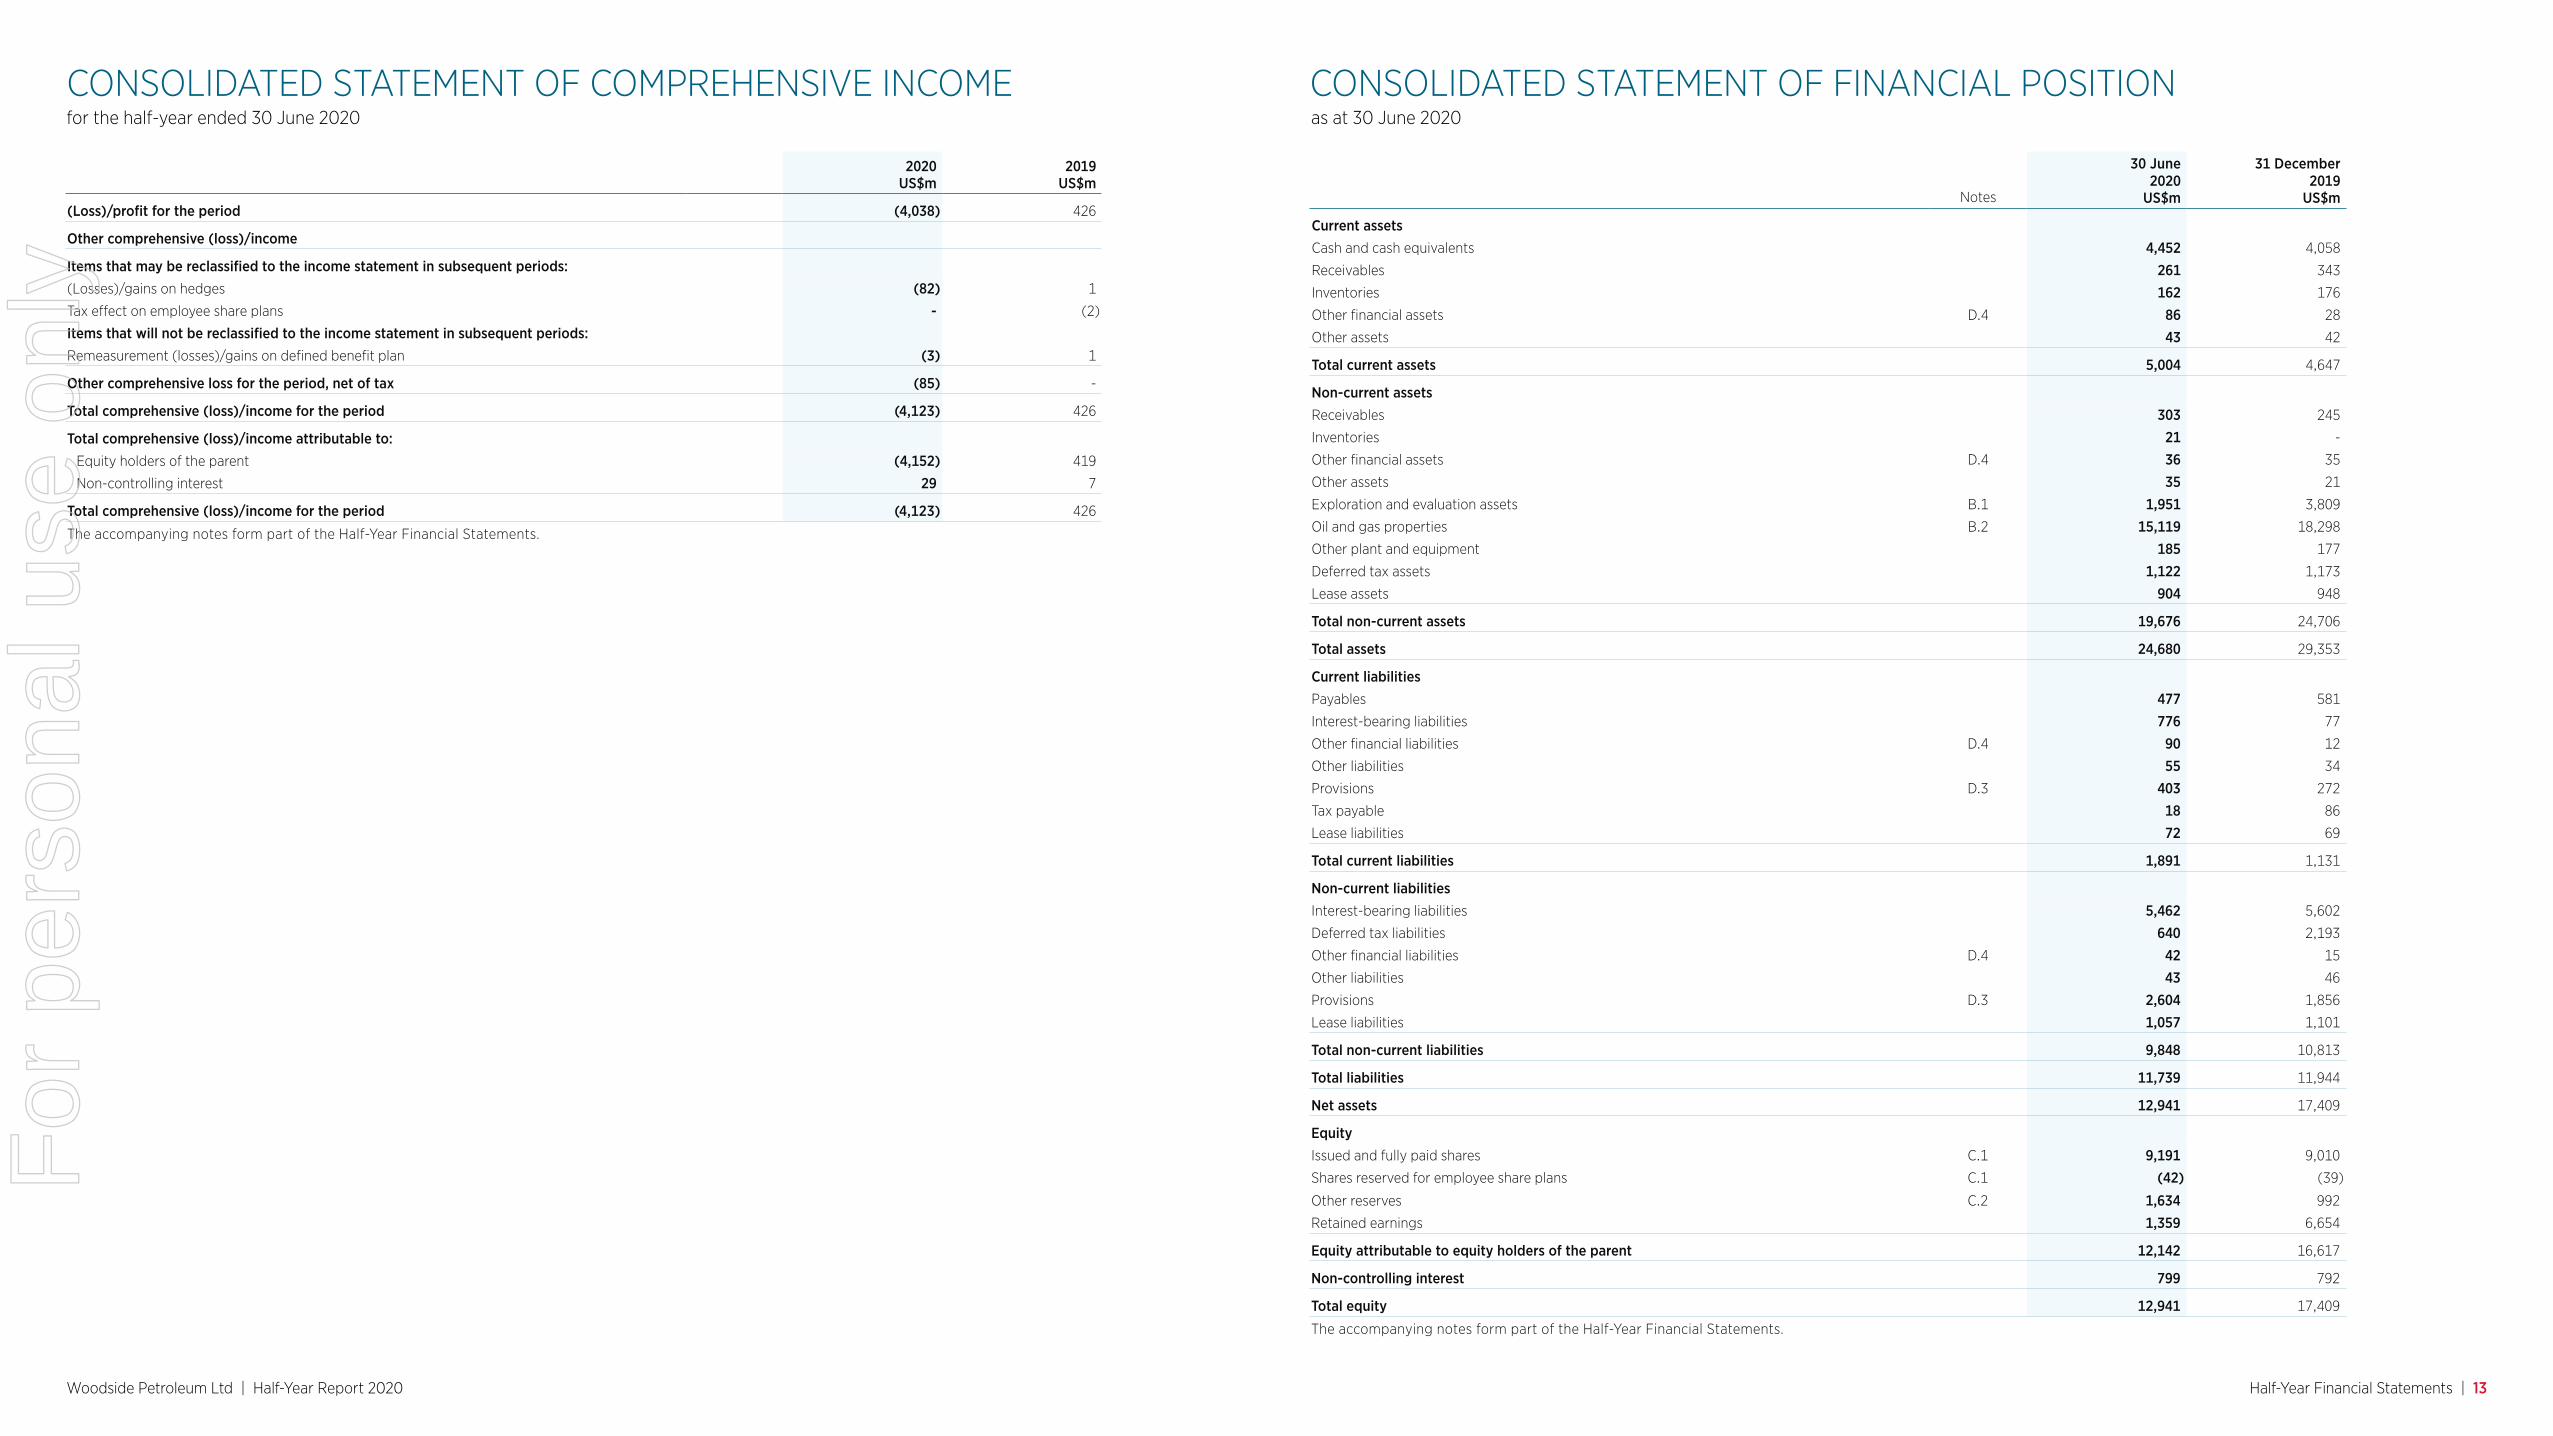
(Loss)/profit for the period (4,038) 426
Other comprehensive (loss)/income
Items that may be reclassified to the income statement in subsequent periods:(Losses)/gains on hedges (82) 1
Tax effect on employee share plans - (2)
Items that will not be reclassified to the income statement in subsequent periods:Remeasurement (losses)/gains on defined benefit plan (3) 1
Other comprehensive loss for the period, net of tax (85) -
Total comprehensive (loss)/income for the period (4,123) 426
Total comprehensive (loss)/income attributable to:Equity holders of the parent (4,152) 419
Non-controlling interest 29 7
Total comprehensive (loss)/income for the period (4,123) 426
The accompanying notes form part of the Half-Year Financial Statements.
30 June 2020
31 December 2019
Notes US$m US$m
Current assetsCash and cash equivalents 4,452 4,058
Receivables 261 343
Inventories 162 176
Other financial assets D.4 86 28
Other assets 43 42
Total current assets 5,004 4,647
Non-current assetsReceivables 303 245
Inventories 21 -
Other financial assets D.4 36 35
Other assets 35 21
Exploration and evaluation assets B.1 1,951 3,809
Oil and gas properties B.2 15,119 18,298
Other plant and equipment 185 177
Deferred tax assets 1,122 1,173
Lease assets 904 948
Total non-current assets 19,676 24,706
Total assets 24,680 29,353
Current liabilitiesPayables 477 581
Interest-bearing liabilities 776 77
Other financial liabilities D.4 90 12
Other liabilities 55 34
Provisions D.3 403 272
Tax payable 18 86
Lease liabilities 72 69
Total current liabilities 1,891 1,131
Non-current liabilitiesInterest-bearing liabilities 5,462 5,602
Deferred tax liabilities 640 2,193
Other financial liabilities D.4 42 15
Other liabilities 43 46
Provisions D.3 2,604 1,856
Lease liabilities 1,057 1,101
Total non-current liabilities 9,848 10,813
Total liabilities 11,739 11,944
Net assets 12,941 17,409
Equity Issued and fully paid shares C.1 9,191 9,010
Shares reserved for employee share plans C.1 (42) (39)
Other reserves C.2 1,634 992
Retained earnings 1,359 6,654
Equity attributable to equity holders of the parent 12,142 16,617
Non-controlling interest 799 792
Total equity 12,941 17,409
The accompanying notes form part of the Half-Year Financial Statements.
For
per
sona
l use
onl
y
Woodside Petroleum Ltd | Half-Year Report 2020 Half-Year Financial Statements | 14
for the half-year ended 30 June 2020
CONSOLIDATED STATEMENT OF CHANGES IN EQUITYfor the half-year ended 30 June 2020
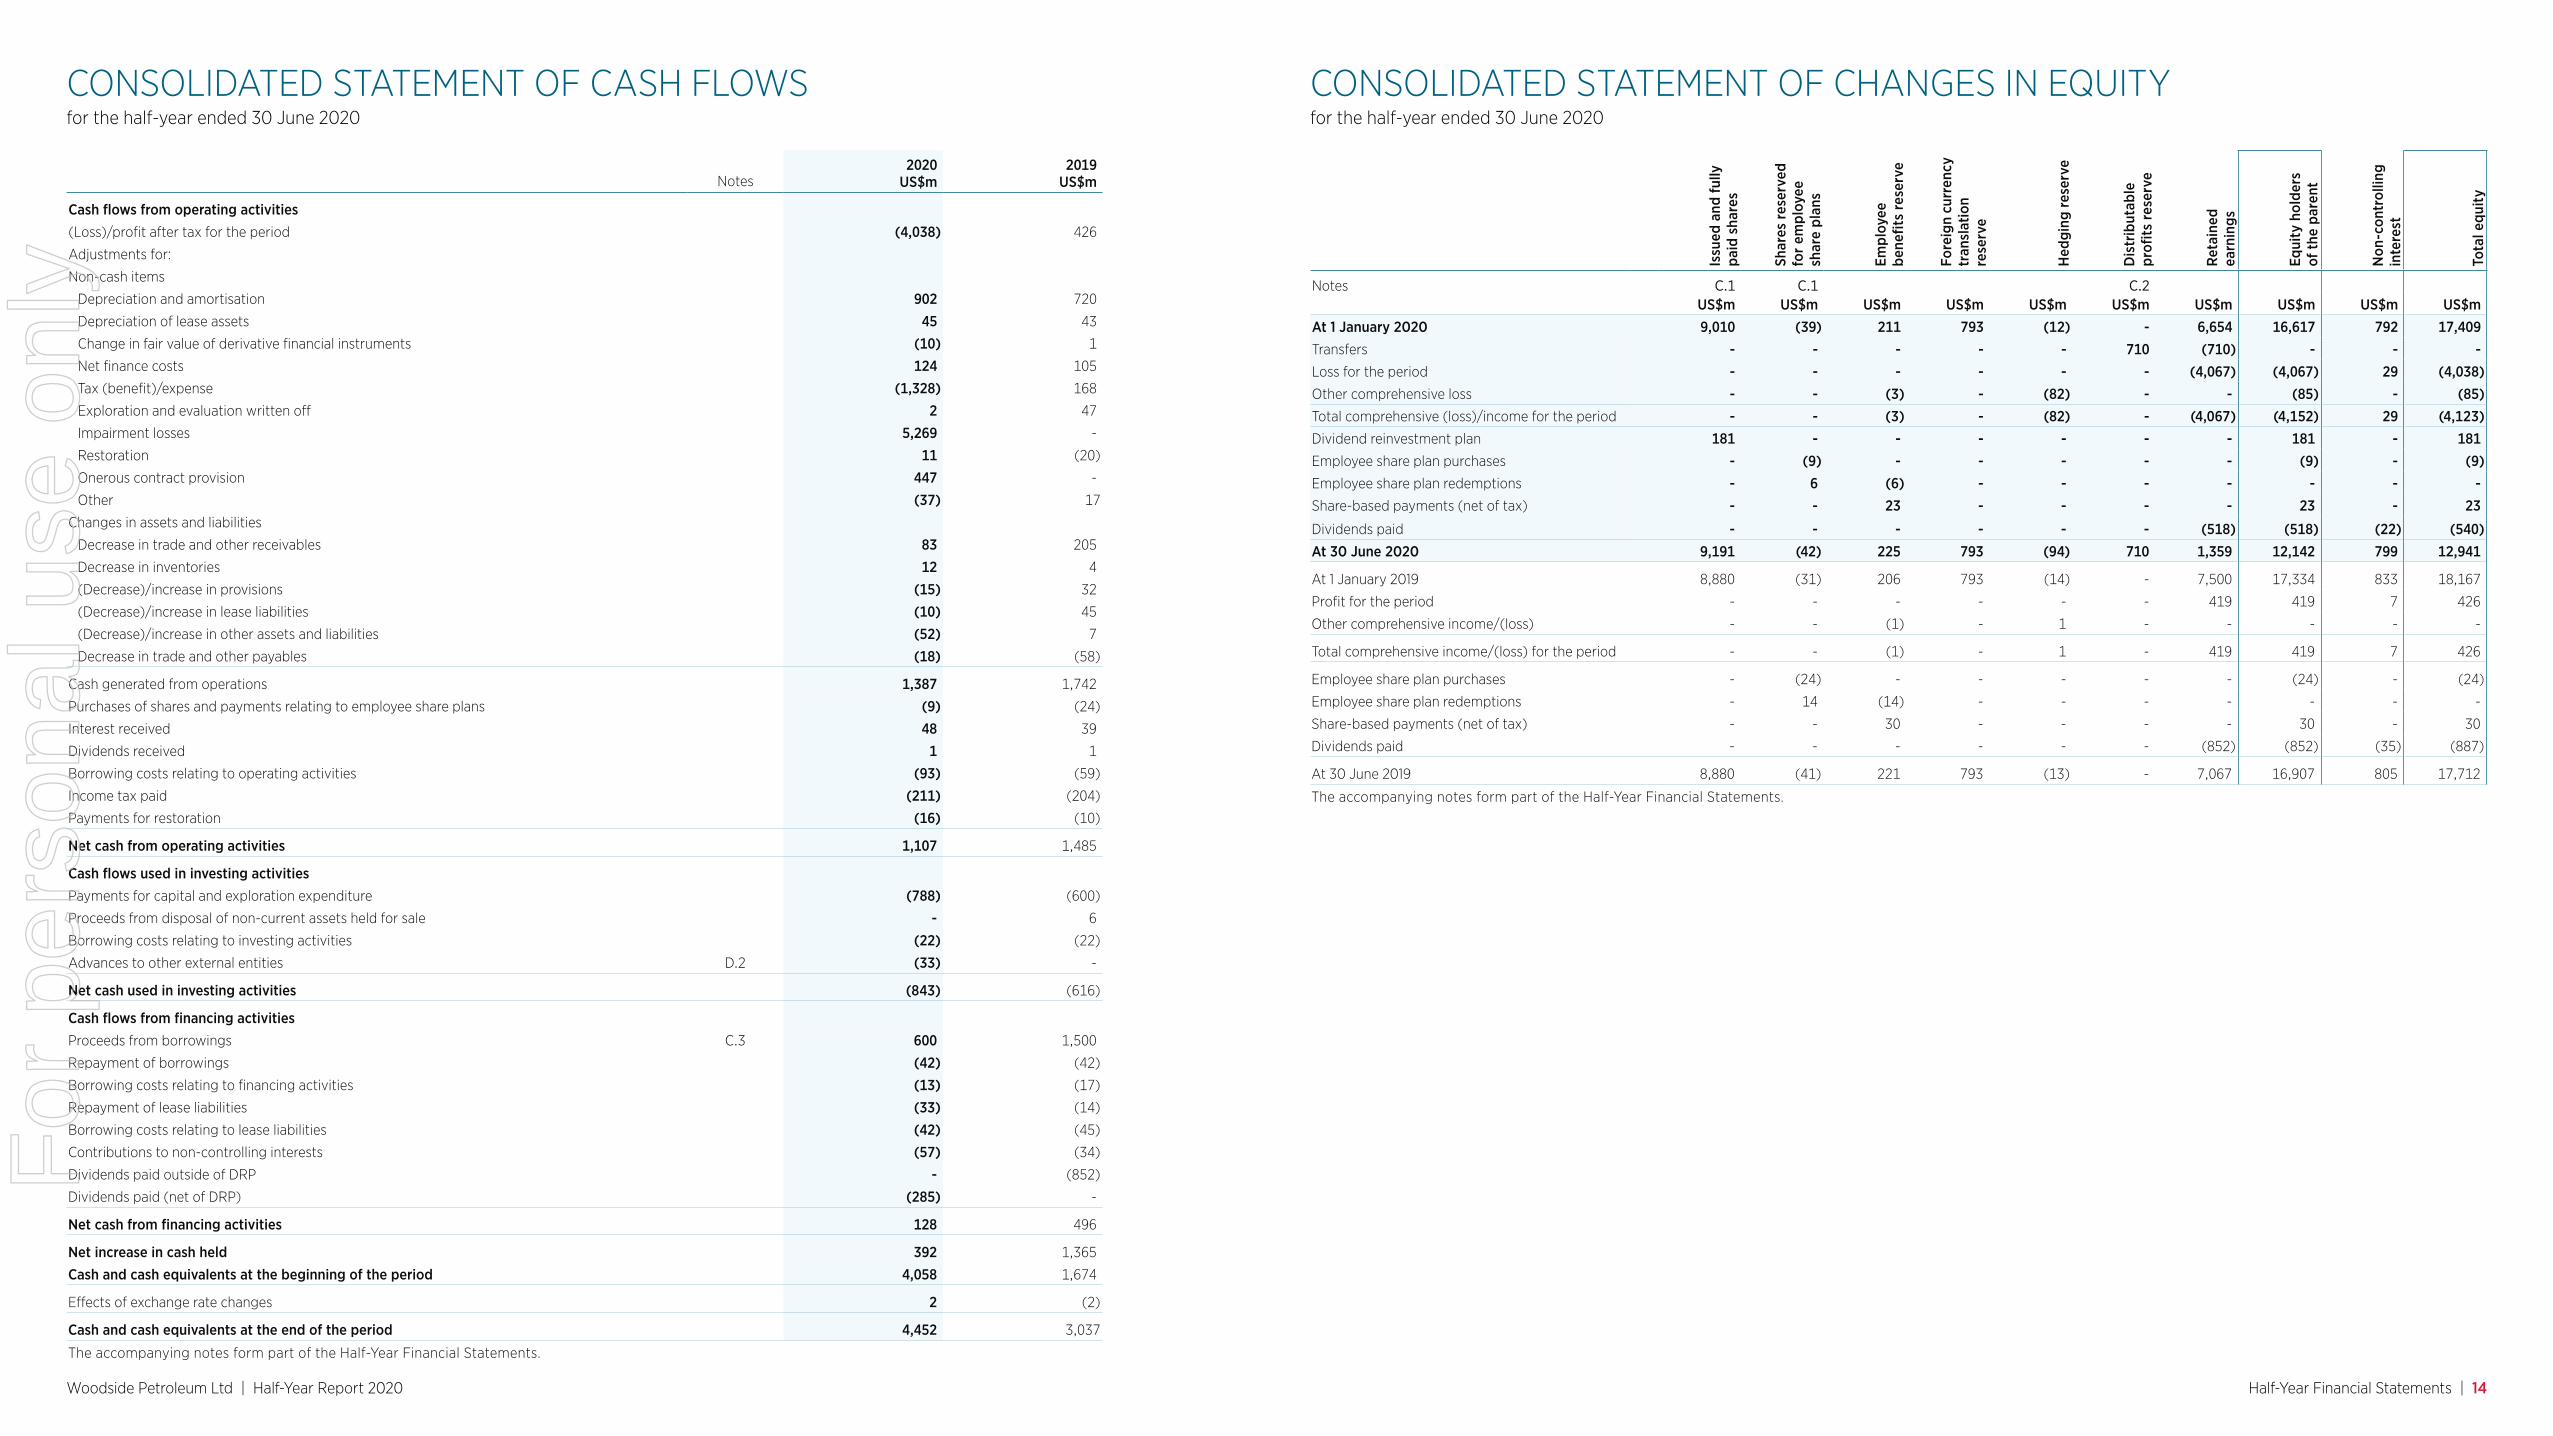
CONSOLIDATED STATEMENT OF CASH FLOWS
2020 2019 Notes US$m US$m
Cash flows from operating activities
(Loss)/profit after tax for the period (4,038) 426
Adjustments for:
Non-cash items
Depreciation and amortisation 902 720
Depreciation of lease assets 45 43
Change in fair value of derivative financial instruments (10) 1
Net finance costs 124 105
Tax (benefit)/expense (1,328) 168
Exploration and evaluation written off 2 47
Impairment losses 5,269 -
Restoration 11 (20)
Onerous contract provision 447 -
Other (37) 17
Changes in assets and liabilities
Decrease in trade and other receivables 83 205
Decrease in inventories 12 4
(Decrease)/increase in provisions (15) 32
(Decrease)/increase in lease liabilities (10) 45
(Decrease)/increase in other assets and liabilities (52) 7
Decrease in trade and other payables (18) (58)
Cash generated from operations 1,387 1,742
Purchases of shares and payments relating to employee share plans (9) (24)
Interest received 48 39
Dividends received 1 1
Borrowing costs relating to operating activities (93) (59)
Income tax paid (211) (204)
Payments for restoration (16) (10)
Net cash from operating activities 1,107 1,485
Cash flows used in investing activitiesPayments for capital and exploration expenditure (788) (600)
Proceeds from disposal of non-current assets held for sale - 6
Borrowing costs relating to investing activities (22) (22)
Advances to other external entities D.2 (33) -
Net cash used in investing activities (843) (616)
Cash flows from financing activitiesProceeds from borrowings C.3 600 1,500
Repayment of borrowings (42) (42)
Borrowing costs relating to financing activities (13) (17)
Repayment of lease liabilities (33) (14)
Borrowing costs relating to lease liabilities (42) (45)
Contributions to non-controlling interests (57) (34)
Dividends paid outside of DRP - (852)
Dividends paid (net of DRP) (285) -
Net cash from financing activities 128 496
Net increase in cash held 392 1,365
Cash and cash equivalents at the beginning of the period 4,058 1,674
Effects of exchange rate changes 2 (2)
Cash and cash equivalents at the end of the period 4,452 3,037
The accompanying notes form part of the Half-Year Financial Statements.
Issu
ed a
nd fu
lly
paid
sha
res
Shar
es r
eser
ved
for
empl
oyee
sh
are
plan
s
Empl
oyee
be
nefit
s re
serv
e
Fore
ign
curr
ency
tr
ansl
atio
n re
serv
e
Hed
ging
res
erve
Dis
trib
utab
le
profi
ts r
eser
ve
Ret
aine
d ea
rnin
gs
Equi
ty h
olde
rs
of th
e pa
rent
Non
-con
trol
ling
inte
rest
Tota
l equ
ity
Notes C.1 C.1 C.2 US$m US$m US$m US$m US$m US$m US$m US$m US$m US$mAt 1 January 2020 9,010 (39) 211 793 (12) - 6,654 16,617 792 17,409 Transfers - - - - - 710 (710) - - -Loss for the period - - - - - - (4,067) (4,067) 29 (4,038)Other comprehensive loss - - (3) - (82) - - (85) - (85)Total comprehensive (loss)/income for the period - - (3) - (82) - (4,067) (4,152) 29 (4,123)Dividend reinvestment plan 181 - - - - - - 181 - 181 Employee share plan purchases - (9) - - - - - (9) - (9)Employee share plan redemptions - 6 (6) - - - - - - -Share-based payments (net of tax) - - 23 - - - - 23 - 23
Dividends paid - - - - - - (518) (518) (22) (540)At 30 June 2020 9,191 (42) 225 793 (94) 710 1,359 12,142 799 12,941
At 1 January 2019 8,880 (31) 206 793 (14) - 7,500 17,334 833 18,167
Profit for the period - - - - - - 419 419 7 426
Other comprehensive income/(loss) - - (1) - 1 - - - - -
Total comprehensive income/(loss) for the period - - (1) - 1 - 419 419 7 426
Employee share plan purchases - (24) - - - - - (24) - (24)
Employee share plan redemptions - 14 (14) - - - - - - -
Share-based payments (net of tax) - - 30 - - - - 30 - 30
Dividends paid - - - - - - (852) (852) (35) (887)
At 30 June 2019 8,880 (41) 221 793 (13) - 7,067 16,907 805 17,712
The accompanying notes form part of the Half-Year Financial Statements.
For
per
sona
l use
onl
y
Woodside Petroleum Ltd | Half-Year Report 2020 Half-Year Financial Statements | 15
About these statementsWoodside Petroleum Ltd (Woodside or the Group) is a for-profit entity limited by shares, incorporated and domiciled in Australia. Its shares are publicly traded on the Australian Securities Exchange. The nature of the operations and principal activities of the Group are described in the Base business and Developments sections and in the segment information below.
The condensed half-year financial statements were authorised for issue in accordance with a resolution of the directors on 13 August 2020.
Statement of complianceThe condensed half-year financial statements are condensed general purpose financial statements, which have been prepared in accordance with the requirements of the Corporations Act 2001 and Australian Accounting Standard (AASB) 134 Interim Financial Reporting.
The condensed half-year financial statements do not include all notes of the type normally included in annual financial statements. Accordingly, these condensed half-year financial statements are to be read in conjunction with the Financial Statements within the Annual Report for the year ended 31 December 2019 (2019 Financial Statements) and any public announcements made by Woodside during the period ended 30 June 2020 in accordance with the continuous disclosure requirements of the Corporations Act 2001 and the ASX Listing Rules.
The accounting policies are consistent with those disclosed in the 2019 Financial Statements except for the impact of new or amended standards and interpretations effective 1 January 2020. The adoption of these standards and interpretations did not result in any significant changes to the Group’s accounting policies.
The Group early adopted AASB 2019-3 Amendments to Australian Accounting Standards - Interest Rate Benchmark Reform (AASB 2019-3) in the prior year, effective from 1 January 2019.
CurrencyThe functional and presentation currency of Woodside and all its subsidiaries is US dollars.
Transactions in foreign currencies are initially recorded in the functional currency of the transacting entity at the exchange rates ruling at the date of transaction. Monetary assets and liabilities denominated in foreign currencies at the reporting date are translated at the rates of exchange ruling at that date. Exchange differences in the consolidated financial statements are taken to the income statement.
Rounding of amountsThe amounts contained in the condensed half-year financial statements have been rounded to the nearest million dollars under the option available to the Group under Australian Securities and Investments Commission (ASIC) Corporations (Rounding in Financial/Directors’ Reports) Instrument 2016/191 dated 24 March 2016, unless otherwise stated.
Basis of preparationThe condensed half-year financial statements have been prepared on a historical cost basis, except for derivative financial instruments and certain other financial assets and financial liabilities, which have been measured at fair value or amortised cost adjusted for changes in fair value attributable to the risks that are being hedged in effective hedge relationships. Where not carried at fair value, if the carrying value of financial assets and financial liabilities does not approximate their fair value, the fair value has been included in the notes to the condensed half-year financial statements.
The condensed half-year financial statements comprise the financial results of the Group and its subsidiaries for the period ended 30 June 2020. Subsidiaries are fully consolidated from the date on which control is obtained by the Group and cease to be consolidated from the date at which the Group ceases to have control.
The subsidiaries of the Group have the same reporting period and accounting policies as the parent company. All intercompany balances and transactions, including unrealised profits and losses arising from intra-group transactions, have been eliminated in full.
Non-controlling interests are allocated their share of the net profit after tax in the consolidated income statement, their share of other comprehensive income, net of tax, in the consolidated statement of comprehensive income, and are presented within equity in the consolidated statement of financial position, separately from parent shareholders’ equity.
The condensed half-year financial statements provide comparative information in respect of the previous period. Reclassifications of items in the financial statements of the previous period have been made in accordance with the classification of items in the condensed half-year financial statements of the current period.
Reporting segmentsThe Group has identified its operating segments based on the internal reports that are reviewed and used by the executive management team in assessing performance and in determining the allocation of resources.
The reporting segments are consistent with the 2019 Financial Statements. In the period, the following changes were made and 2019 amounts have been restated:
• Revenue from sale of hydrocarbons – the Group changed the presentation of LNG revenue to align with the marketing and sale of LNG on a portfolio basis. LNG revenue includes the sale of produced and purchased LNG and is measured for each segment at the average realised price of all LNG sold. The sale of purchased LNG was previously classified as trading revenue or other hydrocarbon revenue in the segment note in the 2019 Financial Statements.
• Shipping and other revenue – was previously classified as trading revenue in the 2019 Financial Statements.
The geographical location where the Group generates revenue from contracts with external customers has not significantly changed from the year ended 31 December 2019.
for the half-year ended 30 June 2020
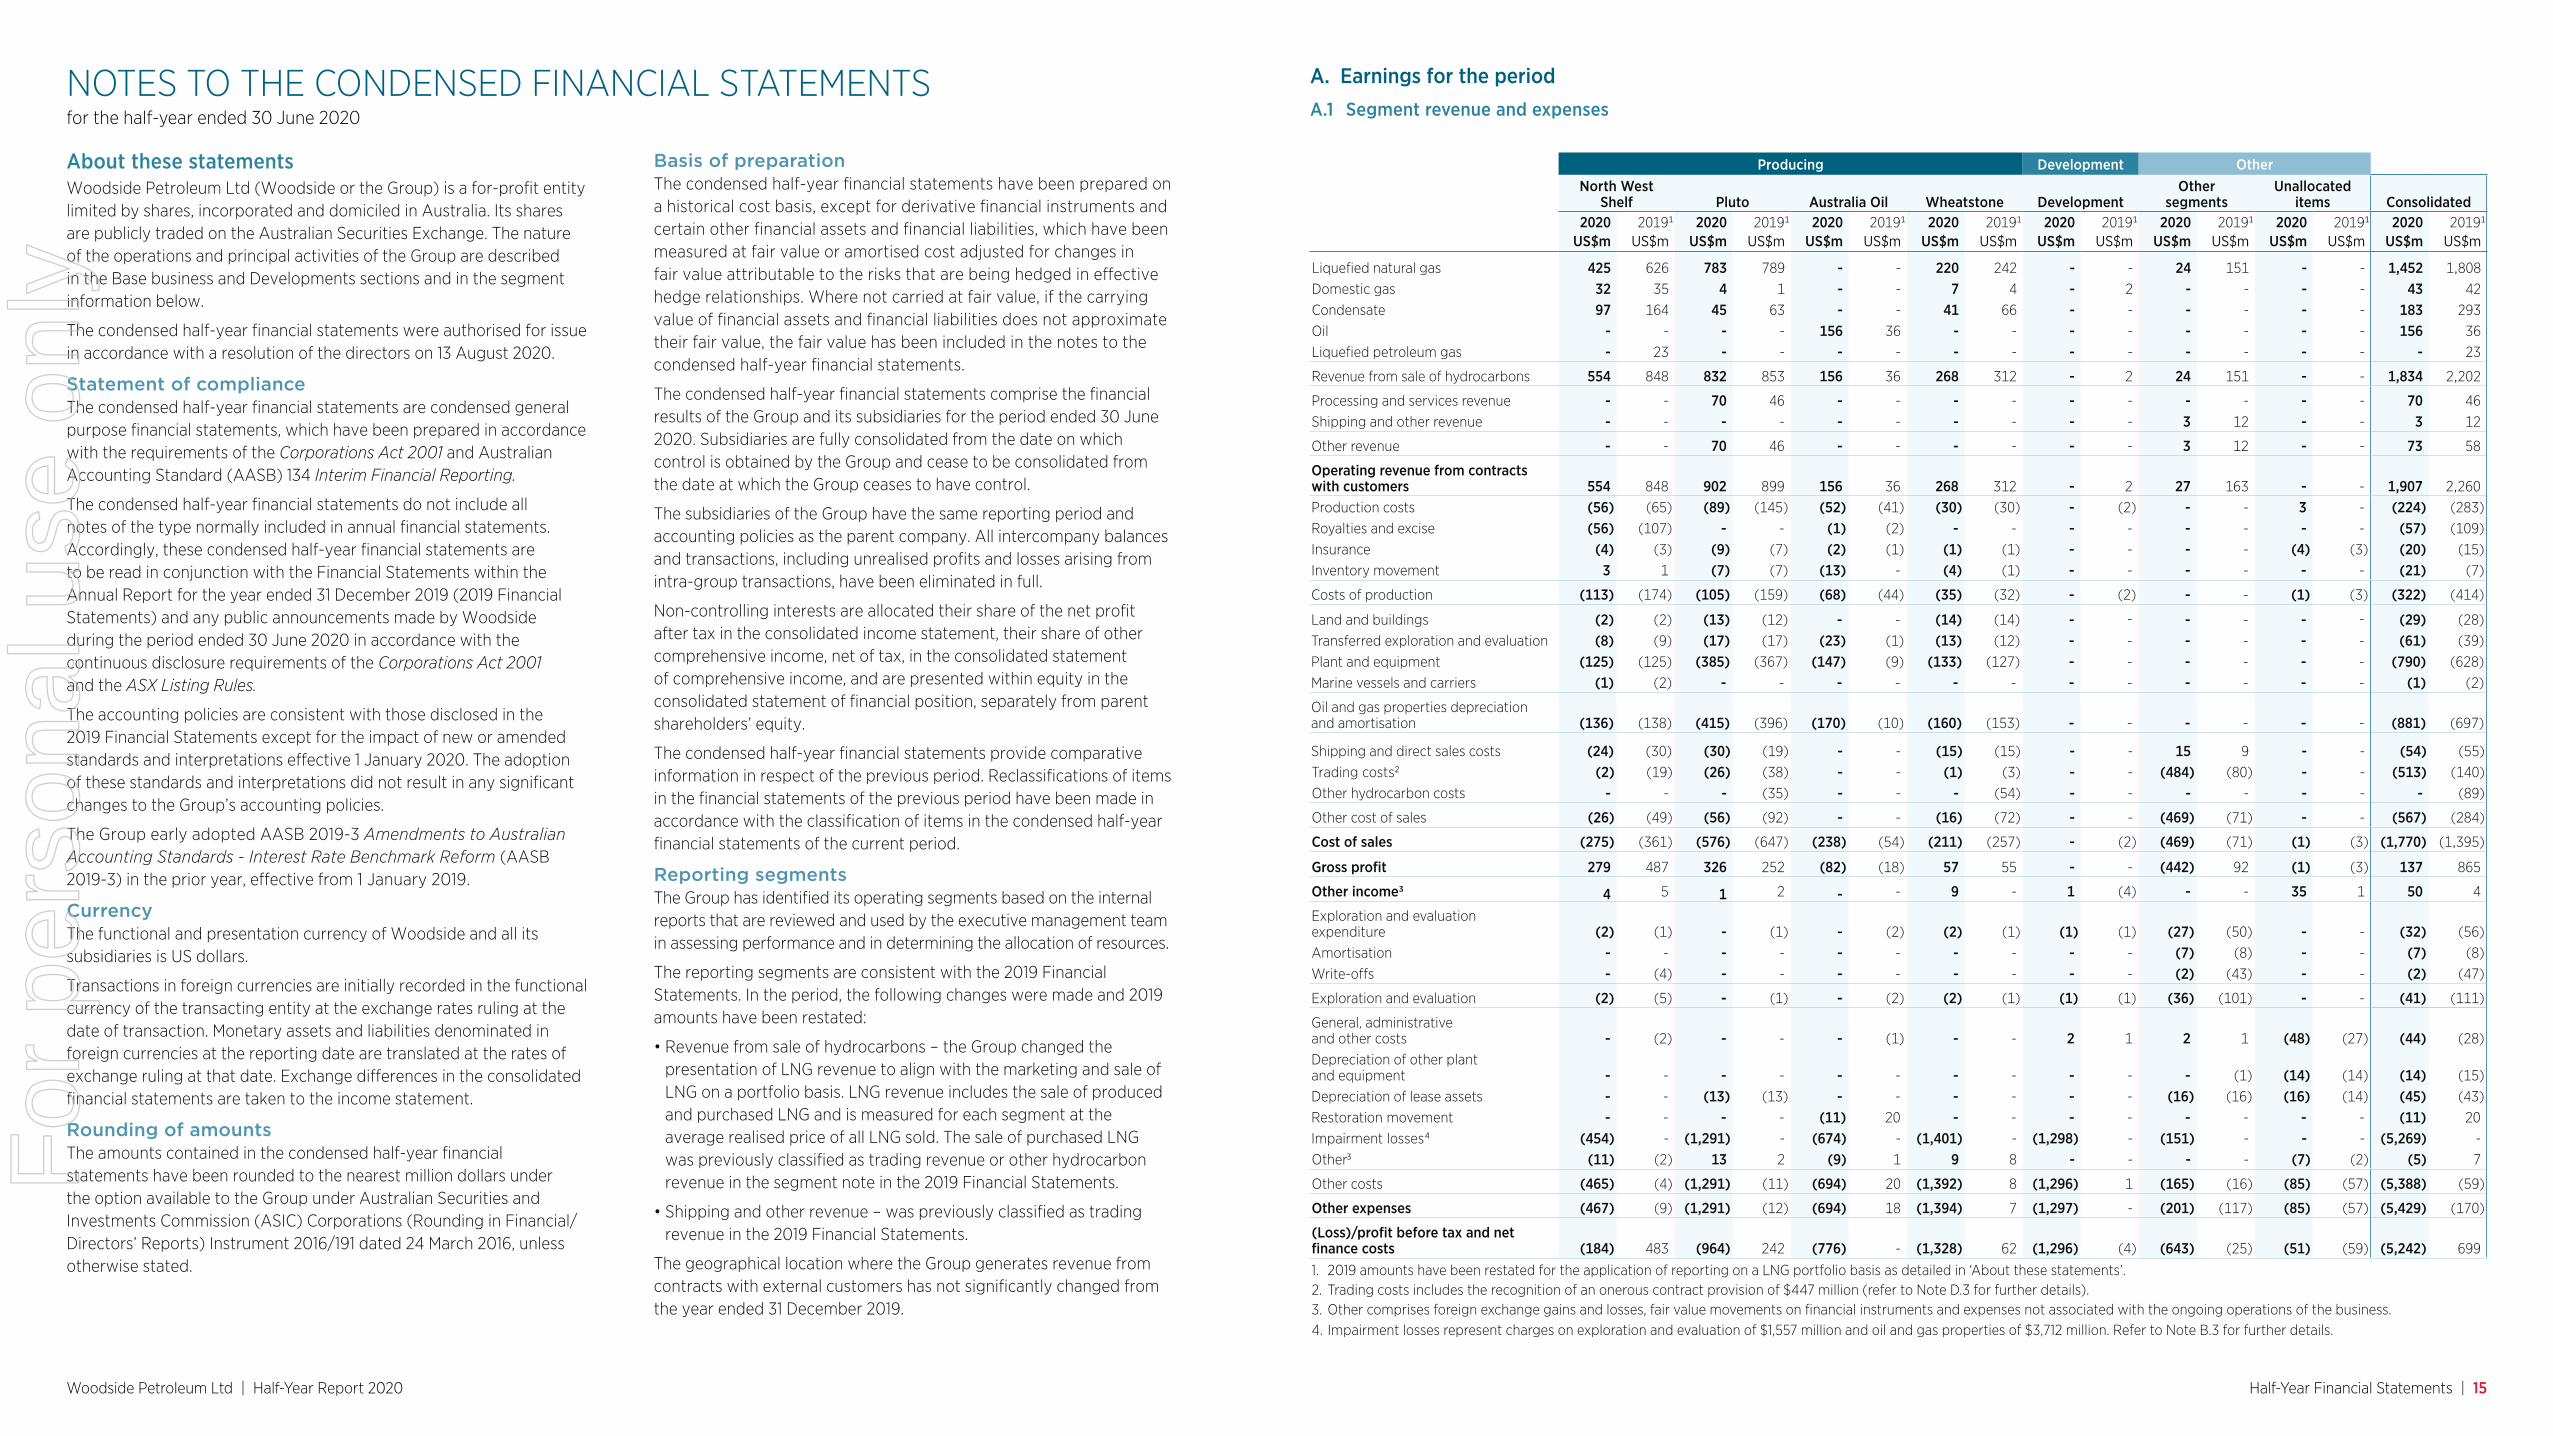
A. Earnings for the periodA.1 Segment revenue and expenses
NOTES TO THE CONDENSED FINANCIAL STATEMENTS
Producing Development Other
North West
Shelf Pluto Australia Oil Wheatstone DevelopmentOther
segmentsUnallocated
items Consolidated2020 20191 2020 20191 2020 20191 2020 20191 2020 20191 2020 20191 2020 20191 2020 20191
US$m US$m US$m US$m US$m US$m US$m US$m US$m US$m US$m US$m US$m US$m US$m US$m
Liquefied natural gas 425 626 783 789 - - 220 242 - - 24 151 - - 1,452 1,808 Domestic gas 32 35 4 1 - - 7 4 - 2 - - - - 43 42 Condensate 97 164 45 63 - - 41 66 - - - - - - 183 293 Oil - - - - 156 36 - - - - - - - - 156 36 Liquefied petroleum gas - 23 - - - - - - - - - - - - - 23
Revenue from sale of hydrocarbons 554 848 832 853 156 36 268 312 - 2 24 151 - - 1,834 2,202
Processing and services revenue - - 70 46 - - - - - - - - - - 70 46 Shipping and other revenue - - - - - - - - - - 3 12 - - 3 12
Other revenue - - 70 46 - - - - - - 3 12 - - 73 58
Operating revenue from contracts with customers 554 848 902 899 156 36 268 312 - 2 27 163 - - 1,907 2,260 Production costs (56) (65) (89) (145) (52) (41) (30) (30) - (2) - - 3 - (224) (283)Royalties and excise (56) (107) - - (1) (2) - - - - - - - - (57) (109)Insurance (4) (3) (9) (7) (2) (1) (1) (1) - - - - (4) (3) (20) (15)Inventory movement 3 1 (7) (7) (13) - (4) (1) - - - - - - (21) (7)
Costs of production (113) (174) (105) (159) (68) (44) (35) (32) - (2) - - (1) (3) (322) (414)
Land and buildings (2) (2) (13) (12) - - (14) (14) - - - - - - (29) (28)Transferred exploration and evaluation (8) (9) (17) (17) (23) (1) (13) (12) - - - - - - (61) (39)Plant and equipment (125) (125) (385) (367) (147) (9) (133) (127) - - - - - - (790) (628)Marine vessels and carriers (1) (2) - - - - - - - - - - - - (1) (2)
Oil and gas properties depreciation and amortisation (136) (138) (415) (396) (170) (10) (160) (153) - - - - - - (881) (697)
Shipping and direct sales costs (24) (30) (30) (19) - - (15) (15) - - 15 9 - - (54) (55)Trading costs2 (2) (19) (26) (38) - - (1) (3) - - (484) (80) - - (513) (140)Other hydrocarbon costs - - - (35) - - - (54) - - - - - - - (89)
Other cost of sales (26) (49) (56) (92) - - (16) (72) - - (469) (71) - - (567) (284)
Cost of sales (275) (361) (576) (647) (238) (54) (211) (257) - (2) (469) (71) (1) (3) (1,770) (1,395)
Gross profit 279 487 326 252 (82) (18) 57 55 - - (442) 92 (1) (3) 137 865
Other income3 4 5 1 2 - - 9 - 1 (4) - - 35 1 50 4
Exploration and evaluation expenditure (2) (1) - (1) - (2) (2) (1) (1) (1) (27) (50) - - (32) (56)Amortisation - - - - - - - - - - (7) (8) - - (7) (8)Write-offs - (4) - - - - - - - - (2) (43) - - (2) (47)
Exploration and evaluation (2) (5) - (1) - (2) (2) (1) (1) (1) (36) (101) - - (41) (111)
General, administrative and other costs - (2) - - - (1) - - 2 1 2 1 (48) (27) (44) (28)Depreciation of other plant and equipment - - - - - - - - - - - (1) (14) (14) (14) (15)Depreciation of lease assets - - (13) (13) - - - - - - (16) (16) (16) (14) (45) (43)Restoration movement - - - - (11) 20 - - - - - - - - (11) 20 Impairment losses4 (454) - (1,291) - (674) - (1,401) - (1,298) - (151) - - - (5,269) -Other3 (11) (2) 13 2 (9) 1 9 8 - - - - (7) (2) (5) 7
Other costs (465) (4) (1,291) (11) (694) 20 (1,392) 8 (1,296) 1 (165) (16) (85) (57) (5,388) (59)
Other expenses (467) (9) (1,291) (12) (694) 18 (1,394) 7 (1,297) - (201) (117) (85) (57) (5,429) (170)
(Loss)/profit before tax and net finance costs (184) 483 (964) 242 (776) - (1,328) 62 (1,296) (4) (643) (25) (51) (59) (5,242) 699
1. 2019 amounts have been restated for the application of reporting on a LNG portfolio basis as detailed in ‘About these statements’.2. Trading costs includes the recognition of an onerous contract provision of $447 million (refer to Note D.3 for further details).3. Other comprises foreign exchange gains and losses, fair value movements on financial instruments and expenses not associated with the ongoing operations of the business.4. Impairment losses represent charges on exploration and evaluation of $1,557 million and oil and gas properties of $3,712 million. Refer to Note B.3 for further details.
For
per
sona
l use
onl
y
Woodside Petroleum Ltd | Half-Year Report 2020 Half-Year Financial Statements | 16
NOTES TO THE CONDENSED FINANCIAL STATEMENTSfor the half-year ended 30 June 2020
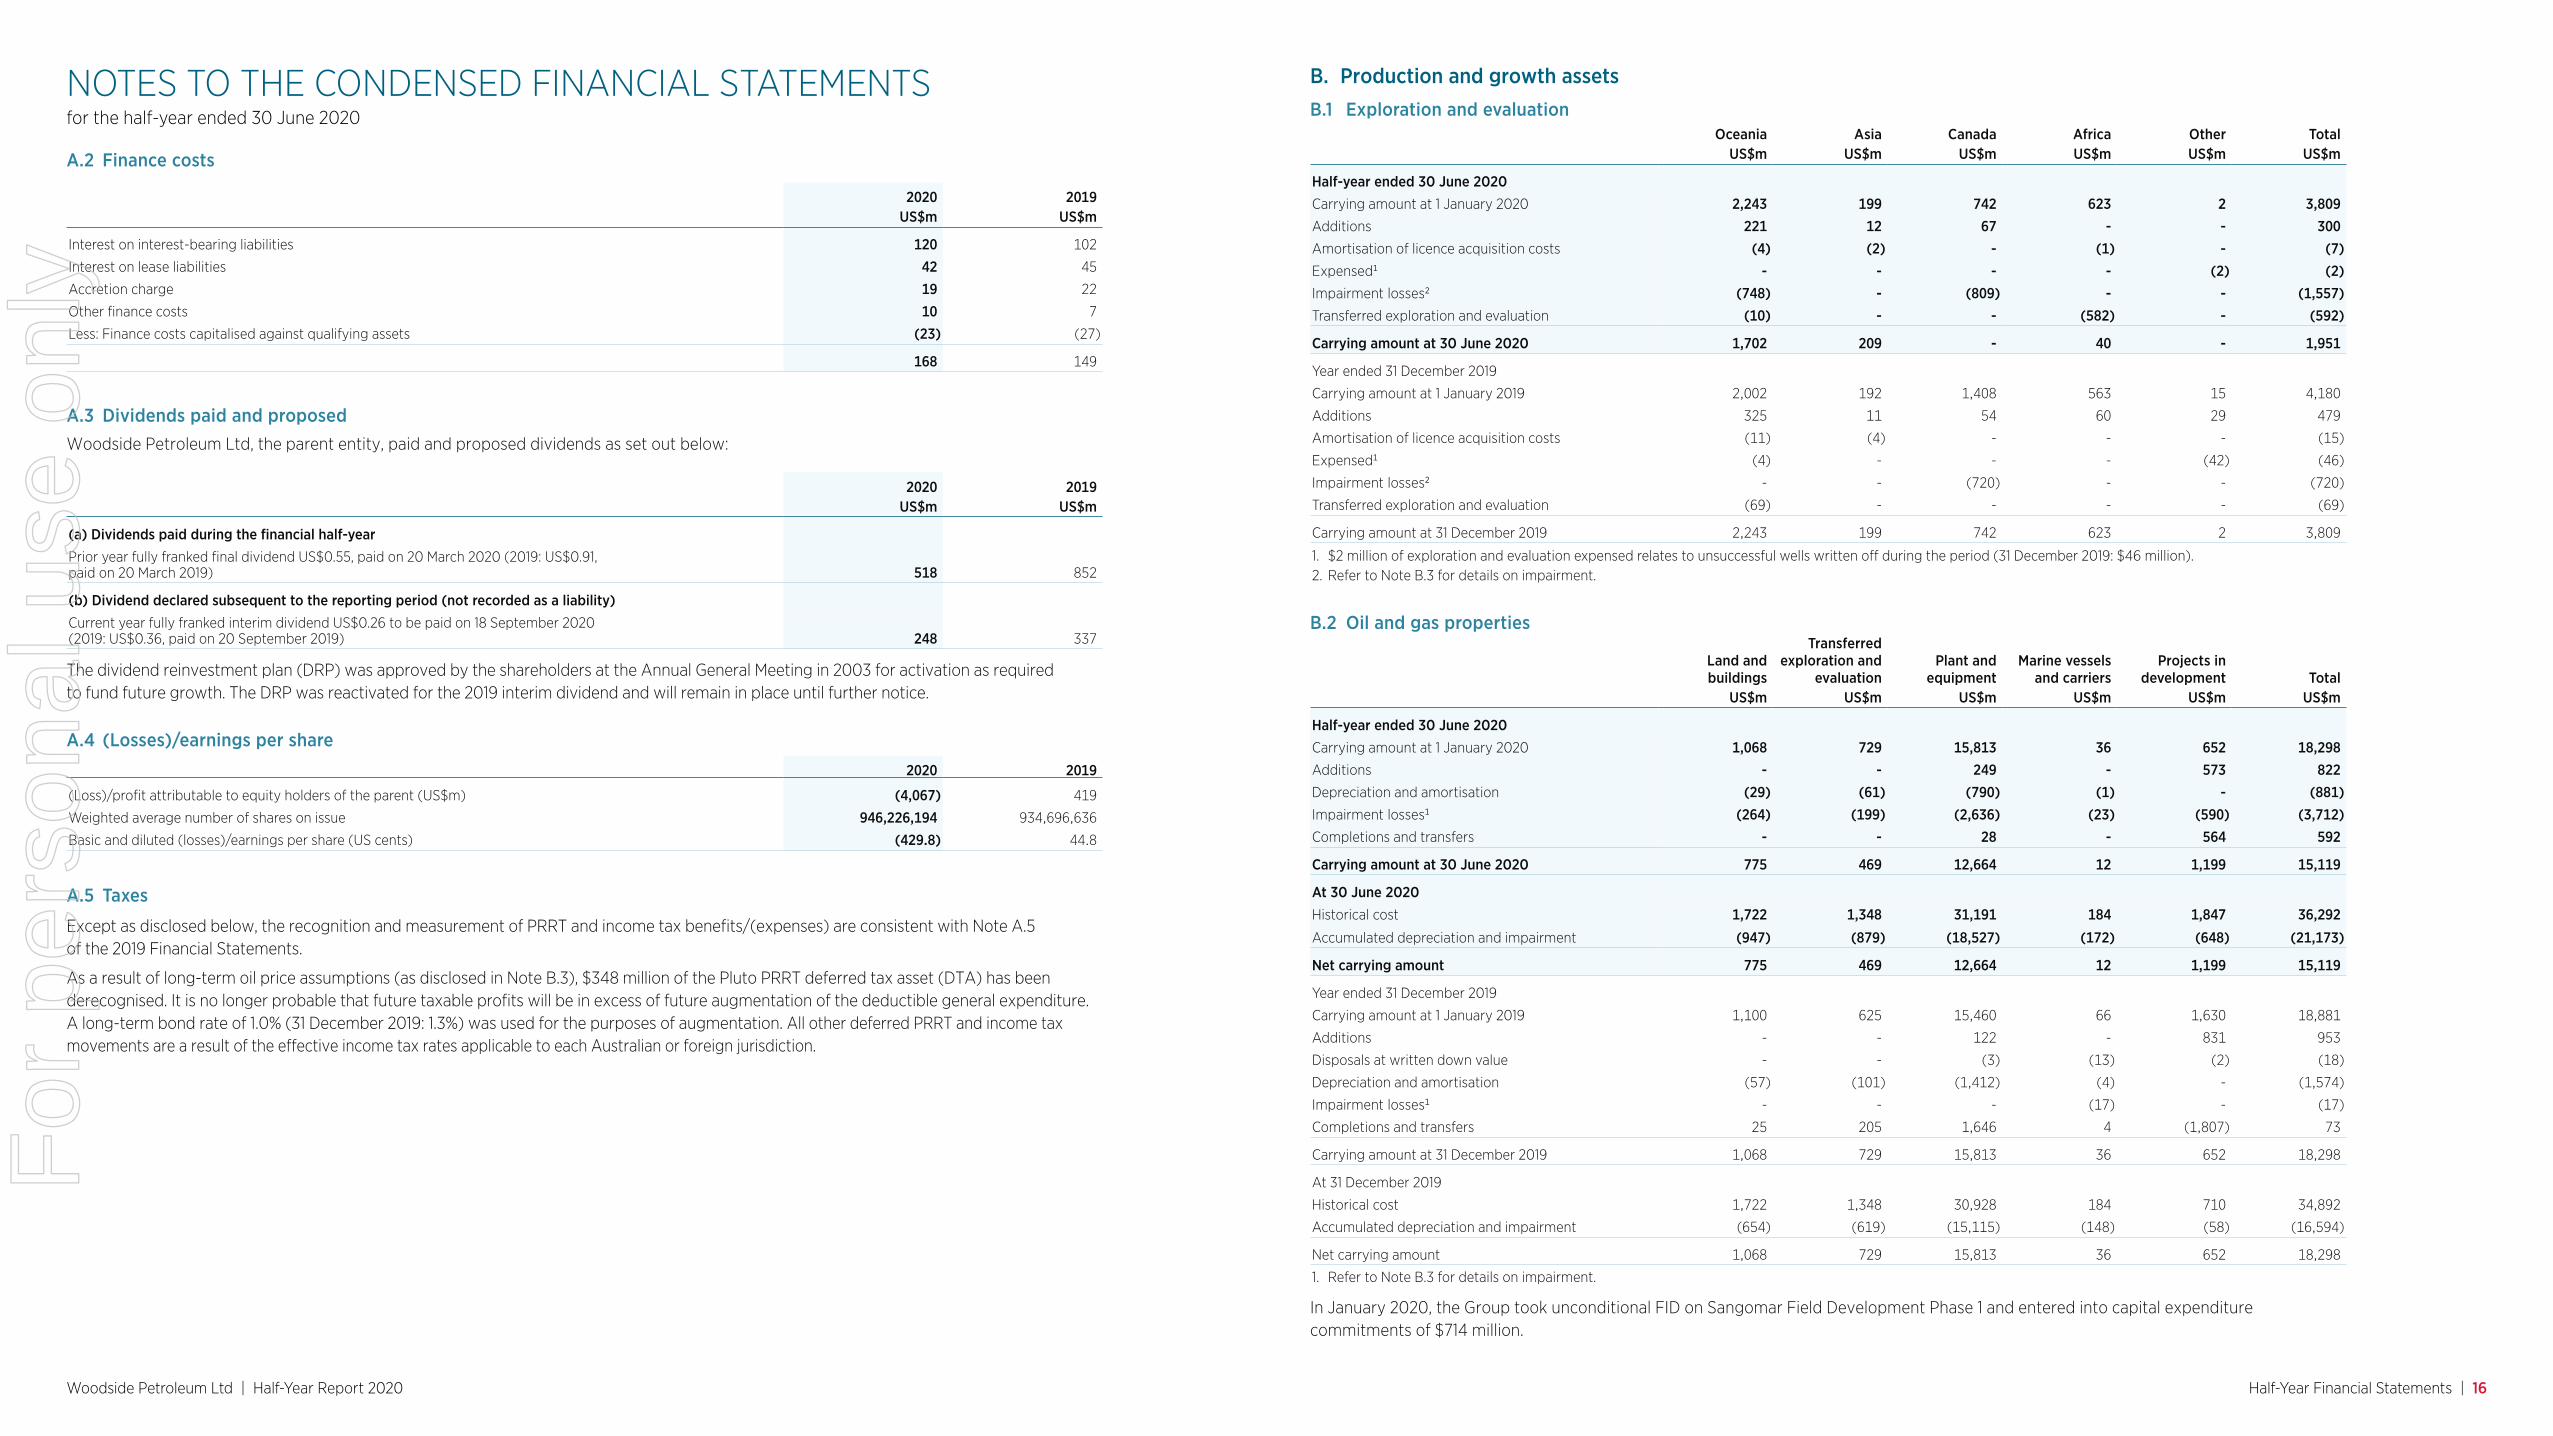
A.2 Finance costs
2020 2019US$m US$m
Interest on interest-bearing liabilities 120 102
Interest on lease liabilities 42 45
Accretion charge 19 22
Other finance costs 10 7
Less: Finance costs capitalised against qualifying assets (23) (27)
168 149
A.3 Dividends paid and proposedWoodside Petroleum Ltd, the parent entity, paid and proposed dividends as set out below:
2020 2019US$m US$m
(a) Dividends paid during the financial half-yearPrior year fully franked final dividend US$0.55, paid on 20 March 2020 (2019: US$0.91, paid on 20 March 2019) 518 852
(b) Dividend declared subsequent to the reporting period (not recorded as a liability)Current year fully franked interim dividend US$0.26 to be paid on 18 September 2020 (2019: US$0.36, paid on 20 September 2019) 248 337
The dividend reinvestment plan (DRP) was approved by the shareholders at the Annual General Meeting in 2003 for activation as required to fund future growth. The DRP was reactivated for the 2019 interim dividend and will remain in place until further notice.
A.4 (Losses)/earnings per share
2020 2019
(Loss)/profit attributable to equity holders of the parent (US$m) (4,067) 419
Weighted average number of shares on issue 946,226,194 934,696,636
Basic and diluted (losses)/earnings per share (US cents) (429.8) 44.8
A.5 Taxes
Except as disclosed below, the recognition and measurement of PRRT and income tax benefits/(expenses) are consistent with Note A.5 of the 2019 Financial Statements.
As a result of long-term oil price assumptions (as disclosed in Note B.3), $348 million of the Pluto PRRT deferred tax asset (DTA) has been derecognised. It is no longer probable that future taxable profits will be in excess of future augmentation of the deductible general expenditure. A long-term bond rate of 1.0% (31 December 2019: 1.3%) was used for the purposes of augmentation. All other deferred PRRT and income tax movements are a result of the effective income tax rates applicable to each Australian or foreign jurisdiction.
B. Production and growth assetsB.1 Exploration and evaluation
Oceania Asia Canada Africa Other TotalUS$m US$m US$m US$m US$m US$m
Half-year ended 30 June 2020Carrying amount at 1 January 2020 2,243 199 742 623 2 3,809 Additions 221 12 67 - - 300 Amortisation of licence acquisition costs (4) (2) - (1) - (7)Expensed1 - - - - (2) (2)Impairment losses2 (748) - (809) - - (1,557)Transferred exploration and evaluation (10) - - (582) - (592)
Carrying amount at 30 June 2020 1,702 209 - 40 - 1,951
Year ended 31 December 2019
Carrying amount at 1 January 2019 2,002 192 1,408 563 15 4,180
Additions 325 11 54 60 29 479
Amortisation of licence acquisition costs (11) (4) - - - (15)
Expensed1 (4) - - - (42) (46)
Impairment losses2 - - (720) - - (720)
Transferred exploration and evaluation (69) - - - - (69)
Carrying amount at 31 December 2019 2,243 199 742 623 2 3,809
1. $2 million of exploration and evaluation expensed relates to unsuccessful wells written off during the period (31 December 2019: $46 million).2. Refer to Note B.3 for details on impairment.
B.2 Oil and gas properties
Land and buildings
Transferred exploration and
evaluation Plant and
equipmentMarine vessels
and carriersProjects in
development Total US$m US$m US$m US$m US$m US$m
Half-year ended 30 June 2020Carrying amount at 1 January 2020 1,068 729 15,813 36 652 18,298 Additions - - 249 - 573 822 Depreciation and amortisation (29) (61) (790) (1) - (881)Impairment losses1 (264) (199) (2,636) (23) (590) (3,712)Completions and transfers - - 28 - 564 592
Carrying amount at 30 June 2020 775 469 12,664 12 1,199 15,119
At 30 June 2020Historical cost 1,722 1,348 31,191 184 1,847 36,292
Accumulated depreciation and impairment (947) (879) (18,527) (172) (648) (21,173)
Net carrying amount 775 469 12,664 12 1,199 15,119
Year ended 31 December 2019
Carrying amount at 1 January 2019 1,100 625 15,460 66 1,630 18,881
Additions - - 122 - 831 953
Disposals at written down value - - (3) (13) (2) (18)
Depreciation and amortisation (57) (101) (1,412) (4) - (1,574)
Impairment losses1 - - - (17) - (17)
Completions and transfers 25 205 1,646 4 (1,807) 73
Carrying amount at 31 December 2019 1,068 729 15,813 36 652 18,298
At 31 December 2019
Historical cost 1,722 1,348 30,928 184 710 34,892
Accumulated depreciation and impairment (654) (619) (15,115) (148) (58) (16,594)
Net carrying amount 1,068 729 15,813 36 652 18,298
1. Refer to Note B.3 for details on impairment.
In January 2020, the Group took unconditional FID on Sangomar Field Development Phase 1 and entered into capital expenditure commitments of $714 million.
For
per
sona
l use
onl
y
Woodside Petroleum Ltd | Half-Year Report 2020 Half-Year Financial Statements | 17
NOTES TO THE CONDENSED FINANCIAL STATEMENTSfor the half-year ended 30 June 2020
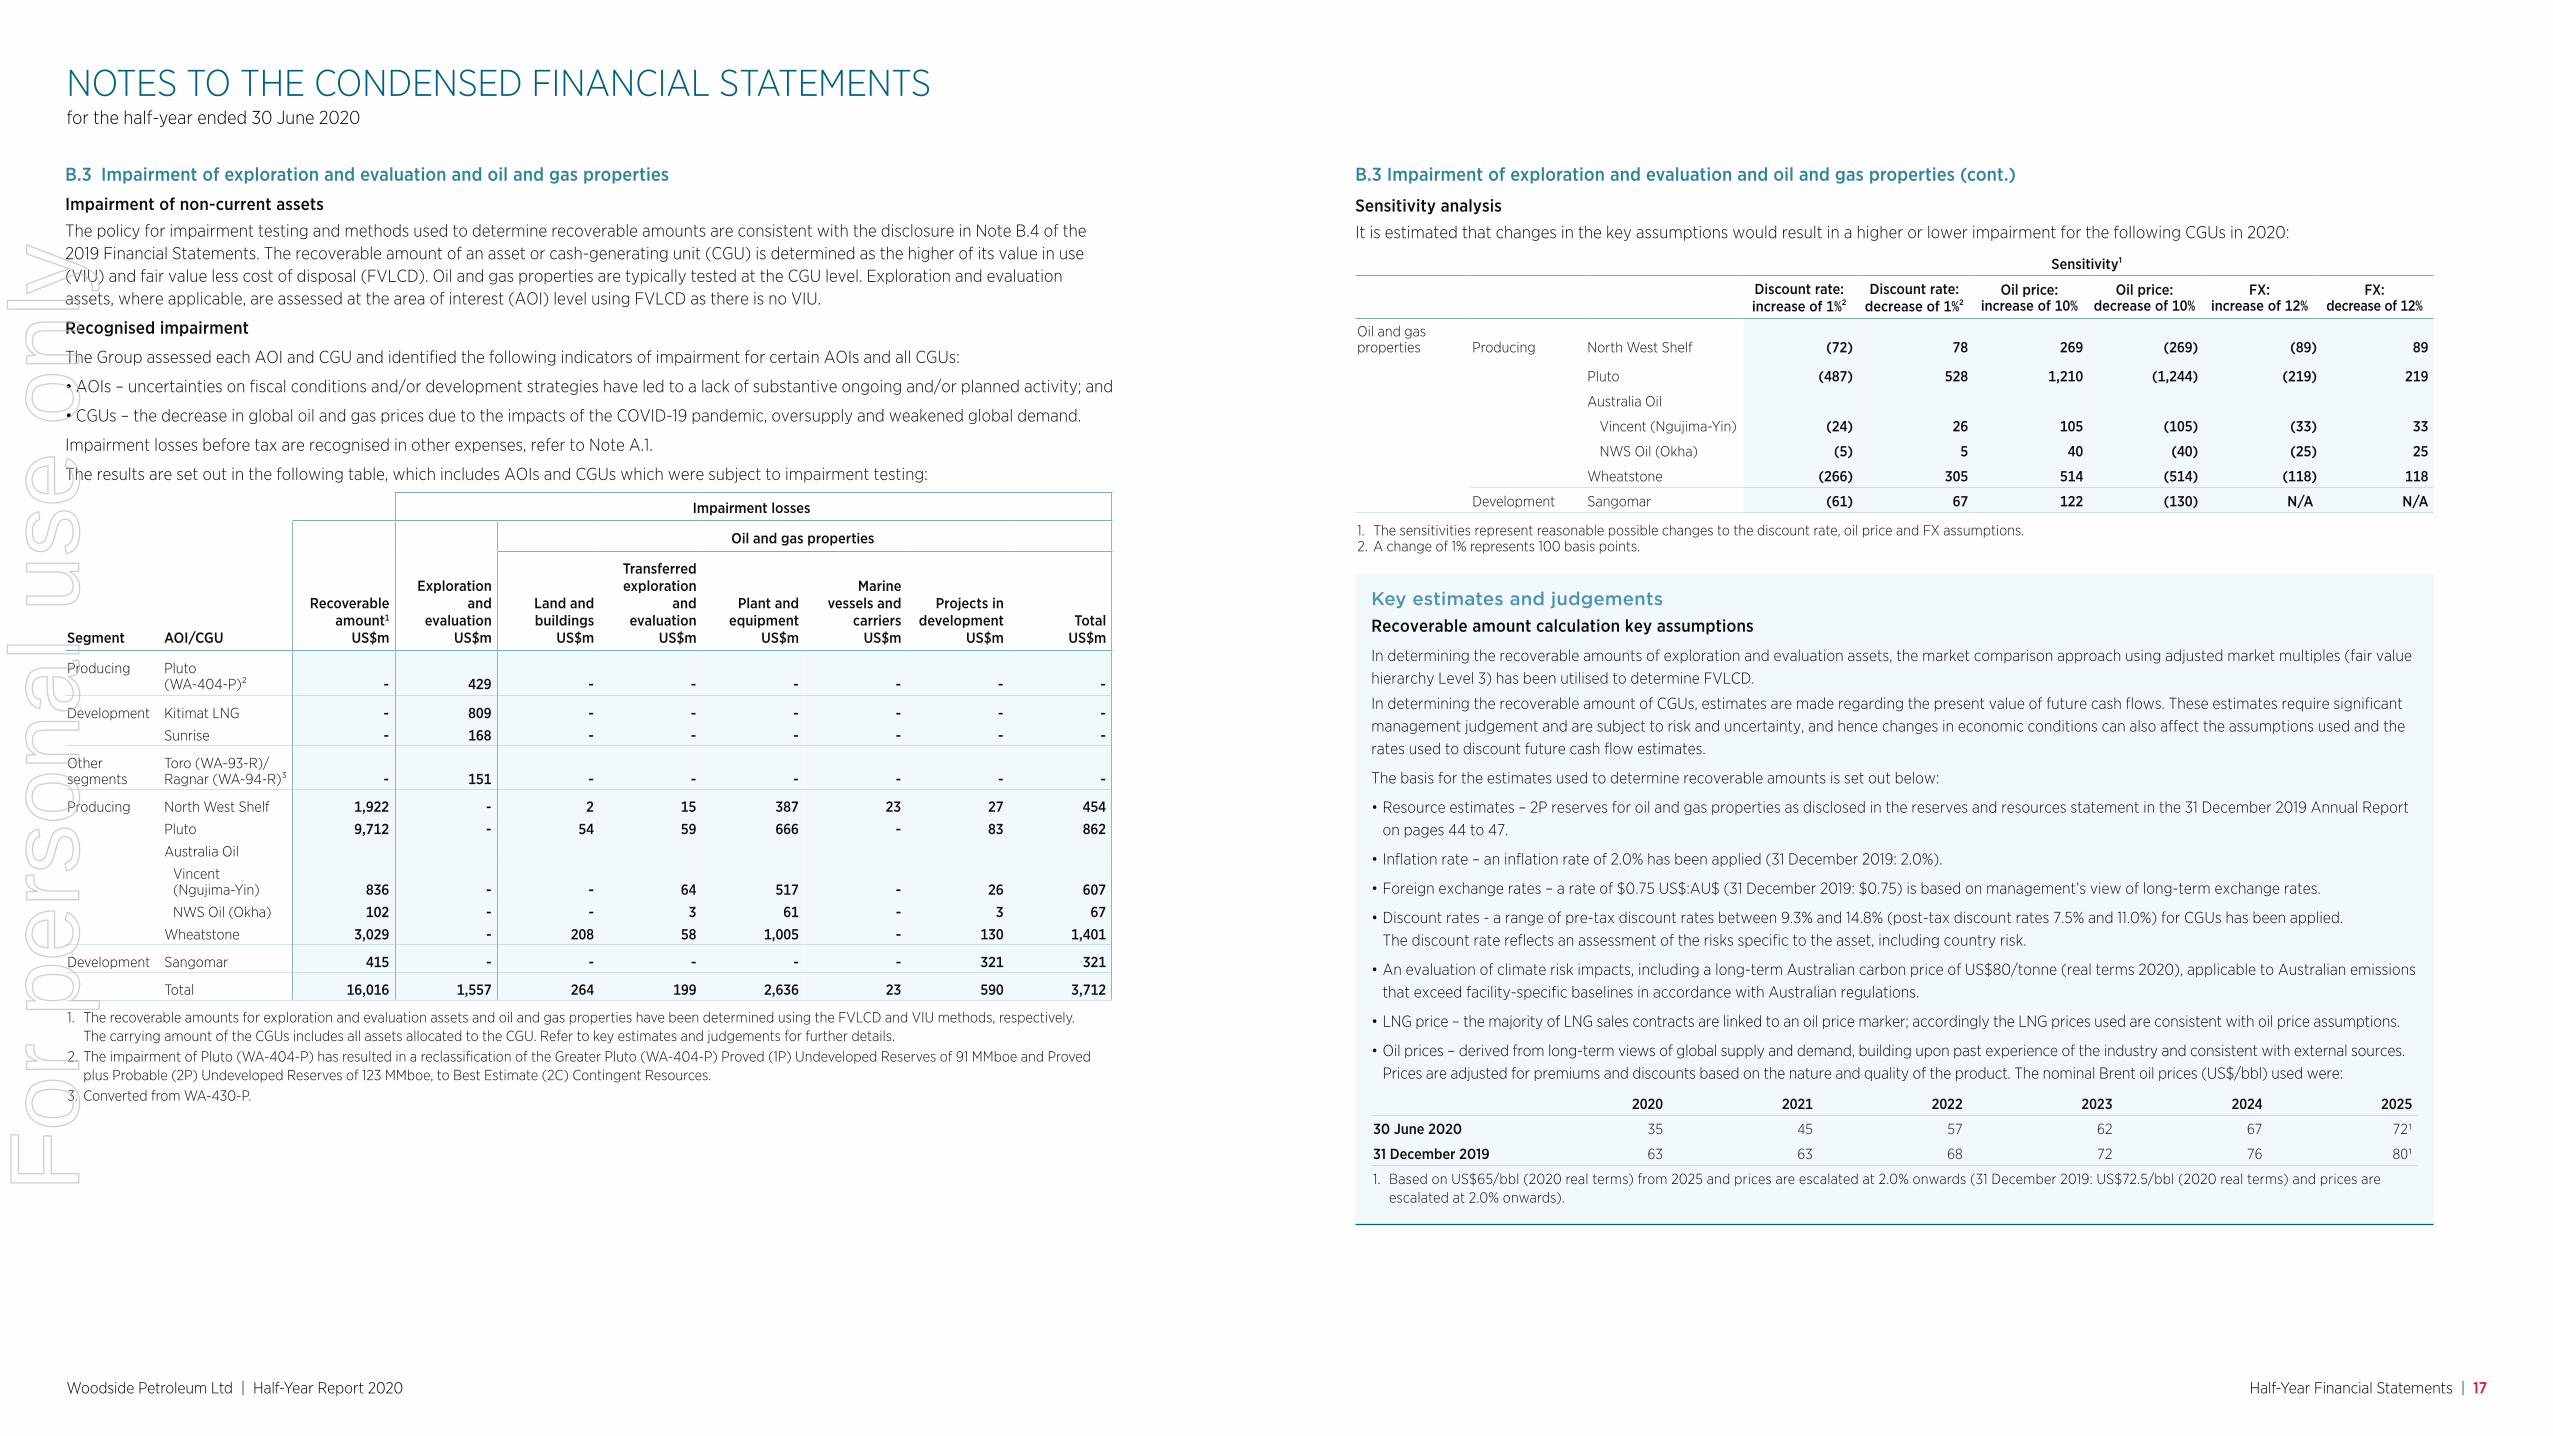
B.3 Impairment of exploration and evaluation and oil and gas properties
Impairment of non-current assetsThe policy for impairment testing and methods used to determine recoverable amounts are consistent with the disclosure in Note B.4 of the 2019 Financial Statements. The recoverable amount of an asset or cash-generating unit (CGU) is determined as the higher of its value in use (VIU) and fair value less cost of disposal (FVLCD). Oil and gas properties are typically tested at the CGU level. Exploration and evaluation assets, where applicable, are assessed at the area of interest (AOI) level using FVLCD as there is no VIU.
Recognised impairment
The Group assessed each AOI and CGU and identified the following indicators of impairment for certain AOIs and all CGUs:
• AOIs – uncertainties on fiscal conditions and/or development strategies have led to a lack of substantive ongoing and/or planned activity; and
• CGUs – the decrease in global oil and gas prices due to the impacts of the COVID-19 pandemic, oversupply and weakened global demand.
Impairment losses before tax are recognised in other expenses, refer to Note A.1.
The results are set out in the following table, which includes AOIs and CGUs which were subject to impairment testing:
Impairment losses
Recoverable amount1
US$m
Exploration and
evaluationUS$m
Oil and gas properties
Segment AOI/CGU
Land and buildings
US$m
Transferred exploration
and evaluation
US$m
Plant and equipment
US$m
Marine vessels and
carriersUS$m
Projects in development
US$mTotal
US$m
Producing Pluto (WA-404-P)² - 429 - - - - - -
Development Kitimat LNG - 809 - - - - - - Sunrise - 168 - - - - - -
Other segments
Toro (WA-93-R)/Ragnar (WA-94-R)³ - 151 - - - - - -
Producing North West Shelf 1,922 - 2 15 387 23 27 454Pluto 9,712 - 54 59 666 - 83 862Australia Oil
Vincent (Ngujima-Yin) 836 - - 64 517 - 26 607NWS Oil (Okha) 102 - - 3 61 - 3 67
Wheatstone 3,029 - 208 58 1,005 - 130 1,401
Development Sangomar 415 - - - - - 321 321
Total 16,016 1,557 264 199 2,636 23 590 3,712
1. The recoverable amounts for exploration and evaluation assets and oil and gas properties have been determined using the FVLCD and VIU methods, respectively. The carrying amount of the CGUs includes all assets allocated to the CGU. Refer to key estimates and judgements for further details.
2. The impairment of Pluto (WA-404-P) has resulted in a reclassification of the Greater Pluto (WA-404-P) Proved (1P) Undeveloped Reserves of 91 MMboe and Proved plus Probable (2P) Undeveloped Reserves of 123 MMboe, to Best Estimate (2C) Contingent Resources.
3. Converted from WA-430-P.
Key estimates and judgements
Recoverable amount calculation key assumptions
In determining the recoverable amounts of exploration and evaluation assets, the market comparison approach using adjusted market multiples (fair value hierarchy Level 3) has been utilised to determine FVLCD.
In determining the recoverable amount of CGUs, estimates are made regarding the present value of future cash flows. These estimates require significant management judgement and are subject to risk and uncertainty, and hence changes in economic conditions can also affect the assumptions used and the rates used to discount future cash flow estimates.
The basis for the estimates used to determine recoverable amounts is set out below:
• Resource estimates – 2P reserves for oil and gas properties as disclosed in the reserves and resources statement in the 31 December 2019 Annual Report on pages 44 to 47.
• Inflation rate – an inflation rate of 2.0% has been applied (31 December 2019: 2.0%).
• Foreign exchange rates – a rate of $0.75 US$:AU$ (31 December 2019: $0.75) is based on management’s view of long-term exchange rates.
• Discount rates - a range of pre-tax discount rates between 9.3% and 14.8% (post-tax discount rates 7.5% and 11.0%) for CGUs has been applied. The discount rate reflects an assessment of the risks specific to the asset, including country risk.
• An evaluation of climate risk impacts, including a long-term Australian carbon price of US$80/tonne (real terms 2020), applicable to Australian emissions that exceed facility-specific baselines in accordance with Australian regulations.
• LNG price – the majority of LNG sales contracts are linked to an oil price marker; accordingly the LNG prices used are consistent with oil price assumptions.
• Oil prices – derived from long-term views of global supply and demand, building upon past experience of the industry and consistent with external sources. Prices are adjusted for premiums and discounts based on the nature and quality of the product. The nominal Brent oil prices (US$/bbl) used were:
2020 2021 2022 2023 2024 2025
30 June 2020 35 45 57 62 67 721
31 December 2019 63 63 68 72 76 801
1. Based on US$65/bbl (2020 real terms) from 2025 and prices are escalated at 2.0% onwards (31 December 2019: US$72.5/bbl (2020 real terms) and prices are escalated at 2.0% onwards).
B.3 Impairment of exploration and evaluation and oil and gas properties (cont.)
Sensitivity analysis It is estimated that changes in the key assumptions would result in a higher or lower impairment for the following CGUs in 2020:
Sensitivity¹
Discount rate: increase of 1%²
Discount rate: decrease of 1%²
Oil price: increase of 10%
Oil price: decrease of 10%
FX: increase of 12%
FX: decrease of 12%
Oil and gas properties Producing North West Shelf (72) 78 269 (269) (89) 89
Pluto (487) 528 1,210 (1,244) (219) 219
Australia Oil
Vincent (Ngujima-Yin) (24) 26 105 (105) (33) 33
NWS Oil (Okha) (5) 5 40 (40) (25) 25
Wheatstone (266) 305 514 (514) (118) 118
Development Sangomar (61) 67 122 (130) N/A N/A
1. The sensitivities represent reasonable possible changes to the discount rate, oil price and FX assumptions.2. A change of 1% represents 100 basis points.
For
per
sona
l use
onl
y
Woodside Petroleum Ltd | Half-Year Report 2020 Half-Year Financial Statements | 18
D.3 ProvisionsRestoration
of operating locations1
Employee benefits
Onerous contracts Other Total
US$m US$m US$m US$m US$m
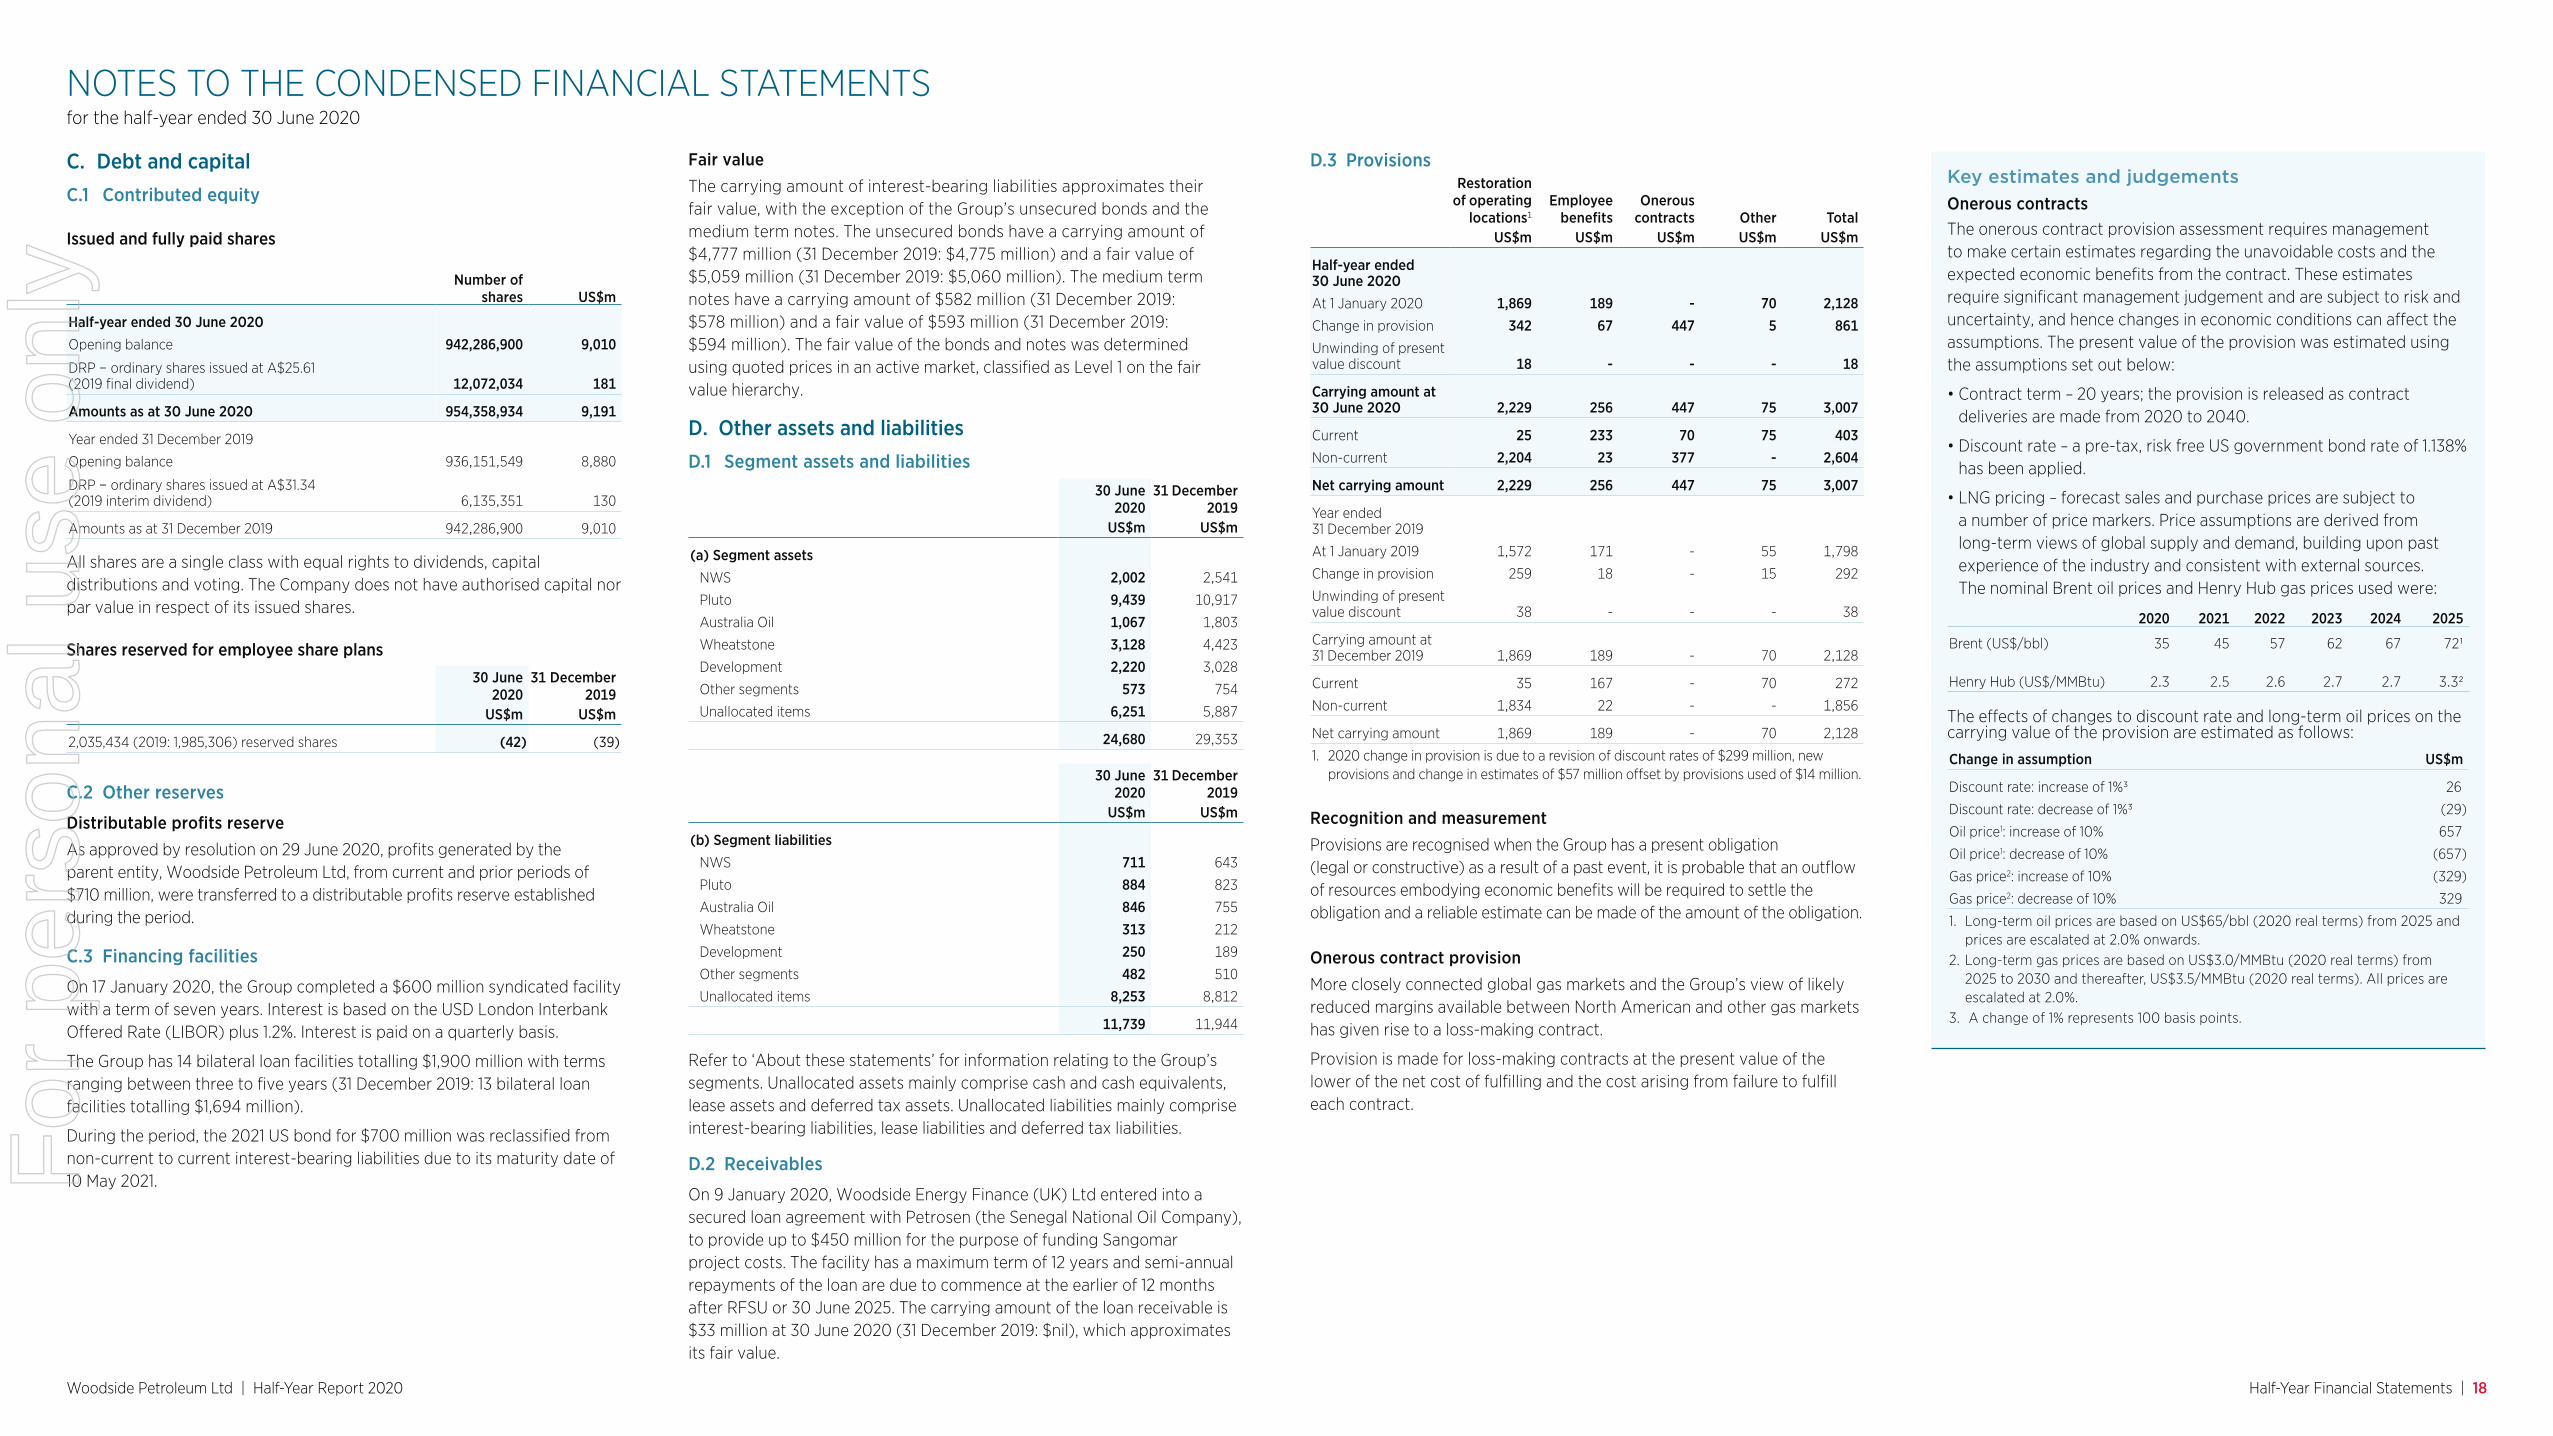
Half-year ended 30 June 2020At 1 January 2020 1,869 189 - 70 2,128 Change in provision 342 67 447 5 861 Unwinding of present value discount 18 - - - 18
Carrying amount at 30 June 2020 2,229 256 447 75 3,007
Current 25 233 70 75 403 Non-current 2,204 23 377 - 2,604
Net carrying amount 2,229 256 447 75 3,007
Year ended 31 December 2019
At 1 January 2019 1,572 171 - 55 1,798
Change in provision 259 18 - 15 292
Unwinding of present value discount 38 - - - 38
Carrying amount at 31 December 2019 1,869 189 - 70 2,128
Current 35 167 - 70 272
Non-current 1,834 22 - - 1,856
Net carrying amount 1,869 189 - 70 2,128
1. 2020 change in provision is due to a revision of discount rates of $299 million, new provisions and change in estimates of $57 million offset by provisions used of $14 million.
Recognition and measurementProvisions are recognised when the Group has a present obligation (legal or constructive) as a result of a past event, it is probable that an outflow of resources embodying economic benefits will be required to settle the obligation and a reliable estimate can be made of the amount of the obligation.
Onerous contract provisionMore closely connected global gas markets and the Group’s view of likely reduced margins available between North American and other gas markets has given rise to a loss-making contract.
Provision is made for loss-making contracts at the present value of the lower of the net cost of fulfilling and the cost arising from failure to fulfill each contract.
NOTES TO THE CONDENSED FINANCIAL STATEMENTSfor the half-year ended 30 June 2020
C. Debt and capitalC.1 Contributed equity
Issued and fully paid shares
Number of shares US$m
Half-year ended 30 June 2020Opening balance 942,286,900 9,010
DRP – ordinary shares issued at A$25.61 (2019 final dividend) 12,072,034 181
Amounts as at 30 June 2020 954,358,934 9,191
Year ended 31 December 2019
Opening balance 936,151,549 8,880
DRP – ordinary shares issued at A$31.34 (2019 interim dividend) 6,135,351 130
Amounts as at 31 December 2019 942,286,900 9,010
All shares are a single class with equal rights to dividends, capital distributions and voting. The Company does not have authorised capital nor par value in respect of its issued shares.
Shares reserved for employee share plans
30 June 2020
31 December 2019
US$m US$m
2,035,434 (2019: 1,985,306) reserved shares (42) (39)
C.2 Other reserves
Distributable profits reserveAs approved by resolution on 29 June 2020, profits generated by the parent entity, Woodside Petroleum Ltd, from current and prior periods of $710 million, were transferred to a distributable profits reserve established during the period.
C.3 Financing facilities
On 17 January 2020, the Group completed a $600 million syndicated facility with a term of seven years. Interest is based on the USD London Interbank Offered Rate (LIBOR) plus 1.2%. Interest is paid on a quarterly basis.
The Group has 14 bilateral loan facilities totalling $1,900 million with terms ranging between three to five years (31 December 2019: 13 bilateral loan facilities totalling $1,694 million).
During the period, the 2021 US bond for $700 million was reclassified from non-current to current interest-bearing liabilities due to its maturity date of 10 May 2021.
Fair valueThe carrying amount of interest-bearing liabilities approximates their fair value, with the exception of the Group’s unsecured bonds and the medium term notes. The unsecured bonds have a carrying amount of $4,777 million (31 December 2019: $4,775 million) and a fair value of $5,059 million (31 December 2019: $5,060 million). The medium term notes have a carrying amount of $582 million (31 December 2019: $578 million) and a fair value of $593 million (31 December 2019: $594 million). The fair value of the bonds and notes was determined using quoted prices in an active market, classified as Level 1 on the fair value hierarchy.
D. Other assets and liabilities D.1 Segment assets and liabilities
30 June 2020
31 December 2019
US$m US$m
(a) Segment assetsNWS 2,002 2,541
Pluto 9,439 10,917
Australia Oil 1,067 1,803
Wheatstone 3,128 4,423
Development 2,220 3,028
Other segments 573 754
Unallocated items 6,251 5,887
24,680 29,353
30 June 2020
31 December 2019
US$m US$m
(b) Segment liabilitiesNWS 711 643
Pluto 884 823
Australia Oil 846 755
Wheatstone 313 212
Development 250 189
Other segments 482 510
Unallocated items 8,253 8,812
11,739 11,944
Refer to ‘About these statements’ for information relating to the Group’s segments. Unallocated assets mainly comprise cash and cash equivalents, lease assets and deferred tax assets. Unallocated liabilities mainly comprise interest-bearing liabilities, lease liabilities and deferred tax liabilities.
D.2 Receivables
On 9 January 2020, Woodside Energy Finance (UK) Ltd entered into a secured loan agreement with Petrosen (the Senegal National Oil Company), to provide up to $450 million for the purpose of funding Sangomar project costs. The facility has a maximum term of 12 years and semi-annual repayments of the loan are due to commence at the earlier of 12 months after RFSU or 30 June 2025. The carrying amount of the loan receivable is $33 million at 30 June 2020 (31 December 2019: $nil), which approximates its fair value.
Key estimates and judgements
Onerous contractsThe onerous contract provision assessment requires management to make certain estimates regarding the unavoidable costs and the expected economic benefits from the contract. These estimates require significant management judgement and are subject to risk and uncertainty, and hence changes in economic conditions can affect the assumptions. The present value of the provision was estimated using the assumptions set out below:
• Contract term – 20 years; the provision is released as contract deliveries are made from 2020 to 2040.
• Discount rate – a pre-tax, risk free US government bond rate of 1.138% has been applied.
• LNG pricing – forecast sales and purchase prices are subject to a number of price markers. Price assumptions are derived from long-term views of global supply and demand, building upon past experience of the industry and consistent with external sources. The nominal Brent oil prices and Henry Hub gas prices used were:
2020 2021 2022 2023 2024 2025
Brent (US$/bbl) 35 45 57 62 67 721
Henry Hub (US$/MMBtu) 2.3 2.5 2.6 2.7 2.7 3.32
The effects of changes to discount rate and long-term oil prices on the carrying value of the provision are estimated as follows:
Change in assumption US$m
Discount rate: increase of 1%3 26
Discount rate: decrease of 1%3 (29)
Oil price1: increase of 10% 657
Oil price1: decrease of 10% (657)
Gas price2: increase of 10% (329)
Gas price2: decrease of 10% 329
1. Long-term oil prices are based on US$65/bbl (2020 real terms) from 2025 and prices are escalated at 2.0% onwards.
2. Long-term gas prices are based on US$3.0/MMBtu (2020 real terms) from 2025 to 2030 and thereafter, US$3.5/MMBtu (2020 real terms). All prices are escalated at 2.0%.
3. A change of 1% represents 100 basis points.
For
per
sona
l use
onl
y
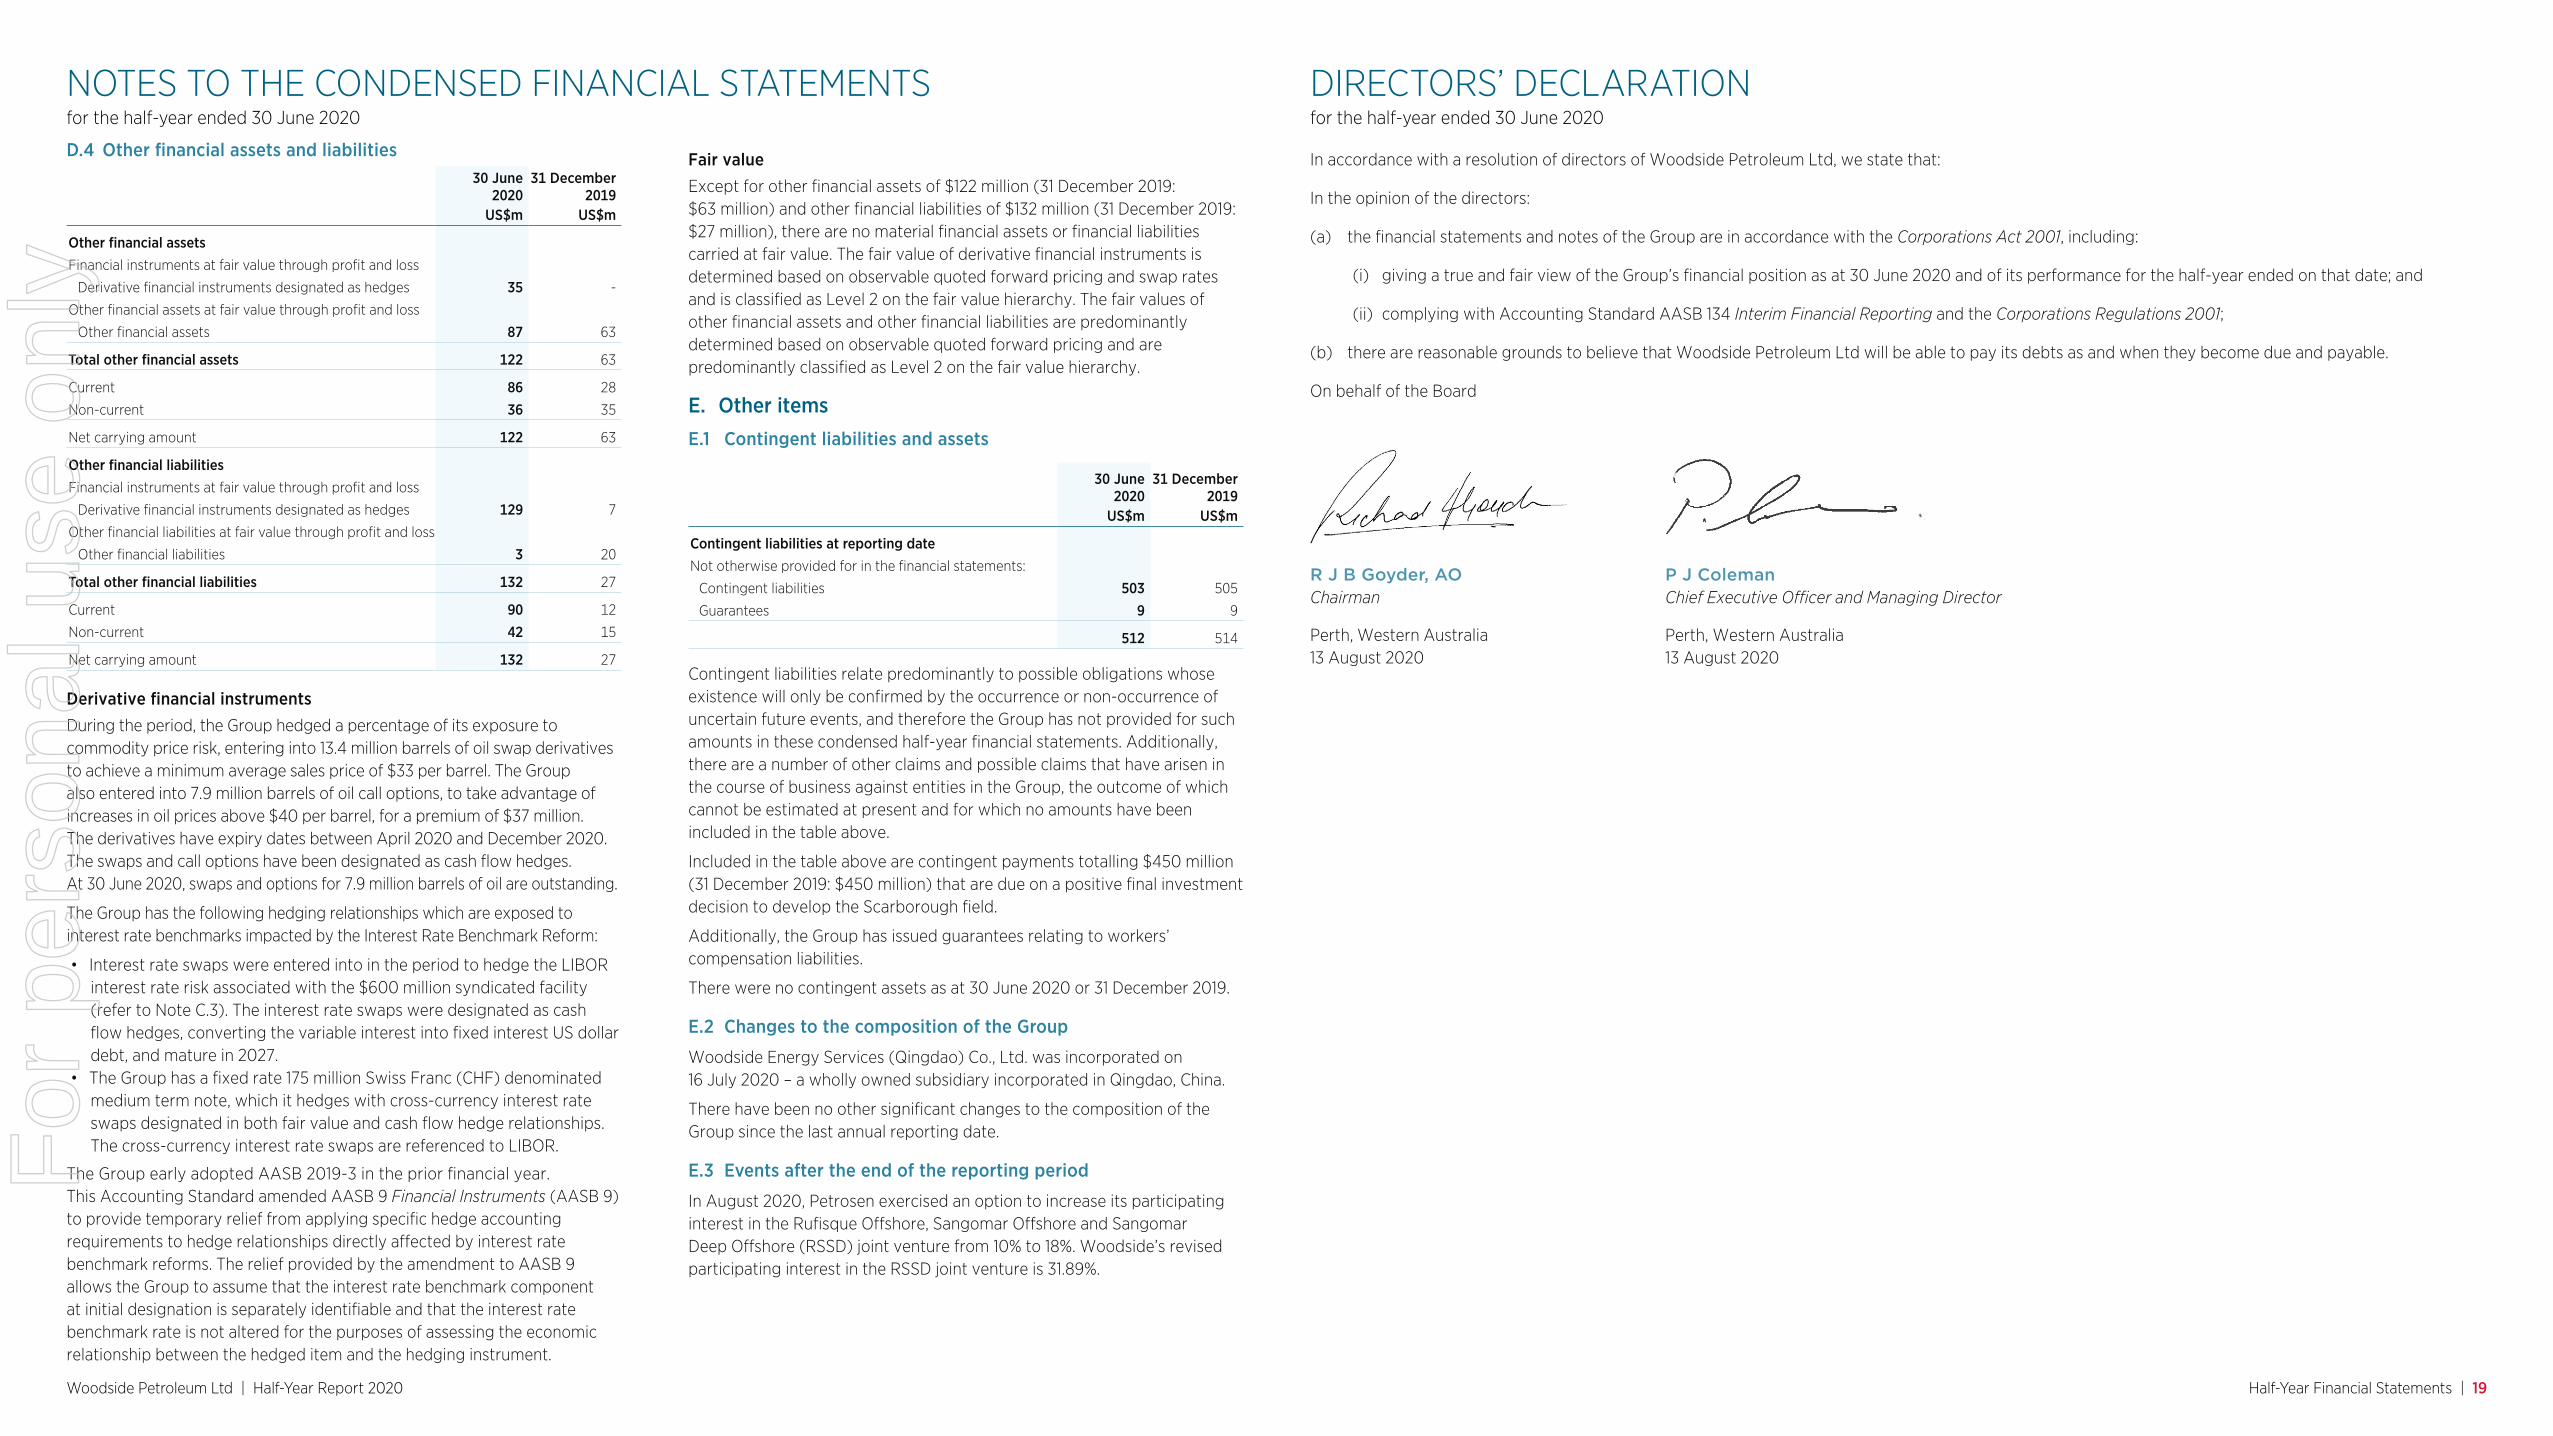
Woodside Petroleum Ltd | Half-Year Report 2020 Half-Year Financial Statements | 19
DIRECTORS’ DECLARATIONNOTES TO THE CONDENSED FINANCIAL STATEMENTSfor the half-year ended 30 June 2020for the half-year ended 30 June 2020
In accordance with a resolution of directors of Woodside Petroleum Ltd, we state that:
In the opinion of the directors:
(a) the financial statements and notes of the Group are in accordance with the Corporations Act 2001, including:
(i) giving a true and fair view of the Group’s financial position as at 30 June 2020 and of its performance for the half-year ended on that date; and
(ii) complying with Accounting Standard AASB 134 Interim Financial Reporting and the Corporations Regulations 2001;
(b) there are reasonable grounds to believe that Woodside Petroleum Ltd will be able to pay its debts as and when they become due and payable.
On behalf of the Board
R J B Goyder, AOChairman
Perth, Western Australia 13 August 2020
P J ColemanChief Executive Officer and Managing Director
Perth, Western Australia 13 August 2020
Fair valueExcept for other financial assets of $122 million (31 December 2019: $63 million) and other financial liabilities of $132 million (31 December 2019: $27 million), there are no material financial assets or financial liabilities carried at fair value. The fair value of derivative financial instruments is determined based on observable quoted forward pricing and swap rates and is classified as Level 2 on the fair value hierarchy. The fair values of other financial assets and other financial liabilities are predominantly determined based on observable quoted forward pricing and are predominantly classified as Level 2 on the fair value hierarchy.
E. Other itemsE.1 Contingent liabilities and assets
30 June 2020
31 December 2019
US$m US$m
Contingent liabilities at reporting dateNot otherwise provided for in the financial statements:
Contingent liabilities 503 505
Guarantees 9 9
512 514
Contingent liabilities relate predominantly to possible obligations whose existence will only be confirmed by the occurrence or non-occurrence of uncertain future events, and therefore the Group has not provided for such amounts in these condensed half-year financial statements. Additionally, there are a number of other claims and possible claims that have arisen in the course of business against entities in the Group, the outcome of which cannot be estimated at present and for which no amounts have been included in the table above.
Included in the table above are contingent payments totalling $450 million (31 December 2019: $450 million) that are due on a positive final investment decision to develop the Scarborough field.
Additionally, the Group has issued guarantees relating to workers’ compensation liabilities.
There were no contingent assets as at 30 June 2020 or 31 December 2019.
E.2 Changes to the composition of the Group
Woodside Energy Services (Qingdao) Co., Ltd. was incorporated on 16 July 2020 – a wholly owned subsidiary incorporated in Qingdao, China.
There have been no other significant changes to the composition of the Group since the last annual reporting date.
E.3 Events after the end of the reporting period
In August 2020, Petrosen exercised an option to increase its participating interest in the Rufisque Offshore, Sangomar Offshore and Sangomar Deep Offshore (RSSD) joint venture from 10% to 18%. Woodside’s revised participating interest in the RSSD joint venture is 31.89%.
D.4 Other financial assets and liabilities30 June
202031 December
2019US$m US$m
Other financial assets Financial instruments at fair value through profit and loss
Derivative financial instruments designated as hedges 35 -
Other financial assets at fair value through profit and loss
Other financial assets 87 63
Total other financial assets 122 63
Current 86 28
Non-current 36 35
Net carrying amount 122 63
Other financial liabilities Financial instruments at fair value through profit and loss
Derivative financial instruments designated as hedges 129 7
Other financial liabilities at fair value through profit and loss
Other financial liabilities 3 20
Total other financial liabilities 132 27
Current 90 12
Non-current 42 15
Net carrying amount 132 27
Derivative financial instrumentsDuring the period, the Group hedged a percentage of its exposure to commodity price risk, entering into 13.4 million barrels of oil swap derivatives to achieve a minimum average sales price of $33 per barrel. The Group also entered into 7.9 million barrels of oil call options, to take advantage of increases in oil prices above $40 per barrel, for a premium of $37 million. The derivatives have expiry dates between April 2020 and December 2020. The swaps and call options have been designated as cash flow hedges. At 30 June 2020, swaps and options for 7.9 million barrels of oil are outstanding.
The Group has the following hedging relationships which are exposed to interest rate benchmarks impacted by the Interest Rate Benchmark Reform:
• Interest rate swaps were entered into in the period to hedge the LIBOR interest rate risk associated with the $600 million syndicated facility (refer to Note C.3). The interest rate swaps were designated as cash flow hedges, converting the variable interest into fixed interest US dollar debt, and mature in 2027.
• The Group has a fixed rate 175 million Swiss Franc (CHF) denominated medium term note, which it hedges with cross-currency interest rate swaps designated in both fair value and cash flow hedge relationships. The cross-currency interest rate swaps are referenced to LIBOR.
The Group early adopted AASB 2019-3 in the prior financial year. This Accounting Standard amended AASB 9 Financial Instruments (AASB 9) to provide temporary relief from applying specific hedge accounting requirements to hedge relationships directly affected by interest rate benchmark reforms. The relief provided by the amendment to AASB 9 allows the Group to assume that the interest rate benchmark component at initial designation is separately identifiable and that the interest rate benchmark rate is not altered for the purposes of assessing the economic relationship between the hedged item and the hedging instrument.
For
per
sona
l use
onl
y
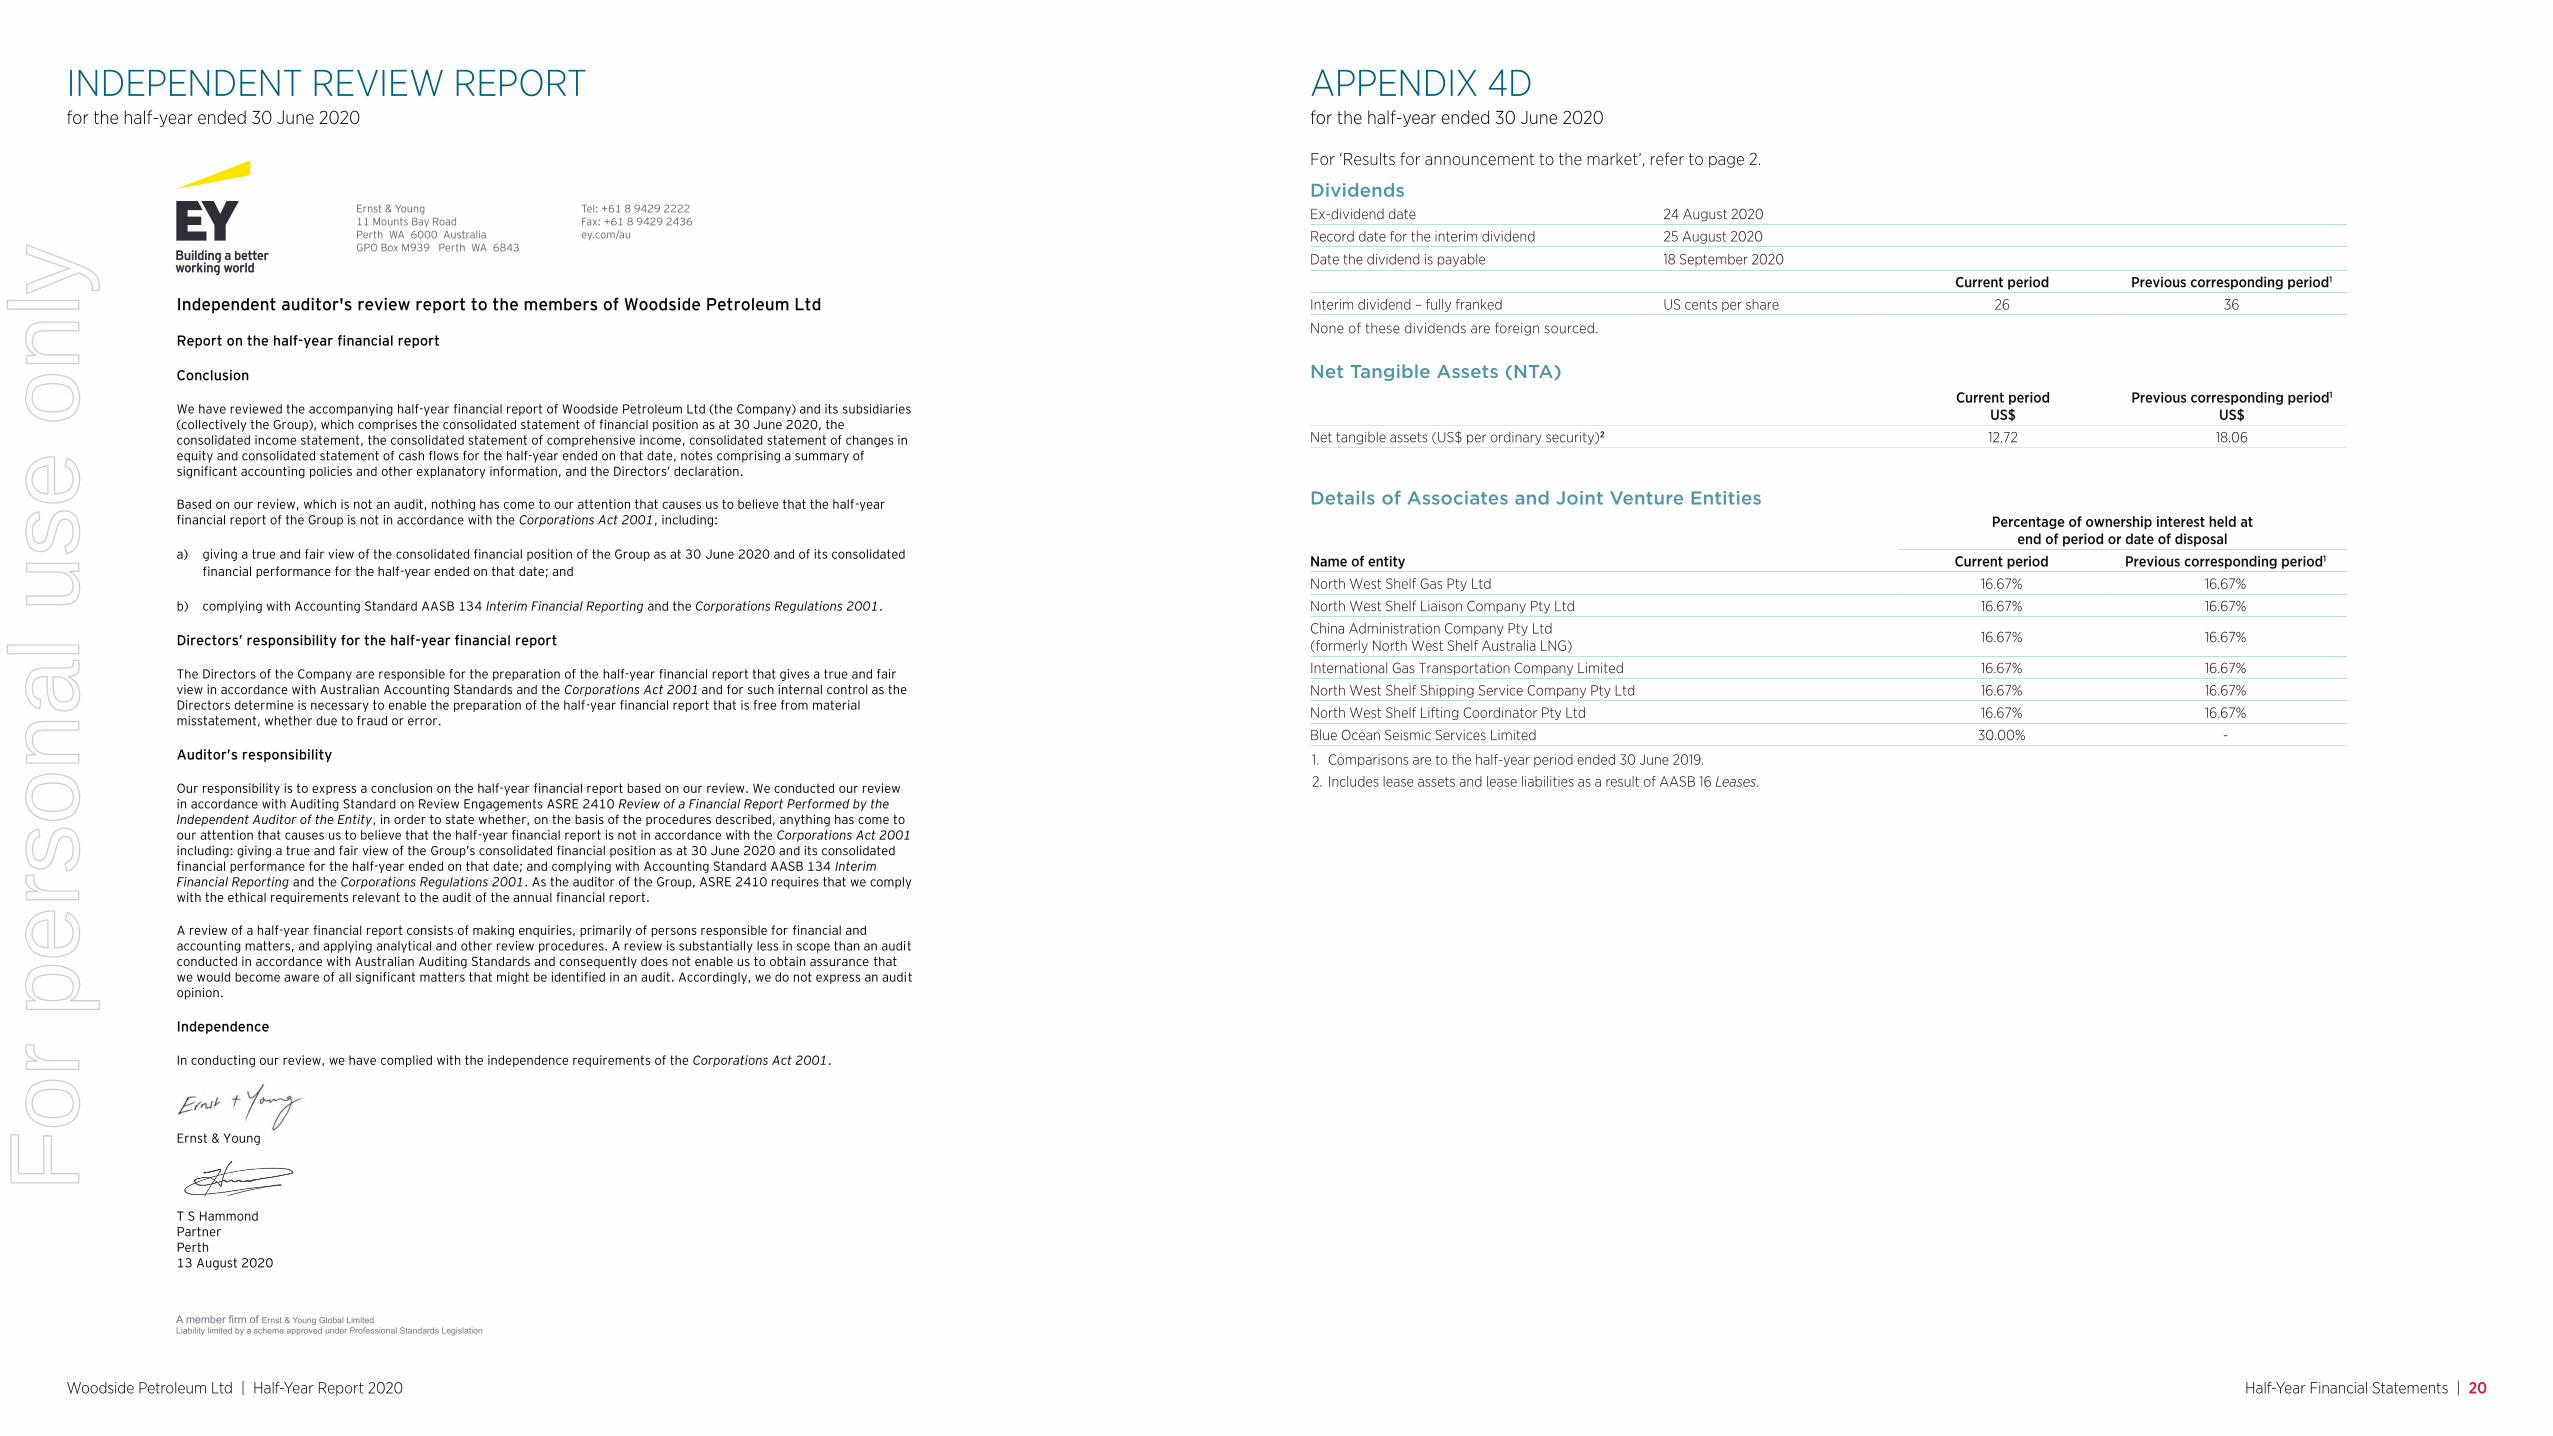
Woodside Petroleum Ltd | Half-Year Report 2020 Half-Year Financial Statements | 20
APPENDIX 4DINDEPENDENT REVIEW REPORTfor the half-year ended 30 June 2020for the half-year ended 30 June 2020
A member firm of Ernst & Young Global LimitedLiability limited by a scheme approved under Professional Standards Legislation
Ernst & Young 11 Mounts Bay Road Perth WA 6000 Australia GPO Box M939 Perth WA 6843
Tel: +61 8 9429 2222 Fax: +61 8 9429 2436 ey.com/au
Independent auditor's review report to the members of Woodside Petroleum Ltd
Report on the half-year financial report
Conclusion
We have reviewed the accompanying half-year financial report of Woodside Petroleum Ltd (the Company) and its subsidiaries (collectively the Group), which comprises the consolidated statement of financial position as at 30 June 2020, the consolidated income statement, the consolidated statement of comprehensive income, consolidated statement of changes in equity and consolidated statement of cash flows for the half-year ended on that date, notes comprising a summary of significant accounting policies and other explanatory information, and the Directors’ declaration.
Based on our review, which is not an audit, nothing has come to our attention that causes us to believe that the half-year financial report of the Group is not in accordance with the Corporations Act 2001, including:
a) giving a true and fair view of the consolidated financial position of the Group as at 30 June 2020 and of its consolidated financial performance for the half-year ended on that date; and
b) complying with Accounting Standard AASB 134 Interim Financial Reporting and the Corporations Regulations 2001.
Directors’ responsibility for the half-year financial report
The Directors of the Company are responsible for the preparation of the half-year financial report that gives a true and fair view in accordance with Australian Accounting Standards and the Corporations Act 2001 and for such internal control as the Directors determine is necessary to enable the preparation of the half-year financial report that is free from material misstatement, whether due to fraud or error.
Auditor’s responsibility
Our responsibility is to express a conclusion on the half-year financial report based on our review. We conducted our reviewin accordance with Auditing Standard on Review Engagements ASRE 2410 Review of a Financial Report Performed by the Independent Auditor of the Entity, in order to state whether, on the basis of the procedures described, anything has come to our attention that causes us to believe that the half-year financial report is not in accordance with the Corporations Act 2001 including: giving a true and fair view of the Group’s consolidated financial position as at 30 June 2020 and its consolidated financial performance for the half-year ended on that date; and complying with Accounting Standard AASB 134 Interim Financial Reporting and the Corporations Regulations 2001. As the auditor of the Group, ASRE 2410 requires that we comply with the ethical requirements relevant to the audit of the annual financial report.
A review of a half-year financial report consists of making enquiries, primarily of persons responsible for financial and accounting matters, and applying analytical and other review procedures. A review is substantially less in scope than an audit conducted in accordance with Australian Auditing Standards and consequently does not enable us to obtain assurance thatwe would become aware of all significant matters that might be identified in an audit. Accordingly, we do not express an audit opinion.
Independence
In conducting our review, we have complied with the independence requirements of the Corporations Act 2001. Ernst & Young T S Hammond Partner Perth 13 August 2020
For ‘Results for announcement to the market’, refer to page 2.
Dividends Ex-dividend date 24 August 2020
Record date for the interim dividend 25 August 2020
Date the dividend is payable 18 September 2020
Current period Previous corresponding period1
Interim dividend – fully franked US cents per share 26 36
None of these dividends are foreign sourced.
Net Tangible Assets (NTA)Current period
US$ Previous corresponding period1
US$ Net tangible assets (US$ per ordinary security)2 12.72 18.06
Details of Associates and Joint Venture Entities
Name of entity
Percentage of ownership interest held at end of period or date of disposal
Current period Previous corresponding period1 North West Shelf Gas Pty Ltd 16.67% 16.67%
North West Shelf Liaison Company Pty Ltd 16.67% 16.67%
China Administration Company Pty Ltd (formerly North West Shelf Australia LNG)
16.67% 16.67%
International Gas Transportation Company Limited 16.67% 16.67%
North West Shelf Shipping Service Company Pty Ltd 16.67% 16.67%
North West Shelf Lifting Coordinator Pty Ltd 16.67% 16.67%
Blue Ocean Seismic Services Limited 30.00% -
1. Comparisons are to the half-year period ended 30 June 2019.
2. Includes lease assets and lease liabilities as a result of AASB 16 Leases.
For
per
sona
l use
onl
y
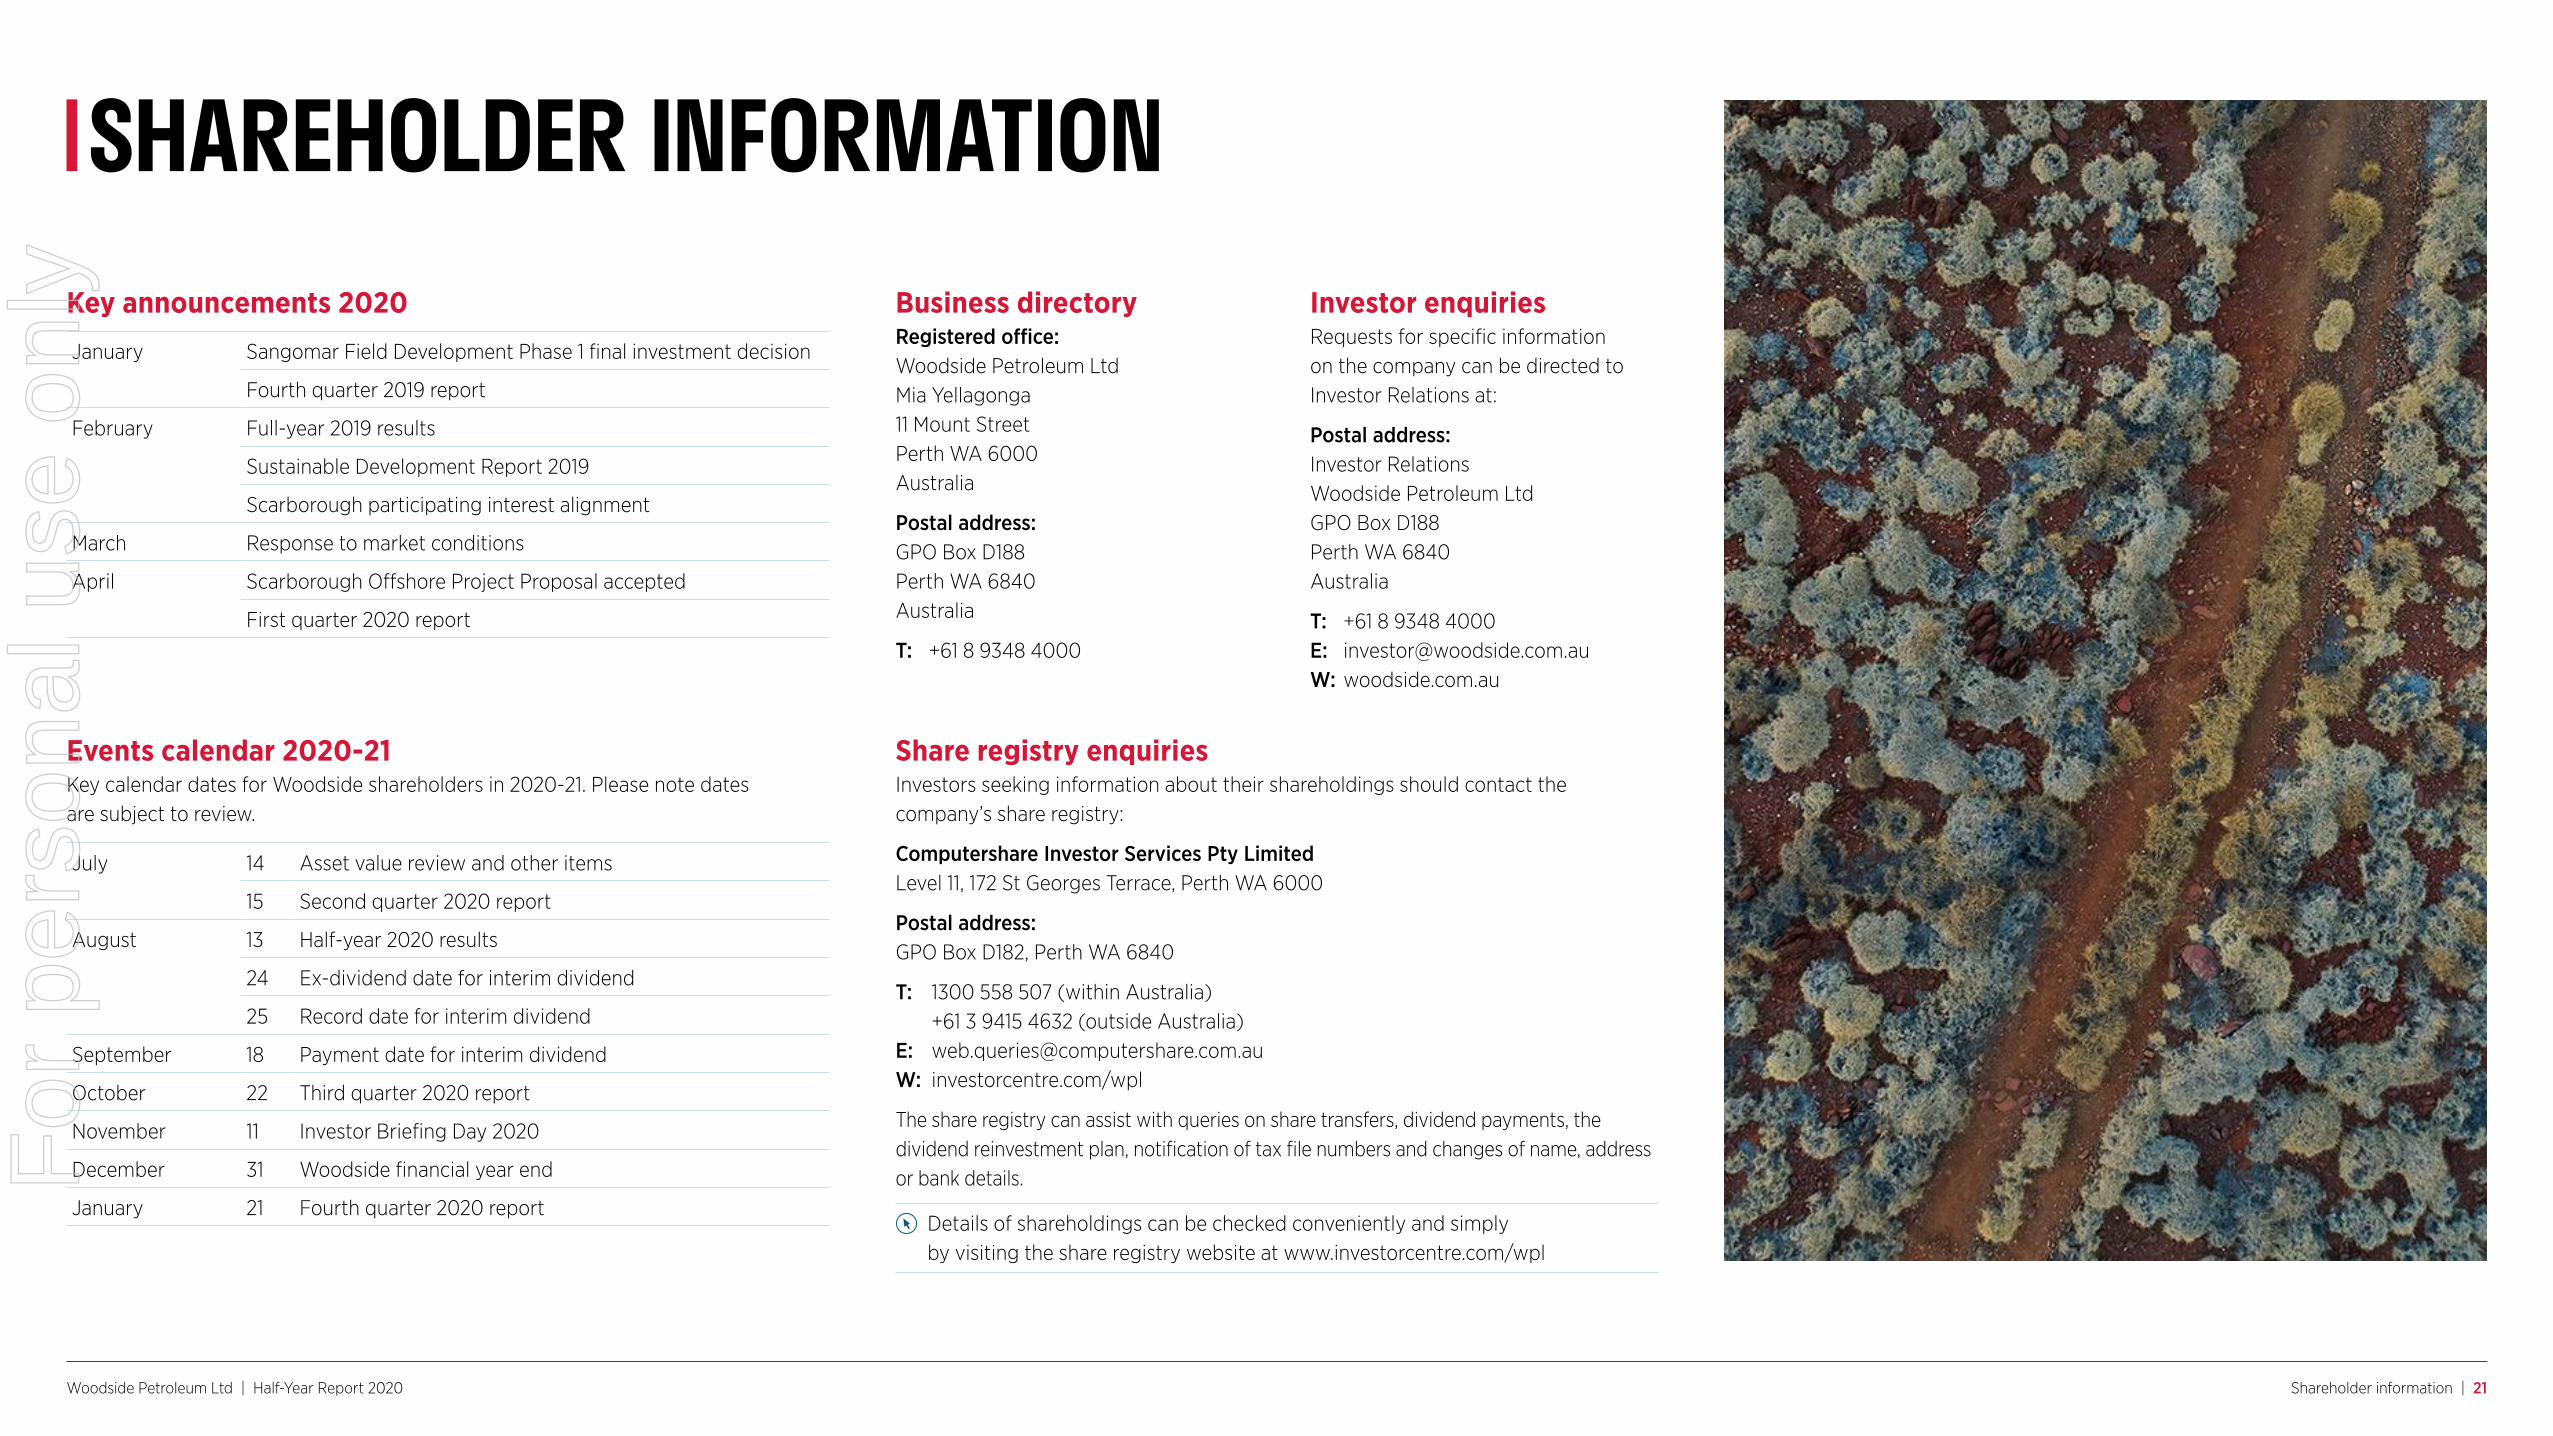
Woodside Petroleum Ltd | Half-Year Report 2020 Shareholder information | 21
Share registry enquiriesInvestors seeking information about their shareholdings should contact the company’s share registry:
Computershare Investor Services Pty Limited Level 11, 172 St Georges Terrace, Perth WA 6000
Postal address: GPO Box D182, Perth WA 6840
T: 1300 558 507 (within Australia) +61 3 9415 4632 (outside Australia)
E: [email protected]: investorcentre.com/wpl
The share registry can assist with queries on share transfers, dividend payments, the dividend reinvestment plan, notification of tax file numbers and changes of name, address or bank details.
Details of shareholdings can be checked conveniently and simply by visiting the share registry website at www.investorcentre.com/wpl
SHAREHOLDER INFORMATION
January Sangomar Field Development Phase 1 final investment decision
Fourth quarter 2019 report
February Full-year 2019 results
Sustainable Development Report 2019
Scarborough participating interest alignment
March Response to market conditions
April Scarborough Offshore Project Proposal accepted
First quarter 2020 report
July 14 Asset value review and other items
15 Second quarter 2020 report
August 13 Half-year 2020 results
24 Ex-dividend date for interim dividend
25 Record date for interim dividend
September 18 Payment date for interim dividend
October 22 Third quarter 2020 report
November 11 Investor Briefing Day 2020
December 31 Woodside financial year end
January 21 Fourth quarter 2020 report
Key announcements 2020
Events calendar 2020-21Key calendar dates for Woodside shareholders in 2020-21. Please note dates are subject to review.
Business directoryRegistered office: Woodside Petroleum Ltd Mia Yellagonga 11 Mount Street Perth WA 6000 Australia
Postal address: GPO Box D188 Perth WA 6840 Australia
T: +61 8 9348 4000
Investor enquiriesRequests for specific information on the company can be directed to Investor Relations at:
Postal address: Investor Relations Woodside Petroleum Ltd GPO Box D188 Perth WA 6840 Australia
T: +61 8 9348 4000 E: [email protected] W: woodside.com.au
For
per
sona
l use
onl
y
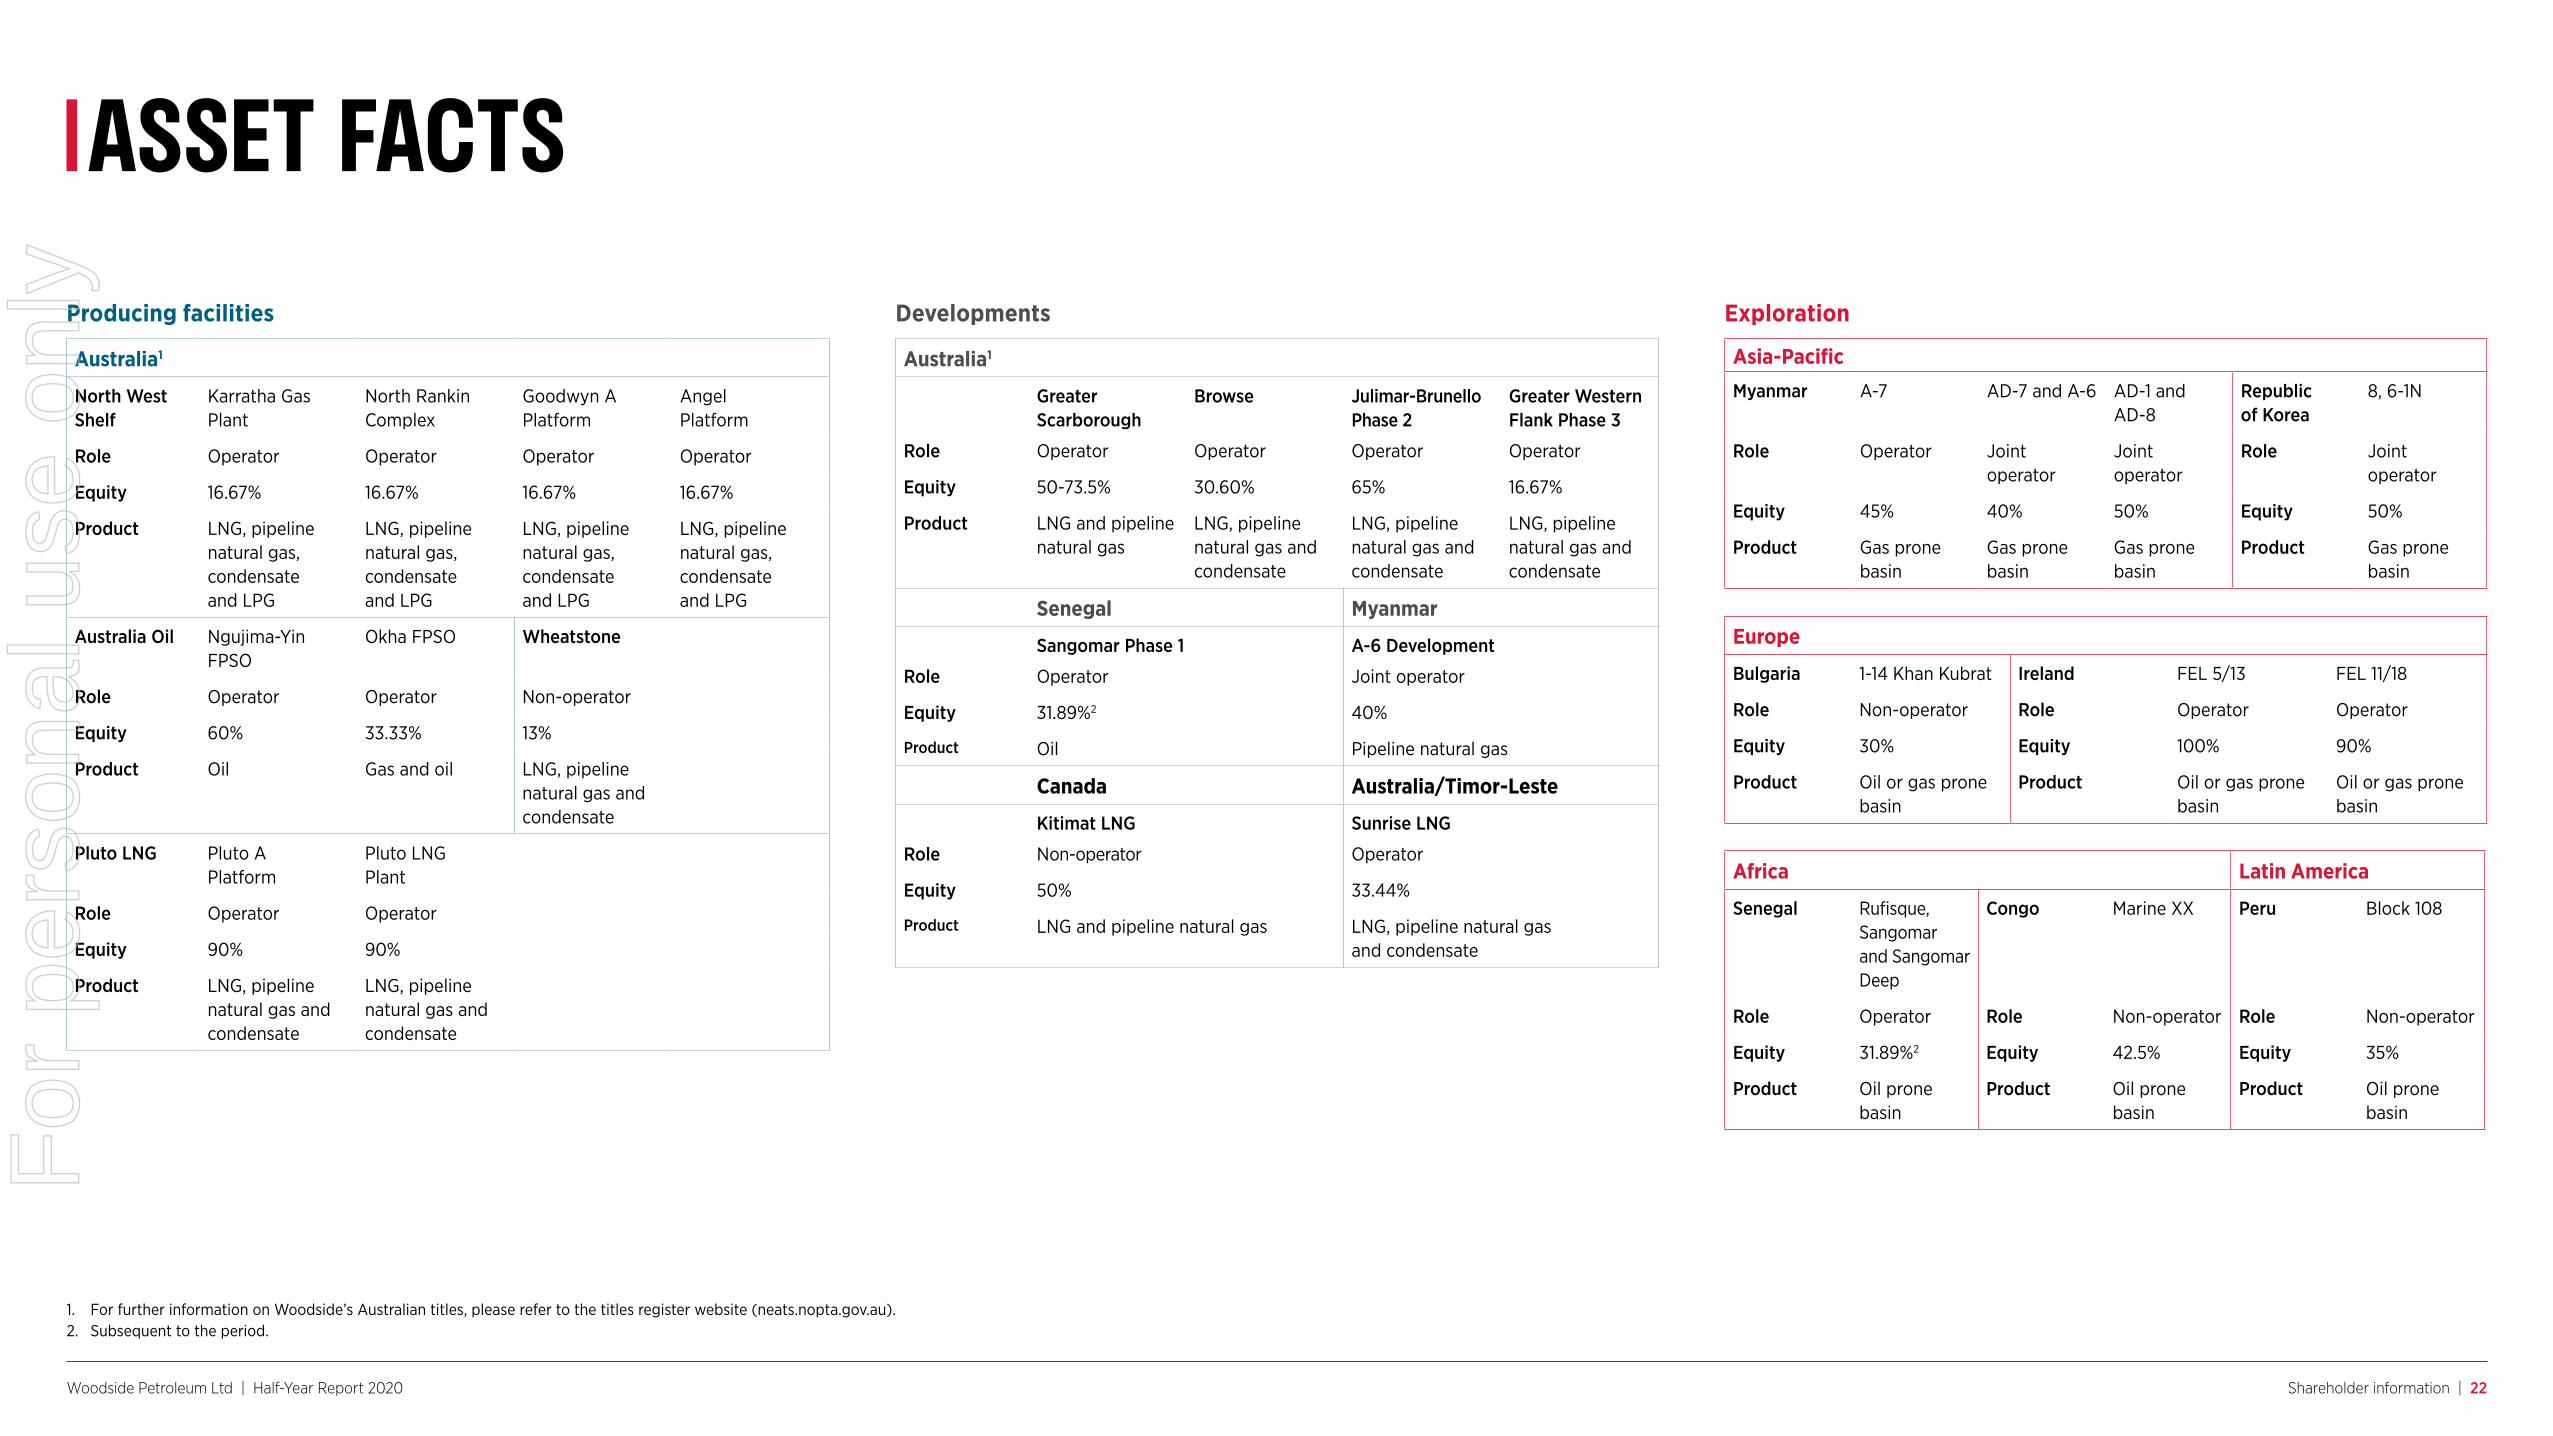
Woodside Petroleum Ltd | Half-Year Report 2020 Shareholder information | 22
ASSET FACTS
Australia1
North West Shelf
Karratha Gas Plant
North Rankin Complex
Goodwyn A Platform
Angel Platform
Role Operator Operator Operator Operator
Equity 16.67% 16.67% 16.67% 16.67%
Product LNG, pipeline natural gas, condensate and LPG
LNG, pipeline natural gas, condensate and LPG
LNG, pipeline natural gas, condensate and LPG
LNG, pipeline natural gas, condensate and LPG
Australia Oil Ngujima-Yin FPSO
Okha FPSO Wheatstone
Role Operator Operator Non-operator
Equity 60% 33.33% 13%
Product Oil Gas and oil LNG, pipeline natural gas and condensate
Pluto LNG Pluto A Platform
Pluto LNG Plant
Role Operator Operator
Equity 90% 90%
Product LNG, pipeline natural gas and condensate
LNG, pipeline natural gas and condensate
Producing facilities
Australia1
Greater Scarborough
Browse Julimar-Brunello Phase 2
Greater Western Flank Phase 3
Role Operator Operator Operator Operator
Equity 50-73.5% 30.60% 65% 16.67%
Product LNG and pipeline natural gas
LNG, pipeline natural gas and condensate
LNG, pipeline natural gas and condensate
LNG, pipeline natural gas and condensate
Senegal Myanmar
Sangomar Phase 1 A-6 Development
Role Operator Joint operator
Equity 31.89%2 40%
Product Oil Pipeline natural gas
Canada Australia/Timor-Leste
Kitimat LNG Sunrise LNG
Role Non-operator Operator
Equity 50% 33.44%
Product LNG and pipeline natural gas LNG, pipeline natural gas and condensate
Developments Exploration
Asia-PacificMyanmar A-7 AD-7 and A-6 AD-1 and
AD-8Republic of Korea
8, 6-1N
Role Operator Joint operator
Joint operator
Role Joint operator
Equity 45% 40% 50% Equity 50%
Product Gas prone basin
Gas prone basin
Gas prone basin
Product Gas prone basin
Europe
Bulgaria 1-14 Khan Kubrat Ireland FEL 5/13 FEL 11/18
Role Non-operator Role Operator Operator
Equity 30% Equity 100% 90%
Product Oil or gas prone basin
Product Oil or gas prone basin
Oil or gas prone basin
Africa Latin America
Senegal Rufisque, Sangomar and Sangomar Deep
Congo Marine XX Peru Block 108
Role Operator Role Non-operator Role Non-operator
Equity 31.89%2 Equity 42.5% Equity 35%
Product Oil prone basin
Product Oil prone basin
Product Oil prone basin
1. For further information on Woodside’s Australian titles, please refer to the titles register website (neats.nopta.gov.au).2. Subsequent to the period.
For
per
sona
l use
onl
y
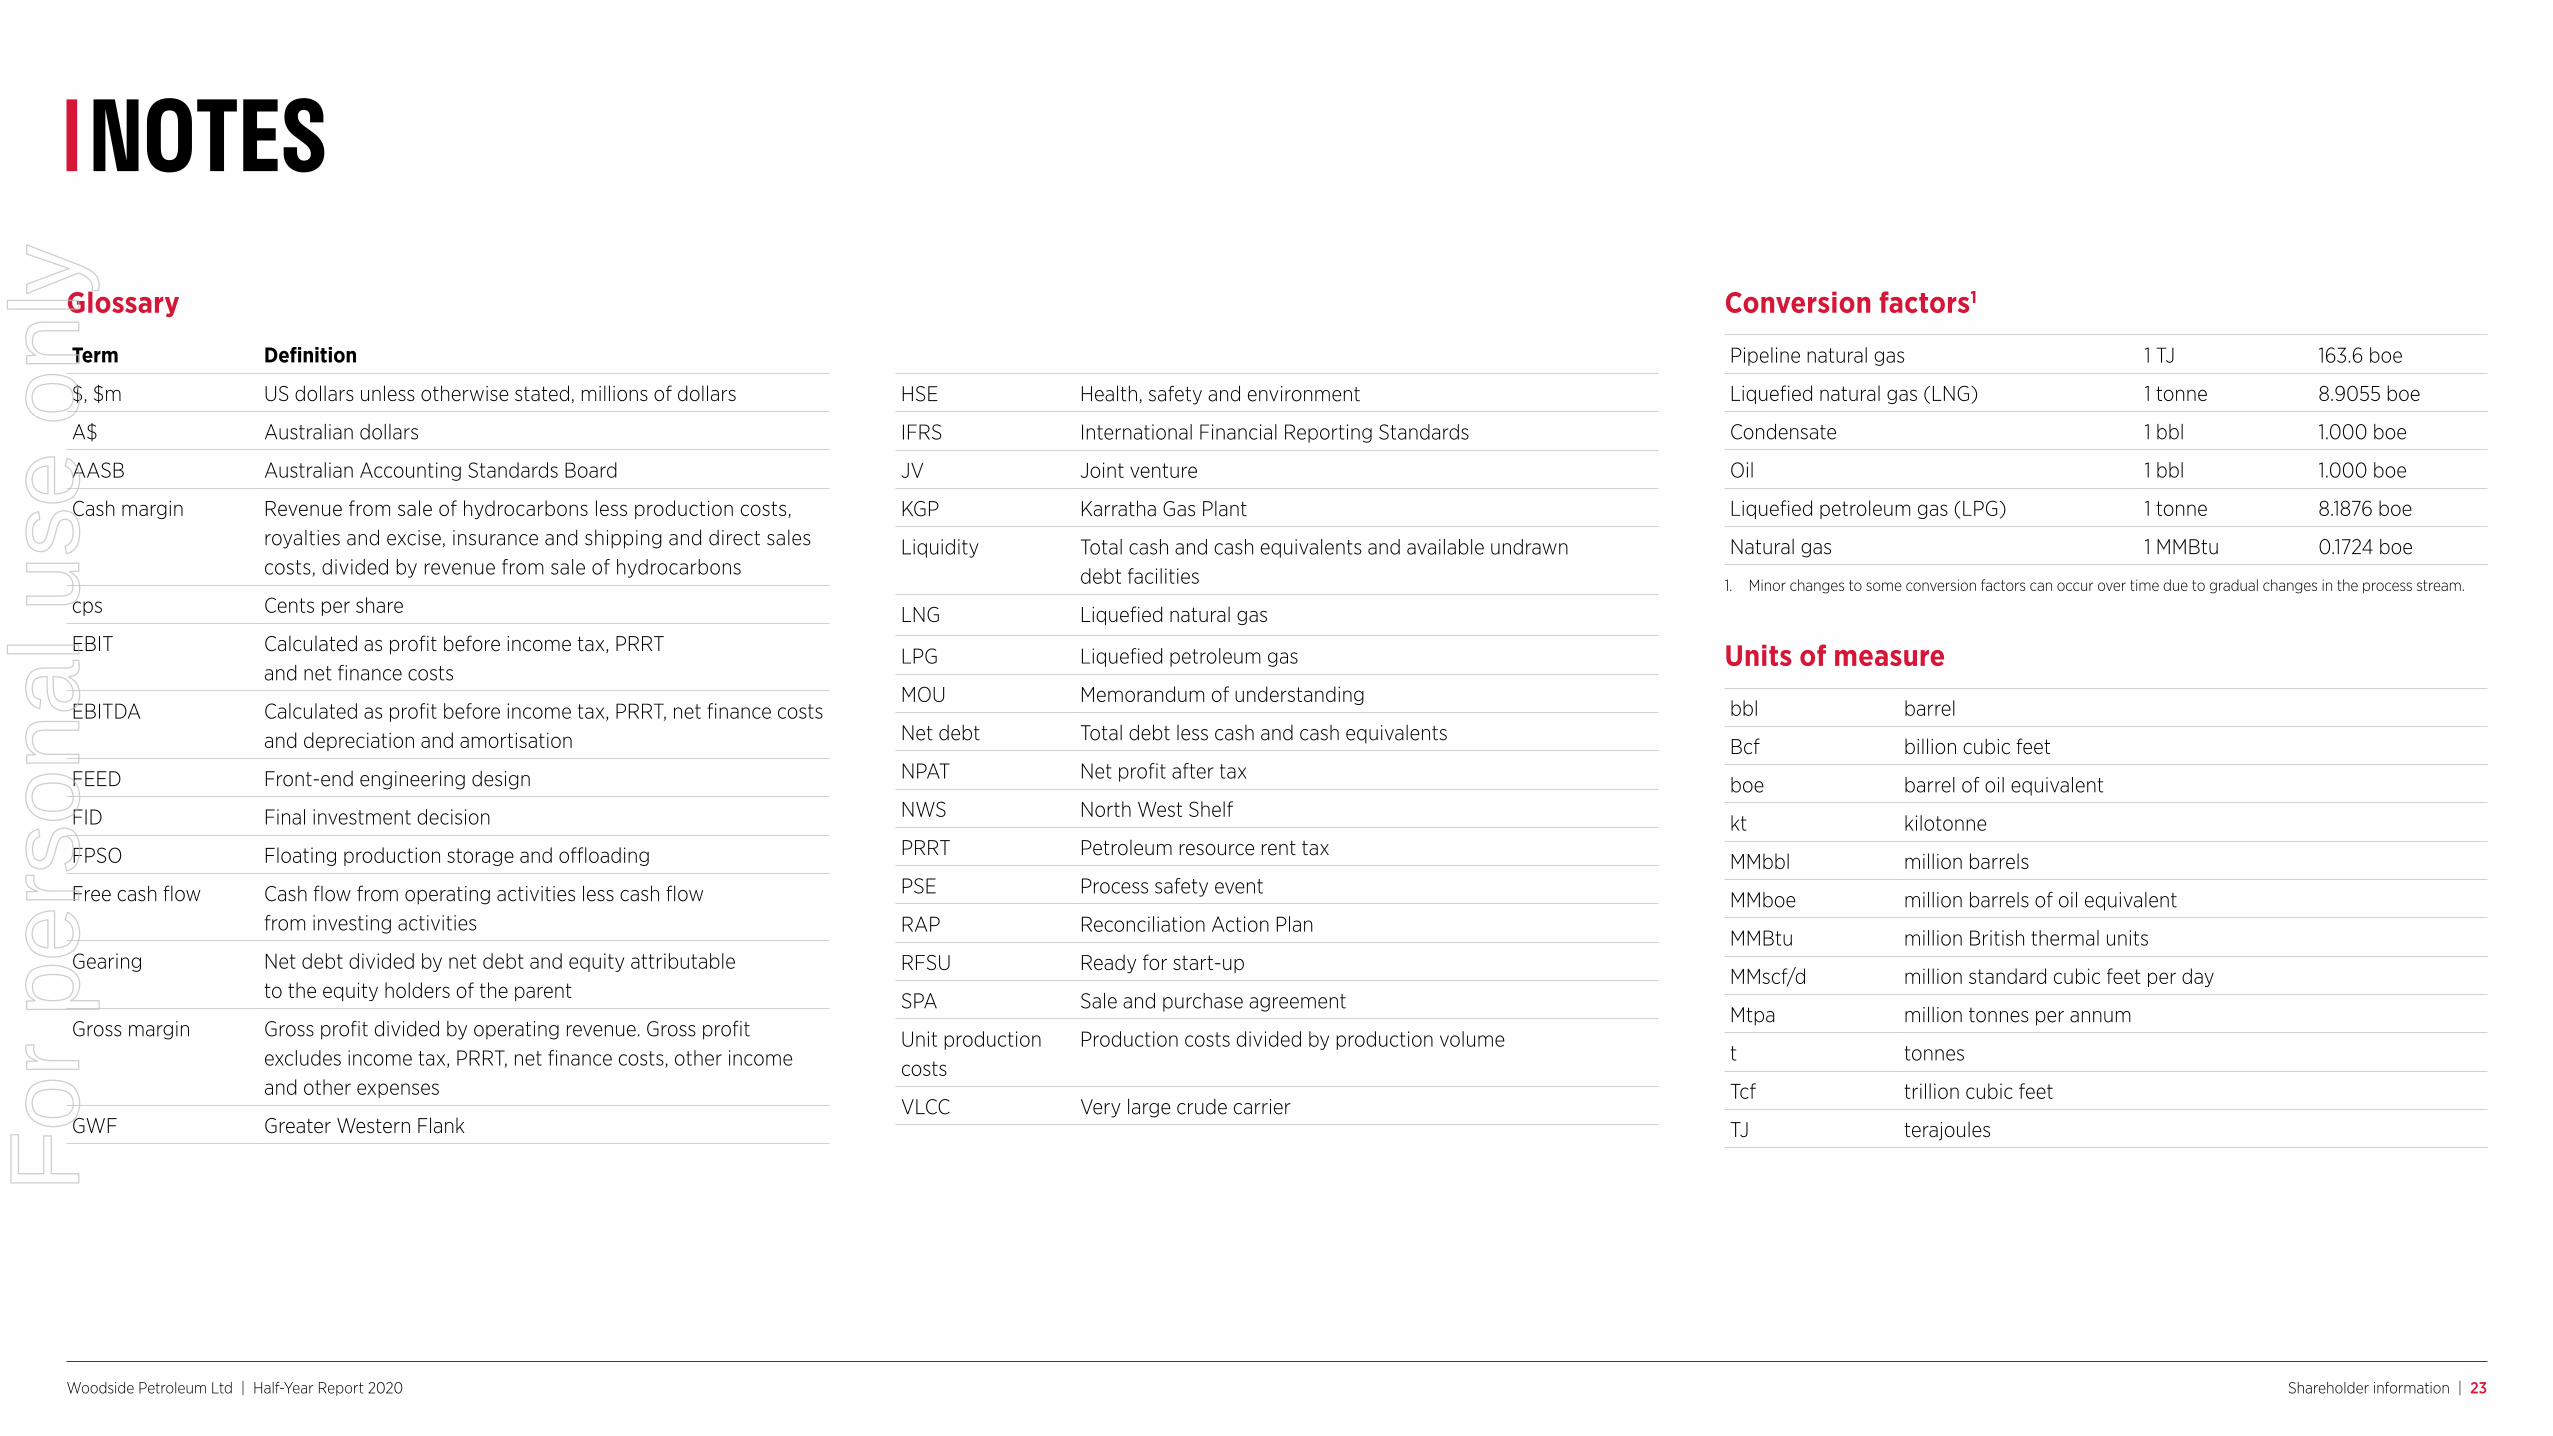
Woodside Petroleum Ltd | Half-Year Report 2020 Shareholder information | 23
NOTES
Term Definition
$, $m US dollars unless otherwise stated, millions of dollars
A$ Australian dollars
AASB Australian Accounting Standards Board
Cash margin Revenue from sale of hydrocarbons less production costs, royalties and excise, insurance and shipping and direct sales costs, divided by revenue from sale of hydrocarbons
cps Cents per share
EBIT Calculated as profit before income tax, PRRT and net finance costs
EBITDA Calculated as profit before income tax, PRRT, net finance costs and depreciation and amortisation
FEED Front-end engineering design
FID Final investment decision
FPSO Floating production storage and offloading
Free cash flow Cash flow from operating activities less cash flow from investing activities
Gearing Net debt divided by net debt and equity attributable to the equity holders of the parent
Gross margin Gross profit divided by operating revenue. Gross profit excludes income tax, PRRT, net finance costs, other income and other expenses
GWF Greater Western Flank
bbl barrel
Bcf billion cubic feet
boe barrel of oil equivalent
kt kilotonne
MMbbl million barrels
MMboe million barrels of oil equivalent
MMBtu million British thermal units
MMscf/d million standard cubic feet per day
Mtpa million tonnes per annum
t tonnes
Tcf trillion cubic feet
TJ terajoules
Pipeline natural gas 1 TJ 163.6 boe
Liquefied natural gas (LNG) 1 tonne 8.9055 boe
Condensate 1 bbl 1.000 boe
Oil 1 bbl 1.000 boe
Liquefied petroleum gas (LPG) 1 tonne 8.1876 boe
Natural gas 1 MMBtu 0.1724 boe
HSE Health, safety and environment
IFRS International Financial Reporting Standards
JV Joint venture
KGP Karratha Gas Plant
Liquidity Total cash and cash equivalents and available undrawn debt facilities
LNG Liquefied natural gas
LPG Liquefied petroleum gas
MOU Memorandum of understanding
Net debt Total debt less cash and cash equivalents
NPAT Net profit after tax
NWS North West Shelf
PRRT Petroleum resource rent tax
PSE Process safety event
RAP Reconciliation Action Plan
RFSU Ready for start-up
SPA Sale and purchase agreement
Unit production costs
Production costs divided by production volume
VLCC Very large crude carrier
Glossary
Units of measure
Conversion factors1
1. Minor changes to some conversion factors can occur over time due to gradual changes in the process stream.
For
per
sona
l use
onl
y
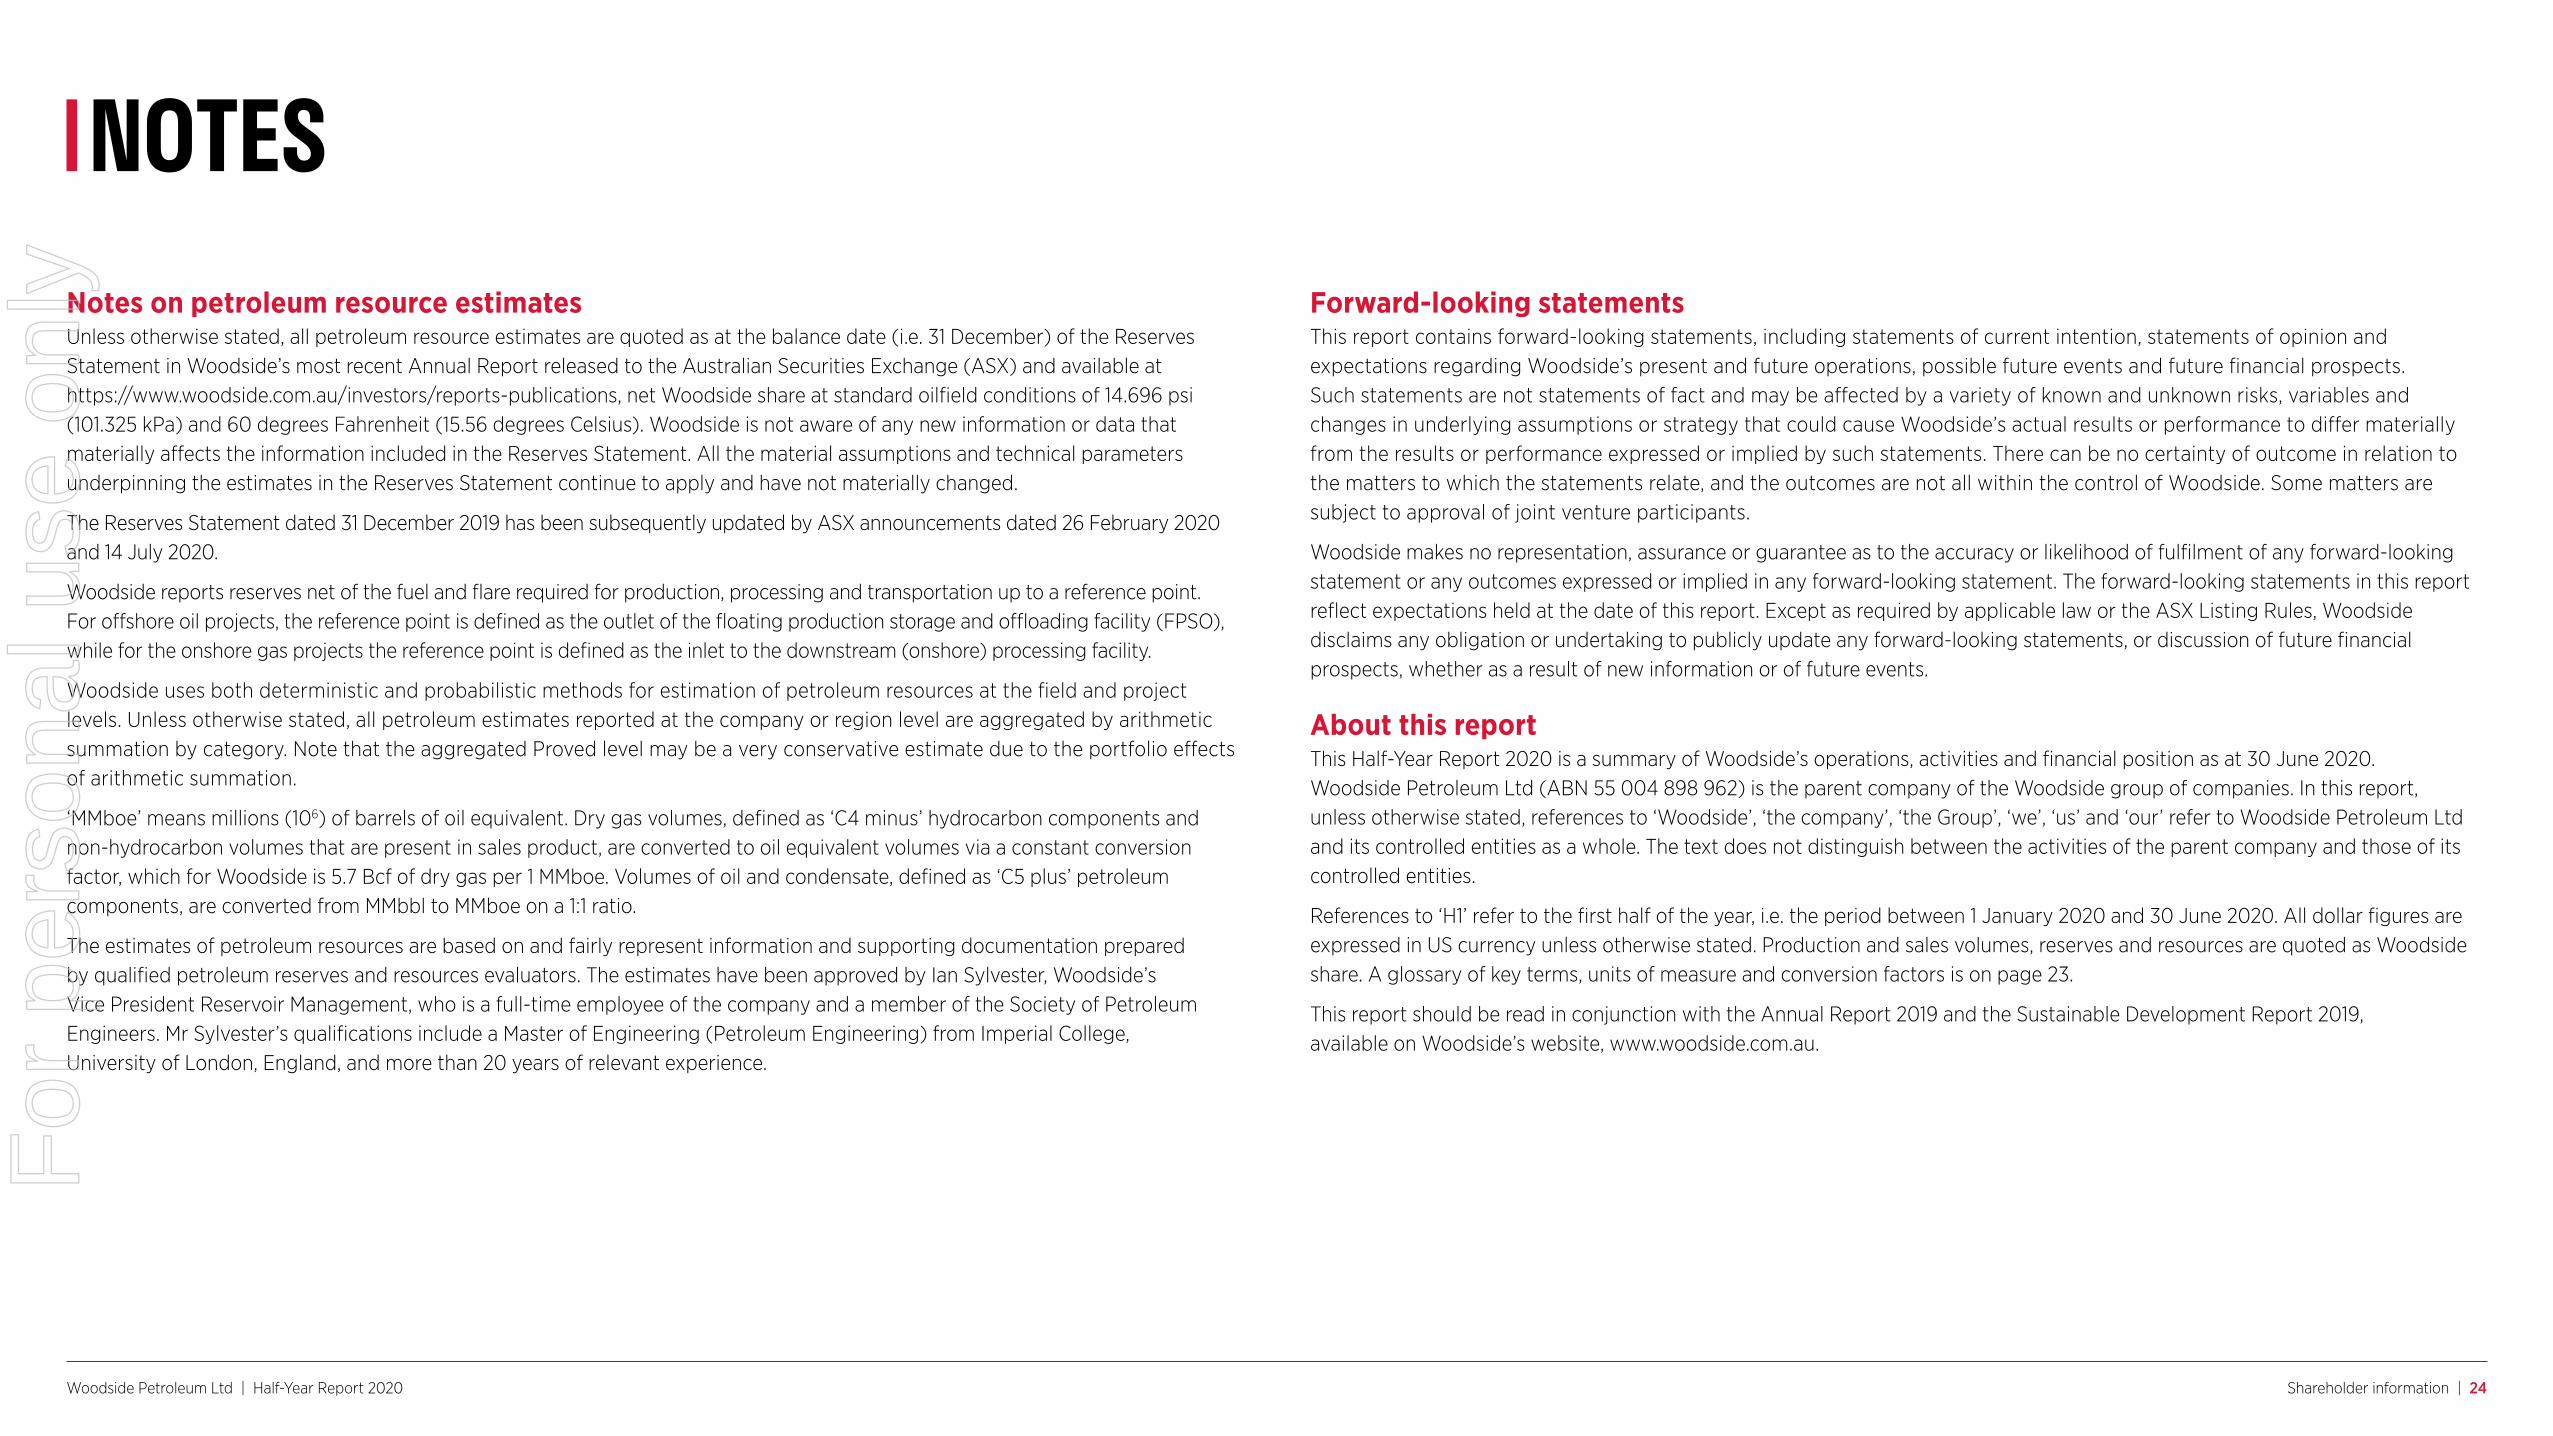
Woodside Petroleum Ltd | Half-Year Report 2020 Shareholder information | 24
NOTESNotes on petroleum resource estimates Unless otherwise stated, all petroleum resource estimates are quoted as at the balance date (i.e. 31 December) of the Reserves Statement in Woodside’s most recent Annual Report released to the Australian Securities Exchange (ASX) and available at https://www.woodside.com.au/investors/reports-publications, net Woodside share at standard oilfield conditions of 14.696 psi (101.325 kPa) and 60 degrees Fahrenheit (15.56 degrees Celsius). Woodside is not aware of any new information or data that materially affects the information included in the Reserves Statement. All the material assumptions and technical parameters underpinning the estimates in the Reserves Statement continue to apply and have not materially changed.
The Reserves Statement dated 31 December 2019 has been subsequently updated by ASX announcements dated 26 February 2020 and 14 July 2020.
Woodside reports reserves net of the fuel and flare required for production, processing and transportation up to a reference point. For offshore oil projects, the reference point is defined as the outlet of the floating production storage and offloading facility (FPSO), while for the onshore gas projects the reference point is defined as the inlet to the downstream (onshore) processing facility.
Woodside uses both deterministic and probabilistic methods for estimation of petroleum resources at the field and project levels. Unless otherwise stated, all petroleum estimates reported at the company or region level are aggregated by arithmetic summation by category. Note that the aggregated Proved level may be a very conservative estimate due to the portfolio effects of arithmetic summation.
‘MMboe’ means millions (106) of barrels of oil equivalent. Dry gas volumes, defined as ‘C4 minus’ hydrocarbon components and non-hydrocarbon volumes that are present in sales product, are converted to oil equivalent volumes via a constant conversion factor, which for Woodside is 5.7 Bcf of dry gas per 1 MMboe. Volumes of oil and condensate, defined as ‘C5 plus’ petroleum components, are converted from MMbbl to MMboe on a 1:1 ratio.
The estimates of petroleum resources are based on and fairly represent information and supporting documentation prepared by qualified petroleum reserves and resources evaluators. The estimates have been approved by Ian Sylvester, Woodside’s Vice President Reservoir Management, who is a full-time employee of the company and a member of the Society of Petroleum Engineers. Mr Sylvester’s qualifications include a Master of Engineering (Petroleum Engineering) from Imperial College, University of London, England, and more than 20 years of relevant experience.
Forward-looking statementsThis report contains forward-looking statements, including statements of current intention, statements of opinion and expectations regarding Woodside’s present and future operations, possible future events and future financial prospects. Such statements are not statements of fact and may be affected by a variety of known and unknown risks, variables and changes in underlying assumptions or strategy that could cause Woodside’s actual results or performance to differ materially from the results or performance expressed or implied by such statements. There can be no certainty of outcome in relation to the matters to which the statements relate, and the outcomes are not all within the control of Woodside. Some matters are subject to approval of joint venture participants.
Woodside makes no representation, assurance or guarantee as to the accuracy or likelihood of fulfilment of any forward-looking statement or any outcomes expressed or implied in any forward-looking statement. The forward-looking statements in this report reflect expectations held at the date of this report. Except as required by applicable law or the ASX Listing Rules, Woodside disclaims any obligation or undertaking to publicly update any forward-looking statements, or discussion of future financial prospects, whether as a result of new information or of future events.
About this reportThis Half-Year Report 2020 is a summary of Woodside’s operations, activities and financial position as at 30 June 2020. Woodside Petroleum Ltd (ABN 55 004 898 962) is the parent company of the Woodside group of companies. In this report, unless otherwise stated, references to ‘Woodside’, ‘the company’, ‘the Group’, ‘we’, ‘us’ and ‘our’ refer to Woodside Petroleum Ltd and its controlled entities as a whole. The text does not distinguish between the activities of the parent company and those of its controlled entities.
References to ‘H1’ refer to the first half of the year, i.e. the period between 1 January 2020 and 30 June 2020. All dollar figures are expressed in US currency unless otherwise stated. Production and sales volumes, reserves and resources are quoted as Woodside share. A glossary of key terms, units of measure and conversion factors is on page 23.
This report should be read in conjunction with the Annual Report 2019 and the Sustainable Development Report 2019, available on Woodside’s website, www.woodside.com.au.
For
per
sona
l use
onl
y

Head office:Woodside Petroleum LtdMia Yellagonga11 Mount StreetPerth WA 6000
Postal address:GPO Box D188Perth WA 6840Australia
T: +61 8 9348 4000F: +61 8 9214 2777E: [email protected]
Woodside Petroleum LtdABN 55 004 898 962
woodside.com.auFor
per
sona
l use
onl
y