Embed Size (px)
Citation preview

27 August 2015 The Manager ASX Market Announcements Australian Securities Exchange Exchange Centre Level 4 20 Bridge Street Sydney NSW 2000 Electronic Lodgement
Australian Foundation Investment Company Limited Statutory Annual Report, Annual Shareholder Review,
Notice of Meeting and Proxy Form Dear Sir / Madam Please find attached the 2015 Statutory Annual Report, Annual Shareholder Review, Notice of Meeting and Proxy Form being sent to shareholders. Yours faithfully
Simon Pordage Company Secretary
For
per
sona
l use
onl
y

Annual Report 2015
EXPERIENCE INCOME GROWTH
For
per
sona
l use
onl
y

The Company’s primary investment goals are:
To provide attractive total returns over the medium to long term.
To pay dividends which, over time, grow faster than the rate of inflation.
CONTENTS
1 Directors’ Report 1 Year in Summary 1 5 Year Summary 2 About the Company 3 Review of Operations and Activities 9 Top 25 Investments 10 Board and Management 13 Remuneration Report 34 Non-audit Services 35 Auditor’s Independence Declaration
37 Financial Statements 37 Consolidated Income Statement 38 Consolidated Statement of
Comprehensive Income 39 Consolidated Balance Sheet 40 Consolidated Statement of
Changes in Equity 42 Consolidated Cash Flow Statement
43 Notes to the Financial Statements43 A. Understanding AFIC’s Financial
Performance48 B. Costs, Tax and Risk52 C. Unrecognised Items
53 Additional Information53 D. Balance Sheet Reconciliations56 E. Income Statement Reconciliations57 F. Other Information
67 Directors’ Declaration
68 Independent Audit Report
70 Other Information 70 Information About Shareholders
and Noteholders71 Major Shareholders 72 Major Transactions in the
Investment Portfolio 73 Major Transactions in the
Buy and Write Portfolio 74 Sub-underwriting 74 Substantial Shareholders 74 Transactions in Securities 75 Holdings of Securities79 Issues of Securities 80 Company Particulars 81 Shareholder Meetings
Australian Foundation Investment Company Limited ABN 56 004 147 120
For
per
sona
l use
onl
y

DIRECTORS’ REPORT
The Company aims to provide shareholders with attractive investment returns through access to a steady stream of fully franked dividends and enhancement of capital invested.
YEAR IN SUMMARY
2015 2014 2013 2012 2011Net profit after tax ($ million) 293.6 254.3 242.8 219.9 233.3Net profit per share (cents) 27.2 24.4 23.5 21.5 23.0Dividends per share (cents)(a) 23 22 22 21 21Investments at market value ($ million)(b) 6,414 6,324 5,411 4,570 4,885Net asset backing (cents) (c) 585.1 584.5 518.5 435.1 478.9Number of shareholders (30 June) 107,622 103,188 96,668 93,513 93,092
Notes(a) All dividends were fully franked. The LIC attributable gain attached to the dividend was: 2015: 7.1 cents, 2014: nil, 2013: 4.3 cents, 2012 and 2011: nil.(b) Excludes cash.(c) Net asset backing per share based on year-end data before the provision for the final dividend. The figures do not include a provision for capital gains
tax that would apply if all securities held as non-current investments had been sold at balance date as Directors do not intend to dispose of the portfolio.
5 YEAR SUMMARY
PROFIT FOR THE YEAR
$293.6mUp 15.5% from 2014
FULLY FRANKED DIVIDENDS
14¢ Final23¢ Total
Up 1 cent up from 2014
TOTAL PORTFOLIO RETURN
+3.9%
S&P/ASX 200 Accumulation Index +5.7%
TOTAL SHAREHOLDER RETURN
+2.8%
Share price plus dividend
MANAGEMENT EXPENSE RATIO
0.16%
0.17% in 2014
TOTAL PORTFOLIO
$6.6b $6.4 billion in 2014
Including cash at 30 June
1Australian Foundation Investment Company Limited Annual Report 2015
For
per
sona
l use
onl
y

ABOUT THE COMPANY
Australian Foundation Investment Company Limited (AFIC) specialises in investing in Australian equities. We have been investing in Australian companies for over 80 years and is Australia’s largest listed investment company.
Investment AimsThe Company aims to provide shareholders with attractive investment returns through access to a steady stream of fully franked dividends and enhancement of capital invested.
The Company’s primary investment goals are to pay dividends which, over time, grow faster than the rate of inflation and to provide attractive total returns over the medium to long term.
Approach to InvestingThe investment philosophy is built on taking a medium to longer term view of value, which means that the aim is to buy and hold individual stocks for the long term based on selection criteria, which, in summary, include:
• formulation and execution of business strategy of the Company and its underlying business value;
• key financial indicators, including cash flow, prospective price earnings relative to projected growth, sustainability of earnings and dividend yield; and
• corporate governance practices.
The Company has access to lines of credit of up to $150 million, which allows it to borrow money when appropriate investment returns are available. The Company also has on issue $203.6 million of convertible notes.
The Company also uses options written against a small proportion of its investments to generate additional income.
Our StructureThe Company has a ‘closed end’ structure, which means that the number of shares on issue is fixed and set by the Board. As a result, the Company does not issue new shares or cancel them as investors enter and leave. This allows management to concentrate on the performance of the funds invested over the longer term without having to deal with continuous inflows or outflows of monies.
FeesThe management expense ratio to 30 June 2015 was 0.16 per cent of assets. The Company does not charge entry or exit fees when shareholders acquire or dispose of their holdings, although transaction costs will be borne by the shareholder when buying or selling through a stockbroker. There are no trailing commissions or portfolio performance fees.
Investing in the CompanyBy investing in the Company, shareholders have immediate access to a diversified portfolio numbering around 100 companies, most of which are predominantly Australia’s major companies, and to a Board and Investment Committee with extensive investment skills and practical business experience. The Company’s shares can be bought or sold through the Australian Securities Exchange (ASX) and New Zealand Securities Exchange (NZX) (ASX Code: AFI, NZX Code: AFI). The Company’s convertible notes can be bought or sold through the ASX (ASX Code: AFIG).
TransparencyWe take an active approach to keeping shareholders informed about the Company’s activities and performance including yearly and half-yearly profit announcements, regular shareholder briefings and access to all Company announcements, including monthly net tangible asset announcements, through the ASX and the Company’s website afi.com.au
2 Australian Foundation Investment Company Limited Annual Report 2015
For
per
sona
l use
onl
y

REVIEW OF OPERATIONS AND ACTIVITIES
ProfitProfit for the year to 30 June 2015 was $293.6 million, up 15.5 per cent from $254.3 million in the corresponding period last year. The profit figure this year includes a non-cash dividend of $31.9 million received as a result of the demerger of South32 from BHP Billiton. Last year’s figure included $11.0 million of demerger dividends from Amcor and Brambles.
Income from investments (excluding demerger dividends), which consists primarily of franked dividend income, was up 8 per cent over the year. The trading portfolio contributed $8.4 million compared to $9.9 million last year.
Earnings per share for the year were 27.2 cents per share compared with 24.4 cents per share last year.
DividendsThe Company has maintained its final dividend at 14 cents per share fully franked, bringing total dividends for the year to 23 cents per share fully franked, an increase of 1 cent from 22 cents last year. The Board notes the profit result provides scope to increase the dividend. Based on expectations, the Board currently intends to apply a 1 cent increase to the interim dividend to be paid in February 2016 to further rebalance the interim and final dividends.
Dividend ImputationAs shareholders may be aware there has recently been significant commentary about the dividend imputation system. The Tax Discussion Paper issued by the Australian Treasury in March 2015 posed a number of questions about the Australian taxation system. Specifically the following questions outlined in the discussion paper relating to dividend imputation were: ‘Is the dividend imputation system continuing to serve Australia well as our economy becomes increasingly open? Could the taxation of dividends be improved?’
AFIC has made a submission to the Tax Discussion Paper. In it we strongly argued that the current imputation system, which avoids the double taxation of corporate profits in the hands of investors, is desirable and has served the Australian capital market very well. The system results in Australian investors being taxed at their marginal rate on the underlying company income by being given a tax credit for the company tax already paid. We believe this to be an equitable system for investors.
In addition, by making the taxation on equity tax neutral with that of debt via the imputation system, Australia reduces the cost of equity for Australian investors. This lowering has led to Australian corporates becoming less geared, and thus less risky, further increasing their relative value to both foreign and domestic investors. We believe that for most companies the imputation system has placed an appropriate discipline on the balance between them paying out dividends and the use of capital for expansion.
We also suggested the imputation system is well understood and appreciated. It has been central to the health and robustness of the Australian equity market and
superannuation system. As a result, any changes would have a significant impact on Australian investors. This is likely to have a negative effect on confidence, which may impact the broader economy.
AFIC’s full submission to the Tax Discussion Paper is available on the Company’s website.
Market and Portfolio PerformanceFigures 1 and 2 highlight the relative performance of different sectors of the market over the financial year. The banks, until recently, and the property trust sector
Figure 1: Relative performance of energy, materials and banking sectors in the market
S&P/ASX 200Energy
S&P/ASX 200Materials
S&P/ASX 200Banks
Source: FactSet
May
15
Apr
15
Mar
15
Feb
15
Jan
15
Dec
14
Jun
15
Jul 1
5
Nov
14
Oct
14
Sep
14
Aug
14
Jul 1
4
70
140
130
80
90
100Inde
x 110
120
S&P/ASX 200Telecom Services
S&P/ASX 200Healthcare
S&P/ASX 200Property Trusts
May
15
Apr
15
Mar
15
Feb
15
Jan
15
Dec
14
Jun
15
Jul 1
5
Nov
14
Oct
14
Sep
14
Aug
14
Jul 1
4
70
140
130
Source: FactSet
80
90
100
110
120
Inde
x
Figure 2: Relative performance of telecom services, healthcare andproperty trust sectors in the market
3Australian Foundation Investment Company Limited Annual Report 2015
For
per
sona
l use
onl
y

REVIEW OF OPERATIONS AND ACTIVITIES continued
have been the beneficiary of investor attraction to yield. Materials and energy have clearly been impacted by the marked fall in commodity and energy prices. Finally companies in attractive and growing industry segments, such as healthcare and telecommunications services, also generated strong returns. It should be noted AFIC is not typically a large investor in the property trusts given the absence of franking in the dividends and the historical long term underperformance of this sector relative to industrial companies.
AFIC’s portfolio return for the 12 months to 30 June 2015 was 3.9 per cent compared with the S&P/ASX 200 Accumulation Index of 5.7 per cent. The 10 year return for AFIC, which is consistent with its approach as a long term investor, was 7.9 per cent per annum versus the Index return of 7.1 per cent per annum. AFIC’s performance numbers are after expenses and tax paid. It should also be noted that Index returns for the market do not include the impact of management expenses and tax on their performance.
The most significant contributors to AFIC’s portfolio performance by value over the year were Commonwealth Bank, Telstra, Amcor, Transurban and Toll Holdings as a result of it being taken over by Japan Post.
Holdings that had the biggest negative impact on AFIC’s portfolio performance were companies in the energy and resource sectors, including those companies exposed to these sectors such as Bradken and ALS Limited, as did the performance of Woolworths in the second half of the year. The underweight position in property trusts and to some extent the underweight position in healthcare, in particular CSL, also had a negative impact on relative performance.
The generation of fully franked income is one of the key aspects of AFIC’s investment approach. As an indication of the importance of franking to returns it is useful to look at performance, including the benefit of franking credits. The total portfolio return (TPR) for one year, including dividends paid and the full benefit of franking credits, was 5.6 per cent. This compares with the S&P/ASX 200 Accumulation Index calculated on the same basis, which was 6.8 per cent. The comparable 10 year return for the portfolio was 9.8 per cent per annum against the benchmark return of 8.5 per cent per annum.
Share Price PerformanceThe share price underperformed the portfolio return as the share price premium to the net asset backing (before tax on unrealised gains) fell from 5.8 per cent to 4.6 per cent over the course of the financial year. Importantly the share price over the long term has also performed well with this return aligned to the longer term portfolio returns.
Figure 5 outlines the benefit of compound returns and the value of AFIC’s investment approach. It shows the total share price return (including dividends and the full benefit of franking credits) from an investment of $1,000 in AFIC shares over a 10 year period relative to the return from the S&P/ASX 200 Accumulation Index, including franking credits.
Investment Portfolio ActivityAFIC is a long term investor. Its particular interest is in companies that can deliver long term value and share their prosperity by growing dividends over time. Given extremely low interest rates, significant investor interest has also been in companies with good dividend yields driving those share prices to high levels for most of the year. Companies delivering reliable earnings growth also tended to trade at very high price earnings ratios (P/E ratio). Given these high valuations for most of the year it has been challenging to find value.
As a result, our primary investment interest this year has been to broaden the portfolio, including building particular areas in the portfolio such as Health and Aged Care and adding some smaller companies, including participation in selected initial public offerings (IPOs).
Major purchases in the investment portfolio included CSL and AGL (through its rights issue). Federation Centres was introduced to the portfolio during the year, with this holding further increased as a result of the merger with Novion Property Group. Other new companies added to the portfolio included Healthscope (via its IPO), Cover-More Group, Veda Group, Regis Healthcare (via its IPO) and Sims Metal Management.
Details of the new stocks added during year are:
• Federation Centres (following the merger between Federation Centres and Novion Property Group on 11 June 2015) is one of Australia’s largest owners and managers of shopping centres. The group’s portfolio of assets ranges from large super-regional malls to direct factory outlets and smaller convenience and neighbourhood centres across Australia.
• Healthscope is one of Australia’s leading private healthcare operators, providing services through the operation of private hospitals and medical centres in Australia.
• Cover-More Group is a specialist and integrated travel insurance and medical assistance provider. The company holds the leading market position in Australia, with over 40 per cent market share through 25,000 active agents. It is also
Figure 3: Portfolio and share price performance to 30 June 2015
10 year return
Net asset per share growth plus dividends S&P/ASX 200 Accumulation IndexShare price growth plus dividends
1 year return 3 year return 5 year return
15.1
%
14.9
% 18.3
%
5.7%
3.9%
2.8% 7.
9% 9. 4
%
7.1%10
.0%
9.9%
9.7%
4 Australian Foundation Investment Company Limited Annual Report 2015
For
per
sona
l use
onl
y

Figure 5: Ten year performance of an investment of $1,000 in AFIC shares including dividends and the full bene�t of franking
Share price growth plusdividends including franking
S&P/ASX 200 Accumulation Indexincluding franking
Jun
15
Jun
05
Jun
06
Jun
07
Jun
08
Jun
09
Jun
10
Jun
11
Jun
12
Jun
13
Jun
14
$0
$3,500
$3,000
$500
$1,000
$1,500
$2,000
$2,500
Note: Assumes the reinvestment of dividends. This chart calculates the benefit of franking creditsat the time dividends are paid for both AFIC and the Index. In practice there is a timing difference between receipt of the dividend and the realisation of the franking benefit in the following tax year.
Figure 4: Share price premium/discount to net asset backing
15%
-15%
-10%
-5%
0%
5%
10%
Jun
05
Jun
07
Jun
09
Jun
11
Jun
13
Jun
15
5Australian Foundation Investment Company Limited Annual Report 2015
For
per
sona
l use
onl
y

REVIEW OF OPERATIONS AND ACTIVITIES continued
steadily growing its footprint in Asia. Cover-More was established in 1986 and listed on the ASX in December 2013.
• Veda Group is the largest credit reference agency in Australia and New Zealand. It provides credit reporting, credit scoring and marketing analytics services.
• Regis Healthcare is one of the largest and most geographically diversified private Australian residential aged care providers, operating a large portfolio of high quality aged care facilities. Regis was formed in the early 1990s and listed on the ASX in October 2014.
• Sims Metal Management is the leading metals and electronics recycling company in the world. The company specialises in ferrous and non-ferrous metals recycling, post-consumer electronic goods recycling, and municipal waste recycling. Its primary operations are located in the United States, Australia and the United Kingdom.
The largest sales resulted from the takeover of Toll Holdings by Japan Post and activity in the Company’s small buy and write portfolio, which led to the exercise of call options in Telstra, CSL, Transurban and Suncorp.
Overall purchases for the year totalled $377.1 million, with sales totalling $262.1 million.
Figure 6 highlights the profile of the total portfolio by the various sectors of the market at the end of the financial year. In comparison to last year there has been an increase in portfolio weightings in Healthcare (up from 3.6 per cent last year) and Telecom Services (up from 4.8 per cent last year) sectors. There was also an increase in cash to 2.5 per cent from 1.1 per cent at the end of last year. The biggest reduction was in Energy (down from 9.3 per cent last year) as the fall in oil price over the year impacted the share prices of companies in this sector.
OutlookThe expectation is that low interest rates will be a feature of global markets for some time. In the more immediate term there is likely to be periods of volatility as concerns arise about the risks in Europe and China and as adjustments are made over time to monetary policy settings by the Federal Reserve in the United States. However, the low interest rate environment in Australia is likely to provide underlying support to the market even in light of these other factors, which may produce some setbacks.
Figure 7 reinforces the attractiveness of equity yields when compared to 10 year government bond yields. The gap between equity yields and 10 year government bond yields remains high in response to subdued growth, low inflation and monetary policy.
The P/E ratio shows how much investors are willing to pay per dollar of earnings growth.
However, given the current environment in Australia where earnings growth is likely to be subdued as a result of current economic settings, it is evident that investors are also willing to pay above average P/E ratios given low interest rates. As a result, the market is at the upper end of valuation levels despite recent falls.
As experienced more recently, heightened perceptions of risk can quickly translate into sharp moves in equity markets. AFIC has the financial resources to take advantage of these adjustments. We believe the core of our portfolio is relatively well positioned. As a result, the focus of new investment is likely to be on specific value opportunities that may arise in smaller and mid cap sized companies that can deliver growing dividends over time, as well as underrepresented sectors in the portfolio such as healthcare.
The Company also operates a small buy and write portfolio within the investment portfolio, where stocks are purchased with the specific intent of selling call options against these holdings. A rise in volatility will assist with further profitable use of this portfolio as more call option premium is received for selling call options.
Ultimately, the real test of the market’s direction over the longer term will be progress on economic reform in Australia, improved business and consumer confidence and the potential impact of a lower Australian dollar on international competitiveness. These factors will be central to companies generating additional revenue growth to improve profitability rather than the continued reliance of reducing costs, which has been the response of companies over recent years to inconsistent business conditions and external shocks such as falling commodity prices.
Company Position Capital ChangesAs a result of the reinvestment of dividends, 4,982,987 new shares were issued at a price of $5.93 per share in August 2014 and 3,379,323 new shares were issued at a price of $5.97 per share in February 2015.
As a result of participation in the Company’s Dividend Substitution Share Plan (DSSP), 301,765 new shares were issued at nil cost in August 2014 and 223,678 new shares were issued at nil cost in February 2015.
As a result of conversion of convertible notes, 306,318 new shares were issued at a price of $5.0864 per share in August 2014 and 170,036 new shares were issued at a price of $5.0864 per share in February 2015.
As a result of the Share Purchase Plan (SSP), 31,424,433 shares were issued at a price of $5.88 in October 2014.
The Company’s buy-back facility remains open although no shares were bought back during the year.
1.4%
Cons
umer
Disc
retio
nary
Prop
erty
Trus
ts
2.0%
Info
rmat
ion
Tech
nolo
gy
2.5%
Cash
5.7%
Tele
com
Serv
ices
2.7%
Utili
ties
5.9%
Heal
thca
re
6.7%
Ener
gy
8.1%
Indu
stria
ls
8.0%
Cons
umer
Stap
les
9.2%
Othe
rFi
nanc
ials
16.7%
Mat
eria
ls
29.1%
Bank
s
Figure 6: Investment by sector as at 30 June 2015
2.0%
6 Australian Foundation Investment Company Limited Annual Report 2015
For
per
sona
l use
onl
y

Figure 8: S&P/ASX 200 Price earnings ratio
2015
2005
2006
2007
2008
2009
2010
2011
2012
2013
2014
9
17
16
Source: FactSet
10
11
12
13
14
15
Average 13.7
Tim
es
Figure 7: Australian equity yields versus 10 year government bond yields
Australian 10 year bond yield Equity yield S&P/ASX 200 Index
Jul 1
4
Jul 0
0
Jul 0
1
Jul 0
2
Jul 0
3
Jul 0
4
Jul 0
5
Jul 0
6
Jul 0
7
Jul 0
8
Jul 0
9
Jul 1
0
Jul 1
1
Jul 1
2
Jul 1
3
0%
12%
2%
4%
6%
8%
10%
7Australian Foundation Investment Company Limited Annual Report 2015
For
per
sona
l use
onl
y
REVIEW OF OPERATIONS AND ACTIVITIES continued
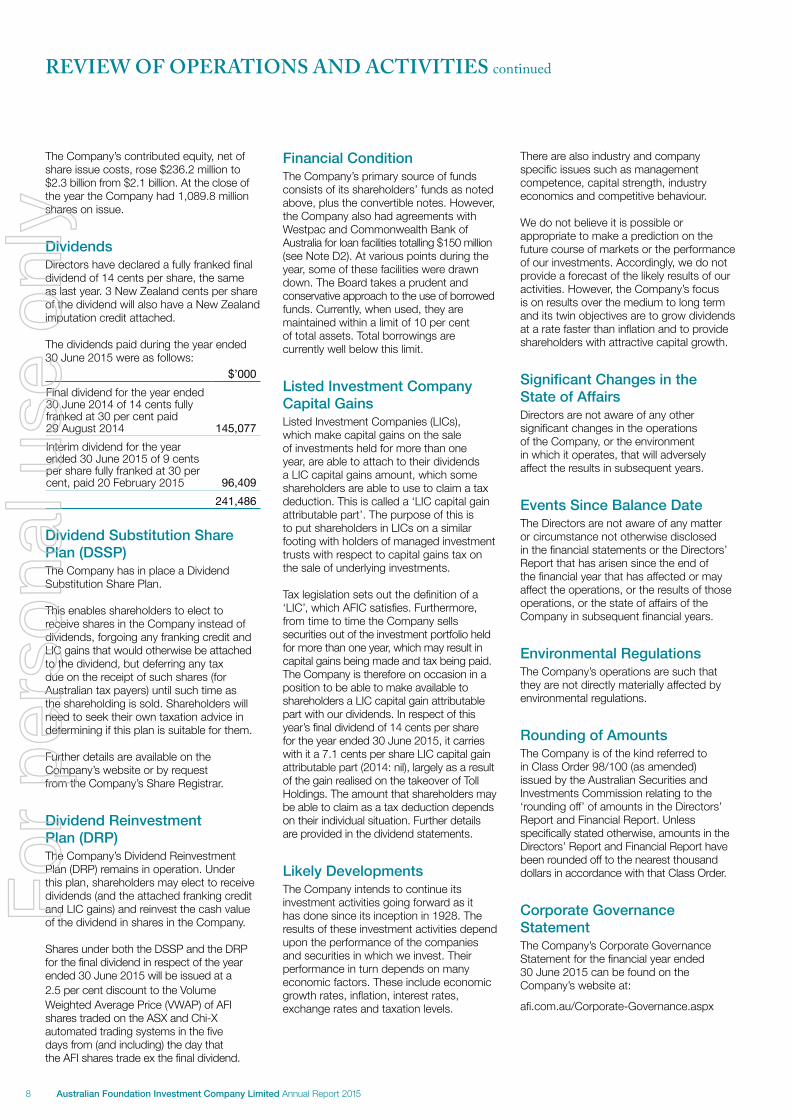
The Company’s contributed equity, net of share issue costs, rose $236.2 million to $2.3 billion from $2.1 billion. At the close of the year the Company had 1,089.8 million shares on issue.
DividendsDirectors have declared a fully franked final dividend of 14 cents per share, the same as last year. 3 New Zealand cents per share of the dividend will also have a New Zealand imputation credit attached.
The dividends paid during the year ended 30 June 2015 were as follows:
$’000Final dividend for the year ended 30 June 2014 of 14 cents fully franked at 30 per cent paid 29 August 2014 145,077Interim dividend for the year ended 30 June 2015 of 9 cents per share fully franked at 30 per cent, paid 20 February 2015 96,409
241,486
Dividend Substitution Share Plan (DSSP)The Company has in place a Dividend Substitution Share Plan.
This enables shareholders to elect to receive shares in the Company instead of dividends, forgoing any franking credit and LIC gains that would otherwise be attached to the dividend, but deferring any tax due on the receipt of such shares (for Australian tax payers) until such time as the shareholding is sold. Shareholders will need to seek their own taxation advice in determining if this plan is suitable for them.
Further details are available on the Company’s website or by request from the Company’s Share Registrar.
Dividend Reinvestment Plan (DRP)The Company’s Dividend Reinvestment Plan (DRP) remains in operation. Under this plan, shareholders may elect to receive dividends (and the attached franking credit and LIC gains) and reinvest the cash value of the dividend in shares in the Company.
Shares under both the DSSP and the DRP for the final dividend in respect of the year ended 30 June 2015 will be issued at a 2.5 per cent discount to the Volume Weighted Average Price (VWAP) of AFI shares traded on the ASX and Chi-X automated trading systems in the five days from (and including) the day that the AFI shares trade ex the final dividend.
Financial ConditionThe Company’s primary source of funds consists of its shareholders’ funds as noted above, plus the convertible notes. However, the Company also had agreements with Westpac and Commonwealth Bank of Australia for loan facilities totalling $150 million (see Note D2). At various points during the year, some of these facilities were drawn down. The Board takes a prudent and conservative approach to the use of borrowed funds. Currently, when used, they are maintained within a limit of 10 per cent of total assets. Total borrowings are currently well below this limit.
Listed Investment Company Capital GainsListed Investment Companies (LICs), which make capital gains on the sale of investments held for more than one year, are able to attach to their dividends a LIC capital gains amount, which some shareholders are able to use to claim a tax deduction. This is called a ‘LIC capital gain attributable part’. The purpose of this is to put shareholders in LICs on a similar footing with holders of managed investment trusts with respect to capital gains tax on the sale of underlying investments.
Tax legislation sets out the definition of a ‘LIC’, which AFIC satisfies. Furthermore, from time to time the Company sells securities out of the investment portfolio held for more than one year, which may result in capital gains being made and tax being paid. The Company is therefore on occasion in a position to be able to make available to shareholders a LIC capital gain attributable part with our dividends. In respect of this year’s final dividend of 14 cents per share for the year ended 30 June 2015, it carries with it a 7.1 cents per share LIC capital gain attributable part (2014: nil), largely as a result of the gain realised on the takeover of Toll Holdings. The amount that shareholders may be able to claim as a tax deduction depends on their individual situation. Further details are provided in the dividend statements.
Likely DevelopmentsThe Company intends to continue its investment activities going forward as it has done since its inception in 1928. The results of these investment activities depend upon the performance of the companies and securities in which we invest. Their performance in turn depends on many economic factors. These include economic growth rates, inflation, interest rates, exchange rates and taxation levels.
There are also industry and company specific issues such as management competence, capital strength, industry economics and competitive behaviour.
We do not believe it is possible or appropriate to make a prediction on the future course of markets or the performance of our investments. Accordingly, we do not provide a forecast of the likely results of our activities. However, the Company’s focus is on results over the medium to long term and its twin objectives are to grow dividends at a rate faster than inflation and to provide shareholders with attractive capital growth.
Significant Changes in the State of AffairsDirectors are not aware of any other significant changes in the operations of the Company, or the environment in which it operates, that will adversely affect the results in subsequent years.
Events Since Balance DateThe Directors are not aware of any matter or circumstance not otherwise disclosed in the financial statements or the Directors’ Report that has arisen since the end of the financial year that has affected or may affect the operations, or the results of those operations, or the state of affairs of the Company in subsequent financial years.
Environmental RegulationsThe Company’s operations are such that they are not directly materially affected by environmental regulations.
Rounding of AmountsThe Company is of the kind referred to in Class Order 98/100 (as amended) issued by the Australian Securities and Investments Commission relating to the ‘rounding off’ of amounts in the Directors’ Report and Financial Report. Unless specifically stated otherwise, amounts in the Directors’ Report and Financial Report have been rounded off to the nearest thousand dollars in accordance with that Class Order.
Corporate Governance StatementThe Company’s Corporate Governance Statement for the financial year ended 30 June 2015 can be found on the Company’s website at:
afi.com.au/Corporate-Governance.aspx
8 Australian Foundation Investment Company Limited Annual Report 2015
For
per
sona
l use
onl
y

TOP 25 INVESTMENTSAs at 30 June 2015
Includes investments held in both the investment and trading portfolios.
Valued at closing prices at 30 June 2015Total Value
$ Million% of
Portfolio1 Commonwealth Bank of Australia 722.1 11.32 Westpac Banking Corporation 586.3 9.13 BHP Billiton* 384.6 6.04 National Australia Bank 336.3 5.25 Telstra Corporation 322.0 5.06 Wesfarmers 289.7 4.57 Australia and New Zealand Banking Group 273.3 4.38 Rio Tinto 196.3 3.19 Amcor 176.5 2.810 Transurban Group 170.5 2.711 Woolworths 161.8 2.512 AMP 121.0 1.913 Oil Search* 119.6 1.914 Brambles 118.4 1.815 Woodside Petroleum* 116.8 1.816 QBE Insurance Group* 113.3 1.817 CSL* 101.2 1.618 Computershare 95.5 1.519 AGL Energy 94.9 1.520 APA Group 85.2 1.321 Incitec Pivot 84.8 1.322 Ramsay Health Care 83.6 1.323 Origin Energy 83.3 1.324 Milton Corporation 64.8 1.025 Santos 62.9 1.0Total 4,964.9
As a percentage of total portfolio value (excludes cash) 77.4%
* Indicates that options were outstanding against part of the holding.
9Australian Foundation Investment Company Limited Annual Report 2015
For
per
sona
l use
onl
y

BOARD AND MANAGEMENT
DirectorsTerrence A Campbell AO BCom (Melb). Chairman and Independent Non-Executive Director. Chairman of the Investment Committee and member of the Remuneration and Nomination Committees.
Mr Campbell has been a Director of the Company since September 1984, appointed Deputy Chairman in September 2008 and Chairman in October 2013. He is Senior Chairman of Goldman Sachs Australia and New Zealand (formerly Goldman Sachs JBWere) and Advisory Director of Goldman Sachs. Mr Campbell was formerly Chairman and Chief Executive of Goldman Sachs JBWere. He is also Chairman of Mirrabooka Investments Limited and is a former Director of Djerriwarrh Investments Limited and AMCIL Limited.
Ross E Barker BSc (Hons) (Melb), MBA (Melb), F Fin. Managing Director. Member of the Investment Committee. Managing Director of the Company’s subsidiary, Australian Investment Company Services Limited (AICS).
Mr Barker became Chief Executive Officer in February 2001 having been an Alternate Director of the Company since April 1987. He was appointed Managing Director in October 2001. He is also Managing Director of Djerriwarrh Investments Limited, AMCIL Limited and Mirrabooka Investments Limited. He is also Chairman of Melbourne Business School Ltd and a member of the Financial Reporting Council.
Jacqueline C Hey BCom (Melb), Grad Cert (Management), GAICD. Independent Non-Executive Director.
Ms Hey was appointed to the Board in July 2013. She is a Non-Executive Director of Qantas Limited, Bendigo and Adelaide Bank Limited, Special Broadcasting Service (SBS), Melbourne Business School Ltd and Cricket Australia. She is also the Honorary Consul for Sweden in Victoria. She was formerly Managing Director of Ericsson United Kingdom and Ireland and Managing Director of Ericsson Australia and New Zealand.
Graeme R Liebelt B Ec (Hons), FAICD. Independent Non-Executive Director. Chairman of the Remuneration Committee.
Mr Liebelt was appointed to the Board in June 2012. He is Chairman of Amcor Limited, Director of Australia and New Zealand Banking Group Limited, Deputy Chairman of the Melbourne Business School Ltd and a Director of Carey Baptist Grammar School. He is a Fellow of the Australian Academy of Technological Sciences and Engineering and a Fellow of the Australian Institute of Company Directors. He was formerly Managing Director and CEO of Orica Limited and Chairman and Director of the Global Foundation.
John Paterson BCom (Hons) (Melb), CPA, F Fin. Independent Non-Executive Director. Chairman of the Nomination Committee. Member of the Remuneration Committee and Investment Committee. Chairman of the Company’s subsidiary, AICS.
Mr Paterson is a Company Director who was appointed to the Board in June 2005. He was a former Alternate Director of the Company for Mr Campbell from April 1987 to June 2005. He is Chairman of Djerriwarrh Investments Limited. He was formerly a Director of Goldman Sachs JBWere and is a former member of the Board of Guardians of Australia’s Future Fund.
David A Peever BEc MSC (Mineral Economics). Independent Non-Executive Director. Member of the Audit Committee.
Mr Peever was appointed to the Board in November 2013. He was Managing Director of Rio Tinto Australia from 2009 to 2014. He had been with Rio Tinto since 1987 in an extensive range of senior roles.
He is Deputy Chairman and Chairman elect of Cricket Australia and a Director of the Melbourne Business School. He is a member of the Prime Minister’s Indigenous Advisory Council and a member of the Chief of Defence’s Gender Equality Advisory Board. He Chaired the Minister of Defence’s First Principles Review of Defence and now Chairs the Minister’s Oversight Board, which guides the implementation of the Review. He was formerly Vice-President of the Minerals Council of Australia and a Director of the Business Council of Australia.
Fergus D Ryan AO FCPA, FAICD. Independent Non-Executive Director. Member of the Investment Committee, Audit Committee and the Nomination Committee.
Mr Ryan is a company Director and Certified Public Accountant. He was appointed a Director of the Company in August 2001. He is also a Patron of the Global Foundation and a Councillor of The Committee for Melbourne.
He was formerly a Director of the Commonwealth Bank of Australia Limited, the Strategic Investment Coordinator and Major Projects Facilitator for the Federal Government, a Director of Clayton Utz, of the National Australia Day Council and the Centre for Social Impact. He was also former Deputy Chairman of the Council of the National Library. Mr Ryan spent his career with Arthur Andersen, during which he was Managing Partner Melbourne for 15 years and Managing Partner Australia for five years.
10 Australian Foundation Investment Company Limited Annual Report 2015
For
per
sona
l use
onl
y

Catherine M Walter AM LLB (Hons), LLM, MBA (Melb), FAICD. Independent Non-Executive Director. Member of the Investment Committee, Remuneration Committee and the Audit Committee.
Mrs Walter is a solicitor and company Director. She was appointed a Director of the Company in August 2002. Mrs Walter is also a Director of the RBA’s Payment Systems Board, Victorian Funds Management Corporation and WEHI. She was formerly Chair of Federation Square Pty Ltd and Australian Synchrotron Company Ltd and a Director of ASX, National Australia Bank Ltd, Orica Ltd and Melbourne Business School.
Peter J Williams Dip.All, MAICD, FAIM. Independent Non-Executive Director. Chairman of the Audit Committee. Member of the Investment Committee and Nomination Committee. Director of the Company’s subsidiary, AICS.
Mr Williams was appointed a Director of the Company in February 2010. He is Chairman of MIPS Advisory Committee, Fiig Securities Limited and Olympic Park Sports Medical Centre Pty Ltd. He is a Director of the Australian Baseball Federation, National Australia Trustees Limited, Foundation for Young Australians and the E.W. Tipping Foundation. Mr Williams was formerly Managing Director of Equity Trustees Limited, a Director of the Trustee Corporations Association of Australia and a General Manager with AXA/National Mutual in Australia and Hong Kong.
Senior ExecutivesGeoffrey N Driver B Ec, Grad Dip Finance, MAICD. General Manager, Business Development and Investor Relations.
Mr Driver joined the Company in January 2003. Previously, he was with National Australia Bank Ltd for 18 years in various roles covering business strategy, marketing, distribution, investor relations and business operations. Mr Driver is Deputy Chairman of Trust for Nature (Victoria).
R Mark Freeman BE, MBA, Grad Dip App Fin (Sec Inst), AMP (INSEAD). Chief Investment Officer.
Mr Freeman has been Chief Investment Officer since joining the Company in February 2007. Prior to this he was a Partner with Goldman Sachs JBWere, where he spent 12 years advising the investment companies on their investment and dealing activities. He has a deep knowledge and experience of investments markets and the Company’s approaches, policies and processes.
Simon M Pordage LLB (Hons), FGIA, FCIS, MAICD. Company Secretary.
Mr Pordage joined the Company in February 2009. He is a Chartered Secretary and has over 17 years’ company secretarial experience and was previously Deputy Company Secretary for Australia and New Zealand Banking Group Limited and prior to that was Head of Board Support for Barclays PLC in the United Kingdom. He is a Vice President and Non-Executive Director of Governance Institute of Australia, Chairman of its National Legislation Review and Remuneration Committees and Deputy Chairman of its Victorian Council.
Andrew JB Porter MA (Hons) (St And), FCA, MAICD. Chief Financial Officer.
Mr Porter joined the Company in January 2005. He is a Chartered Accountant and has had over 21 years’ experience in accounting and financial management both in the United Kingdom, with Andersen Consulting and Credit Suisse First Boston, and in Australia where he was Regional Chief Operating Officer for the Corporate and Investment Banking Division of CSFB. He is also a Non-Executive Director of the Royal Victorian Eye & Ear Hospital and a member of the National Executive of the G100, the peak body for CFOs.
11Australian Foundation Investment Company Limited Annual Report 2015
For
per
sona
l use
onl
y

BOARD AND MANAGEMENT continued
Meetings of Directors The number of meetings of the Company’s Board of Directors and of each Board Committee held during the year ended 30 June 2015 and the numbers of meetings attended by each Director were:
Board Investment Committee Audit Committee Remuneration Committee Nomination CommitteeEligible to
Attend AttendedEligible to
Attend AttendedEligible to
Attend AttendedEligible to
Attend AttendedEligible to
Attend AttendedRE Barker 12 12 35 34 - 4# - 2# - -TA Campbell 12 11 35 32 - 1# 2 1 3 3JC Hey 12 11 - 31# - - - - - -GR Liebelt 12 12 - 22# - 2 2 - -J Paterson 12 11 35 30 - - 2 2 3 3DA Peever 12 11 - 26# 4 4 - - - 1#
FD Ryan 12 11 35 26 4 4 - - 3 3CM Walter 12 11 35 29 4 4 2 2 - -PJ Williams 12 12 35 33 4 4 - 1# 3 3
# Attended meetings by invitation.
Retirement, Election and Continuation in Office of DirectorsMessrs TA Campbell and GR Liebelt, having been re-elected and elected respectively by shareholders at the 2012 Annual General Meeting (AGM), will retire and, being eligible, will offer themselves for re-election at the forthcoming 2015 AGM. Mr FD Ryan will retire from the Board at the conclusion of the 2015 AGM.
Insurance of Directors and OfficersDuring the financial year, the Company paid insurance premiums to insure the Directors and Officers named in this report to the extent allowable by law. The terms of the insurance contract preclude disclosure of further details.
12 Australian Foundation Investment Company Limited Annual Report 2015
For
per
sona
l use
onl
y

REMUNERATION REPORT
ContentsThe Directors present AFIC’s 2015 Remuneration Report, which outlines key aspects of our remuneration policy and remuneration awarded this year. The report is structured as follows:
1. Remuneration Policy and Link to Performance2. Structure of Remuneration3. Executive Remuneration Expense and Outcomes4. Contract Terms5. Non-Executive Director Remuneration
AppendixA. Remuneration GovernanceB. Annual Incentives: Details of Outcomes and ConditionsC. Long Term Incentives: Details of Outcomes and ConditionsD. Directors and executives: Equity Holdings and Other TransactionsE. Performance Measures, Investment Company
1. Remuneration Policy and Link to Performance
1.1 What is Our Remuneration Policy?AFIC is an investor in securities listed primarily in Australia and New Zealand. Our primary objectives are to grow dividends at a faster rate than inflation and provide shareholders with capital growth over the medium to long term. To achieve this, we need to attract and retain professional, competent and highly motivated executives and staff through offering attractive remuneration arrangements which:
• reflect market conditions;
• recognise the skills, experience, roles, and responsibilities of the individuals;
• align with shareholder interests; and
• align with the risk management strategies.
Generally, we seek to set total remuneration at the upper or second quartile of the sectors in which we operate.
Remuneration for the Group’s executives has two main elements:
• fixed annual remuneration (FAR); and
• performance-related pay, being annual incentives and long term incentives (LTI).
FAR is determined with reference to levels necessary to recruit and retain staff with the relevant skills and experience in the industry in which the Group operates. We seek external input to ensure that the FAR meets these conditions. This includes industry data provided by the Financial Institutions Remuneration Group Inc (FIRG) and McLagan for the financial services industry.
13Australian Foundation Investment Company Limited Annual Report 2015
For
per
sona
l use
onl
y

REMUNERATION REPORT continued
Through performance-related pay, the remuneration is adjusted to reflect the risks that the Company and its shareholders face and how the Company has responded to those risks. In particular:
• The key performance indicators chosen to determine performance-related pay are those that the Company considers most relevant to its objectives of improving shareholder wealth over the medium to long term.
• The focus is on performance over the medium to long term with only a minor proportion of both annual incentives and LTI being dependent on a single year’s performance.
• Executives other than the Chief Information Officer (CIO) agree to invest 50 per cent of the annual cash incentive (after tax) in AFIC shares and shares of the other investment companies (including AMCIL Limited, Djerriwarrh Investments Limited and Mirrabooka Investments Limited) and to hold these shares for a minimum of two years. The CIO and other members of the investment team are encouraged to purchase shares in AFIC and the other investment companies.
The Remuneration Committee may, at its discretion, cancel any performance rights that are yet to vest or to be tested in the event of any negative issues that may arise, including material mis-statement of the Company’s financial statements.
1.2 What is Our Target Remuneration Mix?The target remuneration mix for executives is as follows:
1.3 How is the Remuneration Paid in 2015 Linked to Performance?Table 1 discloses the actual remuneration outcomes received by the Company’s executives during the year and the LTI that may vest in future years. These amounts are different to the statutory remuneration expense disclosed in Table 7. The Board considers the information about remuneration outcomes in Table 1 relevant for users because the statutory remuneration expense includes accounting charges for long term incentives that may or may not be received in future years. See below for details of the differences.
Managing Director’starget remuneration mix
Annual incentive ≈ 29%
Long term incentive ≈ 14%
Fixed annual remuneration ≈ 57%
Other executives’ target remuneration mix
Annual incentive ≈ 21%
Long term incentive ≈ 10%
Fixed annual remuneration ≈ 69%
Investment team’s target remuneration mix
Annual incentive ≈ 29%
Long term incentive ≈ 12%
Fixed annual remuneration ≈ 59%
14 Australian Foundation Investment Company Limited Annual Report 2015
For
per
sona
l use
onl
y

Table 1: Actual Executive Remuneration Outcomes Possible
Dividends Future LTIPrior on Unvested (to Vest
Annual Years’ LTI ELTIP Total LTI Over NextTotal FAR Other1 Incentive Received2 Shares Remuneration3 Forfeited Four Years)4
$ $ $ $ $ $ $ $Ross Barker – Managing Director2015 704,445 5,438 317,281 85,411 10,555 1,123,130 0 930,9212014 676,973 - 363,054 114,137 14,974 1,169,138 15,261 818,100Mark Freeman – Chief Investment Officer2015 800,000 - 338,800 151,570 - 1,290,370 0 601,3502014 780,000 - 398,520 182,420 - 1,360,940 0 616,730Andrew Porter – Chief Financial Officer2015 612,000 - 164,036 47,574 5,928 829,538 0 484,7142014 588,000 - 181,526 66,295 8,319 844,140 7,767 430,571Geoff Driver – General Manager – Business Development and Investor Relations 2015 505,000 - 134,760 35,408 4,634 679,802 0 389,3852014 490,000 - 146,324 48,442 6,387 691,153 6,060 341,040Simon Pordage – Company Secretary2015 376,000 - 101,096 11,959 2,489 491,544 0 268,9082014 365,000 - 109,714 8,335 2,776 485,825 0 217,591
1. Other relates to a refund of charges in respect of parking for 2015 and prior.
The value of LTI forfeited during the year in Table 1 was determined based on the closing price of AFIC shares on the last possible vesting date.The differences between the amounts disclosed in Table 1 and the amounts in Table 7 are as follows:2. Prior year’s LTI received in Table 1 shows the value of performance shares that vested during the year, measured at the closing price on the day that they
were received. In respect of the investment team, it shows the cash payment received during the year for the previous financial year. In contrast, Table 7 shows the accounting expense recognised in relation to the LTI plans during the year.
3. Total remuneration in Table 1 includes the amount of dividends paid to executives in relation to unvested Executive Long Term Incentive Plan (ELTIP) shares. For accounting purposes, the dividends are recognised as distributions in equity and not as an expense.
4. The future LTI in Table 1 reflects potential future remuneration that may be received by the executives over the next four years if the performance conditions are satisfied. This includes the performance shares that are yet to vest under the old ELTIP, valued at the closing price of AFIC shares as at 30 June 2015 (30 June 2014), plus the estimated amounts payable under the new ELTIP and the investment team LTI plan assuming the performance conditions will be satisfied at the time of vesting. For accounting purposes, these amounts are recognised as expense over the vesting period.
Information about Non-Executive Director remuneration is provided in section 5 Non-Executive Director Remuneration.
15Australian Foundation Investment Company Limited Annual Report 2015
For
per
sona
l use
onl
y

1.3.1 Fixed RemunerationMost executives received modest inflationary increases in their fixed annual remuneration this year. AFIC continues to operate in a highly competitive market, and salary levels are reviewed periodically with the aim of remunerating its executives to the extent required to attract and retain executives who are leaders in their field.
1.3.2 Performance-related PayThe tables in this section show:
• AFIC’s performance against annual incentive metrics for the executives (excluding the CIO). 28.5 per cent of the annual incentive that is determined by AFIC’s performance (Table 2). 14.5 per cent of the annual incentive for executives (other than the CIO) is based on the Company performance of the other investment companies (see Table 18). A further 20 per cent is based on personal objectives. The remaining 37 per cent of the annual incentives of executives (excluding the CIO) are assessed against investment returns from AFIC and the other investment companies (see Table 3 for AFIC and Table 18 for the other investment companies). See Table 5 for more details on what the measures are.
• Investment performance for AFIC against annual incentive metrics for both the executives and the investment team (Table 3).
• The outcomes for the two LTI awards that were tested for vesting during the year (Table 4).
Refer to sections 2.2 and 2.3 for explanations of the measures used.
The tables show that whilst the medium to long term targets (which are the primary focus) were achieved, the one year figures were not. The risk/reward performance figures over both three and five years also did not meet benchmark. This has resulted in over 10 per cent of the target annual incentive not being paid. AFIC’s returns are after taxes and expenses and represent the ‘net’ return to the shareholders, whereas index returns do not include either, and many returns quoted by managed funds exclude either tax or expenses, or both.
AFIC’s metrics were largely mirrored by the other investment companies, which bear part of the costs of employing the Group’s executives and staff (refer to section E in the Appendix for details). Mirrabooka outperformed on most of the metrics in both the short and the longer term, whilst Djerriwarrh (and AMCIL to a lesser extent) also underperformed on the shorter term metrics.
This is the third year of the new AFIC Executive Long Term Incentive Plan (LTIP). As it is a four year plan, no amounts have been paid out under it yet.
Executives did not receive all of their LTIP under the old plan this year. 37.5 per cent may still vest in July or August 2015, but the full targets were not achieved during the year (see Table 4). If the full targets are not achieved by August 2015, the shares will be forfeited.
For the investment team, the continued strong out-performance over time of AMCIL and Mirrabooka was offset in part by the in-line performance of AFIC and the underperformance of Djerriwarrh on a gross return (GR) basis. This resulted in 84 per cent of the LTIP vesting this year. Detailed information about the performance of each investment company is provided in section E of the Appendix (Table 18).
Table 2: Executive Team Performance (Excluding Investment Returns)Performance Measure Benchmark Result AFIC Result Comparison to BenchmarkTotal shareholder return (14.6 per cent)Share price return – one year 5.7% 2.8% Unfavourable Share price return – three years 15.1% 18.3% Favourable Share price return – five years 9.7% 9.9% Favourable Share price return – eight years 2.8% 5.4% Favourable Share price return – 10 years 7.1% 9.4% Favourable Growth in net operating result per share (8.3 per cent) 1.6% 11.8% Favourable Management expense ratio compared to base of 0.19 per cent (5.6 per cent) 0.19% 0.16% Favourable
Outcome Achieved Partially achieved Not achieved
REMUNERATION REPORT continued
16 Australian Foundation Investment Company Limited Annual Report 2015
For
per
sona
l use
onl
y

Table 3: Investment Team Performance (Including Investment Returns Used for Executives)Measure Benchmark Result AFIC Result Comparison to BenchmarkInvestment return – one year 5.7% 4.6% Unfavourable Investment return – three years 15.1% 15.1% Favourable Investment return – five years 9.7% 10.1% Favourable Investment return – eight years 2.8% 4.5% Favourable Investment return – 10 years 7.1% 8.4% Favourable Gross return – one year 6.8% 5.6% Unfavourable Gross return – three years 16.7% 16.8% Favourable Gross return – five years 11.3% 12.0% Favourable Gross return – eight years 4.2% 5.9% Favourable Gross return – 10 years 8.5% 9.8% Favourable Reward to risk – three years 1st qtr 91st/159 3rd qtr Unfavourable Reward to risk – five years 1st qtr 39th/137 2nd qtr Unfavourable Reward to risk – eight years 1st qtr 25th/113 1st qtr Favourable Reward to risk – 10 years 1st qtr 16th/87 1st qtr Favourable
Outcome Achieved Partially achieved Not achieved
Table 4: Vesting and Forfeiture of Long Term Incentives During The Year
Award DateAssessment
DatesMeasure
Tested 2015Benchmark
ResultAFIC
Result%
Vested %
ForfeitedOld ELTIP – performance shares1
25 August 2010 August 2014 – August 2015
Total shareholder return 9.46% 10.26% 25% -
Total portfolio return 10.99% (median)/12.22%
75th percentile
12.02% 37.5% -
Investment team LTI1 July 2011 30 June 2015 Gross return 10.8% 11.5% 84.2% 15.8%
1. Of the shares awarded in August 2010, 62.5 per cent of the total award had vested as at 30 June 2015. 37.5 per cent vested as the TPR was 12.02 per cent for four years at the end of August 2014, which was between the 62.5th and 75th percentile of the comparative Mercer Wholesale Equity Australia All-Cap universe. 25 per cent vested as the total shareholder return (TSR) for the four years and one month at the end of September 2014 was 10.26 per cent, which was 8.5 per cent above the comparative (S&P/ASX 200 9.46 per cent for the same period). 37.5 per cent of the award remains eligible for vesting until the end of August 2015.
2. Structure of Remuneration
2.1 Fixed Annual Remuneration (FAR)The FAR component of an executive’s remuneration comprises base salary, superannuation guarantee contributions and fringe benefits. Executives can elect to receive a portion of their FAR in the form of additional superannuation contributions or fringe benefits. This will not affect the gross amount payable by the Group. Dividends received by the executives in relation to unvested shares awarded under the old ELTIP are taken into account when setting remuneration levels.
2.2 Annual IncentivesThere are two annual incentive plans, one for the executives (excluding the CIO) and one for the investment team (including the CIO). As the roles and objectives of the Senior Executives and investment team are different, it is desirable to provide separate incentives to focus each team on the different business-critical measures they are able to impact. Table 5 below outlines the key terms and conditions.
17Australian Foundation Investment Company Limited Annual Report 2015
For
per
sona
l use
onl
y

REMUNERATION REPORT continued
Table 5: Annual Incentives – Key Terms and Conditions
Targeted % of FAR Managing Director50%
Other Executives30%
Investment Team50%
Objectives Align remuneration with the creation of shareholder wealth over the past year and over a longer period.
Choose measures that reflect the management of the Group and the other investment companies, as well as the key investment returns that reflect the creation of shareholder wealth.
Align remuneration with the outcomes of the Group’s investment objectives over a period of between one and 10 years.
Choose measures that are the key metrics for portfolio performance, and also include dividends paid and franking credits, as well as actual portfolio return and the risk profile of the investments.
Performance measures • Company performance (43 per cent): relative total shareholder return (movement in share price plus dividends paid and assumed to be reinvested) over the previous one, three, five, eight and 10 years, growth in net operating result and management expense ratio.
• Investment performance (37 per cent): relative investment return, gross return and risk/reward return, the same as for investment team (see on the right for details).
• Personal objectives (20 per cent).
• Investment return relative to S&P/ASX 200 Accumulation Index over the previous one, three, five, eight and 10 years.
• Gross return compared to S&P/ASX 200 Accumulation Index grossed up for franking credits over previous one, three, five, eight and 10 years.
• Risk and reward return compared to performance of peers over previous three, five, eight and 10 years.
• Income generation for current year (Djerriwarrh only).
• Qualitative measures: investment process and diversification of portfolio.
• Personal objectives.Relative weightings of investment companies for investment related performance
AFIC: 53 per cent
Djerriwarrh Investments Limited: 16 per cent
AMCIL Limited: 4 per cent
Mirrabooka Investments Limited: 7 per cent
Personal objectives: 20 per cent Delivery of award Incentive is paid in cash, but 50 per cent of the after tax amount
received is used by recipients to acquire shares in AFIC and the other investment companies which they agree to hold for minimum of two years.
Paid in cash or shares or combination of both, at the discretion of the Remuneration Committee.
Performance measured in 2015 Majority of measures achieved except for the one year measures and the shorter term risk reward measures (see Tables 2 and 3 above).
Majority of measures achieved except for the one year measures and the shorter term risk reward measures (see Tables 2 and 3 above).
Outcomes for 2015 (see Table 10 for details)
88.75 per cent Average 89.1 per cent 84.7 per cent (CIO)
The performance measures of each annual incentive plan are reviewed by the Remuneration Committee. The Committee may, from time to time, revise the performance conditions and weightings in order to better meet the objectives of the annual incentive policies. It may also change or suspend any part of the incentive payment arrangements. If relevant targets are not achieved but performance is close to the target, some of the incentive may be paid. This is noted as ‘partially achieved’ in Table 3. Where stretch levels of performance are achieved above target, then higher amounts may be paid. To date, total annual incentives paid to each executive have never exceeded target.
For more detailed information about the annual incentive performance conditions and outcomes for 2015, please refer to Section B Annual Incentives: Details of Outcomes and Conditions in the Appendix.
18 Australian Foundation Investment Company Limited Annual Report 2015
For
per
sona
l use
onl
y

2.3 Long Term Incentive Plans (LTIP)As for the annual incentives, there are also two LTI plans, one for the executives (excluding the CIO), which is called the ELTIP, and one for the investment team (including the CIO). A new ELTIP was introduced in 2012. Table 6 outlines the purpose and the key terms and conditions of each plan.
Table 6: Long Term Incentives – Key Terms and ConditionsExecutives New ELTIP (Performance Rights)
Old ELTIP (Performance Rights)
Investment Team LTI Plan
Target 50 per cent of targeted STI 50 per cent of gross amount awarded under STI Plan
20 per cent of FAR
Objectives Align remuneration with growth in shareholder wealth over a forward looking period of four years (four to five years for the old ELTIP). Reward out-performance.
Performance measures • Total gross shareholder return relative to S&P/ASX 200 Gross Accumulation Index – 50 per cent.
• Total portfolio return relative to median performance of comparable retail fund managers – 50 per cent.
Graded vesting for both, see Table 15 in the Appendix for details.
• Total shareholder return relative to S&P/ASX 200 Accumulation Index – 50 per cent.
• Total portfolio return relative to median performance of comparable retail fund managers – 50 per cent.
Graded vesting for both, see Table 15 in the Appendix for details.
Gross return for AFIC and the other investment companies, relative to relevant accumulation indices. Graded vesting depending on performance, see Table 15 in the Appendix for details.
Performance period Four years Four to five years Four yearsRetesting No retesting. First testing after four years,
then every month until the end of year five.
No retesting.
Entitlement to dividends during vesting period
No entitlement during vesting period.
Executives are entitled to dividends on unvested shares.
No entitlement.
Delivery Executives will be paid an amount of cash that is dependent on the original ELTIP amount granted and the Company’s TSR over the vesting period.
Executives must use the after tax amount of cash received to purchase AFIC shares on-market (no dilution to existing shareholders).
Executives are granted performance shares (ordinary share purchased on-market), which will vest if performance conditions are satisfied.
Paid in cash or shares, at the discretion of the Remuneration Committee.
Holding lock over shares acquired (where applicable)
None None None
Performance for awards tested in 2015 (Table 4)
n/a August 2010: 62.5 per cent vested in current year, 37.5 per cent still eligible for vesting (see Table 4).
July 2011: 84.2 per cent vested (see Table 4).
For more detailed information about the LTI plans and their performance conditions, including vesting schedules and outcomes for 2015, please refer to Section C Long Term Incentives: Details of Outcomes and Conditions in the Appendix.
19Australian Foundation Investment Company Limited Annual Report 2015
For
per
sona
l use
onl
y

REMUNERATION REPORT continued
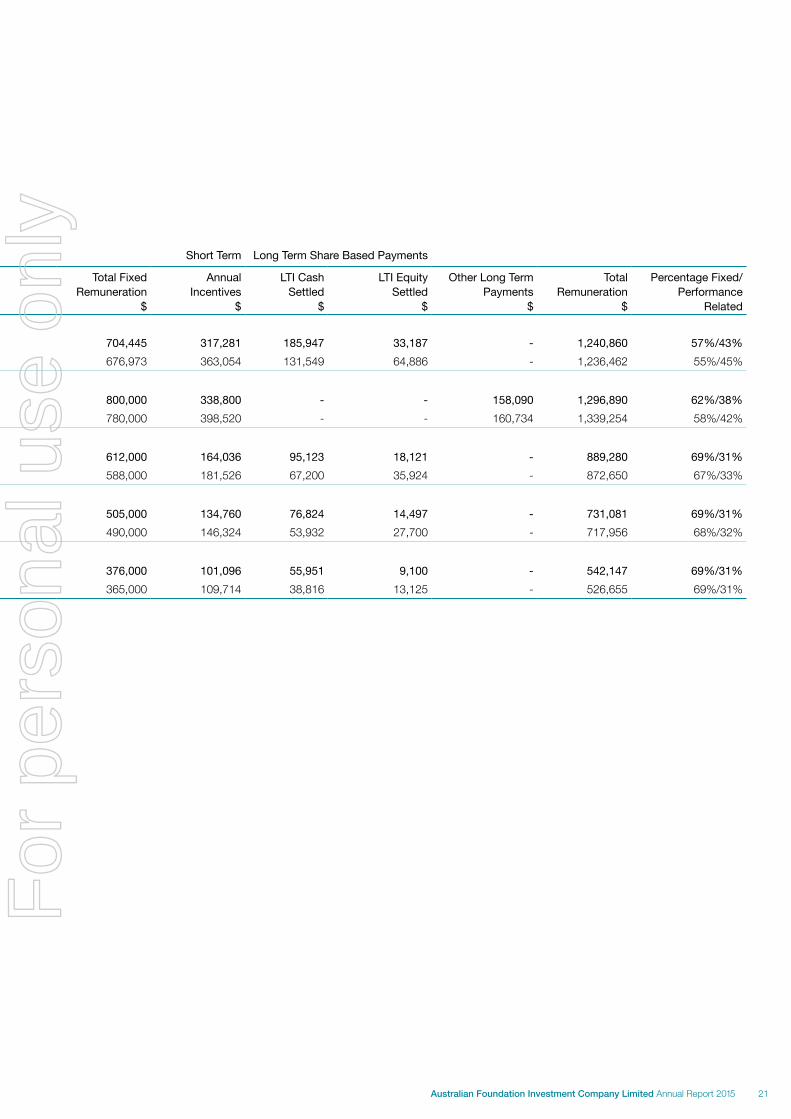
3. Executive Remuneration Expense and OutcomesThis section discloses the remuneration expense recognised under accounting standards for each executive (Table 7). These amounts are different to the remuneration outcomes disclosed in Table 1 as noted in that table.
Table 7: Remuneration ExpenseShort Term Short Term Short Term Post Employment Short Term Long Term Share Based Payments
Base Non-cash Total Fixed Annual LTI Cash LTI Equity Other Long Term Total Percentage Fixed/Salary Benefits1 Other2 Superannuation Remuneration Incentives Settled Settled Payments Remuneration Performance
$ $ $ $ $ $ $ $ $ $ RelatedRoss Barker – Managing Director2015 658,182 10,705 558 35,000 704,445 317,281 185,947 33,187 - 1,240,860 57%/43%2014 632,030 8,643 1,300 35,000 676,973 363,054 131,549 64,886 - 1,236,462 55%/45%
Mark Freeman – Chief Investment Officer2015 775,000 - - 25,000 800,000 338,800 - - 158,090 1,296,890 62%/38%2014 755,000 - - 25,000 780,000 398,520 - - 160,734 1,339,254 58%/42%
Andrew Porter – Chief Financial Officer2015 587,000 - - 25,000 612,000 164,036 95,123 18,121 - 889,280 69%/31%2014 565,083 - - 22,917 588,000 181,526 67,200 35,924 - 872,650 67%/33%
Geoff Driver – General Manager – Business Development and Investor Relations 2015 475,000 - - 30,000 505,000 134,760 76,824 14,497 - 731,081 69%/31%2014 465,000 - - 25,000 490,000 146,324 53,932 27,700 - 717,956 68%/32%
Simon Pordage – Company Secretary2015 357,217 - - 18,783 376,000 101,096 55,951 9,100 - 542,147 69%/31%2014 347,225 - - 17,775 365,000 109,714 38,816 13,125 - 526,655 69%/31%
1. Non-cash benefits relate to the provision of a car parking space. 2. Other relates to a refund of charges in respect of parking.
20 Australian Foundation Investment Company Limited Annual Report 2015
For
per
sona
l use
onl
y
3. Executive Remuneration Expense and OutcomesThis section discloses the remuneration expense recognised under accounting standards for each executive (Table 7). These amounts are different to the remuneration outcomes disclosed in Table 1 as noted in that table.
Table 7: Remuneration ExpenseShort Term Short Term Short Term Post Employment Short Term Long Term Share Based Payments
Base Non-cash Total Fixed Annual LTI Cash LTI Equity Other Long Term Total Percentage Fixed/Salary Benefits1 Other2 Superannuation Remuneration Incentives Settled Settled Payments Remuneration Performance
$ $ $ $ $ $ $ $ $ $ RelatedRoss Barker – Managing Director2015 658,182 10,705 558 35,000 704,445 317,281 185,947 33,187 - 1,240,860 57%/43%2014 632,030 8,643 1,300 35,000 676,973 363,054 131,549 64,886 - 1,236,462 55%/45%
Mark Freeman – Chief Investment Officer2015 775,000 - - 25,000 800,000 338,800 - - 158,090 1,296,890 62%/38%2014 755,000 - - 25,000 780,000 398,520 - - 160,734 1,339,254 58%/42%
Andrew Porter – Chief Financial Officer2015 587,000 - - 25,000 612,000 164,036 95,123 18,121 - 889,280 69%/31%2014 565,083 - - 22,917 588,000 181,526 67,200 35,924 - 872,650 67%/33%
Geoff Driver – General Manager – Business Development and Investor Relations 2015 475,000 - - 30,000 505,000 134,760 76,824 14,497 - 731,081 69%/31%2014 465,000 - - 25,000 490,000 146,324 53,932 27,700 - 717,956 68%/32%
Simon Pordage – Company Secretary2015 357,217 - - 18,783 376,000 101,096 55,951 9,100 - 542,147 69%/31%2014 347,225 - - 17,775 365,000 109,714 38,816 13,125 - 526,655 69%/31%
1. Non-cash benefits relate to the provision of a car parking space. 2. Other relates to a refund of charges in respect of parking.
21Australian Foundation Investment Company Limited Annual Report 2015
For
per
sona
l use
onl
y

4. Contract TermsEach executive is employed under an open-ended contract, the terms of which can be varied by mutual agreement. There is no provision for cessation of employment. Either the Company or the executive can give notice in accordance with statutory requirements (typically four weeks’ notice; this can be altered at the Board’s discretion but in no case to be more than 12 months). There are no specific payments to be made as a consequence of termination beyond those required by statute. Should there be any payments, these will be at the Board’s discretion.
Material breaches of the terms of employment will normally result in the termination of an executive’s employment.
5. Non-Executive Director RemunerationShareholders approve the maximum aggregate amount of remuneration per year to be allocated between Non-Executive Directors (NEDs) as they see fit. In proposing the amount for consideration by shareholders, the Remuneration Committee takes into account the time demands made on Directors together with such factors as the general level of fees paid to Australian corporate directors.
For NEDs charged with the responsibility of the oversight of the Company’s activities, a fixed annual fee is paid with no element of performance-related pay.
The amount approved at the AGM in October 2007 was $1,000,000 per annum, which is the maximum amount that may be paid in total to all NEDs. Retirement allowances for Directors were frozen at 30 June 2004.
NEDs do not receive any performance-based remuneration. On appointment, the Company enters into a deed of access and indemnity with each NED. There are no termination payments due at the cessation of office, and any Director may retire or resign from the Board, or be removed by a resolution of shareholders.
The amounts paid to each NED, and the figures for the corresponding period, are set out in Table 8.
REMUNERATION REPORT continued
22 Australian Foundation Investment Company Limited Annual Report 2015
For
per
sona
l use
onl
y

Table 8: Non-Executive Director RemunerationPrimary
(Fee/Base Salary)$
Post Employment(Superannuation)
$
TotalRemuneration
$TA Campbell AO – Chairman (from 9 October 2013)2015 155,251 14,749 170,0002014 131,218 12,138 143,356DR Argus AC – Non-Executive Director (retired 9 October 2013)2015 - - -2014 20,112 1,860 21,972JC Hey – Non-Executive Director (appointed 31 July 2013)2015 77,626 7,374 85,0002014 69,647 6,442 76,089GR Liebelt – Non-Executive Director2015 77,626 7,374 85,0002014 75,515 6,985 82,500J Paterson – Non-Executive Director2015 77,626 7,374 85,0002014 75,515 6,985 82,500DA Peever – Non-Executive Director (appointed 20 November 2013)2015 77,626 7,374 85,0002014 47,328 4,378 51,706FD Ryan AO – Non-Executive Director2015 50,000 35,000 85,0002014 54,920 27,580 82,500BB Teele – (Chairman until 9 October 2013, retired 9 October 2013)2015 - - -2014 40,224 4,646 44,870CM Walter AM – Non-Executive Director2015 77,626 7,374 85,0002014 75,515 6,985 82,500PJ Williams – Non-Executive Director2015 77,626 7,374 85,0002014 75,515 6,985 82,500Total Remuneration of Non-Executive Directors2015 671,007 93,993 765,0002014 665,509 84,984 750,493
Amounts Payable on RetirementThe amounts payable to the current NEDs who were in office at 30 June 2004, which will be paid when they retire, are set out in Table 9. These amounts were expensed in prior years as the retirement allowances accrued. It is expected that FD Ryan AO will retire during the year ended 30 June 2016. Should this occur, the amount owing as a retirement allowance of $66,329 will be paid to him. Neither of the other two NEDs listed below are expected to retire in the forthcoming year.
23Australian Foundation Investment Company Limited Annual Report 2015
For
per
sona
l use
onl
y

REMUNERATION REPORT continued
Table 9: Non-Executive Director Retirement AllowanceAmount Payable on Retirement $
TA Campbell AO 114,500FD Ryan AO 66,329CM Walter AM 42,385Total 223,214
AppendixA. Remuneration GovernanceResponsibilities of the Board and the Remuneration CommitteeThe Board’s primary responsibilities include:
• reviewing and approving the recommendations of the Remuneration Committee; and
• providing guidance to the Remuneration Committee where appropriate.
For more information, the Charter of the Board is available on the Company’s website.
The Remuneration Committee’s primary responsibilities include:
• reviewing the level of fees for NEDs and the Chairman;
• reviewing the Managing Director’s remuneration arrangements;
• evaluating the Managing Director’s performance;
• reviewing the remuneration arrangements for other Senior Executives;
• monitoring legislative developments with regards to executive remuneration; and
• ensures that the Group continues to comply with all requirements in this area.
For more information, the Charter of the Remuneration Committee is available on the Company’s website.
The Remuneration Committee is composed of four NEDs (GR Liebelt (Chairman), TA Campbell AO, J Paterson and CM Walter AM) and meets at least twice per year.
Policy on HedgingThe Company provides no lending or leveraging arrangements to its executives, who are prohibited by Company policy from entering into hedging arrangements that mitigate the possibility that ‘at risk’ incentive payments may not vest.
Use of Remuneration ConsultantsThe Remuneration Committee has approved the appointment of an independent consultant, Ernst & Young, to advise regarding executive and NED remuneration matters during the year.
Ernst & Young reports directly to the Remuneration Committee (where deemed necessary) and is engaged by it to review recommendations to the Remuneration Committee and provide independent advice to the Committee on:
(a) Proposed remuneration levels and remuneration structure for the Managing Director.
(b) Proposed remuneration levels and remuneration structure for the Managing Director’s direct reports.
(c) Proposed remuneration levels of NEDs.
24 Australian Foundation Investment Company Limited Annual Report 2015
For
per
sona
l use
onl
y

Ernst & Young provided no remuneration advice during the year.
The Board is satisfied that these arrangements ensure that any remuneration recommendations made by remuneration consultants are free from influence by management.
The use of the remuneration advisers by management is limited to specific areas to ensure that the independent advice that the Remuneration Committee receives is not perceived as having been compromised by management.
Ernst & Young is separately engaged by management to report on the following:
(a) trends in remuneration for the sectors in which the Group operates (provision of market practice data);
(b) the relative positioning of the remuneration of the Group’s employees (including executives) within those sectors;
(c) proposed remuneration levels for employees other than designated Senior Executives; and
(d) advice on the operation of the incentive plans (e.g. tax and accounting advice).
The Managing Director then makes recommendations to the Remuneration Committee with regards to the remuneration levels and structure of the executives.
Ernst & Young also reviews the calculations used in determining the vesting of awards and certifies them as being correct and in accordance with the terms and conditions of the LTI plan.
Ernst & Young was paid $6,628 during the year ended 30 June 2015 for general remuneration advice including confirmation of vesting calculations (2014: $26,569), and during the year the Group also paid $127,827 for other professional advice received, which included acting as the internal auditor for AICS and general taxation and accountancy advice (2014: $167,184) (all including GST).
Ernst & Young was remunerated on an invoiced basis, based on work performed.
The Company also participates in the annual McLagan and FIRG surveys of fund managers to understand current remuneration levels and practices.
B. Annual Incentives: Details of Outcomes and ConditionsTable 10 below shows the annual incentives paid to individual executives as a result of AFIC’s and the other investment companies’ performance on financial metrics and the individual’s achievement of their own personal objectives. Tables 11 and 12 set out the detailed terms and conditions of the annual incentives. For a high level summary, see section 2.2 and Table 5 of the main part of the Remuneration Report.
Table 10: Annual Incentive OutcomesExecutive Percentage of Target Paid $ Paid Percentage of Target Forfeited $ ForfeitedRoss Barker 89% $317,281 11% $40,219Andrew Porter 89% $164,036 11% $19,964Geoff Driver 89% $134,760 11% $16,740Simon Pordage 89% $101,096 11% $12,304Mark Freeman 85% $338,800 15% $61,200
25Australian Foundation Investment Company Limited Annual Report 2015
For
per
sona
l use
onl
y

Table 11: Executive Annual Incentive Performance ConditionsPerformance Areas and Relative Weighting Performance Measures Objectives These Measures Aim to AchieveCompany Performance (43 per cent)
The relevant weightings of the investment companies are:
• AFIC: 66.25 per cent• Djerriwarrh Investments Limited: 20 per cent• AMCIL Limited: 5 per cent• Mirrabooka Investments Limited: 8.75 per cent
• Relative total shareholder return (TSR): TSR is the movement in share price plus the dividends paid by the Company assumed to be reinvested. TSR performance is measured against the S&P/ASX 200 Accumulation Index over one, three, five, eight and 10 year periods (Combined Mid Cap 50 and Small Ordinaries for Mirrabooka).
• Growth in net profit per share: measured against CPI.
• Management expense ratio (MER): measured against prior years’ results or, in the case of AFIC, measured against a base of 0.19 per cent.
• TSR: this is a direct measure of the increase in shareholders’ wealth against the performance of the index.
• Growth in net profit per share reflects the ability of the Company to meet its stated aim of ‘paying out dividends which, over time, grow faster than the rate of inflation.’
• MER reflects the costs of running the Company.
Investment Performance (37 per cent)
The relevant weightings of the investment companies are:
• AFIC: 66.25 per cent• Djerriwarrh Investments Limited: 20 per cent• AMCIL Limited: 5 per cent• Mirrabooka Investments Limited: 8.75 per cent
• Relative investment return: measure of the return on the portfolio invested (including cash) over the previous one, three, five, eight and 10 years, relative to the S&P/ASX 200 Accumulation Index (Combined Mid Cap 50 and Small Ordinaries for Mirrabooka).
• Gross return (GR): measure of the movement in the net asset backing of the Company (per share) plus the dividends assumed to be reinvested grossed up for franking credits over the previous one, three, five, eight and 10 years. This return is compared to the S&P/ASX 200 Accumulation Index grossed up for franking credits (Combined Mid Cap 50 and Small Ordinaries for Mirrabooka).
• Risk/reward return: this is a measure over three, five, eight and 10 years of the past performance of the Company, compared to the performance of the Company’s peers (i.e. investment funds) as reported by Mercer. (Note: this measure is used for AFIC’s performance only, reflecting that Company’s focus on producing stable returns over the medium to long term).
The NEDs consider that the metrics used equate, over the medium to long term, with the stated objectives of the Company, namely ‘to provide attractive total returns and pay dividends, which, over time, grow faster than the rate of inflation’.
• Investment return: reflects the returns generated by the mix of the investments that the Company has invested in. These reflect the value added to shareholders wealth by the investment decisions of the Company.
• Gross return (GR): reflects the movement in the value of the underlying portfolio over the period with the additional recognition of the importance of franking credits.
• Risk/reward return: best reflects the return of the portfolio against the risks to shareholders of investing in the companies selected.
Note: the Remuneration Committee has discretion to determine, at the time of the review, what it considers to be the appropriate level of return to be used.
Personal objectives (20 per cent) Includes:• advice to the Board;• succession planning;• management of staff;• risk management;• promotion of the corporate culture; and• satisfaction of key internal stakeholders.
These measures all contribute to the efficient running of the Group and the other investment companies, enhancing investment outcomes.
Personal objectives are included in incentive calculations to encourage out-performance on non-financial metrics. These metrics can be important determinants of business success in the medium term. The Managing Director reviews the performance of each executive with the Remuneration Committee, and the Remuneration Committee alone determines how the Managing Director is performing against these objectives.
REMUNERATION REPORT continued
26 Australian Foundation Investment Company Limited Annual Report 2015
For
per
sona
l use
onl
y

Table 12: Investment Team Annual Incentive Performance ConditionsPerformance Areas and Relative Weighting Performance Measures Objectives These Measures Aim to AchieveInvestment return
The relevant weightings of the investment companies are:• AFIC: 66.25 per cent• Djerriwarrh Investments Limited: 20 per cent• AMCIL Limited: 5 per cent• Mirrabooka Investments Limited: 8.75 per cent
• Measure of the return on the portfolio invested (including cash) over the previous one, three, five, eight and 10 years. Measured relative to the S&P/ASX 200 Accumulation Index (Combined Mid Cap 50 and Small Ordinaries for Mirrabooka).
• Investment return reflects the returns generated by the mix of the investments that the Company has invested in. These reflect the value added to shareholders’ wealth by the investment decisions of the Company.
Gross return
The relevant weightings of the investment companies are:• AFIC: 66.25 per cent• Djerriwarrh Investments Limited: 20 per cent• AMCIL Limited: 5 per cent• Mirrabooka Investments Limited: 8.75 per cent
• Measure of the movement in the net asset backing of the Company (per share) plus the dividends assumed to be reinvested grossed up for franking credits over the previous one, three, five, eight and 10 years. This return is compared to the S&P/ASX 200 Accumulation Index grossed up for franking credits (Combined Mid Cap 50 and Small Ordinaries for Mirrabooka).
• Gross return reflects the movement in the value of the underlying portfolio over the period with the additional recognition of the importance of franking credits.
Risk/reward return
Note: this measure is used for AFIC’s performance only
• This is a measure over the previous three, five, eight and 10 years of Company performance. It is calculated by using the movement in the net asset backing of the Company (per share) plus the dividends reinvested divided by the standard deviation of the movement in the net asset backing of the Company (per share) plus the dividends reinvested over the same period.
This is compared to the performance of the Company’s peers (i.e. investment funds) as reported by Mercer.
• Risk/reward return best reflects the return of the portfolio against the risks to shareholders of investing in the companies selected, therefore aligning executives to shareholders.
Reflects AFIC’s focus on producing stable returns over the medium to long term.
Note: the Remuneration Committee has discretion to determine, at the time of the review, what it considers to be the appropriate level of return to be used.
Income generation • This is relevant for measuring Djerriwarrh Investments Limited’s operating earnings as a per cent of the average investable assets. It is a one year measure only, and measures the ability of the investment team to generate returns from the assets of Djerriwarrh Investments Limited. It is compared to the return generated in prior years.
• Reflects the objective for Djerriwarrh Investments Limited to create an enhanced income from its portfolio.
Qualitative measures • Investment process – including the identification of quality stocks.
• Diversifying the portfolio – for example, developing a ‘nursery’ of smaller potential growth stocks.
• These qualitative processes provide the opportunities for the future growth of the Company’s investments.
Personal objectives • Includes research, stock ideas, portfolio management, meeting participation, interaction with staff and presentation skills.
• Personal objectives are included in incentive calculations to encourage out-performance on non-financial metrics. These metrics can be important determinants of business success in the medium term. The Chief Investment Officer reviews the performance of each member of the investment team with the Managing Director and the Remuneration Committee.
C. Long Term Incentives: Details of Outcomes and ConditionsThis section shows a reconciliation of the performance shares outstanding under the old ELTIP award (Table 13) and the outstanding cash bonuses under the new ELTIP and the investment team LTI schemes (Table 14). It also explains the detailed terms and conditions of the three LTIs that are currently in operation (Table 15). For a high level overview, see section 2.3 of the main body of the Remuneration Report.
27Australian Foundation Investment Company Limited Annual Report 2015
For
per
sona
l use
onl
y

REMUNERATION REPORT continued
Table 13: Performance Shares Held by Executives (Old ELTIP)
Value Number Opening VestedClosing Balance Value Value
Maximum Value Yet
Year Granted Granted Granted Balance Current Year Forfeited (Yet to Vest) Forfeited1 Vested1 to Vest2
Ross Barker – Managing Director2011 $111,327 23,063 23,063 14,413 - 8,650 - $85,411 $52,9382012 $123,470 29,472 29,472 - - 29,472 - - $180,369Andrew Porter – Chief Financial Officer2011 $62,009 12,846 12,846 8,028 - 4,818 - $47,574 $29,4862012 $67,319 16,069 16,069 - - 16,069 - - $98,342Geoff Driver – General Manager – Business Development and Investor Relations2011 $46,152 9,561 9,561 5,975 - 3,586 - $35,408 $21,9462012 $54,144 12,924 12,924 - - 12,924 - - $79,095Simon Pordage – Company Secretary2011 $15,592 3,230 3,230 2,018 - 1,212 - $11,959 $7,4172012 $35,107 8,380 8,380 - - 8,380 - - $51,286
1. The dollar amounts shown are the market value of the shares vested at the date of vesting (for shares that vested) or at the last possible day of vesting (for those forfeited).
2. The dollar value yet to vest is calculated using AFIC’s share price as at 30 June 2015 ($6.12). The minimum value yet to vest is nil.
The grant and vesting dates for the performance shares that are yet to vest are:• Granted 25 August 2010, vesting: August 2014 – August 2015. Grant date value: $4.83.• Granted 22 August 2011, vesting: August 2015 – August 2016. Grant date value: $4.19.
The grant dates and percentages of the old ELTIP that vested during the year are disclosed in Table 4. They are the same for all executives.
Table 14: Vesting of New ELTIP and Investment Team LTI
New ELTIP Award DateVesting Date Subject to
Performance HurdlesValue at
Award Date
Number of Rights Awarded
Value Per Right
Value Yet to Vest 30 June 2015
Ross Barker – Managing Director 1 July 2012 30 June 2016 $173,000 42,126 $4.107 $289,4121 July 2013 30 June 2017 $182,000 33,562 $5.423 $222,7131 July 2014 30 June 2018 $178,750 29,707 $6.017 $185,489Andrew Porter – Chief Financial Officer 1 July 2012 30 June 2016 $88,970 21,664 $4.107 $148,8381 July 2013 30 June 2017 $92,000 16,965 $5.423 $112,5801 July 2014 30 June 2018 $92,000 15,290 $6.017 $95,468Geoff Driver – General Manager – Business Development and Investor Relations 1 July 2012 30 June 2016 $71,610 17,437 $4.107 $119,7961 July 2013 30 June 2017 $73,500 13,554 $5.423 $89,9421 July 2014 30 June 2018 $75,750 12,589 $6.017 $78,606Simon Pordage – Company Secretary 1 July 2012 30 June 2016 $50,250 12,236 $4.107 $84,0631 July 2013 30 June 2017 $55,000 10,142 $5.423 $67,3041 July 2014 30 June 2018 $56,700 9,423 $6.017 $58,838
28 Australian Foundation Investment Company Limited Annual Report 2015
For
per
sona
l use
onl
y
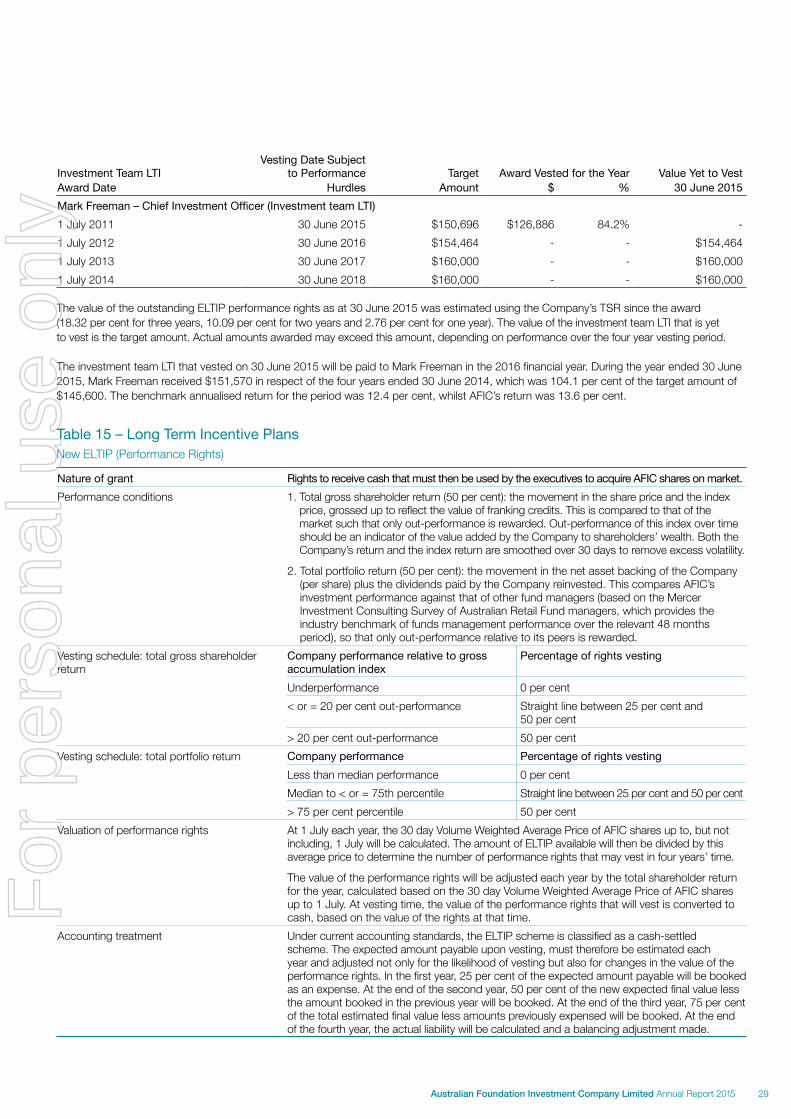
Investment Team LTIVesting Date Subject
to Performance Target Award Vested for the Year Value Yet to Vest Award Date Hurdles Amount $ % 30 June 2015Mark Freeman – Chief Investment Officer (Investment team LTI)1 July 2011 30 June 2015 $150,696 $126,886 84.2% -1 July 2012 30 June 2016 $154,464 - - $154,4641 July 2013 30 June 2017 $160,000 - - $160,0001 July 2014 30 June 2018 $160,000 - - $160,000
The value of the outstanding ELTIP performance rights as at 30 June 2015 was estimated using the Company’s TSR since the award (18.32 per cent for three years, 10.09 per cent for two years and 2.76 per cent for one year). The value of the investment team LTI that is yet to vest is the target amount. Actual amounts awarded may exceed this amount, depending on performance over the four year vesting period.
The investment team LTI that vested on 30 June 2015 will be paid to Mark Freeman in the 2016 financial year. During the year ended 30 June 2015, Mark Freeman received $151,570 in respect of the four years ended 30 June 2014, which was 104.1 per cent of the target amount of $145,600. The benchmark annualised return for the period was 12.4 per cent, whilst AFIC’s return was 13.6 per cent.
Table 15 – Long Term Incentive PlansNew ELTIP (Performance Rights)
Nature of grant Rights to receive cash that must then be used by the executives to acquire AFIC shares on market.Performance conditions 1. Total gross shareholder return (50 per cent): the movement in the share price and the index
price, grossed up to reflect the value of franking credits. This is compared to that of the market such that only out-performance is rewarded. Out-performance of this index over time should be an indicator of the value added by the Company to shareholders’ wealth. Both the Company’s return and the index return are smoothed over 30 days to remove excess volatility.
2. Total portfolio return (50 per cent): the movement in the net asset backing of the Company (per share) plus the dividends paid by the Company reinvested. This compares AFIC’s investment performance against that of other fund managers (based on the Mercer Investment Consulting Survey of Australian Retail Fund managers, which provides the industry benchmark of funds management performance over the relevant 48 months period), so that only out-performance relative to its peers is rewarded.
Vesting schedule: total gross shareholder return
Company performance relative to gross accumulation index
Percentage of rights vesting
Underperformance 0 per cent< or = 20 per cent out-performance Straight line between 25 per cent and
50 per cent> 20 per cent out-performance 50 per cent
Vesting schedule: total portfolio return Company performance Percentage of rights vestingLess than median performance 0 per centMedian to < or = 75th percentile Straight line between 25 per cent and 50 per cent> 75 per cent percentile 50 per cent
Valuation of performance rights At 1 July each year, the 30 day Volume Weighted Average Price of AFIC shares up to, but not including, 1 July will be calculated. The amount of ELTIP available will then be divided by this average price to determine the number of performance rights that may vest in four years’ time.
The value of the performance rights will be adjusted each year by the total shareholder return for the year, calculated based on the 30 day Volume Weighted Average Price of AFIC shares up to 1 July. At vesting time, the value of the performance rights that will vest is converted to cash, based on the value of the rights at that time.
Accounting treatment Under current accounting standards, the ELTIP scheme is classified as a cash-settled scheme. The expected amount payable upon vesting, must therefore be estimated each year and adjusted not only for the likelihood of vesting but also for changes in the value of the performance rights. In the first year, 25 per cent of the expected amount payable will be booked as an expense. At the end of the second year, 50 per cent of the new expected final value less the amount booked in the previous year will be booked. At the end of the third year, 75 per cent of the total estimated final value less amounts previously expensed will be booked. At the end of the fourth year, the actual liability will be calculated and a balancing adjustment made.
29Australian Foundation Investment Company Limited Annual Report 2015
For
per
sona
l use
onl
y

REMUNERATION REPORT continued
Investment Team LTI PlanNature of grant Cash or shares, at discretion of the Company. Performance condition Gross return, which measures the movement in the net asset backing of the Company
(per share), plus the dividends assumed to be reinvested grossed up for franking credits. This return is compared to the relevant accumulating index as set out below.
Indices that investment portfolios are assessed against
Investment portfolio Relevant accumulation index
AFIC (60 per cent) S&P/ASX 200 Accumulation Index, grossed up for franking credits
Djerriwarrh Investments Limited (25 per cent) S&P/ASX 200 Accumulation Index, grossed up for franking credits
Mirrabooka Investments Limited (10 per cent) S&P/ASX Mid Cap 50 Accumulation Index and the S&P/ASX Small Ordinaries Accumulation Index, grossed up for franking credits
AMCIL Limited (5 per cent) S&P/ASX 200 Accumulation Index, grossed up for franking credits
Vesting schedule: Company gross return Company performance relative to the relevant accumulation index
Percentage of rights vesting
< 90 per cent performance 0 per cent90 – 99 per cent performance Board discretion> 100 per cent up to 110 per cent performance
Straight line between 50 per cent and 100 per cent
> 110 per cent up to 120 per cent performance Straight line between 100 per cent and 150 per cent 120 per cent + performance 150 per cent
Previous ELTIP (Performance Shares)Nature of grant Performance shares that vest when the performance conditions are satisfied.Performance conditions 1. Total shareholder return (50 per cent) must outperform the S&P/ASX 200 Accumulation Index.
2. Total portfolio return (50 per cent) must outperform the median performance of comparable retail fund managers (based on the Mercer Investment Consulting Survey of Australian Retail Fund managers, which provides the industry benchmark of funds management performance over the relevant 48 to 60 month period).
Vesting schedule: total gross shareholder return
Company performance relative to gross accumulation index
Percentage of rights vesting
Underperformance 0 per cent< 10 per cent out-performance 25 per cent10 per cent to 20 per cent out-performance 37.5 per cent> 20 per cent out-performance 50 per cent
Vesting schedule – total portfolio return Company performance Percentage of rights vestingLess than median performance 0 per centMedian to <62.5th percentile 25 per cent62.5th percentile to <75th percentile 37.5 per cent> 75 per cent percentile 50 per cent
Vesting points and vesting period Four years after performance shares are granted to executives, performance is measured against the hurdles to determine what proportion of shares will vest, i.e. will be released to participants. This measurement point is called the vesting point. There are potentially 13 vesting points under the ELTIP, starting with the first test at the end of year four, and at each month end thereafter until the fifth year of the performance period.
Dividends Dividends are paid to the executives on performance shares prior to vesting, but are taken into account when setting the executive’s FAR.
Accounting treatment If the shares fail to vest because an employee ceases employment at any time prior to the vesting of the shares, or the total portfolio return is less than the median performance, the unvested shares will be cancelled and expenses recognised to date will be reversed. However, if the shares fail to vest because the TSR condition is not satisfied, the relevant expenses will continue to be recognised.
Reasons for change Although dividends received under unvested shares in the ELTIP were taken into account when assessing total remuneration, the Remuneration Committee decided that this should no longer occur. It was also considered that the multiple vesting periods may give an executive a greater likelihood of vesting than was considered to be best market practice. External advice was therefore sought in structuring a new plan that would continue to meet incentive objectives.
30 Australian Foundation Investment Company Limited Annual Report 2015
For
per
sona
l use
onl
y

D. Directors and Executives: Equity Holdings and Other TransactionsTables 16 and 17 set out reconciliations of shares and convertible notes issued by the Group and held directly, indirectly or beneficially by Non-Executive Directors and executives of the Group, or by entities to which they were related.
Table 16: Shareholdings of Directors and ExecutivesOpening Balance Changes During Year Closing Balance Subject to Vesting
TA Campbell 363,564 13,068 376,632 -RE Barker 867,995 15,045 883,040 38,122JC Hey 5,405 2,802 8,207 -GR Liebelt 59,250 87,393 146,643 -J Paterson 408,410 19,256 427,666 -DA Peever 1,730 7,150 8,880 -FD Ryan 86,767 - 86,767 -CM Walter 156,589 13,883 170,472 -PJ Williams 14,422 - 14,422 -GN Driver 118,960 4,362 123,322 16,510RM Freeman 127,777 4,461 132,238 -SM Pordage 26,339 3,133 29,472 9,592AJB Porter 136,291 5,307 141,598 20,887
Table 17: Holdings of 6.25 per cent 2017 Convertible NotesOpening Balance Changes During Year Closing Balance
RE Barker 250 - 250CM Walter 6,262 - 6,262J Paterson 4,500 1,375 5,875GN Driver 250 - 250
Other Arrangements with Non-Executive DirectorsNon-Executive Directors John Paterson and Catherine Walter have rented office space and, in some cases, a parking space from the Group at commercial rates during the year. Sub-lease rental income (included in revenue) received or receivable by the Group during the year was:
Rental Income Received/Receivable $
J Paterson 30,364CM Walter 16,883
E. Performance Measures by Investment CompanyTable 18 on the following page shows the performance of AFIC and the other investment companies over the past five years, including details of TSR, TPR and GR. These measures, which represent growth in shareholder wealth, determine the vesting of AFIC’s LTI plans to executives and the investment team.
31Australian Foundation Investment Company Limited Annual Report 2015
For
per
sona
l use
onl
y

REMUNERATION REPORT continued
Table 18: Detailed Performance Measures for AFIC and the Other Investment Companies
Year Ending 30 June10 Year Return
8 Year Return
5 Year Return
4 Year Return
3 Year Return 2015 2014 2013 2012 2011
Comparative returns
S&P/ASX 200 Accumulation Return 7.1% 2.8% 9.7% 9.2% 15.1% 5.7% 17.4% 22.8% -6.7% 11.7%
Gross S&P/ASX 200 Accumulation Return 8.5% 4.2% 11.3% 10.8% 16.7% 6.8% 19.2% 24.6% -5.2% 13.2%
Combined Mid Cap 50 and Small Ordinaries Accumulation Return (used for Mirrabooka Investments Limited) 3.9% -2.2% 5.2% 2.8% 9.0% 5.6% 16.9% 4.8% -13.6% 15.3%
Gross Combined Mid Cap 50 and Small Ordinaries Accumulation Return (used for Mirrabooka Investments Limited) 4.8% -1.3% 6.2% 3.8% 9.9% 6.3% 18.0% 5.9% -12.7% 16.3%
AFIC
Total shareholder return 9.4% 5.4% 9.9% 13.1% 18.3% 2.8% 17.9% 36.7% -1.1% -2.3%
Total portfolio return 7.9% 4.0% 10.0% 9.6% 14.9% 3.9% 17.3% 24.4% -4.8% 11.5%
Growth in net operating result per share 4.6% 1.8% 8.4% 4.9% 9.8% 11.8% 7.5% 13.2% -11.2% 23.9%
Management expense ratio n/a n/a n/a n/a n/a 0.16% 0.17% 0.18% 0.19% 0.17%
Risk/reward return1 16th/87 25th/113 39th/137 48th/147 91st/159 139th/176 36th/177 90th/175 25th/151 65th/137
Gross return 9.8% 5.9% 12.0% 11.5% 16.8% 5.6% 19.2% 26.5% -2.9% 13.5%
Investment return 8.4% 4.5% 10.1% 9.8% 15.1% 4.6% 17.0% 24.4% -4.7% 11.7%
Djerriwarrh Investments Limited
Total shareholder return 8.5% 5.6% 10.3% 12.1% 14.4% 5.2% 17.4% 21.2% 5.4% 3.3%
Total portfolio return 6.2% 2.1% 7.9% 7.1% 11.3% 0.2% 15.6% 19.0% -4.4% 10.9%
Growth in net operating profit per share -0.3% -3.3% 0.7% -4.4% 6.5% 10.8% 20.7% -8.4% -31.8% 23.9%
Management expense ratio n/a n/a n/a n/a n/a 0.41% 0.39% 0.39% 0.41% 0.38%
Gross return 9.2% 5.2% 11.3% 10.5% 14.7% 3.2% 19.1% 22.5% -1.3% 14.0%
Investment return 7.7% 4.3% 9.7% 9.1% 13.1% 2.8% 16.3% 21.1% -2.2% 12.0%
Operating earnings as a percentage of available investable assets n/a n/a n/a n/a n/a 7.9% 7.6% 6.9% 8.0% 10.1%
32 Australian Foundation Investment Company Limited Annual Report 2015
For
per
sona
l use
onl
y

Year Ending 30 June10 Year Return
8 Year Return
5 Year Return
4 Year Return
3 Year Return 2015 2014 2013 2012 2011
Mirrabooka Investments Limited
Total shareholder return 11.0% 6.7% 15.6% 15.5% 20.0% 4.3% 21.2% 36.6% 2.8% 16.2%
Total portfolio return 8.7% 4.0% 12.5% 11.7% 14.6% 3.1% 22.8% 18.9% 3.5% 15.8%
Growth in net operating result per share -1.1% -6.3% -0.7% -7.2% -6.7% -10.0% -7.0% -1.6% -10.0% 30.0%
Management expense ratio n/a n/a n/a n/a n/a 0.67% 0.64% 0.70% 0.79% 0.79%
Gross return 11.2% 6.7% 15.5% 14.8% 17.9% 6.8% 26.4% 21.2% 5.7% 18.2%
Investment return 11.8% 7.0% 15.4% 14.7% 18.4% 6.5% 26.5% 23.1% 4.5% 17.9%
AMCIL Limited
Total shareholder return 12.1% 7.8% 13.7% 14.5% 14.6% -0.9% 22.7% 23.6% 14.1% 10.8%
Total portfolio return 12.1% 6.3% 10.9% 10.2% 12.4% 2.2% 14.7% 21.1% 4.0% 13.6%
Growth in net operating result per share 4.7% -1.4% 2.3% -4.4% 2.6% 4.3% -9.6% 14.8% -22.6% 33.6%
Management expense ratio n/a n/a n/a n/a n/a 0.67% 0.65% 0.77% 0.84% 0.80%
Gross return 14.3% 8.6% 13.3% 12.9% 15.3% 5.1% 18.8% 22.5% 5.9% 14.8%
Investment return 14.0% 8.4% 13.3% 12.6% 15.3% 3.9% 17.9% 25.3% 4.8% 16.1%
1. This represents the Company’s ranking in the Mercer IDPS Australian Share Universe – i.e. 10th out of 71 funds. The period used is year to May.
33Australian Foundation Investment Company Limited Annual Report 2015
For
per
sona
l use
onl
y

NON-AUDIT SERVICES
Details of non-audit services performed by the auditors may be found in Note F2 of the Financial Report.
The Board of Directors has considered the position and, in accordance with the advice received from the Audit Committee, is satisfied that the provision of the non-audit services is compatible with the general standard of independence for auditors imposed by the Corporations Act 2001. The Directors are satisfied that the provision of non-audit services by the auditor, as set out below, did not compromise the auditor independence requirements of the Corporations Act 2001 for the following reasons:
• all non-audit services have been reviewed by the Audit Committee to ensure they do not impact the impartiality and objectivity of the auditor; and
• none of the services undermine the general principles relating to auditor independence as set out in the Corporations Act 2001 including reviewing or auditing the auditor’s own work, acting in a management or a decision-making capacity for the Company, acting as advocate for the Company, or jointly sharing economic risk and rewards.
A copy of the Auditors Independence Declaration is set out on page 35.
This report is made in accordance with a resolution of the Directors.
Terrence Campbell AOChairman
Melbourne 20 July 2015
34 Australian Foundation Investment Company Limited Annual Report 2015
For
per
sona
l use
onl
y

AUDITOR’S INDEPENDENCE DECLARATION
35Australian Foundation Investment Company Limited Annual Report 2015
For
per
sona
l use
onl
y
FINANCIAL STATEMENTS CONTENTS
37 Consolidated Financial Statements37 Consolidated Income Statement 38 Consolidated Statement of
Comprehensive Income39 Consolidated Balance Sheet40 Consolidated Statement of
Changes in Equity42 Consolidated Cash Flow Statement
43 Notes to the Financial Statements43 A. Understanding AFIC’s Financial
Performance43 A1. How AFIC Manages its Capital43 A2. Investments Held and How
They are Measured45 A3. Operating Income46 A4. Dividends Paid47 A5. Earnings Per Share
48 B. Costs, Tax and Risk48 B1. Management Costs48 B2. Tax50 B3. Risk
52 C. Unrecognised Items52 C1. Contingencies
53 Additional Information53 D. Balance Sheet Reconciliations53 D1. Current Assets – Cash53 D2. Credit Facilities54 D3. Convertible Notes54 D4. Revaluation Reserve54 D5. Realised Capital Gains Reserve54 D6. Retained Profits55 D7. Share Capital
56 E. Income Statement Reconciliations56 E1. Reconciliation of Net Cash Flows from
Operating Activities to Profit56 E2. Tax Reconciliations
57 F. Other Information57 F1. Related Parties58 F2. Remuneration of Auditors58 F3. Segment Reporting59 F4. Summary of Significant Accounting
Policies not Previously Disclosed62 F5. Performance Bond62 F6. Share Based Payments65 F7. Lease Commitments65 F8. Principles of Consolidation66 F9. Subsidiaries66 F10. Parent Entity Financial Information
Australian Foundation Investment Company Limited Annual Report 201536
For
per
sona
l use
onl
y

Note2015
$’0002014 $’000
Dividends and distributions A3 317,762 275,793Revenue from deposits and bank bills 3,425 4,898Other revenue A3 4,461 4,208Total revenue 325,648 284,899
Net gains on trading portfolio and non-equity investments A3 8,440 9,945Income from operating activities 334,088 294,844
Finance costs (15,757) (20,525)Administration expenses B1 (14,867) (14,122)Profit before income tax expense 303,464 260,197
Income tax expense B2, E2 (9,860) (5,904)
Profit for the year 293,604 254,293
Profit is attributable to:Equity holders of Australian Foundation Investment Company Ltd 293,503 254,213Minority interest 101 80
293,604 254,293
Cents CentsBasic earnings per share A5 27.23 24.35Diluted earnings per share A5 27.11 24.32
This Income Statement should be read in conjunction with the accompanying notes.
FINANCIAL STATEMENTS
CONSOLIDATED INCOME STATEMENTFor the year ended 30 June 2015
37Australian Foundation Investment Company Limited Annual Report 2015
For
per
sona
l use
onl
y

CONSOLIDATED STATEMENT OF COMPREHENSIVE INCOMEFor the year ended 30 June 2015
Year to 30 June 2015 Year to 30 June 2014Revenue1 Capital1 Total Revenue1 Capital1 Total
$’000 $’000 $’000 $’000 $’000 $’000Profit for the year 293,650 (46) 293,604 254,220 73 254,293
Other comprehensive incomeItems that will not be recycled through the Income StatementGains/(losses) for the period - (23,281) (23,281) - 665,894 665,894Deferred tax expense on above - (3,122) (3,122) - (200,411) (200,411)Items that may be recycled through the Income StatementGross movement in fair value for interest rate swaps - 401 401 - 1,731 1,731Tax expense on above - (120) (120) - (519) (519)Total other comprehensive income2 - (26,122) (26,122) - 466,695 466,695
Total comprehensive income 293,650 (26,168) 267,482 254,220 466,768 720,988
1. ‘Capital’ includes realised or unrealised gains or losses (and the tax on those) on securities in the investment portfolio, including non-equity investments held in the investment portfolio. Income in the form of distributions and dividends is recorded as ‘revenue’. All other items, including expenses, are included in profit for the year, which is categorised under ‘revenue’.
2. Total tax movement in other comprehensive income: 2015: $(3.2) million; 2014: ($200.9) million.
Year to 30 June 2015 Year to 30 June 2014Revenue Capital Total Revenue Capital Total
$’000 $’000 $’000 $’000 $’000 $’000Total comprehensive income is attributable to:Equity holders of Australian Foundation Investment Company Ltd 293,549 (26,168) 267,381 254,140 466,768 720,908Minority interests 101 - 101 80 - 80
293,650 (26,168) 267,482 254,220 466,768 720,988
This Statement of Comprehensive Income should be read in conjunction with the accompanying notes.
38 Australian Foundation Investment Company Limited Annual Report 2015
For
per
sona
l use
onl
y

CONSOLIDATED BALANCE SHEETAs at 30 June 2015
Note2015
$’0002014$’000
Current assetsCash D1 163,840 69,084Receivables 46,059 65,758Trading portfolio 1,930 -Total current assets 211,829 134,842
Non-current assetsFixtures and fittings - 76Investment portfolio A2 6,412,242 6,326,268Deferred tax assets 527 864Total non-current assets 6,412,769 6,327,208
Total assets 6,624,598 6,462,050
Current liabilitiesPayables 10,783 6,128Tax payable 30,050 13,419Borrowings D2 - 100,000Trading portfolio - 1,980Provisions 3,409 3,213Interest rate hedging contracts - 281Total current liabilities 44,242 125,021
Non-current liabilitiesProvisions 1,508 1,089Convertible notes D3 202,252 203,779Deferred tax liabilities – investment portfolio B2 930,152 948,009Total non-current liabilities 1,133,912 1,152,877
Total liabilities 1,178,154 1,277,898
Net assets 5,446,444 5,184,152
Shareholders’ equityShare capital A1, D7 2,301,232 2,064,936Revaluation reserve A1, D4 2,152,455 2,253,053Realised capital gains reserve A1, D5 391,773 317,624General reserve A1 23,637 23,637Interest rate hedging reserve A1 - (281)Retained profits A1, D6 576,382 524,319Parent entity interest 5,445,479 5,183,288Minority interest 965 864Total equity 5,446,444 5,184,152
This Balance Sheet should be read in conjunction with the accompanying notes.
39Australian Foundation Investment Company Limited Annual Report 2015
For
per
sona
l use
onl
y

Share Capital
Revaluation Reserve
Realised Capital Gains
General Reserve
Interest Rate Hedging
Retained Profits
Total Parent Entity
Minority Interest Total
Year Ended 30 June 2015 Note $’000 $’000 $’000 $’000 $’000 $’000 $’000 $’000 $’000Total equity at the beginning of the year 2,064,936 2,253,053 317,624 23,637 (281) 524,319 5,183,288 864 5,184,152
Dividends paid A4 - - - - - (241,486) (241,486) - (241,486)Shares issued – Dividend Reinvestment Plan D7 49,724 - - - - - 49,724 - 49,724Shares issued – Share Purchase Plan D7 184,671 - - - - - 184,671 - 184,671Shares issued – conversion of notes D7 2,423 - - - - - 2,423 - 2,423Other share capital adjustments (522) - - - - - (522) - (522)Total transactions with shareholders 236,296 - - - - (241,486) (5,190) - (5,190)
Profit for the year - (46) - - - 293,549 293,503 101 293,604
Other comprehensive income (net of tax)Net losses for the period - (26,403) - - - - (26,403) - (26,403)Net movement in fair value of swap contracts - - - - 281 - 281 - 281Other comprehensive income for the year - (26,403) - - 281 - (26,122) - (26,122)Transfer to realised capital gains of cumulative gains on investments sold - (74,149) 74,149 - - - - - -
Total equity at the end of the year 2,301,232 2,152,455 391,773 23,637 - 576,382 5,445,479 965 5,446,444
Share Capital
Revaluation Reserve
Realised Capital Gains
General Reserve
Interest Rate Hedging
Retained Profits
Total Parent Entity
Minority Interest Total
Year Ended 30 June 2014 Note $’000 $’000 $’000 $’000 $’000 $’000 $’000 $’000 $’000Total equity at the beginning of the year 2,002,128 1,801,692 334,243 23,637 (1,493) 465,701 4,625,908 784 4,626,692
Dividends paid A4 - - (30,814) - - (195,522) (226,336) - (226,336)Shares issued – Dividend Reinvestment Plan D7 46,064 - - - - - 46,064 - 46,064Shares issued – conversion of notes D7 16,660 - - - - - 16,660 - 16,660Other share capital adjustments 84 - - - - - 84 - 84Total transactions with shareholders 62,808 - (30,814) - - (195,522) (163,528) - (163,528)
Profit for the year - 73 - - - 254,140 254,213 80 254,293
Other comprehensive income (net of tax)Net gains for the period - 465,483 - - - - 465,483 - 465,483Net movement in fair value of swap contracts - - - - 1,212 - 1,212 - 1,212Other comprehensive income for the year - 465,483 - - 1,212 - 466,695 - 466,695Transfer to realised capital gains of cumulative gains on investments sold - (14,195) 14,195 - - - - - -
Total equity at the end of the year 2,064,936 2,253,053 317,624 23,637 (281) 524,319 5,183,288 864 5,184,152
This Statement of Changes in Equity should be read in conjunction with the accompanying notes.
CONSOLIDATED STATEMENT OF CHANGES IN EQUITYFor the year ended 30 June 2015
40 Australian Foundation Investment Company Limited Annual Report 2015
For
per
sona
l use
onl
y

Share Capital
Revaluation Reserve
Realised Capital Gains
General Reserve
Interest Rate Hedging
Retained Profits
Total Parent Entity
Minority Interest Total
Year Ended 30 June 2015 Note $’000 $’000 $’000 $’000 $’000 $’000 $’000 $’000 $’000Total equity at the beginning of the year 2,064,936 2,253,053 317,624 23,637 (281) 524,319 5,183,288 864 5,184,152
Dividends paid A4 - - - - - (241,486) (241,486) - (241,486)Shares issued – Dividend Reinvestment Plan D7 49,724 - - - - - 49,724 - 49,724Shares issued – Share Purchase Plan D7 184,671 - - - - - 184,671 - 184,671Shares issued – conversion of notes D7 2,423 - - - - - 2,423 - 2,423Other share capital adjustments (522) - - - - - (522) - (522)Total transactions with shareholders 236,296 - - - - (241,486) (5,190) - (5,190)
Profit for the year - (46) - - - 293,549 293,503 101 293,604
Other comprehensive income (net of tax)Net losses for the period - (26,403) - - - - (26,403) - (26,403)Net movement in fair value of swap contracts - - - - 281 - 281 - 281Other comprehensive income for the year - (26,403) - - 281 - (26,122) - (26,122)Transfer to realised capital gains of cumulative gains on investments sold - (74,149) 74,149 - - - - - -
Total equity at the end of the year 2,301,232 2,152,455 391,773 23,637 - 576,382 5,445,479 965 5,446,444
Share Capital
Revaluation Reserve
Realised Capital Gains
General Reserve
Interest Rate Hedging
Retained Profits
Total Parent Entity
Minority Interest Total
Year Ended 30 June 2014 Note $’000 $’000 $’000 $’000 $’000 $’000 $’000 $’000 $’000Total equity at the beginning of the year 2,002,128 1,801,692 334,243 23,637 (1,493) 465,701 4,625,908 784 4,626,692
Dividends paid A4 - - (30,814) - - (195,522) (226,336) - (226,336)Shares issued – Dividend Reinvestment Plan D7 46,064 - - - - - 46,064 - 46,064Shares issued – conversion of notes D7 16,660 - - - - - 16,660 - 16,660Other share capital adjustments 84 - - - - - 84 - 84Total transactions with shareholders 62,808 - (30,814) - - (195,522) (163,528) - (163,528)
Profit for the year - 73 - - - 254,140 254,213 80 254,293
Other comprehensive income (net of tax)Net gains for the period - 465,483 - - - - 465,483 - 465,483Net movement in fair value of swap contracts - - - - 1,212 - 1,212 - 1,212Other comprehensive income for the year - 465,483 - - 1,212 - 466,695 - 466,695Transfer to realised capital gains of cumulative gains on investments sold - (14,195) 14,195 - - - - - -
Total equity at the end of the year 2,064,936 2,253,053 317,624 23,637 (281) 524,319 5,183,288 864 5,184,152
This Statement of Changes in Equity should be read in conjunction with the accompanying notes.
41Australian Foundation Investment Company Limited Annual Report 2015
For
per
sona
l use
onl
y

CONSOLIDATED CASH FLOW STATEMENTFor the year ended 30 June 2015
Note
2015$’000
Inflows/(Outflows)
2014$’000
Inflows/ (Outflows)
Cash flows from operating activitiesSales from trading portfolio 41,909 77,672Purchases for trading portfolio (32,297) -Interest received 3,680 5,886Dividends and distributions received 309,469 244,715
322,761 328,273
Other receipts 4,467 4,213Administration expenses (14,903) (13,669)Finance costs paid (14,993) (19,830)Income taxes paid (13,677) (4,616)Net cash inflow/(outflow) from operating activities E1 283,655 294,371
Cash flows from investing activitiesSales from investment portfolio 244,676 175,794Purchases for investment portfolio (325,949) (477,264)Net cash inflow/(outflow) from investing activities (81,273) (301,470)
Cash flows from financing activitiesRepayment of borrowings (100,000) -Proceeds from share issues 184,671 -Share issue transaction costs (597) (57)Dividends paid (191,700) (180,200)Net cash inflow/(outflow) from financing activities (107,626) (180,257)
Net increase/(decrease) in cash held 94,756 (187,356)Cash at the beginning of the year 69,084 256,440Cash at the end of the year D1 163,840 69,084
For the purpose of the Cash Flow Statement, ‘cash’ includes cash and deposits held at call.
This Cash Flow Statement should be read in conjunction with the accompanying notes.
42 Australian Foundation Investment Company Limited Annual Report 2015
For
per
sona
l use
onl
y

NOTES TO THE FINANCIAL STATEMENTS
A. Understanding AFIC’s Financial Performance
A1. How AFIC Manages its CapitalAFIC’s objective is to provide shareholders with attractive investment returns through access to a steady stream of fully franked dividends and enhancement of capital invested.
AFIC recognises that its capital will fluctuate with market conditions. In order to manage those fluctuations, the Board may adjust the amount of dividends paid, issue new shares, buy back the Company’s shares or sell assets to settle any debt.
AFIC’s capital consists of its shareholders’ equity plus any net borrowings. A summary of the balances in equity is provided below:2015
$’0002014 $’000
Share capital 2,301,232 2,064,936Revaluation reserve 2,152,455 2,253,053Realised capital gains 391,773 317,624General reserve 23,637 23,637Interest rate hedging reserve - (281)Retained profits 576,382 524,319
5,445,479 5,183,288
Refer to Notes D4– D7 for a reconciliation of movement from period to period for each equity account (except the general reserve, which is historical and relates to past profits that can be distributed and has had no movement, and the interest rate hedging reserve).
A2. Investments Held and How They Are MeasuredAFIC has two portfolios of securities: the investment portfolio and the trading portfolio.
The investment portfolio holds securities that the Company intends to retain on a long term basis, and includes a small sub-component over which options may be written. The trading portfolio consists of securities that are held for short term trading only, including option contracts written over securities that are held in the specific sub-component of the investment portfolio, and is relatively small in size. The Board has therefore focused the information in this section on the investment portfolio.
The balance and composition of the investment portfolio was:2015
$’0002014 $’000
Equity instruments (excluding below) at market value 6,248,944 6,179,489Equity instruments (over which options may be written) 148,845 131,824Hybrids 11,788 12,225Convertible notes that are classified as debt 2,665 2,730
6,412,242 6,326,268
How Investments Are Shown in the Financial StatementsThe accounting standards set out the following hierarchy for fair value measurement:
Level 1: Quoted prices in active markets for identical assets or liabilities.
Level 2: Inputs other than quoted prices, which can be observed either directly (as prices) or indirectly (derived from prices).
Level 3: Inputs for the asset or liabilities that are not based on observable market data.
All financial instruments held by AFIC are classified as Level 1 (other than the options sold by the Company, which are Level 2). Their fair values are initially measured at the costs of acquisition and then remeasured based on quoted market prices at the end of the reporting period.
43Australian Foundation Investment Company Limited Annual Report 2015
For
per
sona
l use
onl
y
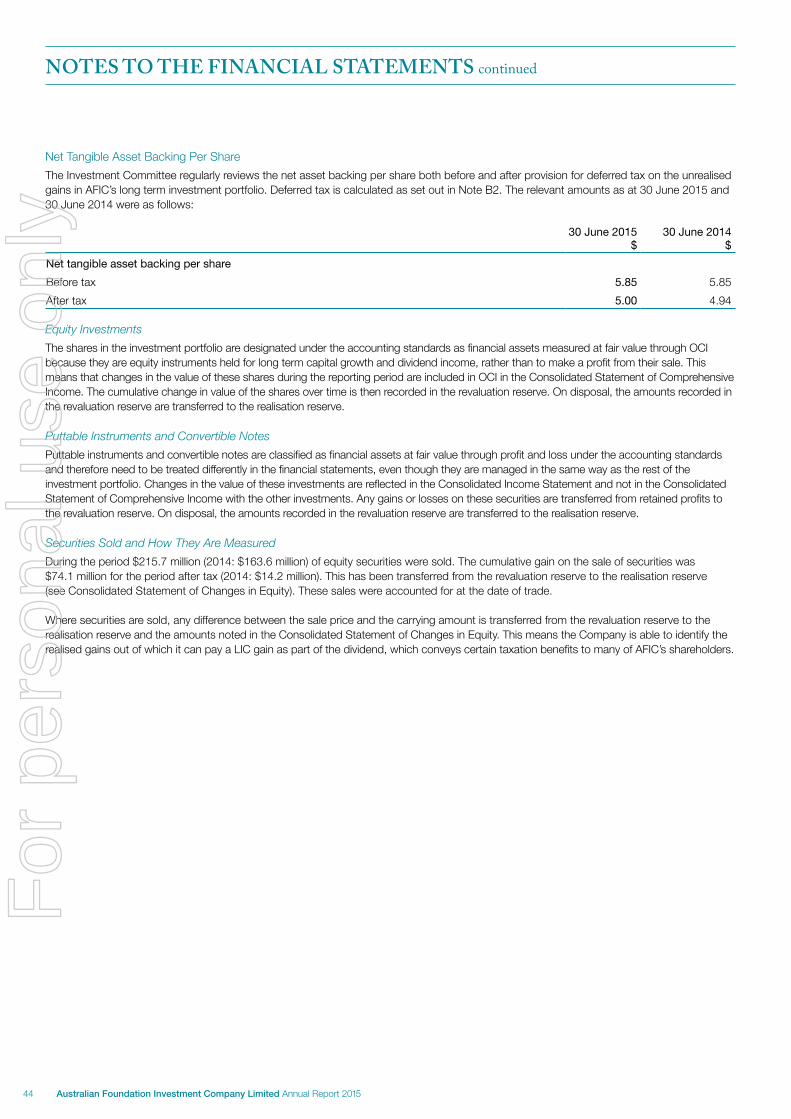
NOTES TO THE FINANCIAL STATEMENTS continued
Net Tangible Asset Backing Per ShareThe Investment Committee regularly reviews the net asset backing per share both before and after provision for deferred tax on the unrealised gains in AFIC’s long term investment portfolio. Deferred tax is calculated as set out in Note B2. The relevant amounts as at 30 June 2015 and 30 June 2014 were as follows:
30 June 2015 $
30 June 2014 $
Net tangible asset backing per shareBefore tax 5.85 5.85After tax 5.00 4.94
Equity InvestmentsThe shares in the investment portfolio are designated under the accounting standards as financial assets measured at fair value through OCI because they are equity instruments held for long term capital growth and dividend income, rather than to make a profit from their sale. This means that changes in the value of these shares during the reporting period are included in OCI in the Consolidated Statement of Comprehensive Income. The cumulative change in value of the shares over time is then recorded in the revaluation reserve. On disposal, the amounts recorded in the revaluation reserve are transferred to the realisation reserve.
Puttable Instruments and Convertible NotesPuttable instruments and convertible notes are classified as financial assets at fair value through profit and loss under the accounting standards and therefore need to be treated differently in the financial statements, even though they are managed in the same way as the rest of the investment portfolio. Changes in the value of these investments are reflected in the Consolidated Income Statement and not in the Consolidated Statement of Comprehensive Income with the other investments. Any gains or losses on these securities are transferred from retained profits to the revaluation reserve. On disposal, the amounts recorded in the revaluation reserve are transferred to the realisation reserve.
Securities Sold and How They Are MeasuredDuring the period $215.7 million (2014: $163.6 million) of equity securities were sold. The cumulative gain on the sale of securities was $74.1 million for the period after tax (2014: $14.2 million). This has been transferred from the revaluation reserve to the realisation reserve (see Consolidated Statement of Changes in Equity). These sales were accounted for at the date of trade.
Where securities are sold, any difference between the sale price and the carrying amount is transferred from the revaluation reserve to the realisation reserve and the amounts noted in the Consolidated Statement of Changes in Equity. This means the Company is able to identify the realised gains out of which it can pay a LIC gain as part of the dividend, which conveys certain taxation benefits to many of AFIC’s shareholders.
44 Australian Foundation Investment Company Limited Annual Report 2015
For
per
sona
l use
onl
y

A3. Operating IncomeThe total income received from AFIC’s investments in 2015 is set out below.
2015 $’000
2014 $’000
Dividends from securities held in investment portfolio at 30 June 314,066 272,317Income from investment securities sold during the year 3,449 2,608Dividends from securities held in trading portfolio at 30 June - -Interest income from securities in investment portfolio 247 246Income from trading and non-equity securities sold during the year - 622
317,762 275,793
Interest incomeIncome from cash investments 3,425 4,898Other incomeAdministration fees 4,403 4,204Other income 58 4
4,461 4,208
Dividend IncomeDistributions from listed securities are recognised as income when those securities are quoted in the market on an ex-distribution basis. Capital returns on ordinary shares are treated as an adjustment to the carrying value of the shares.
Trading Income and Non-equity InvestmentsNet gains on the trading and options portfolio are set out below.
2015 $’000
2014 $’000
Net gainsNet realised gains from trading portfolio – shares 4,101 4,321 – options 3,533 5,190Unrealised gains from trading portfolio – shares 12 - – options 859 330Unrealised gains/(losses) from non-equity investments (65) 104
8,440 9,945
$119.3 million of shares are lodged with the ASX Clear Pty Ltd as collateral for sold option positions written by the Group (2014: $126.5 million). These shares are lodged with ASX Clear under the terms of ASX Clear Pty Ltd, which require participants in the exchange traded option market to lodge collateral, and are recorded as part of the Group’s investment portfolio. If all call options were exercised, this would lead to the sale of $60.7 million worth of securities at an agreed price – the ‘exposure’ (2014: $79.9 million).
45Australian Foundation Investment Company Limited Annual Report 2015
For
per
sona
l use
onl
y

NOTES TO THE FINANCIAL STATEMENTS continued
A4. Dividends PaidThe dividends paid and payable for the year ended 30 June 2015 are shown below:
2015 $’000
2014 $’000
(a) Dividends Paid During the YearFinal dividend for the year ended 30 June 2014 of 14 cents fully franked at 30 per cent paid 29 August 2014 (2014: 14 cents fully franked at 30 per cent paid on 30 August 2013) 145,077 143,800Interim dividend for the year ended 30 June 2015 of 9 cents per share fully franked at 30 per cent, paid 20 February 2015 (2014: 8 cents fully franked at 30 per cent paid 21 February 2014) 96,409 82,536
241,486 226,336
Dividends paid in cash 191,762 180,272Dividends reinvested in shares 49,724 46,064
241,486 226,336
Dividends forgone via DSSP 3,128 2,307
(b) Franking CreditsOpening balance of franking account at 1 July 128,143 126,024Franking credits on dividends received 100,932 95,833Tax paid during the year 13,458 4,277Franking credits paid on ordinary dividends paid (103,494) (97,001)Franking credits deducted on DSSP shares issued (1,341) (990)Closing balance of franking account 137,698 128,143Adjustments for tax payable in respect of the current year’s profits and the receipt of dividends recognised as receivables 44,659 28,167Adjusted closing balance 182,357 156,310Impact on the franking account of dividends declared but not recognised as a liability at the end of the financial year: (65,391) (62,943)Net available 116,966 93,367
These franking account balances would allow AFIC to frank additional dividend payments up to an amount of: 272,921 217,856
AFIC’s ability to continue to pay franked dividends is dependent upon the receipt of franked dividends from the trading and investment portfolios and on AFIC paying tax.
(c) New Zealand Imputation Account(Figures in A$ at year-end exchange rate: 2015: NZX$1.14; A$1; 2014: NZX$ 41.077; A$1)Opening balance 6,761 630Imputation credits on dividends received 5,599 6,131Imputation credits on dividends paid - -Closing balance 12,360 6,761Three New Zealand cents per share of the dividend to be paid on 28 August 2015 will have a New Zealand imputation credit attached. This will utilise, at the above exchange rates, $11.2 million of the above balance.
46 Australian Foundation Investment Company Limited Annual Report 2015
For
per
sona
l use
onl
y

2015 $’000
2014 $’000
(d) Dividends Declared After Balance DateSince the end of the year Directors have declared a final dividend of 14 cents per share fully franked at 30 per cent. The aggregate amount of the final dividend for the year to 30 June 2015 to be paid on 28 August 2015, but not recognised as a liability at the end of the financial year is: 152,578
(e) Listed Investment Company Capital Gain AccountBalance of the LIC capital gain account 61,134 10,254This equates to an attributable amount of 87,334 14,649
Distributed LIC capital gains may entitle certain shareholders to a deduction in their tax return, as set out in the dividend statement. LIC capital gains available for distribution are dependent on the disposal of investment portfolio holdings that qualify for LIC capital gains, or the receipt of LIC distributions from LIC securities held in the portfolios. $54.5 million of the capital gain ($77.8 million of the attributable amount) will be paid out as part of the final dividend on 28 August 2015.
A5. Earnings Per ShareThe table below shows the earnings per share based on the profit for the year.
2015 2014Basic earnings per share Number NumberWeighted average number of ordinary shares used as the denominator 1,078,053,226 1,044,013,116
$’000 $’000Profit for the year 293,503 254,213
Cents CentsBasic earnings per share 27.23 24.35
Diluted earnings per shareWeighted average number of ordinary shares attributable to members of the Company 1,078,053,226 1,044,013,116Weighted maximum number of potential shares as a result of possible conversion 40,185,036 42,677,765
1,118,238,262 1,086,690,881
$’000 $’000Profit after tax for the year attributable to members of the Company 293,503 254,213Interest and costs on convertible notes (after tax) 9,570 10,027Adjusted profit after tax attributable to members of the Company 303,073 264,240
Cents CentsDiluted earnings per share 27.11 24.32
47Australian Foundation Investment Company Limited Annual Report 2015
For
per
sona
l use
onl
y

NOTES TO THE FINANCIAL STATEMENTS continued
B. Costs, Tax and Risk
B1. Management CostsThe total management expenses for the period are as follows:
2015 $’000
2014 $’000
Rental expense relating to non-cancellable leases (534) (512)Employee benefit expenses (9,815) (9,128)Depreciation charge (75) (130)Other administration expenses (4,443) (4,352)
Employee Benefit ExpensesA major component of employee benefit expenses is Directors’ and Executives’ remuneration. This has been summarised below:
Short Term Benefits
$
Other Long Term benefits
$
Post Employment Benefits
$
Share Based Payments
$Total
$2015Non-Executive Directors 671,007 - 93,993 - 765,000Executives 3,919,635 158,090 133,783 488,750 4,700,258Total 4,590,642 158,090 227,776 488,750 5,465,258
2014Non-Executive Directors 665,509 - 84,984 - 750,493Executives 3,973,419 160,734 125,692 433,132 4,692,977Total 4,638,928 160,734 210,676 433,132 5,443,470
Detailed remuneration disclosures are provided in the Remuneration Report.
The Group does not make loans to Directors or Executives.
B2. TaxAFIC’s tax position, and how it accounts for tax, is explained here. Detailed reconciliations of tax accounting to the financial statements can be found in Note E2.
The income tax expense for the period is the tax payable on this financial year’s taxable income, adjusted for any changes in deferred tax assets and liabilities attributable to temporary differences and for any unused tax losses. Deferred tax assets and liabilities (except for those related to the unrealised gains or losses in the investment portfolio) are offset, as all current and deferred taxes relate to the Australian Taxation Office and can legally be settled on a net basis.
A provision has been made for taxes on any unrealised gains or losses on securities valued at fair value through the Income Statement – i.e. the trading portfolio, puttable instruments and convertible notes that are classified as debt.
A provision also has to be made for any taxes that could arise on sale of securities in the investment portfolio, even though there is no intention to dispose of them. Where AFIC disposes of such securities, tax is calculated according to the particular parcels allocated to the sale for tax purposes, offset against any capital losses carried forward.
48 Australian Foundation Investment Company Limited Annual Report 2015
For
per
sona
l use
onl
y

Tax ExpenseThe income tax expense for the period is shown below:
2015 $’000
2014 $’000
(a) Reconciliation of Income Tax Expense to Prima Facie Tax PayableProfit before income tax expense 303,464 260,197Tax at the Australian tax rate of 30 per cent (2014: 30 per cent) 91,039 78,059Tax offset for franked dividends (70,454) (66,473)Demerger dividends not taxable (9,557) (3,294)Tax effect of sundry items not taxable in calculating taxable income (147) 76
10,881 8,368Over provision in prior years (1,021) (2,464)
Total tax expense 9,860 5,904
Deferred Tax Liabilities – Investment PortfolioThe accounting standards require us to recognise a deferred tax liability for the potential capital gains tax on the unrealised gain in the investment portfolio. This amount is shown in the Balance Sheet. However, the Board does not intend to sell the investment portfolio, so this tax liability is unlikely to arise at this amount. Any sale of securities would also be affected by any changes in capital gains tax legislation or tax rate applicable to such gains when they are sold.
2015 $’000
2014 $’000
Deferred tax liabilities on unrealised gains in the investment portfolio 930,152 948,009
Opening balance at 1 July 948,009 751,761Charged to Income Statement for puttable instruments/non-equity investments (19) 31Tax on realised gains (20,960) (4,194)Charged to OCI for ordinary securities on gains or losses for the period 3,122 200,411
930,152 948,009
49Australian Foundation Investment Company Limited Annual Report 2015
For
per
sona
l use
onl
y

NOTES TO THE FINANCIAL STATEMENTS continued
B3. RiskMarket RiskMarket risk is the risk that the fair value or future cash flows of a financial instrument will fluctuate because of changes in market prices.As a LIC that invests in tradeable securities, AFIC can never be free of market risk as it invests its capital in securities, which are not risk free – the market price of these securities will fluctuate.
A general fall in market prices of 5 per cent and 10 per cent, if spread equally over all assets in the investment portfolio, would lead to a reduction in AFIC’s comprehensive income of $224.3 million and $448.7 million respectively, at a tax rate of 30 per cent (2014: $221.3 million and $442.6 million), and a reduction in profit after tax of $93,000 and $187,000 respectively, at a tax rate of 30 per cent (2014: $96,000 and $191,000). The revaluation reserve at 30 June 2015 was $2.15 billion (2014: $2.3 billion). It would require a fall in the value of the investment portfolio of 48 per cent after tax to fully deplete this (2014: 51 per cent).
AFIC seeks to reduce market risk at the investment portfolio level by ensuring that it is not, in the opinion of the Investment Committee, overly exposed to one company or one particular sector of the market. The relative weightings of the individual securities and the relevant market sectors are reviewed by the Investment Committee and risk can be managed by reducing exposure where necessary. AFIC does not have a minimum or maximum amount of the portfolio that can be invested in a single company or sector.
AFIC’s investment by sector is as below:
2015 %
2014 %
Energy 6.71 9.34Materials 16.66 17.46Industrials 8.07 8.31Consumer discretionary 1.36 1.10Consumer staples 7.97 9.61Banks 29.16 29.71Other financials (including property trusts) 11.23 10.52Telecommunications 5.68 4.83Healthcare 5.92 3.61Other – e.g. information technology and utilities 4.75 4.43Cash 2.49 1.08
2015 %
2014 %
Securities representing over 5 per cent of the investment portfolio at 30 June 2015 were:Commonwealth Bank 11.3 10.8Westpac 9.1 9.8BHP Billiton 6.0 8.1National Australia Bank 5.2 4.9Telstra 5.0 4.5
50 Australian Foundation Investment Company Limited Annual Report 2015
For
per
sona
l use
onl
y

Interest Rate RiskThe Group is not currently materially exposed to interest rate risk as all its cash investments and borrowings (with the exception of the convertible notes) are short term for a fixed interest rate. The convertible notes were also issued at a fixed interest rate.
AFIC is also not directly exposed to material currency risk as most of its investments are quoted in Australian dollars.
The writing of call options provides some protection against a fall in market prices as it generates income to partially compensate for a fall in capital values. Options are only written against securities that are held in the trading or the specific sub-section of the investment portfolio.
Credit RiskCredit risk is the risk that one party to a financial instrument will cause a financial loss for the other party by failing to discharge an obligation. AFIC is exposed to credit risk from cash, receivables, securities in the trading portfolio and securities in the investment portfolio respectively. None of these assets are overdue. The risk in relation to each of these items is set out below.
CashAll cash investments not held in a transactional account are invested in short term deposits with Australia’s ‘big four’ commercial banks or their wholly-owned subsidiaries or in cash management trusts managed by those subsidiaries. In the unlikely event of a bank default or default on the underlying securities in the cash trust, there is a risk of losing the cash deposits and any accrued unpaid interest.
ReceivablesOutstanding settlements are on the terms operating in the securities industry, which usually require settlement within three days of the date of a transaction. Receivables are non-interest bearing and unsecured. In the event of a payment default, there is a risk of losing any difference between the price of the securities sold and the price of the recovered securities from the discontinued sale.
Trading and Investment PortfoliosConverting and convertible notes or other interest-bearing securities that are not equity securities carry credit risk to the extent of their carrying value. This risk will be realised in the event of a shortfall on winding up of the issuing companies.
Liquidity RiskLiquidity risk is the risk that an entity will not be able to meet its financial liabilities.
AFIC monitors its cash flow requirements daily. The Investment Committee also monitors the level of contingent payments on a regular basis by reference to known sales and purchases of securities, dividends and distributions to be paid or received, put options that may require AFIC to purchase securities, and facilities that need to be repaid. AFIC ensures that it has either cash or access to short term borrowing facilities sufficient to meet these contingent payments.
AFIC’s inward cash flows depend upon the dividends received. Should these drop by a material amount, AFIC would amend its outward cash flows accordingly. AFIC’s major cash outflows are the purchase of securities and dividends paid to shareholders, and both of these can be adjusted by the Board and management. Furthermore, the assets of AFIC are largely in the form of readily tradeable securities, which can be sold on-market if necessary.
51Australian Foundation Investment Company Limited Annual Report 2015
For
per
sona
l use
onl
y

The table below analyses AFIC’s financial liabilities into relevant maturity groupings. The amounts disclosed in the table are the contractual undiscounted cash flows. Balances due within 12 months equal their carrying amounts as the impact of discounting is not significant.
Less Than 6 Months
$’000
6 –12 Months
$’000
Greater Than
1 Year $’000
Total Contractual Cash Flows
$’000
Carrying Amount
$’00030 June 2015Non-derivativesPayables 10,783 - - 10,783 10,783Borrowings - - - - -Convertible notes - - 203,568 203,568 202,252
10,783 - 203,568 214,351 213,035DerivativesOptions in trading portfolio1 - - - - 1,229Interest rate swaps - - - - -
- - - - 1,229
Less Than 6 Months
$’000
6 –12 Months
$’000
Greater Than
1 Year $’000
Total Contractual Cash Flows
$’000
Carrying Amount
$’00030 June 2014Non-derivativesPayables 6,128 - - 6,128 6,128Borrowings 100,000 - - 100,000 100,000Convertible notes - - 205,991 205,991 203,779
106,128 - 205,991 312,119 309,907
DerivativesOptions in trading portfolio1 1,950 - - 1,950 1,980Interest rate swaps 264 - - 264 281
2,214 - - 2,214 2,261
1. In the case of call options, there are no contractual cash flows because if the option is exercised the contract will be settled in the securities over which the option is written. The contractual cash flows for put options (none in 2015) written are the cash sums the Company will pay to acquire securities over which the options have been written, and it is assumed for purpose of the above disclosure that all options will be exercised (i.e. maximum cash outflow).
C. Unrecognised ItemsUnrecognised items, such as contingencies, do not appear in the financial statements, usually because they don’t meet the requirements for recognition. However, they have the potential to have a significant impact on the Group’s financial position and performance.
C1. ContingenciesDirectors are not aware of any material contingent liabilities or contingent assets other than those already disclosed elsewhere in the Financial Report.
NOTES TO THE FINANCIAL STATEMENTS continued
52 Australian Foundation Investment Company Limited Annual Report 2015
For
per
sona
l use
onl
y

ADDITIONAL INFORMATION
Additional information that shareholders may find useful is included here. It is grouped into three sections:
D. Balance Sheet reconciliations
E. Income Statement reconciliations
F. Other information
D. Balance Sheet ReconciliationsThis section provides information about the basis of calculation of line items in the financial statements that the Directors do not consider significant in the context of the Group’s operations.
D1. Current Assets – Cash2015
$’0002014 $’000
Cash at bank and in hand (including on-call) 119,772 19,584Fixed term deposits 44,068 49,500
163,840 69,084
Cash holdings yielded an average floating interest rate of 2.76 per cent (2014: 3.5 per cent). All cash investments not held in a transactional account or an overnight ‘at call’ account are invested in short term deposits with Australia’s ‘big four’ commercial banks or their wholly-owned subsidiaries, all rated ‘AA-’ by S&P, which have a maturity of three months or less or in cash management trusts managed by those subsidiaries (currently rated AAAm).
D2. Credit Facilities2015
$’0002014 $’000
Commonwealth Bank of Australia – cash advance facilities 115,000 165,000Amount drawn down 0 100,000Undrawn facilities 115,000 65,000
Westpac Bank – cash advance facilities 35,000 85,000Amount drawn down 0 0Undrawn facilities 35,000 85,000
Total short term loan facilities 150,000 250,000Amount drawn down 0 100,000Unknown facilities 150,000 150,000
The above borrowings are unsecured. Repayment of facilities is done either through the use of cash received from distributions or the sale of securities, or by rolling existing facilities into new ones. Facilities are usually drawn down for no more than three months.
53Australian Foundation Investment Company Limited Annual Report 2015
For
per
sona
l use
onl
y

ADDITIONAL INFORMATION continued
D3. Convertible Notes2015
$’0002014 $’000
Non-current unsecured – convertible notes at amortised cost 202,252 203,779
There were 2,035,676 convertible notes outstanding at 30 June 2015 each with a face value of $100, which were issued on 19 December 2011. These notes carry an interest entitlement of 6.25 per cent per annum. They may be converted at the option of the holder into ordinary shares based on a conversion price of $5.0864 per share on 28 February or 31 August each year until 28 February 2017. Notes not converted will be redeemed at their face value on 28 February 2017. At 30 June 2015, the face value of the convertible notes was $203.6 million (2014: $206 million). Terms of the notes are regulated under a trust deed between the Company and Australian Executor Trustees Ltd.
At issuance the residual value of the equity component of the convertible notes was calculated as nil.
D4. Revaluation Reserve2015
$’0002014 $’000
Opening balance at 1 July 2,253,053 1,801,692Gains/(losses) on investment portfolio– Equity instruments (23,281) 665,894– Puttable/debt instruments (transferred from retained profits) (65) 104Provision for tax on unrealised gains (3,103) (200,442)Cumulative taxable realised (gains)/losses (net of tax) (74,149) (14,195)
2,152,455 2,253,053
This reserve is used to record increments and decrements on the revaluation of the investment portfolio as described in accounting policy Note A2.
D5. Realised Capital Gains Reserve2015
$’0002014 $’000
Opening balance at 1 July 317,624 334,243Dividends paid - (30,814)Cumulative taxable realised gains for period through OCI (net of tax) 74,149 14,195
391,773 317,624
This reserve records gains or losses after applicable taxation arising from disposal of securities in the investment portfolio as described in A2.
D6. Retained Profits2015
$’0002014 $’000
Opening balance at 1 July 524,319 465,701Dividends paid (241,486) (195,522)Profit for the year 293,503 254,213Transfer to revaluation reserve (puttable instruments and non-equity investments) (net of tax) 46 (73)
576,382 524,319
This reserve relates to past profits.
54 Australian Foundation Investment Company Limited Annual Report 2015
For
per
sona
l use
onl
y

D7. Share Capital(a) Share Capital
Consolidated and Parent Entity Consolidated and Parent Entity2015
Shares ’000
2015 $’000
2014 Shares
’0002014 $’000
Ordinary shares – fully paid 1,089,844 2,301,238 1,049,055 2,065,017Less ELTIP shares adjustment - (6) - (81)
1,089,844 2,301,232 1,049,055 2,064,936
(b) Movements in Share Capital
Date Details Notes
Number of Shares
’000
Issue Price
$
Paid-up Capital
$’0001/7/2013 Balance 1,037,326 2,002,35030/8/2013 Dividend Reinvestment Plan (i) 5,182 5.64 29,22430/8/2013 Dividend Substitution Share Plan (ii) 252 n/a -31/8/2013 Convertible note conversion (iv) 2 5.09 124/10/2013 Cancellation of ELTIP shares (5) n/a (27)21/2/2014 Dividend Reinvestment Plan (i) 2,874 5.86 16,84021/2/2014 Dividend Substitution Share Plan (ii) 151 n/a -28/2/2014 Convertible note conversion (iv) 3,273 5.09 16,648Various Costs of issue - (30)30/6/2014 Balance 1,049,055 2,065,01729/8/2014 Dividend Reinvestment Plan (i) 4,983 5.93 29,54929/8/2014 Dividend Substitution Share Plan (ii) 302 n/a -31/8/2014 Convertible note conversion (iv) 306 5.09 1,5586/10/2014 Share Purchase Plan (v) 31,425 5.88 184,67120/2/2015 Dividend Reinvestment Plan (i) 3,379 5.97 20,17520/2/2015 Dividend Substitution Share Plan (ii) 224 n/a -28/2/2015 Convertible note conversion (iv) 170 5.09 865Various Costs of issue - (597)30/6/2015 Balance 1,089,844 2,301,238
(i) Shareholders elect to have all or part of their dividend payment reinvested in new ordinary shares under the DRP. The price of the new DRP shares is based on the average selling price of shares traded on the ASX and Chi-X in the five days after the shares begin trading on an ex-dividend basis.
(ii) The Group has a DSSP whereby shareholders may elect to forgo a dividend and receive shares instead. Pricing for the DSSP shares is done as per the DRP shares.
(iii) The Group has an on-market share buy-back program. During the financial year, no shares were bought back (2014: nil).(iv) See Note D3. 24,230 Feb 2017 convertible notes were converted into shares during the year (2014: 166,605).(v) During the year, the Group had a SPP. Shareholders were invited to subscribe for $15,000 worth of new shares. Pricing was set at the lower of $5.93
or a 2.5 per cent discount to the VWAP of the shares traded on the five days up to and including the closing date of the offer.
All shares have been fully paid, rank pari passu and have no par value.
55Australian Foundation Investment Company Limited Annual Report 2015
For
per
sona
l use
onl
y

ADDITIONAL INFORMATION continued
E. Income Statement Reconciliations
E1. Reconciliation of Net Cash Flows From Operating Activities to Profit2015
$’0002014 $’000
Profit for the year 293,604 254,293Fair value movement in puttable instruments 46 (73)Add back depreciation 75 130Net decrease/(increase) in trading portfolio (3,910) 51,999Dividends received as securities under DRP investments (3,399) (11,047)Decrease/(increase in current receivables 19,699 (13,487)– Less increase/(decrease) in receivables for investment portfolio (19,125) 12,707Increase in deferred tax liabilities (17,520) 196,716– Less increase/(decrease) in deferred tax liability on investment portfolio 17,857 (196,248)Increase/(decrease) in current payables 4,655 (3,206)– Less decrease/(increase) in payables for investment portfolio (5,523) 2,554– Less increase/(decrease) in dividends payable (62) (73)Increase/(decrease) in provision for tax payable 16,631 4,932Movement in ELTIP account 75 141Capital gains tax charge taken through equity (20,960) (4,194)Increase/(decrease) in other provisions/non-cash items (including convertible note expenses) 1,512 (773)Net cash flows from operating activities 283,655 294,371
E2. Tax ReconciliationsTax Expense Composition
2015 $’000
2014 $’000
Charge for tax payable relating to the current year 10,563 7,869Over provision in prior years (1,021) (2,464)Increase/(decrease) in deferred tax liabilities – investment portfolio (19) 31Decrease in deferred tax assets 337 468
9,860 5,904
Amounts Recognised Directly Through Other Comprehensive Income
Net increase in deferred tax liabilities relating to capital gains tax on the movement in gains in the investment portfolio 3,122 200,411
3,122 200,411
56 Australian Foundation Investment Company Limited Annual Report 2015
For
per
sona
l use
onl
y

Deferred Tax Assets and Liabilities The deferred tax balances are attributable to:
2015 $’000
2014 $’000
(a) Tax on unrealised gains in the trading portfolio (261) (99)(b) Provisions and expenses charged to the accounting profit that are not yet tax deductible 1,553 1,375(c) Interest and dividend income receivable that is not assessable for tax until receipt (765) (412)
527 864
Movements:Opening asset balance at 1 July 864 1,332Credited/(charged) to Income Statement (337) (468)
527 864
Deferred tax assets arise when provisions and expenses have been charged but are not yet tax deductible. These assets are realised when the relevant items become tax deductible, as long as enough taxable income has been generated to claim the assets against, and as long as there are no changes to the tax legislation that affect AFIC’s ability to claim the deduction.
The portion of deferred tax liability likely to be reversed within the next 12 months is $1 million (2014: $0.5 million). This relates primarily to items described in items (a) and (c) above.
F. Other InformationThis section covers other information that is not directly related to specific line items in the financial statements, including information about related party transactions, share based payments, assets pledged as security and other statutory information.
F1. Related PartiesAll transactions with deemed related parties were made on normal commercial terms and conditions and approved by independent Directors.
(a) Arrangements With Non-Executive DirectorsNon-Executive Directors John Paterson and Catherine Walter have rented office space and, in some cases, a parking space from the Group at commercial rates during the year. Sub-lease rental income (included in revenue) received or receivable by the Group during the year was $47,247 (2014: $59,542).
(b) AICS Transactions With Minority InterestsThe below transactions were with Djerriwarrh Investments Ltd as a minority interest holder in the Company’s subsidiary.
2015 $’000
2014 $’000
Administration expenses charged for the year 2,274 2,234
(c) AICS Transactions With Other Listed Investment CompaniesAICS had the following transactions with other LICs to which it provides services:
Administration expenses charged for the year to Mirrabooka Investments Ltd 1,398 1,310Administration expenses charged for the year to AMCIL Ltd 768 717
57Australian Foundation Investment Company Limited Annual Report 2015
For
per
sona
l use
onl
y

ADDITIONAL INFORMATION continued
F2. Remuneration of AuditorsFor the year the auditor earned or will earn the following remuneration:
2015 $
2014 $
PricewaterhouseCoopersAudit or review of financial reports 239,964 207,470AFSL compliance audit and review 9,925 9,683Non-audit servicesTaxation compliance services 37,868 36,970Total remuneration 287,757 254,123
F3. Segment ReportingOperating segments are reported in a manner consistent with the internal reporting used by the chief operating decision-maker. The Board, through its sub-committees, has been identified as the chief operating decision-maker, as it is responsible for allocating resources and assessing performance of the operating segments.
Description of SegmentsThe Board makes the strategic resource allocations for AFIC. AFIC has therefore determined the operating segments based on the reports reviewed by the Board, which are used to make strategic decisions.
The Board is responsible for AFIC’s entire portfolio of investments and considers the business to have a single operating segment. The Board’s asset allocation decisions are based on a single, integrated investment strategy and AFIC’s performance is evaluated on an overall basis.
Segment Information Provided to the BoardThe internal reporting provided to the Board for AFIC’s assets, liabilities and performance is prepared on a consistent basis with the measurement and recognition principles of Australian Accounting Standards, except that net assets are reviewed both before and after the effects of capital gains tax on investments (as reported in AFIC’s net tangible asset announcements to the ASX).
Other Segment InformationRevenues from external parties are derived from the receipt of dividend, distribution and interest income, and income arising on the trading portfolio and realised income from the options portfolio.
AFIC is domiciled in Australia and most of AFIC’s income is derived from Australian entities or entities that maintain a listing in Australia. AFIC has a diversified portfolio of investments, with only three investments comprising more than 10 per cent of AFIC’s income, including realised income from the trading and options written portfolios – BHP Billiton (15.9 per cent – including $31.9 million (9.5 per cent of income) of demerger dividend from the demerger of South32), Commonwealth Bank (10.6 per cent) and Westpac Bank (10.1 per cent).
58 Australian Foundation Investment Company Limited Annual Report 2015
For
per
sona
l use
onl
y

F4. Summary of Significant Accounting Policies Not Previously Disclosed This general purpose Financial Report has been prepared in accordance with Australian Accounting Standards, Interpretations issued by the Australian Accounting Standards Board and the Corporations Act 2001. This Financial Report has been authorised for issue and is presented in the Australian currency. AFIC has the power to amend and reissue the Financial Report.
AFIC has attempted to improve the transparency of its reporting by adopting ‘plain English’ where possible. Key ‘plain English’ phrases and their equivalent AASB terminology are as follows:
Phrase AASB TerminologyMarket value Fair value for actively traded securitiesCash Cash and cash equivalentsShare capital Contributed equityOptions Derivatives written over equity instruments that are valued at fair value through profit or lossHybrids Equity instruments that have some of the characteristics of debt
AFIC complies with International Financial Reporting Standards (IFRS). AFIC is a ‘for profit’ entity.
AFIC has not applied any Australian Accounting Standards or AASB Interpretations that have been issued as at balance date but are not yet operative for the year ended 30 June 2015 (‘the inoperative standards’) except for AASB 9 (2009), which was adopted on 7 December 2009. The impact of the inoperative standards has been assessed and the impact has been identified as not being material. AFIC only intends to adopt other inoperative standards at the date at which their adoption becomes mandatory.
Basis of Accounting The financial statements are prepared using the valuation methods described in A2. All other items have been treated in accordance with the historical cost convention.
Fair Value of Financial Assets and LiabilitiesThe fair value of cash and cash equivalents and non-interest bearing monetary financial assets and liabilities of AFIC approximates their carrying value.
Convertible NotesOn the issue of convertible notes, the Group estimates the fair value of the liability component of the convertible notes, being the obligation to make future payments of principal and interest to holders, using a market interest rate for a non-convertible note of similar terms and conditions. The residual amount is included in equity as other equity securities with no recognition of any change in the value of the option in subsequent periods. The liability component is then included in borrowings. Expenses incurred in connection with the issue of the notes are deducted from the total face value and the expense is then incurred over the life of the notes.
The total liability is subsequently carried on an amortised cost basis with interest on the notes recognised as finance costs on an effective yield basis until the liability is extinguished on conversion or maturity of the notes.
59Australian Foundation Investment Company Limited Annual Report 2015
For
per
sona
l use
onl
y

ADDITIONAL INFORMATION continued
Employee Benefits(i) Wages, Salaries and Annual LeaveLiabilities for wages and salaries, including annual leave, expected to be settled within 12 months of balance date are recognised as current provisions in respect of employees’ services up to balance date and are measured at the amounts expected to be paid when the liabilities are settled.
(ii) Long Service LeaveIn calculating the value of long service leave, consideration is given to expected future wage and salary levels, experience of employee departures and periods of service. Expected future payments are discounted using market yields at balance date on national government bonds with terms to maturity and currency that match, as closely as possible, the estimated future cash outflows.
(iii) Cash IncentivesCash incentives are provided under the Senior Executive Annual Incentive Plan and are dependent upon the performance of the Group. A provision is made for the cost of unsettled cash incentives at balance date. The Investment Team Annual Incentive plans are also settled on a cash basis.
(iv) Share IncentivesShare incentives are provided under the Senior Executive Annual Incentive Plan, Senior Executive Long Term Incentive Plan, Investment Team Long Term Incentive Plan and the Employee Share Acquisition Scheme.
For the Employee Share Acquisition Scheme and the Senior Executive Annual Incentive Plan, the incentives are based on the performance of the individual, the Group and investment companies to which the Group provides administration services for the financial year. For the Employee Share Acquisition Scheme and a portion of the Senior Executive Annual Incentive, the recipient agrees to purchase (or have purchased for them) shares on-market, but receives a cash amount. A provision for the amount payable under the Annual Incentive Plans is recognised on the Balance Sheet.
For the Investment Team Long Term Incentive Plan, the incentives are based on the performance of the Group and investment companies to which the Group provides administration services over a four year period. The incentives may be settled in shares (but based on a cash amount) or cash. Expenses are recognised over the four year assessment period based on the amount expected to be payable under this plan, resulting in a provision for incentive payable being built up on the Balance Sheet over the assessment period.
Under the Senior Executive Long Term Incentive Plan, which was introduced for the year ended 30 June 2013, the amount awarded is represented by performance shares. The 30 day VWAP of AFIC shares up to but not including 1 July is calculated. The amount of ELTIP available is then divided by this 30 day VWAP price to determine the number of performance shares that may vest at the vesting point in four years’ time. The value of each performance shares will be adjusted by the accumulation return on the AFI share price (being the movement in the share price assuming the reinvestment of any dividends) up to vesting date, based on a final share price calculated on the 30 day VWAP price up to 30 June.
60 Australian Foundation Investment Company Limited Annual Report 2015
For
per
sona
l use
onl
y

The expense will be charged directly through the Group’s profit and loss account in the following manner – 25 per cent of the total estimated cost in year one, 50 per cent of the total estimated cost in year two less the expense charged in year one, 75 per cent of the total estimated cost in year three less the expense charged in years one and two, and 100 per cent of the total estimated cost in year four less the expense charged in years one, two and three.
Shares are no longer awarded under the previous Senior Executive Long Term Incentive Plan but expenses will continue to be incurred under it until the conclusion of the vesting period in August 2015. Shares acquired to satisfy obligations under the old Senior Executive Long Term Incentive Plans are recognised as an adjustment against share capital (referred to as ‘ELTIP shares adjustment’) as at the date of acquisition by the Group. Between the award date and the vesting date, the fair value of the ELTIP shares is expensed over the relevant period of service for each Executive, and recognised in equity in the ELTIP shares adjustment account. In the event that the Executive does not complete the period of service, the cumulative expense is reversed. The fair value of the shares is determined at the award date and is based on:
• The market price of the shares at award date.
• Allowance for the impact of the holding restriction between award date and vesting date.
• The expected performance of the Group in meeting the market hurdles, which determine vesting.
Any shares that do not ultimately vest are cancelled by offsetting the relevant component of the ELTIP shares adjustment account against share capital. The reduction in share capital is based on that proportion of the original acquisition cost of share compensation that did not vest. Any residual element in the ELTIP shares adjustment account for the relevant award year is transferred to retained earnings.
Directors’ Retirement AllowancesThe Group recognises as ‘amounts payable’ Directors’ retirement allowances that have been crystallised. No further amounts will be expensed as retirement allowances.
Administration FeesThe Group currently provides administrative services to other LICs. The associated fees are recognised on an accruals basis as income throughout the year. Any amounts outstanding at balance date are recognised as receivable, subject to the assessment of recoverability by the Directors.
Operating LeasesThe Group currently has an operating lease in respect of its premises. Payments made under operating leases are charged to the Income Statement on a straight-line basis over the period of the lease.
Rounding of AmountsAFIC is a company of the kind referred to in Class Order 98/0100, issued by the Australian Securities and Investments Commission, relating to the ‘rounding off’ of amounts in the Financial Report. Amounts in the Financial Report have been rounded off in accordance with that Class Order, to the nearest thousand dollars, or in certain cases, to the nearest dollar.
61Australian Foundation Investment Company Limited Annual Report 2015
For
per
sona
l use
onl
y

ADDITIONAL INFORMATION continued
F5. Performance BondThe Group’s subsidiary, AICS, has under the terms of its Australian Financial Services Licence in place a performance bond to the sum of $20,000 underwritten by the Commonwealth Bank of Australia in favour of the ASIC, payable on demand to ASIC.
F6. Share Based PaymentsShare Based PaymentsThe Group has a number of share incentive arrangements. These are accounted for in accordance with Note F4. Where shares are issued to employees of AICS, AICS compensates AFIC for the fair value of the shares.
(a) Executive Incentive PlansThe Executives’ remuneration arrangements incorporate an ‘at risk’ component as set out in the Remuneration Report. Part of this ‘at risk’ component is paid in shares in the Group.
(i) Senior Executive Annual Incentive PlanAt the start of each financial year, the Remuneration Committee sets the target (cash) amount of remuneration that could be paid should all performance targets and measures be achieved. If all are achieved, 100 per cent of the remuneration will be awarded. If stretch levels of performance are achieved above target, then higher amounts may be paid. On the other hand, there is no set minimum that will be paid regardless of performance.
The performance measures are a combination of the performance of the Group, the investment companies to which the Group provides administration services and personal objectives.
All of the incentive remuneration awarded is paid in cash, with 50 per cent of the after tax amount being used by the Executive to purchase shares. All remuneration under the plan is paid in the financial year following the year of assessment.
The Executive agrees to the shares being subject to being held for two years (holding term), during which they cannot be sold. Dividends are paid to Executives on these shares prior to the expiry of the holding term. Should an Executive leave the Group before the holding term expires, the restriction will be lifted.
22,452 shares (2014: 22,859 shares) were purchased by Executives in the year (in relation to the prior year) with a fair value (being the acquisition price) of $135,685 (2014: $131,877).
62 Australian Foundation Investment Company Limited Annual Report 2015
For
per
sona
l use
onl
y

(ii) Senior Executive Long Term Incentive PlanSenior Executives were awarded a number of shares equivalent to 50 per cent of the gross amount awarded under the old Annual Incentive Plan. These shares (‘performance shares’) were acquired on-market. The award of shares to participants was made for no consideration. The shares are subject to a holding lock for a minimum of four years (the vesting period), during which time the Executive will be entitled to receive dividends and hold voting rights.
The performance shares vest between four and five years after grant date, entirely dependent on the achievement of set quantitative measures, the TSR and the TPR, which reflect the movement in the share price of the Company TSR and in the portfolio of investments in which the Company has invested shareholders’ funds TPR. The number of shares that vest is based on the highest cumulative performance level achieved under each category. Shares that do not vest are transferred back to the Group for no consideration and are cancelled.
Should an Executive cease employment prior to the shares vesting, then all unvested shares may be cancelled.
Details of the number of shares awarded, vested and cancelled in the year are set out in the Remuneration Report.
Under the new Senior Executive Long Term Incentive Plan, the amount awarded will be represented by performance rights. The 30 day VWAP of AFIC shares up to but not including 1 July will be calculated. The amount of ELTIP available will then be divided by this 30 day VWAP price to determine the number of performance rights that may vest at the vesting point in four years’ time. The value of each performance right will be adjusted by the accumulation return on the AFI share price (being the movement in the share price assuming the reinvestment of any dividends) up to vesting date, based on a final share price calculated on the 30 day VWAP price up to 30 June.
The expense will be charged in accordance with AASB 2 directly through the Group’s profit and loss account in the following manner – 25 per cent of the total estimated cost in year one, 50 per cent of the total estimated cost in year two less the expense charged in year one, 75 per cent of the total estimated cost in year three less the expense charged in years one and two, and 100 per cent of the total estimated cost in year four less the expense charged in years one, two and three.
The estimated fair value of the award will be calculated in accordance with AASB 2 – Share Based Payments at the end of each year until the final year of vesting. The liability shown after the final year of vesting will represent the actual amount being paid to eligible employees as a cash-settled share based payment.
67,009 rights were awarded under the plan during the year ended 30 June 2015 (2014: 74,223). An expense of $413,846 (2014: $299,884) was incurred.
63Australian Foundation Investment Company Limited Annual Report 2015
For
per
sona
l use
onl
y

ADDITIONAL INFORMATION continued
Set out below is a summary of AFIC shares awarded but not yet vested under the Executive Long Term Incentive Plan:
2015 Award Date Assessment Period
Balance at Start of The Year Number
Awarded During
The Year Number
Vested During
The Year Number
Lapsed During
The Year Number
Balance at End of The Year Number
August 2010 August 2014 – August 2015 48,700 - 30,434 - 18,266August 2011 August 2015 – August 2016 66,845 - - - 66,845Total 115,545 - 30,434 - 85,111
2014 Award Date Assessment Period
Balance at Start of The Year Number
Awarded During
The Year Number
Vested During
The Year Number
Lapsed During
The Year Number
Balance at End of The Year Number
August 2008 August 2012 – August 2013 5,112 - - 5,112 -October 2009 October 2013 – October 2014 39,502 - 39,502 - -August 2010 August 2014 – August 2015 48,700 - - - 48,700August 2011 August 2015 – August 2016 66,845 - - - 66,845Total 160,159 - 39,502 5,112 115,545
(iii) Investment Team Long Term Incentive PlanSimilar to the annual incentive plans, a target cash amount of long term incentive is set each year in respect of that year, which will vest in four years’ time. The percentage of this target that ultimately vests four years after the award depends on the gross return of the Group and the investment companies it provides administration services to.
The amount that vests will be paid in cash or shares (purchased on market at that time, based on the cash amount that vests) at the discretion of the Group.
$371,859 under this plan vested in the period (2014: $415,657) and was paid in cash.
(b) Employee Share Acquisition SchemeUnder the current Employee Share Acquisition Scheme, each employee who is not a participant in the Senior Executive or investment team incentive plans is awarded $5,000 per annum. After PAYG is deducted, $2,500 is used to buy shares in the Company, which are held for three years when they cannot be sold. After three years, or the departure of the employee from employment with the Group, the shares come out of the holding lock. During the financial year, 3,216 shares were purchased under this scheme at an average price of $6.21.
64 Australian Foundation Investment Company Limited Annual Report 2015
For
per
sona
l use
onl
y

(c) Expenses Arising From Share Based Payment TransactionsTotal expenses arising from share based payment transactions recognised during the period as part of the employee benefit expense (including the expense for the ELTIP but excluding the Investment Team Long Term Incentive Plan) were as follows:
2015 $’000
2014 $’000
Share based payment expense 529 458
(d) LiabilityThe total liability arising from share based payment transactions is included in the current and non-current liabilities for ‘provisions’.
F7. Lease CommitmentsThe Group has entered into a non-cancellable operating lease for the use of its premises for four years with a further option, which has been exercised, of four years. Current commitment relating to leases at balance date, for the current lease (including GST), is:
2015 $’000
2014 $’000
Due within one year 563 563Later than one year but less than five - 563Greater than five years - -
563 1,126
F8. Principles of ConsolidationAFIC’s consolidated financial statements consist of the financial statements of AFIC, the parent, and its subsidiary, AICS. 25 per cent of AICS is owned by Djerriwarrh Investments Ltd, another investment company for which AICS performs operational and investment services, and for which it is paid monthly.
No subsidiaries were acquired or disposed of during the year. Intercompany transactions and balances between AFIC and AICS are eliminated on consolidation.
The financial information for the parent entity, disclosed in F9 below, has been prepared on the same basis as the consolidated financial statements. All notes are for the consolidated group unless specifically noted otherwise.
65Australian Foundation Investment Company Limited Annual Report 2015
For
per
sona
l use
onl
y

ADDITIONAL INFORMATION continued
F9. SubsidiariesThe consolidated financial statements incorporate the assets, liabilities and results of the following subsidiaries:
Equity HoldingName of Entity Country of Incorporation Class of Shares 2015 2014Australian Investment Company Services Ltd Australia Ordinary 75% 75%
The investment in AICS is accounted for at cost in the individual financial statements of AFIC.
F10. Parent Entity Financial Information
Summary Financial InformationThe individual financial statements for the parent entity show the following aggregate amounts:
2015 $’000
2014 $’000
Balance SheetCurrent assets 204,211 128,376Total assets 6,616,668 6,454,712
Current liabilities 40,486 121,636Total liabilities 1,173,929 1,273,866
Shareholders’ equityIssued capital 2,301,232 2,064,936
ReservesRevaluation reserve 2,152,455 2,253,053Realised capital gains reserve 391,773 317,624General reserve 23,637 23,637Interest rate hedging reserve - (281)Retained earnings 573,642 521,877
3,141,507 3,115,910
Total shareholders’ equity 5,442,739 5,180,846
Profit or loss for the year 293,200 253,973
Total comprehensive income 267,078 720,668
66 Australian Foundation Investment Company Limited Annual Report 2015
For
per
sona
l use
onl
y

In the Directors’ opinion:
(1) the financial statements and notes set out on pages 37 to 66 are in accordance with the Corporations Act 2001 including:
(a) complying with the Accounting Standards, the Corporations Regulations 2001 and other mandatory professional reporting requirements; and
(b) giving a true and fair view of the entity’s financial position as at 30 June 2015 and of its performance for the financial year ended on that date; and
(2) there are reasonable grounds to believe that the Company will be able to pay its debts as and when they become due and payable.
Note F4 to the financial statements confirms that the financial statements also comply with International Financial Reporting Standards as issued by the International Accounting Standards Board.
This declaration is made in accordance with a resolution of the Directors.
This declaration has been made after receiving the declarations required to be made to the Directors by the Managing Director and the Chief Financial Officer regarding the financial statements in accordance with Section 295A of the Corporations Act 2001 for the financial year ended 30 June 2015.
The declarations received were that, in the opinion of the Managing Director and the Chief Financial Officer to the best of their knowledge, the financial records of the Company have been properly maintained, that the financial statements comply with accounting standards and that they give a true and fair view.
Terrence Campbell AOChairman
Melbourne20 July 2015
DIRECTORS’ DECLARATION
67Australian Foundation Investment Company Limited Annual Report 2015
For
per
sona
l use
onl
y

INDEPENDENT AUDIT REPORT
68 Australian Foundation Investment Company Limited Annual Report 2015
For
per
sona
l use
onl
y

69Australian Foundation Investment Company Limited Annual Report 2015
For
per
sona
l use
onl
y

OTHER INFORMATION
At 17 July 2015 there were 107,774 holdings of ordinary shares and 4,184 holders of December 2011 6.25 per cent unsecured convertible notes. These holdings were distributed in the following categories:
Size of Holding Shareholdings Noteholdings1 to 1,000 26,816 3,9001,001 to 5,000 37,701 2455,001 to 10,000 18,483 2810,001 to 100,000 23,785 11100,000 and over 989 0Total 107,774 4,184
Percentage held by the 20 largest holders 5.43% 14.66%Average holding 10,112 486
There were 2,356 shareholdings of less than a marketable parcel of $500 (80 shares).
There were 2 noteholdings of less than a marketable parcel of $500 (5 notes).
Voting Rights of Ordinary SharesThe Constitution provides for votes to be cast:
(i) on a show of hands, one vote for each shareholder; and
(ii) on a poll, one vote for each fully paid ordinary share.
Voting Rights of Convertible NotesNoteholders have certain rights to vote at meetings of noteholders but are not entitled to vote at general meetings, unless provided for by the ASX Listing Rules or the Corporations Act.
INFORMATION ABOUT SHAREHOLDERS AND NOTEHOLDERS
70 Australian Foundation Investment Company Limited Annual Report 2015
For
per
sona
l use
onl
y

Major ShareholdersThe 20 largest registered holdings of ordinary shares and unsecured convertible notes as at 17 July 2015 are listed below:
Ordinary Shares Shares Held %Questor Financial Services Limited <TPS RF A/C> 6,315,952 0.58Bougainville Copper Limited 5,025,000 0.46Nulis Nominees (Australia) Limited <Navigator Mast Plan Sett A/C> 4,836,305 0.44Navigator Australia Ltd <MLC Investment Sett A/C> 4,254,412 0.39National Nominees Limited 3,721,823 0.34HSBC Custody Nominees (Australia) Limited 3,357,269 0.31Custodial Services Limited <Beneficiaries Holding A/C> 3,184,671 0.29Trustees of The Redemptorist Fathers 2,878,000 0.26Bruce Teele 2,641,301 0.24Invia Custodian Pty Limited <RISF A/C> 2,520,569 0.23Bushways Pty Ltd 2,513,399 0.23Investment Custodial Services Limited <C A/C> 2,439,281 0.22Investment Custodial Services Limited <C A/C> 2,403,081 0.22Citicorp Nominees Pty Limited 2,274,699 0.21Netwealth Investments Limited <Wrap Services A/C> 2,232,992 0.20New Zealand Central Securities Depository Limited 1,919,149 0.18Kalymna Pty Ltd 1,852,186 0.17UBS Wealth Management Australia Nominees Pty Ltd 1,765,591 0.16Questor Financial Services Limited <TPS PIP A/C> 1,639,795 0.15Twibill Pty Ltd 1,440,493 0.13
Unsecured Convertible Notes – (December 2011, 6.25 per cent) Units Held %UBS Nominees Pty Ltd 32,810 1.61J P Morgan Nominees Australia Limited 27,172 1.33Custodial Services Limited <Beneficiaries Holding A/C> 25,604 1.26HSBC Custody Nominees (Australia) Limited 22,192 1.09Netwealth Investments Limited <Super Services A/C> 21,228 1.04Netwealth Investments Limited <Wrap Services A/C> 20,831 1.02Questor Financial Services Limited <TPS RF A/C> 16,260 0.80National Nominees Limited 14,071 0.69Invia Custodian Pty Limited <Grattan Inst/Cth Fund A/C> 11,968 0.59Invia Custodian Pty Limited <Grattan Inst/General Fd A/C> 11,942 0.59Hedgewick Pty Ltd 11,000 0.54Invia Custodian Pty Limited <RISF A/C> 10,000 0.49Wintol Pty Ltd <G & P Burg Super Fund A/C> 10,000 0.49Company B Ltd 9,831 0.48The Beach Retreat Pty Ltd <Rob Noble Super Fund A/C> 9,745 0.48UBS Wealth Management Australia Nominees Pty Ltd 9,110 0.45Koornala Pty Ltd <Yahalom SF A/C> 8,874 0.44HSBC Custody Nominees (Australia) Limited – A/C 2 8,800 0.43Nabe Pty Ltd <The Glass A/C> 8,500 0.42The Wyatt Benevolent Institution Inc 8,500 0.42
71Australian Foundation Investment Company Limited Annual Report 2015
For
per
sona
l use
onl
y

MAJOR TRANSACTIONS IN THE INVESTMENT PORTFOLIO
Acquisitions (Above $10 Million)Cost
$’000Federation Centres(a) 46,414South32 (b) 31,339Healthscope 19,667CSL 16,205AGL Energy(c) 11,183Japara Healthcare 10,494Regis Healthcare 10,065
Disposals (Above $10 Million)Proceeds
$’000Toll Holdings(d) 73,269Novion Property Group(e) 46,414Bradken 10,437
(a) As consideration for the merger with Novion Property Group.(b) As a result of the demerger of BHP Billiton.(c) 1 for 5 rights issue at $11.00 per share.(d) Takeover by Japan Post Co. Ltd.(e) Merger with Federation Centres.
72 Australian Foundation Investment Company Limited Annual Report 2015
For
per
sona
l use
onl
y

MAJOR TRANSACTIONS IN THE BUY AND WRITE PORTFOLIO
Acquisitions (Above $10 Million)Cost
$’000National Australia Bank(f) 24,895CSL 11,851Asciano 11,509
Disposals (Above $10 Million)Proceeds
$’000Telstra (from the exercise of call options) 15,017CSL (from the exercise of call options) 12,551Transurban Group (mostly from the exercise of call options) 11,171Suncorp Group (mostly from the exercise of call options) 10,877National Australia Bank ($7 million from the exercise of call options) 10,414
(f) Includes $21.5 million from 2 for 25 rights issue at $28.50 per share.
73Australian Foundation Investment Company Limited Annual Report 2015
For
per
sona
l use
onl
y

SUB-UNDERWRITING
Company Underwritten by Description Amount UnderwrittenNational Australia Bank Macquarie Capital (Australia) Limited, Merrill
Lynch Equities (Australia Limited) and Morgan Stanley Australia Securities Limited
Accelerated renounceable entitlement offer of two new shares for every existing 25 shares (2 for 25)
$8,333,343
ARB Corporation Taylor Collison Limited ARB Dividend Reinvestment Plan and ARB Bonus Share Plan
$6,500,000
SUBSTANTIAL SHAREHOLDERSThe Company has not been notified of any substantial shareholders.
TRANSACTIONS IN SECURITIES During the year ended 30 June 2015, the Company recorded 907 transactions in securities. $1,062,250 in brokerage (including GST) was paid or accrued for the year.
74 Australian Foundation Investment Company Limited Annual Report 2015
For
per
sona
l use
onl
y

HOLDINGS OF SECURITIESAs at 30 June 2015
Individual investments for the combined investment and trading portfolios as at 30 June 2015 are listed below. The list should not, however, be used to evaluate portfolio performance or to determine the net asset backing per share at other dates. Net asset backing is advised to the ASX each month and is recorded on the toll free telephone service at 1800 780 784 and posted to AFIC’s website afi.com.au
Individual holdings in the portfolios may change during the course of the year. In addition, holdings that are part of the trading portfolio may be subject to call options or sale commitments, by which they may be sold at a price significantly different from the market price prevailing at the time of the exercise or sale.
Code Ordinary Shares, Trust Units or Stapled Securities
Number Held 2014 ’000
Number Held 2015 ’000
Market Value 2015 $’000
AGL AGL Energy 5,083 6,100 94,852AHD Amalgamated Holdings 775 1,030 12,919AIA Auckland International Airport 1,170 1,170 5,125AIO* Asciano 2,810 4,855 31,777ALQ ALS 4,826 4,942 28,913AMC Amcor 12,864 12,864 176,496AMP AMP 20,100 20,100 121,005ANN Ansell 1,284 1,284 30,928ANZ Australia and New Zealand Banking Group 8,488 8,488 273,304APA APA Group 11,643 10,340 85,202APE AP Eagers 325 769 7,194ARB ARB Corporation 583 948 12,353ASH Ashley Services Group 0 4,819 2,867ASX ASX 550 459 18,302AWC Alumina 14,323 14,323 21,914AZJ* Aurizon Holdings 2,980 2,480 12,700BGA Bega Cheese 2,203 2,203 9,538BHP* BHP Billiton 14,221 14,221 384,632BKL Blackmores 36 36 2,725BKN Bradken 6,000 1,576 2,261BKW Brickworks 1,503 1,503 20,741BLD Boral 4,008 4,008 23,450BXB Brambles 11,174 11,174 118,439CAJ Capitol Health 0 9,905 7,577CBA Commonwealth Bank of Australia 8,483 8,483 722,149CCL Coca-Cola Amatil 5,160 5,160 47,214
75Australian Foundation Investment Company Limited Annual Report 2015
For
per
sona
l use
onl
y

HOLDINGS OF SECURITIES continuedAs at 30 June 2015
Code Ordinary Shares, Trust Units or Stapled Securities
Number Held 2014 ’000
Number Held 2015 ’000
Market Value 2015 $’000
CPU Computershare 8,156 8,156 95,511CSL* CSL 1,002 1,172 101,239CSR CSR 2,492 2,492 9,072CTX Caltex Australia 655 605 19,269CVO Cover-More Group 0 4,737 11,275CWP Cedar Woods Properties 4,060 3,859 20,299DJW Djerriwarrh Investments 8,597 8,597 40,318DLX DuluxGroup 2,556 2,556 14,621DUI Diversified United Investment 12,030 12,030 42,226EHE Estia Health 0 952 5,709EQT Equity Trustees 1,456 1,488 30,345FBU Fletcher Building 1,115 1,115 8,040FDC* Federation Centres 0 17,378 50,739FLT Flight Centre Travel Group 131 241 8,219FOX Twenty-First Century Fox 459 459 19,443FPH Fisher & Paykel Healthcare 800 1,706 10,390HSO Healthscope 0 7,885 21,446IAG Insurance Australia Group 4,255 3,500 19,531ICQ iCar Asia 2,855 4,155 2,929ILU Iluka Resources 2,367 2,367 18,179IPL Incitec Pivot 22,209 22,029 84,813IPP iProperty Group 4,488 5,326 12,783IRE IRESS 2,709 2,709 27,419IVC InvoCare 1,279 1,150 13,915JHC Japara Healthcare 6,000 10,393 26,710JHX James Hardie Industries 1,150 1,350 23,382LIC Lifestyle Communities 2,659 4,293 10,475
76 Australian Foundation Investment Company Limited Annual Report 2015
For
per
sona
l use
onl
y

Code Ordinary Shares, Trust Units or Stapled Securities
Number Held 2014 ’000
Number Held 2015 ’000
Market Value 2015 $’000
MIR Mirrabooka Investments 8,728 8,728 22,692MLT Milton Corporation 14,403 14,403 64,813MQA* Macquarie Atlas Roads Group 0 1,000 3,169NAB National Australia Bank 9,543 10,097 336,345ORA Orora 12,864 12,864 26,886ORG Origin Energy 7,187 6,957 83,280ORI Orica 2,712 2,712 57,703OSH* Oil Search 16,483 16,783 119,622PHG Pulse Health 3,933 7,967 4,541PPT Perpetual 1,031 1,031 49,863QBE* QBE Insurance Group 7,796 8,290 113,288QUB Qube Holdings 12,118 13,451 31,610REC Recall Holdings 2,235 2,235 15,487REG Regis Healthcare 0 2,666 13,755RHC Ramsay Health Care 1,360 1,360 83,599RIO Rio Tinto 3,652 3,652 196,282RMD ResMed 2,200 2,700 19,629S32* South32 0 17,721 31,580SAI SAI Global 2,500 2,500 10,425SCG Scentre Group 11,437 11,437 42,888SEK* Seek 1,045 1,600 22,365SGM* Sims Metal Management 0 700 7,264SHL Sonic Healthcare 1,825 2,020 43,167SOL Washington H Soul Pattinson 1,709 1,709 22,963SRX Sirtex Medical 0 220 6,391STO Santos 8,178 8,037 62,927SUN* Suncorp Group 2,260 1,740 23,299
77Australian Foundation Investment Company Limited Annual Report 2015
For
per
sona
l use
onl
y

Code Ordinary Shares, Trust Units or Stapled Securities
Number Held 2014 ’000
Number Held 2015 ’000
Market Value 2015 $’000
SXY Senex Energy 46,717 46,467 13,011SYD Sydney Airport 6,782 6,782 33,774TCL Transurban Group 19,795 18,335 170,518TGG Templeton Global Growth Fund 9,685 12,106 15,798TLS Telstra Corporation 55,095 52,445 322,012TOX Tox Free Solutions 10,661 10,661 32,197TPM TPG Telecom 3,597 4,677 41,950TWE Treasury Wine Estates 3,258 3,258 16,255VED Veda Group 0 4,100 9,102VOC Vocus Communications 466 1,725 9,951WBC Westpac Banking Corporation 18,236 18,236 586,295WES Wesfarmers 7,553 7,423 289,703WFD Westfield Corporation 4,243 4,243 38,692WOR WorleyParsons 310 310 3,227WOW Woolworths 6,314 6,000 161,760WPL* Woodside Petroleum 3,283 3,413 116,768Total 6,399,719
* Part of the security was subject to call options written by the Company.
Code Convertible Notes, Preference Shares and Other Interest Bearing Securities
Number Held 2014 ’000
Number Held 2015 ’000
Market Value 2015 $’000
PPCG Peet 9.5% convertible notes 26 26 2,665RHCPA Ramsay Health Care convertible adjustable rate equity securities 115 115 11,788Total 14,453
HOLDINGS OF SECURITIES continuedAs at 30 June 2015
78 Australian Foundation Investment Company Limited Annual Report 2015
For
per
sona
l use
onl
y

ISSUES OF SECURITIES
Date of Issue Type Price Remarks20 February 2015 DRP/DSSP $5.97 2.5 per cent discount6 October 2014 SPP $5.88 2.5 per cent discount29 August 2014 DRP/DSSP $5.93 2.5 per cent discount21 February 2014 DRP/DSSP $5.86 2.5 per cent discount30 August 2013 DRP/DSSP $5.64 2.5 per cent discount
DSSP = Dividend Substitution Share Plan22 February 2013 DRP $5.3731 August 2012 DRP $4.3624 February 2012 DRP $4.2619 December 2011 Convertible notes $100 face value Mature 28 February 2017. Interest rate 6.25 per cent
per annum. Conversion price: $5.086431 August 2011 DRP $4.1825 February 2011 DRP $4.72 2.5 per cent discount1 September 2010 DRP $4.65 2.5 per cent discount2 June 2010 SPP $4.62 2.5 per cent discount. SPP = Share Purchase Plan26 February 2010 DRP $4.82 5 per cent discount1 September 2009 DRP $4.69 5 per cent discount2 March 2009 DRP $3.72 5 per cent discount25 August 2008 DRP $4.9811 April 2008 SAP $5.2627 February 2008 DRP $5.26 5 per cent discount 22 August 2007 DRP $5.788 March 2007 DRP $5.6022 December 2006 SAP $4.9023 August 2006 DRP $4.707 March 2006 DRP $4.554 November 2005 SAP $3.9623 August 2005 DRP $3.9018 March 2005 DRP $3.6819 August 2004 DRP $3.29 12 March 2004 DRP $3.29 22 October 2003 1 for 8 rights issue $3.00 15 August 2003 DRP $3.47 16 April 2003 SAP $3.04 7 March 2003 DRP $3.11 14 August 2002 DRP $3.11 5 April 2002 SAP $3.167 March 2002 DRP $3.24 15 August 2001 DRP $3.08 29 June 2001 DRP $2.87 7 March 2001 DRP $2.56 16 August 2000 DRP $2.47 7 March 2000 DRP $2.64 11 August 1999 DRP $2.95 12 April 1999 SAP $2.54 SAP = Share Acquisition Plan15 March 1998 DRP $2.79 4 September 1998 DRP $2.43 DRP = Dividend Reinvestment Plan
* Note for issues of securities in earlier years, please consult the Company’s website, afi.com.au or via telephone (03) 9650 9911.
79Australian Foundation Investment Company Limited Annual Report 2015
For
per
sona
l use
onl
y

COMPANY PARTICULARS
Australian Foundation Investment Company Limited (AFIC)ABN 56 004 147 120
DirectorsTerrence A Campbell AO, ChairmanRoss E Barker, Managing DirectorJacqueline C HeyGraeme R LiebeltJohn PatersonDavid A PeeverFergus D Ryan AOCatherine M Walter AMPeter J Williams
Company SecretariesSimon M PordageAndrew JB Porter
AuditorPricewaterhouseCoopersChartered Accountants
Country of IncorporationAustralia
Registered Office and Mailing AddressLevel 21, 101 Collins Street Melbourne Victoria 3000
Contact DetailsTelephone (03) 9650 9911Facsimile (03) 9650 9100Email [email protected] afi.com.au
For enquiries regarding net asset backing (as advised each month to the Australian Securities Exchange):
Telephone 1800 780 784 (toll free)
Share Registrar AustraliaComputershare Investor Services Pty LtdYarra Falls, 452 Johnston StreetAbbotsford Victoria 3067
New ZealandComputershare Investor Services Pty Ltd159 Hurstmere Road Takapuna Auckland 0622
ShareholderEnquiry Lines 1300 662 270 (Australia) 0800 333 501 (from New Zealand) +61 3 9415 4373 (from overseas)Facsimile (03) 9473 2500Website investorcentre.com.au/contact
For all enquiries relating to shareholdings, noteholdings, dividends and related matters, please contact the Share Registrar as above.
Australian and New Zealand Securities Exchange CodesAFI Ordinary shares (ASX and NZX)AFIG Unsecured convertible notes (ASX)
80 Australian Foundation Investment Company Limited Annual Report 2015
For
per
sona
l use
onl
y
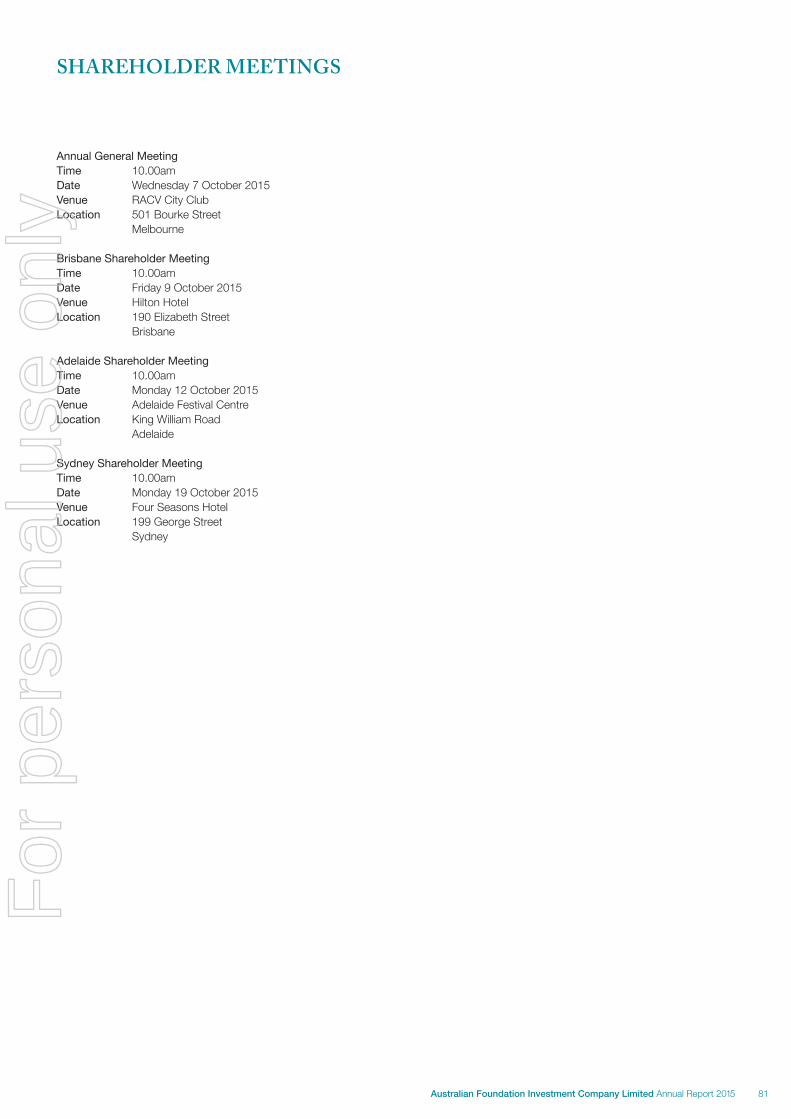
Annual General MeetingTime 10.00amDate Wednesday 7 October 2015Venue RACV City ClubLocation 501 Bourke Street Melbourne
Brisbane Shareholder MeetingTime 10.00am Date Friday 9 October 2015Venue Hilton HotelLocation 190 Elizabeth Street Brisbane
Adelaide Shareholder MeetingTime 10.00amDate Monday 12 October 2015Venue Adelaide Festival CentreLocation King William Road Adelaide
Sydney Shareholder MeetingTime 10.00amDate Monday 19 October 2015Venue Four Seasons HotelLocation 199 George Street Sydney
SHAREHOLDER MEETINGS
81Australian Foundation Investment Company Limited Annual Report 2015
For
per
sona
l use
onl
y

Design: MDM Investor Connect. Printed on environmentally friendly paper.
For
per
sona
l use
onl
y

Annual Review 2015
EXPERIENCE INCOME GROWTH
For
per
sona
l use
onl
y

The Company’s primary investment goals are:
To provide attractive total returns over the medium to long term.
To pay dividends which, over time, grow faster than the rate of inflation.
CONTENTS
1 Year in Summary 2 Review of Operations and Activities 14 Top 25 Investments 15 Income Statement 16 Balance Sheet 17 Summarised Statement
of Changes in Equity 18 Holdings of Securities 25 Major Transactions in the
Investment Portfolio
26 Major Transactions in the Buy and Write Portfolio
27 5 Year Summary 28 Company Particulars 29 Shareholder Meetings
The Company aims to provide shareholders with attractive investment returns through access to a steady stream of fully franked dividends and enhancement of capital invested.
Australian Foundation Investment Company Limited ABN 56 004 147 120
For
per
sona
l use
onl
y

YEAR IN SUMMARY
TOTAL SHAREHOLDER RETURN
+2.8%
Share price plus dividend
FULLY FRANKED DIVIDENDS
14¢ Final23¢ Total
Up 1 cent up from 2014
PROFIT FOR THE YEAR
$293.6mUp 15.5% from 2014
TOTAL PORTFOLIO RETURN
+3.9%
S&P/ASX 200 Accumulation Index +5.7%
TOTAL PORTFOLIO
$6.6b $6.4 billion in 2014
Including cash at 30 June
MANAGEMENT EXPENSE RATIO
0.16%
0.17% in 2014
1Australian Foundation Investment Company Limited Annual Review 2015
For
per
sona
l use
onl
y

ProfitProfit for the year to 30 June 2015 was $293.6 million, up 15.5 per cent from $254.3 million in the corresponding period last year. The profit figure this year includes a non-cash dividend of $31.9 million received as a result of the demerger of South32 from BHP Billiton. Last year’s figure included $11.0 million of demerger dividends from Amcor and Brambles.
Income from investments (excluding demerger dividends), which consists primarily of franked dividend income, was up 8 per cent over the year. The trading portfolio contributed $8.4 million compared to $9.9 million last year.
Earnings per share for the year were 27.2 cents per share compared with 24.4 cents per share last year.
DividendsThe Company has maintained its final dividend at 14 cents per share fully franked, bringing total dividends for the year to 23 cents per share fully franked, an increase of 1 cent from 22 cents last year. The Board notes the profit result provides scope to increase the dividend. Based on expectations, the Board currently intends to apply a 1 cent increase to the interim dividend to be paid in February 2016 to further rebalance the interim and final dividends.
Dividend ImputationAs shareholders may be aware there has recently been significant commentary about the dividend imputation system. The Tax Discussion Paper issued by the Australian Treasury in March 2015 posed a number of questions about the Australian taxation system. Specifically the following questions outlined in the discussion paper relating to dividend Imputation were: ‘Is the dividend imputation system continuing to serve Australia well as our economy becomes increasingly open? Could the taxation of dividends be improved?’.
REVIEW OF OPERATIONS AND ACTIVITIES
2
For
per
sona
l use
onl
y

3Australian Foundation Investment Company Limited Annual Review 2015
For
per
sona
l use
onl
y

AFIC has made a submission to the Tax Discussion Paper. In it we strongly argued that the current imputation system, which avoids the double taxation of corporate profits in the hands of investors, is desirable and has served the Australian capital market very well. The system results in Australian investors being taxed at their marginal rate on the underlying company income by being given a tax credit for the company tax already paid. We believe this to be an equitable system for investors.
In addition, by making the taxation on equity tax neutral with that of debt via the imputation system, Australia reduces the cost of equity for Australian investors. This lowering has led to Australian corporates becoming less geared, and thus less risky, further increasing their relative value to both foreign and domestic investors. We believe that for most companies the imputation system has placed an appropriate discipline on the balance between them paying out dividends and the use of capital for expansion.
We also suggested the imputation system is well understood and appreciated. It has been central to the health and robustness
of the Australian equity market and superannuation system. As a result, any changes would have a significant impact on Australian investors. This is likely to have a negative effect on confidence, which may impact the broader economy.
AFIC’s full submission to the Tax Discussion Paper is available on the Company’s website.
Market and Portfolio PerformanceFigures 1 and 2 highlight the relative performance of different sectors of the market over the financial year. The banks, until recently, and the property trust sector have been the beneficiary of investor attraction to yield. Materials and energy have clearly been impacted by the marked fall in commodity and energy prices. Finally companies in attractive and growing industry segments, such as healthcare and telecommunications services, also generated strong returns. It should be noted AFIC is not typically a large investor in the property trusts given the absence of franking in the dividends and the historical long term underperformance of this sector relative to industrial companies.
REVIEW OF OPERATIONS AND ACTIVITIEScontinued
4
For
per
sona
l use
onl
y

Figure 1: Relative performance of energy, materials and banking sectors in the market
S&P/ASX 200Energy
S&P/ASX 200Materials
S&P/ASX 200Banks
Source: FactSet
May
15
Apr
15
Mar
15
Feb
15
Jan
15
Dec
14
Jun
15
Jul 1
5
Nov
14
Oct
14
Sep
14
Aug
14
Jul 1
4
70
140
130
80
90
100Inde
x 110
120
S&P/ASX 200Telecom Services
S&P/ASX 200Healthcare
S&P/ASX 200Property Trusts
May
15
Apr
15
Mar
15
Feb
15
Jan
15
Dec
14
Jun
15
Jul 1
5
Nov
14
Oct
14
Sep
14
Aug
14
Jul 1
4
70
140
130
Source: FactSet
80
90
100
110
120
Inde
x
Figure 2: Relative performance of telecom services, healthcare andproperty trust sectors in the market
5Australian Foundation Investment Company Limited Annual Review 2015
For
per
sona
l use
onl
y

AFIC’s portfolio return for the 12 months to 30 June 2015 was 3.9 per cent compared with the S&P/ASX 200 Accumulation Index of 5.7 per cent. The 10 year return for AFIC, which is consistent with its approach as a long term investor, was 7.9 per cent per annum versus the Index return of 7.1 per cent per annum. AFIC’s performance numbers are after expenses and tax paid. It should also be noted that Index returns for the market do not include the impact of management expenses and tax on their performance.
The most significant contributors to AFIC’s portfolio performance by value over the year were Commonwealth Bank, Telstra, Amcor, Transurban and Toll Holdings as a result of it being taken over by Japan Post.
Holdings with the biggest negative impact on AFIC’s portfolio performance were companies in the energy and resource sectors, including those companies exposed to these sectors such as Bradken and ALS Limited, as did the performance of Woolworths in the second half of the year. The underweight position in property trusts and to some extent the underweight position in healthcare, in particular CSL, also had a negative impact on relative performance.
The generation of fully franked income is one of the key aspects of AFIC’s investment approach. As an indication of the importance of franking to returns it is useful to look at performance, including the benefit of franking credits. The total portfolio return for one year, including dividends paid and the full benefit of franking credits, was 5.6 per cent. This compares with the S&P/ASX 200 Accumulation Index calculated on the same basis which was 6.8 per cent. The comparable 10 year return for the portfolio was 9.8 per cent per annum against the benchmark return of 8.5 per cent per annum.
Share Price PerformanceThe share price underperformed the portfolio return as the share price premium to the net asset backing (before tax on unrealised gains) fell from 5.8 per cent to 4.6 per cent over the course of the financial year. Importantly the share price over the long term has also performed well with this return aligned to the longer term portfolio returns.
REVIEW OF OPERATIONS AND ACTIVITIEScontinued
6
For
per
sona
l use
onl
y

Figure 4: Share price premium/discount to net asset backing
15%
-15%
-10%
-5%
0%
5%
10%
Jun
05
Jun
07
Jun
09
Jun
11
Jun
13
Jun
15
Figure 3: Portfolio and share price performance to 30 June 2015
10 year return
Net asset per share growth plus dividends S&P/ASX 200 Accumulation IndexShare price growth plus dividends
1 year return 3 year return 5 year return
15.1
%
14.9
% 18.3
%
5.7%
3.9%
2.8% 7.
9% 9. 4
%
7.1%10
.0%
9.9%
9.7%
7Australian Foundation Investment Company Limited Annual Review 2015
For
per
sona
l use
onl
y

Figure 5 outlines the benefit of compound returns and the value of AFIC’s investment approach. It shows the total share price return (including dividends and the full benefit of franking credits) from an investment of $1,000 in AFIC shares over a 10 year period relative to the return from the S&P/ASX 200 Accumulation Index, including franking credits.
Investment Portfolio ActivityAFIC is a long term investor. Its particular interest is in companies that can deliver long term value and share their prosperity by growing dividends over time. Given extremely low interest rates, significant investor interest has also been in companies with good dividend yields driving those share prices to high levels for most of the year. Companies delivering reliable earnings growth also tended to trade at very high price earnings ratios (P/E ratio). Given these high valuations for most of the year it has been challenging to find value.
As a result, our primary investment interest this year has been to broaden the portfolio, including building particular areas in the portfolio such as Health and Aged Care and adding some smaller companies, including participation in selected initial public offerings (IPOs).
Major purchases in the investment portfolio included CSL and AGL (through its rights issue). Federation Centres was introduced to the portfolio during the year, with this holding further increased as a result of the merger with Novion Property Group. Other new companies added to the portfolio included Healthscope (via its IPO), Cover-More Group, Veda Group, Regis Healthcare (via its IPO) and Sims Metal Management.
Details of the new stocks added during year are:
• Federation Centres (following the merger between Federation Centres and Novion Property Group on 11 June 2015) is one of Australia’s largest owners and managers of shopping centres. The group’s portfolio of assets ranges from large super-regional malls to direct factory outlets, smaller convenience and neighbourhood centres across Australia.
• Healthscope is one of Australia’s leading private healthcare operators, providing services through the operation of private hospitals and medical centres in Australia.
• Cover-More Group is a specialist and integrated travel insurance and medical assistance provider. The company holds the leading market position in Australia, with over 40 per cent market share through 25,000 active agents. It is also steadily growing its footprint in Asia. Cover-More was established in 1986 and listed on the ASX in December 2013.
REVIEW OF OPERATIONS AND ACTIVITIEScontinued
8
For
per
sona
l use
onl
y

• Veda Group is the largest credit reference agency in Australia and New Zealand. It provides credit reporting, credit scoring and marketing analytics services.
• Regis Healthcare is one of the largest and most geographically diversified private Australian residential aged care providers, operating a large portfolio of high quality aged care facilities. Regis was formed in the early 1990s and listed on the ASX in October 2014.
• Sims Metal Management is the leading metals and electronics recycling company in the world. The company specialises in ferrous and non-ferrous metals recycling,
post-consumer electronic goods recycling, and municipal waste recycling. Its primary operations are located in the United States, Australia and the United Kingdom.
The largest sales resulted from the takeover of Toll Holdings by Japan Post and activity in the Company’s small buy and write portfolio, which led to the exercise of call options in Telstra, CSL, Transurban and Suncorp.
Overall purchases for the year totalled $377.1 million, with sales totalling $262.1 million.
Figure 5: Ten year performance of an investment of $1,000 in AFIC shares including dividends and the full bene�t of franking
Share price growth plusdividends including franking
S&P/ASX 200 Accumulation Indexincluding franking
Jun
15
Jun
05
Jun
06
Jun
07
Jun
08
Jun
09
Jun
10
Jun
11
Jun
12
Jun
13
Jun
14
$0
$3,500
$3,000
$500
$1,000
$1,500
$2,000
$2,500
Note: Assumes the reinvestment of dividends. This chart calculates the benefit of franking creditsat the time dividends are paid for both AFIC and the Index. In practice there is a timing difference between receipt of the dividend and the realisation of the franking benefit in the following tax year.
9Australian Foundation Investment Company Limited Annual Review 2015
For
per
sona
l use
onl
y

Figure 6 highlights the profile of the total portfolio by the various sectors of the market at the end of the financial year. In comparison to last year there has been an increase in portfolio weightings in Healthcare (up from 3.6 per cent last year) and Telecom Services (up from 4.8 per cent last year) sectors. There was also an increase in cash to 2.5 per cent from 1.1 per cent at the end of last year. The biggest reduction was in Energy (down from 9.3 per cent last year) as the fall in oil price over the year impacted the share prices of companies in this sector.
OutlookThe expectation is that low interest rates will be a feature of global markets for some time. In the more immediate term it is likely there will be periods of volatility as concerns arise about the risks in Europe, China and as adjustments are made over time to monetary policy settings by the Federal
Reserve in the United States. However, the low interest rate environment in Australia is likely to provide underlying support to the market even in light of these other factors, which may produce some setbacks.
Figure 7 reinforces the attractiveness of equity yields when compared to 10 year government bond yields. The gap between equity yields and 10 year government bond yields remains high in response to subdued growth, low inflation and monetary policy.
The P/E ratio shows how much investors are willing to pay per dollar of earnings growth.
However, given the current environment in Australia where earnings growth is likely to be subdued as a result of current economic settings, it is evident that investors are also willing to pay above average P/E ratios given the low interest rates. As a result, the market is at the upper end of valuation levels despite recent falls.
REVIEW OF OPERATIONS AND ACTIVITIEScontinued
10
For
per
sona
l use
onl
y

1.4%
Cons
umer
Disc
retio
nary
Prop
erty
Trus
ts
2.0%
Info
rmat
ion
Tech
nolo
gy
2.5%
Cash
5.7%Te
leco
mSe
rvic
es2.7%
Utili
ties
5.9%
Heal
thca
re
6.7%
Ener
gy
8.1%
Indu
stria
ls
8.0%
Cons
umer
Stap
les
9.2%
Othe
rFi
nanc
ials
16.7%
Mat
eria
ls
29.1%
Bank
s
Figure 6: Investment by sector as at 30 June 2015
2.0%
Figure 7: Australian equity yields versus 10 year government bond yields
Australian 10 year bond yield Equity yield S&P/ASX 200 Index
Jul 1
4
Jul 0
0
Jul 0
1
Jul 0
2
Jul 0
3
Jul 0
4
Jul 0
5
Jul 0
6
Jul 0
7
Jul 0
8
Jul 0
9
Jul 1
0
Jul 1
1
Jul 1
2
Jul 1
3
0%
12%
2%
4%
6%
8%
10%
11Australian Foundation Investment Company Limited Annual Review 2015
For
per
sona
l use
onl
y
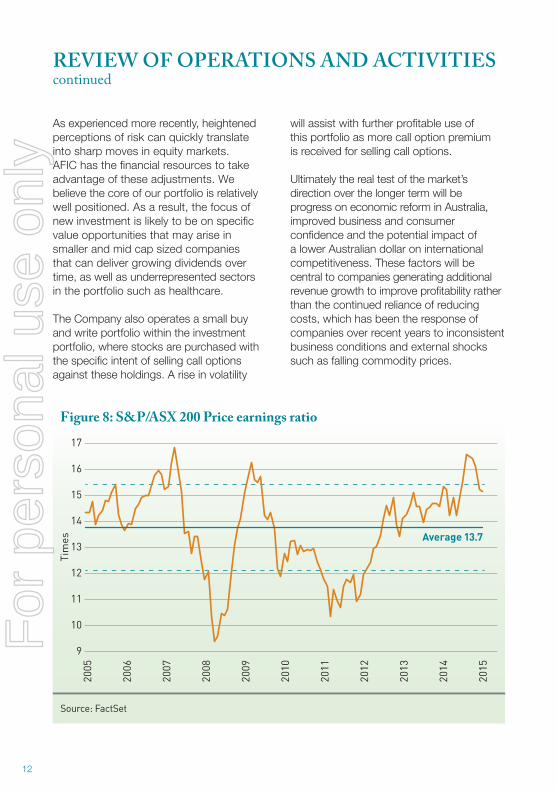
As experienced more recently, heightened perceptions of risk can quickly translate into sharp moves in equity markets. AFIC has the financial resources to take advantage of these adjustments. We believe the core of our portfolio is relatively well positioned. As a result, the focus of new investment is likely to be on specific value opportunities that may arise in smaller and mid cap sized companies that can deliver growing dividends over time, as well as underrepresented sectors in the portfolio such as healthcare.
The Company also operates a small buy and write portfolio within the investment portfolio, where stocks are purchased with the specific intent of selling call options against these holdings. A rise in volatility
will assist with further profitable use of this portfolio as more call option premium is received for selling call options.
Ultimately the real test of the market’s direction over the longer term will be progress on economic reform in Australia, improved business and consumer confidence and the potential impact of a lower Australian dollar on international competitiveness. These factors will be central to companies generating additional revenue growth to improve profitability rather than the continued reliance of reducing costs, which has been the response of companies over recent years to inconsistent business conditions and external shocks such as falling commodity prices.
REVIEW OF OPERATIONS AND ACTIVITIEScontinued
Figure 8: S&P/ASX 200 Price earnings ratio
2015
2005
2006
2007
2008
2009
2010
2011
2012
2013
2014
9
17
16
Source: FactSet
10
11
12
13
14
15
Average 13.7
Tim
es
12
For
per
sona
l use
onl
y

13Australian Foundation Investment Company Limited Annual Review 2015
For
per
sona
l use
onl
y

TOP 25 INVESTMENTSAs at 30 June 2015
Includes investments held in both the investment and trading portfolios.
Valued at closing prices at 30 June 2015Total Value
$ Million% of
Portfolio1 Commonwealth Bank of Australia 722.1 11.32 Westpac Banking Corporation 586.3 9.13 BHP Billiton* 384.6 6.04 National Australia Bank 336.3 5.25 Telstra Corporation 322.0 5.06 Wesfarmers 289.7 4.57 Australia and New Zealand Banking Group 273.3 4.38 Rio Tinto 196.3 3.19 Amcor 176.5 2.810 Transurban Group 170.5 2.711 Woolworths 161.8 2.512 AMP 121.0 1.913 Oil Search* 119.6 1.914 Brambles 118.4 1.815 Woodside Petroleum* 116.8 1.816 QBE Insurance Group* 113.3 1.817 CSL* 101.2 1.618 Computershare 95.5 1.519 AGL Energy 94.9 1.520 APA Group 85.2 1.321 Incitec Pivot 84.8 1.322 Ramsay Health Care 83.6 1.323 Origin Energy 83.3 1.324 Milton Corporation 64.8 1.025 Santos 62.9 1.0Total 4,964.9
As a percentage of total portfolio value (excludes cash) 77.4%
* Indicates that options were outstanding against part of the holding.
14
For
per
sona
l use
onl
y

2015 $’000
2014 $’000
Dividends and distributions 317,762 275,793Revenue from deposits and bank bills 3,425 4,898Other revenue 58 -Net gains on trading portfolio (including unrealised gains or losses) 8,440 9,945Total income 329,685 290,636
Finance costs (15,757) (20,525)Administration expenses (net of recoveries) (10,464) (9,914)Profit before income tax 303,464 260,197
Income tax (9,860) (5,904)Net profit 293,604 254,293
Cents CentsNet profit per share 27.23 24.35
INCOME STATEMENTFor the year ended 30 June 2015
15Australian Foundation Investment Company Limited Annual Review 2015
For
per
sona
l use
onl
y

BALANCE SHEETAs at 30 June 2015
2015$’000
2014$’000
Current assetsCash 163,840 69,084Receivables 46,059 65,758Trading portfolio 1,930 -Total current assets 211,829 134,842
Non-current assetsFixtures and fittings - 76Investment portfolio 6,412,242 6,326,268Deferred tax assets 527 864Total non-current assets 6,412,769 6,327,208
Total assets 6,624,598 6,462,050
Current liabilitiesPayables 10,783 6,128Tax payable 30,050 13,419Borrowings - 100,000Trading portfolio - 1,980Provisions 3,409 3,213Interest rate hedging contracts - 281Total current liabilities 44,242 125,021
Non-current liabilitiesProvisions 1,508 1,089Convertible notes 202,252 203,779Deferred tax liabilities – investment portfolio 930,152 948,009Total non-current liabilities 1,133,912 1,152,877
Total liabilities 1,178,154 1,277,898
Net assets 5,446,444 5,184,152
Shareholders’ equityShare capital 2,301,282 2,064,986Revaluation reserve 2,152,455 2,253,053Realised capital gains reserve 391,773 317,624General reserve 23,637 23,637Interest rate hedging reserve - (281)Retained profits 577,297 525,133Total shareholders’ equity (including minority interests) 5,446,444 5,184,152
16
For
per
sona
l use
onl
y

SUMMARISED STATEMENT OF CHANGES IN EQUITY For the year ended 30 June 2015
2015 $’000
2014 $’000
Total equity at the beginning of the year 5,184,152 4,626,692
Dividends paid (241,486) (226,336)Shares issued – Dividend Reinvestment Plan 49,724 46,064 – Conversion of convertible notes 2,423 16,660 – Share Purchase Plan 184,671 -Other share capital adjustments (522) 84
Total transactions with shareholders (5,190) (163,528)
Profit for the year 293,604 254,293
Revaluation of investment portfolio (23,281) 665,894
Provision for tax on revaluation (3,122) (200,411)Revaluation of investment portfolio (after tax) (26,403) 465,483
Net movement in fair value for interest rate swaps 281 1,212
Total comprehensive income for the year 267,482 720,988
Realised gains on securities sold 95,109 18,389
Tax expense on realised gains on securities sold (20,960) (4,194)Net realised gains on securities sold 74,149 14,195
Transfer from revaluation reserve to realised gains reserve (74,149) (14,195)
Total equity at the end of the year 5,446,444 5,184,152
A full set of AFIC’s final accounts are available on the Company’s website.
17Australian Foundation Investment Company Limited Annual Review 2015
For
per
sona
l use
onl
y

HOLDINGS OF SECURITIESAs at 30 June 2015
Individual investments for the combined investment and trading portfolios as at 30 June 2015 are listed below. The list should not, however, be used to evaluate portfolio performance or to determine the net asset backing per share at other dates. Net asset backing is advised to the Australian Securities Exchange each month and is recorded on the toll free telephone service at 1800 780 784 and posted to AFIC’s website afi.com.au
Individual holdings in the portfolios may change during the course of the year. In addition, holdings that are part of the trading portfolio may be subject to call options or sale commitments, by which they may be sold at a price significantly different from the market price prevailing at the time of the exercise or sale.
Code Ordinary Shares, Trust Units or Stapled Securities
Number Held 2014 ’000
Number Held 2015 ’000
Market Value 2015 $’000
AGL AGL Energy 5,083 6,100 94,852AHD Amalgamated Holdings 775 1,030 12,919AIA Auckland International Airport 1,170 1,170 5,125AIO* Asciano 2,810 4,855 31,777ALQ ALS 4,826 4,942 28,913AMC Amcor 12,864 12,864 176,496AMP AMP 20,100 20,100 121,005ANN Ansell 1,284 1,284 30,928ANZ Australia and New Zealand Banking Group 8,488 8,488 273,304
18
For
per
sona
l use
onl
y

Code Ordinary Shares, Trust Units or Stapled Securities
Number Held 2014 ’000
Number Held 2015 ’000
Market Value 2015
$’000
APA APA Group 11,643 10,340 85,202APE AP Eagers 325 769 7,194ARB ARB Corporation 583 948 12,353ASH Ashley Services Group 0 4,819 2,867ASX ASX 550 459 18,302AWC Alumina 14,323 14,323 21,914AZJ* Aurizon Holdings 2,980 2,480 12,700BGA Bega Cheese 2,203 2,203 9,538BHP* BHP Billiton 14,221 14,221 384,632BKL Blackmores 36 36 2,725BKN Bradken 6,000 1,576 2,261BKW Brickworks 1,503 1,503 20,741BLD Boral 4,008 4,008 23,450BXB Brambles 11,174 11,174 118,439CAJ Capitol Health 0 9,905 7,577CBA Commonwealth Bank of Australia 8,483 8,483 722,149CCL Coca-Cola Amatil 5,160 5,160 47,214CPU Computershare 8,156 8,156 95,511
19Australian Foundation Investment Company Limited Annual Review 2015
For
per
sona
l use
onl
y

Code Ordinary Shares, Trust Units or Stapled Securities
Number Held 2014 ’000
Number Held 2015 ’000
Market Value 2015 $’000
CSL* CSL 1,002 1,172 101,239CSR CSR 2,492 2,492 9,072CTX Caltex Australia 655 605 19,269CVO Cover-More Group 0 4,737 11,275CWP Cedar Woods Properties 4,060 3,859 20,299DJW Djerriwarrh Investments 8,597 8,597 40,318DLX DuluxGroup 2,556 2,556 14,621DUI Diversified United Investment 12,030 12,030 42,226EHE Estia Health 0 952 5,709EQT Equity Trustees 1,456 1,488 30,345FBU Fletcher Building 1,115 1,115 8,040FDC* Federation Centres 0 17,378 50,739FLT Flight Centre Travel Group 131 241 8,219FOX Twenty-First Century Fox 459 459 19,443FPH Fisher & Paykel Healthcare 800 1,706 10,390
HOLDINGS OF SECURITIES continuedAs at 30 June 2015
20
For
per
sona
l use
onl
y

Code Ordinary Shares, Trust Units or Stapled Securities
Number Held 2014 ’000
Number Held 2015 ’000
Market Value 2015
$’000
HSO Healthscope 0 7,885 21,446IAG Insurance Australia Group 4,255 3,500 19,531ICQ iCar Asia 2,855 4,155 2,929ILU Iluka Resources 2,367 2,367 18,179IPL Incitec Pivot 22,209 22,029 84,813IPP iProperty Group 4,488 5,326 12,783IRE IRESS 2,709 2,709 27,419IVC InvoCare 1,279 1,150 13,915JHC Japara Healthcare 6,000 10,393 26,710JHX James Hardie Industries 1,150 1,350 23,382LIC Lifestyle Communities 2,659 4,293 10,475MIR Mirrabooka Investments 8,728 8,728 22,692MLT Milton Corporation 14,403 14,403 64,813MQA* Macquarie Atlas Roads 0 1,000 3,169NAB National Australia Bank 9,543 10,097 336,345
21Australian Foundation Investment Company Limited Annual Review 2015
For
per
sona
l use
onl
y
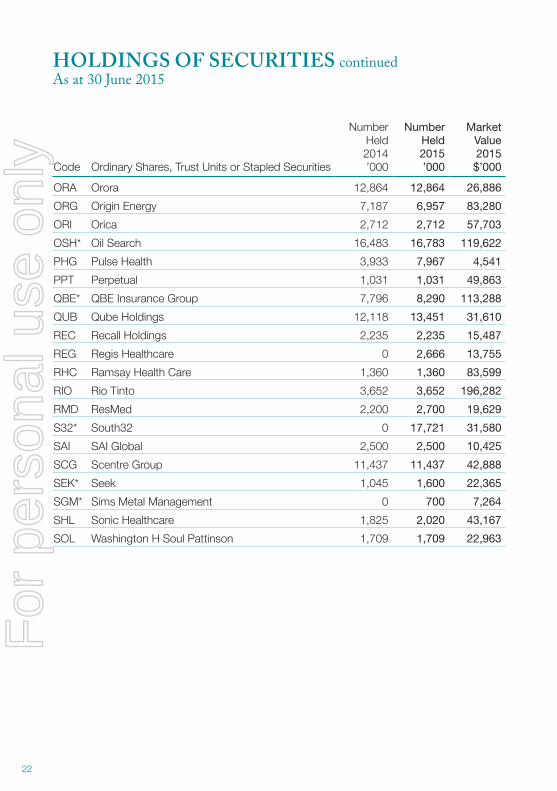
Code Ordinary Shares, Trust Units or Stapled Securities
Number Held 2014 ’000
Number Held 2015 ’000
Market Value 2015 $’000
ORA Orora 12,864 12,864 26,886ORG Origin Energy 7,187 6,957 83,280ORI Orica 2,712 2,712 57,703OSH* Oil Search 16,483 16,783 119,622PHG Pulse Health 3,933 7,967 4,541PPT Perpetual 1,031 1,031 49,863QBE* QBE Insurance Group 7,796 8,290 113,288QUB Qube Holdings 12,118 13,451 31,610REC Recall Holdings 2,235 2,235 15,487REG Regis Healthcare 0 2,666 13,755RHC Ramsay Health Care 1,360 1,360 83,599RIO Rio Tinto 3,652 3,652 196,282RMD ResMed 2,200 2,700 19,629S32* South32 0 17,721 31,580SAI SAI Global 2,500 2,500 10,425SCG Scentre Group 11,437 11,437 42,888SEK* Seek 1,045 1,600 22,365SGM* Sims Metal Management 0 700 7,264SHL Sonic Healthcare 1,825 2,020 43,167SOL Washington H Soul Pattinson 1,709 1,709 22,963
HOLDINGS OF SECURITIES continuedAs at 30 June 2015
22
For
per
sona
l use
onl
y

Code Ordinary Shares, Trust Units or Stapled Securities
Number Held 2014 ’000
Number Held 2015 ’000
Market Value 2015
$’000
SRX Sirtex Medical 0 220 6,391STO Santos 8,178 8,037 62,927SUN* Suncorp Group 2,260 1,740 23,299SXY Senex Energy 46,717 46,467 13,011SYD Sydney Airport 6,782 6,782 33,774TCL Transurban Group 19,795 18,335 170,518TGG Templeton Global Growth Fund 9,685 12,106 15,798TLS Telstra Corporation 55,095 52,445 322,012TOX Tox Free Solutions 10,661 10,661 32,197TPM TPG Telecom 3,597 4,677 41,950TWE Treasury Wine Estates 3,258 3,258 16,255VED Veda Group 0 4,100 9,102VOC Vocus Communications 466 1,725 9,951WBC Westpac Banking Corporation 18,236 18,236 586,295WES Wesfarmers 7,553 7,423 289,703WFD Westfield Corporation 4,243 4,243 38,692WOR WorleyParsons 310 310 3,227WOW Woolworths 6,314 6,000 161,760WPL* Woodside Petroleum 3,283 3,413 116,768Total 6,399,719
* Part of the security was subject to call options written by the Company.
23Australian Foundation Investment Company Limited Annual Review 2015
For
per
sona
l use
onl
y

CodeConvertible Notes, Preference Shares and Other Interest Bearing Securities
Number Held 2014 ’000
Number Held 2015 ’000
Market Value 2015
$’000PPCG Peet 9.5% convertible notes 26 26 2,665RHCPA Ramsay Health Care convertible adjustable
rate equity securities115 115 11,788
Total 14,453
HOLDINGS OF SECURITIES continuedAs at 30 June 2015
24
For
per
sona
l use
onl
y
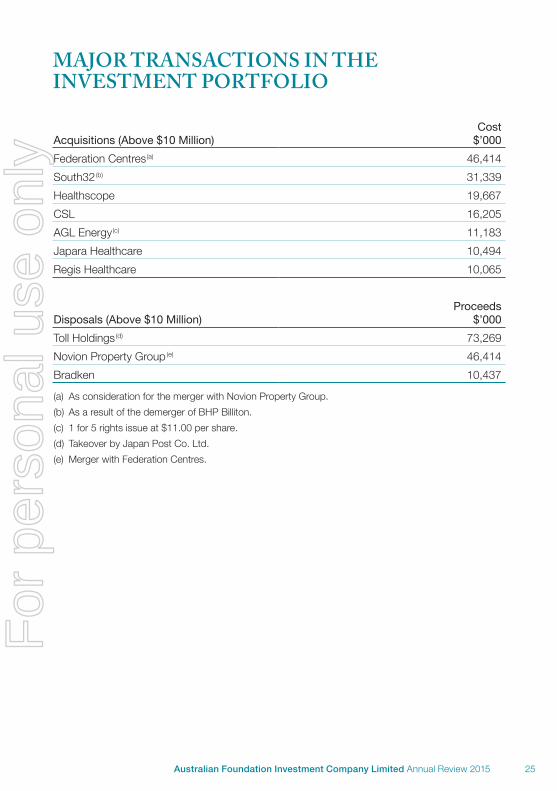
Acquisitions (Above $10 Million)Cost
$’000Federation Centres(a) 46,414South32 (b) 31,339Healthscope 19,667CSL 16,205AGL Energy (c) 11,183Japara Healthcare 10,494Regis Healthcare 10,065
Disposals (Above $10 Million)Proceeds
$’000Toll Holdings (d) 73,269Novion Property Group(e) 46,414Bradken 10,437
(a) As consideration for the merger with Novion Property Group.(b) As a result of the demerger of BHP Billiton.(c) 1 for 5 rights issue at $11.00 per share.(d) Takeover by Japan Post Co. Ltd.(e) Merger with Federation Centres.
MAJOR TRANSACTIONS IN THE INVESTMENT PORTFOLIO
25Australian Foundation Investment Company Limited Annual Review 2015
For
per
sona
l use
onl
y

Acquisitions (Above $10 Million)Cost
$’000National Australia Bank(a) 24,895CSL 11,851Asciano 11,509
Disposals (Above $10 Million)Proceeds
$’000Telstra (from the exercise of call options) 15,017CSL (from the exercise of call options) 12,551Transurban Group (mostly from the exercise of call options) 11,171Suncorp Group (mostly from the exercise of call options) 10,877National Australia Bank ($7 million from the exercise of call options) 10,414
(a) Includes $21.5 million from 2 for 25 rights issue at $28.50 per share.
MAJOR TRANSACTIONS IN THE BUY AND WRITE PORTFOLIO
26
For
per
sona
l use
onl
y

2015 2014 2013 2012 2011Net profit after tax ($ million) 293.6 254.3 242.8 219.9 233.3Net profit per share (cents) 27.2 24.4 23.5 21.5 23.0Dividends per share (cents)(a) 23 22 22 21 21Investments at market value ($ million)(b) 6,414 6,324 5,411 4,570 4,885Net asset backing (cents) (c) 585.1 584.5 518.5 435.1 478.9Number of shareholders (30 June) 107,622 103,188 96,668 93,513 93,092
Notes(a) All dividends were fully franked. The LIC attributable gain attached to the dividend was:
2015: 7.1 cents, 2014: nil, 2013: 4.3 cents, 2012 and 2011: nil.(b) Excludes cash.(c) Net asset backing per share based on year-end data before the provision for the final dividend. The
figures do not include a provision for capital gains tax that would apply if all securities held as non-current investments had been sold at balance date as Directors do not intend to dispose of the portfolio.
5 YEAR SUMMARY
27Australian Foundation Investment Company Limited Annual Review 2015
For
per
sona
l use
onl
y

COMPANY PARTICULARS
Contact DetailsTelephone (03) 9650 9911Facsimile (03) 9650 9100Email [email protected] afi.com.au
For enquiries regarding net asset backing (as advised each month to the Australian Securities Exchange):
Telephone 1800 780 784 (toll free)
Share RegistrarComputershare Investor Services Pty LtdYarra Falls, 452 Johnston StreetAbbotsford Victoria 3067
ShareholderEnquiry Lines 1300 662 270 (Australia) 0800 333 501 (from New Zealand) +61 3 9415 4373 (from overseas)Facsimile (03) 9473 2500Website investorcentre.com.au/contact
For all enquiries relating to shareholdings, dividends and related matters, please contact the Share Registrar in your country.
Australian and New Zealand Securities Exchange CodesAFI Ordinary shares (ASX and NZX)AFIG Unsecured convertible notes (ASX)
Australian Foundation Investment Company Limited (AFIC)ABN 56 004 147 120
AFIC is a listed investment company. As such it is an investor in equities and similar securities on the stock market primarily in Australia.
DirectorsTerrence A Campbell AO, ChairmanRoss E Barker, Managing DirectorJacqueline C HeyGraeme R LiebeltJohn PatersonDavid A Peever Fergus D Ryan AOCatherine M Walter AMPeter J Williams
Company SecretariesSimon M PordageAndrew JB Porter
AuditorPricewaterhouseCoopers Chartered Accountants
Country of IncorporationAustralia
Registered Office and Mailing AddressLevel 21, 101 Collins Street Melbourne Victoria 3000
28
For
per
sona
l use
onl
y

SHAREHOLDER MEETINGS
Annual General MeetingTime 10.00amDate Wednesday 7 October 2015Venue RACV City ClubLocation 501 Bourke Street Melbourne
Brisbane MeetingTime 10.00amDate Friday 9 October 2015Venue Hilton HotelLocation 190 Elizabeth Street Brisbane
Adelaide MeetingTime 10.00amDate Monday 12 October 2015Venue Adelaide Festival CentreLocation King William Road Adelaide
Sydney MeetingTime 10.00amDate Monday 19 October 2015Venue Four Seasons HotelLocation 199 George Street Sydney
The Annual Report for 2015 is available on AFIC’s website afi.com.au or by contacting the Company on (03) 9650 9911.
29Australian Foundation Investment Company Limited Annual Review 2015
For
per
sona
l use
onl
y

Design: MDM Investor Connect. Printed on environmentally friendly paper.
For
per
sona
l use
onl
y
1
NOTICE OF ANNUAL GENERAL MEETING 2015 The Annual General Meeting of Australian Foundation Investment Company Limited, ABN: 56 004 147 120
(the Company) will be held at: RACV CITY CLUB, 501 BOURKE STREET, MELBOURNE, VICTORIA 3000 at
10.00am (AEDT) on Wednesday 7 October 2015.
The Company has determined that, for the purpose of voting at the meeting, shares will be taken to be held
by those persons recorded on the Company's register at 7.00pm (AEDT) on Monday 5 October 2015.
BUSINESS OF THE MEETING
1. FINANCIAL STATEMENTS AND REPORTS
To consider the Directors' Report, Financial Statements and Independent Audit Report for the financial year
ended 30 June 2015.
(Please note that no resolution will be required to be passed on this matter)
2. ADOPTION OF REMUNERATION REPORT
To consider and, if thought fit, to pass the following resolution (as an ordinary resolution):
“That the Remuneration Report for the financial year ended 30 June 2015 be adopted.”
(Please note that the vote on this item is advisory only)
3. & 4. RE-ELECTION OF DIRECTORS
To consider and, if thought fit, to pass the following resolutions (as ordinary resolutions):
"That Mr Graeme Liebelt, a Director retiring from office in accordance with Rule 46 of the Constitution, being
eligible is re-elected as a Director of the Company."
"That Mr Terrence Campbell AO, a Director retiring from office in accordance with Rule 46 of the
Constitution, being eligible is re-elected as a Director of the Company."
5. RENEWAL OF PARTIAL TAKEOVER APPROVAL RULES
To consider and, if thought fit, pass the following resolution (as a special resolution):
"To insert Rules 79 and 80 relating to partial takeover approvals in the Company’s constitution in the form
provided in the Explanatory Notes. If renewed, these Rules will come into effect from the close of the 2015
Annual General Meeting and will cease to have effect (unless renewed earlier) on 7 October 2018”.
By Order of the Board
Simon Pordage
Company Secretary
27 August 2015
For
per
sona
l use
onl
y

Australian Foundation Investment Company Limited
Notice of Annual General Meeting 2015
2
EXPLANATORY NOTES
The Explanatory Notes below provide additional information regarding the items of business proposed for the
Annual General Meeting.
IMPORTANT: Shareholders are urged to direct their proxy how to vote by clearly marking the
relevant box for each item on the proxy form.
Please ensure that your properly completed proxy form reaches the share registry by the deadline of
10.00am (AEDT) on Monday 5 October 2015.
1. FINANCIAL STATEMENTS AND REPORTS
During this item there will be a reasonable opportunity for shareholders to ask questions and comment on
the Directors' Report, Financial Statements and Independent Audit Report for the financial year ended
30 June 2015. No resolution will be required to be passed on this matter.
Shareholders who have not elected to receive a hard copy of the Company’s 2015 Annual Report can view
or download it from the Company’s website at:
www.afi.com.au/Reports-by-year.aspx
2. ADOPTION OF REMUNERATION REPORT
Board recommendation and undirected proxies: The Board recommends that shareholders vote in
FAVOUR of item 2. The Chairman of the meeting intends to vote undirected proxies in FAVOUR of item 2.
During this item there will be a reasonable opportunity for shareholders at the meeting to comment on and
ask questions about the Remuneration Report which can be found in the Company’s 2015 Annual Report.
As prescribed by the Corporations Act, the vote on the proposed resolution is an advisory one.
Voting exclusions on item 2
Pursuant to section 250R(4) of the Corporations Act 2001, the Company is required to disregard any votes
cast on item 2 (in any capacity) by or on behalf of either a member of the key management personnel, details
of whose remuneration are included in the remuneration report; or a closely related party of such a member
(together “prohibited persons”).
However, the Company will not disregard a vote if:
• the prohibited person does so as a proxy appointed by writing that specifies how the proxy is to vote on
the proposed resolution; and
• the vote is not cast on behalf of a prohibited person.
If the Chairman of the meeting is appointed, or taken to be appointed, as a proxy, the shareholder can direct
the Chairman of the meeting to vote for or against, or to abstain from voting on, the resolution on item 2
(Adoption of Remuneration Report) by marking the appropriate box opposite item 2 on the proxy form.
Pursuant to section 250R(5) of the Corporations Act 2001, if the Chairman of the meeting is a proxy
and the relevant shareholder does not mark any of the boxes opposite item 2, the relevant
shareholder will be expressly authorising the Chairman to exercise the proxy in relation to item 2.
For
per
sona
l use
onl
y

Australian Foundation Investment Company Limited
Notice of Annual General Meeting 2015
3
ITEMS 3 & 4. RE-ELECTION OF DIRECTORS
Board recommendation and undirected proxies: The Board recommends that shareholders vote in
FAVOUR of items 3 & 4. The Chairman of the meeting intends to vote undirected proxies in FAVOUR
of items 3 & 4.
Mr Liebelt and Mr Campbell AO were elected and re-elected respectively as Directors by shareholders at the
2012 AGM. As such they are required to seek re-election by shareholders at this AGM. Their biographical
details are set out below:
Graeme R Liebelt
B Ec (Hons), FAICD. Independent Non-Executive Director. Chairman of the Remuneration Committee.
Mr Liebelt has been a Director of the Company since June 2012. He is Chairman of Amcor Limited, Director
of Australia and New Zealand Banking Group Limited, Deputy Chairman of the Melbourne Business School
Limited and a Director of Carey Baptist Grammar School. He is a Fellow of the Australian Academy of
Technological Sciences and Engineering and a Fellow of the Australian Institute of Company Directors. He was
formerly Managing Director and CEO of Orica Limited and Chairman and Director of the Global Foundation.
Terrence A Campbell AO
BCom (Melb). Chairman and Independent Non-Executive Director. Chairman of the Investment
Committee and member of the Remuneration and Nomination Committees.
Mr Campbell has been a Director of the Company since September 1984, appointed Deputy Chairman in
September 2008 and Chairman in October 2013. He is Senior Chairman of Goldman Sachs Australia and
New Zealand (formerly Goldman Sachs JBWere) and Advisory Director of Goldman Sachs. Mr Campbell
was formerly Chairman and Chief Executive of Goldman Sachs JBWere. He is also Chairman of Mirrabooka
Investments Limited and a former Director of Djerriwarrh Investments Limited and AMCIL Limited.
Further information regarding the Company’s Corporate Governance arrangements and the Board’s role can
be found on the Company’s website at:
www.afi.com.au/Corporate-Governance.aspx
5. RENEWAL OF PARTIAL TAKEOVER APPROVAL RULES
Board recommendation and undirected proxies: The Board recommends that shareholders vote in
FAVOUR of item 5. The Chairman of the meeting intends to vote undirected proxies in FAVOUR of item 5.
This is the Explanatory Statement pursuant to Section 648G of the Corporations Act 2001 (Cth) in relation to
altering the Constitution of the Company.
The Corporations Act permits a company to include rules in its Constitution which enable the company to
refuse to register a transfer of shares resulting from a partial (or proportional) takeover bid unless a
resolution is first passed by members approving the takeover bid.
The proposed adoption of the partial takeover approval provisions
The Directors propose to renew the following partial takeover approval rules in the Company’s Constitution.
They mirror exactly the existing Rules 79 and 80, previously approved by shareholders at the 2012 AGM and
which will expire on 10 October 2015 unless renewed earlier:
79. Restriction on Registration
Subject to the Corporations Act and the Listing Rules, the registration of any transfer of shares giving effect to a
takeover contract under a proportional takeover bid in respect of shares in a class of shares in the Company is
prohibited unless and until a resolution to approve the takeover bid is passed in accordance with rule 80.
For
per
sona
l use
onl
y

Australian Foundation Investment Company Limited
Notice of Annual General Meeting 2015
4
80. Procedures
(a) Subject to rule 80(b), the only persons entitled to vote on a resolution to approve a proportional
takeover bid are those persons who, as at the end of the day on which the first offer under the takeover
bid was made, held shares included in the bid class for which the offer was made. Each person entitled
to vote has one vote for each share in the relevant class held by the person at that time.
(b) Neither the bidder under the takeover bid nor any associate of the bidder is entitled to vote on
the resolution.
(c) The resolution is to be considered at a meeting convened and conducted by the Company of the
persons entitled to vote on the resolutions. The provisions of this Constitution relating to general
meetings apply to the meeting with any modifications the Directors decide are required in the
circumstances.
(d) The resolution is taken to have been passed only if the proportion that the number of votes in favour
of the resolution bears to the total number of votes on the resolution is greater than 50 per cent.
If approved by shareholders at the meeting, the proposed Rules 79 and 80 will operate for three years from
the date of the meeting (that is, until 7 October 2018) unless renewed earlier.
Partial takeover bids
A partial takeover bid involves the bidder offering to buy a proportion only of each shareholder's shares in the
target company.
This means that control of the target company may pass without members having the chance to sell all their
shares to the bidder. It also means the bidder may acquire control of the target company without paying an
adequate premium for gaining control.
To address this possibility, a company may provide in its Constitution that, in the event of a partial takeover
bid being made for shares in the company, the directors must convene a meeting of shareholders to vote on
a resolution to approve that bid.
A meeting convened under the partial takeover provisions is treated as a general meeting of the company
and the majority decision of the company's members will be binding on all individual members.
The Directors consider that it is in the interests of shareholders for the Company to have the partial takeover
approval rules in the Constitution of the Company.
Effect of proposed partial takeover approval rules
Where a partial takeover bid is made, the Directors must convene a meeting of shareholders to vote on a
resolution to approve the partial bid before the 14th day prior to the closing of the bid period.
The vote is decided on a simple majority. Each person who, as at the end of the day on which the first offer
under the takeover bid was made, held bid class shares is entitled to vote. Neither the bidder nor its
associates are entitled to vote on the resolution.
If a meeting is not held, a resolution approving the partial bid will be deemed by section 648E of the
Corporations Act to have been passed thereby allowing the partial bid to proceed. Further, the Directors will
contravene the Act if they fail to ensure a resolution to approve the bid is voted on.
If the resolution is rejected, the registration of any transfer of shares resulting from that partial takeover bid
will be prohibited and the bid will be deemed to be withdrawn. If the resolution is approved, the relevant
transfers of shares will be registered provided they comply with the other provisions of the Constitution.
Rules 79 and 80 will not apply to full takeover bids and will expire three years after the date they were adopted
as part of the Company’s Constitution unless renewed by a further special resolution of shareholders.
For
per
sona
l use
onl
y
Australian Foundation Investment Company Limited
Notice of Annual General Meeting 2015
5
Reason for proposing the resolution
The Directors consider that inclusion of the proposed Rules is in the interests of all shareholders of the
Company. In the Directors' view, shareholders should have the opportunity to vote on a proposed partial
takeover bid.
A partial takeover bid for the Company may enable control of the Company to be acquired by a party holding
less than a majority interest and without shareholders having the opportunity to dispose of all their shares so
that shareholders risk being locked into a minority position in the Company or suffering loss if the bid causes
a decrease in the market value of shares.
Rules 79 and 80 will prevent this situation occurring by permitting shareholders to decide whether or not a
partial takeover bid should be allowed to proceed.
Present acquisition proposals
As at the date of this notice, the Directors are not aware of any proposal by any person to acquire a
substantial interest in the Company.
Advantages and disadvantages
The Corporations Act requires this explanatory statement to discuss the potential advantages and
disadvantages of the partial takeover approval rules for both Directors and shareholders.
While the partial takeover approval provisions have been in effect, there have been no takeover bids for the
Company either proportional or otherwise. So, there are no actual examples against which to review the
advantages and disadvantages of the existing partial takeover provisions (contained in Rules 79 and 80) for
the Directors and shareholders of the Company. The Directors are not aware of any potential takeover bid
which was discouraged by Rules 79 and 80.
In addition to looking at the provisions retrospectively, the Corporations Act also requires this explanatory
statement to discuss the potential future advantages and disadvantages of the proposed rules for both
Directors and shareholders.
The Directors consider that there are no advantages or disadvantages for the Directors in renewing the
proposed partial takeover approval rules. In particular, there is no restriction on their ability to make a
recommendation on whether a partial takeover bid should be accepted.
For shareholders, the potential advantage of renewing the partial takeover approval rules again is that they
provide shareholders with the opportunity to consider, discuss in a meeting called specifically for the purpose,
and vote on whether a partial takeover bid should be approved. This ensures that shareholders have an
opportunity to have a say in the future ownership and control of the Company. The Directors believe that this
would encourage any future partial bids to be structured so as to be attractive to a majority of shareholders.
A potential disadvantage for shareholders arising from renewing the partial takeover approval rules again is
that they may discourage partial takeover bids being made and may reduce any speculative element in the
market price of the Company's shares arising from the possibility of a partial offer being made. As a result,
shareholders may not have the opportunity to dispose of their shares at an attractive price where the
majority rejects an offer from a party seeking control of the Company. The Directors consider that the
potential advantages for shareholders of the proposed partial takeover approval rules outweigh the
potential disadvantages.
Shareholder approval
To pass as a special resolution, this item of business requires the support of 75% or more of the votes cast
on the resolution.
For
per
sona
l use
onl
y

Australian Foundation Investment Company Limited
Notice of Annual General Meeting 2015
6
SHAREHOLDER INFORMATION
Proxies
1. A shareholder entitled to attend and vote at this meeting is entitled to appoint not more than two
proxies (who need not be members of the Company) to attend, vote and speak in the shareholder's
place and to join in any demand for a poll.
2. Where a shareholder appoints more than one representative, proxy or attorney, those appointees
are entitled to vote on a poll but not on a show of hands.
3. A shareholder who appoints two proxies may specify a proportion or number of the shareholder's
votes each proxy is appointed to exercise. Where no such specification is made, each proxy may
exercise half of the votes (any fractions of votes resulting from this are disregarded).
4. Proxy forms may be lodged online by visiting www.investorvote.com.au or by scanning the
QR Code on the proxy form with a mobile device.
5. Relevant custodians may lodge their proxy forms online by visiting
www.intermediaryonline.com
6. Proxy forms and any authorities (or certified copies of those authorities) under which they are signed
may be delivered in person, by mail or by fax to the Company‘s Share Registry (see details below)
no later than 48 hours before the meeting, being 10.00am (AEDT) on Monday 5 October 2015.
Further details are on the proxy form.
7. A proxy need not vote in that capacity on a show of hands on any resolution nor (unless the proxy is
the Chairman of the meeting) on a poll. However, if the proxy's appointment specifies the way to
vote on a resolution, and the proxy decides to vote in that capacity on that resolution, the proxy must
vote the way specified (subject to the other provisions of this Notice, including the voting exclusions
noted above).
8. If a proxy does not attend the meeting or does not vote on a poll on a resolution, then the Chairman
of the meeting will be taken to have been appointed as the proxy of the relevant shareholder in
respect of the meeting or the poll on that resolution, as applicable. If the Chairman of the meeting is
appointed, or taken to be appointed, as a proxy, but the appointment does not specify the way to
vote on a resolution, then the Chairman intends to exercise the relevant shareholder's votes in
favour of the relevant resolution (subject to the other provisions of this Notice, including the voting
exclusions noted above).
Corporate representatives
A body corporate which is a shareholder, or which has been appointed as a proxy, may appoint an individual
to act as its representative at the meeting. Unless it has previously been given to the Company, the
representative should bring evidence of their appointment to the meeting, together with any authority under
which it is signed. The appointment must comply with section 250D of the Corporations Act 2001.
Attorneys
A shareholder may appoint an attorney to vote on their behalf. To be effective for the meeting, the instrument
effecting the appointment (or a certified copy of it) must be received by the deadline for the receipt of proxy
forms (see above), being no later than 48 hours before the meeting.
Share Registry
The Company's Share Registry details are as follows:
Computershare Investor Services Pty Limited
Street address: Postal address:
Yarra Falls GPO Box 242
452 Johnston Street Melbourne VIC 3001
Abbotsford VIC 3067
Telephone: 1300 662 270 (within Australia)
0800 333 501 (within New Zealand)
+61 3 9415 4373 (outside Australia)
Facsimile: 1800 783 447 (within Australia)
+61 3 9473 2555 (outside Australia)
Internet: www.investorcentre.com/contact
For
per
sona
l use
onl
y

1992
51_0
1QY
JC
Lodge your proxy: Online: www.investorvote.com.au
By Mail: Computershare Investor Services Pty Limited GPO Box 242 Melbourne Victoria 3001 Australia
In Person: Computershare Investor Services Pty Limited Yarra Falls, 452 Johnston Street Abbotsford, Victoria
Alternatively you can fax your form to (within Australia) 1800 783 447 (outside Australia) +61 3 9473 2555
For Intermediary Online users only (Custodians) www.intermediaryonline.com
For all enquiries call:(within Australia) 1300 662 270(within New Zealand) 0800 333 501(outside Australia) +61 3 9415 4373
Proxy Form
:*
How to direct your proxy to voteVoting 100% of your holding: Direct your proxy how to vote by marking one of the boxes opposite each item of business. If you do not mark a box your proxy may vote or abstain as they choose (to the extent permitted by law). If you mark more than one box on an item your vote will be invalid on that item.Voting a portion of your holding: Indicate a portion of your voting rights by inserting the percentage or number of shares you wish to vote in the For, Against or Abstain box or boxes. The sum of the votes cast must not exceed your voting entitlement or 100%.Appointing a second proxy: You are entitled to appoint up to two proxies to attend the meeting and vote on a poll. If you appoint two proxies you must specify the percentage of votes or number of shares for each proxy, otherwise each proxy may exercise half of the votes. When appointing a second proxy write both names and the percentage of votes or number of shares for each in Step 1 overleaf.
A proxy need not be a shareholder of the Company.
Lodgement of proxy formThis proxy form (and any authority under which it is signed or a certified copy of it) must be received at an address given above by 10.00am (AEDT) on Monday 5 October 2015, being not later than 48 hours before the commencement of the meeting. Any proxy form received after that time will not be valid for the scheduled meeting.
Signing instructions for postal formsIndividual: Where the holding is in one name, the shareholder or attorney must sign.Joint Holding: Where the holding is in more than one name, all of the shareholders or attorneys should sign.Power of Attorney: If you have not already lodged the Power of Attorney with the registry, please attach a certified photocopy of the Power of Attorney to this form when you return it.Companies: Where the company has a Sole Director who is also the Sole Company Secretary, this form must be signed by that person. If the company (pursuant to section 204A of the Corporations Act 2001) does not have a Company Secretary, a Sole Director can also sign alone. Otherwise this form must be signed by a Director jointly with either another Director or a Company Secretary. Please sign in the appropriate place to indicate the office held.
Attending the meetingIf a representative of a corporate shareholder or proxy is to attend the meeting you will need to provide the appropriate “Certificate of Appointment of Corporate Representative” prior to admission. A form of the certificate may be obtained from Computershare or online at www.investorcentre.com under the help tab, “Printable Forms”.
Comments & Questions: If you have any comments or questions for the Company, please write them on a separate sheet of paper and return with this form.
GO ONLINE TO APPOINT YOUR PROXY, or turn over to complete the form è
For your proxy form to be effective it must be received by 10.00am (AEDT) on Monday 5 October 2015
ABN 56 004 147 120
Appoint your proxy and view the Annual Report onlineGo to www.investorvote.com.au or scan the QR Code with your mobile device.Follow the instructions on the secure website to appoint your proxy.
:Your access information that you will need to appoint your proxy online:
Control Number:
SRN/HIN:
PLEASE NOTE: For security reasons it is important that you keep your SRN/HIN confidential. Please dispose of this form carefully if you appoint your proxy online.
199251_Meetings_Runons/000001/000001/i
For
per
sona
l use
onl
y

1992
51_0
1QY
JC
I/We being a shareholder/s of AUSTRALIAN FOUNDATION INVESTMENT COMPANY LIMITED hereby appoint
the Chairman of the meeting
OR
or failing the individual or body corporate named in relation to the meeting generally or in relation to a poll on a given resolution, or if no individual or body corporate is named, the Chairman of the meeting, as my/our proxy to act generally at the meeting or in relation to a poll on the given resolution (as applicable) on my/our behalf, including to vote in accordance with the following directions (or if no directions have been given, and to the extent permitted by law, as the proxy sees fit), at the Annual General Meeting of Australian Foundation Investment Company Limited to be held at RACV City Club, 501 Bourke Street, Melbourne, Victoria at 10.00am (AEDT) on Wednesday 7 October 2015 and at any adjournment or postponement of that meeting.
Chairman to vote undirected proxies as follows: I/We acknowledge that the Chairman of the meeting intends to vote undirected proxies in favour of each item of business, to the extent permitted by law.
Chairman authorised to exercise proxies on remuneration related matters: If I/we have appointed the Chairman of the meeting as my/our proxy (or the Chairman of the meeting becomes my/our proxy by default), I/we expressly authorise the Chairman of the meeting, to the extent permitted by law, to exercise my/our proxy in respect of item 2 even though the item is connected directly or indirectly with the remuneration of a member of key management personnel of Australian Foundation Investment Company Limited and its consolidated group, which includes the Chairman of the meeting.
Items of BusinessSTEP 2 PLEASE NOTE: If you mark the Abstain box for an item, you are directing your proxy not to vote on your
behalf on a show of hands or a poll and your votes will not be counted in computing the required majority
Appoint a proxy to vote on your behalf
Signature of Shareholder(s) This section must be completed.SIGN
STEP 1
PLEASE NOTE: Leave this box blank if you have selected the Chairman of the meeting. Do not insert your own name(s).
Individual or Shareholder 1
Sole Director and Sole Company Secretary
Shareholder 2
Director
Shareholder 3
Director/Company Secretary
Contact Name
Contact Daytime Telephone Date
/ /
Please mark to indicate your directionsProxy Form
Change of address. If incorrect, mark this box and make the correction in the space to the left. Shareholders sponsored by a broker (reference number commences with ’X’) should advise their broker of any changes.
A F I 1 9 9 2 5 1 A
Board recommendations and undirected proxies: To fully inform shareholders in exercising their right to vote, the Board recommends that shareholders vote, and the Chairman of the Meeting intends to vote undirected proxies (to the extent permitted by law), in the manner set out beside each item of business.
Board recommendations
For Item 2 Adoption of Remuneration Report
For Item 3 Re-election of Director – Mr Graeme Liebelt
For Item 4 Re-election of Director – Mr Terrence Campbell AO
For Item 5Renewal of partial takeover approval rules in the Constitution for a further three years (special resolution)
ForAgainst
Abstain
For
per
sona
l use
onl
y