Embed Size (px)
Citation preview

For
per
sona
l use
onl
y
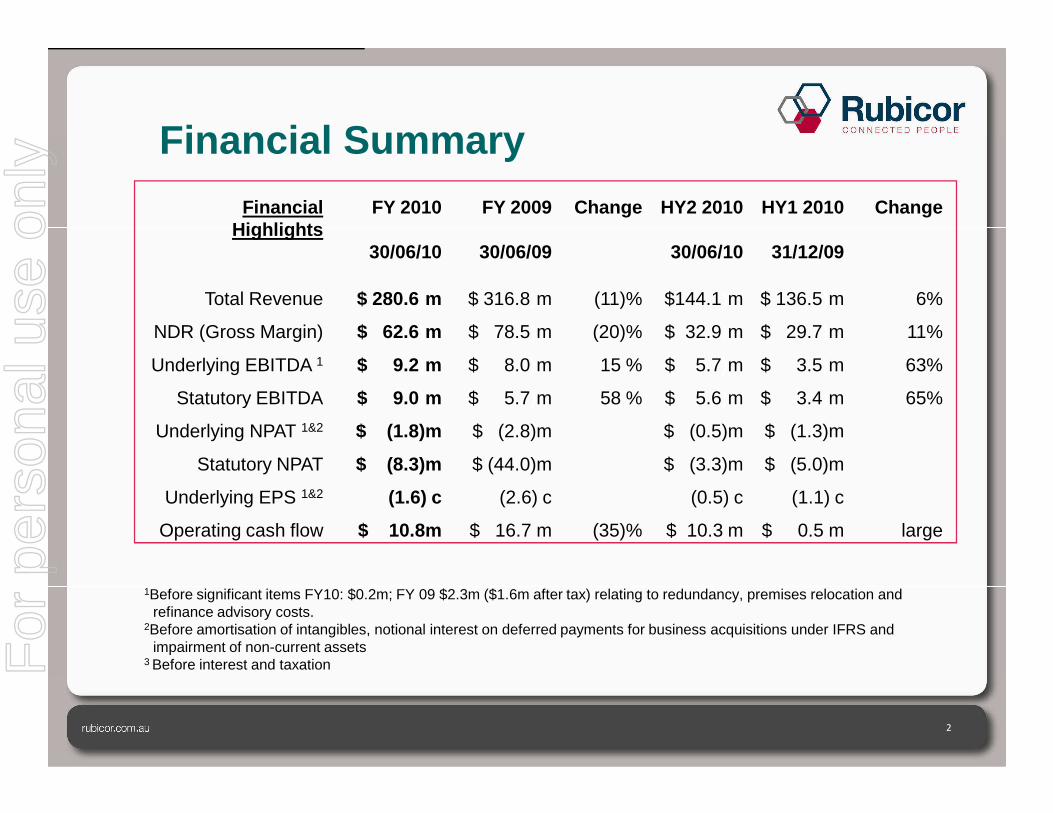
Financial Summary
Financial Highlights
FY 2010 FY 2009 Change HY2 2010 HY1 2010 Change
30/06/10 30/06/09 30/06/10 31/12/09
Total Revenue $ 280.6)m $ 316.8)m (11)% $144.1)m $ 136.5)m 6%
NDR (Gross Margin) $ 62.6)m $ 78.5)m (20)% $ 32.9)m $ 29.7)m 11%
Underlying EBITDA 1 $ 9.2)m $ 8.0)m 15 % $ 5.7)m $ 3.5)m 63%
Statutory EBITDA $ 9.0)m $ 5.7)m 58 % $ 5.6)m $ 3.4)m 65%
2
1Before significant items FY10: $0.2m; FY 09 $2.3m ($1.6m after tax) relating to redundancy, premises relocation and refinance advisory costs.
2Before amortisation of intangibles, notional interest on deferred payments for business acquisitions under IFRS and impairment of non-current assets
3 Before interest and taxation
Statutory EBITDA $ 9.0)m $ 5.7)m 58 % $ 5.6)m $ 3.4)m 65%
Underlying NPAT 1&2 $ (1.8)m $ (2.8)m $ (0.5)m $ (1.3)m
Statutory NPAT $ (8.3)m $ (44.0)m $ (3.3)m $ (5.0)m
Underlying EPS 1&2 (1.6) c (2.6) c (0.5) c (1.1) c
Operating cash flow $ 10.8m $ 16.7 m (35)% $ 10.3 m $ 0.5 m large
For
per
sona
l use
onl
y
Operational highlights
Efficiency and cost control:� Consultant numbers down 40% from peak� Consultant efficiency averaging 42% down from 50% in FY 09 and
nearing long term target of below 40%� Strong improvements in consultant productivity second half� $15m cost savings achieved from FY09 initiatives
3
Growth and performance:� Positioning within growth sectors such as mining & resources,
engineering, IT finance & accounting� Client leverage opportunities continuing� Selectively adding consultant headcount to meet increased jobs growth
For
per
sona
l use
onl
y

Capital Management
Financing:� Continued bank support� Earn-out payments of $1.7m & $4.7m funded in 07/09 &11/09� Bank facilities revised; earnings positive & cash flow neutral
� Term facilities extended to 31 Jul 11� Quarterly amortisation to increase, offset by reduction in interest rate
margin and fees� No final dividend
4
� No final dividend � Positive cash flow of $10.8m achieved
Acquisition model:� Payments align with profitability � Amounts owing to vendors peaked FY09; to be
extinguished by FY14
For
per
sona
l use
onl
y
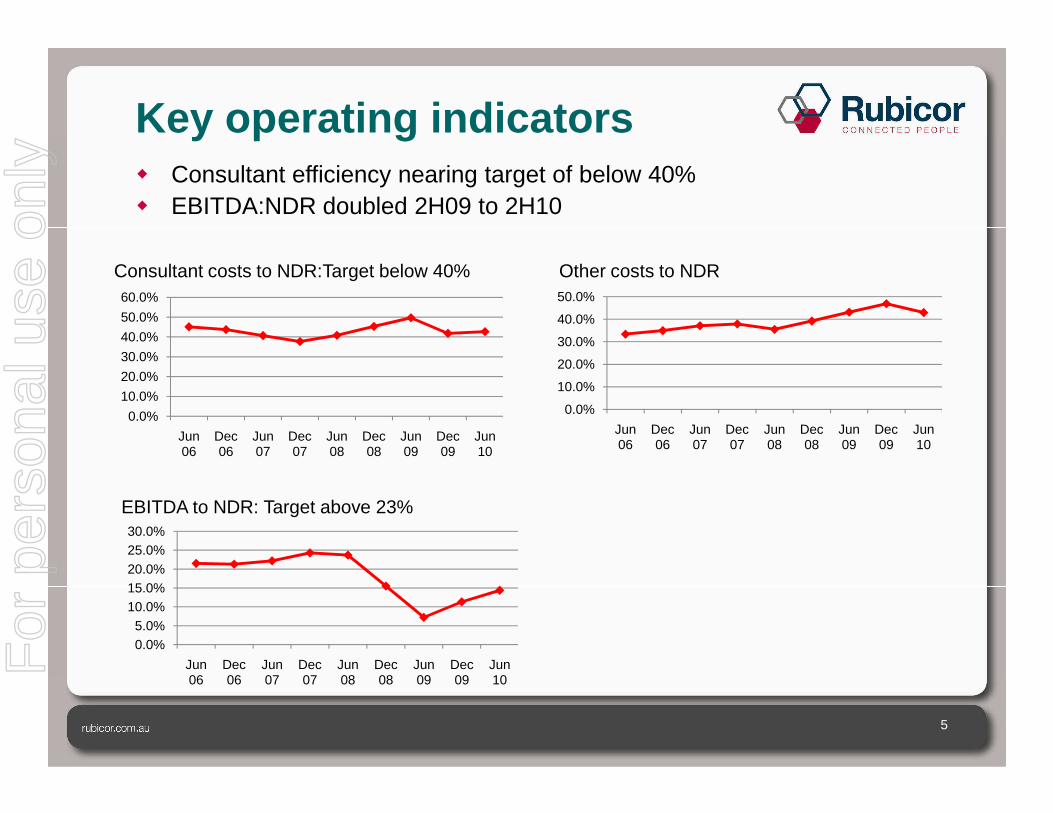
Key operating indicators� Consultant efficiency nearing target of below 40%� EBITDA:NDR doubled 2H09 to 2H10
Consultant costs to NDR:Target below 40% Other costs to NDR
10.0%
20.0%
30.0%
40.0%
50.0%
60.0%
0.0%
10.0%
20.0%
30.0%
40.0%
50.0%
0.0%5.0%
10.0%15.0%20.0%25.0%30.0%
Jun 06
Dec 06
Jun 07
Dec 07
Jun 08
Dec 08
Jun 09
Dec 09
Jun 10
5
EBITDA to NDR: Target above 23%
0.0%
Jun 06
Dec 06
Jun 07
Dec 07
Jun 08
Dec 08
Jun 09
Dec 09
Jun 10
0.0%
Jun 06
Dec 06
Jun 07
Dec 07
Jun 08
Dec 08
Jun 09
Dec 09
Jun 10
For
per
sona
l use
onl
y

Business profile� DIVERSITY: RUB able to exploit sectoral job ‘hot spots’� MIX: Return of more profitable permanent placements as
confidence comes back into job markets
Industry Service
6
Other (including human capital solutions): 4.9 %
Temporary: 44.4 %
Permanent: 50.7 %
For
per
sona
l use
onl
y

350
400
450
Headcount decrease
Organic growth
Consultants� Further reduction of 41 consultants in FY 10: 40% down from peak� Selective growth to meet job ‘hot spots’
422358 376260
Total consultant numbers366 300 263 259
-
50
100
150
200
250
300
Dec 06 Jun 07 Dec 07 Jun 08 Dec 08 Jun 09 Dec-09 Jun-10
7
For
per
sona
l use
onl
y

Underlying profitability= best indicator of performance
12 months ended 30 June2010
$M2009
$MChange
%
Revenue 280.6) 316.8) (11)
NDR (Gross margin) 62.6) 78.5) (20)
EBITDA 9.2) 8.0) 15)
Depreciation (1.0) (1.1)
EBIT 8.2) 6.9) 19)
Finance costs – amortisationFinance costs – interest/charges
(1.5)(7.9)
(2.1)(6.9)
Excludes significant items - $0.2m FY10 $2.3m in FY09
8
Loss Before Tax (1.2) (2.1)
Tax 0.4) 0.6)
Cash interest on vendor liabilities (0.8) (1.3)
NPAT (1.6) (2.8)
NPAT attributable to equity holders
(1.8) (2.8)
EPS (cents) (1.6) (2.6)
For
per
sona
l use
onl
y
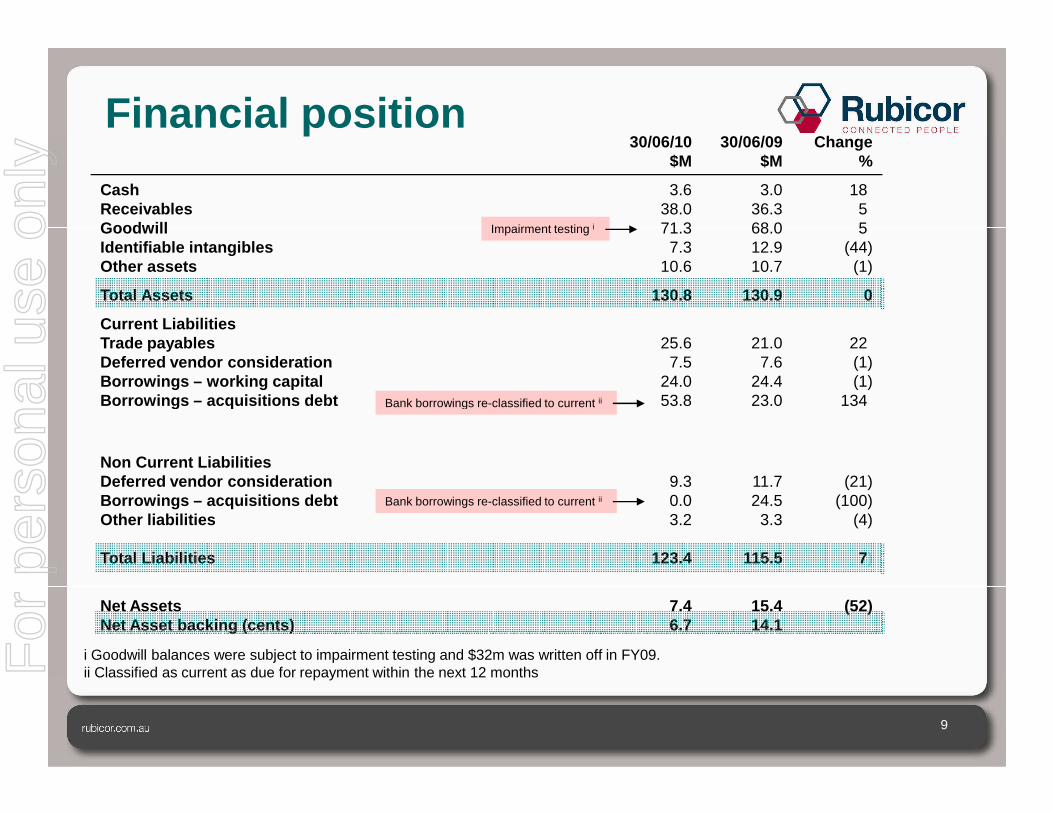
30/06/10$M
30/06/09$M
Change %
CashReceivablesGoodwillIdentifiable intangiblesOther assets
3.638.071.3
7.310.6
3.036.368.012.910.7
18)5)5)
(44)(1)
Total Assets 130.8 130.9 0
Current Liabilities Trade payablesDeferred vendor considerationBorrowings – working capitalBorrowings – acquisitions debt
25.67.5
24.053.8
21.07.6
24.423.0
22)(1)(1)
134)
Financial position
Impairment testing i
Bank borrowings re-classified to current iiBorrowings – acquisitions debt 53.8 23.0 134)
Non Current LiabilitiesDeferred vendor consideration Borrowings – acquisitions debtOther liabilities
Total Liabilities
9.30.03.2
123.4
11.724.5
3.3
115.5
(21)(100)
(4)
7)
Net AssetsNet Asset backing (cents)
7.46.7
15.414.1
(52)
9
i Goodwill balances were subject to impairment testing and $32m was written off in FY09. ii Classified as current as due for repayment within the next 12 months
Bank borrowings re-classified to current
Bank borrowings re-classified to current ii
For
per
sona
l use
onl
y
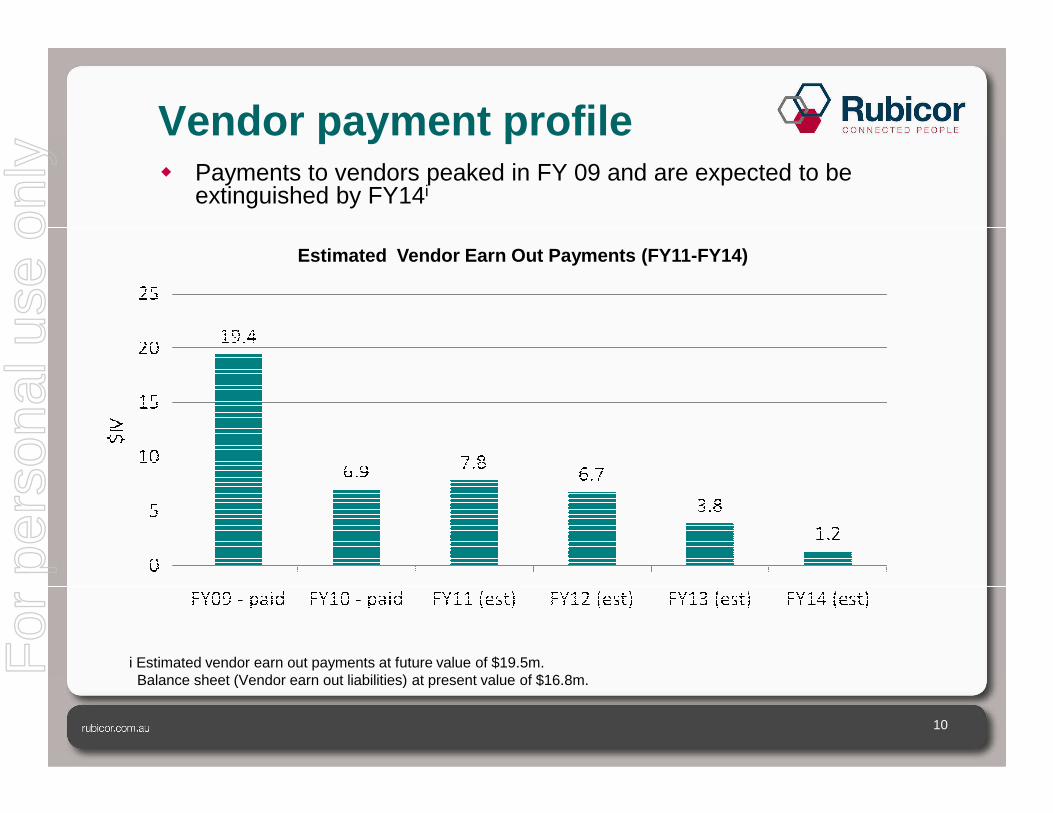
Vendor payment profile� Payments to vendors peaked in FY 09 and are expected to be
extinguished by FY14i
Estimated Vendor Earn Out Payments (FY11-FY14)
10
i Estimated vendor earn out payments at future value of $19.5m. Balance sheet (Vendor earn out liabilities) at present value of $16.8m.
For
per
sona
l use
onl
y
OutlookShort term: Positioning to optimise stronger econom ic environment� Economic indicators show solid employment demand� Focus on organic growth exploiting high growth sectors & geographies � Hiring additional consultants to support growth� Continued consultant productivity optimisation� Technology driven optimisation programs� Leveraging client relationships more significantly across operating
companies companies � Strengthening capability through training and development programs for
consultants and managers
Long term� Skills shortage will continue to be an issue for employers due to
permanent demographic change � Well-established specialist recruitment firms will have the edge
11
For
per
sona
l use
onl
y

AppendicesAppendices
12
For
per
sona
l use
onl
y
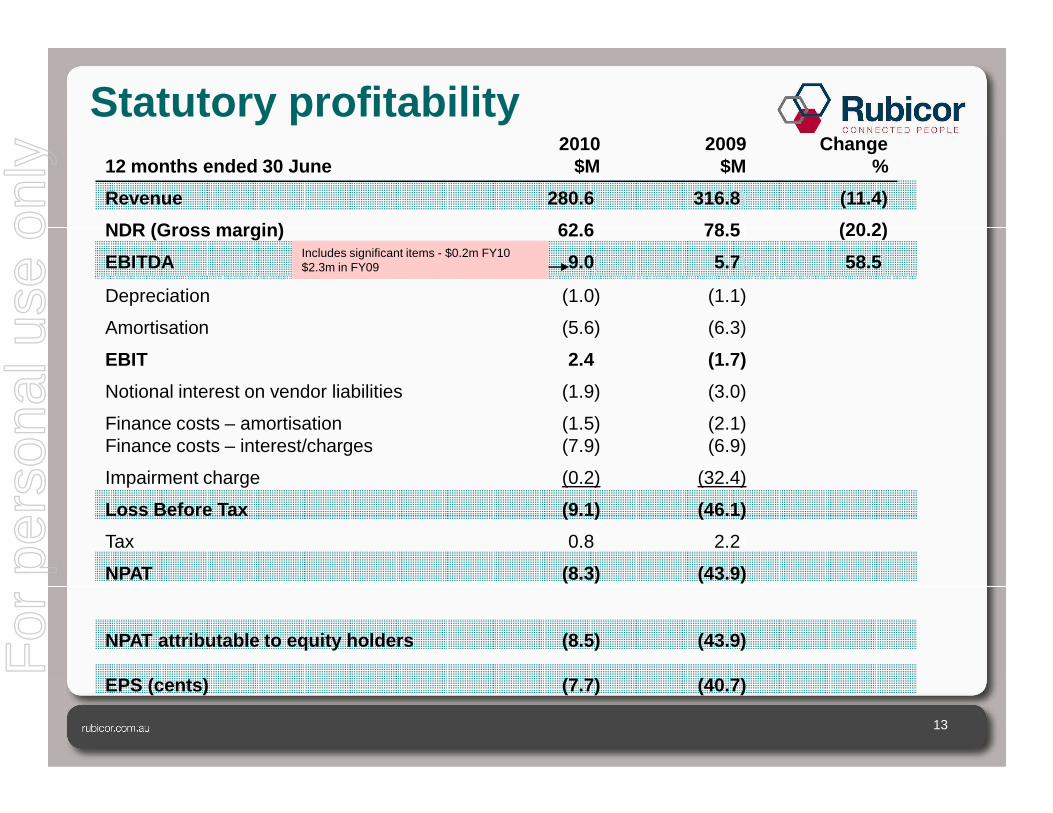
Statutory profitability12 months ended 30 June
2010$M
2009$M
Change%
Revenue 280.6) 316.8) (11.4)
NDR (Gross margin) 62.6 ) 78.5) (20.2)
EBITDA 9.0) 5.7) 58.5)
Depreciation (1.0) (1.1)
Amortisation (5.6) (6.3)
EBIT 2.4) (1.7)
Notional interest on vendor liabilities (1.9) (3.0)
Includes significant items - $0.2m FY10 $2.3m in FY09
13
Finance costs – amortisationFinance costs – interest/charges
(1.5)(7.9)
(2.1)(6.9)
Impairment charge (0.2) (32.4)
Loss Before Tax (9.1) (46.1)
Tax 0.8) 2.2)
NPAT
NPAT attributable to equity holders
EPS (cents)
(8.3)
(8.5)
(7.7)
(43.9)
(43.9)
(40.7)
For
per
sona
l use
onl
y

Reconciliation of statutory to underlying
12 months ended 30 June2010
$M2009
$M
Statutory NPAT – Equity holders (8.5) (43.9)
Underlying NPAT adjusts for significant items, AIFRS-required amortisation, notional interest on vendor liabilities and goodwill impairment
14
Significant items 0.2) 2.3)
Significant non cash itemsAdd back: Amortisation of identifiable intangible assets 5.6) 6.3)
Notional interest on vendor liabilities 1.9) 3.0)
Impairment of goodwill 0.2) 32.4)
Deduct: Cash interest on vendor liabilities (0.8) (1.3)
Tax effect (0.4) (1.6)
Underlying NPAT – Equity holders (1.8) (2.8)For
per
sona
l use
onl
y


![TR 102 376 - V1.1.1 - etsi.org · Broadband Satellite Networks" in the Proc. of the Globecom 2003 Conference, San Francisco, Dec 2003. ETSI 7 ETSI TR 102 376 V1.1.1 (2005-02) [17]](https://img.pdfslide.us/doc/110x75/5b91260c09d3f2b86e8d8fe0/tr-102-376-v111-etsiorg-broadband-satellite-networks-in-the-proc-of.jpg)


![[MS-WPE376]: WordPad ECMA 376 Standards Support · WordPad ECMA 376 Standards Support](https://img.pdfslide.us/doc/110x75/5fab533dea0e1c27ad282e55/ms-wpe376-wordpad-ecma-376-standards-support-wordpad-ecma-376-standards-support.jpg)


![[Dec 2016] cisco ccnp routing and switching 300-101 exam dumps](https://img.pdfslide.us/doc/110x75/5877295c1a28ab2b2c8b5573/dec-2016-cisco-ccnp-routing-and-switching-300-101-exam-dumps.jpg)