Embed Size (px)
Citation preview
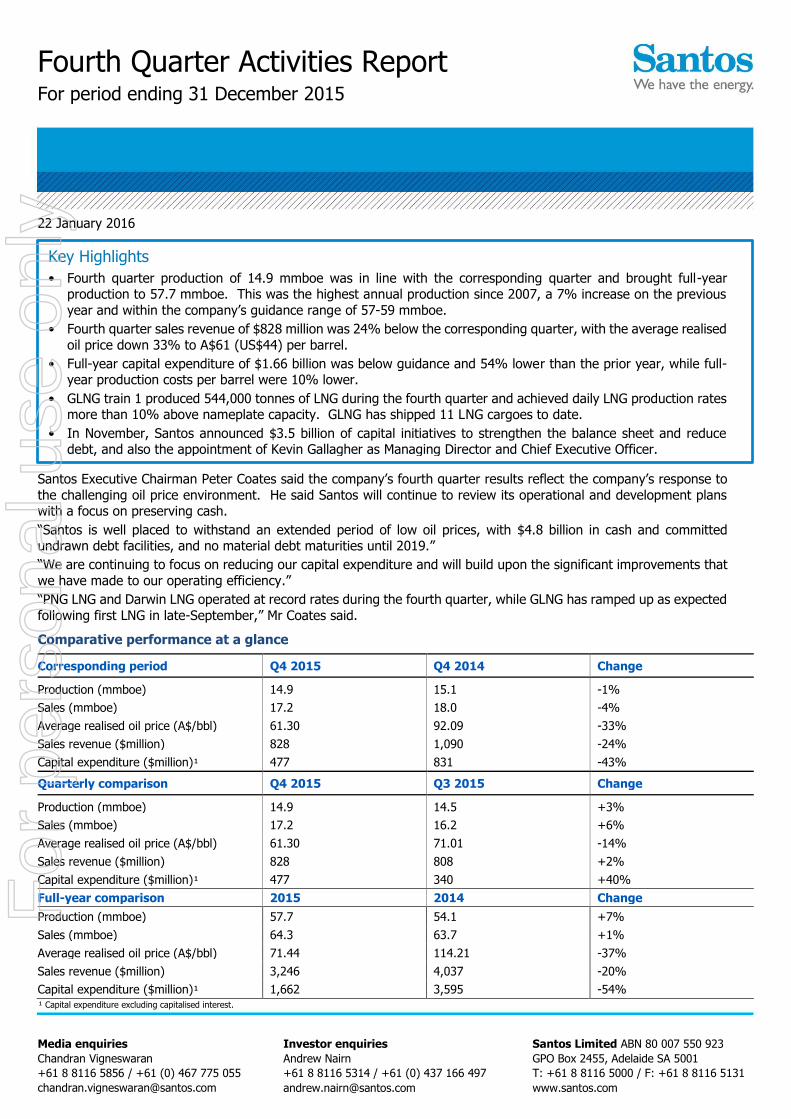
Fourth Quarter Activities Report For period ending 31 December 2015
Media enquiries
Chandran Vigneswaran
+61 8 8116 5856 / +61 (0) 467 775 055
Investor enquiries
Andrew Nairn
+61 8 8116 5314 / +61 (0) 437 166 497
Santos Limited ABN 80 007 550 923
GPO Box 2455, Adelaide SA 5001
T: +61 8 8116 5000 / F: +61 8 8116 5131
www.santos.com
22 January 2016
Santos Executive Chairman Peter Coates said the company’s fourth quarter results reflect the company’s response to
the challenging oil price environment. He said Santos will continue to review its operational and development plans with a focus on preserving cash.
“Santos is well placed to withstand an extended period of low oil prices, with $4.8 billion in cash and committed undrawn debt facilities, and no material debt maturities until 2019.”
“We are continuing to focus on reducing our capital expenditure and will build upon the significant improvements that
we have made to our operating efficiency.”
“PNG LNG and Darwin LNG operated at record rates during the fourth quarter, while GLNG has ramped up as expected
following first LNG in late-September,” Mr Coates said.
Comparative performance at a glance
Corresponding period Q4 2015 Q4 2014 Change
Production (mmboe) 14.9 15.1 -1%
Sales (mmboe) 17.2 18.0 -4%
Average realised oil price (A$/bbl) 61.30 92.09 -33%
Sales revenue ($million) 828 1,090 -24%
Capital expenditure ($million)¹ 477 831 -43%
Quarterly comparison Q4 2015 Q3 2015 Change
Production (mmboe) 14.9 14.5 +3%
Sales (mmboe) 17.2 16.2 +6%
Average realised oil price (A$/bbl) 61.30 71.01 -14%
Sales revenue ($million) 828 808 +2%
Capital expenditure ($million)¹ 477 340 +40%
Full-year comparison 2015 2014 Change
Production (mmboe) 57.7 54.1 +7%
Sales (mmboe) 64.3 63.7 +1%
Average realised oil price (A$/bbl) 71.44 114.21 -37%
Sales revenue ($million) 3,246 4,037 -20%
Capital expenditure ($million)¹ 1,662 3,595 -54% ¹ Capital expenditure excluding capitalised interest.
Key Highlights
• Fourth quarter production of 14.9 mmboe was in line with the corresponding quarter and brought full-year production to 57.7 mmboe. This was the highest annual production since 2007, a 7% increase on the previous
year and within the company’s guidance range of 57-59 mmboe.
• Fourth quarter sales revenue of $828 million was 24% below the corresponding quarter, with the average realised
oil price down 33% to A$61 (US$44) per barrel.
• Full-year capital expenditure of $1.66 billion was below guidance and 54% lower than the prior year, while full-year production costs per barrel were 10% lower.
• GLNG train 1 produced 544,000 tonnes of LNG during the fourth quarter and achieved daily LNG production rates more than 10% above nameplate capacity. GLNG has shipped 11 LNG cargoes to date.
• In November, Santos announced $3.5 billion of capital initiatives to strengthen the balance sheet and reduce debt, and also the appointment of Kevin Gallagher as Managing Director and Chief Executive Officer.
For
per
sona
l use
onl
y
Santos Ltd l Fourth Quarter Activities Report l 31 December 2015 Page 2 of 10
Capital management
On 9 November 2015, Santos announced $3.5 billion of capital initiatives to strengthen the balance sheet and reduce debt.
Since that time, Santos has completed the equity issuances under the placement and entitlement offer with all proceeds received during the fourth quarter. Cash proceeds of $520 million from the sale of the Kipper gas asset to Mitsui E&P Australia are expected in the first quarter of 2016 when that transaction is expected to complete.
Santos had $4.8 billion in cash and committed undrawn debt facilities available as at 31 December 2015.
Approximately $2 billion of debt was repaid during the second half of 2015. Santos' net debt position as at 31 December 2015 was $6.55 billion, comprised of $7.68 billion in gross debt and derivatives less cash of $1.13 billion. All gross debt as at 31 December 2015 was US dollar denominated (excluding the Euro denominated subordinated notes that have been swapped to US dollars through to the first call date) and has been translated to $A at the year-end A$/US$ exchange rate of 0.7274.
The company has no material debt maturities until 2019. The Euro denominated subordinated notes mature in 2070, with Santos having the option to redeem on the first call date on 22 September 2017 and at each semi-annual interest payment date thereafter.
None of the company’s existing debt facilities contain any credit rating-related covenant triggers or review events.
The company’s liquidity and net debt position at the end of 2015 is set out in the table below.
As at 31 December 2015
Liquidity A$million
Cash 1,134
Undrawn bilateral bank debt facilities 3,625
Total liquidity 4,759
Debt A$million
PNG LNG project finance (non-recourse) 2,569
Export credit agency supported loan facilities 2,399
Euro denominated subordinated notes 1,575
US Private Placement 830
Other (finance leases and derivatives) 311
Total debt 7,684
Total net debt 6,550
Preliminary and subject to finalisation of the company’s accounting and audit processes.
Company update Santos announced on 4 December 2015 the start date for Managing Director and Chief Executive Officer Kevin Gallagher will be 1 February 2016. Peter Coates will resume his non-executive Chairman role on the same date.
The oil industry has continued to experience significant volatility with the oil price falling more than 40% since the announcement of the company’s capital initiatives in November 2015. In accordance with its usual timetable and processes for the preparation and finalisation of its full-year accounts, Santos is currently considering the oil price assumptions it uses for asset impairment analysis and reserve bookings.
As announced in the Investor Presentation released to the market on 9 November 2015 and having regard to the further deterioration in the oil price since, the company expects to book reductions to both asset carrying values and reserves as part of finalising its 2015 full-year financial accounts, which are scheduled to be announced to the market on 19 February 2016.
The company is also considering its 2016 operational and development plans and forecasts, with a focus on preserving cash and will provide an update at the release of its 2015 financial accounts.
For
per
sona
l use
onl
y
Santos Ltd l Fourth Quarter Activities Report l 31 December 2015 Page 3 of 10
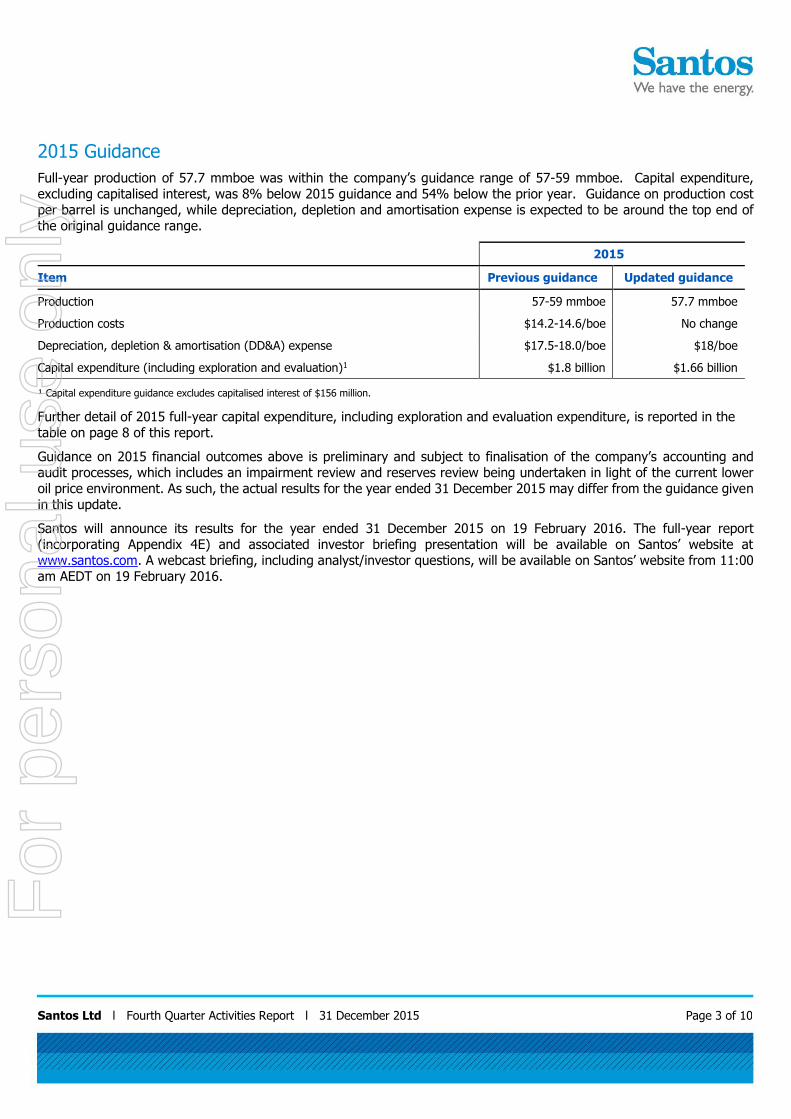
2015 Guidance
Full-year production of 57.7 mmboe was within the company’s guidance range of 57-59 mmboe. Capital expenditure, excluding capitalised interest, was 8% below 2015 guidance and 54% below the prior year. Guidance on production cost per barrel is unchanged, while depreciation, depletion and amortisation expense is expected to be around the top end of the original guidance range.
2015
Item Previous guidance Updated guidance
Production 57-59 mmboe 57.7 mmboe
Production costs $14.2-14.6/boe No change
Depreciation, depletion & amortisation (DD&A) expense $17.5-18.0/boe $18/boe
Capital expenditure (including exploration and evaluation)1 $1.8 billion $1.66 billion
¹ Capital expenditure guidance excludes capitalised interest of $156 million.
Further detail of 2015 full-year capital expenditure, including exploration and evaluation expenditure, is reported in the table on page 8 of this report.
Guidance on 2015 financial outcomes above is preliminary and subject to finalisation of the company’s accounting and audit processes, which includes an impairment review and reserves review being undertaken in light of the current lower oil price environment. As such, the actual results for the year ended 31 December 2015 may differ from the guidance given in this update.
Santos will announce its results for the year ended 31 December 2015 on 19 February 2016. The full-year report (incorporating Appendix 4E) and associated investor briefing presentation will be available on Santos’ website at www.santos.com. A webcast briefing, including analyst/investor questions, will be available on Santos’ website from 11:00 am AEDT on 19 February 2016.
For
per
sona
l use
onl
y
Santos Ltd l Fourth Quarter Activities Report l 31 December 2015 Page 4 of 10
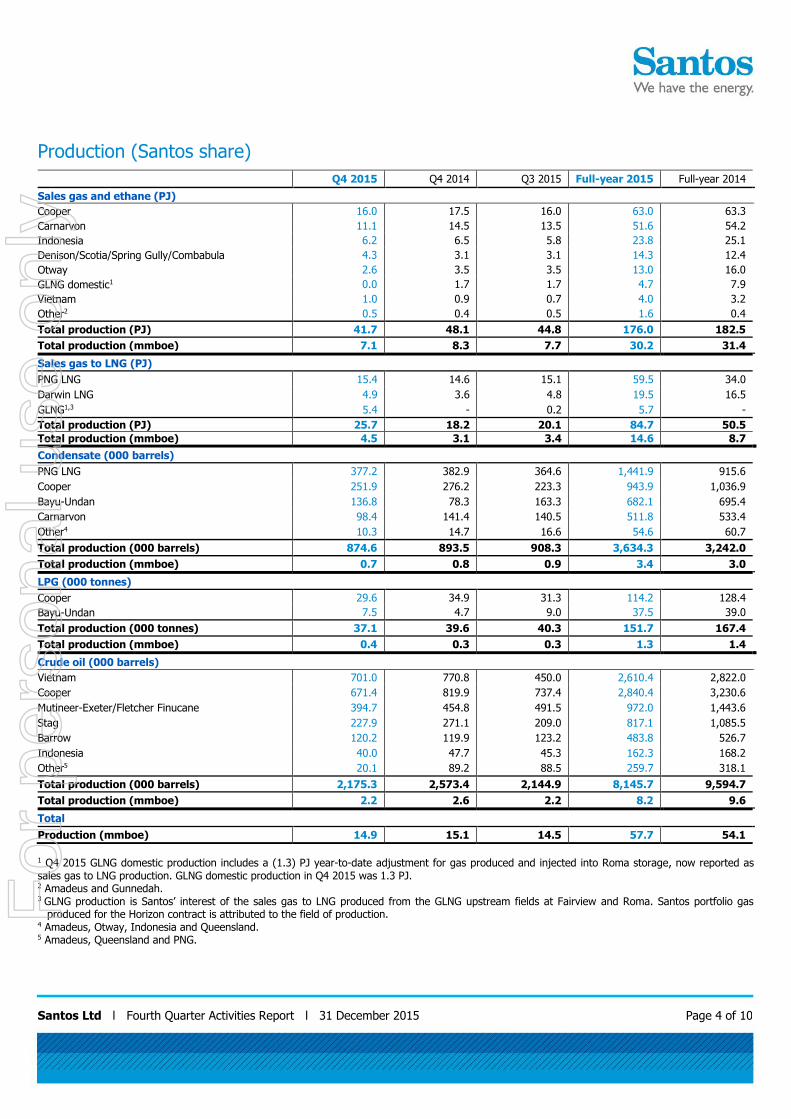
Production (Santos share)
Q4 2015 Q4 2014 Q3 2015 Full-year 2015 Full-year 2014
Sales gas and ethane (PJ)
Cooper 16.0 17.5 16.0 63.0 63.3
Carnarvon 11.1 14.5 13.5 51.6 54.2
Indonesia 6.2 6.5 5.8 23.8 25.1
Denison/Scotia/Spring Gully/Combabula 4.3 3.1 3.1 14.3 12.4
Otway 2.6 3.5 3.5 13.0 16.0
GLNG domestic1 0.0 1.7 1.7 4.7 7.9
Vietnam 1.0 0.9 0.7 4.0 3.2
Other2 0.5 0.4 0.5 1.6 0.4
Total production (PJ) 41.7 48.1 44.8 176.0 182.5
Total production (mmboe) 7.1 8.3 7.7 30.2 31.4
Sales gas to LNG (PJ)
PNG LNG 15.4 14.6 15.1 59.5 34.0
Darwin LNG 4.9 3.6 4.8 19.5 16.5
GLNG1,3 5.4 - 0.2 5.7 -
Total production (PJ) 25.7 18.2 20.1 84.7 50.5
Total production (mmboe) 4.5 3.1 3.4 14.6 8.7
Condensate (000 barrels)
PNG LNG 377.2 382.9 364.6 1,441.9 915.6
Cooper 251.9 276.2 223.3 943.9 1,036.9
Bayu-Undan 136.8 78.3 163.3 682.1 695.4
Carnarvon 98.4 141.4 140.5 511.8 533.4
Other4 10.3 14.7 16.6 54.6 60.7
Total production (000 barrels) 874.6 893.5 908.3 3,634.3 3,242.0
Total production (mmboe) 0.7 0.8 0.9 3.4 3.0
LPG (000 tonnes)
Cooper 29.6 34.9 31.3 114.2 128.4
Bayu-Undan 7.5 4.7 9.0 37.5 39.0
Total production (000 tonnes) 37.1 39.6 40.3 151.7 167.4
Total production (mmboe) 0.4 0.3 0.3 1.3 1.4
Crude oil (000 barrels)
Vietnam 701.0 770.8 450.0 2,610.4 2,822.0
Cooper 671.4 819.9 737.4 2,840.4 3,230.6
Mutineer-Exeter/Fletcher Finucane 394.7 454.8 491.5 972.0 1,443.6
Stag 227.9 271.1 209.0 817.1 1,085.5
Barrow 120.2 119.9 123.2 483.8 526.7
Indonesia 40.0 47.7 45.3 162.3 168.2
Other5 20.1 89.2 88.5 259.7 318.1
Total production (000 barrels) 2,175.3 2,573.4 2,144.9 8,145.7 9,594.7
Total production (mmboe) 2.2 2.6 2.2 8.2 9.6
Total
Production (mmboe) 14.9 15.1 14.5 57.7 54.1
1 Q4 2015 GLNG domestic production includes a (1.3) PJ year-to-date adjustment for gas produced and injected into Roma storage, now reported as sales gas to LNG production. GLNG domestic production in Q4 2015 was 1.3 PJ. 2 Amadeus and Gunnedah. 3 GLNG production is Santos’ interest of the sales gas to LNG produced from the GLNG upstream fields at Fairview and Roma. Santos portfolio gas
produced for the Horizon contract is attributed to the field of production. 4 Amadeus, Otway, Indonesia and Queensland. 5 Amadeus, Queensland and PNG.
For
per
sona
l use
onl
y
Santos Ltd l Fourth Quarter Activities Report l 31 December 2015 Page 5 of 10
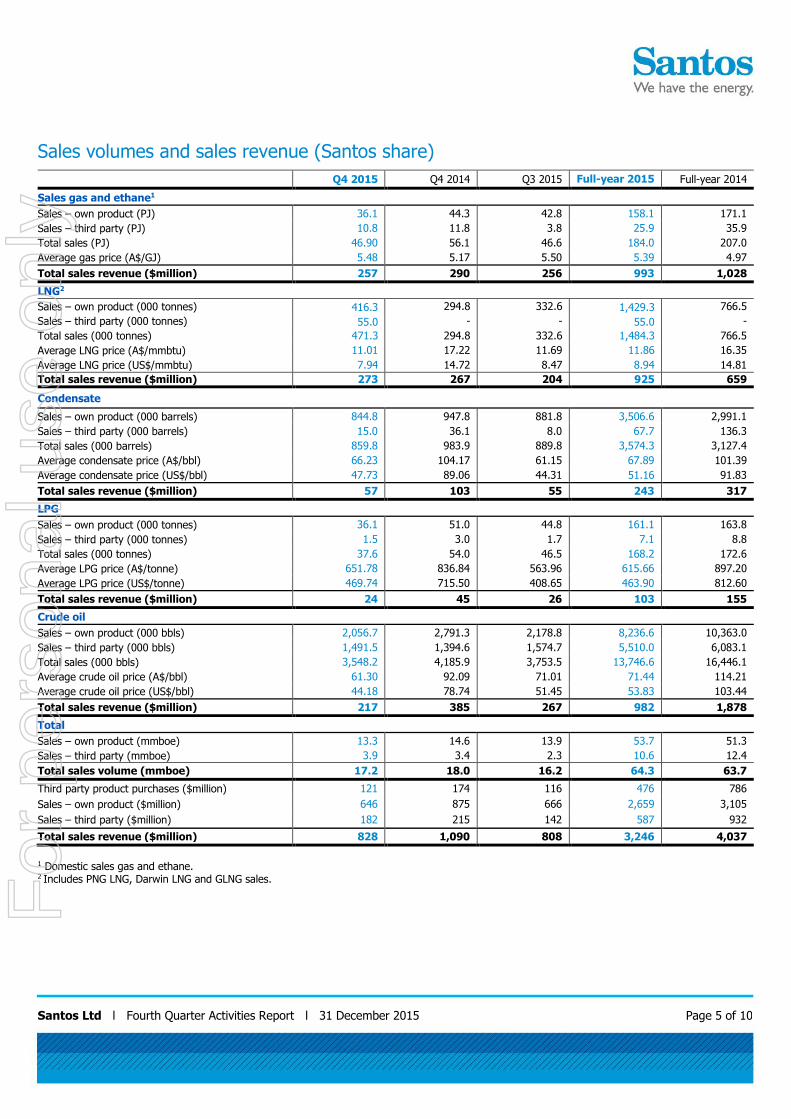
Sales volumes and sales revenue (Santos share)
Q4 2015 Q4 2014 Q3 2015 Full-year 2015 Full-year 2014
Sales gas and ethane1
Sales – own product (PJ) 36.1 44.3 42.8 158.1 171.1
Sales – third party (PJ) 10.8 11.8 3.8 25.9 35.9
Total sales (PJ) 46.90 56.1 46.6 184.0 207.0
Average gas price (A$/GJ) 5.48 5.17 5.50 5.39 4.97
Total sales revenue ($million) 257 290 256 993 1,028
LNG2
Sales – own product (000 tonnes) 416.3 294.8 332.6 1,429.3 766.5
Sales – third party (000 tonnes) 55.0 - - 55.0 -
Total sales (000 tonnes) 471.3 294.8 332.6 1,484.3 766.5
Average LNG price (A$/mmbtu) 11.01 17.22 11.69 11.86 16.35
Average LNG price (US$/mmbtu) 7.94 14.72 8.47 8.94 14.81
Total sales revenue ($million) 273 267 204 925 659
Condensate
Sales – own product (000 barrels) 844.8 947.8 881.8 3,506.6 2,991.1
Sales – third party (000 barrels) 15.0 36.1 8.0 67.7 136.3
Total sales (000 barrels) 859.8 983.9 889.8 3,574.3 3,127.4
Average condensate price (A$/bbl) 66.23 104.17 61.15 67.89 101.39
Average condensate price (US$/bbl) 47.73 89.06 44.31 51.16 91.83
Total sales revenue ($million) 57 103 55 243 317
LPG
Sales – own product (000 tonnes) 36.1 51.0 44.8 161.1 163.8
Sales – third party (000 tonnes) 1.5 3.0 1.7 7.1 8.8
Total sales (000 tonnes) 37.6 54.0 46.5 168.2 172.6
Average LPG price (A$/tonne) 651.78 836.84 563.96 615.66 897.20
Average LPG price (US$/tonne) 469.74 715.50 408.65 463.90 812.60
Total sales revenue ($million) 24 45 26 103 155
Crude oil
Sales – own product (000 bbls) 2,056.7 2,791.3 2,178.8 8,236.6 10,363.0
Sales – third party (000 bbls) 1,491.5 1,394.6 1,574.7 5,510.0 6,083.1
Total sales (000 bbls) 3,548.2 4,185.9 3,753.5 13,746.6 16,446.1
Average crude oil price (A$/bbl) 61.30 92.09 71.01 71.44 114.21
Average crude oil price (US$/bbl) 44.18 78.74 51.45 53.83 103.44
Total sales revenue ($million) 217 385 267 982 1,878
Total
Sales – own product (mmboe) 13.3 14.6 13.9 53.7 51.3
Sales – third party (mmboe) 3.9 3.4 2.3 10.6 12.4
Total sales volume (mmboe) 17.2 18.0 16.2 64.3 63.7
Third party product purchases ($million) 121 174 116 476 786
Sales – own product ($million) 646 875 666 2,659 3,105
Sales – third party ($million) 182 215 142 587 932
Total sales revenue ($million) 828 1,090 808 3,246 4,037
1 Domestic sales gas and ethane. 2 Includes PNG LNG, Darwin LNG and GLNG sales.
For
per
sona
l use
onl
y
Santos Ltd l Fourth Quarter Activities Report l 31 December 2015 Page 6 of 10
Activity by area Comparisons between periods for gas, condensate, LNG and LPG production are made between the current quarter and the same quarter from the previous year, as production is heavily influenced by seasonal factors. Conversely, comparisons for crude oil are made with the immediate previous quarter, as oil production rates are not generally subject to seasonal variations. Both comparisons are available in the table on page 4.
PNG LNG
During the quarter PNG LNG operated at an annualised rate of approximately 7.6 mtpa, 10% above nameplate capacity, supported by strong upstream deliverability and reliable plant performance. 26 LNG cargoes were shipped during the
fourth quarter, taking the full-year total to 101 LNG cargoes shipped and 156 cargoes in total since start-up in May 2014.
Gross gas production was 111.5 PJ (Santos share 15.1 PJ), measured at the inlet of the LNG plant. Gross condensate production for the quarter was 2.8 mmbbls (Santos share 377,200 barrels), measured at the Kutubu entry point. Gross gas
production from SE Gobe of 3.6 PJ (Santos share 0.3 PJ) was purchased by the PNG LNG project during the fourth quarter.
GLNG
As previously announced, GLNG’s first cargo left Curtis Island on 16 October 2015. A total of 11 cargoes have now been
shipped, with seven of those departing Gladstone during the fourth quarter. Commissioning cargoes were sold in advance on a blend of oil-linked and spot-based pricing. Sales under the long-term contracts with GLNG’s foundation customers will
commence during March 2016.
Average feed rate to the plant for the quarter was 370 TJ/d, which includes downtime for the planned 2-week shutdown
completed during November. Average feed gas to the plant for the quarter was approximately 50 per cent GLNG-owned
gas production, with the remaining feed gas supplied from third party and Santos portfolio-purchased quantities. Santos’ share of sales gas production of 5.4 PJ from GLNG’s upstream fields was a 218% increase in the corresponding quarter,
reflecting the ramp up of LNG train 1 over the period.
Train 1 produced 544,000 tonnes of LNG during the fourth quarter and achieved daily LNG production rates more than
10% above nameplate capacity.
Commissioning work on the second LNG train is underway with first LNG expected in the second quarter of 2016.
Santos reports GLNG production as the company’s interest of the sales gas produced from the GLNG upstream fields.
Santos portfolio gas produced for the GLNG project under the Horizon contract is attributed to the field of production. All third party purchased gas is not included in Santos’ reported production.
Bayu-Undan/Darwin LNG
Darwin LNG continued to perform strongly and achieved record annual LNG production of 3.8 million tonnes. Fifteen LNG cargoes were shipped during the quarter, bringing the total for the year to a record 58 cargoes.
Gross gas production of 57.0 PJ was 7% higher than the corresponding quarter due to high Darwin LNG capacity utilisation. Santos’ net entitlement to gas production in the fourth quarter was up 36% at 4.9 PJ due to a net entitlement adjustment
in the previous period. Similarly, despite declining yields, net condensate production increased significantly, up 75% to 136,800 barrels, and net LPG production increased 60% to 7,500 tonnes on the corresponding quarter.
Cooper Basin
Gas and gas liquids
Full-year sales gas and ethane production was in line with 2014 levels. Production during the fourth quarter of 16.0 PJ was
9% lower than the corresponding quarter reflecting reduced development activity and natural field decline, partially offset
by lower downtime and lower fuel, flare and vent. Twelve new gas wells were drilled, cased and suspended during the quarter, with one well drilling ahead as at 31 December. First gas was supplied to GLNG under the Horizon contract in early
October. Condensate and LPG production was 9% and 15% lower respectively as a result of lower raw gas production.
For
per
sona
l use
onl
y
Santos Ltd l Fourth Quarter Activities Report l 31 December 2015 Page 7 of 10
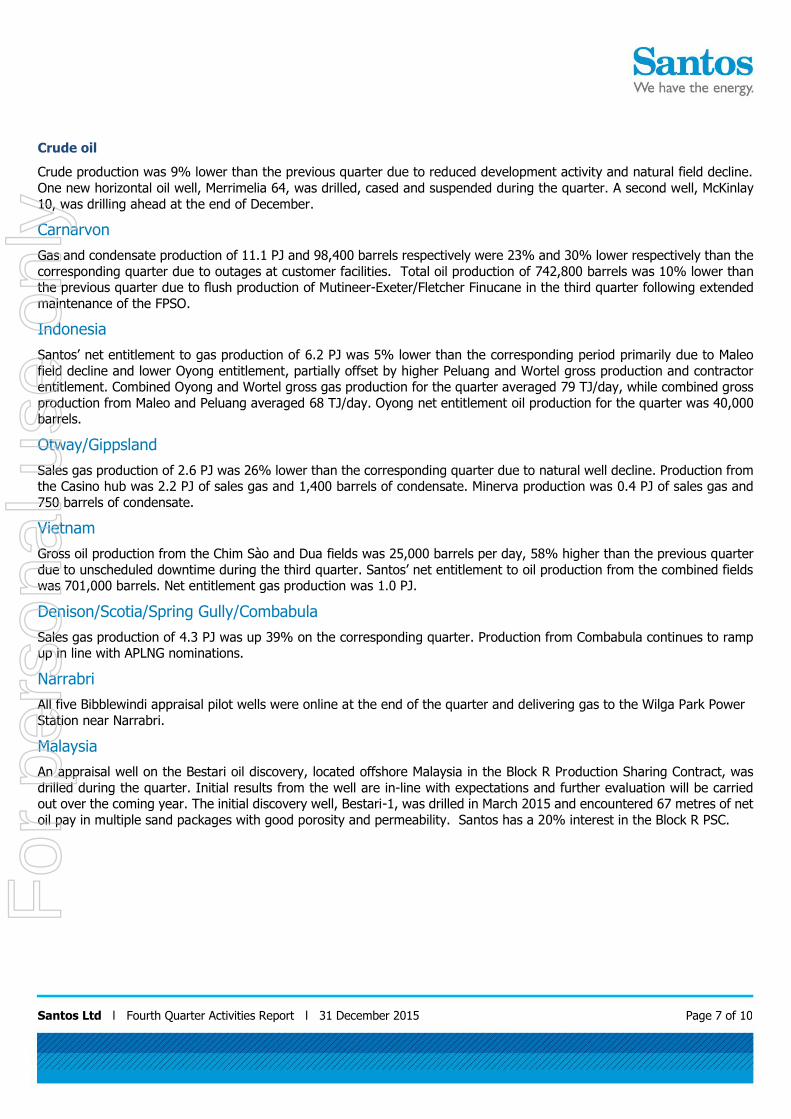
Crude oil
Crude production was 9% lower than the previous quarter due to reduced development activity and natural field decline.
One new horizontal oil well, Merrimelia 64, was drilled, cased and suspended during the quarter. A second well, McKinlay
10, was drilling ahead at the end of December.
Carnarvon
Gas and condensate production of 11.1 PJ and 98,400 barrels respectively were 23% and 30% lower respectively than the
corresponding quarter due to outages at customer facilities. Total oil production of 742,800 barrels was 10% lower than the previous quarter due to flush production of Mutineer-Exeter/Fletcher Finucane in the third quarter following extended
maintenance of the FPSO.
Indonesia
Santos’ net entitlement to gas production of 6.2 PJ was 5% lower than the corresponding period primarily due to Maleo
field decline and lower Oyong entitlement, partially offset by higher Peluang and Wortel gross production and contractor entitlement. Combined Oyong and Wortel gross gas production for the quarter averaged 79 TJ/day, while combined gross
production from Maleo and Peluang averaged 68 TJ/day. Oyong net entitlement oil production for the quarter was 40,000 barrels.
Otway/Gippsland
Sales gas production of 2.6 PJ was 26% lower than the corresponding quarter due to natural well decline. Production from the Casino hub was 2.2 PJ of sales gas and 1,400 barrels of condensate. Minerva production was 0.4 PJ of sales gas and
750 barrels of condensate.
Vietnam
Gross oil production from the Chim Sào and Dua fields was 25,000 barrels per day, 58% higher than the previous quarter
due to unscheduled downtime during the third quarter. Santos’ net entitlement to oil production from the combined fields was 701,000 barrels. Net entitlement gas production was 1.0 PJ.
Denison/Scotia/Spring Gully/Combabula
Sales gas production of 4.3 PJ was up 39% on the corresponding quarter. Production from Combabula continues to ramp up in line with APLNG nominations.
Narrabri
All five Bibblewindi appraisal pilot wells were online at the end of the quarter and delivering gas to the Wilga Park Power
Station near Narrabri.
Malaysia
An appraisal well on the Bestari oil discovery, located offshore Malaysia in the Block R Production Sharing Contract, was
drilled during the quarter. Initial results from the well are in-line with expectations and further evaluation will be carried out over the coming year. The initial discovery well, Bestari-1, was drilled in March 2015 and encountered 67 metres of net
oil pay in multiple sand packages with good porosity and permeability. Santos has a 20% interest in the Block R PSC.
For
per
sona
l use
onl
y
Santos Ltd l Fourth Quarter Activities Report l 31 December 2015 Page 8 of 10
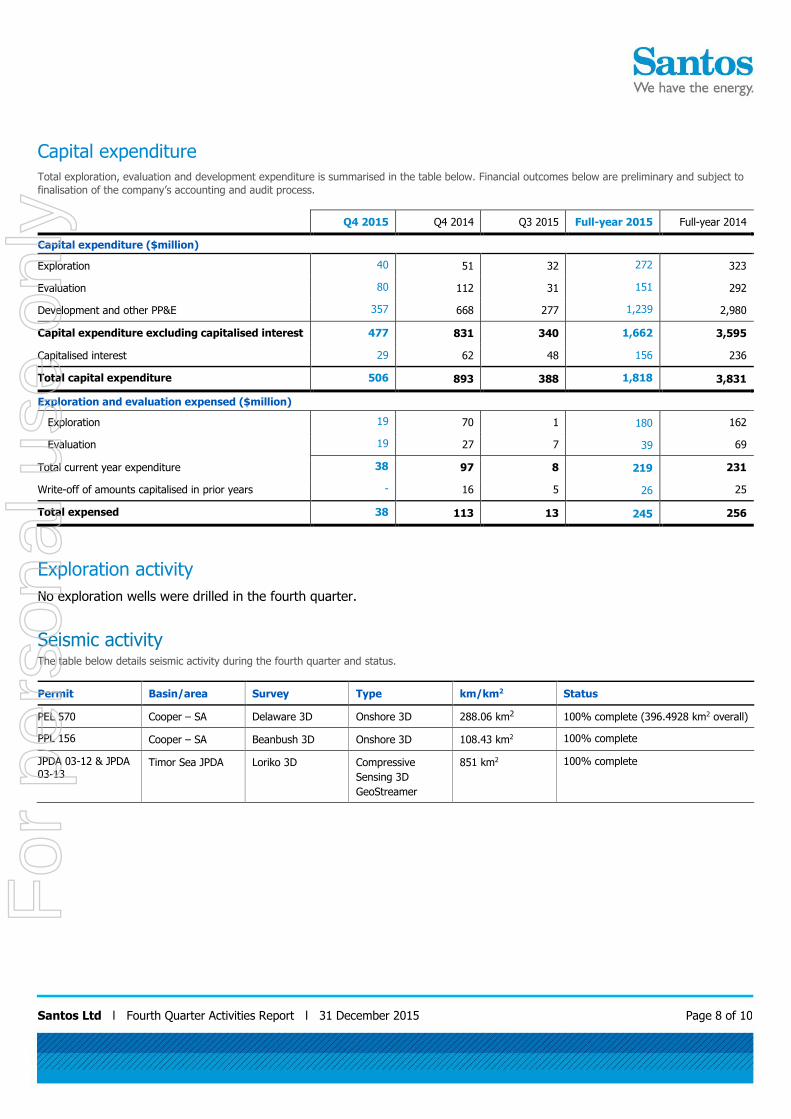
Capital expenditure Total exploration, evaluation and development expenditure is summarised in the table below. Financial outcomes below are preliminary and subject to
finalisation of the company’s accounting and audit process.
Q4 2015 Q4 2014 Q3 2015 Full-year 2015 Full-year 2014
Capital expenditure ($million)
Exploration 40 51 32 272 323
Evaluation 80 112 31 151 292
Development and other PP&E 357 668 277 1,239 2,980
Capital expenditure excluding capitalised interest 477 831 340 1,662 3,595
Capitalised interest 29 62 48 156 236
Total capital expenditure 506 893 388 1,818 3,831
Exploration and evaluation expensed ($million)
Exploration 19 70 1 180 162
Evaluation 19 27 7 39 69
Total current year expenditure 38 97 8 219 231
Write-off of amounts capitalised in prior years - 16 5 26 25
Total expensed 38 113 13 245 256
Exploration activity
No exploration wells were drilled in the fourth quarter.
Seismic activity The table below details seismic activity during the fourth quarter and status.
Permit Basin/area Survey Type km/km2 Status
PEL 570 Cooper – SA Delaware 3D Onshore 3D 288.06 km2 100% complete (396.4928 km2 overall)
PPL 156 Cooper – SA Beanbush 3D Onshore 3D 108.43 km2 100% complete
JPDA 03-12 & JPDA 03-13
Timor Sea JPDA Loriko 3D Compressive
Sensing 3D
GeoStreamer
851 km2 100% complete
For
per
sona
l use
onl
y
Santos Ltd l Fourth Quarter Activities Report l 31 December 2015 Page 9 of 10
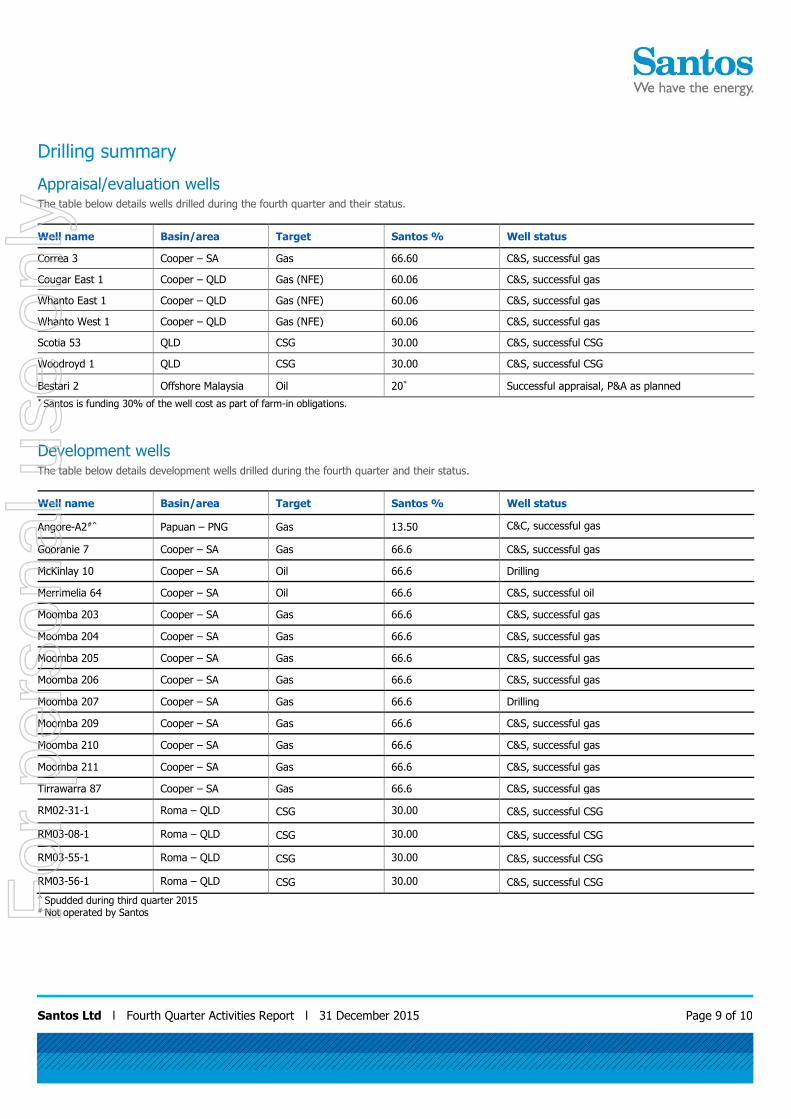
Drilling summary
Appraisal/evaluation wells The table below details wells drilled during the fourth quarter and their status.
Well name Basin/area Target Santos % Well status
Correa 3 Cooper – SA Gas 66.60 C&S, successful gas
Cougar East 1 Cooper – QLD Gas (NFE) 60.06 C&S, successful gas
Whanto East 1 Cooper – QLD Gas (NFE) 60.06 C&S, successful gas
Whanto West 1 Cooper – QLD Gas (NFE) 60.06 C&S, successful gas
Scotia 53 QLD CSG 30.00 C&S, successful CSG
Woodroyd 1 QLD CSG 30.00 C&S, successful CSG
Bestari 2 Offshore Malaysia Oil 20* Successful appraisal, P&A as planned
* Santos is funding 30% of the well cost as part of farm-in obligations.
Development wells The table below details development wells drilled during the fourth quarter and their status.
Well name Basin/area Target Santos % Well status
Angore-A2#^ Papuan – PNG Gas 13.50 C&C, successful gas
Gooranie 7 Cooper – SA Gas 66.6 C&S, successful gas
McKinlay 10 Cooper – SA Oil 66.6 Drilling
Merrimelia 64 Cooper – SA Oil 66.6 C&S, successful oil
Moomba 203 Cooper – SA Gas 66.6 C&S, successful gas
Moomba 204 Cooper – SA Gas 66.6 C&S, successful gas
Moomba 205 Cooper – SA Gas 66.6 C&S, successful gas
Moomba 206 Cooper – SA Gas 66.6 C&S, successful gas
Moomba 207 Cooper – SA Gas 66.6 Drilling
Moomba 209 Cooper – SA Gas 66.6 C&S, successful gas
Moomba 210 Cooper – SA Gas 66.6 C&S, successful gas
Moomba 211 Cooper – SA Gas 66.6 C&S, successful gas
Tirrawarra 87 Cooper – SA Gas 66.6 C&S, successful gas
RM02-31-1 Roma – QLD CSG 30.00 C&S, successful CSG
RM03-08-1 Roma – QLD CSG 30.00 C&S, successful CSG
RM03-55-1 Roma – QLD CSG 30.00 C&S, successful CSG
RM03-56-1 Roma – QLD CSG 30.00 C&S, successful CSG
^ Spudded during third quarter 2015 # Not operated by Santos
For
per
sona
l use
onl
y
Santos Ltd l Fourth Quarter Activities Report l 31 December 2015 Page 10 of 10
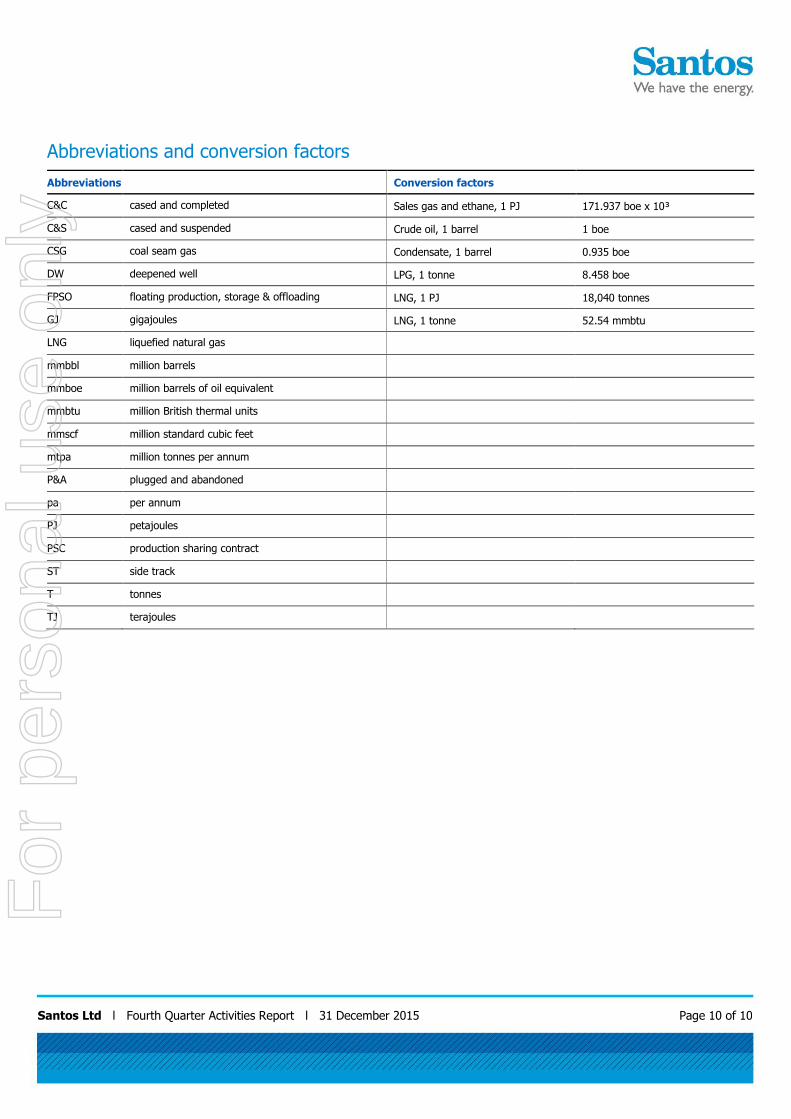
Abbreviations and conversion factors
Abbreviations Conversion factors
C&C cased and completed Sales gas and ethane, 1 PJ 171.937 boe x 10³
C&S cased and suspended Crude oil, 1 barrel 1 boe
CSG coal seam gas Condensate, 1 barrel 0.935 boe
DW deepened well LPG, 1 tonne 8.458 boe
FPSO floating production, storage & offloading LNG, 1 PJ 18,040 tonnes
GJ gigajoules LNG, 1 tonne 52.54 mmbtu
LNG liquefied natural gas
mmbbl million barrels
mmboe million barrels of oil equivalent
mmbtu million British thermal units
mmscf million standard cubic feet
mtpa million tonnes per annum
P&A plugged and abandoned
pa per annum
PJ petajoules
PSC production sharing contract
ST side track
T tonnes
TJ terajoules
For
per
sona
l use
onl
y


![Program Equivalence by Circular Reasoning...Dorel Lucanu, Vlad Rusu. Program Equivalence by Circular Reasoning. [Research Report] RR-8116, 2012, pp.26. hal-00744374v1 INRIA/RR--8116--FR+ENG](https://img.pdfslide.us/doc/110x75/6114dd2655d21b115d4b90bf/program-equivalence-by-circular-reasoning-dorel-lucanu-vlad-rusu-program-equivalence.jpg)