Embed Size (px)
Citation preview

ANNUAL
REPORT
2016
For
per
sona
l use
onl
y

CONTENTS VISION
01 What we do02 History04 FY16 Highlights06 The carsales world07 Our brands08 FY16 Financial performance10 Chair’s report12 Managing Director’s update14 Directors’ report18 Driving a sustainable business forward22 Board of Directors24 Management – executive
leadership team26 Board and management28 Remuneration report47 Auditor’s independence declaration48 Financial statements93 Directors’ declaration94 Independent auditor’s report
to the members96 Shareholder information99 Corporate directory
carsales.com Ltd is a company that makes the buying, selling and owning of cars, trucks, boats, motorbikes, caravans and equipment, simple, safe and easy.
We strive to be the compelling, trusted leader in every market in which we operate. We do this by empowering our people to deliver world class customer-centric solutions which help our customers across the world buy, sell and own with confidence. Whether it is a car, motorbike, caravan, truck, boat, combine harvester or a model car, we bring the same level of technology and knowledge to ensure buyers and sellers alike have meaningful and rewarding outcomes.
At carsales we deliver trust.
CARSALES.COM LIMITED | ANNUAL REPORT | ABN 91 074 444 018
For
per
sona
l use
onl
y

WHAT WE DO
Founded in 1997, carsales.com.au has grown to be the nation’s leading automotive classifieds site and in 2009 the Company floated on the ASX as carsales.com Ltd. carsales is regarded as one of Australia’s original disruptors and has expanded to include a large number of market-leading brands.
The carsales Network is Australia’s number one online destination for buying and selling cars, motorbikes, trucks, boats, caravans and machinery equipment. More vehicles are sold using the carsales Network than anywhere else.
Our core network of market-leading Australian classifieds sites are augmented by classifieds businesses in Chile, Mexico, Brazil, South Korea, Thailand, Malaysia and Indonesia. Our RedBook valuation business has operations in Australia, New Zealand, China, Thailand and Malaysia. Our businesses around the world are underpinned by cutting edge technology and advertising solutions and are enhanced by unique valuation and identification data. The latest reviews,
road tests and industry news, are all published on our sites, ensuring our buyers and sellers are fully informed and may deal with each other in confidence.
carsales is committed to having a positive impact on the community and to ensuring that future generations are supported. We achieve this through a diverse range of initiatives and employment practices and through our charitable arm, the carsales Foundation. As one of the original disruptors in the market, we understand how vital innovation is to our continued success. We believe that our solutions and services are world class and in order to ensure this continues, we strive to attract, retain and celebrate a truly diverse workforce that is empowered to deliver world class solutions.
CARSALES.COM LIMITED | ANNUAL REPORT | 30 JUNE 2016 | 01
For
per
sona
l use
onl
y

HISTORY
1997Founded by Greg Roebuck,
Wal Pisciotta and other senior executives as carz.com.au
1997August – acquired
carsales.com.au domain
2000Became a public non-listed
company
2002Founder Greg Roebuck
appointed Chief Executive Officer
2013Acquired 19.9%
of iCar Asia Limited (ASX: ICQ)
2010Launched iOS app for
iPhone and iPad, and later an Android app
2013Acquired 30% of Brazil’s number
one auto site Webmotors
2014Acquired 49.9% of South Korea’s
number one online car classifieds website SK Encar
Number of cars listed on carsales.com.au
5001997
16,000
50,000
100,000
220,000
1999
2003
2006
2016
02 | CARSALES.COM LIMITED | ANNUAL REPORT | 30 JUNE 2016
For
per
sona
l use
onl
y

Vehículos en venta con fotografía
2003bikesales.com.au released
2005Acquired online classifieds
websites from PBL including CarPoint/BoatPoint
2007Acquired RedBook
2009Initial Public Offering (IPO)
at $3.50/share
2014Acquired 50.1% of Stratton Finance
2015Acquired 50.1% of Auto Inspect
2015Acquired 65% of Mexico’s
SoloAutos
2016Acquired 83.3% of Chileautos
CARSALES.COM LIMITED | ANNUAL REPORT | 30 JUNE 2016 | 03
For
per
sona
l use
onl
y

FY16 HIGHLIGHTS
Over
Expanding global network*
Australia’s number one
Over Around
Facilitated over
Launched
Over Over
24 million
17 billion
carsales Foundation
5 million 6,000
45,000 1,000,000unique visitors
in June 2016
advert impressions pages of motoring.com.au content consumed per month
Nearly Nearly
2,000,000 100,000vehicle data points added
to RedBookvehicles inspected
editorial stories published
car dealers around the world
cars for sale around the world
• Growth of over 30% in Android app traffic
• 64% of customers using mobiles and apps to search for a car on carsales.com.au
• Apps win awards again
• Number of brand new cars in stock up 15% year on year
• Platform now cloud based (AWS) enabling rapid global deployment of carsales IP and technology to integrate international clients and acquisitions
• Integration of vehicle inspection services business Auto Inspect – rebranded RedBook Inspect
• carsales cloud technology live in Mexico
• State-of-the-art vehicle stock locators integrating finance search for BMW and Mercedes Benz
• New dealer portal enabled the consolidation of our B2B clients
• Stratton franchise expansion – now has a presence in every state and territory
Did you know?
* Total of figures for all websites we have an interest in globally.
04 | CARSALES.COM LIMITED | ANNUAL REPORT | 30 JUNE 2016
For
per
sona
l use
onl
y
Key investments for the year• Chileautos (83.3%) – Chilean online
classifieds
• SoloAutos (65%) – Mexican online classifieds
• PromisePay (10.1%) – digital payment platform
• Autologia – Spanish language editorial assets in Mexico acquired by SoloAutos
• Auto Inspect (50.1%) – Australian inspection services
• All About Finance (75%) – specialised Marine and Leisure Finance acquired by Stratton
Key products for the yearcarsales continued its proud track record of innovation in FY16. New product releases included:
• Inbox and notification centre – all alerts and messages in one place
• Dealer depth products (Top Spot, Top Deal, Multilist)
• Instant offer – no hassle way to sell your car
• Free basic ad where the car is priced under $3,000 – similar product released across bike, marine and caravan verticals
• Facebook instant articles
• RedBook Inspect integration into carsales.com.au
• motoring.com.au site refresh and native advertising
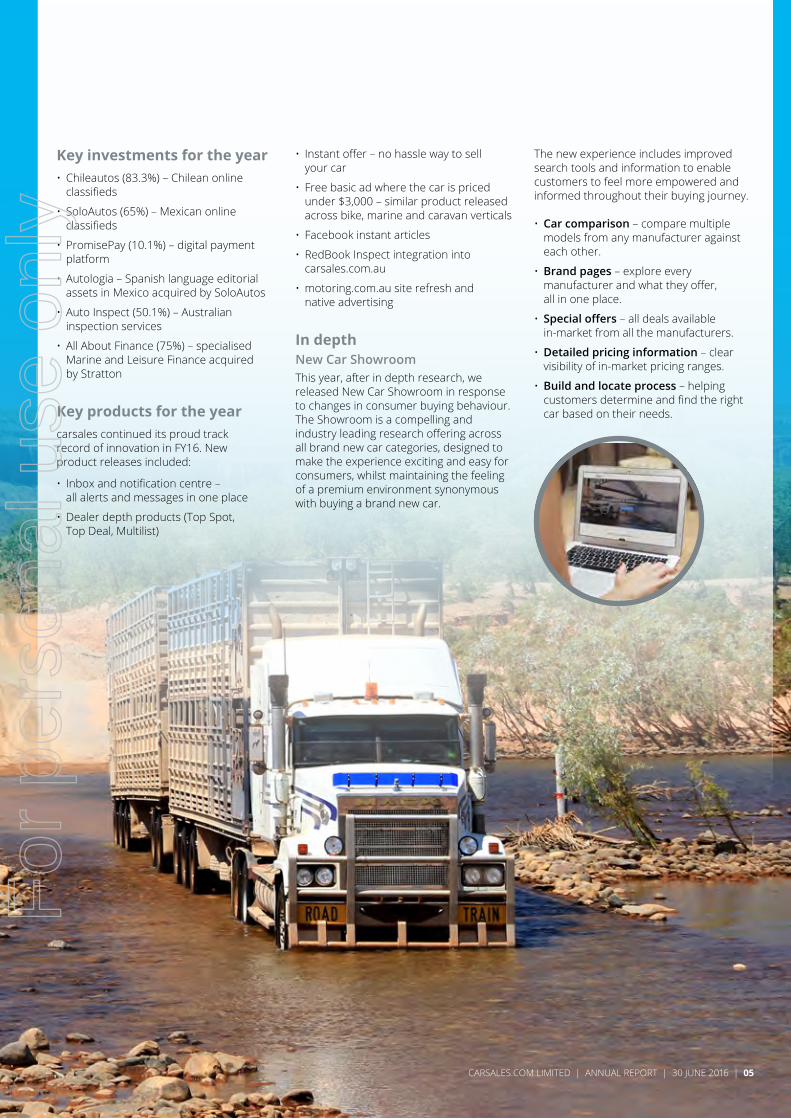
In depthNew Car ShowroomThis year, after in depth research, we released New Car Showroom in response to changes in consumer buying behaviour. The Showroom is a compelling and industry leading research offering across all brand new car categories, designed to make the experience exciting and easy for consumers, whilst maintaining the feeling of a premium environment synonymous with buying a brand new car.
The new experience includes improved search tools and information to enable customers to feel more empowered and informed throughout their buying journey.
• Car comparison – compare multiple models from any manufacturer against each other.
• Brand pages – explore every manufacturer and what they offer, all in one place.
• Special offers – all deals available in-market from all the manufacturers.
• Detailed pricing information – clear visibility of in-market pricing ranges.
• Build and locate process – helping customers determine and find the right car based on their needs.
CARSALES.COM LIMITED | ANNUAL REPORT | 30 JUNE 2016 | 05
For
per
sona
l use
onl
y

THE CARSALES WORLD
1 carsales.com Ltd Staff: 508 Offices: Melbourne, Sydney Perth, Adelaide and Brisbane
2 Stratton Finance Staff: 216
Offices: Melbourne and Sydney
3 SK Encar – South Korea* Staff: 125 Office: Seoul
4 SoloAutos – Mexico Staff: 45 Office: Guadalajara Acquired 65% in October 2015
5 Chileautos – Chile Staff: 30 Office: Santiago Acquired 83.3% in March 2016
6 Webmotors – Brazil* Staff: 206 Office: São Paulo
7 iCar Asia* Staff: 294 Offices: Kuala Lumpur, Bangkok and Jakarta
RedBook International Staff: 26
8 China Office: Beijing
9 Thailand Office: Bangkok
10 Malaysia Office: Kuala Lumpur
11 New Zealand Office: Auckland
12
3
4
5
7
8
910
11
6
* Reflects minority shareholding investments.
06 | CARSALES.COM LIMITED | ANNUAL REPORT | 30 JUNE 2016
For
per
sona
l use
onl
y

OUR BRANDS
Domestic InternationalDomestic and products and services
CARSALES.COM LIMITED | ANNUAL REPORT | 30 JUNE 2016 | 07
For
per
sona
l use
onl
y

FY16 FINANCIAL PERFORMANCE
Revenue EBITDA NPAT
$344m $170m $111m*
Group revenue up 10% Group EBITDA up 10% Adjusted group net profit after tax up 9%
• Online advertising revenue up 11% on prior year
• Data, research and services revenue up 9% on prior year
• Finance and related services gross profit up 29% on prior year
• Group EBITDA margin maintained at 50%
• Share of net profit from international businesses up 18% to $10.1 million
• Final dividend declared of 19.5 cents per share up 10% on prior year
* Adjusted Net Profit after tax is profit attributable to equity holders of the Company after adding back gain on associate dilution, gain on sale of business and acquired intangible amortisation expense.
Adjusted NPAT (millions)
CAGR 11.5%
FY120
20
40
60
80
100
120
71.6
FY13
83.5
FY14
95.5
FY15
101.8
FY16
110.5
Revenue (millions)
CAGR 16.9%
FY120
100
300
200
400
184.2
FY13
215.1
FY14
235.6
FY15
311.8
FY16
344.0
EBITDA (millions)
CAGR 13.9%
FY120
20
40
60
80
120
100
140
160
180
101.3
FY13
120.1
FY14
138.4
FY15
154.3
FY16
170.3
08 | CARSALES.COM LIMITED | ANNUAL REPORT | 30 JUNE 2016
For
per
sona
l use
onl
y
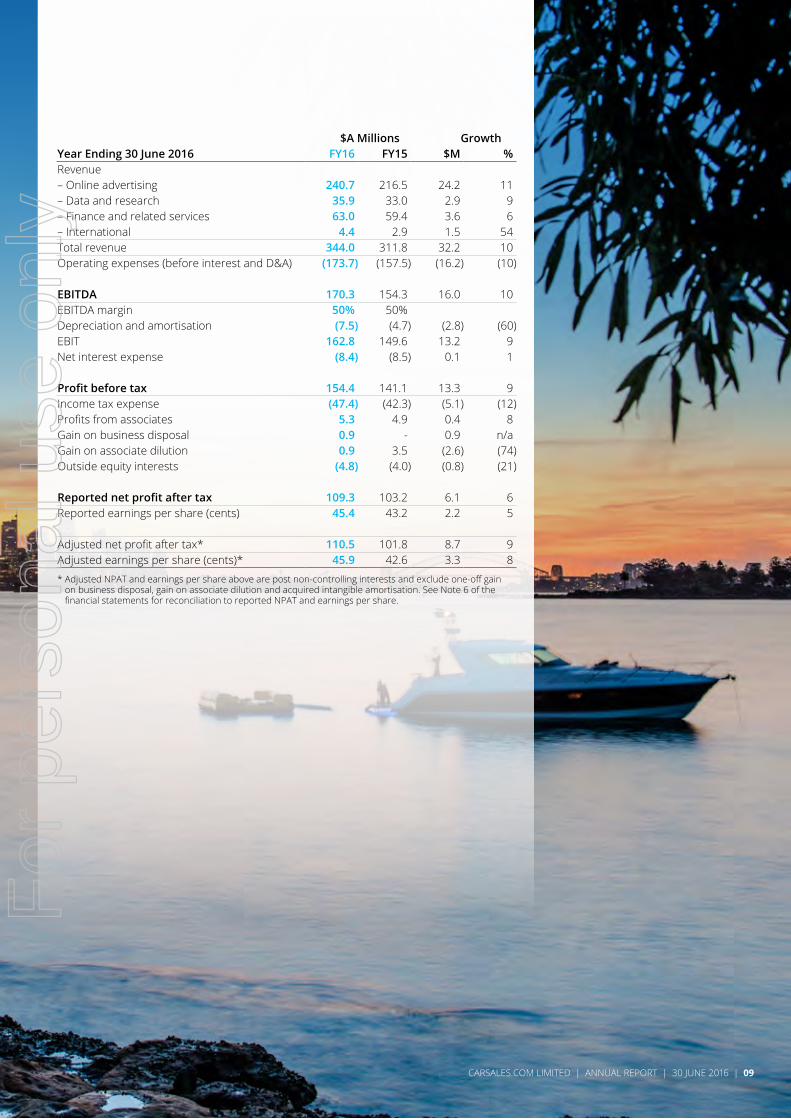
$A Millions GrowthYear Ending 30 June 2016 FY16 FY15 $M %Revenue – Online advertising 240.7 216.5 24.2 11– Data and research 35.9 33.0 2.9 9– Finance and related services 63.0 59.4 3.6 6– International 4.4 2.9 1.5 54Total revenue 344.0 311.8 32.2 10Operating expenses (before interest and D&A) (173.7) (157.5) (16.2) (10)
EBITDA 170.3 154.3 16.0 10EBITDA margin 50% 50%Depreciation and amortisation (7.5) (4.7) (2.8) (60)EBIT 162.8 149.6 13.2 9Net interest expense (8.4) (8.5) 0.1 1
Profit before tax 154.4 141.1 13.3 9Income tax expense (47.4) (42.3) (5.1) (12)Profits from associates 5.3 4.9 0.4 8Gain on business disposal 0.9 - 0.9 n/aGain on associate dilution 0.9 3.5 (2.6) (74)Outside equity interests (4.8) (4.0) (0.8) (21)
Reported net profit after tax 109.3 103.2 6.1 6Reported earnings per share (cents) 45.4 43.2 2.2 5
Adjusted net profit after tax* 110.5 101.8 8.7 9Adjusted earnings per share (cents)* 45.9 42.6 3.3 8* Adjusted NPAT and earnings per share above are post non-controlling interests and exclude one-off gain
on business disposal, gain on associate dilution and acquired intangible amortisation. See Note 6 of the financial statements for reconciliation to reported NPAT and earnings per share.
CARSALES.COM LIMITED | ANNUAL REPORT | 30 JUNE 2016 | 09
For
per
sona
l use
onl
y

CHAIR’S REPORT
Jeffrey BrowneChair
As we go forward, we will continue to disrupt, innovate and benchmark ourselves against the highest standards of technology, while at all times focusing on continuing to deliver growth and prosperity to our shareholders.
I am very pleased to report another successful year for carsales.com Ltd, where new heights have again been achieved in terms of key financial metrics and growth generally across the business.
Most obviously, our closing share price of $12.32 as at 30 June, 2016, reflects more than 20% growth on our closing price of $10.19 at 30 June 2015.
Revenue for the last 12 months is up 10% on the previous corresponding period (pcp) (from $311.8 million to $344.0 million) and EBITDA up by a similar margin (from $154.3 million to $170.3 million).
Adjusted net profit (after tax) and pro-forma operating cash flow (excluding the timing of a one-off change to tax payments in FY15) are both up 9% (from $101.8 million to $110.6m and $112.9 million to $122.6 million respectively).
These results reflect the skill and dedication of a highly motivated management team, very capably led by our Managing Director and CEO, Greg Roebuck, to whom I extend our congratulations and thanks on behalf of the Board.
In August last year I took over the role of Chair from our long standing and founding Chair, Wal Pisciotta. Wal’s skilful oversight of the Board has been fundamental to the success of carsales.com Ltd and I wish to record the Board’s deep appreciation for
his stewardship, hard work and dedication to the task of Chair and Director. Fortunately Wal’s contribution is not lost to us as a result of him continuing as a Non Executive Director and it was indeed fitting recognition of his many great achievements that Wal was awarded the Order of Australia Medal for services to the automotive industry in this year’s Queen’s Birthday honours.
As we move forward, the process of healthy Board renewal must remain in our sights if we are to continue to provide visionary, stimulating and fresh leadership to our highly skilled management team. To that end I am delighted to welcome our newest Director, Edwina Gilbert, who has already made a significant contribution to the Board, assisted by her legal background and extensive industry experience as dealer principal within the Phil Gilbert Motor Group. My thanks and appreciation as well to all of my co-Directors, each of whom has worked tirelessly to achieve the results we now proudly report from the last 12 months.
As our Managing Director and CEO has alluded to more specifically in his report, our last year has seen a number of key, strategic acquisitions. Greg and his team have not only delivered significant organic growth in our traditional markets here in Australia but in addition, the Company’s assets in Asia and Latin America have continued to develop very nicely for us. That contribution will be further enhanced over time by the maturation of our latest acquisitions in Mexico and Chile. Again, my congratulations to Greg and his team for their foresight in chasing down these new opportunities which importantly, broaden and strengthen our revenue base.
Our obvious success over the past 12 months also creates new challenges for us in the future. We need to develop and ensure that we are well and skilfully resourced to fully capitalise on our growth and to continue to scout for new opportunities. I am very confident that we have a Board and a management team that not only recognises these challenges, but embraces them with a vigour that characterises the very special DNA of carsales.com Ltd.
Revenue for the last 12 months is up 10% on the previous corresponding period (from $311.8 million to $344.0 million) and EBITDA up by a similar margin (from $154.3 million to $170.3 million).
10 | CARSALES.COM LIMITED | ANNUAL REPORT | 30 JUNE 2016
For
per
sona
l use
onl
y

So as we go forward, we will continue to disrupt, innovate and benchmark ourselves against the highest standards of technology, while at all times focusing on continuing to deliver growth and prosperity to our shareholders. I thank all of our investors for the faith shown in our Company and very importantly, I thank all of our loyal customers who we proudly service and who help us every day to improve and provide new and exciting services in the automotive industry, an industry which continues to grow and diversify, and an industry which we are privileged to be a special part of.
Very best wishes
Jeffrey BrowneChair
Melbourne8 August 2016
CARSALES.COM LIMITED | ANNUAL REPORT | 30 JUNE 2016 | 11
For
per
sona
l use
onl
y

MANAGING DIRECTOR’S UPDATE
Greg RoebuckManaging Director and Chief Executive Officer
Internationally, we’ve taken majority stakes in two more Latin American businesses: SoloAutos and Chileautos.
Thank you for your support of our great business in what has been another exciting and eventful year. FY16 has once again seen us make a number of new investments, deliver world leading technology solutions and move further ahead in our market leadership. We’re already focussed on the FY17 year and expect it to be another big year of opportunities and challenges – which of course the carsales team is always up for.
The 26th of June 2015 saw us take a controlling stake in a business called Auto Inspect. This business provides numerous inspection services ranging from simple validation services – for example in finance contracts to prove the car is in fact the car being financed; through to detailed and comprehensive pre-purchase inspections; and everything in between. We’ve subsequently renamed this business “RedBook Inspect” to leverage the 70 years of trust in our RedBook brand and extend the “Driving Confidence” that is RedBook. Already, this business is proving to be one of our best acquisitions, delivering strong growth and great synergies.
Internationally, we’ve taken majority stakes in two more Latin American businesses: SoloAutos and Chileautos. SoloAutos is a strong market player in Mexico – a huge market which is continuing to perform well economically and with a population over 125 million is an important marketplace with significant upside. Chileautos is a clear market leader and whilst Chile is a smaller market with a population of around 18 million, it is an advanced and vibrant country. Having controlling stakes in markets where Spanish is the common language has meant we’re comfortable investing substantial resources in making our platforms multi-lingual, which will provide numerous opportunities for us to take our market leading capabilities – such as our award winning app and lead/inventory management systems – to the rest of the world.
Domestically, we’ve recently taken a small stake in a technology based payments business: PromisePay. We see the ability to protect buyers wishing to send deposits or even full payments securely and with guaranteed trust as an important service. We will shortly be rolling out a new product called “PayProtect” as the first of our integrations with PromisePay.
The dealer arm of our business continues to perform well and we’ve focussed significant resources on this part of the business. Our world class solutions to help dealers operate profitably in an ever changing environment has ensured we’re more and more seen by this core customer group as a partner not a disrupter. We have made good progress this year with a number of car companies in regards to their policies regarding the listing of new cars online; disappointingly, there are still some car companies that require their retailers to not list new car stock with prices online. Whilst this clearly hurts a consumer’s ability to have price transparency, we believe it is also hurting the sales volumes of these vehicles – and we hope to see restrictions reduce over time.
The private seller marketplace continues to expand. This year saw us introduce free listings for cars under $3,000. We’ve also introduced similar free listings in some of our other vertical marketplaces such as bikesales, caravanandcampingsales and boatsales. We’ve seen strong take up of this offering as consumers are able to use Australia’s most trusted and safe platform to get a great result for cheaper items.
Our corporate display business has expanded its resources into a dedicated “OEM” team. This team is focussed on growing and enhancing our relationships with the car companies and we regularly host car company CEOs and senior executives from around the country in our offices, to showcase how we can provide vital insights and solutions to this key category of customer.
Both Webmotors and SK Encar – our Brazilian and Korean business investments respectively, continue to perform. Whilst we would like to be seeing greater contributions from these investments, we’re mindful of moving the business models forward at an appropriate speed. Webmotors, as of July 2016, is trialling a “leads model” – very similar to the Australian model that carsales has – and we expect the accountable nature of this model to not only deliver improved financial results, but to cement the value that Webmotors delivers to its dealers in a very tangible way. SK Encar is still some way from this model, but is growing its market share and capabilities very well.
12 | CARSALES.COM LIMITED | ANNUAL REPORT | 30 JUNE 2016
For
per
sona
l use
onl
y

Across the business our focus on innovation continues. We hold a number of hackathons each year and I am continually amazed at the fantastic ideas and innovations the team at carsales delivers. We have a wonderful culture that stems from an unwavering passion to be world class in everything we do. Our continued success is as a direct result of the wonderful team we have and I’d like to take this opportunity to publically thank them all. Our people are the envy of our competitors and I’m very proud of what they bring to the business every day.
In closing, we’ve had another great year, we’ve made more investments in exciting businesses both here and abroad and continued to deliver world class innovations and growth across all areas of the Company.
Yours sincerely,
Greg RoebuckManaging Director and CEO
Melbourne8 August 2016
CARSALES.COM LIMITED | ANNUAL REPORT | 30 JUNE 2016 | 13
For
per
sona
l use
onl
y

DIRECTORS’ REPORT
Your Directors present their report on the consolidated entity (referred to hereafter as the Group) consisting of carsales.com Ltd and the entities it controlled at the end of, or during, the year ended 30 June 2016.
Operational and Financial Review
Principal Activitiescarsales is the Australian automotive classified market leader and facilitates anyone to buy and sell a car, bike, boat, caravan and much more across our network of sites. Our network of sites is set out on page 7.
Our key services, customers and geographies include:
Online Advertising Servicescarsales.com Ltd online advertising offerings can be broken into two key product sets being classified advertising and display advertising services.
Classified advertising allows customers (including dealers and consumers) to advertise automotive and non-automotive goods and services for sale across the carsales Network. Classified advertising typically allows a customer to advertise their red brand X, model X car with 20,000km for $10,000 on a carsales website. This segment includes services such as subscriptions, lead fees and priority placement services across automotive and non-automotive websites.
Display advertising typically involves corporate customers such as automotive manufacturers/importers, finance and insurance companies etc, placing advertisements on carsales Network websites. These advertisements typically display the product or service offerings of the corporate advertiser such as a special offer on new utes by manufacturer X, or save 10% on insurance this month only etc, as banner advertisements or other sponsored links.
Online advertising includes carsales’ investment in tyresales.com.au which is an online tyre retailer that allows consumers to transact and purchase tyres; and RedBook Inspect which provides inspection services published online as part of classified advertisements.
Data and Research ServicesThe carsales.com Ltd divisions of RedBook, LiveMarket, DataMotive and DataMotive Business Intelligence provide various solutions to a range of customers including manufacturers/importers, dealers, industry bodies, finance and insurance companies. They offer products including software, analysis, research and reporting, valuation services, website development and hosting as well as photography services.
Finance and Related Services Finance and Related Services includes the Stratton Finance Pty Ltd subsidiary which provides innovative finance arrangements for vehicles, boats, and other leisure items, vehicle procurement and other related services to customers. Revenues arise from commissions paid by finance providers and other related service providers. carsales also has an investment in RateSetter Australia Pty Ltd (RateSetter) – an innovative peer-to-peer finance provider.
Internationalcarsales.com Ltd has operations in overseas countries through both subsidiaries and equity accounted associate investments as set out below:
Automotive Data Services:
• Auto Information Limited (New Zealand) – 100%
• RedBook Automotive Services (M) Sdn Bhd (Malaysia) – 100%
• RedBook Automotive Data Services (Beijing) Limited (China) – 100%
• Automotive Data Services (Thailand) Company Limited – 100%
Online automotive classifieds:
• Webmotors S.A. (operations in Brazil) – 30%
• iCar Asia Limited (operations in Indonesia, Malaysia and Thailand) – 20.2%
• SK ENCARSALES.COM Ltd (operations in South Korea) – 49.9%
• carsales Mexico SAPI de CV (SoloAutos) (operations in Mexico) – 65%
• Chileautos SpA (operations in Chile) – 83.3%
Group Financial Results2016 was a strong year as we continued to strengthen our domestic market position and deliver on our strategy of growth in core classifieds and data markets, complementary adjacent businesses and international markets.
FY16 was another year of record financial performance with Group operating revenue rising to $344.0m, up 10% on the prior comparative period.
Group earnings remained strong with EBITDA up 10% on the prior comparative period (pcp) to $170.3m and EBITDA margins of 50%.
Adjusted profit attributable to the owners of carsales.com Ltd, was $110.5m, up 9% on the pcp.
Reported profit attributable to the owners of carsales.com Ltd was $109.3m, up 6% on pcp.
The Directors believe the additional information on IFRS measures included in the report is relevant and useful in measuring the financial performance of the Group. In particular, the presentation of ‘adjusted net profit’ and ‘adjusted earnings per share’ provides the best measure to assess the performance of the Group by excluding one-off gains from disposal of business, gains on associate dilution and non-cash acquired intangible asset amortisation from the reported IFRS measures.
carsales Domestic HighlightsThe Australian business performed well during FY16 as we implemented our core and adjacent business growth strategy. Solid revenue growth was achieved across all business segments as follows:
Online Advertising• Dealer revenue up 10% on pcp to $123.8m
reflecting strong growth in depth products and pricing improvements expanding yields. Used car enquiry volumes were up 3% and new car enquiry volumes showed improvement in the second half. Used and new inventory grew by 8% and 15% respectively on pcp.
14 | CARSALES.COM LIMITED | ANNUAL REPORT | 30 JUNE 2016
For
per
sona
l use
onl
y

• Private revenue up 19% on pcp to $51.1m with private automotive ad volumes up double digit percentage in the second half accompanied by lower time to sell. Launch of the free under $3k basic ad campaign in automotive has supported this inventory growth. The extension of the campaign to other lifestyle and leisure brands has been well received. In our adjacent businesses tyresales.com.au and RedBook Inspect, showed strong revenue growth.
• Display revenue up 9% to $65.8m reflecting improved trends from 3% prior year growth rate. Our continued investment in analytics capability and insights is complementing the evolution of the display product set. The launch of the refreshed New Car Showroom will provide new opportunities for display. Despite ongoing changes in OEM advertising policies we still see positive signs in our relationships with OEMs across the board.
Data, Research and Services• Data, Research and Services revenue
up 9% to $35.9m. There was continued solid pcp revenue growth from Livemarket, driven by volume growth. Our RedBook business continues to expand reflecting increasing demand from OEMs for data services.
Finance and Related services• Finance and Related Services revenue
up 6% to $63.0m and gross profit up 29% on pcp to $47.2m reflecting growth in core finance broking and reduction in volume of lower margin other products. Strong growth in core finance broking revenue up 31% on pcp. All About Finance acquisition integrated into core Stratton operations and performing well. RateSetter integration continues and showing encouraging signs for the future. 10.1% stake in PromisePay acquired during the year with significant potential to provide complementary transaction settlement services to core customer base.
Domestic OperationsCosts were well controlled leading to EBITDA up 10% on pcp to $170.3m. Depreciation and amortisation increased by $2.8m on the prior period reflecting acquisition intangible asset amortisation and depreciation of capitalised labour supporting group wide integration and globalisation projects. The sale of the homesales business resulted in a $0.9m gain.
carsales International HighlightsThe Company holds interests in online automotive advertising companies operating in high growth international markets.
We acquired controlling stakes in SoloAutos (Mexico) and Chileautos (Chile) during the year. Along with our RedBook International business, international contributed $4.4m to group revenue – up 54% on the prior year. There is a significant opportunity to grow revenue and earnings from implementation of the carsales technology platform into these businesses.
In addition, carsales owns a portfolio of equity accounted investments in Brazil, South Korea and South East Asia.
WebmotorsWebmotors S.A. (Brazil) is owned 30% by carsales and is the number one online automotive classifieds company in Brazil. Webmotors delivered underlying local currency revenue growth of 13% with growth in both dealer and private revenue segments across the year. Display remains challenging reflecting the subdued economic conditions and impacts on the new car market as a result. Operational improvements continue to drive over 50% growth in dealer lead volumes on pcp. The trialling of a leads based model for dealers from July 2016 is expected to be a good growth contributor over the coming year. Margins remain steady, reflecting underlying leverage offset by investments to implement the lead model. carsales share of earnings excluding acquired intangible amortisation was $4.0m (down 1% on prior year) which reflected adverse FX rates during the year.
SK EncarSK Encarsales (South Korea) is 49.9% owned by carsales and is the number one online automotive classifieds company in South Korea. The business delivered underlying local currency revenue growth of 21% with strong continued revenue growth across dealer, private and display advertising channels. Dealer growth was a standout reflecting growth in premium listing products. Private growth reflects introduction of paid listings in April 2015. EBITDA margin reduced slightly on the prior year to 52% as the business continued to invest in personnel, technology and marketing in the second half of the year. carsales’ share of earnings excluding acquired intangible amortisation was $7.1m (up 15% on prior year).
iCar AsiaiCar Asia Limited (ASX:ICQ) is 20.2% owned as at 30 June 2016 by carsales. iCar Asia is the largest online automotive classifieds network in South East Asia owning the number one online automotive classifieds sites in Malaysia and Thailand, and the number two site in Indonesia. carsales’ share of net loss after tax (excluding gain on dilution) is estimated to be ($2.4m). carsales continues to support iCar’s business as it evolves. carsales’ recognised a gain of $0.9m in the year as a result of topping up our equity position.
Including our associates, adjusted net profit attributable to carsales shareholders from international operations grew by 18% to $10.1m in the year. Adjusted net profit excludes gain on dilution and acquired intangible amortisation.
OutlookWe continue to closely monitor our performance and market conditions. Domestic core business performance in the first month of FY17 has remained solid. Domestic adjacencies continue to build scale and breadth with a number of promising opportunities. Assuming these conditions continue to be stable we anticipate FY17 revenue and EBITDA growth will remain solid.
In terms of international outlook, assuming there is no further deterioration in market conditions, we anticipate the trialling of the lead model in Brazil to be a good growth contributor to local currency revenue and earnings in the coming year. South Korea is expected to see continued solid local currency revenue and earnings growth. We expect ongoing integration of core carsales IP and technology into our Chilean and Mexican businesses to provide a solid uplift in revenue and earnings in the coming year. A more detailed trading update will be provided at the October AGM.
Strategy Our strategy is to grow the three pillars of our business: core classified advertising and data services, complementary adjacent businesses, and international operations. This strategy allows us to maximise value for our customers and shareholders through expanding the breadth and depth of services we offer across new markets and geographies.
CARSALES.COM LIMITED | ANNUAL REPORT | 30 JUNE 2016 | 15
For
per
sona
l use
onl
y

Growing our core classified servicesClassified services are the foundation of our business and we continue to innovate to provide a compelling world class experience for consumers and customers. We’re constantly improving our classified experience for consumers and dealers across all devices and make sure our network of sites is the No. 1 destination for auto intenders in the markets in which we operate. We’ll continue to expand the number of customers who list their car, bike or boat with carsales, increase the volume sold to existing customers and dealers through continued listing depth product evolution and share in the increased value that we create for customers through our innovative approach. Our display business is evolving to reflect the demand for rich media, leveraging our leading editorial content, and developing products to provide ‘right time, right place’ advertising placements to ensure that manufacturers have the opportunity to influence the decision making process of car purchasers. Our data businesses will continue to grow and will allow us to provide deeper and more insightful analytics across our customer base, through increased personalisation of services and use of consumer data.
Complementary adjacent businessConnecting buyers and sellers is only one part of our business. We aim to provide a frictionless end-to-end buying and selling experience and leverage our trusted brand and customer relationships throughout the ownership period. Our investments in Stratton Finance, RateSetter and PromisePay over the last two years assist our customers with financing their purchase, removing a key hurdle in the buying process. Our RedBook Inspect business provides inspection services to consumers, dealers and corporates and along with our core data assets increases the trust between buyers and sellers. Over the next year we will continue to invest in new products and business to continue to build trust.
We run tyresales.com.au – a leading Australian online tyre retailer – which also supports consumers’ ownership experience. We anticipate growing this business and expanding the range of ownership services we provide to consumers over the coming years.
Expanding international operationsThis year marked a milestone in our international expansion strategy with the acquisition of majority stakes of leading classified businesses in Mexico and Chile. The carsales Network of subsidiaries and associate companies extends to ten countries and allows us to take the market leading technology and know-how from Australia into these new geographic markets to maximise returns from our investments. We have invested in a number of high growth, underserved markets which will benefit from structural classified shifts online as well as the investment carsales has already made in its core technology. We expect strong growth from our existing investments over the coming years as well as continuing to be on the lookout for new opportunities.
RiskBeing a complex business in a growth market carries with it a number of risks that the Company manages including, but not limited to:
• Maintenance of professional reputation and brand name – the success of carsales and its businesses around the world is heavily reliant on its reputation and branding. Unforeseen issues or events, which place carsales’ reputation at risk, may impact on its future growth and profitability.
• Relationship with dealers and OEMs – carsales derives a significant proportion of its revenue from motor vehicle dealers and automotive manufacturers (OEMs). A change in the size and/ or structure of this market could impact carsales’ earnings. In particular, consolidation of the dealer market with fewer, larger dealers or increased manufacturer control of dealers’ online advertising activity may impact upon the prospects of carsales. In addition, a significant proportion of carsales’ revenue is generated under monthly agreements with motor vehicle dealers. Should a significant number of dealers cancel or fail to renew their agreements, this may have an adverse effect on the financial performance of carsales.
• Competition – the online automotive advertising industry is highly competitive. carsales’ performance could be adversely affected if existing or new competitors reduce carsales’ market share from its current level.
• Downturn in the Australian economy, motor vehicle or general advertising market – the performance of carsales will continue to be influenced by the overall condition of the motor vehicle market. The motor vehicle market is influenced by the general condition of the Australian economy, which by its nature is cyclical and subject to change. In addition, carsales derives a significant proportion of its revenue from display advertisers on its network of websites. A decline or significant change in the advertising market as a result of broader economic influences or changing advertiser trends that the Company does not respond to could have a negative impact on carsales’ earnings.
• Cyber Security – the cyber threat to companies around the world is growing and unrelenting and carsales as an online business is not immune to these risks. carsales is vigilant and proactive in its approach to cyber security, investing resources to meet the challenges of a complex cyber environment in order to protect our customers’ data. A cyber-attack or hack of carsales systems could have serious impact on the Company’s reputation and financial performance.
• Information Technology – carsales’ business operations rely on owned and 3rd party IT infrastructure and systems. Any interruption to these operations or loss of customer data could impair carsales’ ability to operate its customer facing websites which could have a negative impact on carsales’ financial performance and reputation.
carsales’ future performance will also depend on its ability to monitor and manage major projects such as website upgrades and other projects involving its IT infrastructure.
• International expansion – with the expansion of the business into new high growth international geographies, the Company becomes exposed to the macroeconomic environment of these markets as well as to fluctuations in exchange rates. The Company may not be able to fully recoup its investment in these markets should it not be able to accelerate the growth of its businesses through the implementation of carsales’ business models, intellectual property and technologies.
DIRECTORS’ REPORT CONTINUED
16 | CARSALES.COM LIMITED | ANNUAL REPORT | 30 JUNE 2016
For
per
sona
l use
onl
y

CARSALES.COM LIMITED | ANNUAL REPORT | 30 JUNE 2016 | 17
For
per
sona
l use
onl
y

DRIVING A SUSTAINABLE BUSINESS FORWARD
People and cultureWe work in a fast-paced and dynamic business environment, which means that attracting and retaining the best talent is essential to our sustained success. Our people are highly skilled, experienced and have our values and behaviours at their core. We are always looking at ways to provide more opportunities for our team to learn and evolve, and we work hard to provide a diverse environment that is inclusive and collaborative with a strong social conscience.
To achieve this environment, we promote a culture of feedback so that we can continuously improve. Some of our more formal feedback initiatives include our annual engagement survey and discussion groups.
EngagementWe value employee engagement because we know that an engaged team has a direct impact on the success and sustainability of our business. Each year our team provides feedback via an engagement survey which covers areas such as innovation, leadership, collaboration and communication. The survey results consistently tell us that our people are engaged, and points us to areas we can focus on and improve.
DiversityA diverse and inclusive working environment provides a wide range of perspectives, innovation, engagement and improved operational performance. To achieve this environment we promote a workforce that embraces and respects diversity
and inclusion through our Diversity and Inclusion Council, as well as of our Diversity Strategy.
In 2015, we achieved the Workforce Gender Equality Employer of Choice citation in recognition of our systematic and strategic approach to the journey of achieving a gender diverse workplace. We see that this citation sets the very minimum that we must achieve moving forward and we will work to exceed the expectations of WGEA year on year.
In early 2016 the carsales Foundation was formed with the vision to positively impact the community and show our commitment to making positive changes in all markets in which we operate.
18 | CARSALES.COM LIMITED | ANNUAL REPORT | 30 JUNE 2016
For
per
sona
l use
onl
y

In addition to our diversity strategy we also have a set of specific gender equality objectives that we focus on as set out below:
Objectives Initiatives Outcomes
Continue to grow the number of women performing senior roles from external appointments.
Initiatives include educating managers on the importance of a diverse workforce through unconscious bias training and an executive led Diversity Steering Committee.
Continue to maintain quotas for recruitment shortlists.
Review all job advertisements for gender bias.
In FY16, 50% of our senior leadership appointments have been women.
Continue to implement career development programs to prepare women within the business to take on more senior roles.
Current initiatives include a mentoring program, training and development programs including communication, presentation, management and influence skills training.
The Company’s mentoring program currently consists of 45% women. Of our career development programs, 38% of attendees were women and 44% of FY16 promotions within the business have been female.
Create an environment in which women network and mentor each other to progress their careers within carsales.
This year we implemented an Emerging Female Leaders program which comprised workshops focused on leadership and networking. We also continued with our women’s networking group and celebrated International Women’s Day.
The Emerging Female Leaders program had 39 participants in FY16.
Our female networking groups hosted several sessions and the business collectively celebrated International Women’s Day with a networking event and an inspiring guest speaker.
Implement workplace flexibility programs to create a workplace in which parents can meet both family and work responsibilities.
The Company increased paid parental leave again in FY16, further developed our transition and keeping in touch programs for members of the team taking parental leave, continued to support part time options, provided child care referrals and flexible re-entry into the business from a period of parental leave.
In FY16, 9 members of the carsales team took parental leave and the Company is currently supporting 17 members of the team with formal flexible working arrangements. We also have many more informal flexible working arrangements to allow for team members to meet their family and work commitments.
On 31st May 2016, in accordance with the Workplace Gender Equality Act 2012, carsales submitted a report to the Workplace Gender Equality Agency. This report provided information on carsales’ policies and gender diversity numbers across the business. This report is available in the Investor Centre on the Company website at http://shareholder.carsales.com.au/Investor-Centre/.
White Ribbon accreditation programAs part of our diversity strategy, we are proud to be part of the White Ribbon Workplace accreditation program. We see the program as a way for us to take a leadership role on the issue of domestic violence. Gaining accreditation will see us go through an intensive program of work to take active steps to prevent and respond to violence against women. It will take us 18 months and we are looking forward to the awareness it generates.
CommunityIn early 2016 we formed the carsales Foundation with the vision to positively impact the community and show our commitment to making positive changes in all markets in which we operate.
The carsales Foundation is separate to the carsales business and is a registered charity. Each year the business has made a commitment to make an annual contribution to the Foundation. In addition, all proceeds from our team fundraising events will also go towards the Foundation.
The first phase of the carsales Foundation will focus on two core areas:
• tertiary education for the next generation; and
• community grants program.
The carsales Foundation is a registered charity and is overseen by a Foundation Board consisting of:
• Greg Roebuck – Chief Executive Officer and Managing Director;
• Cameron McIntyre – Chief Operating Officer;
• Nicole Birman – General Counsel and Company Secretary;
• Chris Polites – Dealer Director; and
• Jo Allan – GM People and Culture.
In the short time that the Foundation has been in existence, we are delighted to have already sponsored two scholarships.
CARSALES.COM LIMITED | ANNUAL REPORT | 30 JUNE 2016 | 19
For
per
sona
l use
onl
y
DRIVING A SUSTAINABLE BUSINESS FORWARD CONTINUED
Swinburne University: carsales Foundation – women in IT scholarship• The carsales Foundation women in IT
scholarship is focused on encouraging women to undertake a career in the technology industry. Currently women are under-represented in technology and the carsales Foundation’s goal is that this scholarship will support a female with a demonstrated academic ability and desire to undertake undergraduate studies in the field of Information Technology at Swinburne University. In addition to the scholarship, carsales will provide an internship to support the scholarship recipient to gain practical experience in a leading online organisation.
Curtin University: carsales Foundation – indigenous scholarship• The carsales Foundation indigenous
scholarship has been developed in conjunction with Curtin University to encourage and support indigenous students who have chosen to undertake an undergraduate degree at Curtin University.
In addition to the Foundation’s efforts, all carsales team members are encouraged to take a day out of the office to volunteer for a community based charity. Our team have contributed many volunteer hours supporting organisations such as the Salvation Army, Cancer Council and the RSPCA’s Million Paws Walk.
Learning and developmentWe are focused on providing access to opportunities to support the development, retention and succession of our people. Some of these training and development programs include mentoring programs, our annual CEO Scholarship award, leadership development, conferences, online learning plus internal and external training programs. In FY16 we saw over 3,900 hours of training provided for our team.
Mental health and wellbeingWe are proactive in supporting our team’s mental health. In the last 12 months we have introduced a program to support our team, which includes three aspects: My Physical Wellness, My Mental Wellness and My Future-Self Wellness. This program
involves initiatives such as group fitness training classes, seminars on topics such as healthy eating and relaxation, participation in the corporate games, our Employee Assistance Program, involvement in RUOK Day and more.
HackathonsAs a business built on innovation and disruption, we encourage these values to continue from within. One of the ways we encourage innovation is through our Hackathons. A number of times a year we give our team creative freedom to come up with concepts and working prototypes to benefit the Company, our customers and our consumers. Many of these initiatives are developed and implemented. Whilst we know that running a Hackathon doesn’t alone make us an innovative organisation, it certainly goes a long way to fostering creativity and empowerment to give something a go.
20 | CARSALES.COM LIMITED | ANNUAL REPORT | 30 JUNE 2016
For
per
sona
l use
onl
y

EnvironmentWhilst the nature of the carsales business has a low environmental impact, the Company aims to minimise its environmental footprint. In all Company offices, carsales promotes recycling by having bins throughout our offices with clear explanation on how to correctly recycle; purchases only 100% recycled paper and enforces printing limits including default double sided, black and white printing; and has implemented timed lights in all meeting rooms. The carsales head office in Richmond is certified as a 4.5 star NABERS rated building.
As part of carsales’ continued efforts to minimise its environmental footprint, it has offset emissions for its fleet vehicles. carsales has offset these emissions through Greenfleet (Australia’s most respected source of biodiverse carbon offsets). As a result of this relationship, Greenfleet will plant enough native trees on behalf of carsales to absorb 193.5 tonnes of CO2 emissions and to restore native forests in Australia. To protect our climate and unique biodiversity, carsales has introduced
policies to reduce air travel and increase our use of video conferencing which are having a significant impact on both the Company’s environmental commitments and our financial targets.
The Company’s move to cloud based solutions and Amazon Web Services (AWS) for our cloud based hosting is part of our commitment to reduce our environmental footprint. AWS has a long-term commitment to achieve 100 percent renewable energy usage for the global AWS infrastructure footprint. In April 2015, AWS announced that approximately 25 percent of the power consumed by its global infrastructure was from renewable energy sources with a goal of increasing that percentage to at least 40% by the end of 2016. As part of its renewable energy push, AWS continues to work on ways to increase the energy efficiency of its facilities and equipment, and to launch projects aimed at increasing the availability of renewable energy resources on the electrical grid that supplies power to current and future AWS cloud data centres.
Corporate Governancecarsales is committed to being ethical, transparent and accountable in everything that the Company does. We believe this is essential for the long term performance and sustainability of our Company and supports the interests of our shareholders and other stakeholders. The Board of Directors is responsible for ensuring that the Company has an appropriate corporate governance framework to protect and enhance Company performance and build sustainable value for shareholders. This corporate governance framework acknowledges the ASX Corporate Governance Council’s Corporate Governance Principles and Recommendations (ASX Principles and Recommendations) and is designed to support our business operations, deliver on our strategy, monitor performance and manage risk.
Our Corporate Governance Statement addresses the recommendations contained in the third edition of the ASX Principles and Recommendations and is available on our website at http://shareholder.carsales.com.au/Investor-Centre/?page=Corporate-Governance.
CARSALES.COM LIMITED | ANNUAL REPORT | 30 JUNE 2016 | 21
For
per
sona
l use
onl
y

BOARD OF DIRECTORS
Jeffrey BrowneNon Executive ChairJeffrey practiced as a commercial lawyer in Sydney and Melbourne for 22 years before joining the Nine television network, initially as Executive Director and later becoming Managing Director, with responsibility for all network operations. His legal experience saw him involved in a wide range of matters concerning dealers and motor vehicle manufacturers as well as other multi-national OEMs. Jeffrey is also Chair of Holden Special Vehicles where he has been a Director or Chair for over 12 years. Jeffrey’s media experience includes broad management responsibilities and the development and implementation of new broadcast and digital platforms.
Greg RoebuckManaging Director & CEOGreg was one of the original architects of carsales.com Ltd and has been on its Board since inception and Managing Director and CEO since May of 2002. Greg studied computer science at RMIT (Melbourne) and is a Fellow of the Australian Institute of Company Directors. He has over 32 years’ experience in providing technology solutions to the Australian Automotive Industry. Greg won the Ernst & Young Entrepreneur of the Year Award for Australia in November 2009.
Richard CollinsNon Executive Deputy ChairRichard has been a Director of carsales.com Limited since 2000 and currently holds the position of Deputy Chair of the Board. Richard holds a degree in Commerce from Melbourne University, majoring in Economics and Company Law. He spent 10 years with the Ford Motor Company and has over 30 years’ experience as a Dealer Principal, currently holding Ford, Toyota, Subaru, Suzuki, Isuzu Ute and Skoda franchises. Richard is also a member of the Board of AADA (Australian Automotive Dealer Association) and the Deputy Chair of Stratton Finance.
Wal Pisciotta OAMNon Executive DirectorWal has more than 35 years’ experience in supplying computer services to the automotive industry and is also the Chair of Pentana Solutions Pty Ltd. Wal holds a Bachelor of Science degree in Business Administration from the University of Alabama (United States) and was the Chair of carsales.com Limited since its inception until August 2015. Wal was recognised with the Medal of the Order of Australia for his services to the Australian Automotive Industry in the 2016 Queen’s Birthday Honours.
Kim AndersonNon Executive DirectorKim is the former CEO and founder of Reading Room Inc/Bookstr.com, a community/social networking site for readers, a Non Executive Director of WPP Australia and New Zealand, former Fellow of the University of Sydney Senate and former Director of The Sax Institute. Kim has more than 25 years’ experience in various advertising and media executive positions within companies such as Southern Star Entertainment, the Nine Network, PBL and Ninemsn.
22 | CARSALES.COM LIMITED | ANNUAL REPORT | 30 JUNE 2016
For
per
sona
l use
onl
y

Patrick O’SullivanNon Executive DirectorPat has been a Director of the Company since 2007 and was the Chief Operating Officer and Finance Director of Nine Entertainment Co Pty Limited (formerly PBL Media Pty Ltd) a position he held from February 2006 until 29 June 2012. Pat is a member of The Institute of Chartered Accountants in Ireland and Australia. He is a graduate of the Harvard Business School’s Advanced Management Program. He also served as a Director and Company Secretary of Nine Entertainment Co Pty Limited and was Chair of Ninemsn. Pat is currently a Non Executive Director of iSentia, APN Outdoor, Little Company of Mary Health Care and Chair of HealthEngine and Lux Group.
Edwina GilbertNon Executive DirectorEdwina has worked in the automotive industry since 2003, and is currently Dealer Principal of Gillen Motors and Director of Phil Gilbert Motor Group, managing 200 staff with two brands in two busy metropolitan locations. Edwina was the Chair of the Hyundai NSW Dealer Council and a member of the Hyundai National Dealer Council from 2010 – 2015. Edwina holds a Bachelor of Laws and Bachelor of Arts from Sydney University and practiced commercial law before moving into the automotive industry.
Steve KlossAlternate DirectorSteve has more than 25 years’ experience in supplying computer services to the automotive industry and is currently Chief Executive Officer at Pentana Solutions Pty Ltd. Steve holds a Bachelor of Business degree from Monash University and is an experienced board Director, currently sitting on six boards in addition to his position as Alternate Director of carsales.com Ltd.
Nicole BirmanCompany SecretaryNicole holds the position of General Counsel and Company Secretary of carsales.com Ltd. Nicole joined carsales in 2010 and is an experienced commercial lawyer. As a lawyer at one of Australia’s premier law firms, Nicole worked across a number of legal areas. For the past 8 years Nicole has been advising leading online companies as in-house counsel. Nicole holds a Bachelor of Laws (Hons) and a Bachelor of Arts from Monash University.
CARSALES.COM LIMITED | ANNUAL REPORT | 30 JUNE 2016 | 23
For
per
sona
l use
onl
y

MANAGEMENT – EXECUTIVE LEADERSHIP TEAM
Greg RoebuckManaging Director & CEOGreg was one of the original architects of carsales.com Ltd and has been on its Board since inception and Managing Director and CEO since May of 2002. Greg studied computer science at RMIT (Melbourne) and is a Fellow of the Australian Institute of Company Directors. He has over 32 years’ experience in providing technology solutions to the Australian Automotive Industry. Greg won the Ernst & Young Entrepreneur of the Year Award for Australia in November 2009.
Cameron McIntyreChief Operating OfficerCameron McIntyre has been the Chief Operating Officer at carsales.com Limited since October 2014, prior to which he was the Chief Financial Officer and Company Secretary for more than seven years which included the IPO of the Company in 2009. Cameron has over 23 years of finance and operational experience and is a Non Executive Director at iCarAsia Limited. Cameron holds a degree in Economics from La Trobe University, Melbourne, is a graduate of the General Management Program at Harvard Business School and is a Certified Practicing Accountant (CPA).
Ajay BhatiaChief Product & Information OfficerAjay Bhatia is currently the Chief Product and Information Officer of carsales.com Ltd. In his current role, Ajay is responsible for all aspects of product management, software development, infrastructure, IT operations and various support functions at the carsales.com Ltd. Additionally, Ajay is responsible for strategic oversight of several non-car businesses such as boats, bikes, trucks, caravans and more. Ajay has over 13 years of experience in pure digital businesses. During this time he has held several technical and commercial leadership positions ranging from GM Commercial, Product Director, and Technology Director to CIO. Ajay holds a Bachelor’s degree in Engineering from University of Technology, Sydney and a Masters in Management from the same university. Ajay was awarded Australian CIO of the year for 2015 by CEO Magazine Ltd.
24 | CARSALES.COM LIMITED | ANNUAL REPORT | 30 JUNE 2016
For
per
sona
l use
onl
y

Anthony SainesDirector – Media and OEMAnthony holds an MBA (Strategic Marketing) and since moving to Australia in 1998 has held a number of senior roles in the online advertising industry. Anthony is a current Board member of the Interactive Advertising Bureau (IAB), the peak trade association for online advertising in Australia, and his career includes senior executive positions at Sensis, DoubleClick, BMC Media and a Board position at Adstream Pty Ltd.
Paul BarlowDirector – InternationalPaul joined carsales in 2009 and is responsible for carsales’ international acquisition, growth and operations strategy including representing carsales as a Director of Webmotors, SoloAutos, Chileautos and tyresales.com.au. Paul has been involved in providing technology solutions to the automotive industry since 1988 and online classifieds since 1997 with Reynolds & Reynolds (Pentana Solutions) before founding Digital Motorworks (acquired by ADP Dealer Services). Paul has a Masters in Business Systems from Monash University.
Chris PolitesDirector – DealerChris has been working in the online automotive space since 2002. He was responsible for setting up eBay Motors, and has held a variety of senior roles at Peugeot, Ford Performance Vehicles and Google prior to joining carsales as Director, Dealer. Chris holds a Bachelor of Economics from University of Sydney and an MBA from UNSW.
CARSALES.COM LIMITED | ANNUAL REPORT | 30 JUNE 2016 | 25
For
per
sona
l use
onl
y

BOARD AND MANAGEMENT
Meetings of Directors
Full meetings of Directors
Audit and risk
Remuneration and nomination
A B A B A BJeffrey Browne (Board Chair) 13 14 ** ** 3 3Wal Pisciotta 13 14 ** ** ** **Greg Roebuck 14 14 ** ** ** **Richard Collins 12 14 3 4 ** **Pat O’Sullivan (Chair – Audit and Risk Management) 13 14 4 4 3 3Kim Anderson (Chair – Remuneration and Nomination) 13 14 3 4 3 3Steve Kloss (Alternate Director) 11 14 ** ** ** **Edwina Gilbert 2 2 ** ** ** **A. Number of meetings attended.B. Number of meetings held during the time the Director held office or was a member of the committee during the year.** Not a member of the relevant committee.
26 | CARSALES.COM LIMITED | ANNUAL REPORT | 30 JUNE 2016
For
per
sona
l use
onl
y

Committee MembershipThe following Directors have been members of Board committees for the full financial year unless otherwise stated below:
Remuneration and Nomination CommitteeMs Kim Anderson – Committee Chair (independent) (appointed 27 August 2015)
Mr Jeffrey Browne (independent) (resigned as Committee Chair 27 August 2015)
Mr Pat O’Sullivan (independent)
Mr Wal Pisciotta (resigned from committee 27 August 2015)
Audit and Risk Management Committee Mr Pat O’Sullivan – Committee Chair (independent)
Mr Richard Collins (independent)
Ms Kim Anderson (independent).
CARSALES.COM LIMITED | ANNUAL REPORT | 30 JUNE 2016 | 27
For
per
sona
l use
onl
y

The remuneration report is set out under the following main headings:
1. Remuneration Principles2. Company Financial Performance3. Remuneration Snapshot4. Remuneration Outcomes5. Non Executive Director Remuneration
The Board has established a Remuneration and Nomination Committee which provides advice on remuneration, incentive policies and practices, as well as specific recommendations on remuneration packages and other terms of employment for the Managing Director, Senior Executives and Non Executive Directors (Key Management Personnel).
The term “Senior Executives” refers to the Managing Director and those executives with responsibility and authority for planning, directing and controlling the activities of the Company, namely:
Greg Roebuck Managing DirectorCameron McIntyre Chief Operating OfficerAjay Bhatia Chief Product and Information OfficerAnthony Saines Director – Media and OEMPaul Barlow Director – InternationalChris Polites Director – Dealer
The information provided in this remuneration report has been audited as required by section 308(3C) of the Corporations Act 2001.
1. Remuneration Principles
1.1 Principles used to determine the nature and amount of remunerationThe objective of the Company’s executive remuneration framework is to ensure reward for performance is competitive and appropriate for the results delivered. The framework aligns executive remuneration with the achievement of strategic objectives, the creation of value for shareholders and aligns with market practice for delivery of reward.
The Board ensures that the executive remuneration framework satisfies the following key criteria for good remuneration governance practices:
Alignment to shareholders’ interests:
• Has economic profit as a core component of plan design.
• Focuses on sustained growth in shareholder return, consisting of dividends, growth in share price, constant return on assets as well as focuses on key non-financial drivers of value such as innovation and culture.
• Attracts and retains high calibre executives.
• Transparency.
Alignment to participants’ interests:
• Rewards capability and experience.
• Reflects competitive remuneration for contribution to growth in shareholder wealth.
• Provides a clear structure and goals for earning remuneration.
• Provides recognition for contribution to operational performance.
1.2 Executive RemunerationThe Senior Executive remuneration framework has five components:
• Cash salary and superannuation
• Short-term incentives
• Deferred short-term incentives
• Long-term incentives
• Other benefits
The governance of executive remuneration is a core focus of the Remuneration and Nomination Committee, which ensures that remuneration outcomes for our Senior Executives continue to align with Company performance.
REMUNERATION REPORT
28 | CARSALES.COM LIMITED | ANNUAL REPORT | 30 JUNE 2016
For
per
sona
l use
onl
y

So that the Remuneration and Nomination Committee is fully informed of market best practices, trends, regulatory developments and shareholder views, the Company engaged Guerdon Associates to conduct a number of remuneration reviews during the financial year including:
• a review and benchmarking of the remuneration of the Managing Director and the fees paid to the Chair of the Board;
• a review and benchmarking of the Company’s Long Term Incentive (LTI) program; and
• a review and assessment of alternative incentive programs that are currently being used in the market.
Guerdon was engaged by and reported directly to the Chair of the Remuneration and Nomination Committee. The report prepared by Guerdon was provided directly to the Chair of the Remuneration and Nomination Committee. The report was an input into the Remuneration Committee’s decision-making process and was considered along with other factors.
The fee paid to Guerdon for the remuneration review work conducted was $40,480. Peer BenchmarkingTo ensure the remuneration framework is market competitive and therefore most likely to ensure the retention of talent, the Company will from time to time benchmark remuneration structures against relevant peers.
The Company considers relevant peers to be ASX listed companies that are similar in size, structure and industry to that of carsales.
The Company accepts that while this peer group is small it is the most relevant group from which talent competition arises.
Cash Salary and Superannuation Structured as a total employment cost package that may be delivered as a combination of cash and prescribed non-financial benefits at the Senior Executive’s discretion.
Senior Executives are offered a competitive cash salary and superannuation package. Each Senior Executive’s package is reviewed annually, or subsequent to promotion, by the Remuneration and Nomination Committee, to ensure the Senior Executive’s pay is competitive within the market and in line with Company policies.
There is no guaranteed cash salary and superannuation increase included in any Senior Executive’s contract.
Statutory retirement benefits are provided via contributions to approved superannuation funds. Under current legislation carsales permits superannuation choice for all employees. The Company default superannuation fund is held with MLC.
Short Term IncentivesShort Term Incentives (STIs) are paid to Senior Executives in the form of an annual cash payment on the achievement of objectives as described below. The size of the STI opportunity available to each Senior Executive is based on their accountabilities and impact of the role on the organisation or business unit(s) which they lead.
The Remuneration and Nomination Committee annually considers appropriate targets and key performance indicators (KPIs) to link the STI plan and the level of payout if targets are met. This includes setting any maximum payout under the STI plan and minimum levels of performance to trigger payment of an STI.
The Remuneration and Nomination Committee is responsible for assessing whether the KPIs are met and whether or not STIs will be paid. The STI payments may be adjusted up or down in line with under or over achievement against the target performance levels. This is at the discretion of the Remuneration and Nomination Committee.
The Remuneration and Nomination Committee may also make recommendations to the Board for discretionary STI payments in rare circumstances where a Senior Executive’s performance warrants it.
Senior Executives that leave during the financial year may be paid a portion of their STI at the Board’s discretion. In the case of a good leaver the Board may grant a pro-rata share of their STI entitlements. Where a Senior Executive is a bad leaver and departs under adverse circumstances no pro-rata share is granted.
Deferred Short Term IncentivesDeferred Short Term Incentives (DSTI) are paid to Senior Executives in the form of an annual award of performance rights on the achievement of determined objectives and are not exercisable for a further 12 months after the testing date.
CARSALES.COM LIMITED | ANNUAL REPORT | 30 JUNE 2016 | 29
For
per
sona
l use
onl
y

The size of the DSTI opportunity available to each Senior Executive is determined by the accountabilities and impact of the Senior Executive’s role in the Company.
The vesting of a DSTI award is linked to the achievement of an Earnings Per Share (EPS) objective that is set each year by the Board. The EPS target value established takes into consideration both the annual budget earnings objectives and market determined consensus earnings expectations.
Long Term IncentivesLong Term Incentives (LTI) are provided to eligible employees via the carsales.com Ltd Employee Option Plan which was established via a prospectus lodged with ASIC in 2000. Upon recommendation by the Remuneration and Nomination Committee, the Board determines who shall be eligible to participate in the plan.
The LTI awards are a combination of options and performance rights under this plan and are issued for no cash consideration. Options and performance rights are issued subject to vesting rules and expiry periods. Options and performance rights vest on fixed dates provided that employment has not been terminated, and when financial targets have been achieved. The financial targets are currently EPS based and have a 3 year vesting period.
Options and performance rights issued to the Managing Director contain the same terms, conditions and performance targets as those issued to Senior Executives.
Since listing on the ASX in September 2009 the Board has reviewed a number of different incentive structures that align the terms and performance target methodologies with those of respected peers in our sector, as well as the interests of shareholders in ensuring management are incented to deliver high performance outcomes over the long-term.
The Company has selected EPS to be the most appropriate target on which to apply its LTI and DSTI programs. The rationale for this choice has historically been as a result of having only a small pool of relevant comparable peers, being other ASX listed online corporations.
The Board continues to believe that EPS is the most appropriate measure that best aligns the interest of shareholders with those of management. However, as noted below in section 1.3, from FY17 the Company will introduce changes to the LTI plan that take account of shareholder feedback. Senior Executives who leave the Company have 30 days from their date of departure to exercise any vested options they may be holding unless such departure is under adverse conditions. In exceptional circumstances, and at the Board’s discretion, Senior Executives may be allowed to retain unvested options and performance rights and exercise them in a future period when they vest.
Other BenefitsSenior Executives receive salary continuance insurance cover that is also provided to all other carsales employees. The policy is held with OnePath Life Ltd, but is not allocated on an individual employee basis.
In addition, the Managing Director was provided with a paid travel benefit during the year which includes the cost of FBT.
1.3 Looking ForwardThe Company does not anticipate any considerable changes to its remuneration approach for Senior Executives for FY17. However, as a result of shareholder feedback, the remuneration review conducted by Guerdon, and the Board’s desire to add further balance to the LTI plan, the Company will implement changes to the LTI program effective from FY17. Any modifications to the plan will be outlined to shareholders in the Notice of Meeting of the 2016 Annual General Meeting.
1.4 Non Executive DirectorsFees and payments to Non Executive Directors are determined by the demands that are made on their time, as well as their responsibilities. Non Executive Directors receive fixed, rather than variable pay.
REMUNERATION REPORT CONTINUED
30 | CARSALES.COM LIMITED | ANNUAL REPORT | 30 JUNE 2016
For
per
sona
l use
onl
y

2. Company Financial PerformanceThe graphs below demonstrate carsales’ financial performance over the past five years along with how that performance has translated to shareholders in the form of Earnings Per Share (EPS), share price performance and to Key Management Personnel (KMP) total remuneration shown as a percentage of adjusted profit for the year.
Dividend payment for FY12 includes a special dividend of 6.0 cents per share ($14,021,000).Dividend payment for FY15 includes a special dividend of 1.4 cents per share ($3,361,000).
3. Remuneration Snapshot
3.1 Cash based benefits that were realised in FY16As a general principle, Australian Accounting Standards require the value of share based payments to be calculated at the time of grant and accrued over the performance restriction period. The Corporations Act and Australian Accounting Standards also require that pay and benefits be disclosed for the period that a person is a Senior Executive. This may not reflect what Senior Executives received or became entitled to during the financial year.
The figures in the tables below have not been prepared in accordance with the Australian Accounting Standards. They provide additional disclosures to those outlined in section 3.2 (which provides a breakdown of Senior Executive remuneration in accordance with statutory requirements and Australian Accounting Standards) and may therefore be different.
The tables below are designed to reflect value of benefits that have been actually received by the Non Executive Directors and Senior Executives in FY15 and FY16 rather than the value received on an accounting treatment basis.
Our approach to presenting the table below has been as follows:
• The amounts shown in the table include cash salary, superannuation, non-monetary benefits and STI payable in cash under the STI plan in respect of that year.
• The DSTI and LTI that has been earned as a result of performance in previous financial years but was subject to a restriction period that ended either in June or August 2016 (June or August 2015 for the FY15 financial year).
• The DSTI value in the table below reflects the net value of shares received by the Senior Executive. The net value is calculated as the quantity of shares received at the 30 June 2016 closing share price (30 June 2015 closing share price for the FY15 financial year).
• The LTI values in the table below reflect the net value of options and shares received by the Senior Executive. The net value is calculated as the quantity of shares and options received at the 30 June 2016 share price (30 June 2015 closing share price for the FY15 financial year), less the exercise cost of converting options to shares.
• The FY15 table is presented on the same basis as 2016 unless specified otherwise.
Adjusted EPS and KMPremuneration
FY120
10
40
30
20
50
0
2
8
6
4
10
FY13 FY14 FY15 FY16
Adjusted earnings per share
EPS
cent
s
Ratio
%
KMP % of adjusted NPAT
Dividend paymentand ratio
FY1230
40
70
80
90
50
60
100
70
90
80
100
FY13 FY14 FY15 FY16
Dividend payments in respective year
$’m
Ratio
%
Dividend payout ratio %
Share price and movementpercentage
FY120.0
2.0
8.0
6.0
4.0
14.0
12.0
10.0
-40
-20
40
20
0
60
FY13 FY14 FY15 FY16
Closing share price
$
Mov
emen
t %
Share price movement %
CARSALES.COM LIMITED | ANNUAL REPORT | 30 JUNE 2016 | 31
For
per
sona
l use
onl
y

2016
Cash salary $
Superannuation $
Non-monetary
benefits $
STI payable as cash
$
Value of DSTI performance
rights that became
unrestricted $
Value of LTI that became unrestricted
$FY16 Total
$NameJeffrey Browne 227,871 - - - - - 227,871Richard Collins 197,503 18,763 - - - - 216,266Wal Pisciotta 129,538 - - - - - 129,538Pat O’Sullivan 159,817 15,183 - - - - 175,000Kim Anderson 155,280 10,973 - - - - 166,253Edwina Gilbert 19,569 1,859 - - - - 21,428Steve Kloss (Alternate) 110,000 - - - - - 110,000Sub-total Non Executive Directors 999,578 46,778 - - - - 1,046,356
Executive DirectorGreg Roebuck 1,880,692 19,308 268,093 970,000 - 3,138,093
Other Senior ExecutivesCameron McIntyre 1,080,692 19,308 19,127 350,000 - 1,469,127Ajay Bhatia 680,692 19,308 - 165,000 - 865,000Anthony Saines 610,692 19,308 - 226,000 - 856,000Paul Barlow 510,692 19,308 - 165,000 - 695,000Chris Polites 480,692 19,308 - 200,000 - 700,000Total Key Management Personnel compensation (Group) 6,243,730 162,626 287,220 2,076,000 - 8,769,576
2015
Cash salary $
Superannuation $
Non-monetary
benefits $
STI payable as cash
$
Value of DSTI performance
rights that became
unrestricted $
Value of LTI that became unrestricted
$FY15 Total
$NameJeffrey Browne 122,045 - - - - - 122,045 Richard Collins 182,172 17,306 - - - - 199,478 Wal Pisciotta 175,804 - - - - - 175,804 Pat O’Sullivan 140,945 13,390 - - - - 154,335 Kim Anderson 122,680 11,655 - - - - 134,335 Steve Kloss (Alternate) 90,417 . - - - - 90,417 Sub-total Non Executive Directors 834,063 42,351 - - - - 876,414
Executive DirectorGreg Roebuck 1,675,351 18,783 129,744 680,500 - 756,792 3,261,170
Other Senior ExecutivesCameron McIntyre 981,217 18,783 - 186,125 - 342,959 1,529,084 Ajay Bhatia 581,217 18,783 - 107,192 - 173,933 881,125 Anthony Saines 581,217 18,783 - 102,360 - 210,761 913,121 Paul Barlow 481,217 18,783 - 105,000 - 112,441 717,441 Chris Polites 365,217 18,783 - 107,850 - 86,963 578,813 Total Key Management Personnel compensation (Group) 5,499,499 155,049 129,744 1,289,027 - 1,683,849 8,757,168
REMUNERATION REPORT CONTINUED
32 | CARSALES.COM LIMITED | ANNUAL REPORT | 30 JUNE 2016
For
per
sona
l use
onl
y

3.2 Accounting Based BenefitsThe tables below have been prepared in accordance with the requirements of the Corporations Act and relevant Australian Accounting Standards. The figures provided under the share based payments columns are based on accounting values and do not reflect actual cash amounts received by Senior Executives in FY16.
2016Short-term
employee benefits
Deferred short-term
incentive
Post employment
benefits
Long-term
benefitsShare-based payments*
Cash salary
and fees$
Cash bonus
$
Non-monetary
benefits $
Performance rights
$Superannuation
$
Long service
leave $
Options $
Performance rights
$Total
$Non Executive DirectorsJeffrey Browne 227,871 - - - - - - - 227,871Richard Collins 197,503 - - - 18,763 - - - 216,266Wal Pisciotta 129,538 - - - - - - - 129,538Pat O’Sullivan 159,817 - - - 15,183 - - - 175,000Kim Anderson 155,280 - - - 10,973 - - - 166,253Edwina Gilbert 19,569 - - - 1,859 - - - 21,428Steve Kloss (Alternate) 110,000 - - - - - - - 110,000Sub-total Non Executive Directors 999,578 - - - 46,778 - - - 1,046,356
Executive DirectorGreg Roebuck 1,880,692 970,000 268,093 19,308 52,149 (27,475) 92,700 3,255,467
Other Senior ExecutivesCameron McIntyre 1,080,692 350,000 19,127 - 19,308 15,413 9,581 56,567 1,550,688Ajay Bhatia 680,692 165,000 - - 19,308 28,690 5,625 29,847 929,162Anthony Saines 610,692 226,000 - - 19,308 19,531 5,574 31,769 912,874Paul Barlow 510,692 165,000 - - 19,308 14,938 4,033 18,776 732,747Chris Polites 480,692 200,000 - - 19,308 6,526 2,704 15,099 724,329Total Key Management Personnel compensation (Group) 6,243,730 2,076,000 287,220 - 162,626 137,247 41 244,759 9,151,623
* The negative share based payments reflect the reversal of the accounting provision for the FY16 Long Term Incentive award which did not meet the minimum threshold required for performance rights and options to vest.
CARSALES.COM LIMITED | ANNUAL REPORT | 30 JUNE 2016 | 33
For
per
sona
l use
onl
y

2015Short-term
employee benefits
Deferred short-term
incentive
Post employment
benefits
Long-term
benefitsShare-based
payments
Cash salary
and fees$
Cash bonus
$
Non-monetary
benefits $
Performance rights
$Superannuation
$
Long service
leave $
Options $
Performance rights
$Total
$Non Executive DirectorsJeffrey Browne 122,045 - - - - - - - 122,045Richard Collins 182,172 - - - 17,306 - - - 199,478Wal Pisciotta 175,804 - - - - - - - 175,804Pat O’Sullivan 140,945 - - - 13,390 - - - 154,335Kim Anderson 122,680 - - - 11,655 - - - 134,335Steve Kloss (Alternate) 90,417 - - - - - - - 90,417Sub-total Non Executive Directors 834,063 - - - 42,351 - - - 876,414
Executive DirectorGreg Roebuck 1,675,351 680,500 129,744 - 18,783 243,414 402,464 484,041 3,634,297
Other Senior ExecutivesCameron McIntyre 981,217 186,125 - - 18,783 61,355 149,557 212,035 1,609,072Ajay Bhatia 581,217 107,192 - - 18,783 20,363 66,959 101,535 896,049Anthony Saines 581,217 102,360 - - 18,783 20,870 87,845 122,190 933,265Paul Barlow 481,217 105,000 - - 18,783 12,226 44,591 65,298 727,115Chris Polites 365,217 107,850 - - 18,783 5,069 5,339 52,548 554,806Total Key Management Personnel compensation (Group) 5,499,499 1,289,027 129,744 - 155,049 363,297 756,755 1,037,647 9,231,018
4. Remuneration Outcomes
4.1 Service ConditionsAll Senior Executives have service agreements determining cash salary, superannuation, performance based cash bonuses and participation in the Company Employee Option Plan. They have no fixed employment terms and no special termination payment conditions. All agreements provide for dismissal due to gross misconduct. The termination notice period is 6 months by either party and there is a 6 month non-compete period.
All Senior Executives are entitled to participate in the STI, DSTI and LTI plans.
4.2 SalaryCash salary and Superannuation of Senior Executives for FY16 is set out below:
REMUNERATION REPORT CONTINUED
34 | CARSALES.COM LIMITED | ANNUAL REPORT | 30 JUNE 2016
For
per
sona
l use
onl
y

Name Cash Salary and SuperannuationG Roebuck $1,900,000C McIntyre $1,100,000A Bhatia $700,000A Saines $630,000P Barlow $530,000C Polites $500,000
Senior Executives received a salary increase on 1 July 2015.
In 2016, three Senior Executives were awarded an increase in cash salary and superannuation above 10% by the Board.
Ajay Bhatia’s cash salary and superannuation increased by 20% in FY16 to more closely align his total remuneration to relevant industry peers and to reflect further increases in responsibilities.
Chris Polites’ cash salary and superannuation increased by 30% to better reflect the breadth and accountability of his role and more closely align him with his peers.
Greg Roebuck’s cash salary and superannuation increased by 11% to ensure his retention and align his remuneration with his most relevant industry peers.
4.3 STI Payments (cash bonus) Plan and Outcomes
4.3.1 STI Plan StructureThe KPIs linked to STI plans contain 3 major components and within each component are a series of objectives:
• Financial performance (70% of On-target Earnings Value): The financial objectives set against key financial targets relate to performance against Board approved annual financial objectives of the Company. The targets set in this component of the plan will normally relate to the achievement against:
(a) Company EBITDA and
(b) Company Net Profit After Tax (NPAT).
This section of the plan also enables the Senior Executive to earn up to an additional 70% of on-target earnings for over achievement against each of the above mentioned objectives.
Financial objectives are always set ensuring that the Company is mindful of expected consensus earnings expectations.
• Project delivery (20% of On-target Earnings Value): The project objectives involve the execution of pre-determined project targets for which each Senior Executive is responsible. Projects may include the deployment of new products and technology, developing new markets or improving particular important performance metrics.
This section of the plan also enables the Senior Executive to earn up to an additional 20% of on-target earnings for over achievement against each of the above mentioned objectives.
• People and culture (10% of On-target Earnings Value): carsales is a business that prides itself on having a highly engaged and motivated workforce with a strong sense of values, culture and passion for what it does. The people and culture section of the plan is designed to ensure that Senior Executives are incented to nurture and build on these principles and values. Each Senior Executive has performance objectives to ensure there is ongoing development and enhancement of Company culture. The performance of this is measured through the annual Employee Engagement Survey.
This section of the plan also enables the Senior Executive to earn up to an additional 10% of on-target earnings for over achievement against the above mentioned objective.
CARSALES.COM LIMITED | ANNUAL REPORT | 30 JUNE 2016 | 35
For
per
sona
l use
onl
y

4.3.2 STI Plan OutcomesThe Board has conducted an assessment of the performance of plan objectives and the information below describes each component of the plan’s performance outcomes.
To protect the commercial sensitivity of each objective outcome the Company has used the following references and applied a relevant reference to the plan objective:
Exceeded – The actual objective outcome exceeded the target objective outcome.On Target – The actual objective outcome was equal to the target objective outcome.Partial Achievement – The actual objective outcome while below the target objective outcome was still high enough that some achievement was reported.Missed – The actual objective outcome was materially below the target objective outcome.
• Financial Performance
– Company EBITDA – Exceeded
– Company NPAT – Partial Achievement
• Project Delivery – There were 6 projects that were part of this section of the STI plan, but due to commercial sensitivity each project objective is not outlined below only the status recorded against the overall project numbers:
– Three project objectives were – Exceeded
– Two project objectives were – On Target
– One project objective was – Missed
• People and Culture
– Employee Engagement – On Target
The Board in assessing overall performance and achievement of the plan has exercised discretion where appropriate reflecting individuals contribution to the business during FY16.
Actual STI Payment2016 $ % Paid % ForfeitedG Roebuck 970,000 277 -C McIntyre 350,000 233 -A Bhatia 165,000 174 -A Saines 226,000 141 -P Barlow 165,000 127 -C Polites 200,000 167 -
4.4 Deferred Short Term IncentivesThe vesting of performance rights is subject to the achievement of a financial year ending 30 June 2016 earnings per share target (EPS) but only exercisable 12 months post that testing date.
The minimum and maximum EPS target for the performance rights to vest have been set by the Board. In considering the appropriate EPS target, the Board has used the historical earnings performance of the Company, forward looking market consensus earnings expectations and other internal forward looking plans as inputs for determining the appropriate objective.
Performance rights will not be capable of exercise if at the testing date the minimum targeted growth rate has not been achieved.
Under this scheme, 13,724 performance rights were issued to the Managing Director on 23 October 2015, with an exercise price of $0.00. These performance rights were approved by shareholders at the AGM held on 23 October 2015.
In addition, 31,760 performance rights were issued to Senior Executives on 23 October 2015, with an exercise price of $0.00.
Performance Rights are capable of exercise if at the testing date the EPS target has been achieved or exceeded as follows:
• If the EPS achieved is equal to the minimum target, 70% of the performance rights will be capable of exercise.
• If the EPS achieved is between the minimum and maximum targets, vested performance rights will be capable of exercise on a pro-rata basis between 70% and 100%.
• If the EPS achieved is equal to or exceeds the maximum target, 100% of the performance rights will be capable of exercise.
The performance conditions applying to the performance rights are tested at 30 June 2016.
REMUNERATION REPORT CONTINUED
36 | CARSALES.COM LIMITED | ANNUAL REPORT | 30 JUNE 2016
For
per
sona
l use
onl
y

Subject to the performance conditions being satisfied, performance rights may be exercised after the Board releases the 2017 Annual Report to the ASX.
DSTI Minimum Entitlement Maximum Entitlement Actual AchievedGrant Vesting Date % payable EPS target ($) % payable EPS target ($) % payable EPS ($)Year ending 30 June 2016 August 17 70% 0.446 100% 0.469 80% 0.452
The exercise price of each option is fixed by the Board when the options and performance rights are issued. Amounts received on the exercise of options are recognised as share capital. The performance rights have a $0.00 exercise price and are converted to shares when all vesting conditions have been met. The option price is based on a 5 day volume weighted average price from June 30 of the corresponding financial year. Options and performance rights granted under the plan carry no dividend or voting rights until vested.
The actual EPS achieved for the DSTI grant vesting in August 2017 of $0.452 per share is above the minimum entitlement requirement of $0.446 per share. In calculating the achieved EPS of $0.452 the Company included the earnings and related costs from all acquisitions that occurred up until 23 October 2015 and specifically excludes:
• PromisePay – Acquired 10.1% interest in May 2016
• Chileautos – Acquired 83.3% interest in March 2016
The 2015 DSTI award was performance tested at 30 June 2015 and did not meet the minimum EPS target as set out in the 2015 Annual Report. This award would have vested immediately after the Board released the 2016 Annual Report to the ASX. The amounts payable under this award are as follows:
Actual DSTI Payment
2016
$Paid
%Forfeited
%Forfeited
$G Roebuck - - 100% 151,930 C McIntyre - - 100% 130,925 A Bhatia - - 100% 72,010 A Saines - - 100% 72,269 P Barlow - - 100% 43,206 C Polites - - 100% 35,999
4.5 Long term incentive plan
4.5.1 Options and performance rightsEPS targets relating to Senior Executive options and performance rights, together with the Company’s actual achievements are as follows:
LTI Minimum Entitlement Maximum Entitlement Actual AchievedGrant Vesting Date % payable EPS target ($) % payable EPS target ($) % payable EPS ($)Year ending 30 June 2014 August 16 50% 0.532 100% 0.560 0% 0.436
Minimum and maximum EPS targets for the options and performance rights were set for the period ending 30 June 2016 and approved by shareholders at the 2014 AGM on 25 October 2013.
EPS targets exclude any corporate activity associated with mergers and acquisitions, corporate or capital re-organisations that have occurred after 25 October 2013.
The actual EPS achieved for the LTI grant vesting in August 2016 of 0.436 per share is below the reported FY16 EPS of 0.454 per share. In calculating the achieved EPS of 0.436 the Company included the earnings and related costs from the following acquisitions that occurred prior to 25 October 2013:
• iCar Asia – Acquired 19.9% interest and announced March 2013
• Webmotors – Acquired 30% interest and announced April 2013Actual LTI payment
2016
$Paid
%Forfeited
%Forfeited
$G Roebuck - - 100% 1,058,934 C McIntyre - - 100% 352,979 A Bhatia - - 100% 151,279 A Saines - - 100% 201,697 P Barlow - - 100% 100,848 C Polites - - 100% 83,198
CARSALES.COM LIMITED | ANNUAL REPORT | 30 JUNE 2016 | 37
For
per
sona
l use
onl
y

4.5.2 Unvested Plan Structure for FY15 and FY16 (Senior Executives)The vesting of the plan is subject to the achievement of an EPS target with a testing date of 30 June in the relevant year and are exercisable after the Board releases the Annual Report to the ASX for that year.
The minimum and maximum EPS target for the options and performance rights have been set by the Board. In considering the appropriate EPS target, the Board has used the historical earnings performance of the Company, forward looking market consensus earnings expectations and other internal forward looking plans as inputs for determining the appropriate objective.
The minimum EPS target required for any of the awarded options and performance rights to vest is a target that will require the Company to achieve an EPS value that will reflect double digit compound annual growth rate (“CAGR”) in EPS between the baseline year and the testing year.
The Company will publish in its Annual Report the minimum and maximum EPS target that was applicable to the grant, along with the actual EPS achieved by the Company in that relevant year.
Options and performance rights will be capable of exercise, at the relevant testing date if the EPS target for the relevant period has been achieved or exceeded as follows:
• if the EPS achieved is equal to the minimum target, 50% (FY15 award) of the vested options and performance rights will be capable of exercise; and
• if the EPS achieved is equal to the minimum target, 70% (FY16 award) of the vested options and performance rights will be capable of exercise; and
• if the EPS achieved is equal to or exceeds the maximum target, 100% of the vested options and performance rights will be capable of exercise; and
• if the EPS achieved is between the minimum and maximum targets, vested options and performance rights will be capable of exercise on a pro-rata basis between 50% and 100% (FY15 award) or between 70% and 100% (FY16 award).
The expiry date of these awards are five years from the grant date.
The following award details are outlined for all unvested grants.
DateNumber of
Options
Number of Performance
RightsOptions
$
Performance Rights
$Vesting
Date
Financial Year
GrantedManaging Director 25/10/2013 134,213 50,874 9.10 0 Aug-16 FY14Senior Executives 25/10/2013 112,802 42,758 9.10 0 Aug-16 FY14Managing Director 24/10/2014 204,063 55,603 10.71 0 Aug-17 FY15Senior Executives 24/10/2014 196,425 48,373 10.71 0 Aug-17 FY15Managing Director 23/10/2015 226,269 74,609 10.24 0 Aug-18 FY16Senior Executives 23/10/2015 250,015 49,552 10.24 0 Aug-18 FY16
REMUNERATION REPORT CONTINUED
38 | CARSALES.COM LIMITED | ANNUAL REPORT | 30 JUNE 2016
For
per
sona
l use
onl
y

4.6. Additional Information
4.6.1 STI and DSTI Payments (cash & performance rights) achievement against maximum entitlementAll Senior Executives received grants that were less than their maximum potential STI & DSTI entitlements. The relative proportions of remuneration which are linked to performance and those that are fixed are as follows:
Cash Salary and Superannuation At risk – STI At risk – DSTI At risk – LTI
Name2016
%2015
%2016
%2015
%2016
%2015
%2016
%2015
%Non Executive Directors Jeffrey Browne 100 100 - - - - - -Richard Collins 100 100 - - - - - -Wal Pisciotta 100 100 - - - - - -Pat O’Sullivan 100 100 - - - - - -Kim Anderson 100 100 - - - - - -Edwina Gilbert 100 - - - - - - -Steve Kloss (Alternate) 100 100 - - - - - -
Executive DirectorGreg Roebuck 68 57 30 19 - - 2 24
Other Senior Executives Cameron McIntyre 73 66 23 12 - - 4 22Ajay Bhatia 78 69 18 12 - - 4 19Anthony Saines 71 66 25 11 - - 4 23Paul Barlow 74 71 23 14 - - 3 15Chris Polites 70 67 28 18 - - 2 15
4.6.2 Share Based Compensation DisclosuresThe terms and conditions of each grant of options and performance rights affecting remuneration in the current or a future reporting period are as follows:
Grant date Date exercisable Expiry dateExercise price
$
Value at grant date
$ % VestedPerformance
achievedOctober 2010 August 2013 October 2015 4.90 1.32 100 YesOctober 2010 August 2013 October 2015 4.90 1.44 100 YesOctober 2011 August 2013 October 2016 4.69 1.10 100 YesOctober 2011 August 2014 October 2016 4.69 1.19 100 YesOctober 2012 August 2014 October 2017 5.93 2.33 100 YesOctober 2012 August 2015 October 2017 5.93 2.43 75 YesOctober 2012 August 2015 October 2017 0.00 6.73 75 YesOctober 2013 August 2015 October 2018 0.00 10.58 100 YesOctober 2013 August 20161 October 2018 9.10 3.91 - NoOctober 2013 August 20161 October 2018 0.00 10.32 - NoOctober 2014 August 2016 October 2019 0.00 9.41 - NoOctober 2014 August 2017 October 2019 10.71 2.36 n/a To be determinedOctober 2014 August 2017 October 2019 0.00 9.12 n/a To be determinedOctober 2015 August 2017 October 2020 0.00 8.74 n/a To be determined2
October 2015 August 2018 October 2020 10.24 1.86 n/a To be determinedOctober 2015 August 2018 October 2020 0.00 8.44 n/a To be determined
1. Options and performance rights that are exercisable in August 2016 will not vest as a result of the Company not meeting the minimum EPS target which had been set.2. Subject to satisfactory completion of the remaining service period 80% of this award is expected to vest based on the performance achievements tested at 30 June
2016 as set out on page 37.
$0.00 exercise price represents performance rights.
When exercisable, each option is convertible into one ordinary share upon payment of the exercise price by the option holder, provided that the option holder complies with the rules of the carsales.com Ltd Employee Option Plan. Performance rights will automatically be converted to one ordinary share upon the vesting date provided the holder complies with the rules of carsales.com Ltd Employee Option Plan.
CARSALES.COM LIMITED | ANNUAL REPORT | 30 JUNE 2016 | 39
For
per
sona
l use
onl
y

Options and performance rights not exercised expire at the earliest of (a) the expiry date applicable to the option or performance right, (b) 30 days post the employee ceasing to be employed by carsales.com Ltd (or their employment is terminated), (c) where EPS vesting conditions are not met at the relevant date, or (d) where there has been a special circumstance, then within 90 days after that special circumstance has occurred or as specified by the Board.
Details of options and performance rights granted over ordinary shares in the Company provided as remuneration to each of the Senior Executives are set out below:
Name
Number of options granted during the
year 2016
Number of performance rights granted during the
year 2016
Value of options at grant date 2016
$
Value of performance rights at grant date 2016
$
Number of options and performance
rights vested during the year 2016
Executive DirectorG Roebuck 226,269 88,333 420,001 750,000 126,355
Senior ExecutivesC McIntyre 96,972 31,570 179,999 270,007 56,383A Bhatia 44,176 14,343 81,999 122,999 28,513A Saines 54,994 17,909 102,080 153,117 34,770P Barlow 30,169 9,786 56,000 84,005 18,482C Polites 23,704 7,704 43,999 65,996 14,256
Further information on the options and performance rights is set out in Note 24 to the financial statements.
4.6.3 Shares provided on exercise of remuneration options and performance rightsDetails of ordinary shares in the Company provided as a result of the exercise of options by each Senior Executive are set out below.
NameDate of exercise of options
and performance rights
Number of ordinary shares issued on
exercise of options and performance rights
during the year
Value atexercise date*
$Directors of carsales.com LtdG Roebuck August 2015 39,221 393,959
Senior ExecutivesC McIntyre August 2015 19,695 197,369
December 2015 36,688 175,002A Bhatia August 2015 10,169 101,867
December 2015 18,344 90,986A Saines August 2015 11,840 118,709
December 2015 22,930 103,644P Barlow August 2015 6,466 64,796
December 2015 12,016 63,805C Polites August 2015 5,084 50,929
September 2015 30,348 126,695
* The value at the exercise date of options and performance rights that were granted as part of remuneration and were exercised during the year has been determined as the intrinsic value of the options and performance rights at that date.
REMUNERATION REPORT CONTINUED
40 | CARSALES.COM LIMITED | ANNUAL REPORT | 30 JUNE 2016
For
per
sona
l use
onl
y
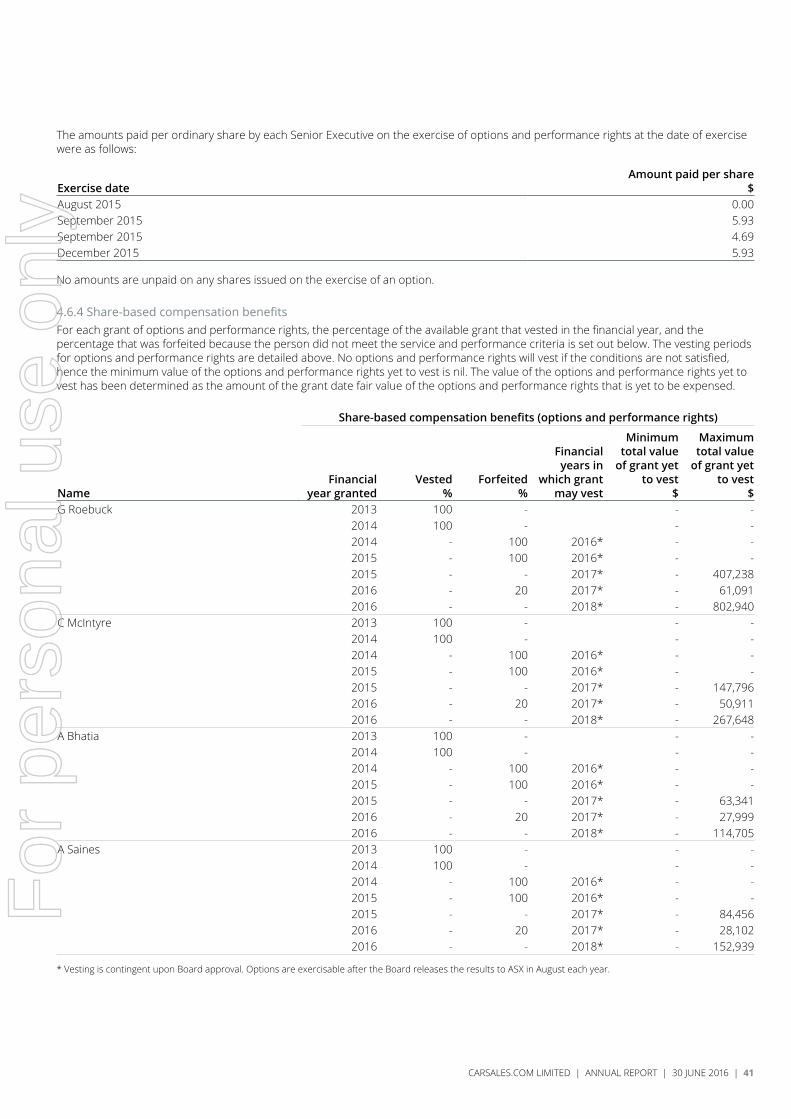
The amounts paid per ordinary share by each Senior Executive on the exercise of options and performance rights at the date of exercise were as follows:
Exercise dateAmount paid per share
$August 2015 0.00September 2015 5.93September 2015 4.69December 2015 5.93
No amounts are unpaid on any shares issued on the exercise of an option.
4.6.4 Share-based compensation benefitsFor each grant of options and performance rights, the percentage of the available grant that vested in the financial year, and the percentage that was forfeited because the person did not meet the service and performance criteria is set out below. The vesting periods for options and performance rights are detailed above. No options and performance rights will vest if the conditions are not satisfied, hence the minimum value of the options and performance rights yet to vest is nil. The value of the options and performance rights yet to vest has been determined as the amount of the grant date fair value of the options and performance rights that is yet to be expensed.
Share-based compensation benefits (options and performance rights)
NameFinancial
year grantedVested
%Forfeited
%
Financial years in
which grant may vest
Minimum total value
of grant yet to vest
$
Maximum total value
of grant yet to vest
$G Roebuck 2013 100 - - -
2014 100 - - -2014 - 100 2016* - -2015 - 100 2016* - -2015 - - 2017* - 407,2382016 - 20 2017* - 61,0912016 - - 2018* - 802,940
C McIntyre 2013 100 - - -2014 100 - - -2014 - 100 2016* - -2015 - 100 2016* - -2015 - - 2017* - 147,7962016 - 20 2017* - 50,9112016 - - 2018* - 267,648
A Bhatia 2013 100 - - -2014 100 - - -2014 - 100 2016* - -2015 - 100 2016* - -2015 - - 2017* - 63,3412016 - 20 2017* - 27,9992016 - - 2018* - 114,705
A Saines 2013 100 - - -2014 100 - - -2014 - 100 2016* - -2015 - 100 2016* - -2015 - - 2017* - 84,4562016 - 20 2017* - 28,1022016 - - 2018* - 152,939
* Vesting is contingent upon Board approval. Options are exercisable after the Board releases the results to ASX in August each year.
CARSALES.COM LIMITED | ANNUAL REPORT | 30 JUNE 2016 | 41
For
per
sona
l use
onl
y

Share-based compensation benefits (options and performance rights)
NameFinancial
year grantedVested
%Forfeited
%
Financial years in
which grant may vest
Minimum total value
of grant yet to vest
$
Maximum total value
of grant yet to vest
$P Barlow 2013 100 - - -
2014 100 - - -2014 - 100 2016* - -2015 - 100 2016* - -2015 - - 2017* - 42,2272016 - 20 2017* - 20,3652016 - - 2018* - 76,473
C Polites 2013 100 - - -2014 100 - - -2014 - 100 2016* - -2015 - 100 2016* - -2015 - - 2017* - 34,8372016 - 20 2017* - 14,0002016 - - 2018* - 63,084
* Vesting is contingent upon Board approval. Options are exercisable after the Board releases the results to ASX in August each year.
(i) Option holdings and performance rightsThe numbers of options and performance rights over ordinary shares in the Company held during the financial year by each Director of carsales.com Ltd and other Key Management Personnel of the Company, including their personally related parties, are set out below.
2016
Balance at start of
the year
Granted as compensation
(including performance
rights) Exercised Forfeited
Balance at end of
the yearVested and exercisable UnvestedName
Non Executive DirectorsJ Browne - - - - - - -R Collins - - - - - - -W Pisciotta - - - - - - -P O’Sullivan - - - - - - -K Anderson - - - - - - -E GilbertS Kloss (Alternate) - - - - - - -
Managing DirectorG Roebuck 664,927 314,602 (39,221) (191,552) 748,756 168,621 580,135
Other Senior ExecutivesC McIntyre 225,793 128,542 (56,383) (67,169) 230,783 - 230,783A Saines 131,368 72,903 (34,770) (38,275) 131,226 - 131,226A Bhatia 102,408 58,519 (28,513) (29,451) 102,963 - 102,963P Barlow 67,355 39,955 (18,482) (19,633) 69,195 - 69,195C Polites 75,781 31,408 (35,432) (16,047) 55,710 - 55,710
REMUNERATION REPORT CONTINUED
42 | CARSALES.COM LIMITED | ANNUAL REPORT | 30 JUNE 2016
For
per
sona
l use
onl
y

(ii) Share holdingsThe numbers of shares in the Company held during the financial year by each Director of carsales.com Ltd and other Key Management Personnel of the Company, including their personally related parties, are set out below. There were no shares granted during the reporting period as compensation.
2016
Balance at the start of
the year
Received during
the year on the exercise
of options
Other changes
during the year
Balance at end of the
yearNameNon Executive DirectorsOrdinary sharesJ Browne 13,650 - 13,112 26,762R Collins 1,003,276 - (89,145) 914,131W Pisciotta 14,770,700 - (115,967) 14,654,733P O’Sullivan 7,350 - 2,300 9,650K Anderson 10,000 - 5,000 15,000E Gilbert 0 - 25,000 25,000S Kloss (Alternate) 2,774,500 - - 2,774,500
Executive DirectorG Roebuck 4,852,681 39,221 - 4,891,902
Other Senior ExecutivesOrdinary sharesC McIntyre 366,019 56,383 (179,640) 242,762A Saines 37,001 34,770 (44,856) 26,915A Bhatia 3,000 28,513 (5,378) 26,135P Barlow 63,264 18,482 (6,498) 75,248C Polites 6,313 35,432 (17,312) 24,433
4.6.5 Other transactions with Key Management Personnel(i) Directors of carsales.com LtdW Pisciotta and S Kloss (Alternate Director) are Directors and shareholders of Pentana Solutions Pty Ltd, which entered into a relationship agreement with carsales.com Ltd in 2010 for the supply of data and services. Under the contract, Pentana Solutions supplies data for the exclusive use of carsales.com Ltd in return for a fixed annual payment, plus a percentage of revenues generated through Pentana Solutions. This was re-signed with a two-year term from March 2015.
R Collins is a shareholder of automotive dealerships which utilised the Group’s services under terms and conditions no more favourable than dealing with other customers at arm’s length in the same circumstances.
E Gilbert is a Director of automotive dealerships which utilised the Group’s services under terms and conditions no more favourable than dealing with other customers at arm’s length in the same circumstances.
4.6.6 Shares under option and performance rightsUnissued ordinary shares of carsales.com Ltd under option at the date of this report are as follows:
Date options granted Expiry date
Issue price of shares
$
Number under
options
Number under performance
rightsOct-2011 Oct-2016 $4.69 36,257 -Oct-2012 Oct-2017 $5.93 216,720 -Oct-2013 Oct-2018 $9.10 81,596 -Oct-2013 Oct-2018 $0.00 - 30,926Oct-2014 Oct-2019 $10.71 638,459 -Oct-2014 Oct-2019 $0.00 - 205,770Oct-2015 Oct-2020 $10.24 862,520 -Oct-2015 Oct-2020 $0.00 - 255,189
1,835,552 491,885
CARSALES.COM LIMITED | ANNUAL REPORT | 30 JUNE 2016 | 43
For
per
sona
l use
onl
y

No option or performance rights holder has any right under the options or performance rights to participate in any other share issue of the Company. No options or performance rights have been issued post 30 June 2016.
4.6.7 Shares issued on the exercise of options and performance rightsThe following ordinary shares of carsales.com Ltd were issued during the year ended 30 June 2016 on the exercise of options granted under the carsales.com Ltd Employee Option Plan. No amounts are unpaid on any of the shares.
Date options and performance rights exercised
Issue price of shares
$
Number of shares
issuedAugust 2015 0.00 123,739August 2015 4.69 – 5.93 61,237September 2015 4.69 – 5.93 40,433October 2015 0.00 50,146October 2015 4.69 – 4.90 55,172November 2015 5.93 11,301December 2015 5.93 107,443February 2016 4.69 – 5.93 12,860March 2016 5.93 47,257April 2016 4.69 – 5.93 13,923May 2016 5.93 16,125June 2016 4.69 – 5.93 26,854
566,490
5. Non Executive Directors’ remunerationThe current base remuneration pool was last approved by shareholders at the Annual General Meeting held on 23 October 2015.
Non Executive Directors’ fees are determined within an aggregate Directors’ fee pool limit, which is periodically recommended for approval by shareholders. The maximum payable to be shared by all Non Executive Directors currently stands at $1,500,000 per annum. The Directors determine how these are to be shared by the Directors.
The Board will from time to time invite a remuneration specialist to conduct a review and benchmarking of fees. The annualised fees paid to the Board are comfortably below the $1,500,000 pool approved by shareholders.
The following fee table applies:
$Chair fee 295,000Deputy Chair fee 140,000Base Director fee 120,000Alternate Director fee 110,000First Committee 25,000Second Committee 30,000
Other Directors Report Disclosures
Directors The following persons were Directors of carsales.com Ltd during the financial year and up to the date of this report unless indicated otherwise:
Jeffrey Browne Non Executive Chair – appointed position of Board Chair on 27 August 2015
Greg Roebuck Managing Director
Wal Pisciotta Non Executive Director – resigned position of Board Chair on 27 August 2015
Richard Collins Non Executive Deputy Chair
Pat O’Sullivan Non Executive Director
Kim Anderson Non Executive Director
Edwina Gilbert Non Executive Director – appointed 27 April 2016
Steve Kloss Alternate Non Executive Director
REMUNERATION REPORT CONTINUED
44 | CARSALES.COM LIMITED | ANNUAL REPORT | 30 JUNE 2016
For
per
sona
l use
onl
y

Dividends – carsales.com Ltd Dividends paid to members during the financial year were as follows:
2016 $’000
2015 $’000
Final fully franked dividend for the year ended 30 June 2015 of 17.7 cents (2014: 17.4 cents) plus a special dividend 1.4 cents (2014: nil cents) per share paid on 15 October 2015. 45,898 41,472 Interim fully franked ordinary dividend for the year ended 30 June 2016 of 17.8 cents (2015: 16.2 cents) per share paid on 15 April 2016. 42,878 38,812
88,776 80,284
At the end of the financial year the Directors have recommended the payment of a fully franked final ordinary dividend of $47,019,000 (19.5 cents per share) to be paid on 17 October 2016 out of retained profits at 30 June 2016.
Significant changes in the state of affairs During the financial year the Company continued to expand into new geographic markets by investing in controlling stakes in SoloAutos in Mexico and Chileautos in Chile, both leading automotive classified businesses in their respective markets. Further details are set out in Note 20 to the financial statements.
Matters subsequent to the end of the financial year No matter or circumstance has arisen since 30 June 2016 that has significantly affected, or may affect:
(a) the Group’s operations in future financial years, or
(b) the results of those operations in future financial years, or
(c) the Group’s state of affairs in future financial years.
Insurance of officers During the financial year, carsales.com Ltd paid a premium to insure the Directors and officers of the Company and its Australian-based controlled entities. The contract of insurance prohibits disclosure of the nature of the liability and the amount of the premium.
Indemnification of Directors and officers All current Directors and officers are indemnified under a deed of indemnity, insurance and access.
Non-audit services The Company may decide to employ the auditor on assignments additional to their statutory audit duties where the auditor’s expertise and experience with the Company are important.
Details of the amounts paid or payable to the auditor (PwC) for non-audit services provided during the year are set out below.
The Board of Directors has considered the position and, in accordance with advice received from the Audit and Risk Management Committee, is satisfied that the provision of the non-audit services is compatible with the general standard of independence for auditors imposed by the Corporations Act 2001. The Directors are satisfied that the provision of non-audit services by the auditor, as set out below, did not compromise the auditor independence requirements of the Corporations Act 2001 for the following reasons:
• all non-audit services have been reviewed by the Audit and Risk Management Committee to ensure they do not impact the impartiality and objectivity of the auditor; and
• none of the services undermine the general principles relating to auditor independence as set out in APES 110 Code of Ethics for Professional Accountants.
During the year the following fees were paid or payable for non-audit services provided by the auditor of the parent entity, its related practices and non-related audit firms:
CARSALES.COM LIMITED | ANNUAL REPORT | 30 JUNE 2016 | 45
For
per
sona
l use
onl
y
Consolidated
2016 $
2015 $
Other assurance services PwC Australian firmControls assurance services - 25,028Due diligence services 224,566 241,879Total remuneration for other assurance services 224,566 266,907
Taxation services PwC Australian firmTax compliance services 143,350 77,000Tax consulting and tax advice on acquisitions 88,124 84,264Total remuneration for taxation services 231,474 161,264
Other advisory services Other services 88,472 8,000
Total remuneration for non-audit services 544,512 436,171
Auditor’s independence declaration A copy of the auditor’s independence declaration as required under section 307C of the Corporations Act 2001 is set out on page 47.
Rounding of amounts The Company is of a kind referred to in ASIC Corporations (Rounding in Financial / Directors’ Reports) Instrument 2016/191, issued by the Australian Securities and Investments Commission, relating to the ‘rounding off’ of amounts in the Director’s Report. Amounts in the Director’s Report have been rounded off in accordance with that Class Order to the nearest thousand dollars, or in certain cases, to the nearest dollar.
Auditor PwC continues in office in accordance with section 327 of the Corporations Act 2001.
Corporate governance report As allowed under the ASX Corporate Governance Principles and Recommendations (Third Edition) the Company has included its report on compliance with the principles in the year to 30 June 2016 in the Corporate Governance section of the Investor Centre on the carsales website. The full report can be found at the following URL: http:// shareholder.carsales.com.au/Investor-Centre/?page=Corporate- Governance
This report is made in accordance with a resolution of Directors.
Jeffrey BrowneChair
Greg Roebuck Managing Director and CEO
Melbourne 8 August 2016
REMUNERATION REPORT CONTINUED
46 | CARSALES.COM LIMITED | ANNUAL REPORT | 30 JUNE 2016
For
per
sona
l use
onl
y

AUDITOR’S INDEPENDENCE DECLARATION
PricewaterhouseCoopers, ABN 52 780 433 757Freshwater Place, 2 Southbank Boulevard, SOUTHBANK VIC 3006, GPO Box 1331, MELBOURNE VIC 3001 T: 61 3 8603 1000, F: 61 3 8603 1999, www.pwc.com.au
Liability limited by a scheme approved under Professional Standards Legislation.
Auditor’s Independence Declaration
As lead auditor for the audit of carsales.com Ltd for the year ended 30 June 2016, I declare that to the best of my knowledge and belief, there have been:
a) no contraventions of the auditor independence requirements of the Corporations Act 2001 inrelation to the audit; and
b) no contraventions of any applicable code of professional conduct in relation to the audit.
This declaration is in respect of carsales.com Ltd and the entities it controlled during the period.
Anton Linschoten MelbournePartnerPricewaterhouseCoopers
8 August 2016
CARSALES.COM LIMITED | ANNUAL REPORT | 30 JUNE 2016 | 47
For
per
sona
l use
onl
y

FINANCIAL STATEMENTS CONTENTS
49 Consolidated statement of comprehensive income
50 Consolidated statement of financial position
51 Consolidated statement of changes in equity
52 Consolidated statement of cash flows
53 Notes to the financial statements
53 About this report
Key performanceCapital and financial risk management Other assets and liabilities Group structure Other
1. Segment information 7. Capital risk management 14. Receivables 19. Interest in other entities
23. Remuneration of auditors
2. Revenue 8. Cash 15. Property, plant and equipment
20. Business combinations and disposals
24. Share-based payments
3. Expenses 9. Borrowings 16. Intangible assets 21. Related party transactions
25. Parent entity financial information
4. Income tax 10. Contributed equity 17. Payables and provisions 22. Deed of cross guarantee
26. Other accounting policies
5. Reconciliation of profit to cash flow
11. Reserves and retained earnings
18. Commitments 27. Events occurring after the reporting period
6. Earnings per share 12. Dividends
13. Financial risk management
93 Directors’ declaration
94 Independent auditor’s report to the members
96 Shareholder information
48 | CARSALES.COM LIMITED | ANNUAL REPORT | 30 JUNE 2016
For
per
sona
l use
onl
y

Notes2016 $’000
2015 $’000
Revenue from continuing operationsSale of goods and services 2 344,010 311,756Revenue from continuing operations 344,010 311,756
ExpensesCosts of sale (30,195) (30,733)Sales and marketing expenses (97,691) (84,607)Operations and administration (21,598) (19,836)Service development and maintenance (24,216) (22,242)Earnings before interest, taxes, depreciation and amortisation 170,310 154,338
Depreciation and amortisation expense (7,527) (4,689)Finance income 9 537 688Finance costs 9 (8,903) (9,204)Share of net profit/(loss) from associates accounted for using the equity method 19(c) 5,223 4,926Gain on associate dilution 955 3,447Gain on sale of business 20(c) 931 –Profit before income tax 161,526 149,506Income tax expense 4 (47,450) (42,339)Profit from continuing operations 114,076 107,167
Other comprehensive incomeItems that may be reclassified to profit or loss:Exchange differences on translation of foreign operations (1,374) 2,212Share of remeasurement of net defined benefit liability of associates 11(a) (333) –Other comprehensive income for the year (1,707) 2,212
Total comprehensive income for the year 112,369 109,379
Profit is attributable to:Owners of carsales.com Ltd 109,249 103,167Non-controlling interests 4,827 4,000
114,076 107,167
Total comprehensive income for the year is attributable to:Owners of carsales.com Ltd 107,782 105,379Non-controlling interests 4,587 4,000
112,369 109,379
Earnings per share-based on profit from continuing operations, attributable to the ordinary equity holders of the parent entity: Cents CentsBasic earnings per share 6 45.4 43.2Diluted earnings per share 6 45.3 42.9
The above consolidated statement of comprehensive income should be read in conjunction with the accompanying notes.
CONSOLIDATED STATEMENT OF COMPREHENSIVE INCOMEFOR THE YEAR ENDED 30 JUNE 2016
CARSALES.COM LIMITED | ANNUAL REPORT | 30 JUNE 2016 | 49
For
per
sona
l use
onl
y
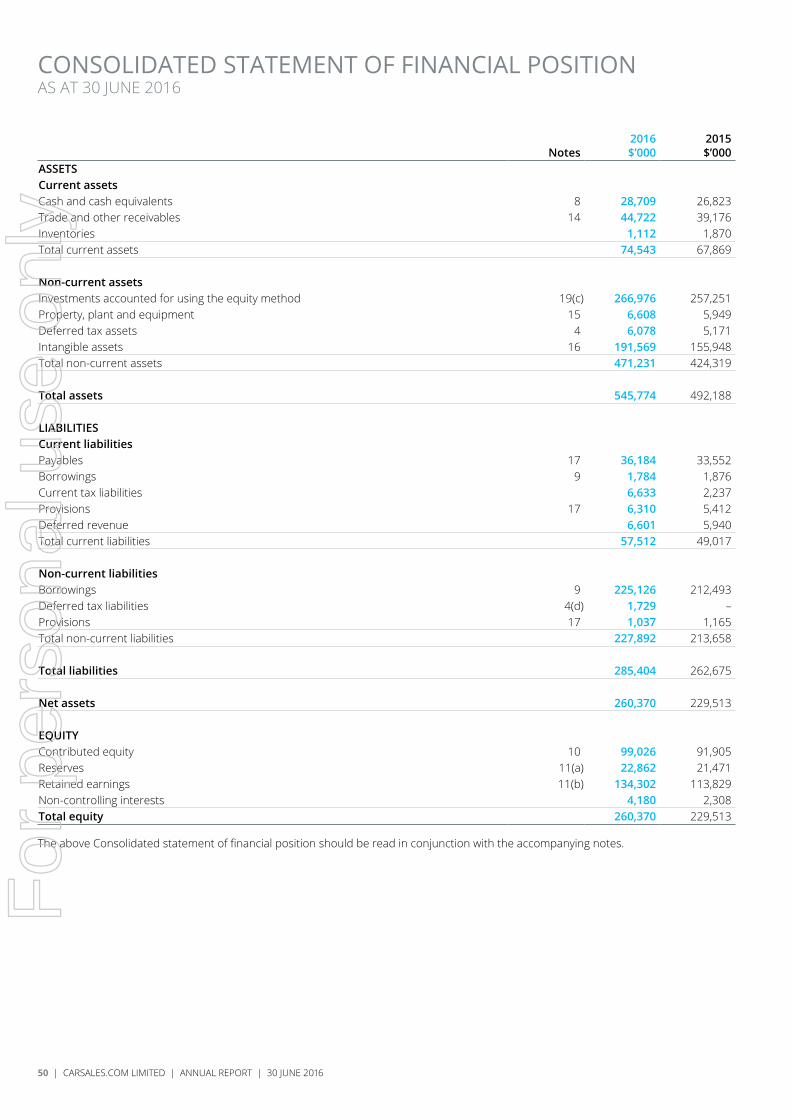
CONSOLIDATED STATEMENT OF FINANCIAL POSITIONAS AT 30 JUNE 2016
Notes2016 $’000
2015 $’000
ASSETSCurrent assetsCash and cash equivalents 8 28,709 26,823Trade and other receivables 14 44,722 39,176Inventories 1,112 1,870Total current assets 74,543 67,869
Non-current assetsInvestments accounted for using the equity method 19(c) 266,976 257,251Property, plant and equipment 15 6,608 5,949Deferred tax assets 4 6,078 5,171Intangible assets 16 191,569 155,948Total non-current assets 471,231 424,319
Total assets 545,774 492,188
LIABILITIESCurrent liabilitiesPayables 17 36,184 33,552Borrowings 9 1,784 1,876Current tax liabilities 6,633 2,237Provisions 17 6,310 5,412Deferred revenue 6,601 5,940Total current liabilities 57,512 49,017
Non-current liabilitiesBorrowings 9 225,126 212,493Deferred tax liabilities 4(d) 1,729 –Provisions 17 1,037 1,165Total non-current liabilities 227,892 213,658
Total liabilities 285,404 262,675
Net assets 260,370 229,513 EQUITYContributed equity 10 99,026 91,905Reserves 11(a) 22,862 21,471Retained earnings 11(b) 134,302 113,829Non-controlling interests 4,180 2,308Total equity 260,370 229,513
The above Consolidated statement of financial position should be read in conjunction with the accompanying notes.
50 | CARSALES.COM LIMITED | ANNUAL REPORT | 30 JUNE 2016
For
per
sona
l use
onl
y

Attributable to owners of carsales.com Ltd
Notes
Contributed equity
$’000
Other reserves
$’000
Retained earnings
$’000
Non-controlling
interest $’000
Total equity
$’000Balance at 1 July 2014 77,603 17,695 90,946 1,132 187,376Profit for the year - - 103,167 4,000 107,167Exchange differences on translation of foreign operations - 2,212 - - 2,212Total comprehensive income for the year - 2,212 103,167 4,000 109,379
Transactions with owners in their capacity as owners:Contributions of equity upon exercise of employee share options 10(b) 5,252 - - - 5,252Non-controlling interest on acquisition of subsidiaries - - - (1,119) (1,119)Dividends paid to members of the parent 12 9,050 - (80,284) - (71,234)Dividends paid to non-controlling interest - - - (1,705) (1,705)Increase in share-based payment reserve inclusive of tax - 1,564 - - 1,564Balance at 30 June 2015 91,905 21,471 113,829 2,308 229,513 Profit for the year - - 109,249 4,827 114,076Exchange differences on translation of foreign operations - (1,134) - (240) (1,374)Share of remeasurement of net defined benefit liability of associates - (333) - - (333)Total comprehensive income for the year - (1,467) 109,249 4,587 112,369
Transactions with owners in their capacity as owners:Contributions of equity upon exercise of employee share options 10(b) 2,173 - - - 2,173Non-controlling interest on acquisition of subsidiaries - - - 2,589 2,589Dividends paid to members of the parent 12 4,948 - (88,776) - (83,828)Dividends paid to non-controlling interest - - - (5,304) (5,304)Increase in share-based payment reserve inclusive of tax - 2,858 - - 2,858Balance at 30 June 2016 99,026 22,862 134,302 4,180 260,370
The above consolidated statement of changes in equity should be read in conjunction with the accompanying notes.
CONSOLIDATED STATEMENT OF CHANGES IN EQUITYFOR THE YEAR ENDED 30 JUNE 2016
CARSALES.COM LIMITED | ANNUAL REPORT | 30 JUNE 2016 | 51
For
per
sona
l use
onl
y

Notes2016 $’000
2015 $’000
Cash flows from operating activitiesReceipts from customers (including GST) 376,501 338,458Payments to suppliers and employees (including GST) (210,458) (185,770)Income taxes paid (43,437) (50,879)Net cash inflow from operating activities 5 122,606 101,809
Cash flows from investing activitiesInvestment in subsidiaries (net of cash acquired) (28,466) (55,751)Investment in associates (10,743) (10,042)Payments for property, plant and equipment (3,440) (676)Proceeds from sale of business 100 -Dividends received from associates 5,649 4,153Interest received 537 688Payments for intangible assets (881) (1,065)Net cash (outflow) from investing activities (37,244) (62,693)
Cash flows from financing activitiesProceeds from issues of shares and other equity securities 2,173 5,252Proceeds from borrowings 82,402 80,080Repayment of borrowings (70,423) (41,035)Interest paid (8,496) (8,843)Dividends paid to non-controlling interests (5,304) (1,705)Dividends paid to company shareholders 12 (83,828) (71,234)Loan arrangement fees paid - (850)Net cash (outflow) from financing activities (83,476) (38,335)
Net increase in cash and cash equivalents 1,886 781Cash and cash equivalents at the beginning of the financial year 26,823 26,042Cash and cash equivalents at end of year 8 28,709 26,823
The above consolidated statement of cash flows should be read in conjunction with the accompanying notes.
CONSOLIDATED STATEMENT OF CASH FLOWS FOR THE YEAR ENDED 30 JUNE 2016
52 | CARSALES.COM LIMITED | ANNUAL REPORT | 30 JUNE 2016
For
per
sona
l use
onl
y

NOTES TO THE CONSOLIDATED FINANCIAL STATEMENTS
About this reportThis financial report covers the consolidated financial statements of the consolidated entity consisting of carsales.com Ltd, its subsidiaries and investments in associates. The financial report is presented in the Australian currency.
carsales.com Ltd is a company limited by shares, incorporated and domiciled in Australia. Its registered office and principal place of business is:
carsales.com LtdLevel 4, 449 Punt RoadRichmond Vic 3121
A description of the nature of the consolidated entity’s operations and its principal activities is included in the Chair’s Report to shareholders on page 10, the Managing Director’s Update on page 12, and in the Directors’ Reports on page 14, each of which are not part of this financial report.
The financial report was authorised for issue by the Directors on 8 August 2016. The Directors have the power to amend and reissue the financial report.
Through the use of the internet, we have ensured that our corporate reporting is timely and complete. All press releases, financial reports and other information are available at our shareholder’s centre on our website: www.carsales.com.au
For queries in relation to our reporting please call +61 (3) 9093 8600.
These financial statements have been streamlined where key information is grouped together for ease of understanding and readability. The notes include information which is required to understand the financial statements and is material and relevant to the operations, financial position and performance of the Group. Information is considered material and relevant if, for example:
• the amount in question is significant because of its size or nature;
• it is important for understanding the results of the Group;
• it helps to explain the impact of significant changes in the Group’s business – for example, acquisitions; or
• it relates to an aspect of the Group’s operations that is important to its future performance.
Navigating this reportThe notes are organised into the following sections:
• key performance: provides a breakdown of the key individual line items in the financial statements that the Directors consider most relevant to understanding performance and shareholder returns for the year and summarises the accounting policies, judgements and estimates relevant to understanding these line items;
• capital and financial risk management: provides information about the capital management practices of the Group, the Group’s exposure and management of various financial risks and explains how these affect the Group’s financial position and performance;
• other assets and liabilities: Provides information on other balance sheet assets and liabilities that do not materially affect performance or give rise to material financial risk;
• group structure: explains aspects of the group structure, such as our portfolio of associate accounted investments and acquisitions and how these have affected the financial position and performance of the Group; and
• other: provides information on items which require disclosure to comply with Australian Accounting; standards and other regulatory pronouncements however are not considered critical in understanding the financial performance or position of the Group.
Significant and other accounting policies that summarise the measurement basis used and presentation policies and are relevant to an understanding of the financial statements are provided throughout the notes to the financial statements.
CARSALES.COM LIMITED | ANNUAL REPORT | 30 JUNE 2016 | 53
For
per
sona
l use
onl
y

Key reporting highlightsNotes containing information relevant to understanding significant changes to the Group’s affairs and performance in the current year are as follows:
• the Group recorded record revenue and EBITDA – Note 1;
• 65% of SoloAutos was acquired during the year – Note 20;
• 83.3% of Chileautos was acquired during the year – Note 20; and
• full year dividend declared – Note 12.
Key estimates and judgementsThe preparation of financial statements in conformity with AIFRS requires the use of certain critical accounting estimates. It also requires management to exercise its judgement in the process of applying the Group’s accounting policies. The areas involving a higher degree of judgement or complexity, or areas where assumptions and estimates are significant to the financial statements, are set out below:
• goodwill impairment testing – Note 16(a); and
• valuation of share-based payments – Note 24.
Basis of preparationThese general purpose financial statements have been prepared in accordance with Australian Accounting Standards, other authoritative pronouncements of the Australian Accounting Standards Board, Urgent Issues Group Interpretations and the Corporations Act 2001. carsales.com Ltd is a for-profit entity for the purpose of preparing the financial statements.
(i) Compliance with International Financial Reporting StandardsThe financial report of carsales.com Ltd complies with International Financial Reporting Standards (IFRS) as issued by the International Accounting Standards Board (IASB).
(ii) Historical cost conventionThese financial statements have been prepared under the historical cost convention.
(iii) Financial statement presentationThe accounting policies adopted are consistent with those of the previous financial year unless otherwise stated.
(iv) Going concernThe financial statements have been prepared on a going concern basis.
Basis of consolidationThe consolidated financial statements incorporate the assets and liabilities of all subsidiaries of carsales.com Ltd (‘’Company’’ or ‘’parent entity’’) as at 30 June 2016 and the results of all subsidiaries for the year then ended. carsales.com Ltd and its subsidiaries together are referred to in this financial report as the Group or the Consolidated Entity.
NOTES TO THE CONSOLIDATED FINANCIAL STATEMENTSCONTINUED
54 | CARSALES.COM LIMITED | ANNUAL REPORT | 30 JUNE 2016
For
per
sona
l use
onl
y

Foreign currency translation
(i) Functional and presentation currencyItems included in the financial statements of each of the Group’s entities are measured using the currency of the primary economic environment in which the entity operates (‘the functional currency’). The consolidated financial statements are presented in Australian dollars, which is carsales.com Ltd’s functional and presentation currency.
(ii) Transactions and balancesForeign currency transactions are translated into the functional currency using the exchange rates prevailing at the dates of the transactions. Foreign exchange gains and losses resulting from the settlement of such transactions and from the translation at year-end exchange rates of monetary assets and liabilities denominated in foreign currencies are recognised in the consolidated statement of comprehensive income.
(iii) Group companiesThe results and financial position of foreign operations (none of which has the currency of a hyperinflationary economy) that have a functional currency different from the presentation currency are translated into the presentation currency as follows:
• Assets and liabilities for each consolidated statement of financial position presented are translated at the closing rate at the date of that balance sheet;
• Income and expenses for each consolidated statement of comprehensive income are translated at average exchange rates (unless this is not a reasonable approximation of the cumulative effect of the rates prevailing on the transaction dates, in which case income and expenses are translated at the dates of the transactions);
• All resulting exchange differences are recognised as a separate component of equity.
On consolidation, exchange differences arising from the translation of any net investment in foreign entities, and of borrowings are taken to other comprehensive income. When a foreign operation is sold or any borrowings forming part of the net investment are repaid, a proportionate share of such exchange differences are recognised in the consolidated statement of comprehensive income, as part of the gain or loss on sale where applicable.
Goodwill and fair value adjustments arising on the acquisition of a foreign operation are treated as assets and liabilities of the foreign operation and translated at the closing rate.
Goods and Services Tax (GST)Revenues, expenses and assets are recognised net of the amount of associated GST, unless the GST incurred is not recoverable from the tax authority. In this case it is recognised as part of the cost of acquisition of the asset or as part of the expense.
Receivables and payables are stated inclusive of the amount of GST receivable or payable. The net amount of GST recoverable from, or payable to, the tax authority is included with other receivables or payables in the consolidated statement of financial position.
Cash flows are presented on a gross basis. The GST components of cash flows arising from investing or financing activities which are recoverable from, or payable to the taxation authority, are presented as operating cash flow.
Rounding of amountsThe Company is of a kind referred to in ASIC Corporations Instrument 2016/191, issued by the Australian Securities and Investments Commission, relating to the ‘’rounding off’’ of amounts in the financial report. Amounts in the financial report have been rounded off in accordance with that Instrument to the nearest thousand dollars, or in certain cases, the nearest dollar.
New accounting standards and interpretationsThere are no new accounting standards and interpretations that are mandatory for 30 June 2016 reporting periods adopted by the Group.
CARSALES.COM LIMITED | ANNUAL REPORT | 30 JUNE 2016 | 55
For
per
sona
l use
onl
y

Key Performance
1. Segment informationOperating segments are reported in a manner consistent with the internal reporting provided to the chief operating decision maker. The chief operating decision maker has been identified as the Managing Director.
Management has determined the operating segments based on the reports reviewed by Key Management Personnel that are used to make strategic decisions.
(a) Description of segmentsThe Group principally operates in four business segments: namely Online Advertising Services, Data and Research Services, International and Finance and Related Services.
Online Advertising Servicescarsales.com Ltd online advertising offerings can be broken into two key product sets being classified advertising and display advertising services.
Classified Advertising allows customers (including dealers and consumers) to advertise automotive and non-automotive goods and services for sale across the carsales Network. Classified advertising typically allows a customer to advertise their red Brand X, model Y car with 20,000km for $10,000 on a carsales website. This segment includes services such as subscriptions, lead fees and priority placement services across automotive and non-automotive websites.
Display advertising, typically involves corporate customers such as automotive manufacturers/importers, finance and insurance companies etc, placing advertisements on carsales Network websites. These advertisements typically display the product or service offerings of the corporate advertiser such as a special offer on new utes by manufacturer X, or save 10% on insurance this month only etc, as banner advertisements or other sponsored links.
Online advertising includes carsales’ investment in tyresales.com.au which is an online tyre advertisement website that allows consumers to transact and purchase tyres.
Data and Research ServicesThe carsales.com Ltd divisions of RedBook, LiveMarket, DataMotive and DataMotive Business Intelligence provide various solutions to a range of customers including manufacturers/importers, dealers, industry bodies, finance and insurance companies offering products including software, analysis, research and reporting, valuation services, website development and hosting as well as photography services. This segment also includes display and consumer advertising related to these divisions.
Internationalcarsales.com Ltd has operations in overseas countries through both subsidiaries and equity accounted associate investments as set out below:
Automotive Data Services:
• Auto Information Limited (New Zealand) – 100%
• RedBook Automotive Services (M) Sdn Bhd (Malaysia) – 100%
• RedBook Automotive Data Services (Beijing) Limited (China) – 100%
• Automotive Data Services (Thailand) Company Limited – 100%
Online automotive classifieds:
• Webmotors S.A. (operation in Brazil) – 30%
• iCar Asia Limited (operations in Indonesia, Malaysia and Thailand) – 20.2%
• SK ENCARSALES.COM Ltd (operation in South Korea) – 49.9%
• carsales Mexico SAPI de CV (operation in Mexico) – 65%
• Chileautos SpA (operation in Chile) – 83.3%
NOTES TO THE CONSOLIDATED FINANCIAL STATEMENTSCONTINUED
56 | CARSALES.COM LIMITED | ANNUAL REPORT | 30 JUNE 2016
For
per
sona
l use
onl
y

1. Segment information (continued)
Finance and Related ServicesFinance and Related Services includes the Stratton Finance Pty Ltd subsidiary which provides innovative vehicle finance arrangements, vehicle procurement and other related services to customers. Segment revenues arise from commissions paid by finance providers and other related service providers. It also includes the equity accounted associate RateSetter Australia Pty Ltd.
(b) Segment analysis
2016
Online Advertising
$’000
Data and Research
$’000International
$’000
Finance and Related
Services $’000
Total $’000
Segment revenueSegment revenue (Note 1(c)(i)) 240,699 35,850 4,434 63,027 344,010Total segment revenue 240,699 35,850 4,434 63,027 344,010
Gross profit 226,482 35,731 4,434 47,168 313,815
EBITDA 131,783 21,357 1,332 15,838 170,310Depreciation and amortisation (7,527)Net interest expense (8,366)Gain on sale of business 931 931Profit before income tax 155,348Income tax expense (47,450)Share of profit from associates 6,230 (1,007) 5,223Gain on associate dilution 955 955Non-controlling interests (4,827)Profit for the year 109,249
Segment assets 104,845 17,344 276,579 74,922 473,690Deferred tax assets 6,078Unallocated assets 66,006Total assets 545,774
2015
Online Advertising
$’000
Data and Research
$’000International
$’000
Finance and Related
Services $’000
Total $’000
Segment revenueSegment revenue (Note 1(c)(i)) 216,463 33,037 2,886 59,370 311,756Total segment revenue 216,463 33,037 2,886 59,370 311,756
Gross profit 207,588 32,864 2,878 36,599 279,929
EBITDA 122,067 19,041 1,579 11,651 154,338Depreciation and amortisation (4,689)Net interest expense (8,516)Profit before income tax 141,133Income tax expense (42,339)Share of profit from associates 4,926 4,926Gain on associate dilution 3,447 3,447Non-controlling interests (4,000)Profit for the year 103,167
Segment assets 99,724 18,321 247,024 71,361 436,430Deferred tax assets 5,171Unallocated assets 50,587Total assets 492,188
CARSALES.COM LIMITED | ANNUAL REPORT | 30 JUNE 2016 | 57
For
per
sona
l use
onl
y

(c) Notes to, and forming part of, the segment information
(i) Segment revenue and gross profitSegment revenue is derived from sales to external customers as set out in the table above. The nature of the segment revenue is as described in Note 1(a) above gross profit is revenue less costs of sale.
(ii) Segment EBITDAThe consolidated entity’s chief operating decision maker assesses the performance of the segments based on a measure of EBITDA. Interest revenue and expense, depreciation and amortisation are not reported to the chief operating decision maker by segment. These items are assessed at a consolidated entity level.
(iii) Segment assetsSegment assets include goodwill and trade receivables. Unallocated assets include property, plant and equipment, intangibles and other assets utilised across multiple segments. All unallocated assets are assessed by the chief operating decision maker at a consolidated entity level.
(iv) LiabilitiesLiabilities are not reported to the chief operating decision maker by segment. All liabilities are assessed at a consolidated entity level.
2. Revenue
2016$’000
2015 $’000
From continuing operationsSales revenueSale of services 314,627 280,927Sale of goods 29,383 30,829 344,010 311,756
Recognition and measurementRevenue is measured at the fair value of the consideration received or receivable. Amounts disclosed as revenue are net of returns, trade allowances and amounts collected on behalf of third parties. Where services have not been provided but the Group is obligated to provide the services in the future, revenue recognition is deferred. Where the Group has utilised the services of a sales agency to sell advertising services on behalf of the Group, the sale is recorded at a value net of sales commissions paid to the sales agency.
Revenue is recognised for the major business activities as follows:
(i) Advertising servicesRevenue is recorded when a customer’s advertisement has been displayed or when a referral has been generated leading to an enforceable claim by the Group. Subscription services are recognised across the period to which they relate.
(ii) Sale of goods – retailRevenue is recorded when goods have been provided to a customer leading to an enforceable claim by the Group.
(iii) Finance and related servicesFees and commissions are recognised on an accruals basis when the service has been provided or on completion of the underlying transaction. Used car disposal revenue and cost of goods are recognised gross (revenue being the fair value of the cash received for the sale of the vehicle, and the cost of goods being the trade in price of the vehicle).
(iv) DividendsDividends are recognised as revenue when the right to receive payment is established.
(v) R&D Tax RebateThe R&D 10% tax rebate is recognised as other income.
NOTES TO THE CONSOLIDATED FINANCIAL STATEMENTSCONTINUED
58 | CARSALES.COM LIMITED | ANNUAL REPORT | 30 JUNE 2016
For
per
sona
l use
onl
y
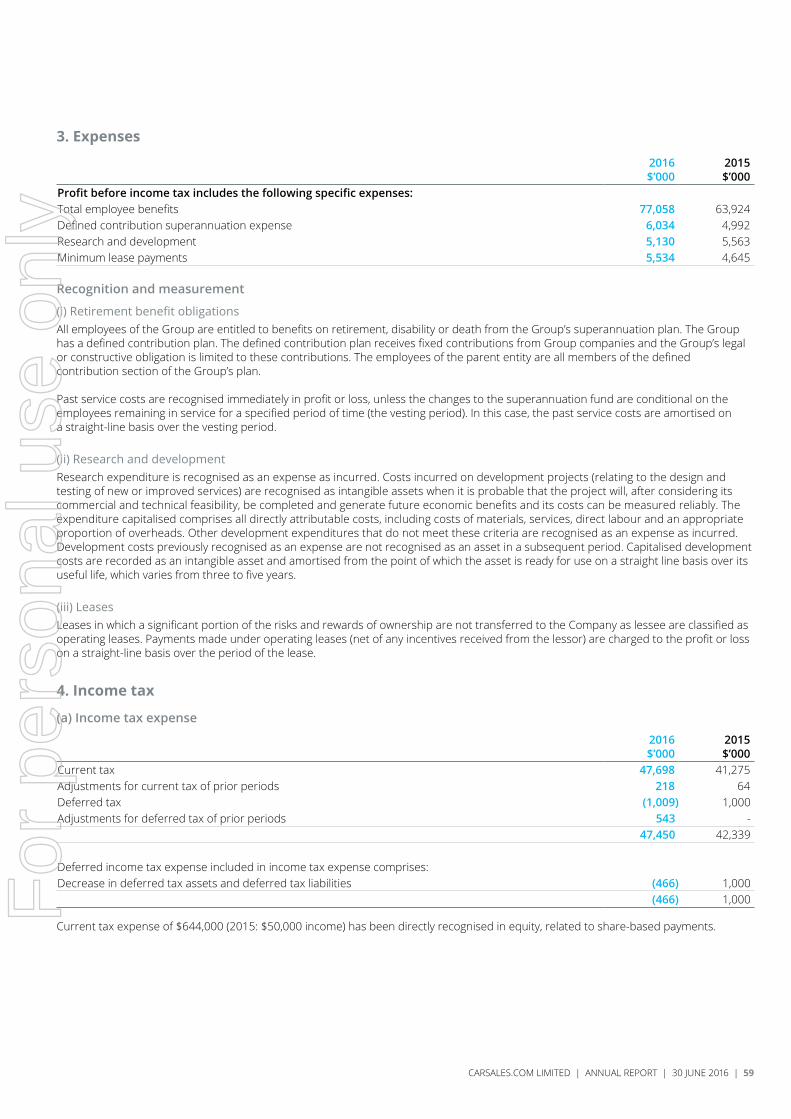
3. Expenses
2016$’000
2015$’000
Profit before income tax includes the following specific expenses:Total employee benefits 77,058 63,924Defined contribution superannuation expense 6,034 4,992Research and development 5,130 5,563Minimum lease payments 5,534 4,645
Recognition and measurement
(i) Retirement benefit obligationsAll employees of the Group are entitled to benefits on retirement, disability or death from the Group’s superannuation plan. The Group has a defined contribution plan. The defined contribution plan receives fixed contributions from Group companies and the Group’s legal or constructive obligation is limited to these contributions. The employees of the parent entity are all members of the defined contribution section of the Group’s plan.
Past service costs are recognised immediately in profit or loss, unless the changes to the superannuation fund are conditional on the employees remaining in service for a specified period of time (the vesting period). In this case, the past service costs are amortised on a straight-line basis over the vesting period.
(ii) Research and developmentResearch expenditure is recognised as an expense as incurred. Costs incurred on development projects (relating to the design and testing of new or improved services) are recognised as intangible assets when it is probable that the project will, after considering its commercial and technical feasibility, be completed and generate future economic benefits and its costs can be measured reliably. The expenditure capitalised comprises all directly attributable costs, including costs of materials, services, direct labour and an appropriate proportion of overheads. Other development expenditures that do not meet these criteria are recognised as an expense as incurred. Development costs previously recognised as an expense are not recognised as an asset in a subsequent period. Capitalised development costs are recorded as an intangible asset and amortised from the point of which the asset is ready for use on a straight line basis over its useful life, which varies from three to five years.
(iii) LeasesLeases in which a significant portion of the risks and rewards of ownership are not transferred to the Company as lessee are classified as operating leases. Payments made under operating leases (net of any incentives received from the lessor) are charged to the profit or loss on a straight-line basis over the period of the lease.
4. Income tax
(a) Income tax expense
2016$’000
2015$’000
Current tax 47,698 41,275Adjustments for current tax of prior periods 218 64Deferred tax (1,009) 1,000Adjustments for deferred tax of prior periods 543 -
47,450 42,339
Deferred income tax expense included in income tax expense comprises:Decrease in deferred tax assets and deferred tax liabilities (466) 1,000
(466) 1,000
Current tax expense of $644,000 (2015: $50,000 income) has been directly recognised in equity, related to share-based payments.
CARSALES.COM LIMITED | ANNUAL REPORT | 30 JUNE 2016 | 59
For
per
sona
l use
onl
y

(b) Numerical reconciliation of income tax expense to prima facie tax payable
2016$’000
2015$’000
Profit from continuing operations before income tax expense 161,526 149,506Tax at the Australian tax rate of 30.0% (2015 – 30.0%) 48,458 44,852Tax effect of amounts which are not deductible (taxable) in calculating taxable income:Non assessable income (R&D tax offset) (255) (150)Share options 22 104Sundry items 317 (20)Adjustment for prior periods 761 64Share of (profit)/losses from associates (1,567) (1,477)Non-taxable gain on associate dilution (286) (1,034)Total income tax expense 47,450 42,339
(c) Deferred tax assetsThe balance comprises temporary differences attributable to:
Employee benefits
$’000
Employee Share Trust
$’000
Doubtful debts$’000
Expense accruals
$’000Intangibles
$’000Other$’000
Total$’000
At 1 July 2014 1,017 3,855 313 731 - - 5,916Acquisition of subsidiary 170 - - 135 - - 305(Charged)/credited to the profit or loss 757 (2,292) (120) 655 - - (1,000)Credited directly to equity - (50) - - - - (50)At 30 June 2015 1,944 1,513 193 1,521 - - 5,171Acquisition of subsidiary 7 - - - - - 7(Charged)/credited to the profit or loss 194 (443) 371 235 (490) 389 256Credited directly to equity - 644 - - - - 644At 30 June 2016 2,145 1,714 564 1,756 (490) 389 6,078
2016$’000
2015$’000
Deferred tax assets to be recovered within 12 months 4,184 3,771 Deferred tax assets to be recovered after more than 12 months 1,894 1,400 6,078 5,171
(d) Deferred tax liabilities
Intangibles $’000
Total $’000
At 1 July 2015 - -Charged/(credited) to the profit or loss 210 210Acquisition of subsidiary (1,939) (1,939)At 30 June 2016 (1,729) (1,729)
NOTES TO THE CONSOLIDATED FINANCIAL STATEMENTSCONTINUED
60 | CARSALES.COM LIMITED | ANNUAL REPORT | 30 JUNE 2016
For
per
sona
l use
onl
y

4. Income tax (continued)
(d) Deferred tax liabilities
2016$’000
2015 $’000
Deferred tax liabilities expected to be settled within 12 months (210) - Deferred tax liabilities expected to be settled after more than 12 months (1,519) -
(1,729) -
Recognition and measurementThe income tax expense or revenue for the period is the tax payable on the current period’s taxable income based on the applicable income tax rate for each jurisdiction adjusted by changes in deferred tax assets and liabilities attributable to temporary differences and to unused tax losses.
Deferred income tax is provided in full, using the liability method, on temporary differences arising between the tax bases of assets and liabilities and their carrying amounts in the consolidated financial statements. However, the deferred income tax is not accounted for if it arises from initial recognition of an asset or liability in a transaction other than a business combination that at the time of the transaction affects neither accounting nor taxable profit or loss. Deferred income tax is determined using tax rates (and laws) that have been enacted or substantially enacted by the balance sheet date and are expected to apply when the related deferred income tax asset is realised or the deferred income tax liability is settled.
Deferred tax assets are recognised for deductible temporary differences and unused tax losses only if it is probable that future taxable amounts will be available to utilise those temporary differences and losses.
Deferred tax liabilities and assets are not recognised for temporary differences between the carrying amount and tax bases of investments in foreign operations where the Company is able to control the timing of the reversal of the temporary differences and it is probable that the differences will not reverse in the foreseeable future.
Deferred tax assets and liabilities are offset when there is a legally enforceable right to offset current tax assets and liabilities and when the deferred tax balances relate to the same taxation authority. Current tax assets and tax liabilities are offset where the entity has a legally enforceable right to offset and intends either to settle on a net basis, or to realise the asset and settle the liability simultaneously.
Tax consolidation legislationcarsales.com Ltd and its wholly-owned Australian entities have implemented the tax consolidation legislation.
The head entity, carsales.com Ltd, and the controlled entities in the tax consolidated group account for their own current and deferred tax amounts. These tax amounts are measured as if each entity in the tax consolidated group continues to be a standalone taxpayer in its own right.
In addition to its own current and deferred tax amounts, carsales.com Ltd also recognises the current tax liabilities (or assets) and the deferred tax assets arising from unused tax losses and unused tax credits assumed from controlled entities in the tax consolidated group.
Assets or liabilities arising under tax funding agreements with the tax consolidated entities are recognised as amounts receivable from or payable to other entities in the Company.
CARSALES.COM LIMITED | ANNUAL REPORT | 30 JUNE 2016 | 61
For
per
sona
l use
onl
y

5. Reconciliation of profit after income tax to net cash inflow from operating activities
2016$’000
2015$’000
Profit for the year 114,076 107,167Depreciation and amortisation 7,527 4,689Non-cash employee benefits expense – share-based payments 2,214 1,614Net finance related costs 8,893 8,516Share of (profit) of associates (5,223) (4,926)Gain on associate dilution (955) (3,447)Net exchange differences (96) 164Change in operating assets and liabilities:
(Increase)/Decrease in trade debtors (4,955) 2,725Decrease in inventory 758 -(Increase)/Decrease in deferred tax assets (900) 1,050(Increase) in other operating assets (2,612) (5,426)Increase/(Decrease) in trade creditors 1,544 (574)(Decrease)/Increase in other operating liabilities (3,096) 338Increase/(Decrease) in provision for income taxes payable 4,686 (11,109)Increase in other provisions 745 1,028
Net cash inflow from operating activities 122,606 101,809
6. Earnings per share
(a) Reported earnings per share Basic earnings per share Diluted earnings per share2016 2015 2016 2015
Reported profit attributable to equity holders of the Company 109,249,000 103,167,000 109,249,000 103,167,000Weighted average number of ordinary shares1 240,645,736 238,911,085 240,645,736 238,911,085Dilutive impact of potential ordinary shares - - 742,315 1,530,744Total weighted average number of ordinary shares used in EPS calculation 240,645,736 238,911,085 241,388,051 240,441,829Reported earnings per share 45.4 43.2 45.3 42.9
1. The dilutive impact of potential ordinary shares represents unexercised options and performance rights as at the balance date 30 June 2016 (2015: 30 June 2015).
(b) Adjusted earnings per share Basic earnings per share Diluted earnings per share2016 2015 2016 2015
Reported profit attributable to equity holders of the Company 109,249,000 103,167,000 109,249,000 103,167,000Less: Gain on associate dilution (955,000) (3,447,000) (955,000) (3,447,000)Less: Gain on sale of business (931,000) - (931,000) - Add: Acquired intangibles amortisation 3,180,000 2,060,000 3,180,000 2,060,000 Adjusted profit attributable to equity holders of the Company 110,543,000 101,780,000 110,543,000 101,780,000Adjusted earnings per share2 45.9 42.6 45.8 42.32. The Directors believe the presentation of “adjusted earnings per share” provides the best measure to assess the performance of the Group by excluding one-off
gain from disposal of business, gain on associate dilution and non-cash acquired intangible assets amortisation from the reported IFRS measure.
Recognition and measurementBasic earnings per share is calculated by dividing:
• the profit attributable to equity holders of the Company, excluding any costs of servicing equity other than ordinary shares;
• by the weighted average number of ordinary shares outstanding during the financial year, adjusted for bonus elements in ordinary shares issued during the year.
Diluted earnings per share adjusts the figures used in the determination of basic earnings per share to take into account:
• the after income tax effect of interest and other financing costs associated with dilutive potential ordinary shares; and
• the weighted average number of additional ordinary shares that would have been outstanding assuming the conversion of all dilutive potential ordinary shares.
Options and performance rights granted to employees under the carsales.com Ltd Employee Option Plan are considered to be potential ordinary shares and have been included in the determination of diluted earnings per share to the extent to which they are dilutive. The options and performance rights have not been included in the determination of basic earnings per share. Details relating to the options are set out in Note 24.
NOTES TO THE CONSOLIDATED FINANCIAL STATEMENTSCONTINUED
62 | CARSALES.COM LIMITED | ANNUAL REPORT | 30 JUNE 2016
For
per
sona
l use
onl
y

Capital & financial risk management
7. Capital risk managementThe Company’s capital position at 30 June is as follows:
2016$’000
2015$’000
Borrowings (Note 9) 226,910 214,369Less: cash and cash equivalents (Note 8) (28,709) (26,823)Net debt 198,201 187,546
Contributed equity (Note 10) 99,026 91,905Reserves (Note 11(a)) 22,862 21,471Retained profits (Note 11(b)) 134,302 113,829Non-controlling interests 4,180 2,308Total equity 260,370 229,513
Total capital 458,571 417,059
The Company’s objectives when managing capital are to safeguard their ability to continue as a going concern, so that they can continue to provide returns for shareholders and benefits for other stakeholders and to maintain an optimal capital structure to reduce the cost of capital.
In order to maintain or adjust the capital structure, the Group may adjust the amount of dividends paid to shareholders, return capital to shareholders, issue new shares or sell assets to reduce debt.
Consistent with others in the industry, the Group monitors its capital on an ongoing-basis.
There are no externally imposed capital requirements.
Investments and other financial assetsThe Group classifies its investments in the following categories: financial assets at fair value, loans and receivables and held-to-maturity investments. The classification depends on the purpose for which the investments were acquired. Management determines the classification of its investments at initial recognition and re-evaluates this designation at each reporting date.
Loans and receivables are non-derivative financial assets with fixed or determinable payments that are not quoted in an active market. They are included in current assets, except for those with maturities greater than 12 months after the reporting date which are classified as non-current assets. Loans and receivables are included in trade and other receivables (Note 14) and receivables in the consolidated statement of financial position.
8. Cash and cash equivalents
2016$’000
2015$’000
Cash on hand 7 7Bank balances 28,702 26,816 28,709 26,823
Recognition and measurementFor cash flow statement presentation purposes, cash and cash equivalents includes cash on hand, deposits held at call with financial institutions, other short term, highly liquid investments with original maturities of three months or less that are readily convertible to known amounts of cash and which are subject to an insignificant risk of changes in value, and bank overdrafts. Bank overdrafts are shown within borrowings in current liabilities on the consolidated statement of financial position.
CARSALES.COM LIMITED | ANNUAL REPORT | 30 JUNE 2016 | 63
For
per
sona
l use
onl
y

(a) Risk exposureThe Company’s exposure to interest rate risk is discussed in Note 9. The maximum exposure to credit risk at the reporting date is the carrying amount of each class of cash and cash equivalents mentioned above.
(b) Cash at bank and on handCash on hand is non-interest bearing. Bank balances attracted interest at an average rate of 2.0% (2015: 2.7%).
9. Borrowings
2016$’000
2015$’000
Bank loan – current 1,784 1,876Bank loan – non-current 225,126 212,493 226,910 214,369
The Group’s principal funding is a $325m rolling syndicated banking facility entered into in February 2015 with tranches maturing at two, three and five years. Borrowings are net of establishment fees of $1.3m.
2016$’000
2015$’000
Finance income 537 688Finance costs (8,903) (9,204) (8,366) (8,516)
Finance incomeFinance income is recognised on a time proportionate basis using the effective interest method. When a receivable is impaired, the Group reduces the carrying amounts to its recoverable amount, being the estimated future cash flow discounted at the original effective interest rate of the instrument, and continues unwinding the discount as finance income. Finance income on impaired loans is recognised using the original effective interest rate.
Recognition and measurementBorrowings are initially recognised at fair value, net of transaction costs incurred. Borrowings are subsequently measured at amortised cost. Any difference between the proceeds (net of transaction costs) and the redemption amount is recognised in the profit or loss over the period of the borrowings using the effective interest method. Fees paid on the establishment of loan facilities are recognised net against the loan and amortised on a straight-line basis over the term of the facility.
Borrowings are derecognised from the consolidated statement of financial position when the obligation specified in the contract is discharged, cancelled or expired. The difference between the carrying amount of a financial liability that has been extinguished or transferred to another party and the consideration paid, including any non-cash assets transferred or liabilities assumed, is recognised in other income or other expenses.
Borrowings are classified as current liabilities unless the Group has an unconditional right to defer settlement of the liability for at least 12 months after the balance sheet date.
Borrowing costs incurred for the construction of any qualifying asset are capitalised during the period of time that is required to complete and prepare the asset for its intended use or sale. Other borrowing costs are expensed.
Interest rate riskThe Group’s main interest rate risk arises from long term borrowings. The Group’s fixed rate borrowings and receivables are carried at amortised cost. They are therefore not subject to interest rate risk as defined in AASB 7 since neither the carrying amount nor the future cash flows will fluctuate because of a change in market rates.
The consolidated entity’s exposure to the cash flow risk of changes in market interest rates relates primarily to the cash at bank and the cash advance facility. The interest rate applicable at year end on the cash at bank was 1.7% (2015: 1.9%), while the interest on the overdraft facility was 8.9% (2015: 9.1%). As at reporting date, the Group had $227,379,000 (2015: $215,219,000) variable rate borrowings at a weighted average interest rate of 3.3% (2015: 3.5%). carsales.com Ltd has a Board approved treasury policy and treasury strategy for the management of interest rate risk. The Company does not currently hedge against interest rate risk. The Board keeps the decision to actively hedge interest rate risk under regular review and this will be reassessed during the 2017 financial year. Any derivative contracts will be entered into solely for interest rate risk management and no speculative hedging is permitted under the policy.
NOTES TO THE CONSOLIDATED FINANCIAL STATEMENTSCONTINUED
64 | CARSALES.COM LIMITED | ANNUAL REPORT | 30 JUNE 2016
For
per
sona
l use
onl
y

9. Borrowings (continued)
Liquidity riskPrudent liquidity risk management implies maintaining sufficient cash and marketable securities, the availability of funding through an adequate amount of committed credit facilities and the ability to close out market positions. The Group manages liquidity risk by continuously monitoring forecast and actual cash flows and matching the maturity profiles of financial assets and liabilities.
Financing arrangementsThe Group had access to the following undrawn borrowing facilities at the end of the reporting period:
2016$’000
2015$’000
Floating rate– Expiring within one year 63,000 3,000– Expiring within one to five years 45,000 110,000
108,000 113,000
Maturities of financial liabilitiesThe following table sets out the Group’s exposure to liquidity risk. The amounts disclosed in the table are the contractual undiscounted cash flows.
Contractual maturities of financial liabilities
Group – at 30 June 2016
0 – 12 months
$’000
Between 1 and 2 years
$’000
Between 2 and 5 years
$’000
Total contractual cash flows
$’000
Carrying amount (assets)/
liabilities$’000
Non-derivativesNon-interest bearing payables 36,184 - - 36,184 36,184Variable rate borrowings 1,740 134,187 94,302 230,229 226,660Fixed rate borrowings 116 88 63 267 250Total non-derivatives 38,040 134,275 94,365 266,680 263,094
Group – at 30 June 2015Non-derivativesNon-interest bearing payables 33,552 - - 33,552 33,552Variable rate borrowings 1,859 1,852 222,780 226,491 214,137Fixed rate borrowings 135 88 19 242 232Total non-derivatives 35,546 1,940 222,799 260,285 247,921
CARSALES.COM LIMITED | ANNUAL REPORT | 30 JUNE 2016 | 65
For
per
sona
l use
onl
y

Net fair value of financial assets and liabilitiesThe net fair value of cash and cash equivalents and non-interest bearing monetary financial assets and non-interest bearing financial liabilities of the consolidated entity approximates their carrying amounts. There are no off-balance sheet financial instruments in place.
Summarised sensitivity analysisThe following table summarises the sensitivity of the Group’s financial assets and financial liabilities to interest rate risk.
Interest rate risk -100 bps +100 bps
At 30 June 2016
Carrying amount
$’000Profit$’000
Other equity
$’000Profit$’000
Other equity
$’000Financial assetsCash and cash equivalents 28,709 (307) (307) 307 307Financial liabilitiesBorrowings (227,379) 2,292 2,292 (2,292) (2,292)Total increase/(decrease) 1,985 1,985 (1,985) (1,985)
Interest rate risk -100 bps +100 bps
At 30 June 2015
Carrying amount
$’000Profit$’000
Other equity
$’000Profit$’000
Other equity
$’000Financial assetsCash and cash equivalents 26,823 (188) (188) 188 188Financial liabilitiesBorrowings (215,219) 1,506 1,506 (1,506) (1,506)Total increase/(decrease) 1,318 1,318 (1,318) (1,318)
NOTES TO THE CONSOLIDATED FINANCIAL STATEMENTSCONTINUED
66 | CARSALES.COM LIMITED | ANNUAL REPORT | 30 JUNE 2016
For
per
sona
l use
onl
y

10. Contributed equity
(a) Share capital
Notes2016
Shares2015
Shares2016$’000
2015$’000
Ordinary sharesFully paid 10(b) 241,123,298 240,081,596 99,026 91,905
241,123,298 240,081,596 99,026 91,905
Recognition and measurementOrdinary shares are classified as equity.
Ordinary shares entitle the holder to participate in dividends and the proceeds on winding up of the Company in proportion to the number of, and amounts paid on, the shares held.
On a show of hands every holder of ordinary shares present at a meeting in person or by proxy, is entitled to one vote, and upon a poll each share is entitled to one vote.
Ordinary shares have no par value and the Company does not have a limited amount of authorised capital.
Incremental costs directly attributable to the issue of new shares, options or performance rights are shown in equity as a deduction, net of tax, from the proceeds. Incremental costs directly attributable to the issue of new shares or options or performance rights for the acquisition of a business are not included in the cost of the acquisition as part of the purchase consideration.
(b) Movements in ordinary share capital
Date Details Number of shares Issue price $’0001 July 2014 Opening balance 237,828,965 77,603August 2014 Exercise of employee options 337,408 $3.89-$5.93 1,669August 2014 Exercise of employee performance rights 208,613 - -October 2014 Exercise of employee options 37,952 $1.75-$4.69 156October 2014 Exercise of employee performance rights 52,379 - -October 2014 Dividend Reinvestment Plan 446,293 $9.78 4,363November 2014 Exercise of employee options 38,275 $4.69-$4.90 183December 2014 Exercise of employee options 51,874 $4.69-$5.93 256March 2015 Exercise of employee options 576,057 $4.69-$5.93 2,768April 2015 Dividend Reinvestment Plan 459,864 $10.19 4,687May 2015 Exercise of employee options 5,172 $4.69 24June 2015 Exercise of employee options 38,744 $4.69-$5.93 19630 June 2015 Balance 240,081,596 91,905
Date Details Number of shares Issue price $’0001 July 2015 Opening balance 240,081,596 91,905August 2015 Exercise of employee options 61,237 $4.69-$5.93 333August 2015 Exercise of employee performance rights 123,739 - -September 2015 Exercise of employee options 40,433 $4.69-$5.93 211October 2015 Exercise of employee options 55,172 $4.69-$4.90 269October 2015 Exercise of employee performance rights 50,146 - -October 2015 Dividend Reinvestment Plan 300,352 $9.65 2,898November 2015 Exercise of employee options 11,301 $5.93 67December 2015 Exercise of employee options 107,443 $5.93 637February 2016 Exercise of employee options 12,860 $4.69-$5.93 73March 2016 Exercise of employee options 47,257 $5.93 280April 2016 Exercise of employee options 13,923 $4.69-$5.93 73April 2016 Dividend Reinvestment Plan 174,860 $11.72 2,050May 2016 Exercise of employee options 16,125 $5.93 96June 2016 Exercise of employee options 26,854 $4.69-$5.93 13430 June 2016 Balance 241,123,298 99,026
Information relating to the carsales.com Ltd Employee Option Plan, including details of options and performance rights issued, exercised and lapsed during the financial year and options and performance rights outstanding at the end of the financial year, is set out in Note 24.
CARSALES.COM LIMITED | ANNUAL REPORT | 30 JUNE 2016 | 67
For
per
sona
l use
onl
y

11. Reserves and retained earnings
(a) Reserves
2016$’000
2015$’000
Share-based payment reserve 23,157 20,299Foreign currency translation reserve 38 1,172Share of remeasurement of net defined benefit liability of associates (333) - 22,862 21,471
(i) Share-based payment reserveBalance 1 July 20,299 18,735Option expense 2,214 1,614Tax on Employee Share Trust charged to equity 644 (50)Balance 30 June 23,157 20,299
The share-based payments reserve is used to recognise the fair value of options and performance rights issued but not exercised.
(ii) Foreign currency translation reserveBalance 1 July 1,172 (1,040)Currency translation differences arising during the year (1,134) 2,212Balance 30 June 38 1,172
Exchange differences arising on translation of the foreign operations are taken to the foreign currency translation reserve, as described in “Basis of preparation” and accumulated within a separate reserve within equity. The reserve is recognised in profit and loss when the net investment is disposed of.
(iii) Share of remeasurement of net defined benefit liability of associatesBalance 1 July - -Share of remeasurement of net defined benefit liability of associates (333) -Balance 30 June (333) - (b) Retained earningsMovements in retained earnings were as follows:
Balance 1 July 113,829 90,946Net profit for the year 109,249 103,167Dividends (88,776) (80,284)Balance 30 June 134,302 113,829
NOTES TO THE CONSOLIDATED FINANCIAL STATEMENTSCONTINUED
68 | CARSALES.COM LIMITED | ANNUAL REPORT | 30 JUNE 2016
For
per
sona
l use
onl
y

12. DividendsProvision is made for the amount of any dividend declared, being appropriately authorised and no longer at the discretion of the entity, on or before the end of the financial year but not distributed at balance date.
(a) Ordinary shares
2016$’000
2015$’000
Final fully franked cash dividend for the year ended 30 June 2015 of 17.7 cents (2014: 17.4 cents) per fully paid ordinary share plus a special dividend of 1.4 cents (2014: nil cents) paid on 15 October 2015. 43,000 37,109Final fully franked dividend for the year ended 30 June 2015 of 17.7 cents (2014: 17.4 cents) plus a special dividend of 1.4 cents (2014: nil cents) – satisfied through the issuance of shares under the Dividend Reinvestment Plan. 2,898 4,363 45,898 41,472Interim ordinary dividend for the year ended 30 June 2016 of 17.8 cents (2015: 16.2 cents) per fully paid share paid on 15 April 2016 (2015: 15 April 2015). Fully franked (2015: fully franked) based on tax paid at 30%. 40,828 34,125Interim ordinary dividend for the year ended 30 June 2016 of 17.8 cents (2015: 16.2 cents) per share – satisfied through issuance of shares under the Dividend Reinvestment Plan. 2,050 4,687 42,878 38,812Total dividends paid 88,776 80,284
(b) Dividends not recognised at year end
2016$’000
2015$’000
In addition to the above dividends, since year end, the Directors have recommended the payment of 19.5 cents per fully paid ordinary share (2015: final dividend 17.7 cents). In 2015 a special dividend of 1.4 cents per fully paid ordinary share fully franked based on tax paid at 30% was also paid. The aggregate amount of the declared dividend expected to be paid on 17 October 2016 out of retained earnings at 30 June 2016, but not recognised as a liability at year end, is 47,019 45,856
(c) Franked dividends
2016$’000
2015$’000
Franking credits available for subsequent financial years based on a tax rate of 30.0% (2015: 30.0%) 42,176 34,428
The above amounts represent the balance of the franking account as at the end of the reporting period, adjusted for:
(a) franking credits that will arise from the payment of the amount of the provision for income tax
(b) franking debits that will arise from the payment of dividends recognised as a liability at the reporting date, and
(c) franking credits that will arise from the receipt of dividends recognised as receivables at the reporting date.
The consolidated amounts include franking credits that would be available to the parent entity if distributable profits of subsidiaries were paid as dividends.
(d) Dividend Reinvestment Plan (“DRP”)The carsales.com Ltd DRP will be maintained for the 2016 final dividend, offering shareholders the opportunity to acquire further ordinary shares in carsales. The DRP will not be offered at a discount and the price will be calculated using the daily volume weighted average sale price of carsales.com Ltd shares sold in the ordinary course of trading on the ASX during the five days after, but not including, the Record Date (22 September 2016). The last date for shareholders to nominate their participation in the DRP is 5:00pm (AEST) on 23 September 2016. Shares issued under the DRP will rank equally with carsales.com Ltd existing fully paid ordinary shares. Shareholders eligible to participate in the DRP are currently limited to those whose registered address on the carsales.com Ltd share registry is in Australia or New Zealand.
Eligible shareholders who wish to participate in the DRP can make their elections online at www.computershare.com.au/easyupdate/CAR or complete the DRP form which will be sent to shareholders for completion and submission to Computershare Investor Services Pty Ltd (carsales share registry). Further information can be obtained from Computershare on 1300 850 505.
CARSALES.COM LIMITED | ANNUAL REPORT | 30 JUNE 2016 | 69
For
per
sona
l use
onl
y

13. Financial risk managementThe Group’s activities expose it to a variety of financial risks: credit risk, interest rate risk and liquidity and foreign exchange risk. The Group’s overall risk management program focuses on the unpredictability of financial markets and seeks to minimise potential adverse effects on the financial performance of the Group. The Group uses different methods to measure different types of risk to which it is exposed.
Risk management is the responsibility of the Chief Financial Officer (CFO) and follows approved policies of the Board of Directors. The CFO identifies, evaluates and hedges financial risks in close cooperation with the Group’s operating units.
(a) Market risk
(i) Foreign exchange riskRefer to Note 19(d) for exposure to foreign exchange risk.
(ii) Price riskThe Group is not exposed to significant equities price risk.
(b) Credit riskCredit risk of the Group arises predominantly from outstanding receivables from customers.
The Group’s credit risk on its receivables is recognised on the consolidated statement of financial position at the carrying amount of those receivable assets, net of any provisions for doubtful debts. There are no significant concentrations of receivables within the Group. Receivable balances are monitored on an ongoing basis with the result that the Group’s exposure to bad debts is not considered to be material.
Details of impaired and past due receivables are disclosed in Note 14.
Credit risk also arises from cash and cash equivalents and deposits with banks and financial institutions. For banks and financial institutions, only independently rated parties with a minimum rating of ‘A’ are accepted by carsales.com Ltd.
(c) Interest rate riskInterest rate risk is set out in Note 9.
(d) Liquidity riskLiquidity risk is set out in Note 9.
Fair value estimationThere are no financial assets or liabilities that are measured at fair value at 30 June 2016.
NOTES TO THE CONSOLIDATED FINANCIAL STATEMENTSCONTINUED
70 | CARSALES.COM LIMITED | ANNUAL REPORT | 30 JUNE 2016
For
per
sona
l use
onl
y

Other assets and liabilities
14. Trade and other receivables
Impaired receivables
2016$’000
Not impaired
receivables 2016$’000
Total receivables
2016$’000
Provision 2016$’000
Carrying value 2016$’000
Carrying value 2015
$’000Current 201 34,324 34,525 201 34,324 26,7531-3 months 62 1,861 1,923 62 1,861 5,2673-6 months 1,254 738 1,992 1,254 738 596Over 6 months 510 36 546 510 36 72Trade receivables 2,027 36,959 38,986 2,027 36,959 32,688
Accrued income 1,948 2,819Other receivables 2,657 386Prepayments 3,158 3,283Trade and other receivables 44,722 39,176
Recognition and measurementTrade receivables are recognised initially at fair value and subsequently measured at amortised cost, less provision for impairment. Trade receivables are due for settlement generally within 30 days following the provision of advertising, data services or finance services.
Collectability of trade receivables is reviewed on an ongoing basis. Debts which are known to be uncollectable are written off by reducing the carrying amount directly. An allowance account (provision for impairment of trade receivables) is used when there is objective evidence that the Group will not be able to collect all amounts due according to the original terms of the receivables. Significant financial difficulties of the debtor, probability that the debtor will enter bankruptcy or financial reorganisation and default or delinquency in payments (more than 30 days overdue) are considered indicators that the trade receivable is impaired. The amount of the impairment allowance is the difference between the asset’s carrying amount and the present value of estimated future cash flows, discounted at the original effective interest rate. Cash flows relating to short term receivables are not discounted if the effect of discounting is immaterial.
The amount of the impairment loss is recognised in the consolidated statement of comprehensive income within the ‘operations and administration’ expense. When a trade receivable for which an impairment allowance had been recognised becomes uncollectable in a subsequent period, it is written off against the allowance account. Subsequent recoveries of amounts previously written off are credited against other expenses in the consolidated statement of comprehensive income.
(a) Impaired trade receivablesThe individually impaired receivables mainly relate to customers which are in unexpectedly difficult economic situations. The creation and release of the provision for impaired receivables has been included in ‘operations and administration’ expenses in the consolidated statement of comprehensive income. Amounts charged to the provision account are generally written off when there is no expectation of recovering additional cash.
(b) Accrued incomeServices provided in the current reporting period are recognised on accrual basis. Settlement is generally within 30 days.
(c) Other receivablesThese amounts generally arise from transactions outside the usual operating activities of the Group. Interest is not charged and collateral is not normally obtained.
The other classes within trade and other receivables do not contain impaired assets and are not past due. Based on the credit history of these other classes, it is expected that these amounts will be received when due.
(d) Fair value and credit riskDue to the short term nature of these receivables, their carrying amount is assumed to approximate their fair value.
The maximum exposure to credit risk at the reporting date is the carrying amount of each class of receivables mentioned above.
CARSALES.COM LIMITED | ANNUAL REPORT | 30 JUNE 2016 | 71
For
per
sona
l use
onl
y

15. Property, plant and equipment
Plant and equipment
$’000
Motor vehicles
$’000
Leasehold impro-
vements$’000
Total$’000
At 30 June 2016Cost 6,704 363 8,032 15,099Accumulated depreciation (4,949) (154) (3,388) (8,491)Net book amount 1,755 209 4,644 6,608
At 30 June 2015Cost 5,763 210 6,455 12,428Accumulated depreciation (3,955) (95) (2,429) (6,479)Net book amount 1,808 115 4,026 5,949
Recognition and measurementProperty, plant and equipment is stated at historical cost less depreciation. Historical cost includes expenditure that is directly attributable to the acquisition of the items.
Subsequent costs are included in the asset’s carrying amount or recognised as a separate asset, as appropriate, only when it is probable that future economic benefits associated with the item will flow to the Group and the cost of the item can be measured reliably. All other repairs and maintenance are charged to the profit or loss during the financial period in which they are incurred.
Depreciation on assets is calculated using the straight line method to allocate their cost, net of their residual values, over their estimated useful lives, as follows:
• Vehicles 3 – 5 years
• Furniture, fittings and equipment 3 – 10 years
• Computer hardware and peripherals 3 – 5 years
• Leased plant and equipment 10 – 15 years or minimum lease period if shorter
• Leasehold improvements 3 – 10 years or minimum lease period if shorter
The assets’ residual values and useful lives are reviewed, and adjusted if appropriate, at each reporting date.
An asset’s carrying amount is written down immediately to its recoverable amount if the asset’s carrying amount is greater than its estimated recoverable amount.
Gains and losses on disposals are determined by comparing proceeds with carrying amount. These are included in the consolidated statement of comprehensive income.
Leases of property, plant and equipment where the Group has substantially all the risks and rewards of ownership are classified as finance leases. Finance leases are capitalised at the lease’s inception at the fair value of the leased property or, if lower, the present value of the minimum lease payments. The corresponding rental obligations, net of finance charges, are included in other short term and long term payables. Each lease payment is allocated between the liability and finance cost. The finance cost is charged to the profit or loss over the lease period so as to produce a constant periodic rate of interest on the remaining balance of the liability for each period. The property, plant and equipment acquired under finance leases is depreciated over the asset’s useful life or over the shorter of the asset’s useful life and the lease term if there is no reasonable certainty that the Group will obtain ownership at the end of the lease term.
NOTES TO THE CONSOLIDATED FINANCIAL STATEMENTSCONTINUED
72 | CARSALES.COM LIMITED | ANNUAL REPORT | 30 JUNE 2016
For
per
sona
l use
onl
y

16. Intangible assets
Goodwill$’000
Computer software
$’000
Brands and customer
relationships$’000
Other intangible
assets1
$’000Total$’000
At 1 July 2014Cost 85,865 11,704 - 4,343 101,912Accumulated amortisation and impairment - (6,671) - (2,972) (9,643)Net book amount 85,865 5,033 - 1,371 92,269
Year ended 30 June 2015Opening net book amount 85,865 5,033 - 1,371 92,269Acquisition of subsidiaries 60,978 - - 12 60,990Additions - 6,000 - 99 6,099Amortisation charge - (2,828) - (582) (3,410)Closing net book amount 146,843 8,205 - 900 155,948
At 30 June 2015Cost 146,843 17,704 - 4,453 169,000Accumulated amortisation and impairment - (9,499) - (3,553) (13,052)Net book amount 146,843 8,205 - 900 155,948
Year ended 30 June 2016Opening net book amount 146,843 8,205 - 900 155,948Acquisition of subsidiaries 26,543 - 3,245 - 29,788Additions - 8,942 - 135 9,077Disposals - (186) - - (186)Amortisation charge - (4,106) (868) (463) (5,437)Reclassifications to brand intangibles2 (4,524) - 6,463 - 1,939Exchange differences 895 - (455) - 440Closing net book amount 169,757 12,855 8,385 572 191,569
At 30 June 2016Cost 169,757 26,438 9,253 4,588 210,036Accumulated amortisation and impairment - (13,583) (868) (4,016) (18,467)Net book amount 169,757 12,855 8,385 572 191,569 1. Other intangible assets include database, domain names and other.2. Reclassifications reflect the fair value adjustment of the brand and customer relationships intangibles acquired as part of business combinations. The reclassification
from goodwill includes the net deferred tax effect of the brand intangibles being reclassified.
CARSALES.COM LIMITED | ANNUAL REPORT | 30 JUNE 2016 | 73
For
per
sona
l use
onl
y

Recognition and measurement
(i) GoodwillGoodwill represents the excess of the cost of an acquisition over the fair value of the Group’s share of the net identifiable assets of the acquired subsidiary at the date of acquisition. Goodwill on acquisitions of subsidiaries is included in intangible assets. Goodwill is not amortised. Instead, goodwill is tested for impairment annually, or more frequently if events or changes in circumstances indicate that it might be impaired, and is carried at cost less accumulated impairment losses. Gains and losses on the disposal of an entity include the carrying amount of goodwill relating to the entity sold.
Goodwill is allocated to cash-generating units for the purpose of impairment testing. Each of those cash-generating units represents the Group’s investment in each primary operating segment (Note 1).
(ii) Computer softwareSoftware includes capitalised development costs being an internally generated intangible asset.
Costs incurred in developing products or systems and costs incurred in acquiring software and licenses that will contribute to future period financial benefits through revenue generation and/or cost reduction are capitalised to software and systems.
(iii) Brands and customer relationshipsAcquired brands represent the value of brands in acquired subsidiaries and businesses that are separately fair valued at the date of acquisition from the remaining goodwill. Acquired brands are written off over a 10 year period.
Acquired customer relationships have a finite useful life and are carried at fair value at acquisition date less accumulated depreciation and impairment losses. Amortisation is calculated using the straight-line method to allocate the cost of the asset over its estimated useful life, which is between 7–10 years.
(iv) Other intangible assetsRedBook database costs capitalised to date include direct payroll and payroll related costs of employees’ time spent on developing the database. These intangible assets have finite lives and are subject to amortisation on a straight line basis. The useful lives for these assets are as follows:
• Software 4 – 5 years
• Domain Names 5 – 10 years
• Database 10 years
• Brand intangibles 10 years
• Customer relationships 7 – 10 years
(a) Impairment tests for goodwillGoodwill is allocated to the Group’s cash-generating units (CGUs) identified according to segment.
A segment-level summary of the goodwill allocation is presented below.
2016Total$’000
Online Advertising 70,715Data and Research 15,823Finance and related services 58,494
145,032
– carsales Mexico SAPI de CV 4,778– Chileautos SpA 19,947International 24,725
169,757
2015Total$’000
Online Advertising 70,715Data and Research 15,823Finance and related services 60,305 146,843
NOTES TO THE CONSOLIDATED FINANCIAL STATEMENTSCONTINUED
74 | CARSALES.COM LIMITED | ANNUAL REPORT | 30 JUNE 2016
For
per
sona
l use
onl
y

16. Intangible assets (continued)
Recognition and measurement
(i) ImpairmentAn impairment loss is recognised for the amount by which the asset’s carrying amount exceeds its recoverable amount. The recoverable amount is the higher of an asset’s fair value less costs to sell and value in use. For the purposes of assessing impairment, assets are grouped at the lowest levels for which there are separately identifiable cash inflows which are largely independent of the cash inflows from other assets or groups of assets (cash-generating units).
(ii) Estimated impairment of goodwillThe Company tests annually whether goodwill has suffered any impairment, in accordance with the accounting policy stated in “basis of preparation”. The recoverable amounts of cash-generating units have been determined based on value-in-use calculations. These calculations require the use of assumptions.
The recoverable amount of a CGU is determined based on value-in-use calculations. These calculations use cash flow projections based on financial budgets covering a five-year period. Cash flows beyond the five-year period are extrapolated using the estimated growth rates stated below. The growth rate does not exceed the long term average growth rate for the business in which the CGU operates.
Goodwill and intangible assets that have an indefinite useful life are not subject to amortisation and are tested annually for impairment, or more frequently if events or changes in circumstances indicate that they might be impaired. Other assets are tested for impairment whenever events or changes in circumstances indicate that the carrying amount may not be recoverable. An impairment loss is recognised for the amount by which the asset’s carrying amount exceeds its recoverable amount. The recoverable amount is the higher of an asset’s fair value less costs to sell and value in use. For the purposes of assessing impairment, assets are grouped at the lowest levels for which there are separately identifiable cash inflows which are largely independent of the cash inflows from other assets or groups of assets (cash-generating units). Non-financial assets other than goodwill that suffered an impairment are reviewed for possible reversal of the impairment at each reporting date.
(b) Key assumptions used for value-in-use calculationsThe carrying value of the acquisition in Chile and Mexico are supported by the fair value less costs to sell valuation method given their recency. The recoverable amount of a CGU is determined based on value-in-use calculations. These calculations use cash flow projections based on approved budgets.
CGU Growth rate1 Discount rate2
2016%
2015%
2016%
2015%
Online Advertising 2.0 2.0 10.6 6.9Data and Research 2.0 2.0 10.6 6.9Finance and related services 2.5 2.5 10.6 6.9
1. Weighted average growth rate used to extrapolate cash flows beyond the budget period.2. In performing the value-in-use calculations for each CGU, the Company has applied pre-tax discount rates to discount the forecast future attributable pre-tax
cash flows.
(c) Impact of possible changes in key assumptionsManagement do not consider that a reasonable change in any of the key assumptions would lead to impairment.
CARSALES.COM LIMITED | ANNUAL REPORT | 30 JUNE 2016 | 75
For
per
sona
l use
onl
y

17. Payables and provisions
Payables2016$’000
2015$’000
Trade payables 15,731 14,167Accrued expenses 17,159 15,451Other payables 3,294 3,934Total payables 36,184 33,552
ProvisionsEmployee benefits – current 6,310 5,412Employee benefits – non-current 1,037 1,165Total employee benefits 7,347 6,577
Recognition and measurement
(i) PayablesThese amounts represent liabilities for goods and services provided to the Group prior to the end of financial year which are unpaid. The amounts are unsecured and are usually paid within 30 days of recognition.
(ii) Short term obligationsLiabilities for wages and salaries, including non-monetary benefits, annual leave and accumulating sick leave expected to be settled within 12 months after the end of the period in which the employees render the related service are recognised in respect of employees’ service up to the end of the reporting period and are measured at the amount expected to be paid when the liabilities are settled. The liability for annual leave and accumulating sick leave is recognised in the provision for employee benefits. All other short term employee benefit obligations are presented as payables.
(iii) Other long term employee benefit obligationsThe liability for long service leave and annual leave which is not expected to be settled within 12 months after the end of the period in which the employees render the related services is recognised in the provision for employee benefits and measured as the present value of expected future payments to be made in respect of services provided by employees up to the end of the reporting period using the projected unit credit method. Consideration is given to expected future wage and salary levels, experience of employee departures and period of service. Expected future payments are discounted using market yields at the end of the reporting period on high-quality corporate bonds with terms to maturity and currency that match, as closely as possible, the estimated future cash outflows.
(iv) Bonus plansThe Group recognises a liability and an expense for bonuses and profit-sharing based on a formula that takes into consideration the profit attributable to the Company’s shareholders after certain adjustments. The Company recognises a provision where contractually obliged or where there is a past practice that has created a constructive obligation.
18. Commitments
Non-cancellable operating leasesThe Group leases offices in a number of locations. The most significant of these leases is the Melbourne head office where the lease is a non-cancellable operating lease expiring within five years. Upon renewal date, the Company has the option to renew the lease for a further two years at terms which are negotiable. The Group also leases various motor cars and printers under non-cancellable operating leases.
2016$’000
2015$’000
Commitments for minimum lease payments in relation to non-cancellableoperating leases are payable as follows:Within one year 5,223 4,538Later than one year but not later than five years 12,518 14,953Later than five years 2,266 3,204 20,007 22,695
Bank guarantee facilityGuarantees in respect of bank facilities drawn down but not included in the accounts of the Group are $3.2 million (2015: $2.7 million)
NOTES TO THE CONSOLIDATED FINANCIAL STATEMENTSCONTINUED
76 | CARSALES.COM LIMITED | ANNUAL REPORT | 30 JUNE 2016
For
per
sona
l use
onl
y

19. Interests in other entities
(a) Material subsidiariesThe Group’s principal subsidiaries at 30 June 2016 are set out below. Unless otherwise stated, they have share capital consisting solely of ordinary shares that are held directly by the Group and the proportion of ownership interests held equals the voting rights held by the Group. The country of incorporation or registration is also their principal place of business.
Name of entity
Place of business/ country of incorporation
Ownership interest held by
the Group *
Ownership interest held by non-controlling
interestsPrincipal activities
2016
%2015
%2016
%2015
%Webpointsclassified Pty Ltd Australia 100.0 100.0 - - (1)Equipment Research Group Pty Ltd Australia 100.0 100.0 - - (2)Discount Vehicles Australia Pty Ltd Australia 100.0 100.0 - - (1)Automotive Data Services Pty Ltd Australia 100.0 100.0 - - (2)Auto Information Limited New Zealand 100.0 100.0 - - (2)RedBook Automotive Services (M) Sdn Bhd Malaysia 100.0 100.0 - - (2)RedBook Automotive Data Services (Beijing) Limited China 100.0 100.0 - - (2)Automotive Data Services (Thailand) Company Limited Thailand 100.0 100.0 - - (2)Tyresales Pty Ltd Australia 50.0 50.0 50.0 50.0 (3)Auto Exchange Holdings Pty Ltd Australia 100.0 100.0 - - (4)carsales.com Investments Pty Ltd Australia 100.0 100.0 - - (4)Automotive Exchange Pty Ltd Australia 50.0 50.0 50.0 50.0 (1)carsales Holdings Pty Ltd Australia 100.0 100.0 - - (4)carsales.com Ltd Employee Share Trust Australia 100.0 100.0 - - (5)carsales Finance Pty Ltd Australia 100.0 100.0 - - (4)Stratton Fleet Services Pty Ltd Australia 50.1 50.1 49.9 49.9 (6)Stratton Franchise Pty Ltd Australia 50.1 50.1 49.9 49.9 (6)Stratton Finance Pty Ltd Australia 50.1 50.1 49.9 49.9 (6)Stratton Marine And Outdoor Finance Pty Ltd Australia 75.0 - 25.0 - (6)Auto Inspect Pty Ltd Australia 50.1 50.1 49.9 49.9 (7)carsales Latam Pty Ltd Australia 100.0 - - - (4)carsales Mexico SAPI de CV Mexico 65.0 - 35.0 - (1)carsales Chile SpA Chile 100.0 - - - (4)Chileautos SpA Chile 83.3 - 16.7 - (1)carsales Foundation Pty Ltd Australia 100.0 - - - (8)
* The proportion of ownership interest is equal to the proportion of voting power held.(1) Classified advertising(2) Data and research(3) Online retail(4) Holding company(5) Share trust company(6) Finance and related services(7) Car inspection(8) Trustee company
(i) SubsidiariesSubsidiaries are all those entities over which the Group has the power to govern the financial and operating policies, generally accompanying a shareholding of more than one-half of the voting rights. The existence and effect of potential voting rights that are currently exercisable or convertible are considered when assessing whether the Group controls another entity.
Subsidiaries are fully consolidated from the date on which control is transferred to the Group. They are de-consolidated from the date that control ceases.
The purchase method of accounting is used to account for the acquisition of subsidiaries by the Company (refer to Note 20).
Intercompany transactions, balances and unrealised gains on transactions between companies are eliminated. Unrealised losses are also eliminated unless the transaction provides evidence of the impairment of the asset transferred. Accounting policies of subsidiaries have been changed where necessary to ensure consistency with the policies adopted by the Company.
Non-controlling interests in the results and equity of subsidiaries are shown separately in the consolidated income statement, statement of comprehensive income, statement of changes in equity and balance sheet respectively.
CARSALES.COM LIMITED | ANNUAL REPORT | 30 JUNE 2016 | 77
For
per
sona
l use
onl
y

(ii) Employee Share TrustThe Group has formed a trust to administer the Group’s employee share scheme. This trust is consolidated, as the substance of the relationship is that the trust is controlled by the Group.
(b) Non-controlling interests (NCI)Set out below is summarised financial information for each subsidiary that has non-controlling interests that are material to the Group. The amounts disclosed for each subsidiary are before intercompany eliminations.
30 June 2016Tyresales
$’000
Auto Exchange
$’000
Stratton Finance
$’000
Auto Inspect
$’000SoloAutos
$’000Chileautos
$’000Summarised balance sheetCurrent assets 2,050 2,602 10,530 1,068 3,933 1,250Current liabilities (2,051) (553) (15,792) (754) (32) (101)Non-current assets 285 173 18,905 196 4,598 4Non-current liabilities - - (5,425) (119) (785) -Net assets 284 2,222 8,218 391 7,714 1,153Accumulated NCI (145) 336 1,566 195 2,036 192
30 June 2015Tyresales
$’000
Auto Exchange
$’000
Stratton Finance
$’000
Auto Inspect
$’000Summarised balance sheetCurrent assets 1,780 4,190 13,316 75Current liabilities (1,873) (2,038) (15,654) (63)Non-current assets 287 214 10,518 36Non-current liabilities - - (3,058) (52)Net assets 194 2,366 5,122 (4) Accumulated NCI (40) 407 1,943 (2)
30 June 2016Tyresales
$’000
Auto Exchange
$’000
Stratton Finance
$’000
Auto Inspect
$’000SoloAutos
$’000Chileautos
$’000Summarised statement of comprehensive incomeProfit/(loss) for the period (210) 557 8,470 1,114 (718) 346Profit/(loss) allocated to NCI (105) 278 4,290 556 (251) 59Dividends paid to NCI - 350 4,667 287 - -
30 June 2015Tyresales
$’000
Auto Exchange
$’000
Stratton Finance
$’000
Auto Inspect
$’000Summarised statement of comprehensive incomeProfit/(loss) for the period (360) 656 7,719 -Profit/(loss) allocated to NCI (180) 328 3,852 -Dividends paid to NCI - - 1,705 -
NOTES TO THE CONSOLIDATED FINANCIAL STATEMENTSCONTINUED
78 | CARSALES.COM LIMITED | ANNUAL REPORT | 30 JUNE 2016
For
per
sona
l use
onl
y

19. Interests in other entities (continued)
(b) Non-controlling interests (NCI) (continued)
30 June 2016Tyresales
$’000
Auto Exchange
$’000
Stratton Finance
$’000
Auto Inspect
$’000SoloAutos
$’000Chileautos
$’000Summarised cash flowsCash flows from operating activities 670 447 12,665 1,056 (722) 217Cash flows from investing activities (68) (113) (5,093) (169) 17 -Cash flows from financing activities - (700) (7,806) (789) - -Net increases/(decrease) in cash and cash equivalents 602 (366) (234) 98 (705) 217
30 June 2015Tyresales
$’000
Auto Exchange
$’000
Stratton Finance
$’000
Auto Inspect
$’000Summarised cash flowsCash flows from operating activities 340 820 10,892 -Cash flows from investing activities (138) (127) (8,548) -Cash flows from financing activities - - 239 -Net increases/(decrease) in cash and cash equivalents 202 693 2,583 -
(c) Interests in associates
Name of entity
Place of business/ country of incorporation % of ownership interest
Nature of relationship
Measurement method
2016%
2015%
Webmotors S.A. Brazil 30.0 30.0 Associate Equity methodiCar Asia Limited Australia 20.2 20.2 Associate Equity methodSK ENCARSALES.COM Ltd South Korea 49.9 49.9 Associate Equity methodRateSetter Australia Pty Ltd Australia 20.0 20.0 Associate Equity methodPromisePay Pty Ltd Australia 10.1 - Associate Equity methodTotal equity accounted investments
Name of entity Quoted fair value Carrying amount Share of Profit
2016 $’000
2015 $’000
2016 $’000
2015 $’000
2016 $’000
2015 $’000
Webmotors S.A. - - 83,381 82,811 3,376 3,479iCar Asia Limited 42,665 31,191 21,658 19,362 (2,456) (3,289)SK ENCARSALES.COM Ltd - - 145,710 144,851 5,309 4,736RateSetter Australia Pty Ltd - - 9,237 10,227 (1,006) -PromisePay Pty Ltd - - 6,990 - - -Total equity accounted investments 42,665 31,191 266,976 257,251 5,223 4,926
RateSetter and PromisePay are both equity accounted for as carsales exercises significant influence over these entities through the right to appoint a Director to the respective Boards.
CARSALES.COM LIMITED | ANNUAL REPORT | 30 JUNE 2016 | 79
For
per
sona
l use
onl
y

(i) AssociatesAssociates are all entities over which the Group has significant influence but not control or joint control, generally accompanying a shareholding of between 20% and 50% of the voting rights. Investments in associates are accounted for using the equity method of accounting, after initially being recognised at cost. The Group’s investment in associates includes goodwill identified on acquisition. Acquisition related costs of associates are capitalised.
The Group’s share of its associates’ post-acquisition profits or losses is recognised in profit or loss, and its share of post-acquisition other comprehensive income is recognised in other comprehensive income. The cumulative post-acquisition movements are adjusted against the carrying amount of the investment. Dividends received from associates are recognised as a reduction in the carrying amount of the investment.
When the Group’s share of losses in an associate equals or exceeds its interest in the associate, including any other unsecured long term receivables, the Group does not recognise further losses, unless it has incurred obligations or made payments on behalf of the associate.
Unrealised gains on transactions between the Group and its associates are eliminated to the extent of the Group’s interest in the associates. Unrealised losses are also eliminated unless the transaction provides evidence of an impairment of the asset transferred. Accounting policies of associates have been changed where necessary to ensure consistency with the policies adopted by the Group. (ii) Contingent liabilities in respect of associates
2016 $’000
2015 $’000
Contingent liabilities – associatesContingent liabilities relating to liabilities of the associate for which the Company is severally liable 568 599
(iii) Summarised financial information for significant associates
Webmotors S.A. iCar Asia Limited1 SK ENCARSALES.COM Ltd
Summarised balance sheet
30 June 2016$’000
30 June 2015$’000
30 June 2016$’000
30 June 2015$’000
30 June 2016$’000
30 June 2015$’000
Total current assets 95,996 91,063 14,489 8,504 25,042 20,592Total non-current assets 15,166 13,181 26,811 27,083 3,978 3,842Total current liabilities (9,408) (9,056) (3,294) (3,462) (8,050) (6,858)Total non-current liabilities - - (486) (527) (7,261) (7,968)Net assets 101,754 95,188 37,520 31,598 13,709 9,608
Group’s share in % 30% 30% 20.2% 20.2% 49.9% 49.9%Group’s share in $ 30,526 28,556 7,579 6,383 6,841 4,794Goodwill 44,518 45,183 14,079 12,979 123,186 122,705Acquired intangibles 8,337 9,072 - - 15,683 17,352Carrying amount 83,381 82,811 21,658 19,362 145,710 144,851
Reconciliation of carrying valueOpening carrying value 82,811 93,323 19,362 19,146 144,851 127,957Investment in associate - 15 3,797 1 - 314Profit/(loss) for the period 3,922 3,878 (2,456) (3,288) 7,064 6,210Amortisation of intangibles (546) (400) - - (1,755) (1,474)Gain on dilution - - 955 3,447 - -Other comprehensive income (1,055) (12,032) - 56 (552) 14,024Dividends received (1,751) (1,973) - - (3,898) (2,180)Closing carrying value 83,381 82,811 21,658 19,362 145,710 144,851
1. These numbers are management estimates based on available market data.
The intangibles and goodwill recognised on acquisition have now been separately identified in the table above, resulting in the restatement of some prior year balances.
NOTES TO THE CONSOLIDATED FINANCIAL STATEMENTSCONTINUED
80 | CARSALES.COM LIMITED | ANNUAL REPORT | 30 JUNE 2016
For
per
sona
l use
onl
y

19. Interests in other entities (continued)
(c) Interests in associates (continued)
Webmotors S.A. iCar Asia Limited* SK ENCARSALES.COM Ltd
Summarised statement of comprehensive income
30 June 2016$’000
30 June 2015$’000
30 June 2016$’000
30 June 2015$’000
30 June 2016$’000
30 June 2015$’000
Revenue 37,023 39,526 6,811 4,443 35,120 27,761Profit from continuing operations 11,255 11,595 (12,159) (15,889) 10,640 9,519
Other comprehensive income - - - - (665) - Total comprehensive income 11,255 11,595 (12,159) (15,889) 9,975 9,519
carsales shareProfit from continuing operations 3,376 3,478 (2,456) (3,288) 5,309 4,736Other comprehensive income (1,055) (12,032) - - (552) 14,024Total 2,321 (8,554) (2,456) (3,288) 4,757 18,760Dividends received from associates and joint venture entities 1,751 1,973 - - 3,898 2,180
* These numbers are management estimates based on available market data.
(d) Foreign Exchange RiskThe Group operates internationally and is exposed to foreign exchange risk arising from various currency exposures, primarily with respect to the Brazilian Real (BRL), the Korean Won (KRW), the Mexican Peso (MXP) and Chilean Peso (CLP).
Foreign exchange risk arises from future commercial transactions and recognised assets and liabilities denominated in foreign currency that is not the entity’s functional currency.
Hedging contracts are sometimes used to manage foreign currency exchange risk. The Company has a treasury strategy and a treasury policy and will actively hedge any major known commitments using forward exchange contracts. The Company does net investment hedge quasi-equity intercompany loans used to fund investments in subsidiaries but does not net investment hedge the carrying value of associates in the balance sheet. Trading and dividend cash flows between associates and the Group are not hedged unless the cash flows are significant and the amount and future payment date is certain. No foreign currency derivatives were entered into in the year.
The analysis below reflects management’s view of possible movements in relevant foreign currencies against the Australian dollar. The table summarises the range of possible outcomes that would affect the Group’s net profit and equity as a result of foreign currency movements.
The estimated impact on carsales.com Ltd share of the reported net profits of our significant overseas associates and subsidiaries through potential movements in exchange rates are as follows:
Impact on profit:
2016$’000
-5%
2015$’000
-5%
2016$’000
5%
2015$’000
5%AUD to KRW (+5% to -5%) 252.3 281.4 (252.3) (281.4)AUD to BRL (+5% to -5%) 160.8 204.0 (160.8) (204.0)AUD to MXP (+5% to -5%) (22.2) - 22.2 -AUD to CLP (+5% to -5%) 13.7 - (13.7) -Net movement 404.6 485.4 (404.6) (485.4)
Impact on equity:
2016$’000
-5%
2015$’000
-5%
2016$’000
5%
2015$’000
5%AUD to KRW (+5% to -5%) 6,911 6,895 (6,911) (6,895)AUD to BRL (+5% to -5%) 3,971 3,834 (3,971) (3,834)AUD to MXP (+5% to -5%) 464 - (464) -AUD to CLP (+5% to -5%) 936 - (936) -Net movement 12,282 10,729 (12,282) (10,729)
CARSALES.COM LIMITED | ANNUAL REPORT | 30 JUNE 2016 | 81
For
per
sona
l use
onl
y

20. Business combinations and disposals
(a) SoloAutos acquisitionOn 2 October 2015 carsales.com Ltd acquired 65% of carsales Mexico SAPI de CV (“SoloAutos”).
Details of the purchase consideration, the net assets acquired and goodwill are as follows:$’000
Purchase consideration:Cash Paid 10,624
The assets and liabilities acquired are estimated as follows:Cash and cash equivalents 4,269VAT receivable 877Plant and equipment 88Intangible assets 3,245Net assets 8,479Less: Non-controlling interests (2,661)Add: Goodwill 4,806Net assets acquired 10,624
(i) Initial accountingBoth the net asset value and the allocation of the purchase price to acquired assets are still preliminary. In particular, the fair values assigned to intangible assets are still being assessed and may be subject to change. The acquisition accounting will be finalised within 12 months of the acquisition date.
(ii) Earn out agreementAs part of the inducement agreement there is a portion of deferred consideration that is payable to the other shareholder in respect of the purchase of the trade and assets of the business from SoloAutos. The earn out is calculated on the basis of the entity’s performance over a three-year period after the acquisition date provided the other shareholder is in continuous employment. This amounts to a maximum of USD $2.15m and is treated as employee compensation expense in the post combination period.
carsales has the option to purchase the remaining 35% of the shares subject to satisfaction of the terms and conditions at a price that approximates the fair value of the non-controlling interest at the date of exercise of the option. (iii) Non-controlling interestThe Group has recognised the non-controlling interests in SoloAutos at proportionate share of net identifiable assets.
The current ownership structure of SoloAutos is as follows:carsales.com Ltd 65%Non-controlling interestsJose Antonio Ramirez (and other legacy shareholders) 35%
100%
NOTES TO THE CONSOLIDATED FINANCIAL STATEMENTSCONTINUED
82 | CARSALES.COM LIMITED | ANNUAL REPORT | 30 JUNE 2016
For
per
sona
l use
onl
y

20. Business combinations and disposals (continued)
(b) Chileautos acquisitionOn 25 March 2016 carsales.com Ltd acquired 83.3% of Chileautos SpA (“Chileautos”).
Details of the purchase consideration, the net assets acquired and goodwill are as follows:$’000
Purchase consideration:Cash Paid 19,657
The assets and liabilities acquired are estimated as follows:Cash and cash equivalents 342Accounts receivable 193Tax assets 290Plant and equipment 3Trade and other payables (68)Net assets 760Less: Non-controlling interests (127)Add: Goodwill 19,024Net assets acquired 19,657
(i) Initial accountingBoth the net asset value and the allocation of the purchase price to acquired assets are still preliminary. In particular, the fair values assigned to intangible assets are still being assessed and may be subject to change. The acquisition accounting will be finalised within 12 months of the acquisition date.
(ii) Option to purchase remaining sharescarsales retains an option to purchase the remaining 16.7% stake in Chileautos at its election at any time during the next four years at a fixed price.
(iii) Non-controlling interestThe Group has recognised the non-controlling interests in Chileautos at proportionate share of net identifiable assets.
The current ownership structure of Chileautos is as follows:carsales Chile SpA 83.3%Non-controlling interestsCarlos Gonzalo Prieto Concha 7.5%Andres Cooper Ochsenius 1.7%Juan Francisco Bettancourt Mujica 7.5%
100%
CARSALES.COM LIMITED | ANNUAL REPORT | 30 JUNE 2016 | 83
For
per
sona
l use
onl
y

Business combinationsThe acquisition method of accounting is used to account for all business combinations, including business combinations involving entities or businesses under common control, regardless of whether equity instruments or other assets are acquired. The consideration transferred for the acquisition of a subsidiary comprises the fair values of the assets transferred, the liabilities incurred and the equity interests issued by the Company. The consideration transferred also includes the fair value of any contingent consideration arrangement and the fair value of any pre-existing equity interest in the subsidiary. Contingent payments classified as debt are subsequently remeasured through profit or loss. Identifiable assets acquired and liabilities and contingent liabilities assumed in a business combination are, with limited exceptions, measured initially at their fair values at the acquisition date. On an acquisition-by-acquisition basis, the Company recognises any non-controlling interest in the acquiree either at fair value or at the non-controlling interest’s proportionate share of the acquiree’s net identifiable assets.
The excess of the consideration transferred, the amount of any non-controlling interest in the acquiree and the acquisition-date fair value of any previous equity interest in the acquiree over the fair value of the Company’s share of the net identifiable assets acquired is recorded as goodwill. If those amounts are less than the fair value of the net identifiable assets of the subsidiary acquired and the measurement of all amounts has been reviewed, the difference is recognised directly in profit or loss as a discount on purchase. If the Company recognises previously acquired deferred tax assets after the initial acquisition accounting is completed these will be recorded directly in profit or loss.
Where settlement of any part of cash consideration is deferred, the amounts payable in the future are discounted to their present value as at the date of exchange. The discount rate used is the entity’s incremental borrowing rate, being the rate at which a similar borrowing could be obtained from an independent financier under comparable terms and conditions.
(c) Sale of businessThe profit from sale of business $931,000 represents the net profit of sale of Homesales business on 30 June 2016.
(d) Stratton acquisition On 15 July 2014 carsales.com Ltd acquired 50.1% of Stratton Finance Pty Ltd (“Stratton”), an innovative vehicle finance business and long term customer of carsales.com Ltd.
Details of the purchase consideration, the net assets acquired and goodwill are as follows:$’000
Purchase consideration:Cash Paid 58,995
The assets and liabilities acquired are estimated as follows:Cash and cash equivalents 3,929Trade and other receivables 2,684Plant and equipment 1,670Inventory 1,376Intangible assets 6,475Trade and other payments (7,085)Provisions (793)External loans (588)Tax liabilities (3,997)Deferred tax (1,634)Net assets: 2,037Add: Non-controlling interest 1,117Add: Goodwill 55,841Net assets acquired 58,995
The goodwill is attributable to the workforce, Stratton’s strong position in a high growth market, its customer database, the high profitability of the business and synergistic benefits expected to be created by this acquisition. The goodwill is not expected to be deductible for tax purposes.
NOTES TO THE CONSOLIDATED FINANCIAL STATEMENTSCONTINUED
84 | CARSALES.COM LIMITED | ANNUAL REPORT | 30 JUNE 2016
For
per
sona
l use
onl
y

21. Related party transactions
(a) Subsidiaries Interests in subsidiaries are set out in Note 19.
(b) Key Management Personnel compensation
2016$
2015$
Short term employee benefits 8,606,950 6,918,270Post-employment benefits 162,626 155,049Long term employment benefits 137,247 363,297Share-based payments 244,800 1,794,402
9,151,623 9,231,018
(c) Transactions with other related partiesThe following transactions occurred with related parties, the nature of which are described in the Remuneration Report.
2016$
2015$
Sales of goods and servicesSale of services to related parties 988,588 858,996
Purchases of goods and servicesPurchases of goods and services from related parties 3,471,979 3,434,710
All transactions were made on normal commercial terms and conditions, at market rates and includes transactions with associates.
(d) Outstanding balances arising from sales/purchases of goods and servicesThe following balances are outstanding at the end of the reporting period in relation to transactions with related parties:
2016$
2015$
Current receivables (sales of goods and services)Other related parties 137,367 108,392Current payables (purchases of goods and services)Other related parties 876,268 850,521
There is no allowance account for impaired receivables in relation to any outstanding balances, and no expense has been recognised in respect of impaired receivables due from related parties.
CARSALES.COM LIMITED | ANNUAL REPORT | 30 JUNE 2016 | 85
For
per
sona
l use
onl
y

22. Deed of cross guaranteeThe following controlled entities have entered into a Deed of Cross Guarantee:Company Financial year entered into agreementcarsales.com Limited 30 June 2015carsales Holdings Pty Ltd 30 June 2015carsales Finance Pty Ltd 30 June 2015Auto Exchange Holdings Pty Ltd 30 June 2015Automotive Data Services Pty Ltd 30 June 2015carsales.com Investments Pty Ltd 30 June 2015Discount Vehicles Australia Pty Ltd 30 June 2015Equipment Research Group Pty Ltd 30 June 2015Webpointclassifieds Pty Ltd 30 June 2015carsales Latam Pty Ltd 30 June 2016carsales Foundation Pty Ltd 30 June 2016
The companies that are party to this deed guarantee the debts of the others and represent the “Closed Group” from the date of entering into the agreement.
These wholly-owned entities have been relieved from the requirement to prepare a financial report and Directors’ report under Class Order 98/1418 (as amended) issued by the Australian Securities and Investments Commission.
(a) Consolidated statement of comprehensive incomeSet out below is a consolidated Income Statement for the year ended 30 June 2016 of the Closed Group.
Consolidated statement of comprehensive income2016$’000
2015$’000
Revenue from continuing operationsSale of goods and services 254,953 238,303Revenue from continuing operations 254,953 238,303
ExpensesCosts of sale (119) (141)Sales and marketing expenses (68,611) (54,979)Operations and administration (15,169) (19,543)Service development and maintenance (17,007) (21,931)Earnings before interest, taxes, depreciation and amortisation 154,047 141,709
Depreciation and amortisation expense (5,437) (4,004)Finance income 656 571Finance costs (8,598) (8,772)Dividends received 5,323 6,231Gain on sale of business 931 -Profit before income tax 146,922 135,735Income tax expense (43,287) (38,526)Profit from continuing operations 103,635 97,209Total comprehensive income for the year 103,635 97,209
NOTES TO THE CONSOLIDATED FINANCIAL STATEMENTSCONTINUED
86 | CARSALES.COM LIMITED | ANNUAL REPORT | 30 JUNE 2016
For
per
sona
l use
onl
y

22. Deed of cross guarantee (continued)
(b) Consolidated statement of financial positionSet out below is a Consolidated statement of financial position as at 30 June 2016 of the Closed Group.
Consolidated statement of finance position2016$’000
2015$’000
Current assetsCash and cash equivalents 13,517 16,177Trade and other receivables 55,894 36,998Total current assets 69,411 53,175
Non-current assetsInvestments 338,920 313,556Property, plant and equipment 2,953 3,576Deferred tax assets 5,323 4,806Intangible assets 89,319 85,545Total non-current assets 436,515 407,483
Total assets 505,926 460,658
Current liabilitiesTrade and other payables 21,359 18,836Current tax liabilities 6,312 584Provisions 5,266 4,622Deferred revenue 5,990 5,413Total current liabilities 38,927 29,455
Non-current liabilitiesBorrowings 219,531 209,151Provisions 784 1,031Total non-current liabilities 220,315 210,182
Total liabilities 259,242 239,637
Net assets 246,684 221,021
EquityContributed equity 99,026 91,905Reserves 23,185 20,299Retained earnings 124,473 108,817Total equity 246,684 221,021
CARSALES.COM LIMITED | ANNUAL REPORT | 30 JUNE 2016 | 87
For
per
sona
l use
onl
y

Other
23. Remuneration of auditorsDuring the year the following fees were paid or payable for services provided by the auditor of the parent entity, its related practices and non-related audit firms:
(a) PricewaterhouseCoopers
2016$
2015$
PricewaterhouseCoopers firmAudit and review of financial reports 370,616 349,000Controls and assurance services - 25,028Due diligence services 224,566 241,879
Total remuneration for audit and other assurance services 595,182 615,907
Taxation servicesTax compliance services, including review of Company income tax returns 143,350 77,000International tax consulting and tax advice on mergers and acquisitions 88,124 84,264
Total remuneration for taxation services 231,474 161,264
Other servicesOther services 88,472 8,000
Total remuneration of PricewaterhouseCoopers 915,128 785,171
(b) Non-PwC audit firms
Audit and other assurance servicesAudit and review of financial statements 33,097 79,683
Total remuneration for audit and other assurance services 33,097 79,683
Total auditors’ remuneration 948,225 864,854
It is the Company’s policy to employ PwC on assignments additional to their statutory audit duties where PwC’s expertise and experience with the Company are important. These assignments are principally tax advice and due diligence reporting on acquisitions, or where PwC is awarded assignments on a competitive basis. It is the Company’s policy to seek competitive tenders for all major consulting projects.
NOTES TO THE CONSOLIDATED FINANCIAL STATEMENTSCONTINUED
88 | CARSALES.COM LIMITED | ANNUAL REPORT | 30 JUNE 2016
For
per
sona
l use
onl
y

24. Share-based paymentsShare-based compensation benefits are provided to employees via the carsales.com Ltd Option Plan.
Total expenses arising from share-based payment transactions recognised during the period as part of employee benefit expense were $2,214,000 (2015: $1,614,000)
(a) Employee Option PlanSet out below are summaries of options and performance rights granted under the plan:2016
Grant date Expiry dateExercise
price
Balance at start of the
year Number
Options granted
during the year
Number
Perfor- mance rights
granted during the
year Number
Total exercised
during the year
Number
Expired or lapsed
during the year
Number
Balance at the end of
the year Number
Vested and exercisable
at end of the year Number
Oct 2010 Oct 2015 $4.90 25,000 - - (25,000) - - -Mar 2011 Oct 2015 $4.90 45,000 - - (45,000) - - -Oct 2011 Oct 2016 $4.69 33,662 - - (12,598) - 21,064 21,064Mar 2012 Oct 2016 $4.69 69,244 - - (54,051) - 15,193 15,193Oct 2012 Oct 2017 $5.93 482,823 - - (255,956) (10,147) 216,720 216,720Oct 2012 Oct 2017 $0.00 140,654 - - (136,614) (4,040) - -Oct 2013 Oct 2018 $9.10 394,759 - - - (20,133) 374,626 -Oct 2013 Oct 2018 $0.00 183,511 - - (37,271) (4,239) 142,001 -Oct 2014 Oct 2019 $10.71 657,376 - - - (18,917) 638,459 -Oct 2014 Oct 2019 $0.00 224,523 - - - (4,658) 219,865 -Oct 2015 Oct 2020 $10.24 - 864,041 - - (1,521) 862,520 -Oct 2015 Oct 2020 $0.00 - - 270,134 - (360) 269,774 -Total 2,256,552 864,041 270,134 (566,490) (64,015) 2,760,222 252,977
Weighted average exercise price $6.35 $10.24 $0.00 $3.84 $6.97 $7.44 $5.75 2015
Grant date Expiry dateExercise
price
Balance at start of the
year Number
Options granted
during the year
Number
Perfor- mance rights
granted during the
year Number
Total exerised
during the year
Number
Expired or lapsed
during the year
Number
Balance at the end of
the year Number
Vested and exercisable
at end of the year Number
Jul 2007 Sep 2014 $1.75 5,000 - - (5,000) - - -Mar 2010 Oct 2014 $3.89 30,625 - - (30,625) - - -Oct 2010 Oct 2015 $4.90 175,000 - - (150,000) - 25,000 25,000Mar 2011 Oct 2015 $4.90 100,000 - - (55,000) - 45,000 45,000Oct 2011 Oct 2016 $4.69 659,375 - - (625,713) - 33,662 33,662Oct 2011 Oct 2016 $0.00 133,725 - - (133,725) - - -Mar 2012 Oct 2016 $4.69 164,283 - - (92,453) (2,586) 69,244 69,244Mar 2012 Mar 2017 $0.00 52,379 - - (52,379) - - -Oct 2012 Oct 2017 $5.93 710,410 - - (126,691) (100,896) 482,823 96,927Oct 2012 Oct 2017 $0.00 255,370 - - (74,888) (39,828) 140,654 -Oct 2013 Oct 2018 $9.10 406,156 - - - (11,397) 394,759 -Oct 2013 Oct 2018 $0.00 218,988 - - - (35,477) 183,511 -Oct 2014 Oct 2019 $10.71 - 660,349 - - (2,973) 657,376 -Oct 2014 Oct 2019 $0.00 - - 225,255 - (732) 224,523 -Total 2,911,311 660,349 225,255 (1,346,474) (193,889) 2,256,552 269,833
Weighted average exercise price $4.57 $10.71 $0.00 $3.90 $3.85 $6.39 $5.19
CARSALES.COM LIMITED | ANNUAL REPORT | 30 JUNE 2016 | 89
For
per
sona
l use
onl
y
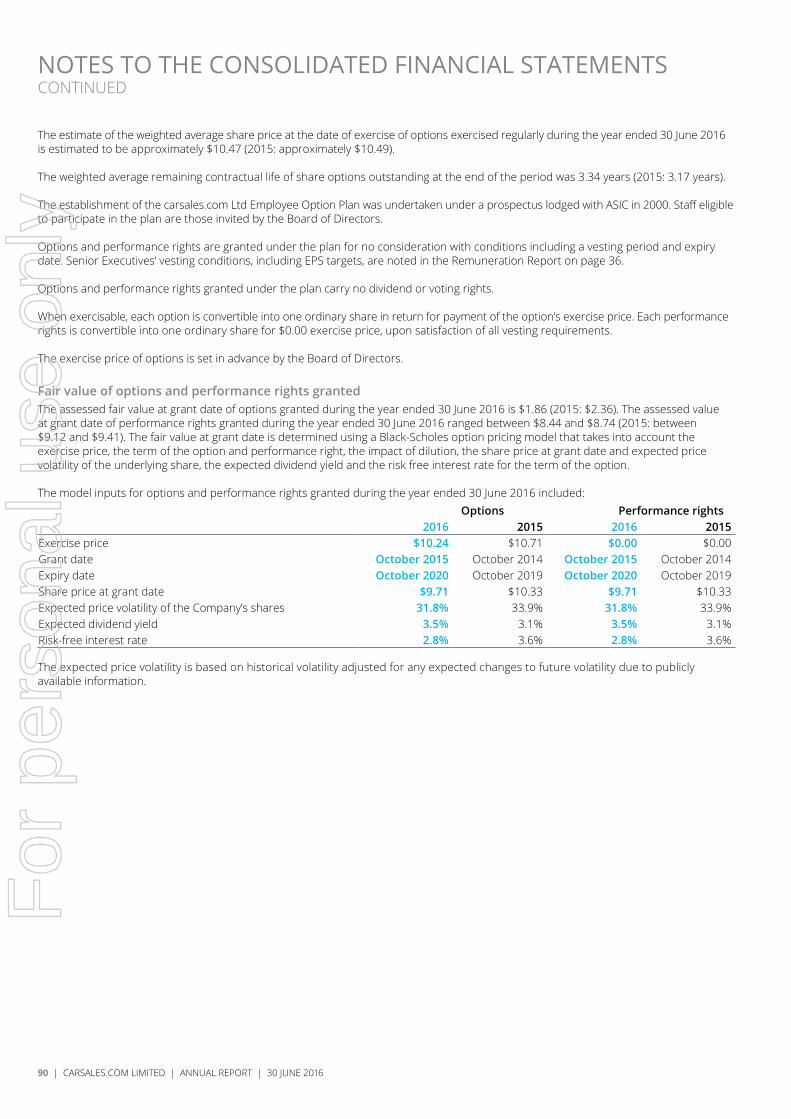
The estimate of the weighted average share price at the date of exercise of options exercised regularly during the year ended 30 June 2016 is estimated to be approximately $10.47 (2015: approximately $10.49).
The weighted average remaining contractual life of share options outstanding at the end of the period was 3.34 years (2015: 3.17 years).
The establishment of the carsales.com Ltd Employee Option Plan was undertaken under a prospectus lodged with ASIC in 2000. Staff eligible to participate in the plan are those invited by the Board of Directors.
Options and performance rights are granted under the plan for no consideration with conditions including a vesting period and expiry date. Senior Executives’ vesting conditions, including EPS targets, are noted in the Remuneration Report on page 36.
Options and performance rights granted under the plan carry no dividend or voting rights.
When exercisable, each option is convertible into one ordinary share in return for payment of the option’s exercise price. Each performance rights is convertible into one ordinary share for $0.00 exercise price, upon satisfaction of all vesting requirements.
The exercise price of options is set in advance by the Board of Directors.
Fair value of options and performance rights grantedThe assessed fair value at grant date of options granted during the year ended 30 June 2016 is $1.86 (2015: $2.36). The assessed value at grant date of performance rights granted during the year ended 30 June 2016 ranged between $8.44 and $8.74 (2015: between $9.12 and $9.41). The fair value at grant date is determined using a Black-Scholes option pricing model that takes into account the exercise price, the term of the option and performance right, the impact of dilution, the share price at grant date and expected price volatility of the underlying share, the expected dividend yield and the risk free interest rate for the term of the option.
The model inputs for options and performance rights granted during the year ended 30 June 2016 included:Options Performance rights
2016 2015 2016 2015Exercise price $10.24 $10.71 $0.00 $0.00Grant date October 2015 October 2014 October 2015 October 2014Expiry date October 2020 October 2019 October 2020 October 2019Share price at grant date $9.71 $10.33 $9.71 $10.33Expected price volatility of the Company’s shares 31.8% 33.9% 31.8% 33.9%Expected dividend yield 3.5% 3.1% 3.5% 3.1%Risk-free interest rate 2.8% 3.6% 2.8% 3.6%
The expected price volatility is based on historical volatility adjusted for any expected changes to future volatility due to publicly available information.
NOTES TO THE CONSOLIDATED FINANCIAL STATEMENTSCONTINUED
90 | CARSALES.COM LIMITED | ANNUAL REPORT | 30 JUNE 2016
For
per
sona
l use
onl
y

25. Parent entity financial information
(a) Summary financial information
2016$’000
2015$’000
Balance sheetCurrent assets 58,777 56,894Non-current assets 413,556 409,698Total assets 472,333 466,592
Current liabilities 15,909 63,047Non-current liabilities 220,556 210,182Total liabilities 236,465 273,229
Shareholders’ equityIssued capital 99,026 91,905Reserves 23,214 20,299Retained earnings 113,628 81,159Total equity 235,868 193,363
Profit or loss for the year 130,698 96,835 Total comprehensive income 130,698 96,835
Recognition and measurementThe financial information for the parent entity, carsales.com Ltd, has been prepared on the same basis as the consolidated financial statements, except as set out below.
(i) Investments in subsidiariesInvestments in subsidiaries are accounted for at cost in the financial statements of carsales.com Ltd. Dividends received from subsidiaries are recognised in the parent entity’s profit or loss, rather than being deducted from the carrying amount of these investments. Investments in subsidiaries are tested for impairment whenever changes in events or circumstances indicate that the carrying amount may not be recoverable. Such events may include receipt of dividends, refer Note 16 for details of impairment accounting policies.
(b) Contingent liabilities of the parent entityThe parent entity did not have any contingent liabilities as at 30 June 2016 or 30 June 2015.
CARSALES.COM LIMITED | ANNUAL REPORT | 30 JUNE 2016 | 91
For
per
sona
l use
onl
y

26. Other accounting policiesThe following standards will be applicable in future reporting periods and the Group will adopt the standards upon the operative date. The Group is assessing the impact of these standards however they are not expected to have significant impact:
• AASB 9 Financial Instruments (effective 1 January 2018).
• Clarification of acceptable methods of depreciation and amortisation (AASB 2014-4) (effective 1 January 2016).
• Accounting for acquisitions of interests in joint operations (AASB 2014-3) (effective 1 January 2016).
• AASB 15 Revenue from Contracts with Customers (effective 1 January 2018).
• IFRS 16 Leases (effective 1 January 2019).
The following standards are not applicable to carsales.com Ltd and therefore there is no impact on the Group:
• AASB 2013-5 Amendments to Australian Accounting Standards - Investment Entities (effective 1 January 2014).
• Transitioning between tiers (AASB 2014-2) (effective date 1 July 2014).
• AASB Interpretation 21 Levies (effective 1 January 2014).
• AASB 2013-4 Amendments to Australian Accounting Standards – Novation of Derivatives and Continuation of Hedge Accounting – [AASB 139] (effective 1 January 2014).
• Hedge Accounting and Amendments to IFRS 9, IFRS 7 and IAS 39.
• Defined Benefit Plans: Employee Contributions – Amendments to IAS 19 (effective 1 January 2014).
• Accounting for Levies (Interpretation 21) (effective 1 January 2014).
• Consolidation and interest of policy holders (AASB 2013-7) (effective 1 January 2014).
• Superannuation Entities (AASB 1056) (effective 1 January 2016).
27. Events occurring after the reporting periodNo matter or circumstance has occurred subsequent to period end that has significantly affected, or may significantly affect, the operations of the Group the results of those operations or the state of affairs of the Group or economic entity in subsequent financial years.
NOTES TO THE CONSOLIDATED FINANCIAL STATEMENTSCONTINUED
92 | CARSALES.COM LIMITED | ANNUAL REPORT | 30 JUNE 2016
For
per
sona
l use
onl
y

DIRECTORS' DECLARATION30 JUNE 2016
In the Directors' opinion:
(a) the financial statements and notes set out on pages 48 to 92 are in accordance with the Corporations Act 2001, including:
(i) Complying with Accounting Standards, the Corporations Regulations 2001 and other mandatory professional reporting requirements.
(ii) Giving a true and fair view of the consolidated entity's financial position as at 30 June 2016 and of its performance for the financial year ended on that date.
(b) there are reasonable grounds to believe that the Company will be able to pay its debts as and when they become due and payable.
The basis of preparation confirms that the financial statements also comply with International Financial Reporting Standards as issued by the International Accounting Standards Board.
The Directors have been given the declarations by the Managing Director and Chief Financial Officer required by section 295A of the Corporations Act 2001.
Greg Roebuck Managing Director
Melbourne8 August 2016
CARSALES.COM LIMITED | ANNUAL REPORT | 30 JUNE 2016 | 93
For
per
sona
l use
onl
y
INDEPENDENT AUDITOR’S REPORT TO THE MEMBERSCARSALES.COM LTD
PricewaterhouseCoopers, ABN 52 780 433 757Freshwater Place, 2 Southbank Boulevard, SOUTHBANK VIC 3006, GPO Box 1331, MELBOURNE VIC 3001 T: 61 3 8603 1000, F: 61 3 8603 1999, www.pwc.com.au
Liability limited by a scheme approved under Professional Standards Legislation.
Independent auditor’s report to the members ofcarsales.com Ltd
Report on the financial report We have audited the accompanying financial report of carsales.com Ltd (the company), which comprises the consolidated statement of financial position as at 30 June 2016, the consolidated statement of comprehensive income, consolidated statement of changes in equity and consolidated statement of cash flows for the year ended on that date, a summary of significant accounting policies, other explanatory notes and the directors’ declaration for carsales.com Ltd (the consolidated entity). The consolidated entity comprises the company and the entities it controlled at year’s end or from time to time during the financial year.
Directors' responsibility for the financial report The directors of the company are responsible for the preparation of the financial report that gives a true and fair view in accordance with Australian Accounting Standards and the Corporations Act 2001and for such internal control as the directors determine is necessary to enable the preparation of the financial report that is free from material misstatement, whether due to fraud or error. In the basis of preparation section, the directors also state, in accordance with Accounting Standard AASB 101 Presentation of Financial Statements, that the financial statements comply with International Financial Reporting Standards.
Auditor’s responsibility Our responsibility is to express an opinion on the financial report based on our audit. We conducted our audit in accordance with Australian Auditing Standards. Those standards require that we comply with relevant ethical requirements relating to audit engagements and plan and perform the audit to obtain reasonable assurance whether the financial report is free from material misstatement.
An audit involves performing procedures to obtain audit evidence about the amounts and disclosures in the financial report. The procedures selected depend on the auditor’s judgement, including the assessment of the risks of material misstatement of the financial report, whether due to fraud or error. In making those risk assessments, the auditor considers internal control relevant to the consolidated entity’s preparation and fair presentation of the financial report in order to design audit procedures that are appropriate in the circumstances, but not for the purpose of expressing an opinion on the effectiveness of the entity’s internal control. An audit also includes evaluating the appropriateness of accounting policies used and the reasonableness of accounting estimates made by the directors, as well as evaluating the overall presentation of the financial report.
We believe that the audit evidence we have obtained is sufficient and appropriate to provide a basis for our audit opinion.
IndependenceIn conducting our audit, we have complied with the independence requirements of the CorporationsAct 2001.
94 | CARSALES.COM LIMITED | ANNUAL REPORT | 30 JUNE 2016
For
per
sona
l use
onl
y

Auditor’s opinion In our opinion:
1. the financial report of carsales.com Ltd is in accordance with the Corporations Act 2001,including:
i. giving a true and fair view of the consolidated entity's financial position as at30 June 2016 and of its performance for the year ended on that date; and
ii. complying with Australian Accounting Standards and the Corporations Regulations2001.
2. the financial report and notes also comply with International Financial Reporting Standards asdisclosed in the basis of preparation section.
Report on the Remuneration Report We have audited the remuneration report included in pages 28 to 46 of the directors’ report for the year ended 30 June 2016. The directors of the company are responsible for the preparation and presentation of the remuneration report in accordance with section 300A of the Corporations Act 2001. Our responsibility is to express an opinion on the remuneration report, based on our audit conducted in accordance with Australian Auditing Standards.
Auditor’s opinion In our opinion, the remuneration report of carsales.com Ltd for the year ended 30 June 2016 complies with section 300A of the Corporations Act 2001.
PricewaterhouseCoopers
Anton Linschoten MelbournePartner 8 August 2016
CARSALES.COM LIMITED | ANNUAL REPORT | 30 JUNE 2016 | 95
For
per
sona
l use
onl
y

SHAREHOLDER INFORMATION30 JUNE 2016
The shareholder information set out below was applicable as at 13 July 2016.
A. Distribution of equity securities
Class of equity securityOrdinary shares
Holding Shares
Options and performance
rights
Redeemable preference
sharesConvertible
notes1 – 1,000 10,138 7 - -1,001 – 5,000 6,509 37 - -5,001 – 10,000 863 16 - -10,001 – 100,000 496 27 - -100,001 and over 80 5 - - 18,086 92 - -
There were 220 holders of less than a marketable parcel of ordinary shares.
96 | CARSALES.COM LIMITED | ANNUAL REPORT | 30 JUNE 2016
For
per
sona
l use
onl
y

B. Equity security holders
Twenty largest quoted equity security holdersThe names of the twenty largest holders of quoted equity securities are listed below:
Ordinary shares
Name Number heldPercentage of issued shares
HSBC Custody Nominees (Australia) Limited 58,868,688 24.4J P Morgan Nominees Australia Limited 35,265,097 14.6National Nominees Limited 17,228,358 7.1Citicorp Nominees Pty Limited 15,305,873 6.3Clear-Way Investments Pty Ltd <The James Family A/C> 14,493,662 6.0BNP Paribas Noms Pty Ltd <DRP> 11,728,530 4.9RBC Investor Services Australia Nominees Pty Limited <BKCUST A/C> 5,727,724 2.4BNP Paribas Nominees Pty Ltd <Agency Lending DRP A/C> 5,454,594 2.3AMP Life Limited 4,129,804 1.7Essena Pty Ltd 3,281,284 1.4Four Us Pty Ltd 2,926,555 1.2Steven Kloss Pty Ltd <Kloss Family A/C> 2,482,000 1.0Billkaren Pty Ltd <Robinson Family A/C> 2,250,000 0.9Gregory Paul Roebuck 1,605,347 0.7Kilienz Pty Ltd <PW & AE Aitken Family A/C> 1,400,000 0.6Citicorp Nominees Pty Limited <Colonial First State INV A/C> 1,219,542 0.5Mr Andrew Gajtan Curmi 1,160,500 0.5HSBC Custody Nominees (Australia) Limited <NT-COMNWLTH Super Corp A/C> 1,030,655 0.4Mrs Anne Beirne 1,000,000 0.4Milton Corporation Limited 920,000 0.4
187,478,213 77.7
Number on issue
Number of holders
Options and performance rights issued under the carsales.com Ltd Employee Option Plan to take up ordinary shares 2,760,222 92
CARSALES.COM LIMITED | ANNUAL REPORT | 30 JUNE 2016 | 97
For
per
sona
l use
onl
y

SHAREHOLDER INFORMATION CONTINUED30 JUNE 2016
C. Substantial holdersSubstantial holders in the Company are set out below: Number held PercentageThe Goldman Sachs Group, Inc 20,002,348 8.3Hyperion Asset Management 14,632,099 6.1JCP Investment Partners 12,430,946 5.2
D. Voting rightsThe voting rights attaching to each class of equity securities are set out below:
(a) Ordinary sharesOn a show of hands every member present at a meeting in person or by proxy shall have one vote and upon a poll each share shall have one vote.
(b) OptionsNo voting rights.
98 | CARSALES.COM LIMITED | ANNUAL REPORT | 30 JUNE 2016
For
per
sona
l use
onl
y

DirectorsJeffrey Browne(Non Executive Chair) (from 27.8.15) (Non Executive Director to 24.8.15)
Wal Pisciotta OAM(Non Executive Director) (Non Executive Chair – to 27.8.15)
Greg Roebuck(Managing Director)
Richard Collins(Non Executive Deputy Chair)
Pat O’Sullivan(Non Executive Director)
Kim Anderson(Non Executive Director)
Edwina Gilbert(Non Executive Director) (from 27.4.16)
Steve Kloss(Alternate Non Executive Director)
Company secretaryNicole Birman
Registered officeLevel 4, 449 Punt Road Richmond Vic 3121 T +61 3 9093 8600 F +61 3 9093 8697 carsales.com.au
Share registryComputershare Ltd 452 Johnston Street Abbotsford Vic 3067 T +61 3 9415 4000 F +61 3 9473 2500 computershare.com
External auditorPricewaterhouseCoopers Freshwater Place 2 Southbank Boulevard Southbank Vic 3006
Stock exchangecarsales.com Ltd is a public company listed with the Australian Securities Exchange Limited
ASX: CAR
CORPORATE DIRECTORY
CARSALES.COM LIMITED | ANNUAL REPORT | 30 JUNE 2016 | 99
For
per
sona
l use
onl
y

For
per
sona
l use
onl
y