Embed Size (px)
Citation preview

ANNUAL REPORT
For
per
sona
l use
onl
y

316,000PEOPLE PAidby AURiONiN 2014
20 000
AssEssmENTscONdUcTEd by ViViR
PATiENTsERVicEd
9 miLLiONhOTEL ROOms
by Ahs
mEThOdOLOgy
UNiqUEbEsTFiT™
hOURs wORkEd
EAch wEEk
>300,000
PROdUcTs & TEchNOLOgiEs
AUsTRALAsiA’s LEAdiNg PROVidER OF iNTEgRATEd hR sERVicEs,
TEAms ANd
55 yEAR hERiTAgEUNLEAshiNgThE POTENTiALOF iNdiVidUALs,
ORgANisATiONs
EmPLOyEEs
cLiENT siTEs
iN cmg OFFicEs
+1,100
ANd >20,000
wORkiNg ON
EmPLOyEEs REVENUE$1.4 b
AcROss 8 cOUNTRiEs40+ OFFicEs
by cmgcONTRAcTORs
For
per
sona
l use
onl
y

1Chandler Macleod Group Limited Annual Report 2014
contents
02 Chairman’s Report
04 Managing Director’s Report
06 Corporate Governance Statement
09 Diversity
10 Directors’ Report
27 Auditor’s Independence Declaration
28 Consolidated Statement of profit and loss and other Comprehensive Income
29 Consolidated Statement of Financial Position
30 Consolidated Statement of Changes in Equity
32 Consolidated Statement of Cash Flows
33 Notes to the Financial Statements
80 Directors’ Declaration
81 Independent Auditor’s Report
82 Other Shareholder Information
83 Corporate Information
For
per
sona
l use
onl
y
2 Chandler Macleod Group Limited Annual Report 2014
2014 was a year of two halves for Chandler Macleod. The first half was impacted by tough economic conditions, low business confidence around the federal election, and a reduction in demand as customers delayed hiring decisions and focused on costs. The second half saw a slight improvement in business confidence and a steady recovery in demand for our services. Our strong performance in Safety and Risk Management continued throughout the year.
FiNANciAL REsULTsReflecting the difficult trading conditions, Chandler Macleod’s underlying Net Profit After Tax for 2014 was down 22% to $14.2 million, with underlying EBITDA down 11% to $40.2 million. It is worth noting the momentum in our second half results with underlying NPAT up 33% and underlying EBITDA up 15% on the first half results. Reflecting our commitment to manage the company balance sheet efficiently and provide the flexibility to fund future growth opportunities, we announced our intention to undertake an on-market share buy-back of up to five per cent of the company’s ordinary shares. The Board has declared a fully franked final dividend of 1.8 cents per share consistent with 2013, but has suspended the Dividend Reinvestment Plan.
Chandler Macleod’s balance sheet remains strong, with excellent operating cashflow at $36 million. This year we reduced our debt by $25 million with a debt : EBITDA ratio of 2.2 times, which positions us well for future growth. The Group continued our cost reduction program throughout the year. Excluding the impact of the Vivir acquisition, costs were down 9% or $14.6 million. Interest expense for the year remained steady at $8.5 million, with the full year interest expense associated with the Vivir acquisition offset by reduced debt from the capital raising. We have also negotiated new banking arrangements with HSBC and Westpac which will deliver more efficient funding and lower our interest costs substantially in 2015.
diVERsiFicATiON sTRATEgyOver the last 12 months, we have continued our strategy to diversify our business. We now have a well-diversified customer base and importantly, are no longer over-exposed to any one sector of the economy. Mining still comprises 15% of our business, but the Government sector now represents 17% of our business with an increase in activity across all levels of government and across most of our businesses. We have seen substantial growth in the Health & Pharmaceutical sector from 3.2% to 8.7% in 2014, as a result of the strength and performance of the Vivir business which extended its national footprint to open 19 new sites across NSW/ACT. Similarly we are seeing strong growth in Hospitality, as a result of
chairman’s Report
For
per
sona
l use
onl
y

3Chandler Macleod Group Limited Annual Report 2014
the contribution from AHS which achieved a 13% increase in hotel rooms serviced across Australia and New Zealand. Pleasingly, the sectors where we are most strongly represented are also those where we believe we have the largest potential for growth.
Internationally, Chandler Macleod’s businesses contributed an EBITDA of $1.9 million last year, down from $2.3 million. In New Zealand, Grafton Consulting which delivers a broad range of HR consulting services has exceeded expectations. Whilst difficult trading conditions across the Asian business have resulted in a decline across these geographies, Cornerstone Global Partners in China (where we have a 40% stake in the business) is also exceeding expectations.
Our results during 2014 and our strong second half are a direct result of our decision to diversify our earnings and change our business mix by reducing our reliance on permanent recruitment revenue and lower margin contracting and growing the Managed Services and Specialist Products businesses.
OUR bOARdChandler Macleod’s achievements and market success would not be possible without the ongoing commitment of our Board members who generously share their experience, wisdom and time to ensure that we are well positioned to achieve our growth aspirations and vision to be the leading provider of HR services in Australasia. I would like to take this opportunity to sincerely thank Jack Cowin, Mark Carnegie, Elizabeth Crouch and John Plummer for their ongoing contribution and support.
ThE yEAR AhEAdWhilst not quite back at the levels we have seen previously, business confidence is improving and we are looking forward to 2015 with renewed confidence. Our second half result was considerably stronger than our first half result and this gives us momentum going into the new financial year. We are also pleased to see contract hours back at the prior corresponding period, and July results well up compared with July last year, which is a positive start to 2015.
Staffing Services is starting to see increasing demand, and we have a strong pipeline of business opportunities, particularly in Aurion, AHS and Vivir. We will continue to focus on changing the business mix, diversifying our earnings, and expanding our business offshore to pursue growth opportunities and improve the long-term sustainability of our business.
ThANk yOUOn behalf of the Board I would like to thank Cameron and the Chandler Macleod Group leadership team for their steadfast dedication and performance in another challenging year. Our sincere thanks also go to all Chandler Macleod Group employees throughout Australia, New Zealand, UK, Ireland, China, Hong Kong, Singapore and Indonesia for their ongoing commitment, dedication and hard work.
Richard England
Chairman
For
per
sona
l use
onl
y
4 Chandler Macleod Group Limited Annual Report 2014
managing director’s Report
Chandler Macleod Group delivered a full year result of $40.2 million underlying EBITDA in challenging circumstances. Our first half results reflected the economic conditions preceding and following the federal election, lower business confidence and lower activity levels in the mining sector. This led to reduced demand for our products and services as clients delayed hiring staff and other key business decisions. Our second half results were stronger than the first half and we have momentum going into 2015. Business confidence is improving, our contract hours are back at the prior corresponding period, we have seen a steady recovery in demand for Staffing Services, and have a strong pipeline of new business opportunities in AHS, Vivir and Aurion.
sAFETy PERFORmANcEI am particularly proud of our Safety leadership and culture. We have improved the Total Recordable Injury Frequency Rate (TRIFR) for the Group by 40% in 36 months, and embedded safety leadership, culture and behaviours across the organisation and at our client sites. This year we achieved OHSAS 18001 and AS/NZ 4801 accreditation, and were awarded the RCSA McLean Award for Workplace Safety as an industry leader in safety.
Our commitment to the health, safety and wellbeing of our people is ongoing, and we have extended the Group’s Life Saving Commitments to all our employees, as we continue to invest in safety leadership programs and other initiatives to keep our employees safe and injury free. We recently established the Safety Centre of Excellence, which will leverage our extensive safety leadership research and experience to help our clients build strong and mature safety cultures.
sTRATEgy UPdATEWe continue to progress our strategy to diversify our earnings and build Australasia’s leading HR services business. We have now moved beyond our Five Pillar Foundations to a new phase of Enhancing Capability with clear priorities to continue to improve and optimise each of our business segments and accelerate the growth of Managed Services and Specialist Products.
In the last year, Vivir has expanded into the NSW and ACT markets, AHS has continued to grow in Australia and New Zealand, and Consulting has restructured around Centres of Excellence in Culture, Safety, Career Transition, Assessment and Indigenous Employment to improve operational efficiencies and enhance their ability to cross-sell across the Group. Aurion has been restructured to better meet the needs of the market, with a shift in focus from software to Business Process Outsourcing and the commencement of
a significant three year investment in core software, including mobile enabled software.
In Staffing Services our continued focus on growing new products and services has been progressing well, with five new pre-employment medical centres open around the country. We have ramped up our Customer Focus Strategy with development of a new management information system, which has provided insights and data to help us to refine our account management and client servicing processes, leading to increased client loyalty and satisfaction.
Over the last 12 months, we have seen significant changes in the diversification of our client base. Whilst there has been reduced demand from the mining and resources sector impacting margin contribution, we have also seen an increase in activity across all levels of Government – local, state and federal, and strong growth in Hospitality and Health as a result of the contribution from AHS and Vivir.
Our continued emphasis on productivity and efficiency, and reducing costs has contributed to our result this year delivering $14.6 million in cost savings, excluding the Vivir acquisition. Streamlining our structure to meet the future needs of our business, improved systems and technology enhancements, and a continued focus on process re-engineering will continue to deliver cost savings throughout 2015 and 2016.
For
per
sona
l use
onl
y

5Chandler Macleod Group Limited Annual Report 2014
The performance of our International offices was slightly down on last year with difficult trading conditions experienced in Asia and New Zealand. Cornerstone Global Partners in China and Grafton Consulting in New Zealand delivered strong results this year. We are well positioned to leverage our international network, and capitalise on future opportunities to extend the reach of Chandler Macleod’s products and services.
OUR REsULTsAmidst tough trading conditions, Chandler Macleod has delivered a full year result of $40.2m underlying EBITDA, with a second half performance much stronger than the first half. Revenue fell 6% from $1.5 billion to $1.4 billion across the full year and the Group reported Net Profit After Tax of $13.5 million for the year, up 26% over the prior corresponding period, although the underlying NPAT of $14.2 million was 22% lower than the prior year. The strength of our second half result is evidenced by underlying EBITDA of $21.5 million and underlying NPAT of $8.1 million which were up 15% and 33% respectively over the first half. It is particularly pleasing to have achieved this strong second half result, given the conclusion of the Qantas contract at Avalon and the impact of seasonality in Staffing Services.
sTAFFiNg sERVicEsStaffing Services reported an EBITDA of $39 million before corporate overheads for the year, down 19% from 2013. This result is attributable to reduced contract hours and lower margins, and lower permanent recruitment activity in most sectors although there were signs of increased activity during the latter part of the year. Conditions in Western Australia saw a large fall in volumes, particularly in mining, although this was offset by some large projects, while volumes in Victoria decreased in the white collar sectors. The decline in revenue was partially offset by cost reductions associated with productivity and efficiency initiatives implemented during the year.
mANAgEd sERVicEsManaged Services reported an EBITDA of $19.4 million before corporate overheads compared to $17.9 million in the prior period. The full year contribution from Vivir, together with growth in AHS, was partially offset by the run off of the Qantas Avalon contract and another large BPO contract. Cost synergies were also achieved through the realignment of the management structure and integration of AHS and Vivir back office functions.
sPEciALisT PROdUcTsSpecialist Products reported an EBITDA of $6.8 million before corporate overheads, in line with the prior year result. Strong growth in Aurion as a result of increased revenue and cost reduction was offset by lower demand for Consulting products, particularly assessment and development products.
iNTERNATiONALChandler Macleod’s International businesses contributed an EBITDA of $1.9 million compared to $2.3 million in the prior year. The New Zealand result benefited from the addition of Grafton Consulting, while difficult trading conditions across the Asian businesses saw declines in all those geographies.
OUTLOOkThere has been a gradual improvement in business confidence although there remains fluctuations across sectors and geographies. In the first half of 2015, we expect continued pressure on margins and reduced demand across the mining sector to continue. On a positive note, we experienced a stronger second half, which gives us confidence moving into 2015. Contract hours in the Staffing Services business have returned to prior year levels and we anticipate this will continue. Our July results were up against prior comparison period, AHS, Vivir and Aurion continue to grow and have strong pipelines. We are continuing to re-engineer the Staffing Services business and have further productivity and efficiency initiatives planned which will
deliver improvements and cost savings over the course of 2015 and 2016. Our new banking arrangements will deliver improved funding costs and operating cashflow in 2015 is expected to remain strong. The market is still going to be challenging, but I am confident that the improvement we have seen in the second half of 2014 will continue into the new financial year and beyond.
ThANk yOU2014 has been particularly challenging. Notwithstanding this, we have made significant progress in our strategy to diversify our earnings and build Australasia’s leading HR services business.
The success of Chandler Macleod Group is all about people. We are a people business. As individuals, as team members, and as a Group, our staff support 20,000 employees working across 3000 client sites across 8 countries everyday. On behalf of the Executive Leadership Team, I would like to extend you our sincere thanks and appreciation for you contribution to Chandler Macleod Group in FY14. I look forward to you sharing in our ongoing success in the future.
cameron JudsonManaging Director & CEO
For
per
sona
l use
onl
y

6 Chandler Macleod Group Limited Annual Report 2014
corporate governance statement
Since the introduction of the ASX Corporate Governance Council’s Principles of Good Corporate Governance and Best Practice recommendation and the revised 2nd Edition of the ASX Principles and Recommendations (the “ASX Principles and Recommendations”) Chandler Macleod Group Limited (the “Company”) has developed and enhanced its systems of control and accountability in line with ASX good governance principles.
The Company has previously adopted, and continues to apply, the revised ASX Principles and Recommendations in relation to the 2013-2014 Financial Year. The Board has assessed each Recommendation in light of all salient factors, including the size of the CMG business and the resources available to the Company, the nature and scope of its operations, the composition and structure of the Board, and the interests of the Company’s shareholders.
As a result of this continuing (and ongoing) assessment, the Company has complied with each Recommendation that the Board considers to be an appropriate benchmark for corporate governance practice. Where the Company’s corporate governance practices depart from the ASX Principles and Recommendations, the Board has offered full disclosure on the nature of, and reason for, the adoption of its own practices.
Further details relating to the Company’s corporate governance practices are available to the public in the Corporate Governance section of the Company’s website (www.chandlermacleod.com). The Company publishes on its website all information required under the ASX Principles and Recommendations, including the Charters of its Board and each of its relevant sub-committees, the Company’s Code of Conduct, and other relevant policies relating to the Board and its corporate governance procedures and responsibilities.
The Company is currently reviewing its corporate governance practices in light of the recent release of the 3rd Edition of the ASX Principles and Recommendations and will, as required report in its compliance with the updated edition in next years Annual Report.
PRiNciPLE 1 – LAy sOLid FOUNdATiONs FOR mANAgEmENT ANd OVERsighTThe Charter of the Company’s Board and the Company’s Delegated Authority Policy are available to the public in the Corporate Governance section of the Company’s website (www.chandlermacleod.com). Those documents set out the functions reserved to the Board and those delegated to the Managing Director. Performance evaluation of senior executives has taken place during the reporting period. The performance of each senior executive was reviewed against specific and measurable qualitative and quantitative performance evaluation criteria including:
� financial measures;
� development and achievement of strategic objectives;
� development of management and staff; and
� achievement of key performance indicators, including safety.
PRiNciPLE 2 - sTRUcTURE ThE bOARd TO Add VALUEA formal review of the Board, its committees and each of the individual directors is undertaken by the Chairman during the reporting period to provide relevant feedback to the ongoing value of the Board and the Directors and to ensure that the appropriate balance of experience is maintained to the Board and the respective Committees.
A review of the Board, its committees and each of the individual directors by the Chairman has taken place during the reporting period in accordance with this procedure.
The Chairman undertakes an annual formal review of the Board, including with respect to reporting period, and has sought independent external advice on an appropriate review framework, in order to provide relevant feedback as to the ongoing value of the Board and the Directors and to ensure that the appropriate balance of skills and experience is maintained by the Board and the respective Committees. Feedback is also provided routinely to individual Board members.
The Company does not have a discrete nomination committee. However, the functions of such a committee are performed by the Remuneration and Nomination Committee. The responsibilities of the Remuneration and Nomination Committee include:
� identifying appropriately qualified and/or experienced individuals to become Directors of the Company and to recommend candidates to the Board;
� reviewing performance of the Directors as members of the Board when requested to do so by the Board; and
� identifying appropriate Directors to fill vacancies on any committee when requested by the Board.
The membership and attendance details of the Remuneration and Nomination Committee are set out in the following table:
meetings
member held Attended
Mr. Richard England 7 7
Ms. Elizabeth Crouch 7 7
Mr. Jack Cowin 7 6
Mr. Jack Cowin is the Chair of the Remuneration and Nomination Committee. While Mr. Cowin is not an independent director, the Board considers he is the appropriate person to Chair this committee in light of his extensive experience in and understanding of remuneration and nomination matters.
The Charter of the Company’s Remuneration and Nomination Committee is available to the public in the Corporate Governance section of the Company’s website (www.chandlermacleod.com).
For
per
sona
l use
onl
y

7Chandler Macleod Group Limited Annual Report 2014
The current composition of the Company’s Board is set out in the following table, including their term as Directors of the Company as at the date of this report. The name, skills, experience, qualifications and special responsibilities of each Director is set out in the Directors’ Report.
member Term in office
independent
Mr. Richard England 6 years, 5 months
Ms. Elizabeth Crouch 3 years, 5 months
Non-independent
Mr. John Plummer1 9 years, 3 months
Mr. Mark Carnegie2 5 years, 5 months
Mr. Cameron Judson 2 years, 1 month
Mr. Jack Cowin3 3 years, 5 months
1Mr John Plummer is considered to be a Non-Independent Director because he is a substantial shareholder of the company.2Mr Mark Carnegie is considered to be a Non-Independent Director because he is associated directly with a substantial shareholder of the company. 3Mr Jack Cowin is considered to be a Non-Independent Director because he is a substantial shareholder of the company.
In deciding on the independence of each Director, the Board has considered the principles outlined in the ASX Principles and Recommendations.
In terms of deciding on materiality thresholds, the Board has determined that a relationship or interest will be material if it is considered by the Board to impact on the ability of the Director to exercise critical and objective judgement in respect to matters that are brought before the Board. At each meeting the Directors are formally required to advise the Board of any change in their interests.
The Board has had regard to the definition of independence and acknowledges that the current Board structure is inconsistent with best practice recommendation 2.1 of the ASX Principles and Recommendations (the majority of the Board should be independent Directors). However the structure is considered appropriate to the extent and nature of the Company’s operations, allowing for more proactive communication between Directors and highly effective decision making. All Directors have a full understanding and competence to deal with emerging issues of the business. The Non-Executive Directors, effectively review and challenge the performance of management and exercise independent judgement.
Each Director is entitled to take independent professional advice at the expense of the Company, subject to approval of the Chairman.
In addition, each Director can and does individually meet with senior management.
In it’s membership, the Board seeks to achieve a mix of skills and diversity that includes international, corporate management, and operational experience as well as a deep understanding of the HR services industry in which Chandler Macleod operates, and the safety, environmental and community challenges the Company faces.
The Board’s policy and procedure for selecting and appointing new Directors to the Board is that when the Board considers a vacancy exists, the Board asks the Remuneration & Nomination Committee to assist and advise the Board in relation to:
� the identification and review of qualified potential candidates, in light of the skills, experience, expertise and personal qualities that will best complement the Board’s effectiveness and diversity; and
� the capacity of the candidate to devote the necessary time and commitment to the role.
The most suitable candidate is appointed by the Board, which may nominate and appoint Directors to the Board to fill casual vacancies. Directors appointed as casual vacancies hold office until the Company’s next AGM and are then eligible for election.
Under the Constitution of the Company and subject to the ASX Listing Rules, a Director must retire from office by rotation, and will be eligible for re-election, no later than the longer of the third AGM of the Company following that Director’s last election.
PRiNciPLE 3 - PROmOTE EThicAL ANd REsPONsibLE dEcisiON mAkiNgCopies of the Company’s Director and Executive Code of Conduct and Securities Dealing Policy are available to the public in the Corporate Governance section of the Company’s website (www.chandlermacleod.com).
In 2012 the Board approved the Diversity Policy which is being implemented throughout the Company. The Board will set and assess annually a gender diversity objective. Diversity issues are also considered through the Remuneration and Nomination Committee prior to strategies being recommended to the Board. This Committee also reviews the diversity responses of the executive leadership team and the People and Culture Department. A company wide diversity report is provided to the Board annually.
The Company is compliant with the Workplace Gender Equality Act 2012 (Act) for the reporting period 1 April 2013 to 31 March 2014. Currently the Company’s ratios for women are as follows:
� Board – 20%
� CEO – 0%
� Executive Leadership Team – 29%
The Company’s overall ratio for women is 74%.
For
per
sona
l use
onl
y

8 Chandler Macleod Group Limited Annual Report 2014
corporate governance statementcontinued
PRiNciPLE 4 - sAFEgUARd iNTEgRiTy iN FiNANciAL REPORTiNgThe Company’s Audit and Risk Management Committee is responsible for independently verifying and safeguarding the integrity of the Company’s financial reporting.
The membership and attendance details of the Audit and Risk Management Committee are set out in the following table:
meetings
member held Attended
Mr. Richard England 6 6
Ms. Elizabeth Crouch 6 6
Mr. Jack Cowin 6 4
Ms Elizabeth Crouch is the chair of the Company’s Audit and Risk Management Committee.
The Charter of the Company’s Audit and Risk Management Committee is available to the public in the Corporate Governance section of the Company’s website (www.chandlermacleod.com).
PRiNciPLE 5 - mAkE TimELy ANd bALANcEd discLOsUREThe Company’s Continuous Disclosure Policy is available to the public in the Corporate Governance section of the Company’s website (www.chandlermacleod.com).
PRiNciPLE 6 - REsPEcT ThE RighTs OF shAREhOLdERsThe Company’s Communications Policy is available to the public in the Corporate Governance section of the Company’s website (www.chandlermacleod.com).
PRiNciPLE 7 - REcOgNisE ANd mANAgE RiskThe Board requires management to design and implement the risk management and internal control system to manage the Company’s material business risks and report to it on whether those risks are being managed effectively. During the reporting period, the Board received the report from management on the effectiveness of the Company’s management of its material business risks under Recommendation 7.2.
The Company has established a policy for the oversight and management of material business risks. The Company’s Risk Management Policy is available to the public in the Corporate Governance section of the Company’s website (www.chandlermacleod.com).
The Company has adopted an Enterprise Risk Management focus including the identification, monitoring and management of risks associated with its business activities and has embedded in its management and reporting systems appropriate risk management controls. These include:
� a commitment to safety as the Company’s priority, supported by appropriate safety management policies, procedures and systems;
� annual budgeting and monthly reporting systems for all businesses, which enable monitoring of progress against performance targets and the evaluation of trends;
� delegations and limits for approval of operating and capital expenditure;
� business line risk monitoring and reporting tools and protocols, with regular risk monitoring at business, executive and Board level, with oversight via the Company’s Audit & Risk Management Committee; and
� a comprehensive insurance program.
The Board has received the assurance from the Chief Executive Officer and the Chief Financial Officer under Recommendation 7.3, that the declaration provided in accordance with section 295A of the Corporations Act is founded on a sound system of risk management and internal control and that the system is operating effectively in all material respects in relation to financial reporting risks.
PRiNciPLE 8 - REmUNERATE FAiRLy ANd REsPONsibLyThe Company does not have a discrete remuneration committee. However, the functions of such a committee are performed by the Remuneration and Nomination Committee.
The responsibilities of the Remuneration and Nomination Committee are set out in the Remuneration and Nomination Committee Charter. Both the Charter and the Company’s Remuneration Policy are available to the public in the Corporate Governance section of the Company’s website (www.chandlermacleod.com). Details of the Company’s remuneration practices are set out in the section of this Annual Report marked ‘Remuneration Report’.
The Company’s Share Trading Policy prohibits employees from entering into transactions in products which limit the economic risk of participating in unvested entitlements under any equity-based remuneration scheme
The membership and attendance details of the Remuneration and Nomination Committee are set out above in relation to Principle 2.
For
per
sona
l use
onl
y

9Chandler Macleod Group Limited Annual Report 2014
diVERsiTy & iNcLUsiONAt Chandler Macleod we believe that every person, team and organisation has potential, and we are committed to helping them unleash it. We demonstrate this through our policies, practices and programs which promote a culture of diversity and inclusion. The following are the highlights of the initiatives at Chandler Macleod during the reporting period:
� Launch of the Indigenous Employment Centre of Excellence that aims to support our clients to overcome barriers to increasing Indigenous employment.
� Establishment of partnerships with Job Support (jobsupport.org.au) and Options Employment (options.org.au) which enabled CMG to welcome team members with a disability across New South Wales, Victoria and Western Australia.
� Chandler Macleod nominated for the “Improving Employment Opportunities Award” in the 2014 National Disability Awards.
� Improved remuneration framework to enable objective comparison based on merit.
� Continued focus on embedding Performance Planning & Review processes based on the Organisational Scorecard, including our Company Values and Cultural Drivers.
� Framework developed to support objective and merit based talent assessment across all levels of the organisation.
� Increase in female representation on the Executive Leadership Team.
gENdER diVERsiTyThe Company is compliant with the Workplace Gender Equality Act 2012 (Act) for the reporting period from 1 April 2013 to 31 March 2014. A copy of this report is available on our website.
Currently the Company’s ratios for women are as follows:
� Board – 20%
� CEO – 0%
� Executive Leadership Team – 29%
� Other Executive Managers – 23%
� Managers – 57%
� Specialists – 58%
� Team Leaders – 64%
� Team Members – 76%
� Overall Total – 74%
diversity
Board
Managing Director
Executive Leadership Team
Executive Managers
Manager
Specialist
Team Leader
Team Member
Total
Women
Men
20% 40% 60% 80% 100%%
For
per
sona
l use
onl
y
10 Chandler Macleod Group Limited Annual Report 2014
The Board of Directors of Chandler Macleod Group Limited (“the Company”) submit their report in respect of the financial year ended 30 June 2014.
diREcTORsThe names and details of the Directors in office during the financial year to the date of this report are as follows. The Directors were in office for this entire period unless otherwise stated.
Richard England – Non-Executive chairmanFCA, MAICD
Richard England was appointed a Director of the Company on 27 February 2008, and became Chairman on 2 May 2008. Richard is a member of the Audit and Risk Management Committee and the Remuneration and Nomination Committee. Richard brings to the Company over 30 years of experience in the accounting and financial services profession as well as broad management experience.
Until 1994, Richard spent most of his professional career with Peat Marwick and EY and its predecessor firms, first becoming a partner in 1982. He practiced in the areas of Corporate Recovery and Restructuring. Richard is currently Chairman of Ruralco Holdings Limited. He is a Non-Executive Director of Macquarie Atlas Roads Limited, Nanosonics Limited and Japara Healthcare Limited.
John Plummer – Non-Executive deputy chairman Bachelor of Commerce, MBA, FCIS
John Plummer was appointed a Director of the Company on 30 May 2005. From 1 September 2007, John became a Non-Executive Director and a member of the Remuneration and Nomination Committee until May 2011. John was also Chairman of the Audit and Risk Management Committee from April 2009 until May 2011.
John is also a Director of Kinetic Superannuation Limited. John is a past National President of the Recruitment and Consulting Services Association, the peak body of the employment services industry in Australia and New Zealand.
mark carnegie – Non-Executive directorBachelor of Arts, Bachelor of Science, Master of Jurisprudence
Mark Carnegie was appointed a Director of the Company on 6 February 2009. Mark was a member of the Company’s Remuneration and Nomination Committee from February 2009 until May 2011.
Mark has had more than 30 years experience as an entrepreneur, investor and corporate adviser in New York, London and Sydney. He was co-founder of Carnegie, Wylie & Company before the acquisition of that business by Lazard Inc and was previously the CEO of Lazard Australia Private Equity Pty Ltd (formerly LCW Private Equity Pty Ltd), Lazard’s Australian private equity business. Mark established M.H. Carnegie & Co. Pty Ltd in 2010, a venture capital and private equity firm. Mark is a Director of Strike Energy Limited and a large number of private companies.
Jack cowin – Non-Executive directorBachelor of Arts, Doctorate of Laws
Jack Cowin was appointed a Director of the Company on 1 March 2011. On 26 May 2011 Jack was appointed Chair of the Remuneration and Nomination Committee and a member of the Audit and Risk Management Committee.
Jack Cowin is the Founder and Executive Chairman of Competitive Foods Australia Pty Ltd, which owns and operates over 350 fast food restaurants in Australia. It also operates several food manufacturing plants for the supermarket and food service industries, exporting to 29 countries. Jack is Chairman of Domino’s Pizza Enterprises Limited, a Director of Network Ten and a Director of BridgeClimb and was appointed a Director of Fairfax Media Limited on 19 July 2012. He brings significant experience and understanding of the sectors in which Chandler Macleod operates.
Elizabeth crouch – Non-Executive directorBachelor of Economics, FAICD
Elizabeth Crouch was appointed a Director of the Company on 1 March 2011. On 26 May 2011 Elizabeth was appointed Chair of the Audit and Risk Management Committee and a member of the Remuneration and Nomination Committee.
Elizabeth spent 16 years with the Federal Government before moving into the private sector, where she held various positions including the role of Chief Executive of the Housing Industry Association. Elizabeth is Deputy Chancellor of Macquarie University and an Alternative Director of Macquarie University Hospital, Chair of the City of Sydney, Health Infrastructure and Transport audit committees. She is an executive coach and mentor with the Orijen Group and the former Chairman of Railcorp and the Public Transport Ticketing Corporation. She also holds a number of positions with community and sports organizations including as a Director of the North Harbour Rays.
directors’ Report
For
per
sona
l use
onl
y

11Chandler Macleod Group Limited Annual Report 2014
cameron Judson – managing director and cEO Bachelor of Arts, MBA (Executive)
Cameron Judson was appointed CEO and Managing Director of the Company on 2 July 2012.
As CEO and Managing Director of Chandler Macleod Group Limited, Cameron is responsible for delivering sustainable profitable growth, improving operational performance and driving innovation and change. With Chandler Macleod since 2005, Cameron held strategic roles as Director Workforce Services, Director of Business Services, Executive General Manager Client Services and Regional General Manager NSW before his appointment as Chief Operating Officer in 2010. As Chief Operating Officer, he was instrumental in developing and executing the Group’s strategy.
Before joining Chandler Macleod, Cameron held senior positions within Chubb and TNT, companies with international operations delivering services to most major vertical markets.
gareth young – Alternate Non-Executive director to mr carnegie (resigned 25 July 2013)Bachelor of Science in Economics
Gareth Young was appointed as the Alternate Non-Executive Director to Mark Carnegie on 31 January 2013.
Gareth is a Director and a member of the investment committee at Lazard Australia Private Equity (“LAPE”). Prior to joining LAPE in August 2011, Gareth spent seven years with ISIS Equity Partners, a private equity firm based in London, as a member of their investment team where he successfully led and supported a number of new investments, recapitalisations, refinancing events, restructuring events and exits. Gareth’s experience also includes periods in the corporate restructuring divisions of Arthur Andersen and EY in London.
cOmPANy sEcRETARiEsThe qualifications and experience of the Company Secretaries in office at the end of the financial year are as follows:
morgan sloperMLM, BALLB (Hons), GdipLegalPrac
Morgan Sloper is Chandler Macleod’s Chief Legal & Risk Officer and was appointed Company Secretary on 31 January 2013. Leading the Legal, Risk and Safety functions for the Group, Morgan supports the achievement of Chandler Macleod’s strategy, through the provision of valued legal and risk advice and guidance, to ensure the organisation effectively manages its regulatory requirements and commercial risks. Morgan re-joined Chandler Macleod in 2013, having previously held the role of General Counsel and Company Secretary at Chandler Macleod between 2007 and 2008.
Morgan brings over 15 years of legal and risk management experience from across Australia, the USA and Asia, and having worked for several leading organisations including Brightpoint, Quiksilver and Optus.
gregory coolahanDip Law (SAB)
Greg Coolahan, the Company’s Group Legal Counsel, was appointed Company Secretary on 17 April 2011.
As Group Legal Counsel, Greg is responsible for contract and tender reviews, commercial and corporate legal advice, insurance maintenance and renewal, and general legal advice, services and training. Greg was formerly Commercial and Legal Director at Ross Human Directions prior to its acquisition by the Company. He previously held a senior legal and commercial role within Otis Elevator Company (Australia and International).
Owen wilsonBachelor of Commerce, ACA
Owen Wilson, the Company’s Chief Financial Officer, was appointed Company Secretary on 9 April 2009. He provided notice of resignation of his position on 3 June 2014 and left the Company in September 2014.
Owen joined the Company following a 15 year career with the ANZ Banking Group during which he held various finance roles culminating in the role of Chief Financial Officer of the Institutional Division of ANZ. Owen was responsible for ANZ’s international partnership business in Asia where he oversaw their investments in numerous banks and credit card businesses across the region. He was a director of numerous companies in Australia and Asia including ANZ Royal Bank in Cambodia and the listed AmBank Group in Malaysia.
Prior to joining ANZ, Owen had a successful career with KPMG in Melbourne and London. He has excellent experience with high end relationship businesses through his work in Institutional Banking and he has managed high volume low margin operations in his previous role.
For
per
sona
l use
onl
y
12 Chandler Macleod Group Limited Annual Report 2014
cORPORATE sTRUcTUREThe Company is a company limited by shares that is incorporated and domiciled in Australia. The Company has prepared a consolidated financial report incorporating the entities that it controlled during the financial year.
PRiNciPAL AcTiViTiEsThe principal activities of the Company and its controlled entities (“the Group”) during the financial year were Staffing Services, Managed Services and Specialist Products.
OPERATiONs ANd FiNANciAL REViEw
OperationsDuring the year the Group offered temporary and permanent recruitment services in Australia and Internationally. The Group provided a range of managed services to help clients reduce risk and improve productivity. In addition, the Group offered specialist products and services in relation to consulting and assessment as well as payroll and HR information systems.
Since it was founded in 1959, Chandler Macleod has earned its place as a market leader in human resources services. Through building on our proven track record of unleashing potential in people and businesses, 55 years on we have diversified to provide products and services to some of Australia’s largest companies and organisations, including 60% of the ASX Top 100.
Chandler Macleod works with individuals and organisations to plan, source, assess, develop and manage their people to deliver productivity and new opportunities where they may not have been possible before. Our team of more than 1,100 internal employees and around 20,000 employees working on client sites during the year makes Chandler Macleod one of the largest employers in our region.
Chandler Macleod maintains a delivery infrastructure across Australia, New Zealand, Asia, the UK and Ireland providing national, regional, and locally-focused client management. We operate a 24 hours a day, 7 days a week service, and can draw from our database of more than half a million qualified candidates who are actively seeking opportunities.
The Group results for the year include the full year impact of Vivir Healthcare Pty Ltd (“Vivir”). Since joining the Group on 5 December 2012, Vivir has performed in line with expectations and has reinforced the strategic direction to change the business mix.
Revenue for the year was $1,413 million, a decrease of 6% over last year. This is due to a fall in contractor hours worked, margin reduction and a continuation of the slowdown in permanent recruitment activity. A drop in demand in Western Australia has added to the softness in the east coast states across many sectors of the economy.
Offsetting the underlying fall in revenue, underlying expenses were reduced by 7%. Excluding acquisitions the reduction was 9%. A restructuring charge for the year of $4.2 million was booked relating to redundancy and property rationalisation costs.
In December 2013 the Group completed a capital raising for $24.7 million that resulted in reduced debt levels at year end. Net interest expense for the year was $8.5 million in line with the prior year. The increased interest expense associated with the Vivir acquisition was largely offset by the impact of interest rate reductions and lower debt levels from the capital raising.
Chandler Macleod’s ongoing commitment to safety and wellbeing resulted in a 10% reduction in the Group’s Total Recordable Injury Frequency Rate. In May, the Group was awarded the Recruitment and Consulting Services Association’s McLean Award for Workplace Safety, which is a testament to Chandler Macleod’s continued focus and efforts to reduce injury frequency, severity and costs. The Group has developed a strong safety leadership and culture, striving for best case safety outcomes by assessing and controlling all high risk activities and continuing to invest in safety leadership programs.
In December 2012 Chandler Macleod acquired the Vivir business. At the time of acquisition the potential earn out was recorded as a liability at fair value. In accordance with accounting standards, movement in the fair value of the liability is recorded in the Statement of Comprehensive Income. In the prior year the original fair value of $4.6 million was reduced to $2.4 million due to post acquisition changes to the underlying assumptions. In the current year a further reassessment of the underlying assumptions has resulted in the earn out liability being reduced to nil and a further $2.8 million fair value adjustment has been included in the Statement of Comprehensive Income.
In July 2013 Chandler Macleod acquired a 40% interest in Cornerstone Global Partners Limited, a recruitment solutions business with offices in Beijing and Shanghai. In August 2013 the Group acquired a 73.7% stake in Grafton Consulting Limited, a New Zealand based company that provides a broad range of human resource consulting services. Both acquisitions are performing above expectations and are increasing the geographic spread of Chandler Macleod services.
staffing services reported an EBITDA of $39.0 million before corporate overheads for the year, down 19% from the prior year. Reduced contract labour hours and lower margins, and lower permanent recruitment activity in most sectors contributed to the result. Conditions in Western Australia saw a large fall in volumes, particularly in mining. The drop in revenue was partially offset by cost reductions achieved during the period.
directors’ Reportcontinued
For
per
sona
l use
onl
y

13Chandler Macleod Group Limited Annual Report 2014
managed services reported an EBITDA of $19.4 million before corporate overheads compared to $17.9 million in the prior period. The full year contribution from Vivir, together with growth in AHS, was partially offset by the run off of the Qantas Avalon contract and another large BPO contract.
specialist Products reported an EBITDA of $6.8 million before corporate overheads, in line with the prior year result. Strong growth in Aurion was offset by lower demand for Consulting products, particularly assessment and development products. The Consulting business has undertaken significant restructuring and reduced its cost base in line with the drop in revenue.
The international businesses contributed an EBITDA of $1.9 million compared to $2.3 million in the prior year. The New Zealand result benefited from the addition of Grafton Consulting, while difficult trading conditions across the Asian businesses saw declines in all those geographies.
The results are:
30 June 2014 30 June 2013^
$000 $000
Revenue 1,413,197 1,503,909
EBITDA* before restructuring, fair value adjustment to contingent consideration, acquisition and related transaction costs 40,196 45,253
Restructuring costs (4,252) (7,333)
Fair value adjustment to contingent consideration 2,775 1,800
Acquisition and related transaction costs (565) (1,630)
EBITDA 38,154 38,090
Net profit after tax before restructuring, fair value adjustment to contingent consideration, impairment of intangibles, acquisition and related transaction costs 14,207 18,251
Restructuring costs after tax (2,991) (5,133)
Fair value adjustment to contingent consideration 2,775 1,800
Impairment of intangibles - (2,700)
Acquisition and related transaction costs after tax (522) (1,510)
Net profit for the period 13,469 10,708
*Earnings before interest, tax, depreciation and amortisation
^30 June 2013 balances have been restated (Note 5b & Note 23d).
Financial PositionThe Board has declared a fully franked final dividend of 1.8 cents per share (2013: 1.8 cents per share). The Company’s Dividend Reinvestment Plan (“DRP”) has been suspended by the Board.
The capital raising in December 2013 and improved working capital management together contributed to a reduction in net debt to $88 million at 30 June 2014. Gearing has fallen to 32%. Interest expense for the year was $8.5 million in line with the prior year. The full year interest expense associated with the Vivir acquisition was more than offset by reduced debt levels.
The Group has negotiated new banking arrangements with Westpac and HSBC. These arrangements will allow for more efficient management of funding resulting in lower funding costs in 2015.
During the period the Group had banking facilities totalling $268.4 million, of which $178.7 million was utilised at year end. The group operated within its loan covenants throughout the year.
The operating cash flow before interest, restructuring costs and acquisition related transaction costs was $36 million. This outcome exceeded previous expectations due to strong cash collections and working capital management.
directors’ Reportcontinued
For
per
sona
l use
onl
y

14 Chandler Macleod Group Limited Annual Report 2014
OPERATiONs ANd FiNANciAL REViEw (CONTINUED)
strategy and OutlookThe Group’s strategy is built around the following 5 pillars:
1. change the business mix: Increase our profit margins by focusing on growth in higher margin products, sectors and skills and selectively adding new products and services to our offering.
The AHS and Vivir businesses continue to deliver in line with expectations and increase the contribution of non-recruitment revenue to the Group. This has helped the Group to maintain EBITDA margins, particularly in the second half of the year, despite margin pressures in other parts of the business. The Group is also increasing its investment in the Aurion business to better position it for the significant growth phase that is already being seen in current pipeline activity.
2. Organise around the client: Maximise our relationships with clients by aligning our structure, account management, sales and marketing practices to reflect a single view of our clients. On the back of the rollout of the new Business Intelligence tool, account management and client servicing processes are being refined.
3. improve Productivity and Efficiency:During the year operating expenses (excluding the impact of acquisitions) decreased by 9% or $14.6 million. A number of group projects are underway to improve productivity and efficiency including a core system upgrade, development of a candidate portal, further centralisation of back office activities where appropriate and the continued development and rollout of the Business Intelligence system to encompass whole of Group. This includes tiered servicing levels, clearly defined client servicing points and centralisation of certain processes into centres of excellence to improve customer service levels.
There has also been a reduction in premises costs as properties continue to be rationalised across the Group – 11 properties were exited during 2014.
4. build our international Network:Focus on leveraging our network of businesses across Australia, New Zealand, Asia, UK and Ireland to grow organically with a view to identifying opportunities that will support building scale in our international network.
The Grafton (NZ) and Cornerstone (China) acquisitions are performing ahead of expectations and have helped to offset the reduction in perm activity experienced across most geographies. 2014 has seen a strengthening of the management team across the International network.
5. Enhance Risk management:Enhance our risk management by having a clear approach to identifying and managing risks to achieve sustainable returns for shareholders, clients and our people.
During the course of the year, the Group’s Risk Management Policy and Framework has been implemented at the project, business unit, divisional and departmental level. The Policy and Framework describes and informs a proactive, structured and integrated approach to risk identification, analysis, evaluation, treatment and reporting. Key risks and issues, and the corresponding mitigation strategies, are reported and discussed on a monthly basis by the Executive Risk Management Committee, with direct oversight from the Group’s Chief Executive Officer, the Audit and Risk Management Committee and Board of Directors.
It is difficult to predict the timing and extent of the further improvement in business confidence in 2015. The stronger second half result reported in 2014 demonstrates that there is some increased momentum in the business since the Federal Election. Hours worked in the Staffing Services business have returned to prior year levels and we are confident that this trend will continue, although the full impact of customer driven margin reductions is still flowing through. The AHS, Vivir and Aurion businesses are showing good growth signs and have very strong pipelines. The significant costs savings that have been delivered in 2013 and 2014 will also provide benefits in future periods.
Future financial outcomes will be impacted by a number of factors:
� Business confidence is mixed across industries but overall appears to be stable since the Federal Budget indicators point to further modest improvement. Reduced demand in the mining sector is expected to continue.
� Margin pressure from customers is expected to continue. Productivity and efficiency initiatives are in train to reduce the impact of lower margins.
� The pipeline remains solid, particularly in the AHS, Vivir and Aurion businesses. These businesses are expected to deliver strong growth in 2015.
� A stronger focus on managing customer profitability through the new management information system should see additional benefits in 2015 and beyond.
� The Consulting and International businesses have been restructured and are well positioned to take advantage of improving market conditions.
� The full year benefit of cost reductions achieved this year will be seen in 2015 and additional productivity and cost saving initiatives will deliver further savings in 2015 and 2016.
directors’ Reportcontinued
For
per
sona
l use
onl
y

15Chandler Macleod Group Limited Annual Report 2014
diVidENds cents $000
Final 2014 dividends declared 1.80 9,864
Dividends paid in the year:
Interim 2014 dividends 1.40 7,609
Final 2013 dividends 1.80 8,454
AcqUisiTiON OF gRAFTON cONsULTiNg LimiTEd (gRAFTON)On 6 August 2013, OCG Consulting Limited (OCG), a subsidiary of Chandler Macleod Group (CMG), acquired 73.7% of shares in Grafton. Grafton delivers a broad range of human resource consulting services to both Corporate and SME clients throughout New Zealand.
The acquisition price comprised of upfront cash payment of NZ$2.9 million and three deferred payments, based on an earn out arrangements. Under the shareholders agreement, OCG has a call option over the remaining 26.3% of shares. The remaining minority shareholders have put options to OCG, exercisable at various stages up to August 2016. On this basis, 100% ownership is virtually certain at acquisition date, therefore Grafton has been accounted for as a wholly-owned subsidiary.
Refer to note 23 of the financial statement for details.
AcqUisiTiON OF cORNERsTONE gLObAL PARTNERs LimiTEd (cORNERsTONE)On 19 July 2013, Chandler Macleod Group (HK) Limited acquired 40% interest in Cornerstone Global Partners Limited (Cornerstone).
Cornerstone delivers a range of recruitment solutions including candidate search and talent management consulting, along with recruitment outsourcing and contracting solutions. Cornerstone services clients across China through their offices in Beijing and Shanghai. Refer to note 15 of the financial statement for details.
sigNiFicANT chANgEs iN ThE sTATE OF AFFAiRsThere were no significant changes in the state of affairs of the Group during the reporting period, apart from the acquisition of Grafton and investment in Cornerstone disclosed above.
ENViRONmENTAL REgULATiON PERFORmANcEThe Group’s operations are not regulated by any significant environmental regulation under a law of the Commonwealth or of a State or Territory.
sigNiFicANT EVENTs AFTER yEAR ENd
dividendOn 18 August 2014, the directors of Chandler Macleod Group Limited declared a final dividend on ordinary shares in respect to the 2014 financial year. The total amount of the dividend is $9.9m which represents a fully franked dividend of 1.80 cents per share. The dividend has not been provided for in the 30 June 2014 financial statements. The directors have suspended the Company’s DRP.
New banking facilityOn 18 August 2014, the Group entered into a combined facilities agreement with Westpac Banking Corporation and the Hong Kong & Shanghai Banking Corporation which comprises:
� Cash Advance facility of $51.2 million
� Bank Guarantee facility (Australia and overseas) of $11 million
� Multi Option facility (Australia and overseas) up to $10 million
� Invoice Finance - With Recourse facility up to $90 million
� Invoice Finance - Without Recourse facility up to $55 million
� Workers Compensation Bond Facility of $55.5 million
The Group will terminate all of its current facilities with NAB and ANZ on or before 29 September 2014.
directors’ Reportcontinued
For
per
sona
l use
onl
y
16 Chandler Macleod Group Limited Annual Report 2014
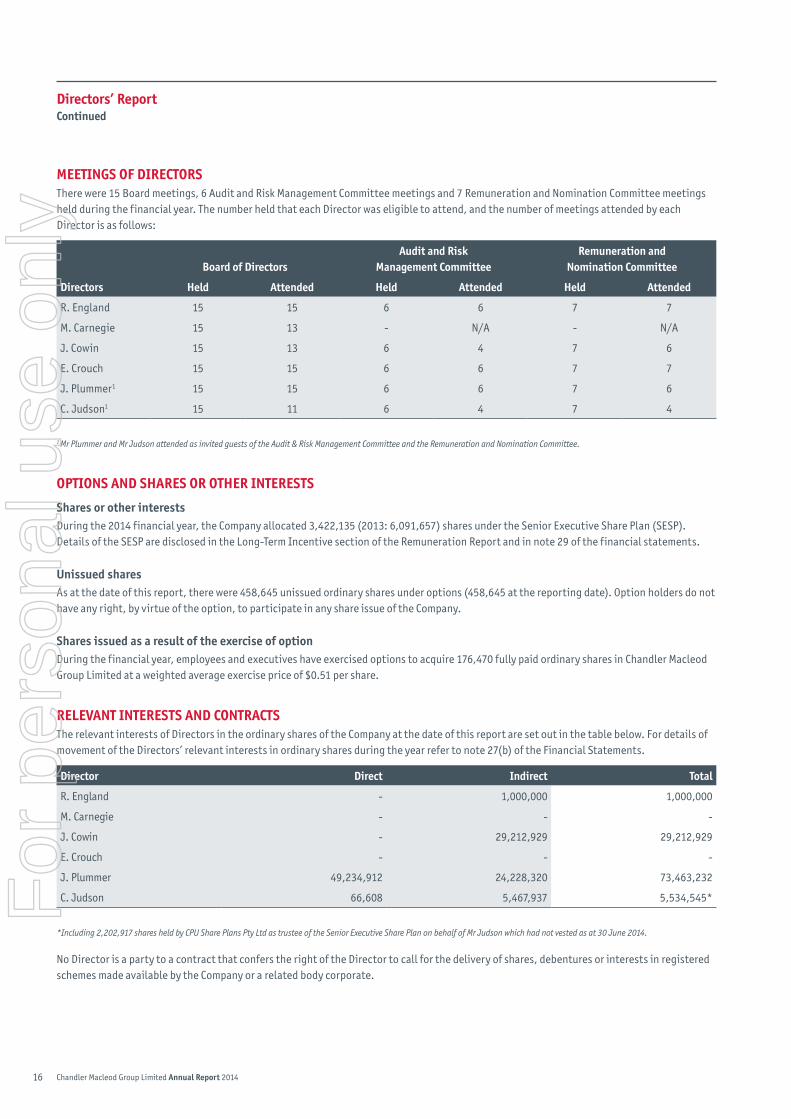
mEETiNgs OF diREcTORsThere were 15 Board meetings, 6 Audit and Risk Management Committee meetings and 7 Remuneration and Nomination Committee meetings held during the financial year. The number held that each Director was eligible to attend, and the number of meetings attended by each Director is as follows:
directors
board of directorsAudit and Risk
management committeeRemuneration and
Nomination committee
held Attended held Attended held Attended
R. England 15 15 6 6 7 7
M. Carnegie 15 13 - N/A - N/A
J. Cowin 15 13 6 4 7 6
E. Crouch 15 15 6 6 7 7
J. Plummer1 15 15 6 6 7 6
C. Judson1 15 11 6 4 7 4
1 Mr Plummer and Mr Judson attended as invited guests of the Audit & Risk Management Committee and the Remuneration and Nomination Committee.
OPTiONs ANd shAREs OR OThER iNTEREsTs
shares or other interestsDuring the 2014 financial year, the Company allocated 3,422,135 (2013: 6,091,657) shares under the Senior Executive Share Plan (SESP). Details of the SESP are disclosed in the Long-Term Incentive section of the Remuneration Report and in note 29 of the financial statements.
Unissued sharesAs at the date of this report, there were 458,645 unissued ordinary shares under options (458,645 at the reporting date). Option holders do not have any right, by virtue of the option, to participate in any share issue of the Company.
shares issued as a result of the exercise of optionDuring the financial year, employees and executives have exercised options to acquire 176,470 fully paid ordinary shares in Chandler Macleod Group Limited at a weighted average exercise price of $0.51 per share.
RELEVANT iNTEREsTs ANd cONTRAcTsThe relevant interests of Directors in the ordinary shares of the Company at the date of this report are set out in the table below. For details of movement of the Directors’ relevant interests in ordinary shares during the year refer to note 27(b) of the Financial Statements.
director direct indirect Total
R. England - 1,000,000 1,000,000
M. Carnegie - - -
J. Cowin - 29,212,929 29,212,929
E. Crouch - - -
J. Plummer 49,234,912 24,228,320 73,463,232
C. Judson 66,608 5,467,937 5,534,545*
*Including 2,202,917 shares held by CPU Share Plans Pty Ltd as trustee of the Senior Executive Share Plan on behalf of Mr Judson which had not vested as at 30 June 2014.
No Director is a party to a contract that confers the right of the Director to call for the delivery of shares, debentures or interests in registered schemes made available by the Company or a related body corporate.
directors’ Reportcontinued
For
per
sona
l use
onl
y

17Chandler Macleod Group Limited Annual Report 2014
EARNiNgs PER shARE2014 2013
Earnings per share (cents per share) 2.71 2.39
Diluted earnings per share (cents per share) 2.65 2.31
iNdEmNiFicATiON OF OFFicERsDuring the financial year the Company paid a premium insuring the Directors of the Company and its officers and any related body corporate against liabilities incurred (including legal costs) as a director, secretary or executive officer to the extent permitted by the Corporations Act 2001.
The Company has agreed to indemnify each Director, to the extent permitted by law, for all liabilities (including legal costs) incurred by the Director as an officer or former officer of the Company or a related body corporate.
iNdEmNiFicATiON OF AUdiTORsTo the extent permitted by law, the Company has agreed to indemnify its auditors, EY, as part of the terms of its audit engagement against claims by third parties arising from the audit (for an unspecified amount). No payment has been made to indemnify EY during or since the financial year.
AUdiTOR iNdEPENdENcE dEcLARATiONThe Auditor’s Independence Declaration follows the Directors’ Report.
NON-AUdiT sERVicEsDetails to the non-audit services provided by the consolidated entity’s auditor are provided at note 33 to the Financial Statements. The Directors are satisfied that the provision of non-audit services is compatible with the general standard of independence for auditors imposed by the Corporations Act 2001. The nature and scope of each type of non-audit service provided means that auditor independence was not compromised. EY received or are due to receive $235,495 for the provision of non-audit services ($167,522 for tax compliance and $67,973 for other assurance services).
REmUNERATiON REPORT (AUdiTEd)This Remuneration Report outlines the Director and executive remuneration arrangements of the Company and the Group in accordance with the requirements of the Corporations Act 2001 (the Act) and its Regulations. This information has been audited as required by section 308(3C) of the Act.
The remuneration report details the remuneration arrangements for Key Management Personnel (‘KMP’) who are defined as those persons having authority and responsibility for planning, directing and controlling the major activities of the Company and the Group, directly or indirectly, including any Director (whether executive or otherwise) of the Company and the Group.
details of kmP
(i) directorsC. Judson Managing Director and Chief Executive Officer
R. England Non-Executive Director and Chairman
J. Plummer Non-Executive Director and Deputy Chairman
M. Carnegie Non-Executive Director
G. Young Non-Executive Alternate to Mr. Carnegie (resigned 25 July 2013)
E. Crouch Non-Executive Director
J. Cowin Non-Executive Director
directors’ Reportcontinued
For
per
sona
l use
onl
y

18 Chandler Macleod Group Limited Annual Report 2014
REmUNERATiON REPORT (AUdiTEd) (CONTINUED)
details of kmP (Continued)
(ii) ExecutivesO. Wilson Chief Financial Officer (notice of resignation received 3 June 2014)
D. Johnson Chief Operating Officer - Staffing Services (resigned 1 November 2013)
T. Sinibaldi Chief Operating Officer - Staffing Services (appointed 1 November 2013)
M. Loader Chief Operating Officer - Managed Services
K. Frame Chief Operating Officer - Specialist Products (appointed 13 January 2014)
Apart from O. Wilson’s notice of resignation, there were no changes in KMPs after the reporting date and before the date the financial report was authorised for issue.
Remuneration and Nomination committeeThe Company does not have a discrete remuneration committee. However, the functions of such a committee are performed by the Remuneration and Nomination Committee (“Committee”), which has been established by resolution of the Board of Directors. The Committee is responsible, among other things, for determining and reviewing remuneration arrangements for the Board and executives. The primary objective of the Committee is to assist the Board to fulfil its corporate governance and overseeing responsibilities in relation to:
� The Company’s overall people strategy including remuneration components, performance measurements and accountability frameworks, organisational structure and culture, business alignment and external competitiveness;
� CEO and executive remuneration framework, including performance incentives and hurdles;
� CEO and executive recruitment, retention, talent management and succession planning;
� Chairman and Non-Executive Director remuneration framework;
� Board structure, membership, tenure and succession planning; and
� Board induction and training.
The Committee is chaired by Mr Jack Cowin and, pursuant to its Charter, is comprised of no less than two and no more than five members appointed by the Board, all of whom must be Non-Executive Directors. As at the date of this Remuneration Report, the Committee comprises three Non-Executive Directors.
The Committee appointed Daman Patterson, Chief People Officer of the Group as their Principal Adviser. To ensure the remuneration committee is fully informed when making remuneration decisions, it seeks external remuneration advice. Advice is periodically obtained from independent external remuneration consultants to structure a market competitive framework that is aligned with its overall business strategy and objectives, pursuant to the Remuneration Policy described below.
During 2014, the Committee engaged Mercer Group as independent remuneration consultants to the Company in order to ensure the remuneration committee is provided with advice, and as required, remuneration recommendations, free from undue influence by members of the KMP to whom the recommendations may relate.
The engagement of Mercer Group by the remuneration committee was based on an agreed set of protocols that would be followed by the Group, members of the remuneration committee and members of KMP. The fees paid to Mercer for their services were $13,125.
During the 2014 year, Mercer Group provided the Company with:
� Outline of the key management personnel (KMP) remuneration review - methodology and deliverables
� Requirements for listed companies when engaging remuneration consultants to advise on KMP remuneration
� Discussion of the appropriate benchmarking peer group for Chandler Macleod
� Company context including current programs, market for talent, key objectives and linkage to company/people strategy
directors’ Reportcontinued
For
per
sona
l use
onl
y

19Chandler Macleod Group Limited Annual Report 2014
Remuneration PolicyThe Remuneration Policy of the Company for its Directors and executives recognises the need for the Company to attract, motivate and retain highly skilled people to undertake the responsibilities of these roles. The Remuneration Policy also recognises that the Board is responsible to the shareholders of the Company to ensure that interests of the Directors and executives of the Company are aligned with the interests of the shareholders.
The primary objective of the Remuneration Policy is to align Director and executive remuneration with sustainable shareholder value. To this end the remuneration policy of the Company embodies the following principles:
� Providing fair, consistent and competitive rewards to attract and retain high calibre executives;
� Motivating the Company’s Directors and executives to achieve superior performance;
� A remuneration framework that is linked to Company performance and total shareholder return; and
� Building a partnership between the Company and its Directors and executives by encouraging share ownership in the Company by Directors and executives.
The combination of fixed and variable pay components including short and long-term incentive strategies is aligned with these principles.
The Senior Executives and the Company Secretaries have an “at risk” or variable component designed to align shareholder value by tying incentive payments to measures of the Company’s performance. Measures include:
� Profit of the consolidated entity;
� Working capital/debtor management; and
� Regional or divisional revenue and profit.
hedging of Equity Awards The Company prohibits executives from entering into arrangements to protect the value of unvested LTI awards. The prohibition includes entering into contracts to hedge their exposure to shares and options awarded as part of their remuneration package.
Non-Executive director RemunerationThe Board seeks to set aggregate remuneration for its Non-Executive Directors at a level that provides the Company with the ability to attract and retain Directors of the highest calibre, whilst incurring a cost that is acceptable to shareholders. The maximum total fees payable by the Company to the Non-Executive Directors collectively is $800,000 per annum.
Non-Executive Directors are paid a fee for being a Director of the Company. An additional fee is paid for each Committee on which a Non-Executive Director sits. Non-Executive Directors do not receive any bonus or incentive payment based upon Company or personal performance. The Board annually reviews the fees paid to Non-Executive Directors and considers advice from external consultants as well as the fees paid to non-executive directors of comparable companies when undertaking its annual review process. The annual fees of the Non-Executive Directors effective from 1 January 2014 (inclusive of superannuation) were;
� Chairman - $250,000;
� Deputy Chairman - $150,000;
� Non-Executive Director - $100,000;
All Non-Executive Directors are retained under standard letters of appointment. The tenure of Non-Executive Directors is subject to the Company Constitution and the Corporations Act 2001.
Non-Executive Directors are reimbursed expenses and may be supported in their role through Company sponsored professional development activities, Company supplied technology, insurance and indemnity cover and other benefits.
No retirement benefits or other forms of bonus or incentive payments are paid to Non-Executive Directors.
structure and Elements of Executive RemunerationEach executive is employed under an executive service agreement. Remuneration for executives (including Executive Directors) comprises three elements, making up a Total Remuneration for each person. Those elements are:
� Total Fixed Remuneration;
� Short Term Incentive; and
� Long Term Incentive.
The remuneration packages of all executives are reviewed annually against a comparator group of ASX-listed companies of similar size. Companies are chosen by reference to market capitalisation and annual revenue to compare remuneration for similar size companies where available comparisons are also made to companies operating in the same sector. The annual benchmarking may or may not lead to changes in an executive’s total fixed remuneration. Other factors considered in setting remuneration levels include an individuals contribution to the Company’s performance, relevant industry experience and tenure. Whilst the Company seeks to position remuneration in the median level, there are no guaranteed increases in total fixed remuneration for executives.
Total Fixed Remuneration (“TFR”)The fixed remuneration includes all benefits, such as salary, superannuation contributions and salary sacrifice benefits. The Company may, in addition, provide other benefits such as mobile phones, home office facilities, indemnity and insurance cover.
directors’ Reportcontinued
For
per
sona
l use
onl
y

20 Chandler Macleod Group Limited Annual Report 2014
REmUNERATiON REPORT (AUdiTEd) (CONTINUED)
short Term incentive (“sTi”)The purpose of STI’s is to reward executives for their contribution to the achievement of the Group and business unit outcomes, as well as individual key performance indicators (KPI). The Company’s STI plan provides for a cash payment based on a target percentage of TFR ranging from 20% of TFR to 40% of TFR. The target payment may then be discounted for under performance or increased for over performance and it is capped at a maximum value of 80% of TFR. To achieve target STI the performance criteria require a reasonable degree of performance improvement beyond previous performance levels. To achieve the maximum STI requires consistent outstanding performance.
The performance indicators for determining an award of STI comprise a combination of key financial and non-financial indicators which can be appropriately measured. The indicators include performance against overall company financial targets, performance against business units’ financial targets and performance against individual objectives. These financial performance measures include EBITDA, net profit after tax, compliance to payment terms and revenue growth. The split between financial and non-financial indicators are reviewed each year by the Remuneration and Nomination Committee. Each performance metric has a threshold performance level below which no STI is payable. The Committee reviews the process for setting STI performance criteria and the process for determining whether those criteria have been met, and approves the target STI percentage of TFR for each eligible executive.
Long Term incentive (“LTi”) The purpose of the LTI is to reward executives for their contribution to the creation of shareholders’ value over the longer term. It is intended that an offer of shares be made annually under the LTI plan or plans, as applicable, subject to satisfaction of performance criteria, the ability of the Company to offer such plans, Board and (if appropriate) shareholder approval and future directions in executive variable remuneration.
senior Executive share Plan (“sEsP”)During the period the Company operated the Senior Executive Share Plan.
The SESP commenced on 17 December 2007 and is an incentive plan for meeting certain performance conditions. The SESP is consistent with the principles and objectives of the Remuneration Policy of building a partnership between the Company and its executives by encouraging ownership by the executives of shares in the Company.
The LTI target under the SESP for each eligible executive is set as a percentage of TFR. The designated percentage, which ranged from 10% to 40% during the reporting period, is determined based on a combination of each executive’s level of responsibility, performance, potential and retention risk.
For shares allocated after 1 July 2008 and prior to 1 March 2011 one third of the share allocations will vest at the completion of 1, 2 and 3 years of service after their allocation, subject to the relevant person still being employed at the time of vesting. The vesting of these shares is not dependent on the satisfaction of a performance condition as the Board elected to base vesting on retention of executives. This scheme came to an end after the completion of three years vesting period on 15 August 2013.
For shares allocated post 1 March 2011, one quarter of this share allocation will vest at the completion of 1, 2, 3 and 4 years of service after their allocation, subject to the relevant person still being employed at the time of vesting. The vesting of these shares is also dependent on the achievement of certain performance hurdles set by the Remuneration & Nomination Committee at the commencement of each financial year.
During the 2014 financial year, the Company allocated 3,422,135 (2013: 6,091,657) shares.
In regards to the SESP, the Board has the discretion that on a redundancy the shares (that have not vested and may be subject to hurdle rates or tenure) can remain on record with the employee until the Board declares that the hurdle rates are met or otherwise. The retrenched employee would then be entitled (if the hurdle rates are met) to the proportion of their shares for their period of employment in relation to that grant of shares.
directors’ Reportcontinued
For
per
sona
l use
onl
y
21Chandler Macleod Group Limited Annual Report 2014
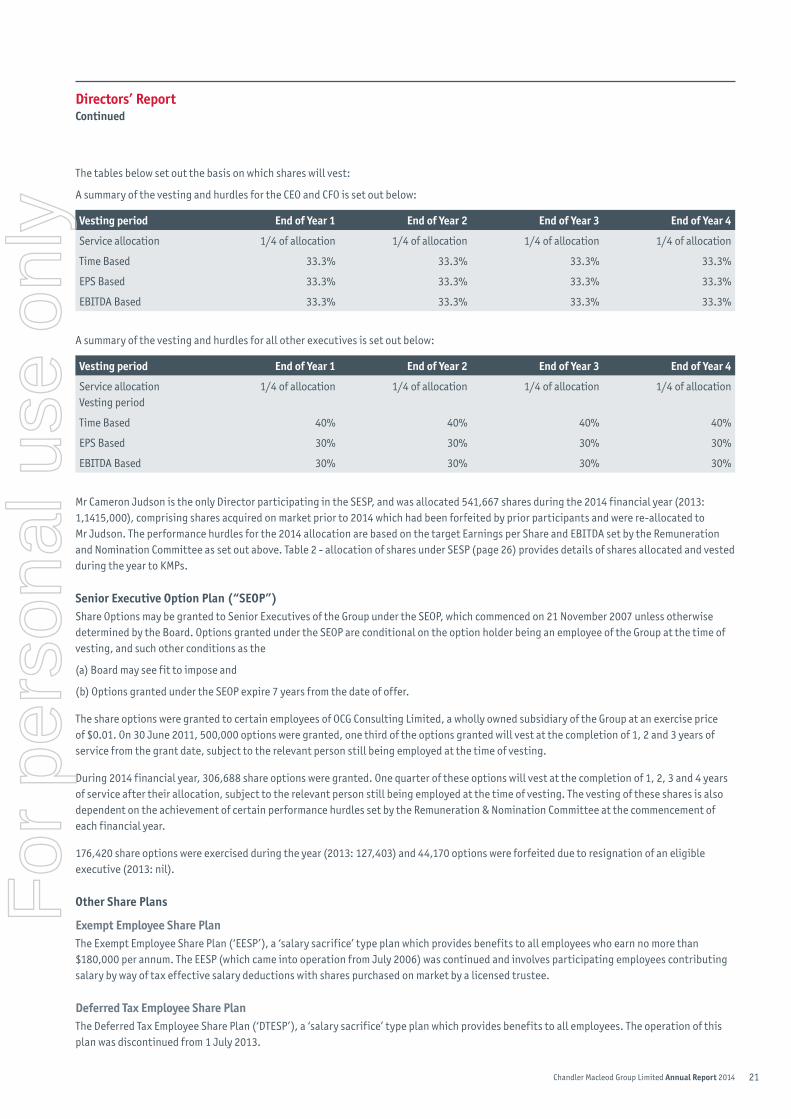
The tables below set out the basis on which shares will vest:
A summary of the vesting and hurdles for the CEO and CFO is set out below:
Vesting period End of year 1 End of year 2 End of year 3 End of year 4
Service allocation 1/4 of allocation 1/4 of allocation 1/4 of allocation 1/4 of allocation
Time Based 33.3% 33.3% 33.3% 33.3%
EPS Based 33.3% 33.3% 33.3% 33.3%
EBITDA Based 33.3% 33.3% 33.3% 33.3%
A summary of the vesting and hurdles for all other executives is set out below:
Vesting period End of year 1 End of year 2 End of year 3 End of year 4
Service allocation Vesting period
1/4 of allocation 1/4 of allocation 1/4 of allocation 1/4 of allocation
Time Based 40% 40% 40% 40%
EPS Based 30% 30% 30% 30%
EBITDA Based 30% 30% 30% 30%
Mr Cameron Judson is the only Director participating in the SESP, and was allocated 541,667 shares during the 2014 financial year (2013: 1,1415,000), comprising shares acquired on market prior to 2014 which had been forfeited by prior participants and were re-allocated to Mr Judson. The performance hurdles for the 2014 allocation are based on the target Earnings per Share and EBITDA set by the Remuneration and Nomination Committee as set out above. Table 2 - allocation of shares under SESP (page 26) provides details of shares allocated and vested during the year to KMPs.
senior Executive Option Plan (“sEOP”)Share Options may be granted to Senior Executives of the Group under the SEOP, which commenced on 21 November 2007 unless otherwise determined by the Board. Options granted under the SEOP are conditional on the option holder being an employee of the Group at the time of vesting, and such other conditions as the
(a) Board may see fit to impose and
(b) Options granted under the SEOP expire 7 years from the date of offer.
The share options were granted to certain employees of OCG Consulting Limited, a wholly owned subsidiary of the Group at an exercise price of $0.01. On 30 June 2011, 500,000 options were granted, one third of the options granted will vest at the completion of 1, 2 and 3 years of service from the grant date, subject to the relevant person still being employed at the time of vesting.
During 2014 financial year, 306,688 share options were granted. One quarter of these options will vest at the completion of 1, 2, 3 and 4 years of service after their allocation, subject to the relevant person still being employed at the time of vesting. The vesting of these shares is also dependent on the achievement of certain performance hurdles set by the Remuneration & Nomination Committee at the commencement of each financial year.
176,420 share options were exercised during the year (2013: 127,403) and 44,170 options were forfeited due to resignation of an eligible executive (2013: nil).
Other share Plans
Exempt Employee share PlanThe Exempt Employee Share Plan (‘EESP’), a ‘salary sacrifice’ type plan which provides benefits to all employees who earn no more than $180,000 per annum. The EESP (which came into operation from July 2006) was continued and involves participating employees contributing salary by way of tax effective salary deductions with shares purchased on market by a licensed trustee.
deferred Tax Employee share PlanThe Deferred Tax Employee Share Plan (‘DTESP’), a ‘salary sacrifice’ type plan which provides benefits to all employees. The operation of this plan was discontinued from 1 July 2013.
directors’ Reportcontinued
For
per
sona
l use
onl
y

22 Chandler Macleod Group Limited Annual Report 2014
REmUNERATiON REPORT (AUdiTEd) (CONTINUED)
Other share Plans (Continued)
Post EmploymentThe post employment elements of remuneration include statutory superannuation contributions made by the Company or sacrificed by the employee. Those executives and directors with agreed severance packages are outlined under Employment Contracts.
Employment contractsThe Senior Executives and the Company Secretaries are employed under written contracts.
The terms of the contracts for the CEO and Executives identified as KMP as at 30 June 2014 are detailed in the table below:
duration of contract Notice of Termination1 Termination payments1
director
C. Judson Open 12 months by Mr Judson or 12 months by the Company Pay in lieu of notice
Executives
O. Wilson Open 6 months by Mr Wilson or 12 months by the Company Pay in lieu of notice
T. Sinibaldi Open 3 months by Ms Sinibaldi or 3 months by the Company Pay in lieu of notice
M. Loader Open 6 months by Ms Loader or 6 months by the Company Pay in lieu of notice
K. Frame Open 3 months by Mr Frame or 3 months by the Company Pay in lieu of notice
1 No person specified above is entitled to notice of termination or a termination payment upon termination for cause. The notice and severance details are provided on the basis of what the person would be entitled to under their employment contract if terminated other than for cause at the date of this report.
On termination on notice by the Company, any LTI shares that have vested or that will vest during the notice period will be released. LTI options and shares that have not yet vested will be forfeited. The Company may terminate the contract at any time without notice if serious misconduct has occurred. Where termination with cause occurs the executive is entitled to that portion of remuneration that is fixed, and only up to the date of termination. On termination with cause any unvested options will immediately be forfeited.
In regards to the SESP, the Board has the discretion that on a redundancy the shares (that have not vested and may be subject to hurdle rates or tenure) can remain on record with the employee until the Board declares that the hurdle rates are met or otherwise. The retrenched employee would then be entitled (if the hurdle rates are met) to the proportion of their shares for their period of employment in relation to that grant of shares.
directors’ Reportcontinued
For
per
sona
l use
onl
y

23Chandler Macleod Group Limited Annual Report 2014
group PerformanceThe graphs below show the performance of the Group as reflected in the movements in EBITDA and earnings per share.
Financial Years Ended 30 June 2010 to 2014EBITDA*
$50,000
$45,000
$40,000
$35,000
$30,000
$25,000
$20,000
$15,000
$10,000
$5,000
$
$’000
2010 2014201320122011
*EBITDA before restructuring, fair value adjustment to contingent consideration, acquisition and related transaction costs
Financial Years Ended 30 June 2010 to 2014Cash Earnings Per Share# (cents)
2010 2011 2012 2013 2014
6.00
5.00
4.00
3.00
2.00
1.00
0.00
#Cash EPS is calculated at EPS plus amortisation of intangibles
The most significant measure driving the STI payment outcomes is the financial performance of the Group. The Key Management Personnel of the Group are measured against the achievement of Group EBITDA targets and EBITDA growth against the corresponding period. Business leaders are measured on achievement of their particular business EBITDA and EBITDA growth target with an element of their STI target also linked to Group outcomes.
STI’s have been recommended with reference to the performance of the Company against the budget set for 2014 year and the contribution of the individuals to the achievement of that target and against their individual KPIs. The Group’s EBITDA before restructuring, fair value adjustment to contingent consideration, acquisition and related transaction costs in 2014 reflects a decline against prior year. Considering the Group performance, the Executives were awarded 45% of the total STI amount payable at target.
directors’ Reportcontinued
For
per
sona
l use
onl
y

24 Chandler Macleod Group Limited Annual Report 2014
REmUNERATiON REPORT (AUdiTEd) (CONTINUED)
Table 1: Remuneration of key management Personnel of the groupThe table below sets out the nature and amount of remuneration of each Executive and Non-Executive Director received for the year ended 30 June 2014.
short-TermPost
Employment Long-Termshare-based
Payment1 Total benefits
Total Performance
Related
salary & Fees2 cash bonus3
Non monetary benefits
super-annuation
Long service leave4
$ $ $ $ $ $ $ %
directors
C. Judson
2014 638,554 100,000 - 25,000 17,188 151,441 932,183 11%
2013 579,226 200,000 - 16,470 11,689 251,713 1,059,098 19%
R. England
2014 219,725 - - 17,775 - - 237,500 0%
2013 208,530 - - 16,470 - - 225,000 0%
J. Plummer
2014 125,854 - - 11,646 - - 137,500 0%
2013 114,676 - - 10,324 - - 125,000 0%
M. Carnegie
2014 93,588 - - 1,412 - - 95,000 0%
2013 88,667 - - - - - 88,667 0%
J. Cowin
2014 105,260 - - 9,740 - - 115,000 0%
2013 100,915 - - 9,085 - - 110,000 0%
E. Crouch
2014 114,413 - - 10,587 - - 125,000 0%
2013 110,089 - - 9,911 - - 120,000 0%
Total Remuneration: directors
2014 1,297,394 100,000 - 76,160 17,188 151,441 1,642,183
2013 1,202,103 200,000 - 62,260 11,689 251,713 1,727,765
1 This relates to total costs under the Share Option Plan, Exempt Employee Share Plan and Senior Executive Share Plan which are all equity settled.2 This includes salaries, annual leave and Director fees.3 Cash bonus relates to the individual year and is not necessarily paid out at year end.4 2013 long service leave was restated to reflect long service leave earned during the financial year.
directors’ Reportcontinued
For
per
sona
l use
onl
y

25Chandler Macleod Group Limited Annual Report 2014
Table 1: Remuneration of key management Personnel of the group (Continued)
short-TermPost
Employment Long-Termshare-based
Payment1
Termination/Resignation
paymentsTotal
benefits
Total Performance
Related
salary & Fees2
cash bonus 3
Non monetary benefits
super-annuation
Long service
leave4
$ $ $ $ $ $ $ $ $
Executives
O. Wilson
2014 578,861 100,000 12,267 19,206 4,386 (82,642) - 632,078 16%
2013 464,715 175,000 16,725 16,470 6,600 321,761 - 1,001,271 17%
T. Sinibaldi5
2014 225,010 50,000 - 11,850 9,235 16,989 - 313,084 16%
2013 - - - - - - - - 0%
M. Loader6
2014 377,117 90,000 - 16,814 13,696 65,520 - 563,147 16%
2013 - - - - - - - - 0%
K. Frame7
2014 168,448 20,000 - 8,887 106 - - 197,441 10%
2013 - - - - - - - - 0%
D. Johnson8
2014 265,020 - 10,811 13,331 (900) (52,659) 95,833 331,436 0%
2013 417,581 160,000 11,446 16,470 368 108,546 - 714,411 22%
Total Remuneration: Executives
2014 1,614,456 260,000 23,078 70,088 26,523 (52,792) 95,833 2,037,186
2013 882,296 335,000 28,171 32,940 6,968 430,307 - 1,715,682
Total Remuneration: key management Personnel
2014 2,911,850 360,000 23,078 146,248 43,711 98,649 95,833 3,679,369
2013 2,084,399 535,000 28,171 95,200 18,657 682,020 - 3,443,447
1 This relates to total share based payments expensed during the period under Share Option Plan, Exempt Employee Share Plan and SESP which are all equity settled.2 This includes salaries and annual leave.3 Cash bonus relates to the individual year and is not necessarily paid out at year end.4 2013 long service leave was restated to reflect long service leave earned during the financial year.5 Ms Sinibaldi met the definition of a key management person on her appointment as Chief Operating Officer for Staffing Services on 1 November 2013. The benefits for the 2014 financial year reflect earnings since her appointment.6 Ms Loader became key management person for the 2014 financial year under AASB 124, but was not a key management person for 2013.7 Mr Frame met the definition of a key management person on his appointment as Chief Operating Officer for Specialist Products on 13 January 2014.8 Mr Johnson resigned from his position on 1 November 2013.
directors’ Reportcontinued
For
per
sona
l use
onl
y

26 Chandler Macleod Group Limited Annual Report 2014
REmUNERATiON REPORT (AUdiTEd) (CONTINUED)
Equity instruments
Table 2: Allocation of shares under sEsP
key management Personnel
included in the sEsP
balance at beginning of
periodAllocation during
the periodVested during the
periodForfeited during
the periodUnvested balance
at end of periodFair Value at grant
date
1 July 2013 30 June 2014 $
C. Judson 2,340,699 541,667 (265,974) (413,475) 2,202,917 0.44
O. Wilson 3,600,000 - (408,000) (792,000) 2,400,000 0.42
T. Sinibaldi 156,250 150,000 (17,500) (26,250) 262,500 0.44
M. Loader 670,000 237,500 (67,000) (100,500) 740,000 0.45
D. Johnson 875,000 375,000 (150,000) (1,100,000) - 0.44
Total 7,641,949 1,304,167 (908,474) (2,432,225) 5,605,417 -
The unvested shares under SESP are held by CPU Share Plan Pty Ltd as the trustee of the SESP.
ROUNdiNg OF AmOUNTsThe entity is a company of the kind specified in Australian Securities and Investments Commission Class Order 98/0100. In accordance with that class order, amounts in the financial statements and the Directors’ Report have been rounded to the nearest thousand dollars unless specifically stated to be otherwise.
This report has been made in accordance with a resolution of Directors.
Richard EnglandChairman
Sydney 18 August 2014
directors’ Reportcontinued
For
per
sona
l use
onl
y

27Chandler Macleod Group Limited Annual Report 2014
Ernst & Young680 George StreetSydney NSW 2000 AustraliaGPO Box 2646 Sydney NSW 2001
Tel: +61 2 9248 5555Fax: +61 2 9248 5959ey.com
TO ThE diREcTORs OF chANdLER mAcLEOd gROUP LimiTEdIn relation to our audit of the financial report of Chandler Macleod Group Limited for the financial year ended 30 June 2014, to the best of my knowledge and belief, there have been no contraventions of the auditor independence requirements of the Corporations Act 2001 or any applicable code of professional conduct.
Ernst & young
P.s. barnardPartner
Sydney 18 August 2014
Auditor’s independence declaration
For
per
sona
l use
onl
y

28 Chandler Macleod Group Limited Annual Report 2014
Note 2014 2013
$000 $000
Revenue 1,412,242 1,502,601
Other income 955 1,308
Total revenue 1,413,197 1,503,909
Contractor and other direct costs (1,222,467) (1,296,897)
Employee benefits expense 5(a) (115,298) (125,195)
Employee benefits expense - restructuring expense (3,372) (7,333)
Administration costs (33,257) (34,173)
Administration costs - restructuring expense (880) -
Other costs (2,456) (2,391)
Acquisition transaction related costs (565) (1,630)
Fair value adjustment to contingent consideration 25(a) 2,775 1,800
Share of profit of associate 15 477 -
Earnings before interest, tax, depreciation and amortisation (EBITDA) 38,154 38,090
Depreciation 13 (4,749) (4,935)
Amortisation^ 5(b) (7,528) (6,625)
Impairment of intangibles 14 - (2,700)
Earnings before interest and tax (EbiT) 25,877 23,830
Finance costs (net) 5(c) (8,504) (8,482)
Profit before income tax 17,373 15,348
Income tax expense 6 (3,904) (4,640)
Net profit for the year 13,469 10,708
Profit for the year is attributable to:
Non-controlling interest (115) 14
Owners of the parent 13,584 10,694
13,469 10,708
Other comprehensive income
Items that may be reclassified subsequently to profit or loss
Foreign currency translation 53 394
Net movement on cash flow hedges 360 58
Total comprehensive income for the year 13,882 11,160
Total comprehensive income for the year attributable to:
Non-controlling interest (115) 14
Owners of the parent 13,997 11,146
13,882 11,160
Earnings per share for profit attributable to the ordinary equity holders of the parent:
Basic earnings per share 7 2.71 2.39
Diluted earnings per share 7 2.65 2.31
^30 June 2013 balances have been restated as a result of adjusting the Vivir purchase price allocation (Note 5).
The accompanying notes form an integral part of this Consolidated Statement of profit and loss and other Comprehensive Income.
consolidated statement of Profit and Loss and other comprehensive incomeFor the year ended 30 June 2014
For
per
sona
l use
onl
y

29Chandler Macleod Group Limited Annual Report 2014
Note 2014 2013^
$000 $000
current assets
Cash and cash equivalents 9 2,671 3,262
Trade and other receivables 10 123,192 117,964
Prepayments and other current assets 11 1,857 3,082
Total current assets 127,720 124,308
Non-current assets
Other financial assets 12 12 73
Property and office equipment 13 11,072 13,017
Intangible assets and goodwill 14 236,970 231,967
Investment in an associate 15 4,191 -
Deferred tax assets 6 10,002 7,093
Total non-current assets 262,247 252,150
Total assets 389,967 376,458
current liabilities
Trade and other payables 17 80,478 75,040
Interest-bearing loans and borrowings 18 14,803 18,990
Income tax payable 5,349 1,755
Other financial liabilities 19 2,482 -
Provisions 20 14,311 16,765
Total current liabilities 117,423 112,550
Non-current liabilities
Payables 17 1,825 2,265
Interest-bearing loans and borrowings 18 76,194 97,637
Other financial liabilities 19 927 3,916
Provisions 20 3,477 3,624
Total non-current liabilities 82,423 107,442
Total liabilities 199,846 219,992
Net assets 190,121 156,466
Equity
Contributed equity 21 186,429 150,825
Retained earnings 22 2,236 4,715
Reserves 1,582 937
Parent interests 190,247 156,477
Non-controlling interests (126) (11)
Total equity 190,121 156,466
^30 June 2013 balances have been restated (Note 23d).
The accompanying notes form an integral part of this Consolidated Statement of Financial Position.
consolidated statement of Financial PositionAs at 30 June 2014
For
per
sona
l use
onl
y

30 Chandler Macleod Group Limited Annual Report 2014
contributed Equity
Retained Earnings
hedge Reserve
Translation Reserves
Employee share
ReservesOwners of
the Parent
Non-controlling
interest Total
$000 $000 $000 $000 $000 $000 $000 $000
At 1 July 2013^ 150,825 4,715 (743) 58 1,622 156,477 (11) 156,466
Profit for the period - 13,584 - - - 13,584 (115) 13,469
Other comprehensive income - - 360 53 - 413 - 413
Total comprehensive income for the period - 13,584 360 111 - 13,997 (115) 13,882
Transactions with owners in their capacity as owners:
Issue of shares as part of deferred settlement 300 - - - - 300 - 300
Shares vested under employee share plans 871 - - - (871) - - -
Issue of shares under dividend reinvestment plan (DRP) 3,108 - - - - 3,108 - 3,108
Issue of shares 31,874 - - - - 31,874 - 31,874
Transaction cost on issue of shares (459) - - - - (459) - (459)
Shares acquired by/transferred to the trustee of the senior executive share plan (90) - - - - (90) - (90)
Share-based payment - - - - 1,103 1,103 - 1,103
Dividends paid - (16,063) - - - (16,063) - (16,063)
At 30 June 2014 186,429 2,236 (383) 111 1,854 190,247 (126) 190,121
consolidated statement of changes in Equity
For
per
sona
l use
onl
y
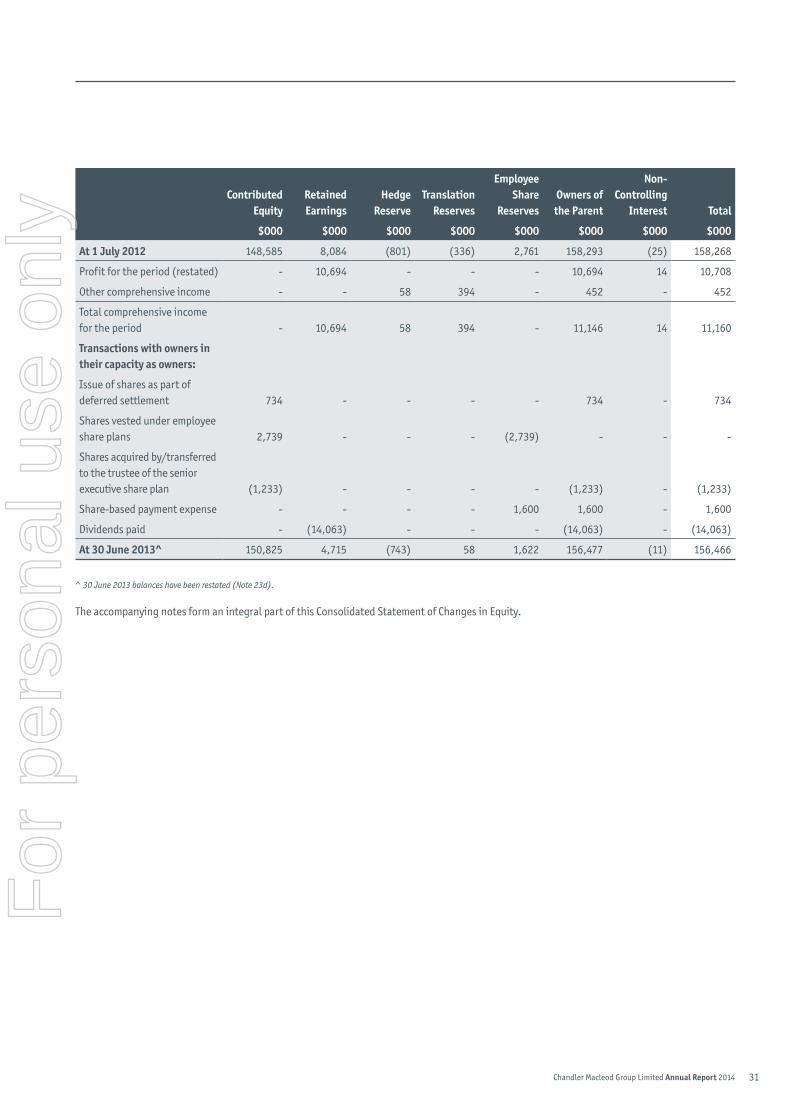
31Chandler Macleod Group Limited Annual Report 2014
contributed Equity
Retained Earnings
hedge Reserve
Translation Reserves
Employee share
ReservesOwners of
the Parent
Non-controlling
interest Total
$000 $000 $000 $000 $000 $000 $000 $000
At 1 July 2012 148,585 8,084 (801) (336) 2,761 158,293 (25) 158,268
Profit for the period (restated) - 10,694 - - - 10,694 14 10,708
Other comprehensive income - - 58 394 - 452 - 452
Total comprehensive income for the period - 10,694 58 394 - 11,146 14 11,160
Transactions with owners in their capacity as owners:
Issue of shares as part of deferred settlement 734 - - - - 734 - 734
Shares vested under employee share plans 2,739 - - - (2,739) - - -
Shares acquired by/transferred to the trustee of the senior executive share plan (1,233) - - - - (1,233) - (1,233)
Share-based payment expense - - - - 1,600 1,600 - 1,600
Dividends paid - (14,063) - - - (14,063) - (14,063)
At 30 June 2013^ 150,825 4,715 (743) 58 1,622 156,477 (11) 156,466
^ 30 June 2013 balances have been restated (Note 23d).
The accompanying notes form an integral part of this Consolidated Statement of Changes in Equity.
For
per
sona
l use
onl
y

32 Chandler Macleod Group Limited Annual Report 2014
Note
2014 2013
$000 $000
cash flows from operating activities
Receipts from customers (inclusive of GST) 1,548,773 1,678,018
Payments to suppliers and employees (inclusive of GST) (1,510,304) (1,619,959)
Finance income 20 34
Acquisition transaction related costs (338) (1,472)
Employee benefit expense - restructuring costs (4,573) (6,097)
Finance costs (3,578) (3,677)
Income tax paid (2,586) (6,264)
Net cash flows from operating activities 9(b) 27,414 40,583
cash flows from investing activities
Business combinations, net of cash acquired 23 (2,512) (39,723)
Purchase of property, plant and equipment (2,149) (2,704)
Purchase of software and project development costs 14 (6,158) (4,374)
Investment in associate 15 (2,255) -
Proceeds from sale of subsidiary 326 -
Proceeds from disposal of property, plant and equipment 9 668
Net cash flows used in investing activities (12,739) (46,133)
cash flows from financing activities
Proceeds from issue of shares, net of costs 31,223 -
Proceeds from borrowings - 35,000
Repayment of finance lease capital (2,208) (1,908)
Repayment of borrowings (26,730) (8,602)
Purchase of shares 21(a) (90) (499)
Payment of dividends 8 (12,955) (14,063)
Finance costs – acquisition (4,700) (5,404)
Net cash flows from financing activities (15,460) 4,524
Net decrease in cash (785) (1,026)
Cash and cash equivalents at beginning of financial year 9 3,262 4,288
cash and cash equivalents at end of financial year 9 2,477 3,262
The accompanying notes form an integral part of this Consolidated Statement of Cash Flows.
consolidated statement of cash FlowsFor the year ended 30 June 2014
For
per
sona
l use
onl
y

33Chandler Macleod Group Limited Annual Report 2014
1. cORPORATE iNFORmATiONThe financial report of Chandler Macleod Group Limited (‘the Company’) and its controlled entities for the year ended 30 June 2014 was authorised for issue in accordance with a resolution of the directors on 18 August 2014.
Chandler Macleod Group Limited is a for profit company limited by shares incorporated in Australia whose shares are publicly traded on the Australian Securities Exchange.
The nature of the operations and principal activities of the Group during the financial year were HR services incorporating recruitment, consulting, HR information systems and managed services. Further details on the business segments are described in note 4.
2. sUmmARy OF sigNiFicANT AccOUNTiNg POLiciEs
(a) basis of preparationThe financial report is a general purpose financial report, which has been prepared in accordance with the requirements of the Corporations Act 2001, Australian Accounting Standards and other authoritative pronouncements of the Australian Accounting Standards Board. The financial report has also been prepared on a historical cost basis, except for interest-bearing loans & borrowings and other financial liabilities.
The financial report is presented in Australian dollars and all values are rounded to the nearest thousand dollars ($’000) unless otherwise stated under the option available to the Company under ASIC Class Order 98/0100. The Company is an entity to which the class order applies.
(b) statement of compliance
compliance with iFRsThe financial report complies with Australian Accounting Standards and International Financial Reporting Standards (IFRS), as issued by International Accounting Standards Board.
New accounting standards and interpretations
(i) changes in accounting policy and disclosures.In the current year, the Group has adopted all of the new and revised Standards and Interpretations issued by the Australian Accounting Standards Board (AASB) that are relevant to its operations and effective for the current annual reporting period. These include AASB 10 Consolidated Financial Statements, AASB 12 Disclosure of Interests in Other Entities, AASB 128 Investment in Associates and Joint Ventures (2011), AASB 13 Fair Value Measurement and related AASB 2011-8 Amendments to Australian Accounting Standards arising from AASB 13, AASB 119 Employee Benefits (2011), AASB 2011-10 Amendments to Australian Accounting Standards arising from AASB 119 (2011), AASB 2011-4 Amendments to Australian Accounting Standards to Remove Individual Key Management Personnel Disclosure Requirements and AASB 2012-2 Amendments to Australian Accounting Standards - Disclosures - Offsetting Financial Assets and Financial Liabilities.
AASB 12 Disclosure of Interests in Other Entities sets out the requirements for disclosures relating to an entity’s interests in subsidiaries, joint arrangements, associates and structured entities. The requirements in AASB 12 are more comprehensive than the previously existing disclosure requirements for subsidiaries. For example, where a subsidiary is controlled with less than a majority of voting rights. The Group does not have any subsidiaries with material non-controlling interests, nor unconsolidated structured entities. AASB 12 disclosures are provided in notes 15, 24 and 31.
2013-3 - Amendments to AASB 136 Recoverable Amount Disclosures for Non Financial Assets remove the unintended consequences of AASB 13 on the disclosures required under AASB 136. In addition, these amendments require disclosure of the recoverable amounts for the assets or CGUs for which impairment loss has been recognised or reversed during the period. These amendments are effective retrospectively for annual periods beginning on or after 1 January 2014 with earlier application permitted. The Group has early adopted these amendments to AASB 136 in the current period since the amended/additional disclosures provide useful information as intended by the AASB. Accordingly, these amendments have been considered while making disclosures for impairment of non-financial assets in Note 16. These amendments would continue to be considered for future disclosures.
There is no material impact on the Group’s financial statements on the adoption of these new accounting standards.
Notes to the Financial statementsFor the year ended 30 June 2014
For
per
sona
l use
onl
y

34 Chandler Macleod Group Limited Annual Report 2014
2. sUmmARy OF sigNiFicANT AccOUNTiNg POLiciEs (CONTINUED)
(b) statement of compliance (Continued)
(ii) Accounting standards and interpretations issued but not yet effective.Australian Accounting Standards and Interpretations that have recently been issued or amended but are not yet effective and have not been adopted by the Group for the annual reporting period ending 30 June 2014 are outlined in the table below:
Reference Title summary Application date of standard*
impact on group financial report
Application date for group*
AASB 2012-3
Amendments to Australian Accounting Standards - Offsetting Financial Assets and Financial Liabilities
This adds application guidance to AASB 132 Financial Instruments: Presentation to address inconsistencies identified in applying some of the offsetting criteria of AASB 132, including clarifying the meaning of “currently has a legally enforceable right of set-off” and that some gross settlement systems may be considered equivalent to net settlement.
1 January 2014
No direct impact on the amount included in the Group’s financial statements.
1 July 2014
AASB 9 Financial instruments This amendment improves and simplifies the approach for classification and measurement of financial assets compared with the requirements of AASB 139.
The main changes which may impact the Group are described below;
New hedge accounting requirements including changes to hedge effectiveness testing, treatment of hedging costs, risk components that can be hedged and disclosures.
1 January 2017
The Group has not determined the impact on the presentation of the Group’s financial report at this stage.
1 July 2017
*Designates the beginning of the applicable annual reporting period
(c) basis of consolidationThe consolidated financial statements comprise the financial statements of Chandler Macleod Group Limited and its subsidiaries (‘the Group’) (as outlined in note 31) as at 30 June each year.
Controls are achieved where the Company has power over the investee, exposure, or rights to variable returns from its involvement with the investee and the ability to use its power to affect its returns.
The results of subsidiaries acquired or disposed during the year are included in the Consolidated Statement of profit and loss and Comprehensive Income from the effective date of acquisition or up to the effective date of disposal, as appropriate.
Where necessary, adjustments are made to the financial statements of the subsidiaries to bring their accounting policies in line with those used by other members of the Group.
Notes to the Financial statementscontinued
For
per
sona
l use
onl
y

35Chandler Macleod Group Limited Annual Report 2014
All intra-group transactions, balances, income and expenses are eliminated in full on consolidation. In the separate financial statements of the Company, intra-group transactions (‘common control transactions’) are generally accounting for by reference to the existing (consolidated) book value of the items. Where the transaction value of common control transactions differ from their consolidated book value, the difference is recognised as a contribution by or distribution to equity participants by the transacting entities.
(d) business combinationsBusiness combinations are accounted for using the acquisition method. The consideration transferred in a business combination shall be measured at fair value, which shall be calculated as the sum of the acquisition date fair values of the assets transferred by the acquirer, the liabilities incurred by the acquirer to former owners of the acquiree and the equity issued by the acquirer, and the amount of any non-controlling interest in the acquiree. For each business combination, the acquirer measures the non-controlling interest in the acquiree either at fair value or at the proportionate share of the acquiree’s identifiable net assets. Acquisition-related costs are expensed as incurred.
When the Group acquires a business, it assesses the financial assets and liabilities assumed for appropriate classification and designation in accordance with the contractual terms, economic conditions, the Group’s operating or accounting policies and other pertinent conditions as at the acquisition date. This includes the separation of embedded derivatives in host contracts by the acquiree.
If the business combination is achieved in stages, the acquisition date fair value of the acquirer’s previously held equity interest in the acquiree is remeasured at fair value as at the acquisition date through Consolidated Statement of profit and loss and Comprehensive Income.
Any contingent consideration to be transferred by the acquirer will be recognised at fair value at the acquisition date. Changes in the fair value of the contingent consideration that qualify as measurement period adjustments are adjusted retrospectively, with corresponding adjustments against goodwill. Measurement period adjustments are adjustments that arise from additional information obtained during the ‘measurement period’ (which cannot exceed one year from the acquisition date) about facts and circumstances that existed at the acquisition date. Subsequent changes to the fair value of the contingent consideration which is deemed to be an asset or liability will be recognised in accordance with AASB 139 either in Consolidated Statement of profit and loss and Comprehensive Income. If the contingent consideration is classified as equity, it shall not be remeasured.
(e) Operating segmentsAn operating segment is a component of an entity that engages in business activities from which it may earn revenues and incur expenses (including revenues and expenses relating to transactions
with other components of the same entity), whose operating results are regularly reviewed by the entity’s chief operating decision makers to make decisions about resources to be allocated to the segment and assess its performance and for which discrete financial information is available. Management also considers other factors in determining operating segments such as the existence of a line manager and the level of segment information presented to the Board of Directors.
Operating segments have been identified based on the information provided to the chief operating decision makers - being the Board of Directors, the Chief Financial Officer and the Chief Operating Officers of Staffing Services, Managed Services and Specialist Products. The accounting policies applied by the Group in the operating segments internally are consistent with the accounting policies of the Group.
Operating segments that meet the quantitative criteria as prescribed by AASB 8 are reported separately. However, an operating segment that does not meet the quantitative criteria is still reported separately where information about the segment would be useful to users of the financial statements. AASB 8 disclosures are shown in note 4.
(f) Revenue recognitionRevenue is recognised to the extent that it is probable that the economic benefits will flow to the Group and the revenue can be reliably measured. The following specific recognition criteria must also be met before revenue is recognised:
(i) Rendering of servicesRevenue is measured at fair value of the consideration received or receivable taking into account trade discounts and volume rebates.
Revenue from temporary placements is recognised on an accrual basis in accordance with the time worked indicated on client approved time sheets.
Permanent placement fees are recognised on the candidate’s acceptance of the role.
Revenue from rendering of services is recognised upon the delivery of services.
Sales of consulting services are recognised in the accounting period in which the services are rendered. For fixed-price contracts, revenue is recognised under the percentage of completion method, based on the actual service provided as a proportion of the total services to be provided. Services provided but not yet billed are taken up as accrued revenue.
Sales of software are recognised on delivery and installation of the software and the specific terms contained within the customer contract for delivery and installation of the software.
Notes to the Financial statementscontinued
For
per
sona
l use
onl
y
36 Chandler Macleod Group Limited Annual Report 2014
2. sUmmARy OF sigNiFicANT AccOUNTiNg POLiciEs (CONTINUED)
(f) Revenue recognition (Continued)
(ii) interest incomeRevenue is recognised as the interest accrues using the effective interest method. This is a method of calculating the amortised cost of a financial asset and allocating the interest income over the relevant period using the effective interest rate, which is the rate that exactly discounts estimated future cash receipts through the expected life of the financial asset to the net carrying amount of the financial asset.
(g) borrowing costsBorrowing costs are expensed in the Consolidated Statement of profit and loss and Comprehensive Income when incurred on an accrual basis using the effective interest method.
(h) LeasesThe determination of whether an arrangement is or contains a lease is based on the substance of the arrangement and requires an assessment of whether the fulfilment of the arrangement is dependent on the use of a specific asset or assets and the arrangement conveys a right to use the asset.
group as lessee
Finance leasesFinance leases, which transfer to the Group substantially all of the risks and benefits incidental to ownership of the leased item, are capitalised at the inception of the lease at the fair value of the leased asset or, if lower, the present value of the minimum lease payments.
Lease payments are apportioned between finance charges and reduction of the lease liability so as to achieve a constant rate of interest on the remaining balance of the liability. Finance charges are recognised as an expense in the Consolidated Statement of profit and loss and Comprehensive Income.
Capitalised leased assets are depreciated over the shorter of the estimated useful life of the asset and the lease term if there is no reasonable certainty that the Group will obtain ownership by the end of the lease term.
Operating leasesOperating lease payments are recognised as an expense in the Consolidated Statement of profit and loss and Comprehensive Income on a straight-line basis over the term of the lease (where fixed increments). Operating lease incentives are recognised as a liability when received and subsequently reduced by allocating lease payments between rental expense and reduction of the liability.
(i) cash and cash equivalentsCash and cash equivalents in the Consolidated Statement of Financial Position comprise cash at bank and in hand and short-term deposits with an original maturity of three months or less that are readily convertible to known amounts of cash and which are subject to an insignificant risk of changes in value.
For the purposes of the Cash Flow Statement, cash and cash equivalents consists of cash and cash equivalents as defined above, net of outstanding bank overdrafts. Bank overdrafts are included within interest-bearing loans and borrowings in current liabilities on the Consolidated Statement of Financial Position.
(j) Trade and other receivablesTrade receivables, which have terms between 7 and 60 days, are measured initially at fair value and subsequently at amortised cost using the effective interest rate method less an allowance for impairment.
Collectability of trade receivables is reviewed on an ongoing basis. Debts that are known to be uncollectable are written off when identified. An allowance for doubtful debts is made when there is objective evidence that the Group will not be able to collect the debts.
(k) impairment of financial assetsThe Group assesses at each reporting date whether a financial asset or group of financial assets is impaired.
Financial assets carried at costIf there is objective evidence that an impairment loss has been incurred on investment in subsidiaries that is not carried at fair value (because its fair value cannot be reliably measured), the amount of the loss is measured as the difference between the asset’s carrying amount and the present value of estimated future cash flows, discounted at the current market rate of return for a similar financial asset.
For non-financial assets other than goodwill, refer to note 2(t) for the impairment accounting policy.
(l) Foreign currency translation
(i) Functional and presentation currencyBoth the functional and presentation currency of Chandler Macleod Group Limited and its Australian subsidiaries is Australian dollars ($). Each entity in the Group determines its own functional currency and items included in the financial statements of each entity are measured using the functional currency.
Notes to the Financial statementscontinued
For
per
sona
l use
onl
y

37Chandler Macleod Group Limited Annual Report 2014
(ii) Transactions and balances Transactions in foreign currencies are initially recorded in the functional currency by applying the exchange rates ruling at the date of the transaction. Monetary assets and liabilities denominated in foreign currencies are retranslated at the rate of exchange ruling at the reporting date.
Non-monetary items that are measured in terms of historical cost in a foreign currency are translated using the exchange rate as at the date of the initial transaction.
Non-monetary items measured at fair value in a foreign currency are translated using the exchange rates at the date when the fair value was determined.
The functional currencies of the overseas subsidiaries are the currencies of the primary economic environment in which the subsidiaries operate (note 31).
As at the reporting date the assets and liabilities of these overseas subsidiaries are translated into the presentation currency of Chandler Macleod Group Limited at the rate of exchange ruling at the reporting date and their Consolidated Statement of profit and loss and Comprehensive Income are translated at the weighted average exchange rate for the year.
The exchange differences arising on the translation are taken directly to a separate component of equity. On disposal of a foreign entity, the deferred cumulative amount recognised in equity relating to that particular foreign operation is recognised in the Consolidated Statement of profit and loss and Comprehensive Income.
(m) income taxCurrent tax assets and liabilities for the current and prior periods are measured at the amount expected to be recovered from or paid to the taxation authorities based on the current period’s taxable income. The tax rates and tax laws used to compute the amount are those that are enacted or substantively enacted by the reporting date.
Deferred income tax is provided on all temporary differences at the reporting date between the tax bases of assets and liabilities and their carrying amounts for financial reporting purposes.
Deferred income tax liabilities are recognised for all taxable temporary differences except:
� when the deferred income tax liability arises from the initial recognition of goodwill or of an asset or liability in a transaction that is not a business combination and that, at the time of the transaction, affects neither the accounting profit nor taxable profit and loss; or
� when the taxable temporary difference is associated with investments in subsidiaries, associates or interests in joint ventures, and the timing of the reversal of the temporary difference can be controlled and it is probable that the temporary difference will not reverse in the foreseeable future.
Deferred income tax assets are recognised for all deductible temporary differences, carry-forward of unused tax credits and unused tax losses, to the extent that it is probable that taxable profit will be available against which the deductible temporary differences, and the carry-forward of unused tax credits and unused tax losses can be utilised except:
� when the deferred income tax asset relating to the deductible temporary difference arises from the initial recognition of an asset or liability in a transaction that is not a business combination and, at the time of the transaction, affects neither the accounting profit nor taxable profit and loss; or
� when the deductible temporary difference is associated with investments in subsidiaries, associates or interests in joint ventures, in which case a deferred tax asset is only recognised to the extent that it is probable that the temporary difference will reverse in the foreseeable future and taxable profit will be available against which the temporary difference can be utilised.
The carrying amount of deferred income tax assets is reviewed at each reporting date and reduced to the extent that it is no longer probable that sufficient taxable profit will be available to allow all or part of the deferred income tax asset to be utilised.
Unrecognised deferred income tax assets are reassessed at each reporting date and are recognised to the extent that it has become probable that future taxable profit will allow the deferred tax asset to be recovered.
Deferred income tax assets and liabilities are measured at the tax rates that are expected to apply to the year when the asset is realised or the liability is settled, based on tax rates (and tax laws) that have been enacted or substantively enacted at the reporting date.
Deferred tax assets and deferred tax liabilities are offset only if a legally enforceable right exists to set off current tax assets against current tax liabilities and the deferred tax assets and liabilities relate to the same taxable entity and the same taxation authority.
Tax consolidationEffective 1 July 2003 for the purposes of income taxation, Chandler Macleod Group Limited and its 100% owned subsidiaries in Australia formed a tax consolidation group. Members in the group entered into a tax sharing agreement in order to allocate income tax expense to the wholly-owned subsidiaries on a pro-rata basis. In addition, the agreement provides for the allocation of income tax liabilities between the entities should the head entity default on its tax payment obligations. At the balance date, the possibility of default is remote. The head entity of the tax consolidated group is Chandler Macleod Group Limited. Details of the tax funding agreement are disclosed in note 6.
Notes to the Financial statementscontinued
For
per
sona
l use
onl
y
38 Chandler Macleod Group Limited Annual Report 2014
2. sUmmARy OF sigNiFicANT AccOUNTiNg POLiciEs (CONTINUED)
(n) Other taxesRevenues, expenses and assets are recognised net of the amount of GST except:
� when the GST incurred on a purchase of goods and services is not recoverable from the taxation authority, in which case the GST is recognised as part of the cost of acquisition of the asset or as part of the expense item as applicable; and
� receivables and payables, which are stated with the amount of GST included.
The net amount of GST recoverable from, or payable to, the taxation authority is included as part of receivables or payables in the Consolidated Statement of Financial Position.
Cash flows are included in the Cash Flow Statement on a gross basis and the GST components of cash flows arising from investing and financing activities, which is recoverable from, or payable to, the taxation authority are classified as operating cash flows. Commitments and contingencies are disclosed net of the amount of GST recoverable from, or payable to, the taxation authority.
(o) Property and office equipmentPlant and equipment is stated at historical cost less accumulated depreciation and any accumulated impairment losses. Such cost includes the cost of replacing parts that are eligible for capitalisation when the cost of replacing the parts is incurred. Similarly, when each major inspection is performed, its cost is recognised in the carrying amount of the plant and equipment as a replacement only if it is eligible for capitalisation. All other repairs and maintenance are recognised in Consolidated Statement of profit and loss and Comprehensive Income as incurred.
Depreciation is calculated on a straight-line basis over the estimated useful life of the assets as follows:
Life method
Leasehold improvements 3 - 5 Yrs Straight Line
Office equipment 3 - 5 Yrs Straight Line
Leased assets 3 - 5 Yrs Straight Line
The assets’ residual values, useful lives and depreciation methods are reviewed, and adjusted if appropriate, at each financial year end.
derecognition and disposalAn item of Property and office equipment is derecognised upon disposal or when no further future economic benefits are expected from its use or disposal.
Any gain or loss arising on derecognition of the asset (calculated as the difference between the net disposal proceeds and the carrying amount of the asset) is included in Other Income/Expense in the Consolidated Statement of profit and loss and Comprehensive Income in the year the asset is derecognised.
(p) Other financial assets / liabilitiesFinancial assets are recognised initially at fair value, plus directly attributable transaction costs. The Group determines the classification of its financial assets after initial recognition and, when allowed and appropriate, re-evaluates this designation at each financial year end.
(i) Loans and receivablesLoans and receivables are non-derivative financial assets with fixed or determinable payments that are not quoted in an active market. Such assets are subject to impairment testing at least annually. Refer to note 2(t) for the impairment accounting policy.
(ii) Parent company investment in subsidiariesInvestments in subsidiaries and associates are carried at cost in the Consolidated Statement of Financial Position of the parent entity.
(iii) interest rate swapThe Group uses interest rate swaps to manage its exposure to interest rates. Interest rate swaps are initially recognised at fair value at the date the contract is entered into and are subsequently remeasured to the fair value at the end of each reporting period. At 30 June 2014, the interest rate swap is designated as an effective hedging instrument and the resulting gain or loss is recognised in the hedging reserves.
(q) derecognition of financial assetsFinancial assets are derecognised when the right to receive cash flows from the financial assets has expired or when the entity transfers substantially all the risks and rewards of the financial assets. If the entity neither retains nor transfers substantially all of the risks and rewards, it derecognises the asset if it has transferred control of the assets.
(r) goodwillGoodwill acquired in a business combination is initially measured at cost being the excess of the cost of the business combination over the Group’s interest in the net fair value of the acquiree’s identifiable assets, liabilities and contingent liabilities.
Following initial recognition, goodwill is measured at cost less any accumulated impairment losses. Goodwill is reviewed for impairment, annually or more frequently if events or changes in circumstances indicate that the carrying value may be impaired.
Notes to the Financial statementscontinued
For
per
sona
l use
onl
y
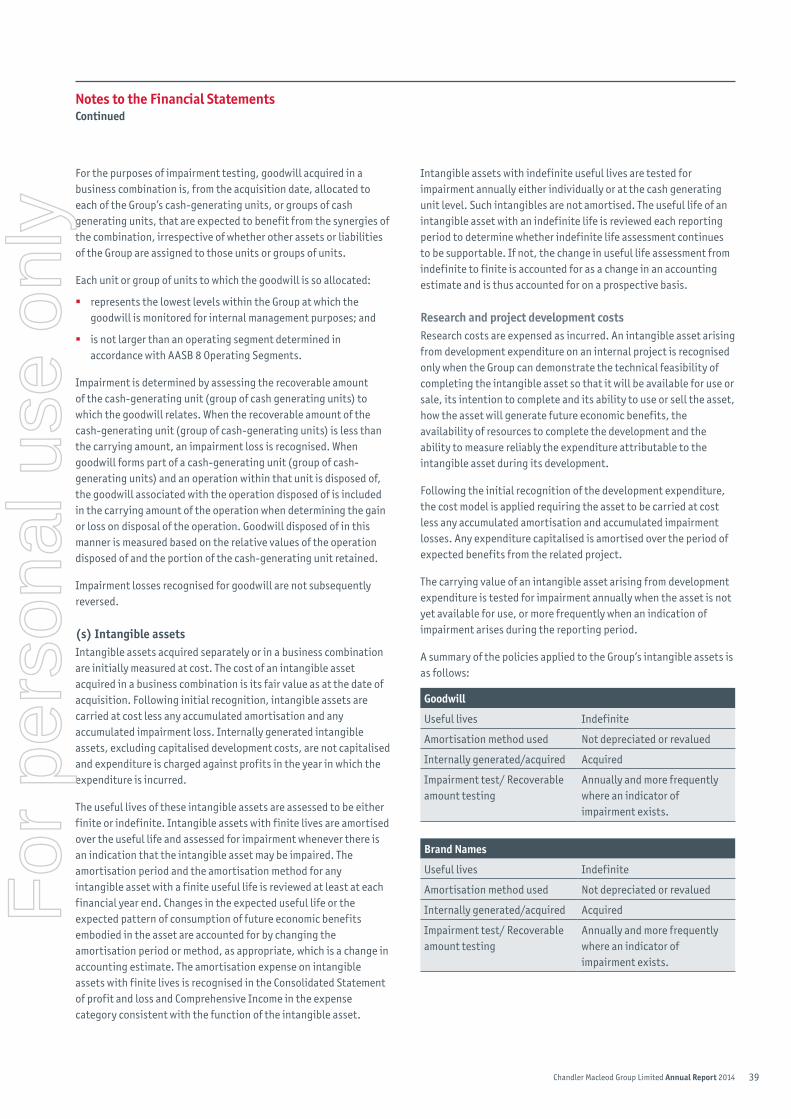
39Chandler Macleod Group Limited Annual Report 2014
For the purposes of impairment testing, goodwill acquired in a business combination is, from the acquisition date, allocated to each of the Group’s cash-generating units, or groups of cash generating units, that are expected to benefit from the synergies of the combination, irrespective of whether other assets or liabilities of the Group are assigned to those units or groups of units.
Each unit or group of units to which the goodwill is so allocated:
� represents the lowest levels within the Group at which the goodwill is monitored for internal management purposes; and
� is not larger than an operating segment determined in accordance with AASB 8 Operating Segments.
Impairment is determined by assessing the recoverable amount of the cash-generating unit (group of cash generating units) to which the goodwill relates. When the recoverable amount of the cash-generating unit (group of cash-generating units) is less than the carrying amount, an impairment loss is recognised. When goodwill forms part of a cash-generating unit (group of cash-generating units) and an operation within that unit is disposed of, the goodwill associated with the operation disposed of is included in the carrying amount of the operation when determining the gain or loss on disposal of the operation. Goodwill disposed of in this manner is measured based on the relative values of the operation disposed of and the portion of the cash-generating unit retained.
Impairment losses recognised for goodwill are not subsequently reversed.
(s) intangible assetsIntangible assets acquired separately or in a business combination are initially measured at cost. The cost of an intangible asset acquired in a business combination is its fair value as at the date of acquisition. Following initial recognition, intangible assets are carried at cost less any accumulated amortisation and any accumulated impairment loss. Internally generated intangible assets, excluding capitalised development costs, are not capitalised and expenditure is charged against profits in the year in which the expenditure is incurred.
The useful lives of these intangible assets are assessed to be either finite or indefinite. Intangible assets with finite lives are amortised over the useful life and assessed for impairment whenever there is an indication that the intangible asset may be impaired. The amortisation period and the amortisation method for any intangible asset with a finite useful life is reviewed at least at each financial year end. Changes in the expected useful life or the expected pattern of consumption of future economic benefits embodied in the asset are accounted for by changing the amortisation period or method, as appropriate, which is a change in accounting estimate. The amortisation expense on intangible assets with finite lives is recognised in the Consolidated Statement of profit and loss and Comprehensive Income in the expense category consistent with the function of the intangible asset.
Intangible assets with indefinite useful lives are tested for impairment annually either individually or at the cash generating unit level. Such intangibles are not amortised. The useful life of an intangible asset with an indefinite life is reviewed each reporting period to determine whether indefinite life assessment continues to be supportable. If not, the change in useful life assessment from indefinite to finite is accounted for as a change in an accounting estimate and is thus accounted for on a prospective basis.
Research and project development costsResearch costs are expensed as incurred. An intangible asset arising from development expenditure on an internal project is recognised only when the Group can demonstrate the technical feasibility of completing the intangible asset so that it will be available for use or sale, its intention to complete and its ability to use or sell the asset, how the asset will generate future economic benefits, the availability of resources to complete the development and the ability to measure reliably the expenditure attributable to the intangible asset during its development.
Following the initial recognition of the development expenditure, the cost model is applied requiring the asset to be carried at cost less any accumulated amortisation and accumulated impairment losses. Any expenditure capitalised is amortised over the period of expected benefits from the related project.
The carrying value of an intangible asset arising from development expenditure is tested for impairment annually when the asset is not yet available for use, or more frequently when an indication of impairment arises during the reporting period.
A summary of the policies applied to the Group’s intangible assets is as follows:
goodwill
Useful lives Indefinite
Amortisation method used Not depreciated or revalued
Internally generated/acquired Acquired
Impairment test/ Recoverable amount testing
Annually and more frequently where an indicator of impairment exists.
brand Names
Useful lives Indefinite
Amortisation method used Not depreciated or revalued
Internally generated/acquired Acquired
Impairment test/ Recoverable amount testing
Annually and more frequently where an indicator of impairment exists.
Notes to the Financial statementscontinued
For
per
sona
l use
onl
y
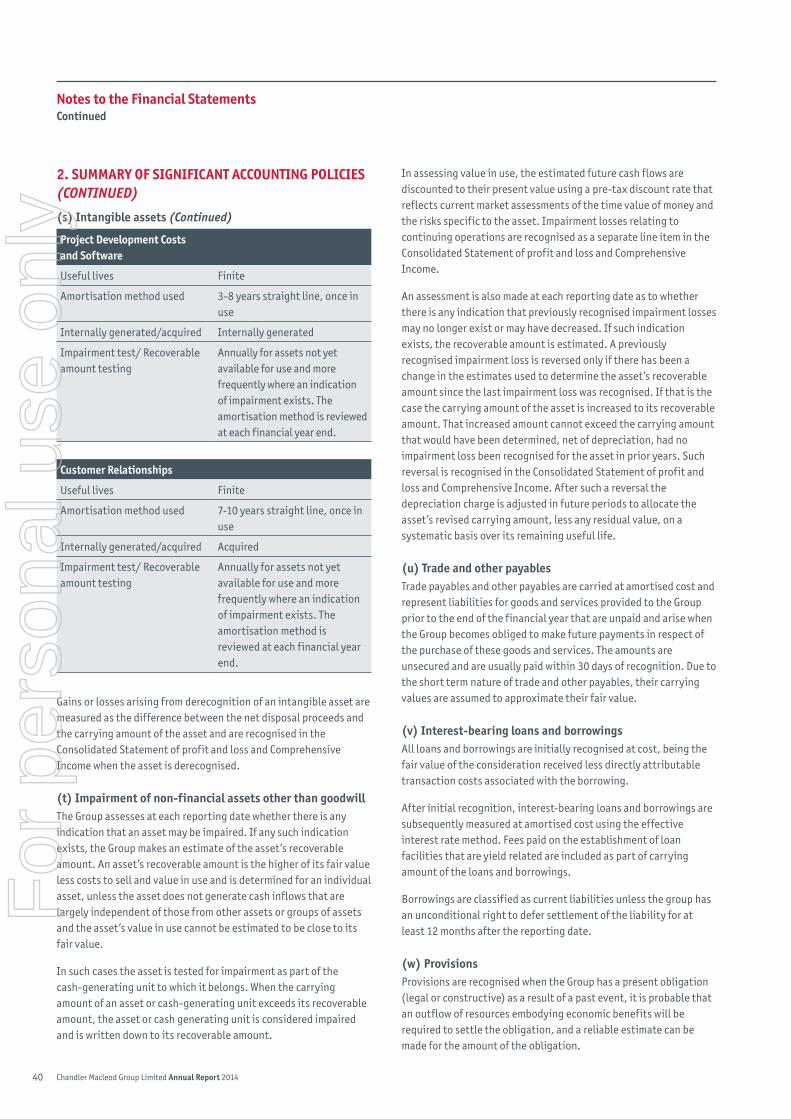
40 Chandler Macleod Group Limited Annual Report 2014
2. sUmmARy OF sigNiFicANT AccOUNTiNg POLiciEs (CONTINUED)
(s) intangible assets (Continued)
Project development costs and software
Useful lives Finite
Amortisation method used 3-8 years straight line, once in use
Internally generated/acquired Internally generated
Impairment test/ Recoverable amount testing
Annually for assets not yet available for use and more frequently where an indication of impairment exists. The amortisation method is reviewed at each financial year end.
customer Relationships
Useful lives Finite
Amortisation method used 7-10 years straight line, once in use
Internally generated/acquired Acquired
Impairment test/ Recoverable amount testing
Annually for assets not yet available for use and more frequently where an indication of impairment exists. The amortisation method is reviewed at each financial year end.
Gains or losses arising from derecognition of an intangible asset are measured as the difference between the net disposal proceeds and the carrying amount of the asset and are recognised in the Consolidated Statement of profit and loss and Comprehensive Income when the asset is derecognised.
(t) impairment of non-financial assets other than goodwillThe Group assesses at each reporting date whether there is any indication that an asset may be impaired. If any such indication exists, the Group makes an estimate of the asset’s recoverable amount. An asset’s recoverable amount is the higher of its fair value less costs to sell and value in use and is determined for an individual asset, unless the asset does not generate cash inflows that are largely independent of those from other assets or groups of assets and the asset’s value in use cannot be estimated to be close to its fair value.
In such cases the asset is tested for impairment as part of the cash-generating unit to which it belongs. When the carrying amount of an asset or cash-generating unit exceeds its recoverable amount, the asset or cash generating unit is considered impaired and is written down to its recoverable amount.
In assessing value in use, the estimated future cash flows are discounted to their present value using a pre-tax discount rate that reflects current market assessments of the time value of money and the risks specific to the asset. Impairment losses relating to continuing operations are recognised as a separate line item in the Consolidated Statement of profit and loss and Comprehensive Income.
An assessment is also made at each reporting date as to whether there is any indication that previously recognised impairment losses may no longer exist or may have decreased. If such indication exists, the recoverable amount is estimated. A previously recognised impairment loss is reversed only if there has been a change in the estimates used to determine the asset’s recoverable amount since the last impairment loss was recognised. If that is the case the carrying amount of the asset is increased to its recoverable amount. That increased amount cannot exceed the carrying amount that would have been determined, net of depreciation, had no impairment loss been recognised for the asset in prior years. Such reversal is recognised in the Consolidated Statement of profit and loss and Comprehensive Income. After such a reversal the depreciation charge is adjusted in future periods to allocate the asset’s revised carrying amount, less any residual value, on a systematic basis over its remaining useful life.
(u) Trade and other payablesTrade payables and other payables are carried at amortised cost and represent liabilities for goods and services provided to the Group prior to the end of the financial year that are unpaid and arise when the Group becomes obliged to make future payments in respect of the purchase of these goods and services. The amounts are unsecured and are usually paid within 30 days of recognition. Due to the short term nature of trade and other payables, their carrying values are assumed to approximate their fair value.
(v) interest-bearing loans and borrowingsAll loans and borrowings are initially recognised at cost, being the fair value of the consideration received less directly attributable transaction costs associated with the borrowing.
After initial recognition, interest-bearing loans and borrowings are subsequently measured at amortised cost using the effective interest rate method. Fees paid on the establishment of loan facilities that are yield related are included as part of carrying amount of the loans and borrowings.
Borrowings are classified as current liabilities unless the group has an unconditional right to defer settlement of the liability for at least 12 months after the reporting date.
(w) ProvisionsProvisions are recognised when the Group has a present obligation (legal or constructive) as a result of a past event, it is probable that an outflow of resources embodying economic benefits will be required to settle the obligation, and a reliable estimate can be made for the amount of the obligation.
Notes to the Financial statementscontinued
For
per
sona
l use
onl
y
41Chandler Macleod Group Limited Annual Report 2014
Where the Group expects some or all of a provision to be reimbursed, for example under an insurance contract, the reimbursement is recognised as a separate asset but only when the reimbursement is virtually certain. The expense relating to any provision is presented in the Consolidated Statement of profit and loss and Comprehensive Income net of any reimbursement.
Provisions are measured at the present value of management’s best estimate of the expenditure required to settle the present obligation at the reporting date. If the effect of the time value of money is material, provisions are determined by discounting the expected future cash flows at a pre-tax rate that reflects current market assessments of the time value of money and, where appropriate, the risks specific to the liability.
When discounting is used, the increase in the provision due to the passage of time is recognised as a borrowing cost.
(x) Employee leave benefitsProvision is made for employee benefits accumulated as a result of employees rendering services up to the reporting date. These benefits include wages and salaries, annual leave and long service leave.
(i) wages, salaries and annual leaveLiabilities for wages and salaries, including non-monetary benefits and annual leave expected to be settled within 12 months of the reporting date are recognised in Provisions in respect of employees’ services up to the reporting date. They are measured at the amounts expected to be paid when the liabilities are settled.
(ii) Long service leaveThe liability for long service leave is recognised in the provision for employee benefits and is measured as the present value of expected future payments to be made in respect of services provided by the employees up to the reporting date. Consideration is given to expected future wage and salary levels, experience of employee departures, and periods of service. Expected future payments are discounted using market yields at the reporting date on national government bonds with terms to maturity and currencies that match, as closely as possible, the estimated future cash outflows.
(y) share-based payment transactions
(i) Equity-settled transactionsThe Group provides benefits to employees (including senior executives) of the Group in the form of share-based payments, whereby employees render services in exchange for shares or rights over shares (equity-settled transactions).
The Group has a number of employee share plans, namely:
� the Exempt Employee Share Plan (‘EESP’), a ‘salary sacrifice’ type plan which commenced on 1 July 2006 and provides benefits to all employees who earn no more than $180,000 per annum;
� the Deferred Tax Employee Share Plan (‘DTESP’), a ‘salary sacrifice’ type plan which also commenced on 1 July 2006 and provides benefits to all employees. The operation of this plan was discontinued from 1 July 2013;
� the Senior Executive Option Plan (‘SEOP’) is applicable to senior executives and commenced on 21 November 2007 after being approved by the Company’s shareholders at its 2007 Annual General Meeting;
� the Senior Executive Share Plan (‘SESP’), an incentive plan for meeting certain performance targets, which commenced on 17 December 2007, having been approved by the Company’s shareholders at its 2007 Annual General Meeting.
The dilutive effect of outstanding options and shares allocated under the Senior Executive Share Plan are reflected as additional share dilution in the computation of earnings per share. The cumulative expense recognised for equity-settled transactions at each reporting date until vesting date reflects the extent to which the vesting period has expired. This opinion is formed based on the best available information at balance date.
(z) contributed equityOrdinary shares are classified as equity. Incremental costs directly attributable to the issue of new shares or options are shown in equity as a deduction, net of tax, from the proceeds.
(aa) Earnings per shareBasic earnings per share (‘EPS’) is calculated as net profit attributable to members of parent company, adjusted to exclude costs of servicing equity (other than dividends) and preference share dividends, divided by the weighted average number of ordinary shares, adjusted for any bonus element.
Diluted EPS is calculated as net profit attributable to members of the parent company, adjusted for:
� costs of servicing equity (other than dividends) and preference share dividends;
� the after tax effect of dividends and interest associated with dilutive potential ordinary shares that have been recognised as expenses; and
� other non-discretionary changes in revenues or expenses during the period that would result from the dilution of potential ordinary shares;
divided by the weighted average number of ordinary shares and dilutive potential ordinary shares, adjusted for any bonus element.
Notes to the Financial statementscontinued
For
per
sona
l use
onl
y
42 Chandler Macleod Group Limited Annual Report 2014
2. SUMMARY OF SIGNIFICANT ACCOUNTING POLICIES (CONTINUED)
(ab) comparatives
Prior period adjustments During the 2013 financial year, CMG acquired 100% of the shares in Vivir. In accordance with accounting standards, CMG provisionally recognised the fair value of assets and liabilities acquired from Vivir in the Consolidated Statement of Financial Position as at 30 June 2013.
The fair value of the net assets acquired was finalised in the current financial year and as a result, the previously reported balances have been adjusted in the comparative period. Please refer to note 23 (d) for details.
3. sigNiFicANT AccOUNTiNg JUdgEmENTs, EsTimATEs ANd AssUmPTiONsThe preparation of the financial statements requires management to make judgements, estimates and assumptions that affect the reported amounts in the financial statements. Management continually evaluates judgements, estimates and assumptions based on experience and other factors, including expectations of future events that may have an impact on the Group. All judgements, estimates and assumptions made are believed to be reasonable based on the most current set of circumstances available to management. Actual results may differ from these estimates under different assumptions and conditions.
Management has identified the following critical accounting policies for which significant judgements, estimates and assumptions are made. Actual results may differ from these estimates under different assumptions and conditions and may materially affect financial results or the financial position reported in future periods.
significant accounting judgements
impairment of non-financial assets other than goodwillThe Group assesses impairment of all assets at each reporting date by evaluating conditions specific to the Group and to the particular asset that may lead to impairment. These include brand and performance, technology, economic and political environments and future brand expectations. If an impairment trigger exists the recoverable amount of the asset is determined.
This involves value in use calculations, which incorporate a number of key estimates and assumptions.
capitalised development costsDevelopment costs are only capitalised by the Group when it can be demonstrated that the technical feasibility of completing the intangible asset is valid so that the asset will be available for use or sale.
significant accounting estimates and assumptions
impairment of goodwill and intangibles with indefinite useful livesThe Group determines whether goodwill and intangibles with indefinite useful lives are impaired at least on an annual basis.
This requires an estimation of the recoverable amount of the cash-generating units to which the goodwill and intangibles with indefinite useful lives are allocated. The assumptions used in this estimation of recoverable amount and the carrying amount of goodwill and intangibles with indefinite useful lives are outlined in note 16.
Allowance for impairment loss on trade receivablesWhere receivables are outstanding beyond the normal trading terms, the likelihood of the recovery of these receivables is assessed by management. A provision for impairment loss is recognised when there is objective evidence that the trade receivables are impaired. The impairment losses are outlined in note 10.
Long service leave provisionThe liability for long service leave is recognised and measured at the present value of the estimated future cash flows to be made in respect of all employees at balance date. In determining the present value of the liability, attrition rates and pay increases through promotion and inflation have been taken into account.
workers compensation provisionThe workers compensation premiums are determined based on the industry in which the Group operates, the amount of wages the Group pays and the Group’s claims experience.
make good provisionProvision is made for the anticipated cost of future restoration of leased premises. The provision includes future cost estimates associated in “making good” premises at the end of the Group’s occupancy. These future cost estimates are discounted to their present value. The calculation of this provision requires assumption as to the likely term of occupancy and expected costs of “make-good”. The related carrying amounts are disclosed in note 20.
Notes to the Financial statementscontinued
For
per
sona
l use
onl
y

43Chandler Macleod Group Limited Annual Report 2014
Estimation of useful lives of assetsThe estimation of the useful lives of assets has been based on historical experience as well as manufacturers’ warranties (for plant and equipment), lease terms (for leased equipment) and turnover policies (for motor vehicles). In addition, the condition of the assets is assessed at least once per year and considered against the remaining useful life. Adjustments to useful life are made when considered necessary. Depreciation charges are included in note 13.
share-based payment transactionsThe Group measures the cost of equity-settled transactions with employees by reference to the fair value of the equity instruments at the date at which they are granted. The fair value of the Share Option Plan is determined using the Black-Scholes model. The accounting estimates and assumptions relating to equity-settled share-based payments would have no impact on the carrying amounts of assets and liabilities within the next annual reporting period but may impact expenses and equity.
Uninsured risks provisionUninsured risks comprise insurance deductibles and provisions for outstanding litigation. The carrying amount reflects the best estimate of claims based on the available information as at the end of the period.
Unused tax lossesDeferred tax assets are recognised for all unused tax losses to the extent that it is probable that taxable profit will be available against which the losses can be utilised. Significant management judgement is required to determine the amount of deferred tax assets that can be recognised, based upon the likely timing and the level of future taxable profits together with future tax planning strategies.
Fair value measurement of contingent consideration Contingent consideration, resulting from business combinations, is valued at fair value at the acquisition date as part of the business combination. When the contingent consideration meets the definition of a financial instrument and, thus, a financial liability, it is subsequently remeasured to fair value at each reporting date. The determination of the fair value is based on discounted cash flows. The key assumptions take into consideration the probability of meeting each performance target and the discount factor.
4. OPERATiNg sEgmENTs
identification of reportable segmentsThe Group has identified its operating segments based on the internal reports that are reviewed and used by the Board of Directors, the Chief Financial Officer and the Chief Operating Officers of Staffing Services, Managed Services and Specialist Products (the chief operating decision makers - CODM) in assessing performance and in determining the allocation of resources. The operating segments are identified by management based on the nature of the services provided. Discrete financial information about each of these operating businesses is reported to the CODM on at least a monthly basis.
Staffing Services consists of Workforce and Recruitment.
Managed Services consists of managed training solutions, business process outsourcing services, aviation, AHS and Vivir business.Specialist Products consists of consulting, payroll outsourcing and payroll software services.
International consists of Hong Kong, China, Singapore, Indonesia, New Zealand, UK and Ireland.
Amounts not relating to the above reportable segments are classified as Unallocated in the segment analysis below.
Accounting policies and inter-segment transactionsThe accounting policies used by the Group in reporting segments internally are the same as those contained in note 2.
inter-segment salesTransfer prices between business segments are set on an arm’s length basis in a manner similar to transactions with third parties. Segment revenue, segment expense and segment result include transfers between business segments. Those transfers are eliminated on consolidation.
corporate chargesCorporate charges comprise non-segmental expenses such as head office expenses and interest. Corporate charges are allocated to each business segment on a proportionate basis linked to segment revenue so as to determine a segmental result.
major customersThe Group has a number of customers to which it provides services. During the period, one customer generated 11.4% of the Group’s total revenue (2013: 13%). These revenues are attributable to all reportable segments. For the purpose of identifying the major customers the Group considered entities under common control as a single customer.
Notes to the Financial statementscontinued
For
per
sona
l use
onl
y
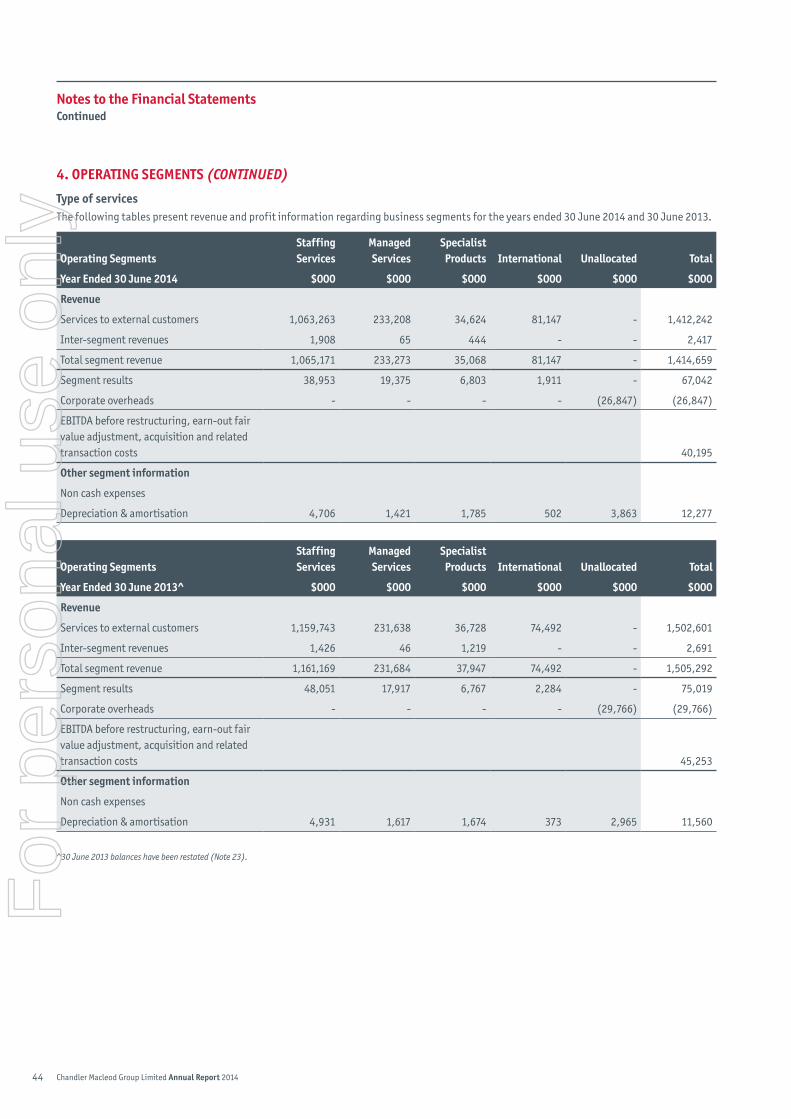
44 Chandler Macleod Group Limited Annual Report 2014
4. OPERATiNg sEgmENTs (CONTINUED)
Type of servicesThe following tables present revenue and profit information regarding business segments for the years ended 30 June 2014 and 30 June 2013.
Operating segmentsstaffing services
managed services
specialist Products international Unallocated Total
year Ended 30 June 2014 $000 $000 $000 $000 $000 $000
Revenue
Services to external customers 1,063,263 233,208 34,624 81,147 - 1,412,242
Inter-segment revenues 1,908 65 444 - - 2,417
Total segment revenue 1,065,171 233,273 35,068 81,147 - 1,414,659
Segment results 38,953 19,375 6,803 1,911 - 67,042
Corporate overheads - - - - (26,847) (26,847)
EBITDA before restructuring, earn-out fair value adjustment, acquisition and related transaction costs 40,195
Other segment information
Non cash expenses
Depreciation & amortisation 4,706 1,421 1,785 502 3,863 12,277
Operating segmentsstaffing services
managed services
specialist Products international Unallocated Total
year Ended 30 June 2013^ $000 $000 $000 $000 $000 $000
Revenue
Services to external customers 1,159,743 231,638 36,728 74,492 - 1,502,601
Inter-segment revenues 1,426 46 1,219 - - 2,691
Total segment revenue 1,161,169 231,684 37,947 74,492 - 1,505,292
Segment results 48,051 17,917 6,767 2,284 - 75,019
Corporate overheads - - - - (29,766) (29,766)
EBITDA before restructuring, earn-out fair value adjustment, acquisition and related transaction costs 45,253
Other segment information
Non cash expenses
Depreciation & amortisation 4,931 1,617 1,674 373 2,965 11,560
^30 June 2013 balances have been restated (Note 23).
Notes to the Financial statementscontinued
For
per
sona
l use
onl
y

45Chandler Macleod Group Limited Annual Report 2014
Revenue by geographical locationsAll revenue from the Managed Services, Staffing Services and Specialist Products segments are derived in Australia.
International segment revenue is derived mainly from New Zealand (AUD $32.8 million) and Hong Kong (AUD $27.4 million), with the remainder (AUD $20.8 million) from the various countries the Group operates in.
segment revenue reconciliation to the consolidated statement of profit and loss and comprehensive income
2014 2013
$000 $000
Total segment revenue 1,414,659 1,505,292
Inter-segment sales elimination (2,417) (2,691)
Other income 955 1,308
Total revenue from operations per the Consolidated Statement of profit and loss and Comprehensive Income 1,413,197 1,503,909
segment earnings before interest, tax, depreciation and amortisation (EbiTdA) reconciliation to the consolidated statement of profit and loss and comprehensive income
2014 2013
$000 $000
EBITDA before restructuring, fair value adjustment to contingent consideration, and transaction related costs 40,196 45,253
Acquisition transaction related costs (565) (1,630)
Restructuring costs (4,252) (7,333)
Fair value adjustment to contingent consideration 2,775 1,800
Depreciation and amortisation expense (12,277) (11,560)
Impairment of intangibles - (2,700)
Finance costs (8,504) (8,482)
Income tax expense (3,904) (4,640)
Net profit from operations per the Consolidated Statement of profit and loss and Comprehensive Income 13,469 10,708
Notes to the Financial statementscontinued
For
per
sona
l use
onl
y

46 Chandler Macleod Group Limited Annual Report 2014
5. REVENUEs ANd EXPENsEs2014 2013
Note $000 $000
Expenses
(a) Employee benefits expense
Wages and salaries 97,955 106,221
Superannuation 7,019 7,692
Share-based payments 29 (a) 655 1,009
Other employee benefits 9,669 10,273
115,298 125,195
(b) Amortisation expense
Amortisation of software 3,664 3,136
Amortisation of acquired intangible assets 3,864 3,489
Total amortisation 14 7,528 6,625
(c) Finance costs
Finance costs
- Bank loans and overdrafts 8,010 8,805
- Finance charges payable under finance leases 204 47
- Interest expense others 64 37
- Non cash interest 246 (373)
Total finance costs 8,524 8,516
Finance income
- Bank interest receivable (20) (34)
Total finance income (20) (34)
Total finance costs 8,504 8,482
(d) Other expense items
Minimum lease payments - Operating leases 10,370 10,995
Doubtful debts - trade debtors 10 155 20
Gain on disposal of non-current assets (7) (71)
Net foreign exchange loss/(gain) 38 (27)
Restructuring costs comprising:
Employee benefits expense 3,372 7,333
Administration costs - onerous lease provision and others 880 -
Income tax benefit (1,261) (2,200)
Restructuring costs, net of tax 2,991 5,133
Notes to the Financial statementscontinued
For
per
sona
l use
onl
y

47Chandler Macleod Group Limited Annual Report 2014
6. iNcOmE TAX The major components of income tax expense are:
2014 2013^
$000 $000
consolidated statement of profit or loss
Current income tax
Current income tax charge 6,573 3,973
Adjustments in respect of current income tax of previous years (340) (317)
Deferred income tax
Relating to origination and reversal of temporary differences (2,329) 984
income tax expense reported in the statement of profit or loss 3,904 4,640
income tax recognised directly in equity
Share based payments (563) -
Capital raising costs (172) -
Net movement on revaluation of cash flow hedges 155 24
income tax recognised in equity (580) 24
A reconciliation between tax expense and the product of accounting profit before income tax multiplied by the Group’s applicable income tax rate is as follows:
2014 2013^
Note $000 $000
Total accounting profit before income tax 17,373 15,348
At the Group’s statutory income tax rate of 30% (2013: 30%) 5,212 4,604
Adjustments in respect of net income tax of previous years, including utilisation of previously unrecognised tax losses
(340) (302)
Tax losses not brought to account 9 19
Accounting profit on disposal of controlled entity (98) -
Impairment of intangible - 810
Change in contingent consideration on acquisition of Vivir 23 (833) (540)
Expenditure not allowable for income tax purposes 101 76
Other (147) (27)
Aggregate income tax expense 3,904 4,640
^30 June 2013 balances have been restated (Note 23d)
Notes to the Financial statementscontinued
For
per
sona
l use
onl
y
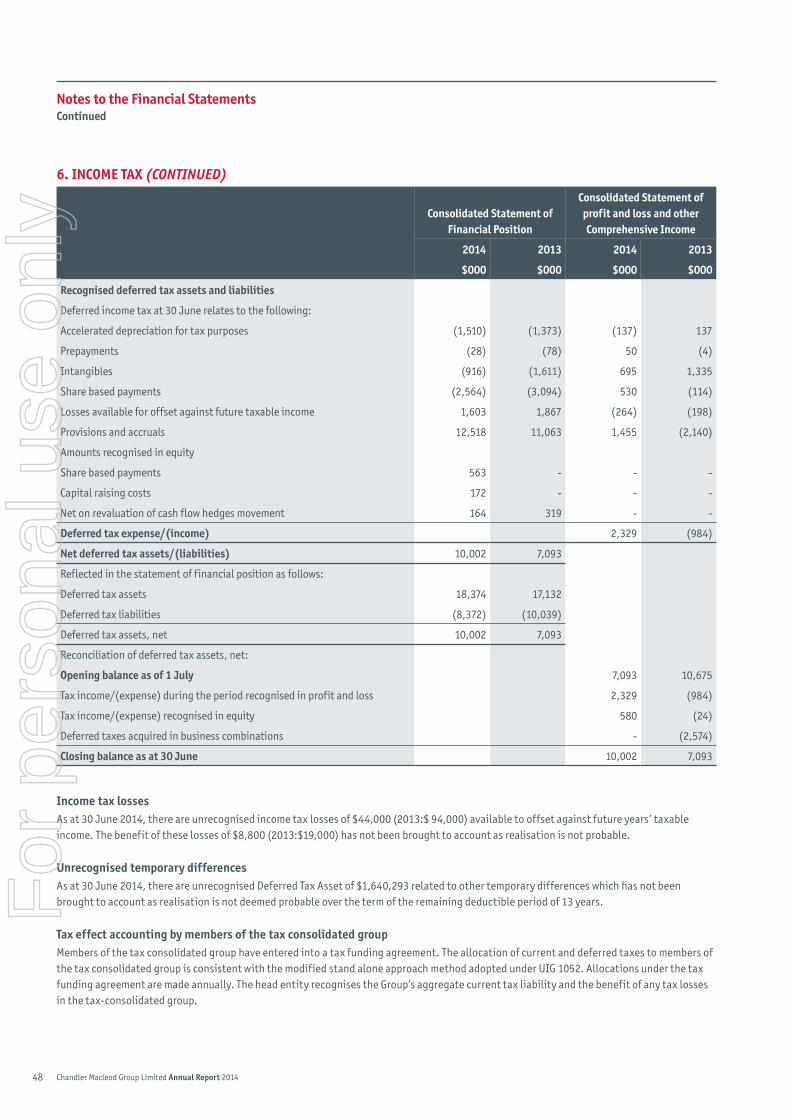
48 Chandler Macleod Group Limited Annual Report 2014
6. iNcOmE TAX (CONTINUED)
consolidated statement of Financial Position
consolidated statement of profit and loss and other comprehensive income
2014 2013 2014 2013
$000 $000 $000 $000
Recognised deferred tax assets and liabilities
Deferred income tax at 30 June relates to the following:
Accelerated depreciation for tax purposes (1,510) (1,373) (137) 137
Prepayments (28) (78) 50 (4)
Intangibles (916) (1,611) 695 1,335
Share based payments (2,564) (3,094) 530 (114)
Losses available for offset against future taxable income 1,603 1,867 (264) (198)
Provisions and accruals 12,518 11,063 1,455 (2,140)
Amounts recognised in equity
Share based payments 563 - - -
Capital raising costs 172 - - -
Net on revaluation of cash flow hedges movement 164 319 - -
deferred tax expense/(income) 2,329 (984)
Net deferred tax assets/(liabilities) 10,002 7,093
Reflected in the statement of financial position as follows:
Deferred tax assets 18,374 17,132
Deferred tax liabilities (8,372) (10,039)
Deferred tax assets, net 10,002 7,093
Reconciliation of deferred tax assets, net:
Opening balance as of 1 July 7,093 10,675
Tax income/(expense) during the period recognised in profit and loss 2,329 (984)
Tax income/(expense) recognised in equity 580 (24)
Deferred taxes acquired in business combinations - (2,574)
closing balance as at 30 June 10,002 7,093
income tax lossesAs at 30 June 2014, there are unrecognised income tax losses of $44,000 (2013:$ 94,000) available to offset against future years’ taxable income. The benefit of these losses of $8,800 (2013:$19,000) has not been brought to account as realisation is not probable.
Unrecognised temporary differencesAs at 30 June 2014, there are unrecognised Deferred Tax Asset of $1,640,293 related to other temporary differences which has not been brought to account as realisation is not deemed probable over the term of the remaining deductible period of 13 years.
Tax effect accounting by members of the tax consolidated groupMembers of the tax consolidated group have entered into a tax funding agreement. The allocation of current and deferred taxes to members of the tax consolidated group is consistent with the modified stand alone approach method adopted under UIG 1052. Allocations under the tax funding agreement are made annually. The head entity recognises the Group’s aggregate current tax liability and the benefit of any tax losses in the tax-consolidated group.
Notes to the Financial statementscontinued
For
per
sona
l use
onl
y
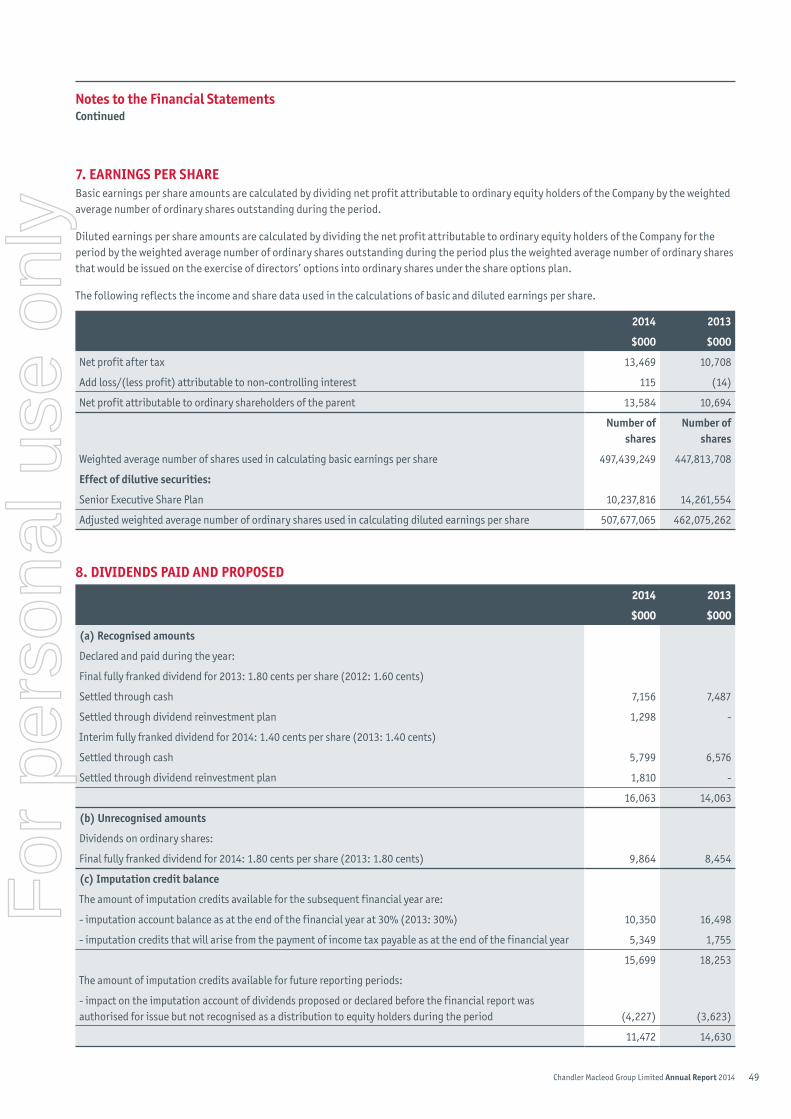
49Chandler Macleod Group Limited Annual Report 2014
7. EARNiNgs PER shAREBasic earnings per share amounts are calculated by dividing net profit attributable to ordinary equity holders of the Company by the weighted average number of ordinary shares outstanding during the period.
Diluted earnings per share amounts are calculated by dividing the net profit attributable to ordinary equity holders of the Company for the period by the weighted average number of ordinary shares outstanding during the period plus the weighted average number of ordinary shares that would be issued on the exercise of directors’ options into ordinary shares under the share options plan.
The following reflects the income and share data used in the calculations of basic and diluted earnings per share.
2014 2013
$000 $000
Net profit after tax 13,469 10,708
Add loss/(less profit) attributable to non-controlling interest 115 (14)
Net profit attributable to ordinary shareholders of the parent 13,584 10,694
Number of shares
Number of shares
Weighted average number of shares used in calculating basic earnings per share 497,439,249 447,813,708
Effect of dilutive securities:
Senior Executive Share Plan 10,237,816 14,261,554
Adjusted weighted average number of ordinary shares used in calculating diluted earnings per share 507,677,065 462,075,262
8. diVidENds PAid ANd PROPOsEd 2014 2013
$000 $000
(a) Recognised amounts
Declared and paid during the year:
Final fully franked dividend for 2013: 1.80 cents per share (2012: 1.60 cents)
Settled through cash 7,156 7,487
Settled through dividend reinvestment plan 1,298 -
Interim fully franked dividend for 2014: 1.40 cents per share (2013: 1.40 cents)
Settled through cash 5,799 6,576
Settled through dividend reinvestment plan 1,810 -
16,063 14,063
(b) Unrecognised amounts
Dividends on ordinary shares:
Final fully franked dividend for 2014: 1.80 cents per share (2013: 1.80 cents) 9,864 8,454
(c) imputation credit balance
The amount of imputation credits available for the subsequent financial year are:
- imputation account balance as at the end of the financial year at 30% (2013: 30%) 10,350 16,498
- imputation credits that will arise from the payment of income tax payable as at the end of the financial year 5,349 1,755
15,699 18,253
The amount of imputation credits available for future reporting periods:
- impact on the imputation account of dividends proposed or declared before the financial report was authorised for issue but not recognised as a distribution to equity holders during the period (4,227) (3,623)
11,472 14,630
Notes to the Financial statementscontinued
For
per
sona
l use
onl
y

50 Chandler Macleod Group Limited Annual Report 2014
9. cAsh FLOw REcONciLiATiON
(a) cash and cash equivalents
2014 2013
$000 $000
Cash at bank and in hand 2,671 3,262
Bank overdraft (Note 18) (194) -
Closing net cash balance 2,477 3,262
Cash at bank earns interest at floating rates based on daily bank deposit rates unless the account has an interest offset arrangement in which case no interest is earned.
(b) Reconciliation to cash Flow statement For the purpose of the Cash Flow Statement, cash and cash equivalents comprise the following at 30 June:
2014 2013
Note $000 $000
Reconciliation of net profit after income tax to net cash provided by operating activities
Net profit after income tax 13,469 10,708
Non-cash items
Depreciation of plant and equipment 4,749 4,935
Amortisation of intangibles 7,528 6,625
Change in contingent consideration on acquisition of Vivir 23 (2,775) (1,800)
Impairment of brand names 16 - 2,700
Net gain on disposal of property and office equipment (7) (71)
Share based payments 540 1,604
Doubtful debts 155 20
Non cash interest 246 (373)
Reclass from operating activities:
Interest on acquisition funding classified as financing 4,700 5,404
Disposal of subsidiary classified as investing (326) -
changes in assets and liabilities
(Increase)/Decrease in trade and other receivables (5,264) 23,764
(Increase)/Decrease in deferred tax (2,909) 983
Decrease/(Increase) in other assets 1,286 (298)
Increase/(Decrease) in trade and other payables 5,298 (8,226)
Increase/(Decrease) in current tax liability 3,594 (3,442)
Decrease in provisions (2,870) (1,950)
Net cash flow from operating activities 27,414 40,583
Notes to the Financial statementscontinued
For
per
sona
l use
onl
y
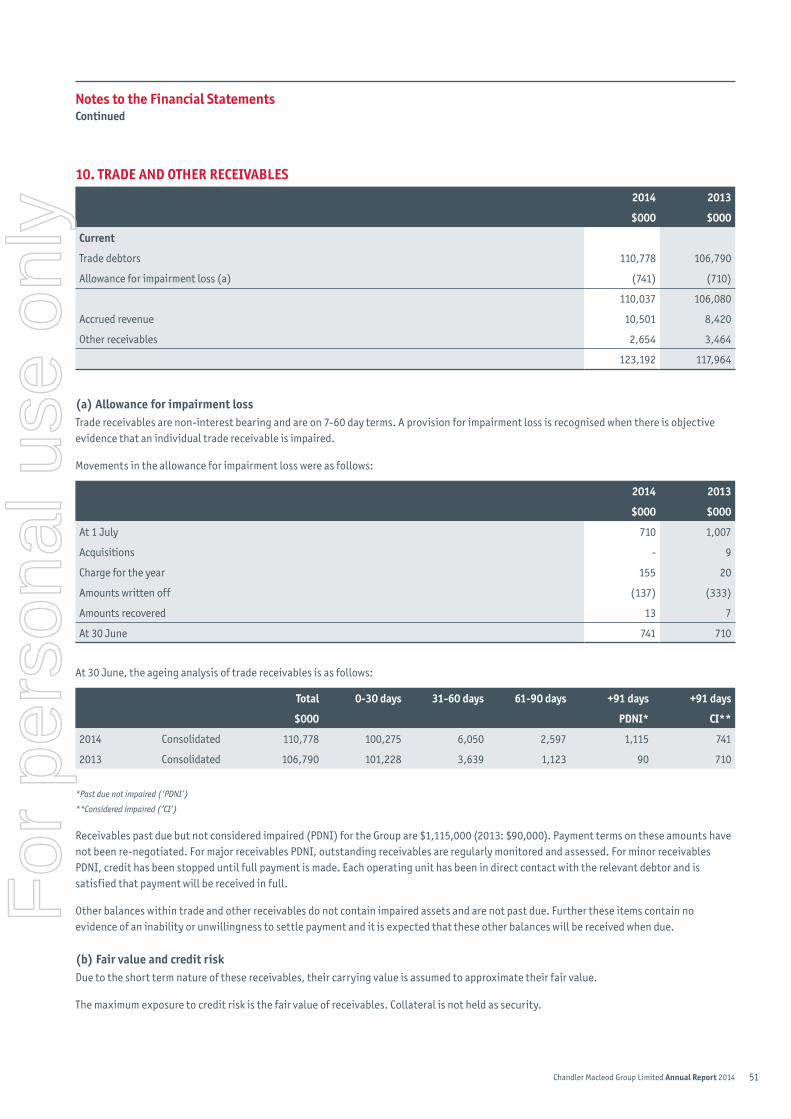
51Chandler Macleod Group Limited Annual Report 2014
10. TRAdE ANd OThER REcEiVAbLEs 2014 2013
$000 $000
current
Trade debtors 110,778 106,790
Allowance for impairment loss (a) (741) (710)
110,037 106,080
Accrued revenue 10,501 8,420
Other receivables 2,654 3,464
123,192 117,964
(a) Allowance for impairment lossTrade receivables are non-interest bearing and are on 7-60 day terms. A provision for impairment loss is recognised when there is objective evidence that an individual trade receivable is impaired.
Movements in the allowance for impairment loss were as follows:
2014 2013
$000 $000
At 1 July 710 1,007
Acquisitions - 9
Charge for the year 155 20
Amounts written off (137) (333)
Amounts recovered 13 7
At 30 June 741 710
At 30 June, the ageing analysis of trade receivables is as follows:
Total 0-30 days 31-60 days 61-90 days +91 days +91 days
$000 PdNi* ci**
2014 Consolidated 110,778 100,275 6,050 2,597 1,115 741
2013 Consolidated 106,790 101,228 3,639 1,123 90 710
*Past due not impaired (‘PDNI’)
**Considered impaired (‘CI’)
Receivables past due but not considered impaired (PDNI) for the Group are $1,115,000 (2013: $90,000). Payment terms on these amounts have not been re-negotiated. For major receivables PDNI, outstanding receivables are regularly monitored and assessed. For minor receivables PDNI, credit has been stopped until full payment is made. Each operating unit has been in direct contact with the relevant debtor and is satisfied that payment will be received in full.
Other balances within trade and other receivables do not contain impaired assets and are not past due. Further these items contain no evidence of an inability or unwillingness to settle payment and it is expected that these other balances will be received when due.
(b) Fair value and credit riskDue to the short term nature of these receivables, their carrying value is assumed to approximate their fair value.
The maximum exposure to credit risk is the fair value of receivables. Collateral is not held as security.
Notes to the Financial statementscontinued
For
per
sona
l use
onl
y

52 Chandler Macleod Group Limited Annual Report 2014
11. PREPAymENTs ANd OThER cURRENT AssETs 2014 2013
$000 $000
Prepaid workcover premium 95 261
Other prepayments 1,762 2,821
1,857 3,082
12. OThER FiNANciAL AssETs (NON-cURRENT)2014 2013
$000 $000
Security deposit 9 9
Other 3 64
12 73
13. PROPERTy ANd OFFicE EqUiPmENTLeasehold
improvementsOffice
equipmentLeased assets Total
$000 $000 $000 $000
year ended 30 June 2014
At 1 July 2013, net of accumulated depreciation 6,044 5,014 1,959 13,017
Acquisitions 60 40 - 100
Additions 1,006 1,263 437 2,706
Disposal - cost (982) (764) - (1,746)
Disposal - accumulated depreciation 982 762 - 1,744
Depreciation charge for the year (2,182) (2,102) (465) (4,749)
At 30 June 2014, net of accumulated depreciation 4,928 4,213 1,931 11,072
At 1 July 2013
Cost 12,750 14,539 2,477 29,766
Accumulated depreciation (6,706) (9,525) (518) (16,749)
Net carrying amount 6,044 5,014 1,959 13,017
At 30 June 2014
Cost 12,834 15,078 2,914 30,826
Accumulated depreciation (7,906) (10,865) (983) (19,754)
Net carrying amount 4,928 4,213 1,931 11,072
Notes to the Financial statementscontinued
For
per
sona
l use
onl
y

53Chandler Macleod Group Limited Annual Report 2014
Leasehold improvements
Office equipment
Leased assets Total
$000 $000 $000 $000
year ended 30 June 2013
At 1 July 2012, net of accumulated depreciation 6,850 6,527 892 14,269
Acquisition - 101 - 101
Additions 1,300 1,482 1,383 4,165
Disposal - cost (1,012) (1,857) - (2,869)
Disposal - accumulated depreciation 1,012 1,274 - 2,286
Depreciation charge for the year (2,106) (2,513) (316) (4,935)
At 30 June 2013, net of accumulated depreciation 6,044 5,014 1,959 13,017
At 1 July 2012
Cost 12,462 14,813 1,094 28,369
Accumulated depreciation (5,612) (8,286) (202) (14,100)
Net carrying amount 6,850 6,527 892 14,269
At 30 June 2013
Cost 12,750 14,539 2,477 29,766
Accumulated depreciation (6,706) (9,525) (518) (16,749)
Net carrying amount 6,044 5,014 1,959 13,017
Assets pledged as securityIncluded in the balance of office equipment are assets over which first mortgages have been granted as security over banking facilities entered into by the parent company, Chandler Macleod Group Limited. Assets under finance lease and commercial hire purchase arrangements are pledged as security for the associated lease and commercial hire purchase liabilities.
The value of assets pledged as security is:
2014 2013
$000 $000
Leasehold improvements 4,928 6,044
Property and office equipment 4,213 5,014
Property and office equipment under finance lease 1,931 1,959
11,072 13,017
Notes to the Financial statementscontinued
For
per
sona
l use
onl
y

54 Chandler Macleod Group Limited Annual Report 2014
14. iNTANgibLE AssETs ANd gOOdwiLL
goodwill
Project development
costs softwareLeased
software brand Namescustomer
Relationships Total
$000 $000 $000 $000 $000 $000 $000
At 1 July 2013
Cost 190,255 4,088 26,478 3,477 7,300 21,000 252,598
Accumulated amortisation and impairment (restated) - - (12,553) (2,693) (2,700) (2,685) (20,631)
Net carrying amount (restated) 190,255 4,088 13,925 784 4,600 18,315 231,967
year ended 30 June 2014
At 1 July 2013,
net of accumulated amortisation and impairment (restated) 190,255 4,088 13,925 784 4,600 18,315 231,967
Arising on acquisition (Note 23a) 3,670 - - - - - 3,670
Additions - 5,833 325 2,703 - - 8,861
Transfers - (5,172) 5,172 - - - -
Disposal - cost - - (1,388) - - - (1,388)
Disposal - accumulated amortisation - - 1,388 - - - 1,388
Amortisation - - (4,142) (1,179) - (2,207) (7,528)
At 30 June 2014, net of accumulated amortisation and impairment 193,925 4,749 15,280 2,308 4,600 16,108 236,970
At 30 June 2014
Cost 193,925 4,749 30,587 6,180 7,300 21,000 263,741
Accumulated amortisation and impairment - - (15,307) (3,872) (2,700) (4,892) (26,771)
Net carrying amount 193,925 4,749 15,280 2,308 4,600 16,108 236,970
Notes to the Financial statementscontinued
For
per
sona
l use
onl
y
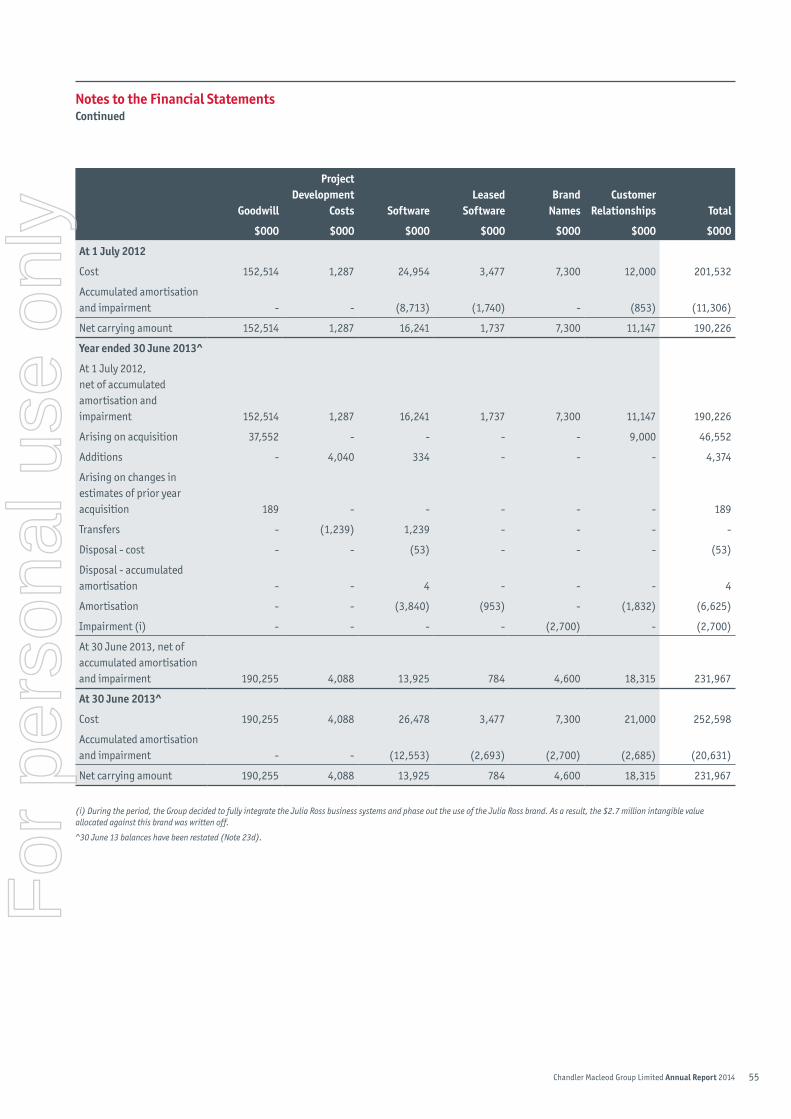
55Chandler Macleod Group Limited Annual Report 2014
goodwill
Project development
costs softwareLeased
softwarebrand
Namescustomer
Relationships Total
$000 $000 $000 $000 $000 $000 $000
At 1 July 2012
Cost 152,514 1,287 24,954 3,477 7,300 12,000 201,532
Accumulated amortisation and impairment - - (8,713) (1,740) - (853) (11,306)
Net carrying amount 152,514 1,287 16,241 1,737 7,300 11,147 190,226
year ended 30 June 2013^
At 1 July 2012, net of accumulated amortisation and impairment 152,514 1,287 16,241 1,737 7,300 11,147 190,226
Arising on acquisition 37,552 - - - - 9,000 46,552
Additions - 4,040 334 - - - 4,374
Arising on changes in estimates of prior year acquisition 189 - - - - - 189
Transfers - (1,239) 1,239 - - - -
Disposal - cost - - (53) - - - (53)
Disposal - accumulated amortisation - - 4 - - - 4
Amortisation - - (3,840) (953) - (1,832) (6,625)
Impairment (i) - - - - (2,700) - (2,700)
At 30 June 2013, net of accumulated amortisation and impairment 190,255 4,088 13,925 784 4,600 18,315 231,967
At 30 June 2013^
Cost 190,255 4,088 26,478 3,477 7,300 21,000 252,598
Accumulated amortisation and impairment - - (12,553) (2,693) (2,700) (2,685) (20,631)
Net carrying amount 190,255 4,088 13,925 784 4,600 18,315 231,967
(i) During the period, the Group decided to fully integrate the Julia Ross business systems and phase out the use of the Julia Ross brand. As a result, the $2.7 million intangible value allocated against this brand was written off.
^30 June 13 balances have been restated (Note 23d).
Notes to the Financial statementscontinued
For
per
sona
l use
onl
y

56 Chandler Macleod Group Limited Annual Report 2014
15. iNVEsTmENT iN AN AssOciATEOn 19 July 2013, Chandler Macleod Group (HK) Limited acquired a 40% interest in Cornerstone Global Partners Limited (“Cornerstone”) for an upfront cash payment of $2.3 million and two contingent consideration payments based on the financial performance of the acquired entity over the next two years. Cornerstone is an organisation based in China who delivers a range of recruitment solutions, including candidate search and talent management consulting, along with recruitment outsourcing and contracting solutions.
The Group’s interest in Cornerstone is accounted for using the equity method in the consolidated financial statements.
30 June 2014 30 June 2013
$000 $000
Initial cash consideration 2,255 -
Contingent consideration 1,459 -
Share of profit of associate 477 -
Carrying amount of the investment 4,191 -
Current assets 1,928 -
Non-current assets 39 -
Current liabilities (660) -
Net Assets 1,307 -
Proportion of the Group’s ownership 40% -
group’s share of net assets 523 -
Revenue 5,062 -
Profit before tax 1,237 -
Income tax expense (44) -
Profit for the year 1,193 -
group’s share of profit for the year 477 -
No dividends have been received from Cornerstone during the 2014 financial year.
The difference between the Group’s share of net assets and the initial cash consideration is the goodwill recognised.
16. imPAiRmENT TEsTiNg OF gOOdwiLL ANd iNTANgibLEs wiTh iNdEFiNiTE LiVEsGoodwill acquired through business combinations has been allocated to individual cash generating units (CGU) in line with the consolidated entity’s reporting segments and step down to identify the individual business units.
The CGUs are aligned to the Board reporting structure, the structure for which budgets and strategic plans are prepared, the day to day management of the business and the level at which goodwill is monitored. The carrying amount of goodwill allocated to CGUs that are significant individually, or in aggregate is as follows:
Notes to the Financial statementscontinued
For
per
sona
l use
onl
y
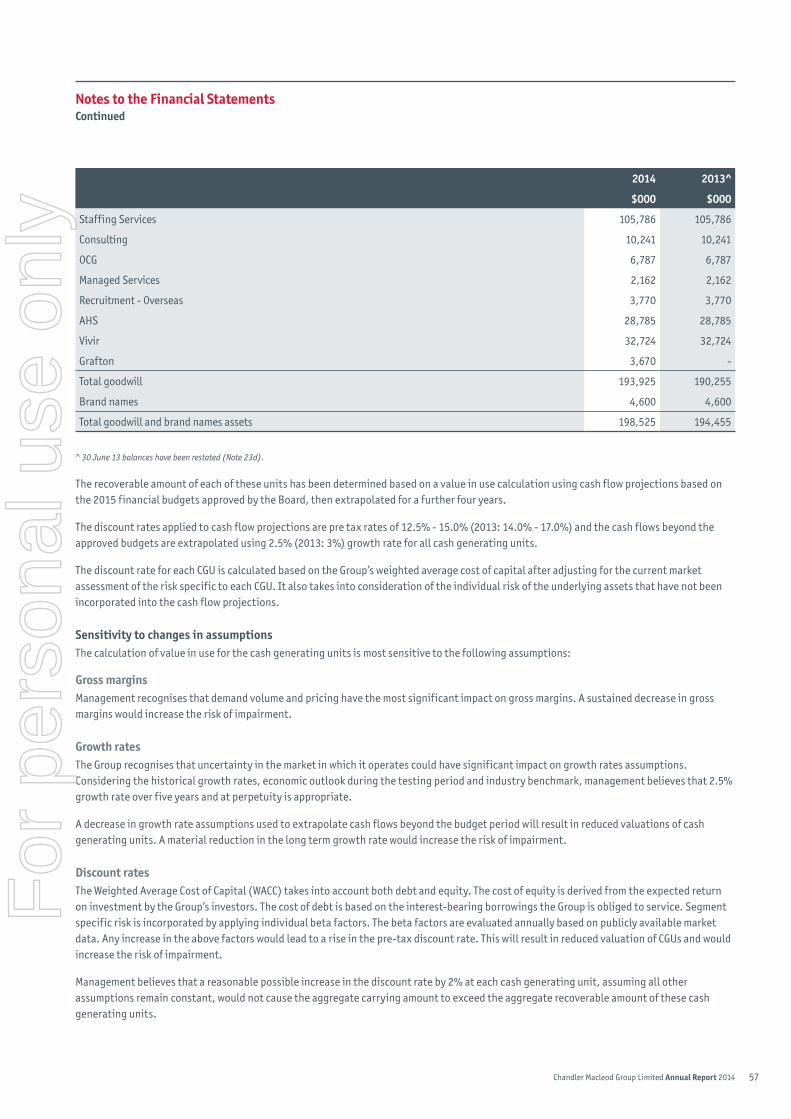
57Chandler Macleod Group Limited Annual Report 2014
2014 2013^
$000 $000
Staffing Services 105,786 105,786
Consulting 10,241 10,241
OCG 6,787 6,787
Managed Services 2,162 2,162
Recruitment - Overseas 3,770 3,770
AHS 28,785 28,785
Vivir 32,724 32,724
Grafton 3,670 -
Total goodwill 193,925 190,255
Brand names 4,600 4,600
Total goodwill and brand names assets 198,525 194,455
^ 30 June 13 balances have been restated (Note 23d).
The recoverable amount of each of these units has been determined based on a value in use calculation using cash flow projections based on the 2015 financial budgets approved by the Board, then extrapolated for a further four years.
The discount rates applied to cash flow projections are pre tax rates of 12.5% - 15.0% (2013: 14.0% - 17.0%) and the cash flows beyond the approved budgets are extrapolated using 2.5% (2013: 3%) growth rate for all cash generating units.
The discount rate for each CGU is calculated based on the Group’s weighted average cost of capital after adjusting for the current market assessment of the risk specific to each CGU. It also takes into consideration of the individual risk of the underlying assets that have not been incorporated into the cash flow projections.
sensitivity to changes in assumptionsThe calculation of value in use for the cash generating units is most sensitive to the following assumptions:
gross marginsManagement recognises that demand volume and pricing have the most significant impact on gross margins. A sustained decrease in gross margins would increase the risk of impairment.
growth ratesThe Group recognises that uncertainty in the market in which it operates could have significant impact on growth rates assumptions. Considering the historical growth rates, economic outlook during the testing period and industry benchmark, management believes that 2.5% growth rate over five years and at perpetuity is appropriate.
A decrease in growth rate assumptions used to extrapolate cash flows beyond the budget period will result in reduced valuations of cash generating units. A material reduction in the long term growth rate would increase the risk of impairment.
discount ratesThe Weighted Average Cost of Capital (WACC) takes into account both debt and equity. The cost of equity is derived from the expected return on investment by the Group’s investors. The cost of debt is based on the interest-bearing borrowings the Group is obliged to service. Segment specific risk is incorporated by applying individual beta factors. The beta factors are evaluated annually based on publicly available market data. Any increase in the above factors would lead to a rise in the pre-tax discount rate. This will result in reduced valuation of CGUs and would increase the risk of impairment.
Management believes that a reasonable possible increase in the discount rate by 2% at each cash generating unit, assuming all other assumptions remain constant, would not cause the aggregate carrying amount to exceed the aggregate recoverable amount of these cash generating units.
Notes to the Financial statementscontinued
For
per
sona
l use
onl
y
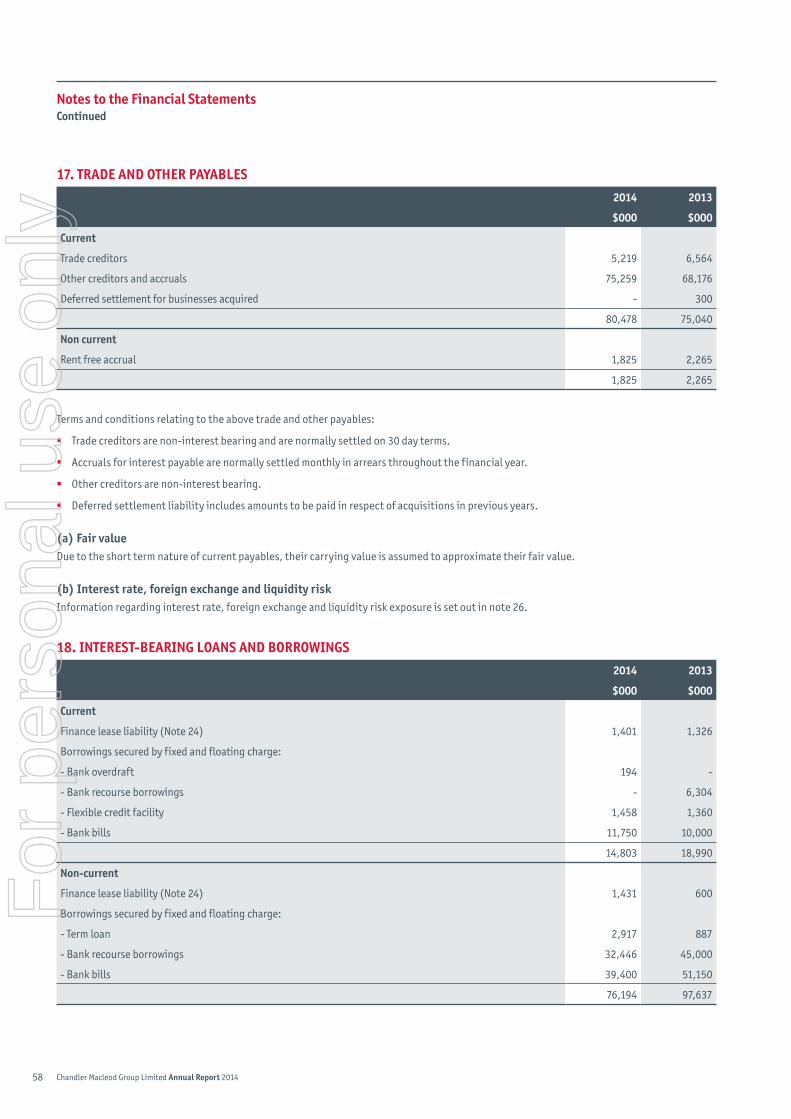
58 Chandler Macleod Group Limited Annual Report 2014
17. TRAdE ANd OThER PAyAbLEs 2014 2013
$000 $000
current
Trade creditors 5,219 6,564
Other creditors and accruals 75,259 68,176
Deferred settlement for businesses acquired - 300
80,478 75,040
Non current
Rent free accrual 1,825 2,265
1,825 2,265
Terms and conditions relating to the above trade and other payables:
� Trade creditors are non-interest bearing and are normally settled on 30 day terms.
� Accruals for interest payable are normally settled monthly in arrears throughout the financial year.
� Other creditors are non-interest bearing.
� Deferred settlement liability includes amounts to be paid in respect of acquisitions in previous years.
(a) Fair valueDue to the short term nature of current payables, their carrying value is assumed to approximate their fair value.
(b) interest rate, foreign exchange and liquidity riskInformation regarding interest rate, foreign exchange and liquidity risk exposure is set out in note 26.
18. iNTEREsT-bEARiNg LOANs ANd bORROwiNgs2014 2013
$000 $000
current
Finance lease liability (Note 24) 1,401 1,326
Borrowings secured by fixed and floating charge:
- Bank overdraft 194 -
- Bank recourse borrowings - 6,304
- Flexible credit facility 1,458 1,360
- Bank bills 11,750 10,000
14,803 18,990
Non-current
Finance lease liability (Note 24) 1,431 600
Borrowings secured by fixed and floating charge:
- Term loan 2,917 887
- Bank recourse borrowings 32,446 45,000
- Bank bills 39,400 51,150
76,194 97,637
Notes to the Financial statementscontinued
For
per
sona
l use
onl
y

59Chandler Macleod Group Limited Annual Report 2014
The combined banking facilities with NAB and ANZ were amended on 30 June 2014 which comprise:
FacilityANZ
Limit ($million)NAb
Limit ($million) Expiry date
Recourse receivables - Tranche A 18.0 27.0 31 July 2015
Recourse receivables - Tranche B 22.0 33.0 31 July 2014
Receivable purchase - 35.0 31 July 2014
Bank bill 20.0 43.4 31 July 2015
Overdraft - 3.0 31 July 2014
Credit card - 0.4 31 July 2014
Receivables purchase facility Under this facility, the Group sells selected trade receivables to NAB and receives the full amount of the invoiced value of those trade receivables in cash. The Group pays a service fee and interest to NAB on this facility and there is no retention of cash or discount on the consideration received from NAB. Interest is charged at a floating rate based on the Bank Bill Swap Bid Rate and the debtors’ credit risk.
The Group transfers substantially all of the risks and rewards to NAB which bears the collection risks without the right to receive payments from the Group in the event of any loss arising from the non-collectability of these receivables. As at the year end the Group utilised $33,855,122 (2013: $33,024,094) under this facility.
Facilities for overseas entities (not included in table above)OCG Consulting Limited, the New Zealand subsidiary of the Group has a banking facility with the ANZ Banking Group New Zealand which provides a flexible credit facility of AUD$0.6 million, an overdraft facility of AUD$1.7 million and a term loan facility of AUD$2.9 million in New Zealand.
ACI, a subsidiary of the Group operating in Indonesia, has a facility agreement with PT ANZ Panin Bank, which comprises a Revolving Loan Facility up to AUD$1.0 million and an Overdraft Facility up to AUD$1.1 million. The ultimate parent Chandler Macleod Group Limited provided a guarantee to secure the facilities.
AHS, a subsidiary of the Company acquired in 2012 financial year has a banking facility with the ANZ which provides an overdraft facility of $0.3 million.
At 30 June 2014, the Group had available $89,696,167 (2013: $62,544,000) of undrawn committed borrowing facilities.
(a) Fair valueAll current and non-current borrowings recognised above are recognised at amounts that represent fair value.
(b) interest rate, foreign exchange and liquidity riskDetails regarding interest rate, foreign exchange and liquidity risk are disclosed in note 26.
(c) Assets pledged as securityThe facilities are secured by a registered equitable mortgage over the Group’s total assets.
(d) compliance to covenantsDuring the year, there were no defaults or breaches by the Company on any of the loans.
Notes to the Financial statementscontinued
For
per
sona
l use
onl
y
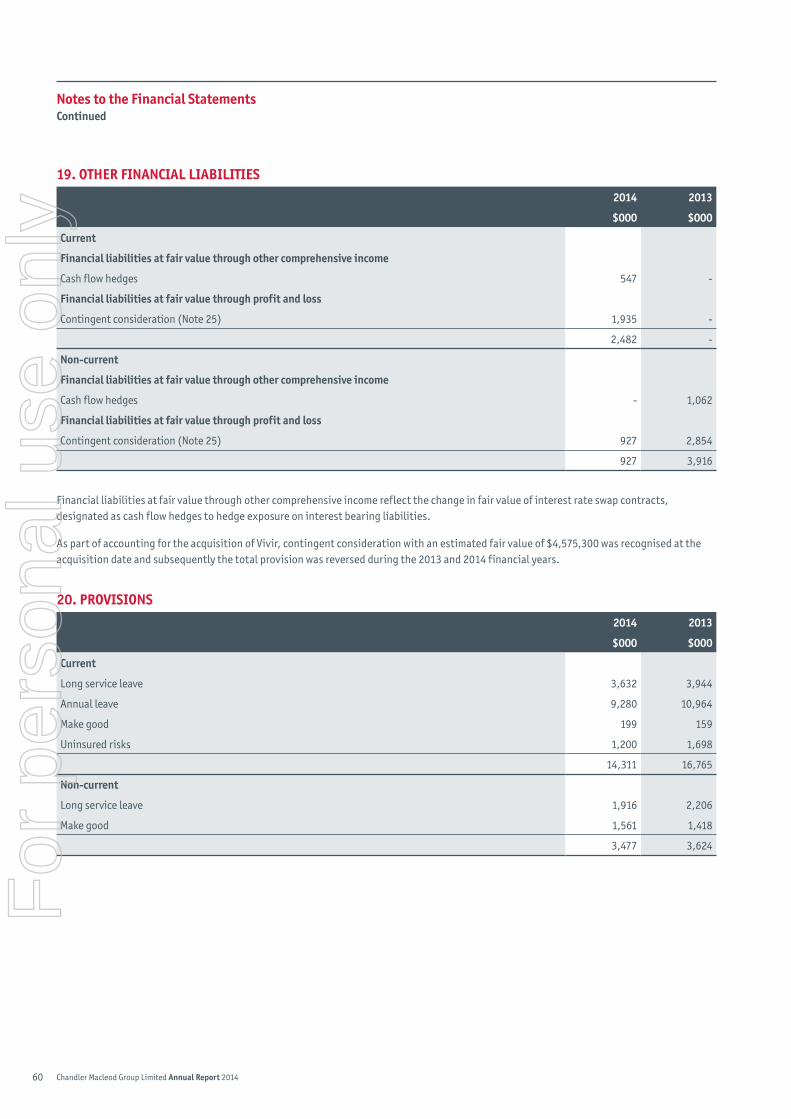
60 Chandler Macleod Group Limited Annual Report 2014
19. OThER FiNANciAL LiAbiLiTiEs2014 2013
$000 $000
current
Financial liabilities at fair value through other comprehensive income
Cash flow hedges 547 -
Financial liabilities at fair value through profit and loss
Contingent consideration (Note 25) 1,935 -
2,482 -
Non-current
Financial liabilities at fair value through other comprehensive income
Cash flow hedges - 1,062
Financial liabilities at fair value through profit and loss
Contingent consideration (Note 25) 927 2,854
927 3,916
Financial liabilities at fair value through other comprehensive income reflect the change in fair value of interest rate swap contracts, designated as cash flow hedges to hedge exposure on interest bearing liabilities.
As part of accounting for the acquisition of Vivir, contingent consideration with an estimated fair value of $4,575,300 was recognised at the acquisition date and subsequently the total provision was reversed during the 2013 and 2014 financial years.
20. PROVisiONs 2014 2013
$000 $000
current
Long service leave 3,632 3,944
Annual leave 9,280 10,964
Make good 199 159
Uninsured risks 1,200 1,698
14,311 16,765
Non-current
Long service leave 1,916 2,206
Make good 1,561 1,418
3,477 3,624
Notes to the Financial statementscontinued
For
per
sona
l use
onl
y

61Chandler Macleod Group Limited Annual Report 2014
movements in provisionsMovements in each class of provision during the financial year, other than provisions relating to employee leave entitlements, are set out below:
make good Provisions
Uninsured Risks Total
$000 $000 $000
At 1 July 2013 1,577 1,698 3,275
Arising during the year 220 320 540
Utilised (37) (818) (855)
At 30 June 2014 1,760 1,200 2,960
Current 2014 199 1,200 1,399
Non-current 2014 1,561 - 1,561
1,760 1,200 2,960
Current 2013 159 1,698 1,857
Non-current 2013 1,418 - 1,418
1,577 1,698 3,275
make good provisionsThe Group leases office facilities throughout Australia, New Zealand, Hong Kong, Singapore, Indonesia, United Kingdom and Ireland and in accordance with the lease agreements, the Group must restore the leased premises to the original condition at the end of the lease terms.
Because of the long-term nature of the liability, the greatest uncertainty in estimating the provision is the cost that will ultimately be incurred.
Uninsured risksUninsured risks comprise insurance deductibles and provisions for outstanding litigation.
21. cONTRibUTEd EqUiTy2014 2013
$000 $000
Issued and fully paid ordinary shares 186,429 150,825
(a) movements in shares on issue Ordinary shares have the right to receive dividends as declared and, in the event of winding up the Company, to participate in the proceeds from the sale of all surplus assets in proportion to the number of and amounts paid up on shares held.
Notes to the Financial statementscontinued
For
per
sona
l use
onl
y
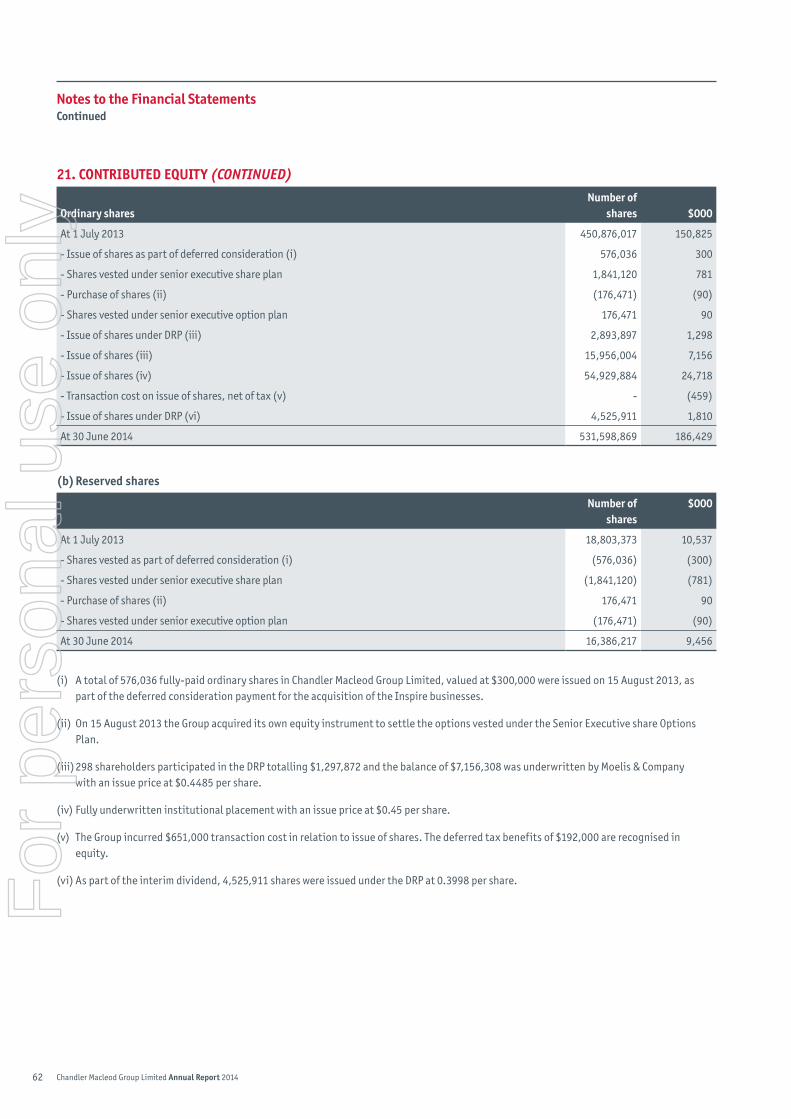
62 Chandler Macleod Group Limited Annual Report 2014
21. cONTRibUTEd EqUiTy (CONTINUED)
Ordinary sharesNumber of
shares $000
At 1 July 2013 450,876,017 150,825
- Issue of shares as part of deferred consideration (i) 576,036 300
- Shares vested under senior executive share plan 1,841,120 781
- Purchase of shares (ii) (176,471) (90)
- Shares vested under senior executive option plan 176,471 90
- Issue of shares under DRP (iii) 2,893,897 1,298
- Issue of shares (iii) 15,956,004 7,156
- Issue of shares (iv) 54,929,884 24,718
- Transaction cost on issue of shares, net of tax (v) - (459)
- Issue of shares under DRP (vi) 4,525,911 1,810
At 30 June 2014 531,598,869 186,429
(b) Reserved shares
Number of shares
$000
At 1 July 2013 18,803,373 10,537
- Shares vested as part of deferred consideration (i) (576,036) (300)
- Shares vested under senior executive share plan (1,841,120) (781)
- Purchase of shares (ii) 176,471 90
- Shares vested under senior executive option plan (176,471) (90)
At 30 June 2014 16,386,217 9,456
(i) A total of 576,036 fully-paid ordinary shares in Chandler Macleod Group Limited, valued at $300,000 were issued on 15 August 2013, as part of the deferred consideration payment for the acquisition of the Inspire businesses.
(ii) On 15 August 2013 the Group acquired its own equity instrument to settle the options vested under the Senior Executive share Options Plan.
(iii) 298 shareholders participated in the DRP totalling $1,297,872 and the balance of $7,156,308 was underwritten by Moelis & Company with an issue price at $0.4485 per share.
(iv) Fully underwritten institutional placement with an issue price at $0.45 per share.
(v) The Group incurred $651,000 transaction cost in relation to issue of shares. The deferred tax benefits of $192,000 are recognised in equity.
(vi) As part of the interim dividend, 4,525,911 shares were issued under the DRP at 0.3998 per share.
Notes to the Financial statementscontinued
For
per
sona
l use
onl
y

63Chandler Macleod Group Limited Annual Report 2014
(c) capital management When managing capital, management’s objective is to provide liquidity for the business and to provide optimal returns to shareholders and benefits for other stakeholders. Management aims to maintain the lowest cost of capital.
Management are constantly reviewing the capital structure to take advantage of favourable costs of capital. As the market is constantly changing, the directors may change the amount of dividends to be paid to shareholders, return capital to shareholders, issue new shares or sell assets to reduce debt.
During 2014, the Group paid dividends of $16,063,000 (2013: $14,063,000). The Group has no fixed dividend payout ratio.
Management monitor capital through the gearing ratio (net debt/total capital). The gearing ratios based on continuing operations at 30 June 2014 and 2013 were as follows:
2014 2013^
$000 $000
Total borrowings* 90,997 116,627
Less cash and cash equivalents (2,671) (3,262)
Net debt 88,326 113,365
Total equity 190,121 156,466
Total capital 278,447 269,831
Gearing ratio 31.7% 42.0%
*Includes interest bearing loans and borrowings
^30 June 2013 balances have been restated (Note 23d).
22. RETAiNEd EARNiNgsMovements in retained earnings were as follows:
2014 2013^
$000 $000
Balance at 1 July 4,715 8,084
Profit for the year 13,584 10,694
Ordinary shares dividend paid (16,063) (14,063)
Balance at 30 June 2,236 4,715
^30 June 2013 balances have been restated (Note 23d).
Notes to the Financial statementscontinued
For
per
sona
l use
onl
y

64 Chandler Macleod Group Limited Annual Report 2014
23. bUsiNEss cOmbiNATiON
Acquisition during 2014
(a) Acquisition of grafton consulting Limited (grafton)On 6 August 2013, OCG Consulting Limited (OCG), a subsidiary of CMG, acquired 73.67% of shares in Grafton. Grafton delivers a broad range of human resource consulting services throughout New Zealand. Under the shareholders agreement, OCG has a call option over the remaining 26.33% of shares. The minority shareholders also have a put option to require OCG to purchase the remaining shares at various stages up to August 2016. On this basis, 100% ownership is virtually certain at acquisition date, therefore Grafton has been accounted for as a wholly-owned subsidiary.
The acquisition price comprised an initial cash payment of NZ$2.9 million and three deferred payments based on earn out arrangement depending on the financial performance of Grafton. As at the acquisition date, it is estimated that the minimum deferred payment will be NZ$0.7 million. There is no cap for the maximum deferred payment. A liability of NZ$1.4 million was recorded for the contingent consideration at the acquisition date based on the available information at the time. The option can be exercised at various stages up to August 2016.
The provisional fair value and carrying value of the identifiable assets and liabilities of these acquisitions as at the date of acquisition is as follows:
grafton
$000
consideration
Cash paid 2,512
Estimated contingent consideration liability (Note 25) 1,258
Total consideration 3,770
statement of Financial Position
Non-current assets 100
Provisional fair value of identifiable net assets/(liabilities) 100
Goodwill arising on acquisition 3,670
Acquisition date fair-value of consideration transferred
Cash paid 2,512
Total cash consideration paid 2,512
Acquisitions during 2013
(b) Vivir Acquisition - Revision of provisional acquisition accountingOn 5 December 2012, the Group acquired 100% of the shares in Vivir Healthcare Pty Ltd (“Vivir”). Vivir is a managed service business operating in Australia’s large and rapidly expanding residential aged care and community care sectors. It delivers high-quality, outcome focused physiotherapy, pain management, dietetics and workplace health and safety to approximately 240 residential aged care facilities (“ACFs”). On a per-resident basis, Vivir provided clinical services to over 18,000 ACF beds through 13,000 unique weekly appointments.
In accordance with AASB3, CMG provisionally recognised the fair value of assets and liabilities acquired from Vivir in the Consolidated Statement of Financial Position as at 30 June 2013 and the difference of $39.0 million between the acquisition price of $39.3 million and the net tangible assets $0.3 million acquired was provisionally accounted for as goodwill.
Notes to the Financial statementscontinued
For
per
sona
l use
onl
y

65Chandler Macleod Group Limited Annual Report 2014
Subsequent to 30 June 2013, a valuation was carried out and the following intangibles were identified and separately recognised in accordance with the relevant accounting standards:
$000
Customer Contracts/Relationships 9,000
Increase in fair value of deferred tax liabilities (2,700)
Fair value adjustments to income tax payable 158
Goodwill 32,724
(c) Acquisition of TrilogyOn 19 November 2012, the business of Trilogy Resources Pty Ltd in Western Australia was acquired by CMG for $4.8 million. Trilogy specialises in providing IT Project Management and IT development contractors.
(d) Prior year adjustmentsAs a result of the above Vivir fair value adjustments, the following adjustments have been made to June 2013 comparative Consolidated Statement of Financial Position as required by AASB3.
30 June 2013 As previously
statedAmendments
to fair value Amortisation30 June 2013
Restated
$000 $000 $000 $000
Non-current Assets
Goodwill 196,555 (6,300) - 190,255
Other intangibles 33,237 9,000 (525) 41,712
Intangible assets and goodwill 229,792 2,700 (525) 231,967
Net deferred tax assets / (liabilities) 9,635 (2,700) 158 7,093
Equity
Retained earnings 5,082 - (367) 4,715
Notes to the Financial statementscontinued
For
per
sona
l use
onl
y

66 Chandler Macleod Group Limited Annual Report 2014
24. cOmmiTmENTs ANd cONTiNgENciEs
Operating lease commitments - group as lesseeThe Group has entered into commercial leases for access to certain premises. These leases have an average life of between 2 and 5 years with renewal options included in most contracts. Rental payments are fixed with inflation or fixed percentage escalation clauses on which contingent rentals are determined.
Future minimum rentals payable under non-cancellable operating leases as at 30 June are as follows:
2014 2013^
$000 $000
Within one year 9,360 8,373
After one year and not later than five years 18,551 24,391
More than five years 3,303 3,231
Aggregate lease expenditure contracted for at reporting date 31,214 35,995
^ 30 June 2013 balance has been restated.
Finance lease and hire purchase commitments - group as lesseeThe Group has finance leases for computer equipment and software licences. These leases have terms of renewal but no purchase options and escalation clauses. Renewals are at the option of the specific entity that holds the lease.
Future minimum lease payments under finance leases together with the present value of the net minimum lease payments are as follows:
2014 2013
minimum lease
payments
Present value of lease
payments
minimum lease
payments
Present value of lease
payments
$000 $000 $000 $000
Within one year 1,526 1,401 1,399 1,326
After one year and not later than five years 1,510 1,431 629 600
Total minimum lease payments 3,036 2,832 2,028 1,926
Less amounts representing finance charges (204) - (102) -
Present value of minimum lease payments 2,832 2,832 1,926 1,926
The weighted average interest rate implicit in the leases for the Group is 6.1% (2013: 7.3%).
guaranteesBank guarantees are as follows:
2014 2013
$000 $000
Bank guarantees in respect of leases of premises 6,223 5,140
Workers’ compensation guarantees 48,504 47,848
Performance guarantees issued on behalf of Hong Kong subsidiary 1,928 1,984
Bank guarantees in respect of Singapore employment licence 17 -
56,672 54,972
Guarantees, if called upon, are payable on demand.
Notes to the Financial statementscontinued
For
per
sona
l use
onl
y
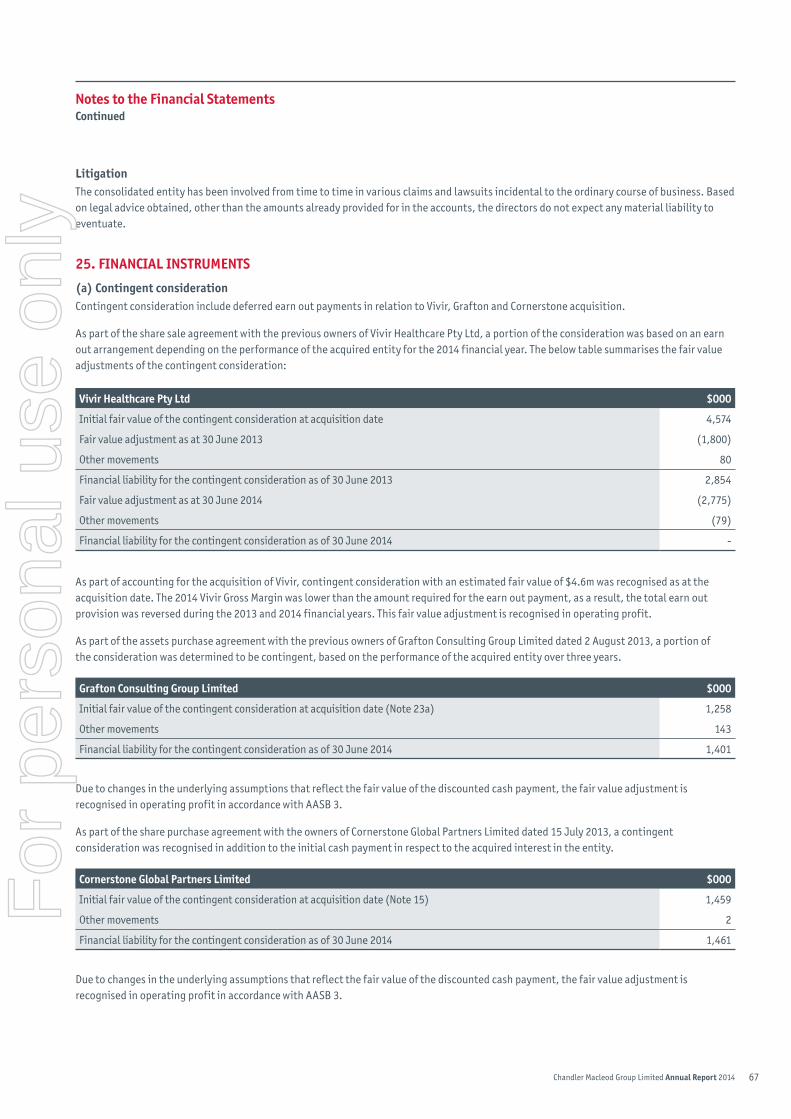
67Chandler Macleod Group Limited Annual Report 2014
LitigationThe consolidated entity has been involved from time to time in various claims and lawsuits incidental to the ordinary course of business. Based on legal advice obtained, other than the amounts already provided for in the accounts, the directors do not expect any material liability to eventuate.
25. FiNANciAL iNsTRUmENTs
(a) contingent considerationContingent consideration include deferred earn out payments in relation to Vivir, Grafton and Cornerstone acquisition.
As part of the share sale agreement with the previous owners of Vivir Healthcare Pty Ltd, a portion of the consideration was based on an earn out arrangement depending on the performance of the acquired entity for the 2014 financial year. The below table summarises the fair value adjustments of the contingent consideration:
Vivir healthcare Pty Ltd $000
Initial fair value of the contingent consideration at acquisition date 4,574
Fair value adjustment as at 30 June 2013 (1,800)
Other movements 80
Financial liability for the contingent consideration as of 30 June 2013 2,854
Fair value adjustment as at 30 June 2014 (2,775)
Other movements (79)
Financial liability for the contingent consideration as of 30 June 2014 -
As part of accounting for the acquisition of Vivir, contingent consideration with an estimated fair value of $4.6m was recognised as at the acquisition date. The 2014 Vivir Gross Margin was lower than the amount required for the earn out payment, as a result, the total earn out provision was reversed during the 2013 and 2014 financial years. This fair value adjustment is recognised in operating profit.
As part of the assets purchase agreement with the previous owners of Grafton Consulting Group Limited dated 2 August 2013, a portion of the consideration was determined to be contingent, based on the performance of the acquired entity over three years.
grafton consulting group Limited $000
Initial fair value of the contingent consideration at acquisition date (Note 23a) 1,258
Other movements 143
Financial liability for the contingent consideration as of 30 June 2014 1,401
Due to changes in the underlying assumptions that reflect the fair value of the discounted cash payment, the fair value adjustment is recognised in operating profit in accordance with AASB 3.
As part of the share purchase agreement with the owners of Cornerstone Global Partners Limited dated 15 July 2013, a contingent consideration was recognised in addition to the initial cash payment in respect to the acquired interest in the entity.
cornerstone global Partners Limited $000
Initial fair value of the contingent consideration at acquisition date (Note 15) 1,459
Other movements 2
Financial liability for the contingent consideration as of 30 June 2014 1,461
Due to changes in the underlying assumptions that reflect the fair value of the discounted cash payment, the fair value adjustment is recognised in operating profit in accordance with AASB 3.
Notes to the Financial statementscontinued
For
per
sona
l use
onl
y

68 Chandler Macleod Group Limited Annual Report 2014
25. FiNANciAL iNsTRUmENTs (CONTINUED)
(b) interest rate swap – cash flow hedgeThe Group hedged $50 million of this exposure by taking out interest rate swap contracts at 5.91% as at 24 April 2012, expiring on 24 April 2015.
In the year ended 30 June 2014, a gain of $126,000 (2013: loss of $181,000) from remeasuring the hedging instrument at fair value is recognised in other comprehensive income and a loss of $641,000 (2013: loss of 239,000) was recycled from the hedge reserve to the income statement and included in finance costs. There was no hedge ineffectiveness during the period.
(c) Fair valuesSet out below is a comparison of the carrying amounts and fair values of financial instruments as at 30 June 2014:
carrying amount Fair Value
$000 $000
30 June 2014
Financial liabilities:
Interest bearing loans and borrowings 76,194 75,579
Other financial liabilities
Contingent consideration 927 927
Total non-current 77,121 76,506
Interest bearing loans and borrowings 14,803 14,792
Other financial liabilities
Contingent consideration 1,935 1,935
Interest rate swap 547 547
Total current 17,285 17,274
Total 94,406 93,780
(d) Fair value hierarchyAll financial instruments for which fair value is recognised or disclosed are categorised within the fair value hierarchy, described as follows, based on the lowest level input that is significant to the fair value measurement as a whole:
Level 1 - Quoted market prices in an active market (that are unadjusted) for identical assets or liabilities
Level 2 - Valuation techniques (for which the lowest level input that is significant to the fair value measurement is directly or indirectly observable)
Level 3 - Valuation techniques (for which the lowest level input that is significant to the fair value measurement is unobservable)
For financial instruments that are recognised at fair value on a recurring basis, the Group determines whether transfers have occurred between Levels in the hierarchy by re-assessing categorisation (based on the lowest level input that is significant to the fair value measurement as a whole) at the end of each reporting period.
Notes to the Financial statementscontinued
For
per
sona
l use
onl
y
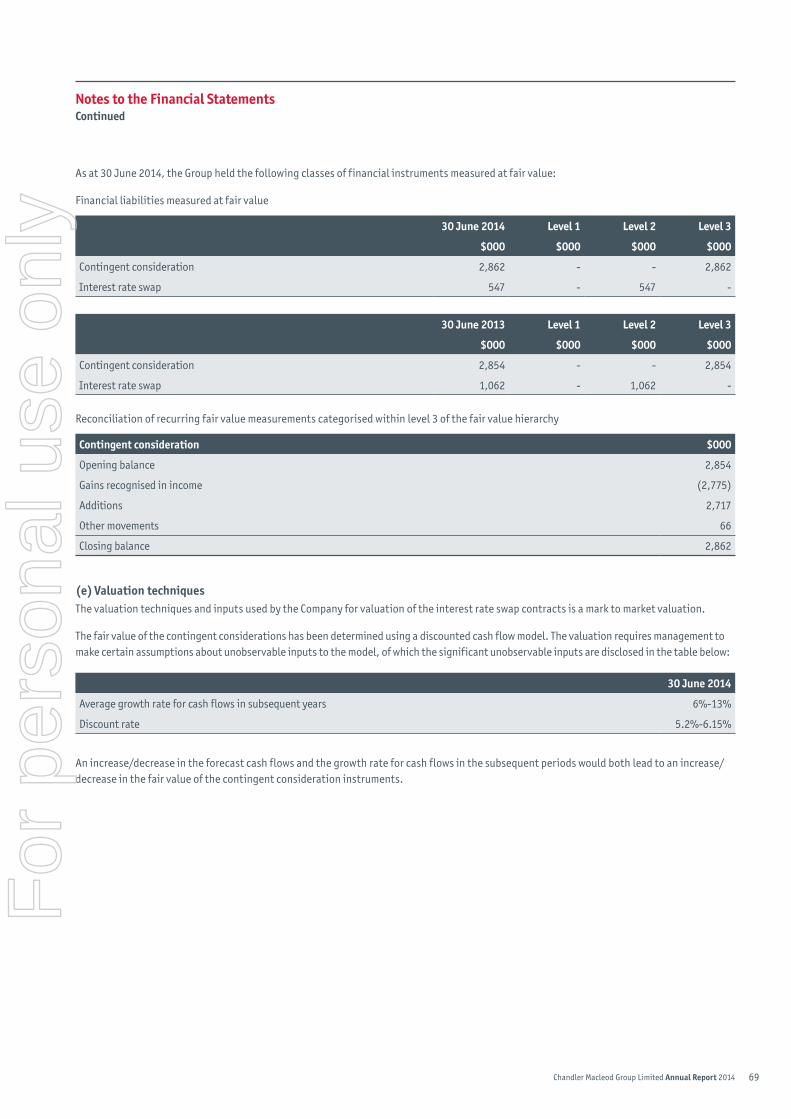
69Chandler Macleod Group Limited Annual Report 2014
As at 30 June 2014, the Group held the following classes of financial instruments measured at fair value:
Financial liabilities measured at fair value
30 June 2014 Level 1 Level 2 Level 3
$000 $000 $000 $000
Contingent consideration 2,862 - - 2,862
Interest rate swap 547 - 547 -
30 June 2013 Level 1 Level 2 Level 3
$000 $000 $000 $000
Contingent consideration 2,854 - - 2,854
Interest rate swap 1,062 - 1,062 -
Reconciliation of recurring fair value measurements categorised within level 3 of the fair value hierarchy
contingent consideration $000
Opening balance 2,854
Gains recognised in income (2,775)
Additions 2,717
Other movements 66
Closing balance 2,862
(e) Valuation techniquesThe valuation techniques and inputs used by the Company for valuation of the interest rate swap contracts is a mark to market valuation.
The fair value of the contingent considerations has been determined using a discounted cash flow model. The valuation requires management to make certain assumptions about unobservable inputs to the model, of which the significant unobservable inputs are disclosed in the table below:
30 June 2014
Average growth rate for cash flows in subsequent years 6%-13%
Discount rate 5.2%-6.15%
An increase/decrease in the forecast cash flows and the growth rate for cash flows in the subsequent periods would both lead to an increase/decrease in the fair value of the contingent consideration instruments.
Notes to the Financial statementscontinued
For
per
sona
l use
onl
y

70 Chandler Macleod Group Limited Annual Report 2014
26. FiNANciAL Risk mANAgEmENT ObJEcTiVEs ANd POLiciEsThe Group’s principal financial instruments comprise bank recourse receivables financing, bank receivables purchase facility, bank bill facility, overdrafts, finance leases, loans, cash at bank and interest rate swaps.
The main purpose of these financial instruments is to provide financing for the Group’s operations. The Group has various other financial assets and liabilities such as trade receivables and trade payables, which arise directly from its operations.
The Group’s policies with regard to financial risk management are clearly defined in its Treasury Policy and are adhered to.
They are an integral part of the Group’s long term strategy, covering areas such as market risk including foreign exchange and interest rate risk, liquidity risk and credit risk. The Group’s Treasury Policy assigns responsibilities for managing financial risks and details the manner in which those risks are monitored.
The Group manages its exposure to key financial risks in accordance with these policies. The objective of these policies is to support the delivery of the Group’s financial targets whilst protecting future financial security.
Primary responsibility for identification and control of financial risks rests with the Executive Risk Management Committee which reports to the Audit and Risk Management Committee of the Board.
Risk Exposures and Responses
(a) market riskThe Group monitors its financial performance and applies a number of levers to minimise downside risk to results that might arise from a downturn in the economy, adverse regulatory changes and tighter margins. The Group has a client base that is well diversified in terms of individual exposure, industry and geography. The Group also reviews its banking facilities and funding structure to mitigate any risks that might arise from market liquidity issues.
(i) Interest rate risk
The Group constantly analyses its interest rate exposure to decide the potential renewals of existing positions, alternative financing and the mix of fixed and variable interest rates.
Interest on amounts drawn under the receivables purchase facility are charged at the Bank Bill Swap Bid rate adjusted for the credit risk of the relevant debtor. At year end, the amount utilised under this facility was $33,855,122 (2013: $33,024,094).
Interest rate swap - cash flow hedge
The Group is exposed to interest rate changes on utilised facilities under the receivable financing facilities, bank bill facility and overdraft facilities which are all floating rate interest loans. The Group hedged $50 million of this exposure by taking out interest rate swap contracts at 5.91% as at 24 April 2012 for the next 36 months.
The interest rate swaps require settlement of net interest receivable or payable each 30 days. The settlement dates coincide with the dates on which interest is payable on the underlying debt. The swap is matched directly against the underlying borrowings and interest expense and as such is considered highly effective. It is settled on a net basis. The swap is measured at fair value and all gains and losses attributable to the hedged risks are taken directly to equity and re-classified into profit and loss when the interest expense is recognised.
Notes to the Financial statementscontinued
For
per
sona
l use
onl
y

71Chandler Macleod Group Limited Annual Report 2014
The Group’s exposure to interest rate risk and the effective weighted average interest rate by maturity periods is set out in the following tables.
Total $000
weighted average effective interest rate %
2014 2013 2014 2013
(i) Financial assets
Floating rate
Cash 2,671 3,262 - -
Deposit 9 9 3.0 3.0
(ii) Financial liabilities
Fixed rate
Financial lease liability 2,832 1,926 6.1 7.3
Deferred settlement for business acquisitions 2,862 3,154 - -
Bank bill 17,554 - 5.9 -
Bank recourse borrowings 32,446 50,000 5.9 5.9
Floating rate
Bank overdraft 194 - 12.5 12.5
Bank recourse borrowings - 1,304 4.7 5.3
Bank bill 33,596 61,150 4.6 5.8
Flexible credit facility 1,458 1,360 9.8 7.6
Term loan 2,917 887 6.9 5.9
The following sensitivity analysis is based on the interest rate risk exposures in existence at the reporting date.
At 30 June 2014, if interest rates had moved, as illustrated in the table below, with all other variables held constant, post tax profit and equity would have been affected as follows:
Judgements of reasonably possible movements: ($000) Post Tax Profit hedge Reserve
higher/(Lower) 2014 2013 2014 2013
Consolidated
+1.0% (100 basis points) (524) (697) 288 625
-1.0% (100 basis points) 524 697 (288) (625)
The movements in profit are due to higher/lower interest costs from variable rate debt balances.
(ii) Foreign currency risk
The Group operates internationally but is not materially exposed to foreign exchange risk arising from currency exposures to the Australian dollar. Foreign exchange risk arises when future commercial transactions and recognised assets and liabilities are denominated in a currency that is not the entity’s functional currency and net investments in foreign operations. The risk is measured using sensitivity analysis and cash flow forecasting.
The Group does not hedge this foreign exchange and translation exposure.
The impact of the exchange movements on the Consolidated Statement of Financial Position is not considered material.
Net assets of overseas operations represents 4.4% (2013: 6.1%) of the Group net assets. The largest individual balance represents 3.6% (2013:3.9%) of the Group net assets.
Net profit after tax from the overseas operations represents 2% (2013: 11.4%) of the Group net profit after tax.
Notes to the Financial statementscontinued
For
per
sona
l use
onl
y
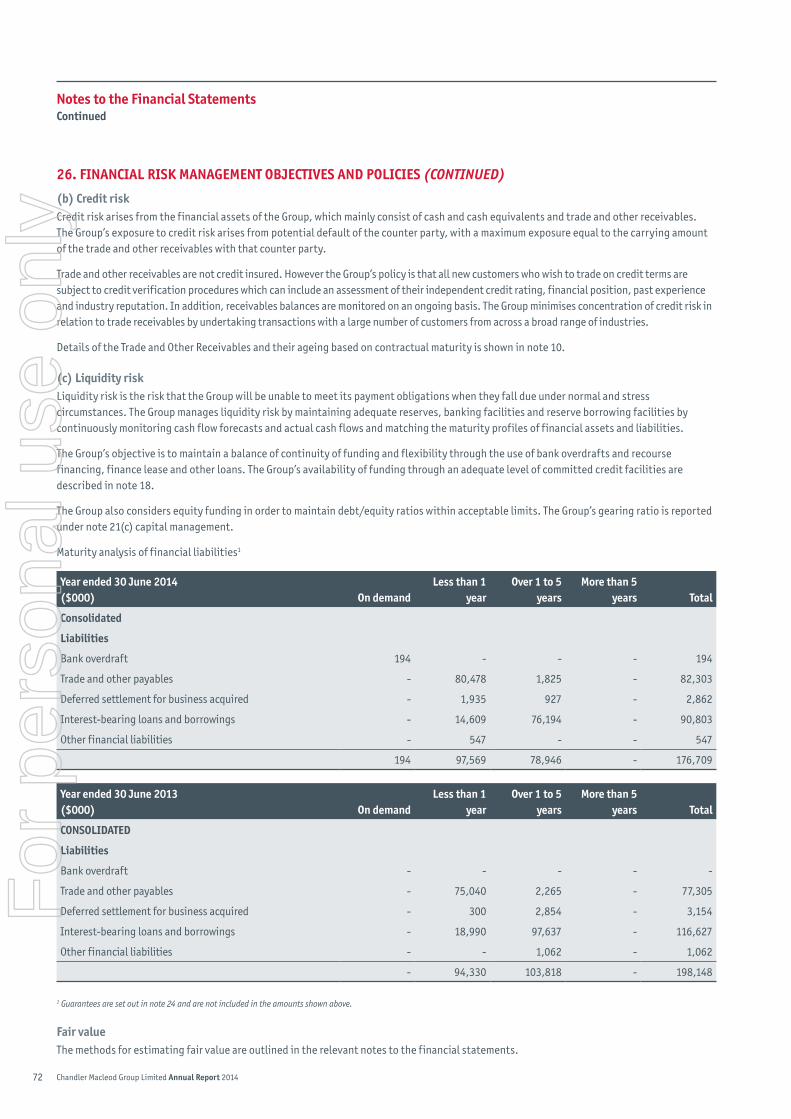
72 Chandler Macleod Group Limited Annual Report 2014
26. FiNANciAL Risk mANAgEmENT ObJEcTiVEs ANd POLiciEs (CONTINUED)
(b) credit riskCredit risk arises from the financial assets of the Group, which mainly consist of cash and cash equivalents and trade and other receivables. The Group’s exposure to credit risk arises from potential default of the counter party, with a maximum exposure equal to the carrying amount of the trade and other receivables with that counter party.
Trade and other receivables are not credit insured. However the Group’s policy is that all new customers who wish to trade on credit terms are subject to credit verification procedures which can include an assessment of their independent credit rating, financial position, past experience and industry reputation. In addition, receivables balances are monitored on an ongoing basis. The Group minimises concentration of credit risk in relation to trade receivables by undertaking transactions with a large number of customers from across a broad range of industries.
Details of the Trade and Other Receivables and their ageing based on contractual maturity is shown in note 10.
(c) Liquidity riskLiquidity risk is the risk that the Group will be unable to meet its payment obligations when they fall due under normal and stress circumstances. The Group manages liquidity risk by maintaining adequate reserves, banking facilities and reserve borrowing facilities by continuously monitoring cash flow forecasts and actual cash flows and matching the maturity profiles of financial assets and liabilities.
The Group’s objective is to maintain a balance of continuity of funding and flexibility through the use of bank overdrafts and recourse financing, finance lease and other loans. The Group’s availability of funding through an adequate level of committed credit facilities are described in note 18.
The Group also considers equity funding in order to maintain debt/equity ratios within acceptable limits. The Group’s gearing ratio is reported under note 21(c) capital management.
Maturity analysis of financial liabilities1
year ended 30 June 2014 ($000) On demand
Less than 1 year
Over 1 to 5 years
more than 5 years Total
consolidated
Liabilities
Bank overdraft 194 - - - 194
Trade and other payables - 80,478 1,825 - 82,303
Deferred settlement for business acquired - 1,935 927 - 2,862
Interest-bearing loans and borrowings - 14,609 76,194 - 90,803
Other financial liabilities - 547 - - 547
194 97,569 78,946 - 176,709
year ended 30 June 2013 ($000) On demand
Less than 1 year
Over 1 to 5 years
more than 5 years Total
cONsOLidATEd
Liabilities
Bank overdraft - - - - -
Trade and other payables - 75,040 2,265 - 77,305
Deferred settlement for business acquired - 300 2,854 - 3,154
Interest-bearing loans and borrowings - 18,990 97,637 - 116,627
Other financial liabilities - - 1,062 - 1,062
- 94,330 103,818 - 198,148
1 Guarantees are set out in note 24 and are not included in the amounts shown above.
Fair valueThe methods for estimating fair value are outlined in the relevant notes to the financial statements.
Notes to the Financial statementscontinued
For
per
sona
l use
onl
y
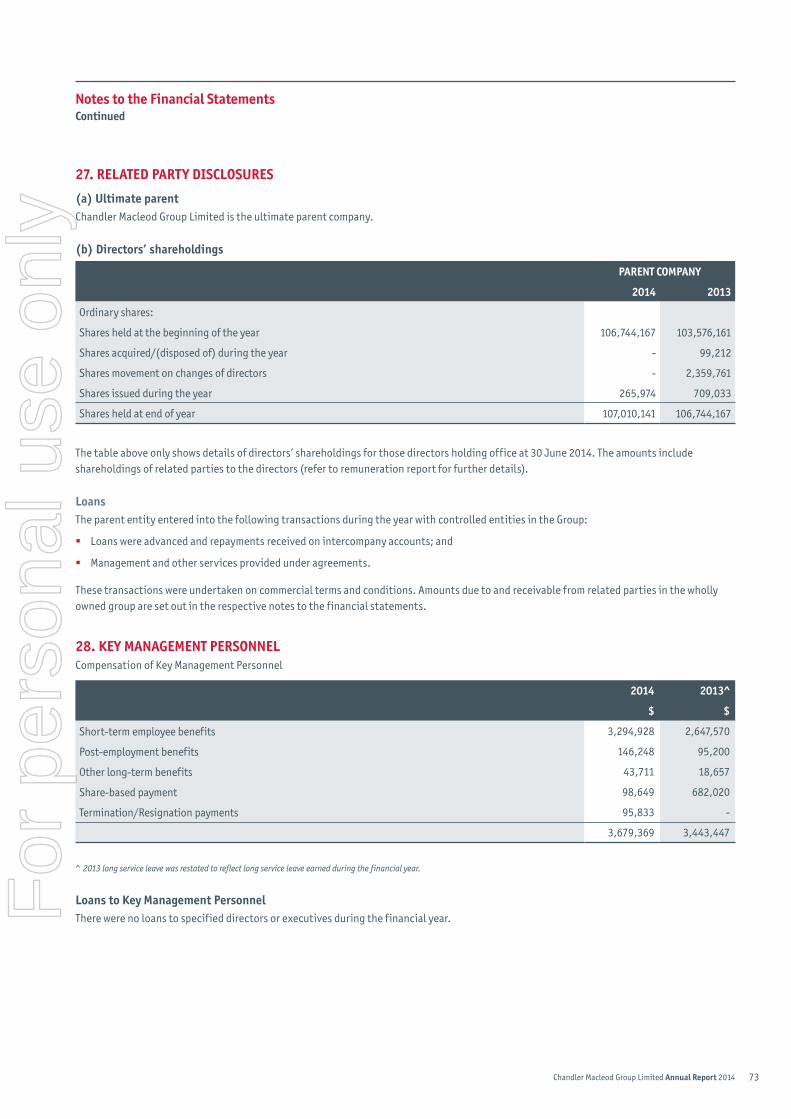
73Chandler Macleod Group Limited Annual Report 2014
27. RELATEd PARTy discLOsUREs
(a) Ultimate parentChandler Macleod Group Limited is the ultimate parent company.
(b) directors’ shareholdings
PARENT cOmPANy
2014 2013
Ordinary shares:
Shares held at the beginning of the year 106,744,167 103,576,161
Shares acquired/(disposed of) during the year - 99,212
Shares movement on changes of directors - 2,359,761
Shares issued during the year 265,974 709,033
Shares held at end of year 107,010,141 106,744,167
The table above only shows details of directors’ shareholdings for those directors holding office at 30 June 2014. The amounts include shareholdings of related parties to the directors (refer to remuneration report for further details).
LoansThe parent entity entered into the following transactions during the year with controlled entities in the Group:
� Loans were advanced and repayments received on intercompany accounts; and
� Management and other services provided under agreements.
These transactions were undertaken on commercial terms and conditions. Amounts due to and receivable from related parties in the wholly owned group are set out in the respective notes to the financial statements.
28. kEy mANAgEmENT PERsONNEL Compensation of Key Management Personnel
2014 2013^
$ $
Short-term employee benefits 3,294,928 2,647,570
Post-employment benefits 146,248 95,200
Other long-term benefits 43,711 18,657
Share-based payment 98,649 682,020
Termination/Resignation payments 95,833 -
3,679,369 3,443,447
^ 2013 long service leave was restated to reflect long service leave earned during the financial year.
Loans to key management Personnel There were no loans to specified directors or executives during the financial year.
Notes to the Financial statementscontinued
For
per
sona
l use
onl
y

74 Chandler Macleod Group Limited Annual Report 2014
29. shARE-bAsEd PAymENT PLANs
(a) Recognised share-based payment expensesThe expense recognised for employee services received during the year is shown in the table below:
2014 2013
$ $
Expense arising from equity-settled share-based payment transactions
- Exempt Employee Share Plan (EESP) 137,700 115,112
- Senior Executive Share Plan (SESP) 460,316 1,546,103
- Senior Executive Option Plan (SEOP) 79,795 53,687
Total expense arising from share-based payment transactions 677,811 1,714,902
(b) Types of share-based payment plans
Exempt Employee share Plan, ‘EEsP’Exempt Employee Share Plan (‘EESP’), a ‘salary sacrifice’ type plan which commenced on 1 July 2006 and provides benefits to all employees who earn no more than $180,000 per annum.
deferred Tax Employee share Plan, ‘dTEsP’Deferred Tax Employee Share Plan (‘DTESP’), a ‘salary sacrifice’ type plan which also commenced on 1 July 2006 and provides benefits to all employees. The operation of this plan was discontinued from 1 July 2013.
senior Executive share Plan, ‘sEsP’The SESP commenced on 17 December 2007 and is an incentive plan for meeting certain performance conditions. The SESP is consistent with the principles and objectives of the Remuneration Policy of building a partnership between the Company and its executives by encouraging ownership by the executives of shares in the Company.
The LTI target under the SESP for each eligible executive is set as a percentage of TFR. The designated percentage, which ranged from 15% to 40% during the reporting period, is determined based on a combination of each executive’s level of responsibility, performance, potential and retention risk.
For shares allocated under the SESP prior to 1 July 2008, the performance condition was linked to the Company’s performance over each vesting period (i.e. 3 years, 4 years, 5 years) having regard to the Total Shareholder Return (“TSR”) of the Company relative to a peer group of companies that represent appropriate investment alternatives for shareholders. This scheme was completed during the 2013 financial year.
For shares allocated after 1 July 2008 and prior to 1 March 2011 one third of the share allocations will vest at the completion of 1, 2 and 3 years of service after their allocation, subject to the relevant person still being employed at the time of vesting.
The vesting of these shares is not dependent on the satisfaction of a performance condition as the Board elected to base vesting on retention of executives. This scheme came to an end after the completion of three years on 15 August 2013.
For shares allocated post 1 March 2011, one quarter of this share allocation will vest at the completion of 1, 2, 3 and 4 years of service after their allocation, subject to the relevant person still being employed at the time of vesting. The vesting of these shares is also dependent on the achievement of certain performance hurdles set by the Remuneration & Nomination Committee at the commencement of each financial year.
During the 2014 financial year, the Company allocated 3,422,135 (2013: 6,091,657) shares.
Notes to the Financial statementscontinued
For
per
sona
l use
onl
y

75Chandler Macleod Group Limited Annual Report 2014
A summary of the vesting and hurdles for the CEO and CFO is set out below:
Vesting period End of year 1 End of year 2 End of year 3 End of year 4
Service allocation 1/4 of allocation 1/4 of allocation 1/4 of allocation 1/4 of allocation
Time Based 33.3% 33.3% 33.3% 33.3%
EPS Based 33.3% 33.3% 33.3% 33.3%
EBITDA Based 33.3% 33.3% 33.3% 33.3%
A summary of the vesting and hurdles for all other staff is set out below:
Vesting period End of year 1 End of year 2 End of year 3 End of year 4
Service allocation 1/4 of allocation 1/4 of allocation 1/4 of allocation 1/4 of allocation
Time Based 40% 40% 40% 40%
EPS Based 30% 30% 30% 30%
EBITDA Based 30% 30% 30% 30%
Mr Cameron Judson is the only Director participating in the SESP, and was allocated 541,667 shares during the 2014 financial year (2013: 1,415,000), comprising shares acquired on market prior to 2014 and had been forfeited by prior participants which were re-allocated to Mr Judson. The performance hurdles for the 2014 allocation are based on the target Earnings per Share and EBITDA set by the Remuneration and Nomination Committee.
senior Executive Option Plan, ‘sEOP’Share Options may be granted to senior executives of the Group under the SEOP, which commenced on 21 November 2007 unless otherwise determined by the Board. Options granted under the SEOP is conditional on the option holder being an employee of the Group at the time of vesting, and such other conditions as the Board may see fit to impose and Options granted under the SEOP expire 7 years from the date of offer.
The share options were granted to certain employees of OCG Consulting Limited, a wholly owned subsidiary of the Group at an exercise price of $0.01. On 30 June 2011, 500,000 options were granted, one third of the options granted will vest at the completion of 1, 2 and 3 years of service from the grant date, subject to the relevant person still being employed at the time of vesting.
During 2014 financial year, 306,688 share options were granted. One quarter of these options will vest at the completion of 1, 2, 3 and 4 years of service after their allocation, subject to the relevant person still being employed at the time of vesting. The vesting of these shares is also dependent on the achievement of certain performance hurdles set by the Remuneration & Nomination Committee at the commencement of each financial year.
176,420 share options were exercised during the year (2013: 127,403) and 44,170 options were forfeited due to resignation of an eligible executive (2013: nil).
Summaries of options granted under SEOP
2014 2013
Outstanding at the beginning of the year 372,597 500,000
Granted during the year 306,688 -
Forfeited during the year (44,170) -
Exercised during the year (176,420) (127,403)
Expire during the year - -
Outstanding at the end of the year 458,695 372,597
Notes to the Financial statementscontinued
For
per
sona
l use
onl
y

76 Chandler Macleod Group Limited Annual Report 2014
29. shARE-bAsEd PAymENT PLANs (CONTINUED)
(c) sEOP pricing modelEquity-settled transactions
The fair value of the equity-settled options is estimated as at the date of grant using the Black-Scholes pricing model taking into account the terms and conditions upon which the options and shares were granted.
The following table list the inputs to the models used for the SEOP for the years ended 30 June 2014 and 2013, respectively:
2014 2013
Dividend yield (%) 7.00 8.00
Expected volatility (%) 10.00 10.00
Risk-free interest rate (%) 3.54 3.76
Expected life of share options (years) 4.00 1.00
Weighted average share price ($) 0.45 0.45
30. PARENT ENTiTyChandler Macleod Group Limited is the ultimate parent of the consolidated Group.
2014 2013
$000 $000
Current Assets 93,337 81,343
Total Assets 320,884 314,606
Current Liabilities (57,206) (53,705)
Total Liabilities (125,806) (160,010)
Issued capital 182,272 146,668
Retained earnings/(accumulated losses) 11,331 7,045
Other reserves 1,475 883
Total sharholders’ Equity 195,078 154,596
Profit of the parent entity 19,965 11,720
Total comprehensive income of the parent entity 20,557 11,778
commitments and contingenciesThe parent has entered into the following guarantees and commitments on behalf its subsidiaries.
2014 2013
guarantees $000 $000
Bank guarantees in respect of leases of premises 6,223 5,140
Workers’ compensation guarantees 48,504 47,848
Performance guarantees issued on behalf of Hong Kong subsidiary 1,928 1,984
56,655 54,972
Cross guarantees given by the parent and some of its subsidiaries are described in note 31.
Notes to the Financial statementscontinued
For
per
sona
l use
onl
y
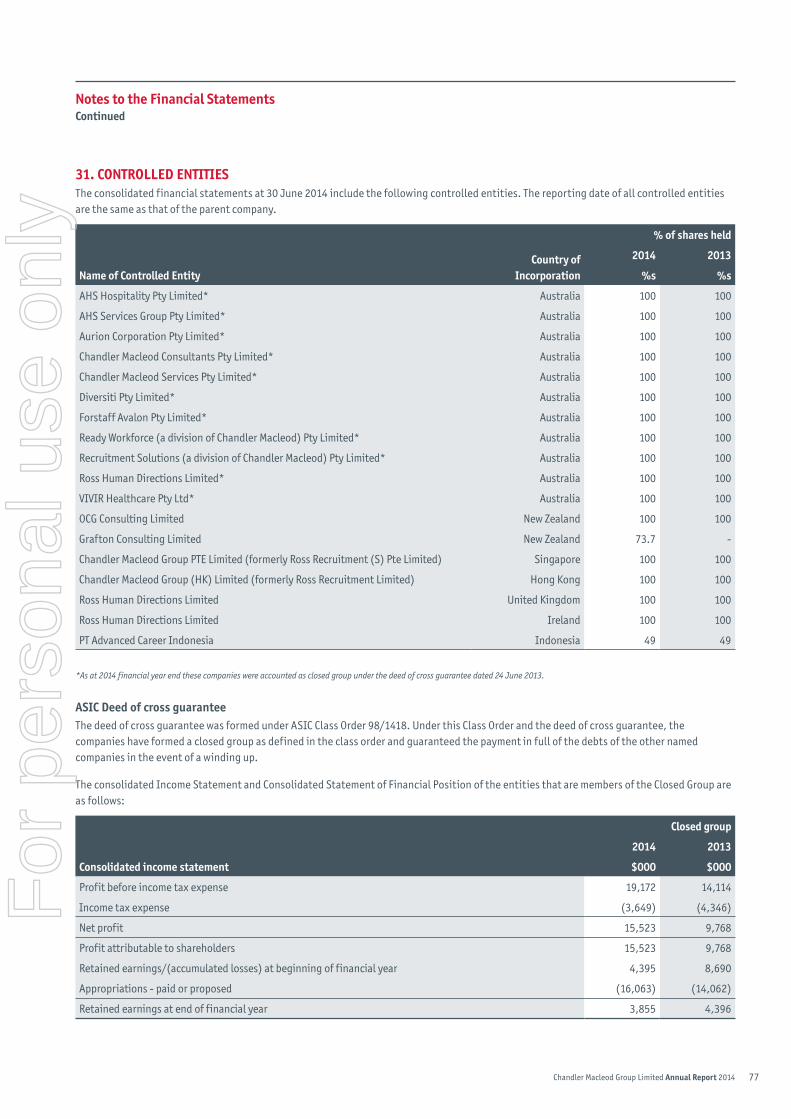
77Chandler Macleod Group Limited Annual Report 2014
31. cONTROLLEd ENTiTiEsThe consolidated financial statements at 30 June 2014 include the following controlled entities. The reporting date of all controlled entities are the same as that of the parent company.
country of incorporation
% of shares held
2014 2013
Name of controlled Entity %s %s
AHS Hospitality Pty Limited* Australia 100 100
AHS Services Group Pty Limited* Australia 100 100
Aurion Corporation Pty Limited* Australia 100 100
Chandler Macleod Consultants Pty Limited* Australia 100 100
Chandler Macleod Services Pty Limited* Australia 100 100
Diversiti Pty Limited* Australia 100 100
Forstaff Avalon Pty Limited* Australia 100 100
Ready Workforce (a division of Chandler Macleod) Pty Limited* Australia 100 100
Recruitment Solutions (a division of Chandler Macleod) Pty Limited* Australia 100 100
Ross Human Directions Limited* Australia 100 100
VIVIR Healthcare Pty Ltd* Australia 100 100
OCG Consulting Limited New Zealand 100 100
Grafton Consulting Limited New Zealand 73.7 -
Chandler Macleod Group PTE Limited (formerly Ross Recruitment (S) Pte Limited) Singapore 100 100
Chandler Macleod Group (HK) Limited (formerly Ross Recruitment Limited) Hong Kong 100 100
Ross Human Directions Limited United Kingdom 100 100
Ross Human Directions Limited Ireland 100 100
PT Advanced Career Indonesia Indonesia 49 49
*As at 2014 financial year end these companies were accounted as closed group under the deed of cross guarantee dated 24 June 2013.
Asic deed of cross guaranteeThe deed of cross guarantee was formed under ASIC Class Order 98/1418. Under this Class Order and the deed of cross guarantee, the companies have formed a closed group as defined in the class order and guaranteed the payment in full of the debts of the other named companies in the event of a winding up.
The consolidated Income Statement and Consolidated Statement of Financial Position of the entities that are members of the Closed Group are as follows:
consolidated income statement
closed group
2014 2013
$000 $000
Profit before income tax expense 19,172 14,114
Income tax expense (3,649) (4,346)
Net profit 15,523 9,768
Profit attributable to shareholders 15,523 9,768
Retained earnings/(accumulated losses) at beginning of financial year 4,395 8,690
Appropriations - paid or proposed (16,063) (14,062)
Retained earnings at end of financial year 3,855 4,396
Notes to the Financial statementscontinued
For
per
sona
l use
onl
y

78 Chandler Macleod Group Limited Annual Report 2014
31. cONTROLLEd ENTiTiEs (CONTINUED)
consolidated statement of financial position
closed group
2014 2013^
$000 $000
current assets
Cash and cash equivalents 269 627
Trade and other receivables 122,987 113,559
Other financial assets 1,392 2,539
Total current assets 124,648 116,725
Non-current assets
Other financial assets 12,898 12,959
Property and office equipment 10,154 12,279
Intangible assets and goodwill 219,913 216,366
Deferred tax assets 9,934 9,583
Total non-current assets 252,899 251,187
Total assets 377,547 367,912
current liabilities
Payables 74,430 69,815
Interest-bearing loans and borrowings 13,345 17,510
Income tax payable 5,280 1,547
Provisions 13,855 15,507
Other financial liabilities 543 -
Total current liabilities 107,453 104,379
Non-current liabilities
Payables 1,825 2,265
Interest-bearing loans and borrowings 73,277 96,837
Other financial liabilities - 3,916
Provisions 3,430 4,375
Total non-current liabilities 78,532 107,393
Total liabilities 185,985 211,772
Net assets 191,562 156,140
Equity
Contributed equity 186,429 150,825
Retained earnings 3,853 4,762
Reserves 1,280 553
Total equity 191,562 156,140
^ 30 June 2013 balances have been restated (Note 23d).
Notes to the Financial statementscontinued
For
per
sona
l use
onl
y

79Chandler Macleod Group Limited Annual Report 2014
32. EVENTs AFTER ThE REPORTiNg dATE
dividendOn 18 August 2014, the directors of Chandler Macleod Group Limited declared a final dividend on ordinary shares in respect of the 2014 financial year. The total amount of the dividend is $9.9 m which represents a fully franked dividend of 1.8 cents per share. The dividend has not been provided for in the 30 June 2014 financial statements.
New banking facilityOn 18 August 2014, the Group entered into a combined facilities agreement with Westpac Banking Corporation and the Hong Kong & Shanghai Banking Corporation which comprises:
� Cash Advance facility of $51.2 million
� Bank Guarantee facility (Australia and overseas) of $11 million
� Multi Option facility (Australia and overseas) up to $10 million
� Invoice Finance - With Recourse facility up to $90 million
� Invoice Finance - Without Recourse facility up to $55 million
� Workers Compensation Bond Facility of $55.5 million
The Group will terminate all of its current facilities with NAB and ANZ on or before 29 September 2014.
Apart from the matters referred to above, there has not arisen in the interval between the end of the financial year and the date of this report any item, transaction or event of a material and unusual nature likely, in the opinion of the directors of the Company, to affect significantly the operations of the consolidated entity, the results of those operations, or the state of affairs of the consolidated entity, in subsequent financial years.
33. AUdiTORs’ REmUNERATiONThe following total remuneration was received by the auditors in respect of:
2014 2013
$ $
Amounts received or due and receivable by:
Ey Australia - primary auditors
- an audit or review of the financial report of the entity and any other entity in the consolidated entity 506,183 542,448
- tax compliance 161,371 211,194
- other assurance services 61,500 119,855
Other auditors
- an audit or review of the financial report of the entity and any other entity in the consolidated entity 113,105 62,077
- tax compliance 16,151 21,490
- other advisory services 6,496 -
864,806 957,064
Notes to the Financial statementscontinued
For
per
sona
l use
onl
y

80 Chandler Macleod Group Limited Annual Report 2014
In accordance with a resolution of the directors of Chandler Macleod Group Limited, I state that:
In the opinion of the directors:
(a) the financial statements and notes of the consolidated entity are in accordance with the Corporations Act 2001, including:
(i) giving a true and fair view of the consolidated entity’s financial position as at 30 June 2014 and of its performance for the year ended on that date; and
(ii) complying with Australian Accounting Standards (including the Australian Accounting Interpretations) and the Corporations Regulations 2001;
(b) the financial statements and notes also comply with International Financial Reporting Standards as disclosed in note 2(b); and
(c) there are reasonable grounds to believe that the Company will be able to pay its debts as and when they become due and payable.
(d) this declaration has been made after receiving the declarations required to be made to the Directors in accordance with section 295A of the Corporations Act 2001 for the financial year ending 30 June 2014.
(e) as at the date of this declaration, there are reasonable grounds to believe that the members of the Closed Group identified in note 31 will be able to meet any obligations or liabilities to which they are or may become subject, by virtue of the Deed of Cross Guarantee.
On behalf of the Board
Richard EnglandChairman
Sydney 18 August 2014
directors’ declaration
For
per
sona
l use
onl
y

81Chandler Macleod Group Limited Annual Report 2014
independent Auditor’s ReportTo the members of chandler macleod group Limited
REPORT ON ThE FiNANciAL REPORTWe have audited the accompanying financial report of Chandler Macleod Group Limited, which comprises the consolidated statement of financial position as at 30 June 2014, the consolidated statement of profit or loss and other comprehensive income, the consolidated statement of changes in equity and the consolidated cash flow statement for the year ended, notes comprising a summary of significant accounting policies and other explanatory information, and the directors’ declaration of the consolidated entity comprising the company and the entities it controlled at the year’s end or from time to time during the financial year.
directors’ Responsibility for the Financial ReportThe directors of the company are responsible for the preparation of the financial report that gives a true and fair view in accordance with Australian Accounting Standards and the Corporations Act 2001 and for such internal controls as the directors determine are necessary to enable the preparation of the financial report that is free from material misstatement, whether due to fraud or error. In Note 2(b), the directors also state, in accordance with Accounting Standard AASB 101 Presentation of Financial Statements, that the financial statements comply with International Financial Reporting Standards.
Auditor’s ResponsibilityOur responsibility is to express an opinion on the financial report based on our audit. We conducted our audit in accordance with Australian Auditing Standards. Those standards require that we comply with relevant ethical requirements relating to audit engagements and plan and perform the audit to obtain reasonable assurance about whether the financial report is free from material misstatement.
An audit involves performing procedures to obtain audit evidence about the amounts and disclosures in the financial report. The procedures selected depend on the auditor’s judgment, including the assessment of the risks of material misstatement of the financial report, whether due to fraud or error. In making those risk assessments, the auditor considers internal controls relevant to the entity’s preparation and fair presentation of the financial report in order to design audit procedures that are appropriate in the circumstances, but not for the purpose of expressing an opinion on the effectiveness of the entity’s internal controls. An audit also includes evaluating the appropriateness of accounting policies used and the reasonableness of accounting estimates made by the directors, as well as evaluating the overall presentation of the financial report.
We believe that the audit evidence we have obtained is sufficient and appropriate to provide a basis for our audit opinion.
independenceIn conducting our audit we have complied with the independence requirements of the Corporations Act 2001. We have given to the directors of the company a written Auditor’s Independence Declaration, a copy of which is included in the directors’ report.
OpinionIn our opinion:
(a) the financial report of Chandler Macleod Group Limited is in accordance with the Corporations Act 2001, including:
(i) giving a true and fair view of the consolidated entity’s financial position as at 30 June 2013 and of its performance for the year ended on that date; and
(ii) complying with Australian Accounting Standards and the Corporations Regulations 2001; and
(b) the financial report also complies with International Financial Reporting Standards as disclosed in Note 2(b).
REPORT ON ThE REmUNERATiON REPORTWe have audited the Remuneration Report included in the directors’ report for the year ended 30 June 2013. The directors of the company are responsible for the preparation and presentation of the Remuneration Report in accordance with section 300A of the Corporations Act 2001. Our responsibility is to express an opinion on the Remuneration Report, based on our audit conducted in accordance with Australian Auditing Standards.
OpinionIn our opinion, the Remuneration Report of Chandler Macleod Group for the year ended 30 June 2013, complies with section 300A of the Corporations Act 2001.
Ernst & young
P s barnardPartner
18 August 2014
Ernst & Young680 George StreetSydney NSW 2000 AustraliaGPO Box 2646 Sydney NSW 2001
Tel: +61 2 9248 5555Fax: +61 2 9248 5959ey.com
For
per
sona
l use
onl
y

82 Chandler Macleod Group Limited Annual Report 2014
Other shareholder information
disTRibUTiON OF hOLdERs EqUiTy sEcURiTiEs As AT 31 AUgUsT 2014Range shareholders
1 - 1,000 227
1,001 - 5,000 957
5,001 - 10,000 478
10,001 - 100,000 1126
100,001 - over 199
Total 2,987
sUbsTANTiAL shAREhOLdERs As discLOsEd TO ThE cOmPANy 31 AUg 2014substantial holder shares in which they or their associates have a relevant interest
John Charles Plummer / Gold Tiger Investments Pty Ltd 73,463,232
Lazard Carnegie Wylie 67,753,528
Mr Victor John Plummer 57,000,000
National Nominees Limited 50,253,062
Corom Pty Ltd 29,212,929
J P Morgan Nominees Australia Limited 27,507,313
HSBC Custody Nominees (Australia) Limited 22,419,935
20 LARgEsT shAREhOLdERs - As AT 31 AUgUsT 2014
NameNumber
of shares held %
Mr Victor John Plummer 57,000,000 10.4
National Nominees Limited 50,253,062 9.17
Mr John Charles Plummer 49,190,452 8.98
Citicorp Nominees Pty Limited 35,682,961 6.51
CWC COFA Pty Ltd 30,489,088 5.56
CWC COFB Pty Ltd 30,489,088 5.56
Corom Pty Ltd 29,212,929 5.33
J P Morgan Nominees Australia Limited 27,507,313 5.02
Gold Tiger Investments Pty Ltd 24,228,320 4.42
HSBC Custody Nominees (Australia) Limited 22,419,935 4.09
CPU Share Plans Pty Ltd 12,831,951 2.34
BNP Paribas Nominees Pty Ltd 12,123,334 2.21
RBC Investor Services Australia Nominees Pty Limited 8,796,557 1.61
CWC Investors Pty Ltd 6,775,352 1.24
AMP Life Limited 6,252,388 1.14
The Trust Company (Australia) Limited 6,003,054 1.10
Brispot Nominees Pty Ltd 5,671,285 1.03
CPU Share Plans Pty Ltd 4,599,769 0.84
Mrs Liesl Jane Wilson 4,160,535 0.76
Aust Executor Trustees Ltd 3,769,600 0.69
427,456,973 78.01
For
per
sona
l use
onl
y
83Chandler Macleod Group Limited Annual Report 2014
corporate information
AbN 33 090 555 052
diREcTORsR.A.F. England (Chairman, Non-Executive Director)M.H. Carnegie (Non-Executive Director)J.J. Cowin (Non-Executive Director)E.A. Crouch (Non-Executive Director)J.C. Plummer (Deputy Chairman, Non-Executive Director)C.J.C. Judson (Managing Director and Chief Executive Officer)
cOmPANy sEcRETARiEsM.H. SloperG.J. CoolahanO.J. Wilson (resigned 5 September 2014)
REgisTEREd OFFicELevel 18, 363 George StreetSydney NSW 2000(02) 9269 8666
PRiNciPAL PLAcE OF bUsiNEssLevel 18, 363 George StreetSydney NSW 2000(02) 9269 8666
shARE REgisTERComputershare Investor Services Pty LimitedYarra Falls452 Johnston StreetAbbotsford VIC 3067
bANkERsNational Australia BankAustralia and New Zealand Banking Group
AUdiTORsErnst & Young
iNTERNET AddREsswww.chandlermacleod.com
PLAN
ASSESS
MANAGE
DEVELOP
SOURCE
For
per
sona
l use
onl
y

chANdLER mAcLEOd gROUP LimiTEd
www.chandlermacleod.com
AbN 33 090 555 052
For
per
sona
l use
onl
y