Embed Size (px)
Citation preview

ABN 18 085 223 570
ANNUAL REPORT
2008
For
per
sona
l use
onl
y

CONTENTS
Chairman’s Report 1 Community, Environment and Heritage 3 Review of Operations 5 Tenement Schedule 18 Shareholder Information 20 Directors’ Report 22 Corporate Governance Statement 30 Income Statement 34 Balance Sheet 35 Statement of Changes in Equity 36 Cash Flow Statement 37 Notes to the Financial Statements 38 Directors’ Declaration 64 Auditors Independence Declaration 65 Independent Audit Report 66
CORPORATE DIRECTORY
DIRECTORS Lewis Cross (Non-executive Chairman) Jonathan Lea (Managing Director) Alan Tough (Executive Director) Kevin Schultz (Non-executive Director) Ian Buchhorn (Non-executive Director) Kenneth Hellsten (Non-executive Director) COMPANY SECRETARY Trevor Verran REGISTERED OFFICE Pre 1 October 2008: Level 2, 123A Colin Street West Perth WA 6005 Post 1 October 2008: Level 2, 1109 Hay Street West Perth WA 6005 PO Box 670 West Perth WA 6872 Telephone: +61 (08) 9481 3030 Facsimile: +61 (08) 9481 3031 Email: [email protected] Website: www.polarismetals.com.au SOUTHERN CROSS DEPOT 321 Arcturus Street Southern Cross WA 6426 Telephone: +61 (08) 9049 1258 Facsimile: +61 (08) 9049 1259
SOLICITORS Blakiston & Crabb 1202 Hay Street West Perth WA 6005 BANKERS National Australia Bank Limited AUDITORS Ord Partners Level 2, 47 Colin Street West Perth WA 6005 SHARE REGISTER Security Transfer Registrars Pty Ltd 770 Canning Highway Applecross WA 6153 PO Box 535 Applecross WA 6953 Telephone: +61 (08) 9315 0933 Facsimile: +61 (08) 9315 2233 ASX CODE POL F
or p
erso
nal u
se o
nly

1
CHAIRMAN’S REPORT Corporate Polaris has progressed significantly towards our strategic objective of being a 5-10 million tonnes per annum iron ore producer. With four potential production projects and excellent exploration potential throughout Western Australia Polaris can plan to move forward with confidence in its transition from explorer to miner. The exploration of a number of known iron ore prospects and the discovery of a new major potential resource at Weelumurra has enabled a pipeline of future projects to be established. Polaris expects to be able to commence production in 2010 and just as importantly has the potential mineral resources to become a long term medium sized Western Australian iron ore mining house. The current focus is firmly on the Yilgarn Iron Ore Project (YIOP) with extensive drill testing of the new discoveries of 2007 and feasibility studies to capture all the required data necessary to obtain mining approvals. Polaris made two renounceable rights issues during the year to raise working capital. Capital requirements for the company have increased, in line with the more advanced nature of operations as the company transitions from exploration to mine development. Approximately $6 million was raised in November 2007 and $11 million in April 2008 after costs. The stock broking firm, Patersons Securities Limited, acted as the underwriter on both occasions. Polaris’ two major shareholders, Heron Resources Limited (Heron) and Malaysia’s The Lion Group (Lion) maintained their support during the year by participating in both capital raisings and, in the case of Lion, actively buying additional equities on the market. As a consequence at the end of the year Heron owns 25.2% and Lion owns 19.7% of Polaris. The Company looks forward to the continuation of this support. During the year ended 30 June 2008, Polaris spun out the non-core gold and nickel assets into a new IPO called Southern Cross Goldfields (ASX: SXG) so the Company can concentrate on developing iron ore projects. Polaris owns approximately 18% of SXG fully paid shares and 45% of SXG options, and hence maintains exposure to the exploration upside. A total of 22 million shares in SXG were distributed in-specie to Polaris’ shareholders in June 2008. A number of Board changes occurred during the year - largely associated with Polaris’ progressive transition from exploration to mining. In particular, the inaugural Managing Director, Kevin Shultz retired to become a non-executive director. Kevin’s vision for the future and major contribution in securing the iron ore assets on which Polaris will base its future cannot be under-estimated. I offer him my warm thanks for his hugely significant input. Vern Strange, another founding Director, also stood down, to concentrate on SXG. Colin McCavana retired due to commitments elsewhere, so 2008 led to a “changing of the guard”. New appointments in January 2008 were Jon Lea as Managing Director and Alan Tough as Executive Director Operations, Project Development The Yilgarn Iron Ore Project (YIOP) hosts five identified mineral resources with excellent potential for iron ore production. The initial focus is on Carina – discovered by Polaris in 2007. A recently completed pre-feasibility study showed a robust financial return and the key recommendation was to progress to a bankable study. The study was based on an extraction rate of 2.5Mtpa but Polaris expects to develop a resource base sufficient to support production at 5mtpa in the longer term. The project benefits from its proximity to open access rail and ports, reducing the costs and time to access infrastructure. The total resource base for the project is considered to be in excess of 100Mt. The Poondano project near Port Hedland similarly offers potential for near-term production. A mining rate of 1-1.5Mtpa is envisaged both of direct shipping channel iron ore and ore up-graded through screening. Iron ore mineralisation was found by helicopter reconnaissance at the Weelumurra project during the year and remote sensing studies suggest an exploration potential of over 250Mt. Being further from infrastructure the time to development will be longer but the project is a key development target after the YIOP. The Bullfinch North project hosts the Mayfield magnetite deposit. Polaris is commencing work to evaluate the potential for direct shipping the high grade ores or using dry separation methods to produce a concentrate. With a resource potential of 100Mt and synergies with the YIOP project through shared infrastructure this project will be evaluated over the coming year.
For
per
sona
l use
onl
y

2
CHAIRMAN’S REPORT Management and Staff As Chairman, I have welcomed the strategic input of our two largest shareholders Heron and Lion, and confidently expect their support to continue.
I also wish to acknowledge the sterling efforts of our Management team and Staff for their dedication and hard work during the year. We have an excellent team progressing first class projects through all of the processes of determining development feasibility and obtaining statutory approvals for the Company to become a 5-10Mtpa iron ore producer.
Lew Cross Chairman
For
per
sona
l use
onl
y

3
COMMUNITY, ENVIRONMENT AND HERITAGE Polaris’ main focus is currently on the Yilgarn Iron Ore Project but exploration and evaluation is occurring throughout the State of Western Australia. We are actively developing the links and relationships with the stakeholders and regulators in all parts of the State that we operate. Discussions with regulators and flora and fauna surveys are ongoing for approvals, consultation continues with Aboriginal groups and Native Title parties over heritage issues as well as liaison with local residents. Polaris strives to inform all stakeholders of future plans and to meet community and regulatory expectations and requirements so that development can occur in a mutually beneficial and acceptable manner. Yilgarn Iron Ore Project (YIOP) The YIOP is focussed on 5 prospects approximately 60km north of Koolyanobbing. The Carina deposit is the initial focus of development. Community To ensure its Yilgarn developments are carried out with the highest standards of Stakeholder consultation and transparency, Polaris has several operational guidelines:
Thorough Stakeholder consultation to ensure that the aspirations of local Stakeholders are reflected in Polaris’ development strategies, such that the whole Community benefits and has an input in decision-making.
Assisting in the development of a robust and diversified Regional economy that provides opportunities throughout mining, agriculture, conservation and tourism, to the benefit of all in the Community.
Respect and support of Indigenous aspirations, through employment opportunities. Maximisation of the utilisation and development of the State’s existing regional infrastructure.
To assist in identifying stakeholder aspirations a number of consultation processes have commenced using external consultants. This process will continue to ensure an enhanced understanding and enable the consideration of local requirements as part of the project development process. Environmental Management Parts of the Yilgarn Iron Ore Project (YIOP) region contain high conservation and biodiversity values. It is therefore critical that Polaris maintains a high standard of environmental management in its operations. Polaris is proactive in Community Consultation, and in undertaking baseline environmental surveys for its exploration programmes and has developed an Exploration Environmental Management Plan (EEMP) to ensure its activities meet acceptable community standards. The EEMP was a major achievement and while drilling was delayed for a period, the mutual understanding developed between Polaris and the regulators helped strengthen the relationship and to expedite future approval processes. The Helena – Aurora ranges host the Bungalbin East, J4 and J5 deposits. Environmental baseline surveys have identified a number of rare and significant plant species on these deposits. The pink flowered rare plant Tetratheca aphylla appears to only grow in fissures of exposed BIF rock on the ranges and in areas of 1970s drill pad disturbance. Further surveys are programmed to continue to map the distribution of such protected species, in order to responsibly schedule drilling programmes in early 2009. The Company has a number of deposits that do not contain rare plant species for which environmental proposals are further advanced.
For
per
sona
l use
onl
y

4
COMMUNITY, ENVIRONMENT AND HERITAGE
The State government is currently evaluating the possible extension of the Mount Manning A-class Nature Reserve and Polaris’ Bungalbin East and J5 deposits fall within the proposed extension. The State has given Polaris three years to quantify the relative economic and environmental value of Bungalbin East, to allow a final decision to be made. Polaris’ view is that the existing Conservation Park zoning over Bungalbin East should remain, since this is a land use which allows both conservation and mining. This view appears to be shared by the community. Allowing a very small percentage of the Conservation Park to be mined will generate the infrastructure and revenue to manage and develop the larger Conservation Park. Additionally, the mining activity will provide the baseline economic activity which will cushion the ups and downs of the local agricultural industry as it struggles with ever increasing drought seasons. The Carina and Chamaeleon deposits are located in a separate range of hills, the Yendilberin Hills which are outside the potential Mount Manning Nature Reserve extension. Carina is the most advanced of the exploration targets in this area. Baseline environmental assessments for flora, terrestrial and subterranean fauna are well underway. The surveys to date have not identified the rare plants or animals in the project area that are present on other ranges. Polaris has submitted a proposal to the Environmental Protection Authority (EPA), to set the level of assessment for mining the Carina deposit. A decision on the submission is anticipated later in 2008. The completion of environmental assessments for flora, fauna, groundwater will lead to in the submission of the final environmental impact assessment document to Government in 2009. Aboriginal Heritage Issues There are no registered Native Title claims over the YIOP area. Polaris maintains a dialogue with the area’s Traditional Owners and undertakes heritage clearance surveys over project areas. Polaris has employed a number of Aboriginal people during its exploration campaigns and continues to seek develop employment opportunities for local people as site activities are increased.
For
per
sona
l use
onl
y

5
REVIEW OF OPERATIONS
The Polaris Metals NL (Polaris) business plan is to become a significant iron ore producer in the coming 2-3 years. The Company is determined to take advantage of the current window of high iron ore prices to commence production as soon as possible. Two “company-maker” projects have been identified during 2008:
• The Yilgarn Iron Ore Project (YIOP) - near Koolyanobbing in the central Yilgarn Province with the new Carina deposit offering an initial production of 2.5Mtpa of direct shipping ores (DSO) targeted for 2010 and other deposits enabling ramp up to 5.0Mtpa in the medium to longer term: and
• The Weelumurra Project in the central Pilbara – potential for 250 Mt of channel iron deposit (CID), detrital
iron deposits (DID) and canga eluvial mineralization. The key distinguishing feature and benefit for the YIOP is its proximity to and potential access to existing infrastructure. As well as these projects two other potential development projects have been identified:
• The Poondano deposit - 30km south east of Port Hedland in the Pilbara Province with potential production of 1.0-1.5Mtpa of channel iron deposit (CID) ore: and
• The Bullfinch North Project – featuring Mayfield with a resource potential of 100Mt including several
million tones of hematite DSO (+60% Fe) and large tonnages of high grade magnetite-bearing mineralisation (~50% Fe).
Over 17,000m of RC drilling was completed during the year to develop JORC-compliant resource estimates. In total, the estimated resource potential of Polaris exceeds 400 million tonnes in the four identified key projects and with approximately 4700 km2 of tenements in Western Australia, there remains significant potential for further discoveries. A prefeasibility study based on Carina in mid 2008 indicated robust cash flows and profitability for the first stage of the YIOP. Under prevailing economic conditions this prospect can form the basis of a medium to long life project from which Polaris can develop into a mid size Western Australia iron ore mining house.
The potential quantity and grade of iron deposits reported as exploration potential is conceptual in nature and there has been insufficient exploration to define a Mineral Resource and it is uncertain if further exploration will result in the determination of a Mineral Resource.
For
per
sona
l use
onl
y

6
REVIEW OF OPERATIONS
Central Yilgarn Projects
Yilgarn Iron Ore Project (Polaris 100%) Overview The Yilgarn Iron Ore Project (YIOP) encompasses approximately 1,000km2 of mining tenements 50km north of Koolyanobbing in Western Australia - iron ore rights for the tenements are held 100% by Polaris. The project currently encompasses five prospects with significant direct shipping ore (DSO) grade iron mineralisation. Some 80-90Mt target potential was established by previous explorers’ drilling (Bungalbin East, J4 and J5), with new prospects (Carina, and Chamaeleon) discovered by Polaris. Targeting a total resource base in excess of 100Mt in current exploration work, the Company believes the Yilgarn Project is capable of sustaining exports initially of 2.5Mt of iron ore annually expanding to 5Mtpa for up to 20 years, subject to securing environmental approvals and infrastructure access. In the past year Polaris has assessed all the prospects in the project area to provide a focus on those with most potential for rapid development. Drill assessment was completed in a number of areas and the clear understanding developed that the Carina and Chamaeleon prospects have the most potential for expedited production. The key reason lies in the relatively ease of obtaining mining approvals. Bungalbin East and J5 are within the proposed extension to the Mount Manning Nature Reserve over the Helena-Aurora Range, considered to be an area with significant biodiversity, and as a consequence subject to a challenging environmental approval process for both exploration and mining activity. Polaris is completing flora and fauna studies aimed at characterising the ecology of the area to ensure informed decisions can be made. The Company believes this approach is likely to lead to access to the target areas albeit with a longer time frame than normally expected. The Carina and Chamaeleon ore bodies are considered to have a higher immediate production potential as they:
• are located on open range land, • do not contain any declared rare flora, • are located outside the Mt Manning Nature Reserve proposed extension, • in the case of Carina, characterised by a relatively simple tabular ore body geometry with visual
ore identification, • have a potential extraction rate in line with likely initial port capacity, and • have a readily saleable DSO product.
The resource potential of the two deposits is sufficient to justify a stage 1 development as indicated by the prefeasibility study completed in mid 2008.
For
per
sona
l use
onl
y

7
REVIEW OF OPERATIONS
YIOP Resource Inventory Independent consultants re-estimated the mineralisation in the YIOP and at a 55% Fe cut-off grade, the quoted Inferred Mineral Resources are: YIOP Inferred Mineral Resource Statement
Prospect Cut-off Fe%
Tonnes (Million)
Fe (%)
SiO2 (%)
Al2O3 (%)
P (%)
LOI (%)
Carina 55 15.6 57.7 3.8 1.7 0.12 10.4 J4 55 4.8 57.4 3.9 1.8 0.14 10.9 J5 55 10.0 59.0 5.8 1.2 0.24 7.50 TOTAL 55 30.4 58.1 4.5 1.6 0.16 9.50
LOI – loss on ignition The exploration potential of Bungalbin East and the western extension to J4 were also assessed by independent resource estimation consultants but based on the nature of the data, Inferred Mineral Resources could not be reported in accordance with the 2004 JORC Code. In addition to the resources quoted above however, broadly spaced, and historic drilling at these two prospects suggests the presence of mineralisation with exploration potential of 70-90Mt at 57-58% Fe. No assessment of the potential at Chamaeleon has been made as more drilling is required. A previous resource estimate exists for Bungalbin East, which was discovered by BHP in the 1960s. The Independent Geologist’s Report and Valuation prepared for Polaris in July 2006 states a target resource of 59Mt with 57.9% Fe, 0.15% P, 2.0% Al2O3, 4.6% SiO2 and 9.8% LOI. (Note the BHP Bungalbin East ‘estimates’ were prepared before the implementation of the current JORC Code and do not meet JORC compliance and therefore should only be regarded as estimates of size and grade of mineralisation.) A dispute with Portman Mining was resolved during the year giving Polaris full ownership of the Bungalbin East, J5 and J4 deposits.
For
per
sona
l use
onl
y

8
REVIEW OF OPERATIONS
The resource potential of the area leads Polaris to believe that a mining operation initially at 2.5Mtpa growing to 5Mtpa can be sustained for around 20 years. The plan is to develop the mineralisation in the Carina area first and subsequently the other resources in the project area. The potential quantity and grade of iron deposits reported as exploration potential is conceptual in nature and there has been insufficient exploration to define a Mineral Resource and it is uncertain if further exploration will result in the determination of a Mineral Resource. Evaluation 2007-2008 Carina and Chamaeleon Drilling has focused on the massive goethite-hematite mineralisation at the Carina and Chamaeleon prospects. The intercepts to date at Carina from the drilling on 160m line spacing indicates mineralisation over a strike length of up to 1,400m, true widths up to 60m, and vertical depths to 140m. The mineralisation remains open at depth and is surrounded largely by mafic and ultramafic volcanics. Chamaeleon however is more structurally complex and further drilling is required to understand the geometry of the mineralisation. The present resource estimate for Carina is classified as ‘Inferred’ and drilling continues at Carina to establish an Indicated and Measured Mineral Resource by the end of the 2008. A desktop evaluation study was completed in September 2007 - the results indicated that a more rigorous and detailed appraisal was justified. A prefeasibility study (PFS) was commenced in late 2007 aimed at establishing the economic potential for mining in the YIOP area at nominal rates of 5-10Mtpa. During the study, the estimation of the initial resource at Carina and the enhanced understanding of timing realities for mining approvals for some of the deposits and export port considerations led to a change in the PFS scope. The study, completed in July 2008, adopted a base case for mining the Carina ore body at a rate of 2.5Mtpa, trucking the ore to a new siding on the Trans Australia rail line and then railing to the Fremantle Port Authorities’ Kwinana operation. A feed of 20Mt at a grade of 57% Fe was used in the Stage 1 study, giving an initial mine life of 8 years from production start-up in late 2010. The base case produced a significant net present value. The results are considered very positive and indicate the project is viable. The key recommendation from the study was that Polaris should proceed to a bankable feasibility study. Polaris is aiming at establishing an Indicated and Measured Mineral Resource estimate for the Carina mineralisation by the end of the 2008. This information will form the basis for the definitive feasibility study, to be commenced formally once the preferred export port option is identified. A number of other studies required for mining approvals are ongoing such as the flora and fauna surveys, hydrogeological testing and geotechnical and metallurgical evaluation. Finalising the preferred infrastructure is a key objective with studies continuing for both the Kwinana and Esperance Ports and the rail access options so that the optimum combination can be found in terms of timing, capital cost, operating costs and potential ship size. It is planned to conclude a feasibility study on the project by mid 2009. Other YIOP Prospects The J4, J5, Bungalbin East and Musca mineralisation lies on or near the Helena-Aurora Range. The Vela prospect is located on the plain country to the south. All prospects apart from J4 are within the proposed extension to the Mt Manning Nature Reserve and are considered to be areas with high conservation values by Government environmental agencies. As a consequence the processes to gain approvals for drilling are thorough and time consuming. Flora and fauna surveys continue over these areas aimed at gaining a comprehensive understanding of the environment, leading to the formulation of impact mitigation and management plans as a prerequisite for obtaining exploration and subsequently mining approvals. Nevertheless drilling was completed at the Vela, Musca and J4 Extended prospects during the year. Vela was discovered by Polaris through regional mapping and sampling. Vela forms a low ridge of discontinuous outcropping hematite/goethite over 2.5km in length. A total of 38 surface samples taken in 2007 averaged 54.5%Fe. 18 RC holes for 1,188 metres were completed at Vela in the initial drill testing. The assays suggest that the iron enrichment of the BIF below surface is insufficient to justify further substantial work. Magnetic interpretation suggests that the mineralisation might extend further to the south west under cover. Further testing is possible but has been assigned a low priority.
For
per
sona
l use
onl
y

9
REVIEW OF OPERATIONS
J4 has been drill tested by previous explorers. Mapping and surface sampling of the area indicated the mineralisation could extend to the southeast. A total of 9 RC holes for 792 metres were completed to test the possible extension. While substantial intervals of enriched BIF were intersected there were no assays of note. Hence it has been established that the economic mineralisation does not extend to the southwest to any significant degree and future work will focus on the existing J4 mineralisation. Musca was a grass roots discovery by Polaris geologists following reconnaissance mapping and sampling. Initial drill testing was through 11 RC holes for 1,042 metres. The mineralisation intersected was thin and patchy suggesting the potential for economic extraction to be limited. An Aboriginal mythological site claim was recently lodged over the Helena-Aurora Range. This has necessitated further investigation and the processes are in train to work through the issue and gain approval to drill at these deposits. Due to this mythological site claim it is possible that drill access to these three prospects will be delayed until calendar 2009. EPA Proposal to Extend the Mt Manning Nature Reserve The Environmental Protection Authority (EPA) advises State government with respect to protection of threatened species and biodiversity conservation. On 14 May 2007 the EPA released Bulletin 1256 advising on recommended measures to protect areas deemed to be of high conservation value in proposed extensions to the Mount Manning Nature Reserve, including that: − an A Class Nature Reserve to include the highest priority conservation areas be established;
− the precautionary principle be applied in relation to proposals to offset loss of highly habitat specific Banded
Iron Formation (“BIF”) endemic species through translocation to other sites.
− with respect to the Helena-Aurora BIF Range the recommendation was that the Mount Manning Nature Reserve be extended southward to cover the bulk of the Range including the Bungalbin East and J5 deposits.
In December 2007, the WA State Government report on the Banded Iron Formation of the Yilgarn, the Helena-Aurora Range was identified as an area the Government was predisposed to preserve. However the Government specifically exempted any action on the Bungalbin East Ranges for three years – on account of their high potential economic benefits for both the State and local stakeholders. . Polaris is undertaking active consultation with the regulators to determine the potential effects of these proposals and is meeting with government to ensure that the Company’s interests are properly presented and that government fully understands the exceptional economic potential of the region. In common with its peers in the mining industry, Polaris recognises the importance of biodiversity conservation and meets or exceeds environmental regulations as well as Aboriginal heritage protection regulations. The Company is well aware of environmental management guidelines of the Department of Industry and Resources (DoIR) and Department of the Environment and Conservation (DEC) as regards operating in environmentally sensitive areas. Importantly the Carina and Chamaeleon iron ore discoveries made by Polaris are outside the priority area recommended by the EPA to become a Nature Reserve, and therefore the Company expects to be able to continue its exploration of them in accordance with its normal practice of environmental compliance. The current and proposed boundaries of the Mount Manning Nature Reserve are provided for reference in the figure below.
For
per
sona
l use
onl
y

10
REVIEW OF OPERATIONS
Other Yilgarn Projects (Polaris 100%) Bullfinch North Project (Polaris 100% Iron Ore Rights) The Bullfinch North Project is located 80km north-west of Southern Cross and contains a number of DSO and magnetite iron prospects, with the most significant being Mayfield and Fish Hook. The Mayfield deposit has been drilled by previous explorers and was the subject of a scoping study completed by Polaris in 2005. The mineralisation consists of high grade magnetite ore (45-50% Fe) covered by a relatively shallow horizon of potentially direct shipping hematite-goethite iron ore. A target resource potential of 70-90Mt was estimated and metallurgical test work suggested the potential for high grade concentrates in excess of 69% Fe with low silica, alumina and phosphorous. A recent rationalisation of the prospect ownership and the significant increases in iron ore prices since the scoping study was completed provide encouragement that the project is now viable – particularly given that infrastructure can be shared with the YIOP to the east. Active exploration has commenced with mapping and sampling and drill scheduled later in the reporting year. Metallurgical test work is planned to better characterise the deposit to assist in marketing studies for both the in situ and upgraded ores. It is planned to assess the deposit for both direct shipment of the high grade magnetite and DSO ores and to evaluate the potential for simple coarse crushing and beneficiation of the magnetite ores. Other potential resources in the area such as Fish Hook will also be evaluated. Discussions with potential off-take partners have commenced to establish whether the magnetite ore can be sold without beneficiation.
For
per
sona
l use
onl
y

11
REVIEW OF OPERATIONS
Johnston Range JV Project (Polaris earning 70%, Golden State Resources Ltd 100%) The Johnston Range Project is situated in the Yilgarn Iron Ore Province, 160km north of Southern Cross. Mapping and surface geochemical sampling in 2006 identified poorly outcropping hematite-goethite iron mineralisation with high grade iron assay results. The highest rock chip result was 65.2% Fe, 2.87% SiO2, 1.24% Al2O3 and 0.065% P. Follow up reconnaissance gravity results combined with the mapping and sampling information identified seven iron ore targets for drill testing. RC drilling of 36 holes for 2,160 metres was completed in November 2007. Results indicated limited widths of iron oxide mineralisation grading progressively into magnetite-bearing BIF. Future options are being reviewed. Windarling East Project (Polaris 100%) The Windarling East Project is situated east of the Windarling iron ore mine of Portman Ltd. Windarling is a 60 Mt deposit grading 63.6% Fe. A reconnaissance gravity survey found anomalies associated with discrete aeromagnetic highs which could be Windarling-type iron mineralisation. Following fauna surveys planned for late 2008, drill testing is planned. Evanston JV Project (Polaris earning 70%, Northgate Minerals 100%) Earlier gravity surveying and reconnaissance geological mapping over the Die Hardy Ranges identified nine iron ore targets. Mapping found a number of goethite and detrital iron outcrops, with the most extensive being a 300-400 metre long outcrop of vitreous goethite which is up to 15m wide. Rock chip sampling of the iron ore targets yielded up to 64.6% Fe, 2.01% SiO2, 0.60% Al2O3 and 0.035% P. Much of the Die Hardy Ranges BIF is unusually enriched in iron, with rock chip assays consistently in the range 40-45% Fe. The area also has potential for large scale magnetite deposits. Drilling testing of the targets in the Evanston project is planned to follow the requisite flora surveys. Northam Project (Polaris 100%) The Northam Project consists of three exploration licenses between the towns of Northam and Calingari, respectively 90km east-northeast and 110km northeast of Perth, Western Australia. An assessment of the tenements carried out in 2007 identified a number of potential magnetite targets. Further field work is planned.
For
per
sona
l use
onl
y

12
REVIEW OF OPERATIONS
Pilbara Iron Ore Projects
Weelumurra Project (Polaris 100%) The Weelumurra Project is comprised of the Weelumurra and Caliwinga Prospects, and is 170-185km south-east of Dampier. Several major CID discoveries have been announced in proximity to Weelumurra:
Fortescue Metals Group’s (FMG) Solomon East prospect with an inferred resource of 0.7 billion tonnes at 56% Fe, on the southeast boundary.
FMG’s Serenity Prospect with an inferred resource of 1.0 billion tonnes at 56% Fe to the south.
Rio Tinto Caliwingina Creek with an inferred resource of 0.9 billion tonnes at 57% Fe to the immediate
north. A helicopter-supported geological reconnaissance of the two Polaris tenement applications in 2007, located channel iron (CID), detrital iron (DID) and canga deposits up to 25m thick. CID at Caliwinga was visually estimated to be up to 25m thick, with grab sample assays up to 58.8% Fe, low in silica, alumina and phosphorus. At Weelumurra canga and detrital iron deposits were identified with grab sample assays up to 64% Fe.
For
per
sona
l use
onl
y

13
REVIEW OF OPERATIONS
An independent Landsat imagery interpretation study was commissioned and reported a CID target potential of 200–250Mt with additional Canga iron target potential of 50–60Mt on both prospects. These are based on interpreted volume estimates, and no reliable grade estimates are as yet available. Granting of the Caliwinga Creek and Weelumurra Creek tenements to Polaris is now in progress with heritage access agreements being negotiated. When granted, Polaris will immediately commence exploration leading to drill testing. Poondano Project (Polaris 100%)
For
per
sona
l use
onl
y

14
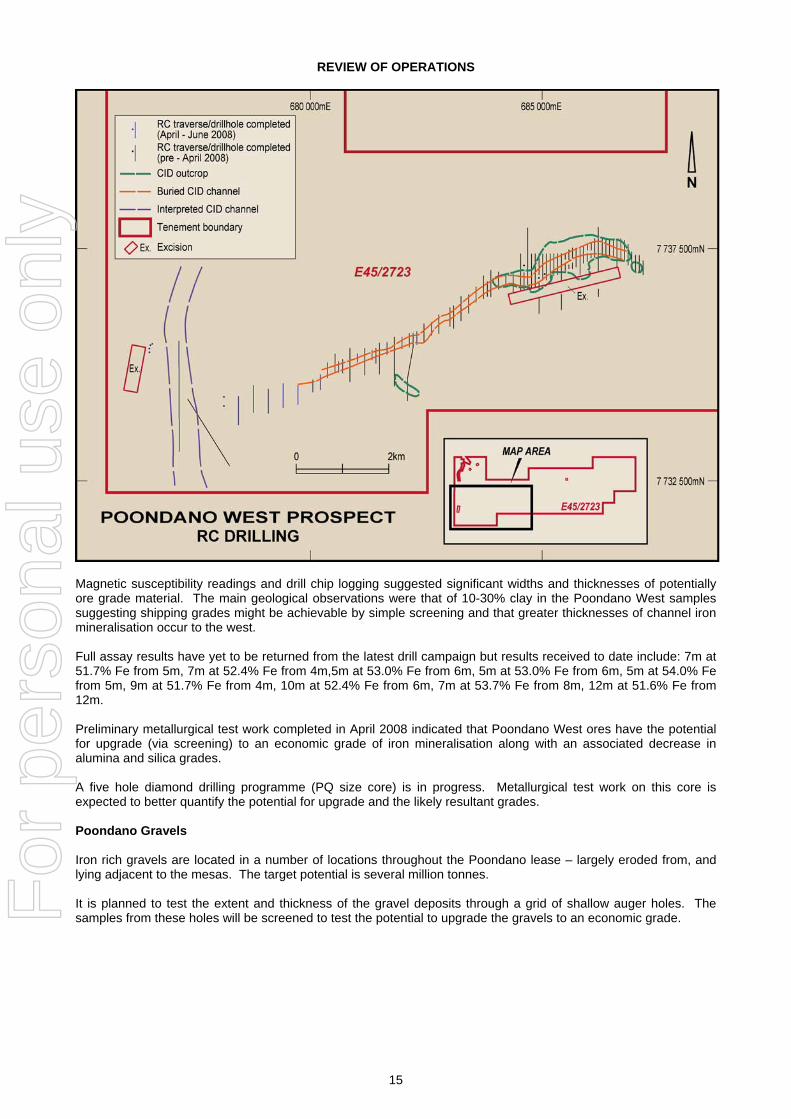
REVIEW OF OPERATIONS Overview The Poondano project, 30km southeast of Port Hedland, comprises a series of channel iron deposits (“CID”) that extend discontinuously over more than 20km. In the east and central sectors of the palaeochannel, the CID remnants are mesas elevated up to 30m above the plain level (“Poondano East” and “Poondano Central”). In the west the CID has expression as a low hill 10-15m above surrounding sand plain (“Poondano West”). This deposit crops out relatively poorly over a 2km strike length. Further to the west the projection of the palaeochannel is covered by sand and iron-rich gravels, but the presence of CID has been confirmed by Polaris RC drilling to extend over more than 7.5km to the west. Work during the year has included surface sampling and RC drilling at the Poondano East Mesa and at West Poondano, and magnetic and electro-magnetic geophysical surveys. A prefeasibility study has been ongoing involving environmental studies, preliminary metallurgical test work and economic assessment. Over 10,000m of RC drilling has been completed on the project. Drill results and preliminary metallurgical test work have down-graded the potential of the East Mesa. The mineralisation does not appear to have an economic grade and the potential for upgrade appears limited. Drilling at Poondano West however, coupled with the preliminary metallurgical test work results, has given confidence that the buried CID mineralisation can be upgraded through screening. The surface sampling at the Central Mesas suggests that the material can be mined at an economic grade and will not need beneficiation. Drill testing is planned to validate the surface sampling. A resource potential exists of 5-10Mt. Grade will depend on the outcomes of screen upgrade testwork which is underway. Future work includes the completion of metallurgical test work and the finalisation of the pre-feasibility study. Should the results be positive, a definitive study is anticipated leading to mining aimed for 2010. Poondano Evaluation 2007-2008 Eastern Mesa Mapping and sampling indicated the mesa grade mineralisation being in the 50-55% Fe range. 10 RC drill holes for 141m total were completed on 80m centres along the spine of the mesa. Drill hole grades (averaged 51% Fe) were similar to those returned from the surface sampling and hence the potential for economic extraction hinges on either blending with higher grade ores or beneficiation. Preliminary metallurgical test work was completed that indicated upgrade through simple screening was unlikely and hence the potential for the mesa has been downgraded. Two diamond holes were drilled on the mesa (27m total) however to provide a more representative sample for rigorous metallurgical testing. These results when received will provide the best indication of whether further work can be justified. Poondano Central Mesas Previous surface sampling indicated the mesas grade approximately 56-58% Fe with the exposed CID up to 9 m thick. Drilling is required to validate these grades. The Central Mesas pose issues for access. Heritage clearance is required prior to any work but given the precipitous nature of the landforms access is difficult. It is planned to use helicopter access to allow the traditional owners access to the mesas to obtain heritage clearance. Subsequently the earthworks will be completed to permit access for the drill rig. This work is expected to be completed in 2008-2009. Of the nine Central Mesas it is likely that only the four largest will be drill tested. The total resource exploration potential of the Central mesas is 1-2Mt of DSO ore. Poondano Western Channel Geophysical surveys indicated that the buried CID channel could be identified under the shallow cover. Two RC drilling campaigns were completed that tested the presence and location of the channel and will be used as the basis of initial resource estimation – once all results are returned. Approximately 10km of potential channel was tested using 760 RC holes for 9,875m at Poondano West. The channel was identified over a strike length of at least 6km and averaged widths of 50-80m with down-hole intercepts up to 18m in thickness, averaging around 6m in thickness. Depth to the top of channel ranged from 1 to 34m with depths typically increasing to the west.
For
per
sona
l use
onl
y
15
REVIEW OF OPERATIONS
Magnetic susceptibility readings and drill chip logging suggested significant widths and thicknesses of potentially ore grade material. The main geological observations were that of 10-30% clay in the Poondano West samples suggesting shipping grades might be achievable by simple screening and that greater thicknesses of channel iron mineralisation occur to the west. Full assay results have yet to be returned from the latest drill campaign but results received to date include: 7m at 51.7% Fe from 5m, 7m at 52.4% Fe from 4m,5m at 53.0% Fe from 6m, 5m at 53.0% Fe from 6m, 5m at 54.0% Fe from 5m, 9m at 51.7% Fe from 4m, 10m at 52.4% Fe from 6m, 7m at 53.7% Fe from 8m, 12m at 51.6% Fe from 12m. Preliminary metallurgical test work completed in April 2008 indicated that Poondano West ores have the potential for upgrade (via screening) to an economic grade of iron mineralisation along with an associated decrease in alumina and silica grades. A five hole diamond drilling programme (PQ size core) is in progress. Metallurgical test work on this core is expected to better quantify the potential for upgrade and the likely resultant grades. Poondano Gravels Iron rich gravels are located in a number of locations throughout the Poondano lease – largely eroded from, and lying adjacent to the mesas. The target potential is several million tonnes. It is planned to test the extent and thickness of the gravel deposits through a grid of shallow auger holes. The samples from these holes will be screened to test the potential to upgrade the gravels to an economic grade.
For
per
sona
l use
onl
y

16
REVIEW OF OPERATIONS Pre-feasibility Study A Pre-feasibility Study continues at Poondano to assess the economics of mining and exporting up to 1.5 million tonnes per annum (Mtpa) of iron ore through Port Hedland (30-40km away). The conceptual plan involves contract mining, product crushing and screening, and trucking to the port. Minimal infrastructure should be required owing to the location apart from the crushing/screening plant. Negotiations are on-going to formalise access to the Utah Point Public Access Berth (seeking allocation of 1.5Mtpa), expected to be in operation by early 2010. Other studies associated with the PFS include optimal mining approach, metallurgical characterisation, initial subterranean fauna monitoring (trolofauna and stygofauna) and characterisation, flora and fauna studies and developing an understanding of the environmental considerations as a prerequisite for obtaining mining approval. At completion of the pre-feasibility study in 2008, the results will be assessed to determine whether the project should progress into a definitive feasibility study. Preliminary metallurgical test work was completed on four bulk samples from the three target areas. The Central and Eastern mesa samples were from surface outcrop while a 4 m deep trench was excavated at the Western prospect and a sample obtained from the top of the channel. The samples were drop tested to replicate blasting and the coarse and fine fraction assayed. All samples returned an approximately 70:30 lump to fines split (lump attracts a premium sale price compared to fines). The Central Mesa sample (head assay 59% Fe) and the two Eastern Mesa samples (head assays 53% Fe and 45% Fe respectively) had similar grades in the two size fractions. The result indicates that to be economic, the in-situ grades must be in the typical DSO range as upgrading by simple screening processes appears unlikely. The Western Poondano trench sample (head assay 47% Fe) showed a significant upgrade in the lump fraction sample (by 7%). This result provides encouragement that the higher grade mineralised intersections received to date are potentially economic. Recent drill results suggest the potential for in-situ grades in some areas to exceed 50% Fe. Results to date suggest a 1-2Mt potential of DSO from Poondano Central. With selective mining and screening at Poondano West it is also possible that an economic beneficiated product will be produced. With selective mining and screening at Poondano West it is also possible that an economic beneficiated product will be produced, resource potential is estimated at 5-10Mt. The Poondano Central channel sampling results are comparable with the grades of Robe River Iron Ore fines and lump products, which have a high level of commercial acceptance in iron ore markets. The metallurgical test work results to be returned later in 2008 should provide the fundamental data for informed decision making for the future direction of the project. Other Pilbara Projects Goldsworthy JV Project (Polaris earning 70% Northgate Minerals 100%) The Goldsworthy JV project area consists of a 120km2 exploration licence located approximately 100km east of Port Hedland. Under the terms of a joint venture with tenement holder Leviathan Resources Limited (wholly owned subsidiary of Perseverance Corporation Limited), Polaris can earn a minimum 70% interest in the project by spending $2.5 million over a four year period. Polaris’ exploration objective has been discovery of iron ore deposits similar to the 65Mt mined out Mt Goldsworthy deposit which is located within an adjacent BHP Billiton mining lease. Reverse circulation drilling in 2007 failed to intersect significant mineralisation of the Goldsworthy type. Geophysical interpretation of the existing geological and geophysical data suggests the tenement has limited potential for economic iron mineralisation. Polaris is currently reviewing its options for Goldsworthy. De Grey Project (Polaris 100%) The De Grey project consists of an exploration licence contiguous with, and extending northeast of the Poondano exploration licence. The area is extensively soil covered and has potential for buried CID palaeochannels. Previously Polaris completed a gravity survey over a part of the area where magnetics indicate concealed iron formations of the type being explored by Atlas Iron with some success in adjacent tenements. Gravity anomalies were detected and these will be followed up by drill testing.
For
per
sona
l use
onl
y

17
REVIEW OF OPERATIONS Ashburton Project (Polaris 100%) The project consists of four granted exploration licences that cover 532km2 located 10-40km south of Rio Tinto’s Paraburdoo iron ore mine in the southern Pilbara region. The area is considered prospective for transported iron ore deposits such as buried Robe pisolitic CID or surficial iron-rich gravels in palaeodrainages shed from the ranges hosting the Paraburdoo iron deposits. A geophysical interpretation identified potential target that were recommended for follow up through sampling and geophysical surveys, leading to drill testing. Onslow Project (Polaris 100%) The Onslow Project comprises three granted exploration licences and five licence applications surrounding Onslow on the north-west coast of Western Australia. The original intent of the licences was to cover a number of deposits of iron-sands that have been formed by coastal processes on iron-rich sediments transported from the Pilbara region by the Ashburton River. An agreement with consulting engineers Prodemas as earn-in partner through their subsidiary Solaris was aimed at the development of a new solar salt project in the Onslow tenements, which are contiguous with and/or in proximity to the existing solar salt operations of Onslow Salt. Following research Prodemas indicated that the project is unlikely to be viable under prevailing global solar salt market conditions. Prodemas indicated they did not intend to proceed with the project and hence forfeited any interest in the tenements. Polaris is reviewing options for the tenements. The information in this report accurately reflects information prepared by competent persons (as defined by the Australasian Code for Reporting of Mineral Resources and Ore Reserves). It is compiled by Mr Jonathan Lea, an employee of the Company who is a Member of The Australasian Institute of Mining and Metallurgy with the requisite experience in the field of activity in which he is reporting. Mr Lea has sufficient experience which is relevant to the style of mineralisation and the type of deposit under consideration and to the activity which he is undertaking to qualify as a Competent person as defined in the 2004 Edition of the “Australasian Code for Reporting of Exploration Results, Mineral Resources and Ore Reserves”. Mr Lea consents to the inclusion in the report of the matters based on his information in the form and context in which it appears. The potential quantity and grade of iron deposits reported as exploration potential is conceptual in nature and there has been insufficient exploration to define a Mineral Resource and it is uncertain if further exploration will result in the determination of a Mineral Resource.
For
per
sona
l use
onl
y

18
TENEMENT SCHEDULE
Tenement State Status Interest Tenement State Status Interest Ashburton Copper Bore E08/1511 to E08/1513 WA Granted 100% All E77/1375 WA Granted 38% All
E47/1528 WA Granted 100% All M77/973 WA Granted 38% All Bandicoot Range Denison Range
E80/3367 WA Granted 100% All E80/2907 WA Granted 20% All British Hill North E80/3274 WA Granted 20% All
E77/1171 WA Granted 100% Fe Die-Hardy Range P77/3429 to P77/3430 WA Granted 100% Fe E77/1293 WA Granted Option Bullfinch North P77/3564 to P77/3565 WA Granted Option E77/1058 WA Granted 75% Fe Evanston
E77/1283 WA Granted 75% Fe E77/1122 WA Granted 70% F-in E77/1368 WA Granted 100% Fe E77/1376 WA Granted 70% F-in
E77/1371 WA Granted 75% Fe Goldsworthy E77/1372 WA Granted 75% Fe E45/2358 WA Granted 70% F-in
E77/1373 WA Granted 100% Fe Jackson E77/1374 WA Granted 75% Fe E77/1125 WA Granted 100% Mag
E77/1390 WA Granted 75% Fe E77/1145 WA Granted 100% MagE77/1391 WA Pending 75% Fe E77/1202 WA Granted 100% Mag
E77/920 WA Granted 75% Fe Jackson North M77/1058 WA Pending 75% Fe E77/1384 WA Granted 100% All
M77/1064 WA Pending 100% Fe Jamieson Range M77/1089 to M77/1090 WA Pending 100% Fe E69/2032 WA Granted 100% All
M77/1094 WA Pending 100% Fe Johnston Range M77/1101 WA Pending 100% Fe E77/1038 WA Granted 70% F-in
M77/1103 WA Pending 100% Fe E77/1155 WA Granted 70% F-in M77/1216 WA Pending 75% Fe E77/1387 to E77/1389 WA Granted 70% F-in
M77/123 WA Granted 100% Fe P77/3670 to P77/3677 WA Granted 70% F-in M77/228 WA Granted 100% Fe Koolyanobbing
P77/3295 WA Granted 100% Fe E77/1272 WA Granted 100% All P77/3301 to P77/3303 WA Granted 100% Fe Le Steere
P77/3304 WA Pending 100% Fe E69/2126 WA Granted 100% All P77/3307 WA Granted 100% Fe E69/2377 WA Pending 100% All
P77/3313 WA Granted 100% Fe Milly Milly P77/3335 to P77/3336 WA Granted 75% Fe E09/1277 WA Granted 100% All
P77/3624 WA Granted 75% Fe Mount Manning P77/3625 to P77/3627 WA Granted 75% Fe E77/1315 WA Pending 100% All
P77/3628 to P77/3629 WA Granted 100% Fe P77/3630 to P77/3636 WA Granted 75% Fe
All represents all mineral rights
Fe represents iron ore rights F-in represents farming in
Mag represents magnetite rights
For
per
sona
l use
onl
y

19
TENEMENT SCHEDULE
Tenement State Status Interest Tenement State Status Interest Mt Elvire Toomey Hills E77/1342 WA Granted 100% All E77/1314 WA Granted 100% Fe Northam Windarling Peak E70/2782 to E70/2783 WA Pending 100% All E77/1353 WA Granted 100% All
E70/2784 WA Granted 100% All Yilgarn Iron Ore Onslow E77/1071 WA Granted 100% Mag
E08/1458 WA Granted 100% All E77/1076 to E77/1077 WA Granted 100% Fe E08/1465 WA Granted 100% All E77/1097 WA Granted 100% Fe
E08/1524 WA Granted 100% All E77/1099 WA Granted 100% Fe E08/1791 WA Pending 100% All E77/1115 WA Granted 100% Fe
E08/1818 to E08/1821 WA Pending 100% All E77/1129 WA Granted 100% Fe Pannawonica E77/1382 to E77/1383 WA Pending 100% All
E47/1525 WA Pending 100% All E77/1418 WA Granted 100% All E47/1526 to E47/1527 WA Granted 100% All E77/1419 WA Granted 100% MagPerrinvale E77/1420 WA Pending 100% All E29/564 WA Granted 100% Mag E77/1542 to E77/1543 WA Pending 100% All
E29/593 WA Granted 100% Mag E77/1557 to E77/1559 WA Pending 100% All E29/653 to E29/655 WA Granted 100% Mag E77/1589 WA Pending 100% All
E30/203 WA Granted 100% Mag E77/842 WA Granted 100% All E30/254 WA Granted 100% Mag E77/919 WA Granted 100% All
E30/331 WA Granted 100% Mag E77/946 WA Granted 100% Fe P29/1922 to P29/1927 WA Granted 100% Mag E77/947 WA Pending 100% All
P30/1011 WA Granted 100% Mag L77/210 WA Pending 100% All Poondano De Gray M77/1095 to M77/1097 WA Pending 100% All
E45/2723 WA Granted 100% All M77/1109 WA Granted 100% MagE45/2736 WA Granted 100% All M77/1112 to M77/1119 WA Pending 100% All
E45/3114 to E45/3115 WA Pending 100% All M77/1165 WA Pending 100% All Rainy Rocks M77/1242 WA Granted 100% All
E77/1268 WA Granted 100% All M77/1243 to M77/1244 WA Pending 100% All P77/3470 WA Granted 100% All P77/3371 to P77/3372 WA Granted 100% Fe Weelumurra Creek P77/3803 to P77/3804 WA Pending 100% All E47/1557 WA Pending 100% All P77/3805 to P77/3806 WA Pending 100% Mag
E47/1558 WA Pending 100% All P77/3871 to P77/3872 WA Pending 100% All Windarling East P77/3882 to P77/3887 WA Pending 100% All
E77/1294 WA Granted 100% All P77/3946 to P77/3949 WA Pending 100% All E77/1459 WA Pending 100% All P77/3952 WA Pending 100% All
All represents all mineral rights
Fe represents iron ore rights F-in represents farming in
Mag represents magnetite rights
For
per
sona
l use
onl
y

20
SHAREHOLDER INFORMATION AS AT 18 SEPTEMBER 2008
Number of
holders Number of
shares held % of shares
issued ORDINARY SHARES Distribution of ordinary shares 1 – 1,000 122 48,891 0.03% 1,001 – 5,000 378 1,134,688 0.73% 5,001 – 10,000 329 2,667,204 1.71% 10,001 – 100,000 824 26,595,194 17.05% 100,001 and over 142 125,524,882 80.48% Total 1,795 155,970,859 100.00% Holdings less than a marketable parcel of shares 246 258,060 0.17% Twenty largest ordinary shareholders Heron Resources Limited 39,243,244 25.16% Lion Diversified Holdings Berhad 30,710,259 19.69% Bell Potter Nominees Ltd 5,318,118 3.41% Nefco Nominees Pty Ltd 2,642,000 1.69% Masen Properties Pty Ltd 2,427,011 1.56% Peterborough Nominees Pty Ltd 2,140,001 1.37% McCavana Colin James & Debra Dianne 1,980,000 1.27% Red Puma Pty Ltd 1,800,000 1.15% Feng Julian 1,386,001 0.89% Hazurn Pty Ltd 1,320,224 0.85% Sheerwater Pty Ltd 1,320,000 0.85% Schultz Dorothy Margaret 961,207 0.62% Aileendonan Investments Pty Ltd 878,856 0.56% Barrett-Lennard Judith 852,456 0.55% Coates Sheldon Philip 785,485 0.50% Paticoa Nominees Pty Ltd 723,392 0.46% Bell Bay Investments Pty Ltd 700,533 0.45% Tonsic Bruna 650,000 0.42% Strong Nigel 648,000 0.42% Forty Traders Limited 623,300 0.40% 97,110,087 62.26% Substantial shareholders Heron Resources Limited 39,243,244 25.16% Lion Diversified Holdings Berhad 30,710,259 19.69% 69,953,503 44.85% There is no current on market buy back.
F
or p
erso
nal u
se o
nly

21
SHAREHOLDER INFORMATION AS AT 18 SEPTEMBER 2008
Number of
holders Number of
options % of options
issued OPTIONS Distribution of options 1 – 1,000 4 2,245 0.02% 1,001 – 5,000 51 230,534 1.58% 5,001 – 10,000 33 252,988 1.73% 10,001 – 100,000 72 2,460,886 16.85% 100,001 and over 25 11,658,588 79.82% Total 185 14,605,241 100.00% Twenty largest option holders McCavana Colin James & Debra Dianne 1,930,000 13.21% Arrowcorp Limited 1,268,530 8.69% Goldmark Investments Pty Ltd 1,066,937 7.31% Goldrise Investments Pty Ltd 910,080 6.23% Melselina Pty Ltd 704,000 4.82% Lion Diversified Holdings Berhad 650,000 4.45% Bell Bay Investments Pty Ltd 550,533 3.77% Taylor Kerry & Brenda Ellen 494,100 3.38% Yelrif Investments Pty Ltd 400,000 2.74% Hannaford Emma Kate 375,604 2.57% Hasenkam Peter Francis 375,000 2.57% Timmid Pty Ltd 350,000 2.40% Hasslinger Alban Richard 340,000 2.33% Fisher Laurence Kevin & Carrie Louise 300,000 2.05% Golden State Resources Ltd 290,000 1.99% Schultz Kevin & Dorothy Margaret 276,237 1.89% Duncan Paul Leslie & Daranee 260,000 1.78% Hasslinger Alban Horst 212,885 1.46% M & K Korkidas Pty Ltd 150,000 1.03% Verran Trevor Alan & Suzanne 143,860 0.98% 11,047,766 75.64% UNQUOTED OPTIONS Exercise price of $0.231 expiring 31/12/08 4 2,500,000 7.04% Exercise price of $0.281 expiring 31/12/10 1 150,000 0.42% Exercise price of $0.281 expiring 14/07/11 3 14,900,000 41.98% Exercise price of $0.40 expiring 31/12/11 1 500,000 1.41% Exercise price of $0.50 expiring 31/12/11 1 100,000 0.28% Exercise price of $0.531 expiring 31/12/11 10 6,325,000 17.82% Exercise price of $0.55 expiring 31/12/11 1 50,000 0.14% Exercise price of $0.621 expiring 04/01/10 1 5,047,062 14.22% Exercise price of $0.631 expiring 31/12/11 1 50,000 0.14% Exercise price of $0.731 expiring 31/12/11 10 5,875,000 16.55% 33 35,497,062 100.00% Unquoted option holders greater than 20% Exercise price of $0.281 expiring 14/07/11 Heron Resources Limited 14,000,000 There are no voting rights attached to options.
For
per
sona
l use
onl
y

22
DIRECTORS’ REPORT The Directors of Polaris Metals NL (“Company” or “Polaris”) submit their report for the year ended 30 June 2008. DIRECTORS The names and details of the Company’s directors in office during the financial year and until the date of this report are as follows. Directors were in office for this entire period unless otherwise stated. Lewis George Cross - Non executive Chairman Mr Cross is a Certified Practising Accountant and principal of the firm CrossCorp Accounting, which has been established for over 29 years. He has a Bachelor of Business majoring in Accounting from Curtin University and is a Fellow of the Institute of Company Directors. Mr Cross has been involved in the mining industry for many years both in Australia and overseas. Mr Cross is also a member of the audit and remuneration committees of the Company. During the past three years Mr Cross has also served as a director of the following listed companies: • Golden State Resources Limited (Director since May 2006) • Aspermont Limited (Director since August 2000) • White Canyon Uranium Ltd (Director since September 2007) Jonathan Robert Lea - Managing Director (Appointed 2 January 2008) Mr Lea has extensive experience in mining and project development. A qualified geologist from the University of Tasmania and a Member of the AusIMM, Mr Lea also has post graduate qualifications in Mineral Economics and Applied Finance and Investment. Over the past 20 years, he has explored for and mined a number of commodities including iron ore, gold, tin, chromite and base metals throughout Australia and in Africa. The majority of Mr Lea’s experience has been in mine based production roles; mine geology, near mine exploration, and project development in a range of operational and management positions. He has also managed mine site environmental, geotechnical and mine engineering and planning functions. Mr Lea is responsible for the day to day operation of the Company’s business with particular focus on the transition of Polaris from exploration to production, and interface with regulatory authorities including government departments and local authorities. During the past three years Mr Lea has not served as a director of any other listed company. Alan Ronald Tough - Executive Director of Operations (Appointed 2 January 2008) Mr Tough is a graduate of the University of Western Australia in Mechanical Engineering with Honours and subsequently with a Masters Degree in Business Administration. His background has included five years each in London and Melbourne in the design and construction business related to mining and industrial projects and eleven years as managing director of the world’s largest heavy mineral operation at Eneabba. A further eleven years as managing director of a specialist insulation company servicing the alumina, and oil and gas industries specialising in the high tech insulation required for LNG production. Both these companies were publicly listed. Prior to the heavy mineral involvement Mr Tough had a contract for two years with the WA State government in industrial development and a similar period as a Corporate Finance Director of a merchant bank. Mr Tough’s extensive background in senior management, finance, off-take agreement negotiation and long standing links with government regulators will be extensively used as Polaris moves towards mine development. During the past three years Mr Tough has not served as a director of any other listed company. Kevin Schultz - Non executive Director Mr Schultz, a geologist and mining engineer from the Western Australia School of Mines, is a Fellow of the Australasian Institute of Mining and Metallurgy (Chartered Professional). He has extensive experience in mining and mineral exploration management which commenced in the 1968-1970 nickel boom when he was responsible for the discovery of the Carr Boyd Rocks nickel copper deposit. Over the ensuing 38 years his management of exploration programs and feasibility studies has ranged across a variety of mineral commodities including gold, iron ore and uranium. Mr Schultz retired as Managing Director on 2 January 2008 and has continued to serve as a non executive Director. During the past three years Mr Schultz has also served as a director of the following listed company: • Northern Uranium Limited (Director since June 2006)
For
per
sona
l use
onl
y

23
DIRECTORS’ REPORT Vernon Wesley Strange - Non executive Director (Resigned 3 July 2008) Mr Strange is a businessman and the owner of drilling contracting company Southern Cross Drilling Services. He has been actively involved in the mineral business, including mining, exploration and prospecting, for over 20 years. Based in Southern Cross he has extensive experience and knowledge of the Yilgarn goldfields and this experience, and his many local contacts among Southern Cross miners, prospectors and farmers, provides the Company with extensive contacts in the area. He was a former President of the Yilgarn Prospectors’ Association and Delegate for the Australian Prospectors’ and Leaseholders’ Association. Mr Strange resigned as a non-executive Director on 3 July 2008 to allow him to focus his energy on Polaris spin-out, Southern Cross Goldfields Limited and will continue to consult to the Company. During the past three years Mr Strange has also served as a director of the following listed company: • Southern Cross Goldfields Limited (Director since March 2007) Colin James McCavana - Non executive Director (Resigned 14 November 2007) Mr McCavana is the Managing Director of ASX listed Haddington Resources Limited. Mr McCavana has over 28 years world wide management experience in the mining industry, many of which have been related to acquisition, development and operation of mineral recovery projects. Mr McCavana is a Fellow of the Australian Institute of Company Directors and a member of the Australasian Institute of Mining and Metallurgy. Mr McCavana resigned as a non-executive Director on 14 November 2007. During the past three years Mr McCavana has also served as a director of the following listed companies: • Haddington Resources Limited (Director since September 1999) • Northern Uranium Limited (Director since June 2006) Ian James Buchhorn - Non executive Director Mr Buchhorn is a mineral economist and geologist with over 30 years of experience. Prior to listing Heron in 1996 as founding managing director, he worked with Anglo American Corporation in Southern Africa; and Comalco, Shell/Billiton and Elders Resources in Australia, as well as setting up and managing Australia’s first specialist mining grade control consultancy. In addition to his strong record in base metals exploration, his mining experience includes bauxite and industrial minerals, and he has commissioned several open cut gold mines. During the past three years Mr Buchhorn has also served as a director of the following listed companies: • Heron Resources Limited (Director since February 1995) • Pioneer Nickel Limited (Director from January 2003 to June 2006) • Rubicon Resources Limited (Director since August 2005) • Southern Cross Goldfields Limited (Director since July 2007) Kenneth John Hellsten - Non executive Director (Appointed 3 July 2008) Mr Hellsten is a Geologist with 25 years experience. He has been employed in senior executive roles ranging from exploration to development and operations. During the past 12 years Mr Hellsten has led teams responsible for the completion of feasibility studies and project development of Cawse and Ravensthorpe HPAL nickel laterite projects. Mr Hellsten went on to commission the Cawse project on schedule and on budget through to successful start-up and has had senior executive roles with BHP Billiton, Centaur Mining and Billiton Australia. Mr Hellsten is also director of a resource management consultant business and is a non-executive director on the Board of Heron Resources Limited, one of Polaris’ major shareholders. He was also the founding Managing Director of IronClad Mining until early 2008. During the past three years Mr Hellsten has also served as a director of the following listed companies: Heron Resources Limited (Director since December 2006) IronClad Mining Limited (Director from May 2007 to February 2008)
COMPANY SECRETARY Trevor Alan Verran Trevor Verran is a Certified Practising Accountant with extensive experience in both the accounting profession and the mining industry. Prior to 2000, he held a senior position in an international firm of accountants. More recently Mr Verran’s experience has included the provision of accounting, financial management and company secretarial services for a number of public mining companies including Aurora Gold Limited (2000-03) and Northern Uranium Limited. Mr Verran has been the Company Secretary and Chief Financial Officer of Polaris Metals NL since May 2004.
For
per
sona
l use
onl
y

24
DIRECTORS’ REPORT
DIRECTORS’ MEETINGS The number of meetings of directors (including meetings of committees of directors) held during the year and the number of meetings attended by each director was as follows:
Directors' Directors' Remuneration Audit Meetings Meetings Committee Committee Attended Held While Meetings Meetings in Office Held Held and Attended and Attended
Lewis George Cross 17 19 1 1 Jonathan Robert Lea (appointed 2/1/08) 9 9 - - Alan Ronald Tough (appointed 2/1/08) 8 9 - - Kevin Schultz 18 19 - - Vernon Wesley Strange (resigned 3/7/08) 14 19 - - Colin James McCavana (resigned 14/11/07) 5 7 1 1 Ian James Buchhorn 19 19 - - Kenneth John Hellsten (appointed 3/7/08) - - - - DIRECTORS’ INTERESTS Interests in the shares and options of the Company and related bodies corporate at the date of this report:
Listed Unlisted Unlisted Unlisted Ordinary 31/12/08 31/12/08 31/12/11 31/12/11 shares $0.181 options $0.231 options $0.531 options $0.731 options
Lewis George Cross 2,140,002 20,000 500,000 1,000,000 1,000,000 Jonathan Robert Lea 89,070 - - 1,000,000 1,000,000 Alan Ronald Tough 75,000 15,000 - - - Kevin Schultz 961,207 301,207 1,000,000 1,000,000 1,000,000 Ian James Buchhorn 1,320,224 - - 1,000,000 1,000,000 Kenneth John Hellsten 30,000 - - - -
DIVIDENDS No dividends were paid or declared by the Company since the end of the previous financial year. PRINCIPAL ACTIVITIES The principal activity of the Group during the course of the financial year was exploration and evaluation of mineral interests. There were no significant changes in the nature of activities during the year. OPERATING AND FINANCIAL REVIEW Overview The Company was formed in 1998 when Vernon Strange acquired several strategic mineral tenements situated in the Southern Cross area of Western Australia. The Company listed on the Australian Securities Exchange in April 2004 with the aim of actively exploring for mineral deposits in Western Australia. The principal focus was on gold, nickel and iron ore in the Southern Cross region of Western Australia. Since listing, the Company expanded its portfolio to include several new iron ore, uranium, and gold projects. The Company is now focused on exploration for iron ore following the acquisition of the iron ore assets of Heron Resources Limited in the previous financial year. The Company divested its uranium tenements to Northern Uranium Limited in the previous financial year and divested its gold and base metal assets to Southern Cross Goldfields Limited during the current financial year.
For
per
sona
l use
onl
y
25
DIRECTORS’ REPORT Operating Results for the Year The consolidated net loss after income tax was $3,748,788 compared with the previous year’s net loss after income tax of $1,041,777. The major items comprising the net profit in 2008 were a gain on derecognition of subsidiary of $1,233,767 following the successful spin-off of Southern Cross Goldfields Limited (2007: (nil), exploration expenditure written off totaling $1,090,390 (2007: $455,674), share-based payments of $1,499,058 (2007 $16,203) and administration and corporate expenses totaling $2,143,807 (2007: $985,771). Financial Position Net assets and total equity increased by $19,036,580 predominately due to an increase in cash, an increase in available-for-sale financial assets and an increase in exploration and evaluation assets. Net assets and total equity at 30 June 2008 was $37,136,521 (2007: $18,099,941). During the year 36,965,768 shares were issued for cash under rights issues raising a total of $18,313,511 before costs of the issues. The net increase in cash for the year was $8,542,899 and cash in bank at the end of the year was $13,161,942. The increase in cash was largely due to proceeds from issue of shares under rights issues. The company’s investments in Southern Cross Goldfields Limited and Northern Uranium Limited (disclosed as investments in associates and available-for-sale financial assets) increased by $6,222,267 due to the acquisition of 11,650,000 shares in Southern Cross Goldfields limited at 20 cents each and the reclassification of the investment in Northern Uranium Limited from an associate to an available-for-sale financial asset resulting in a revaluation in its fair value for the year of $3,337,784. Exploration and evaluation assets increased by $9,274,660 due to exploration expenditure incurred on mineral interests and the balance carried forward at the end of the year was $17,075,630. Exploration Activities A detailed review of the Company’s exploration activities is contained in the Review of Operations section of this Annual Report. SIGNIFICANT CHANGES IN THE STATE OF AFFAIRS The Company’s issued capital increased to $35,876,373 from $19,358,192, an increase of $16,518,181 with the major movement comprising an issue of 36,965,768 shares for cash under rights issues. Significant changes in assets during the year were as follows: • An increase in cash assets of $8,542,899 predominantly due to proceeds from issue of shares of $18,313,511,
proceeds from repayment of loan to Southern Cross Goldfields of $2,346,167 less payments for exploration of mineral interests of $8,024,099, purchase of shares in Southern Cross Goldfields Limited of $2,330,000 and payments for corporate and administration costs of $1,942,211.
• An increase in available-for-sale financial assets of $5,546,000 arising from a revaluation of the fair value of the investment in Northern Uranium Limited and acquisition of unlisted options in Southern Cross Goldfields Limited.
• An increase in exploration and evaluation assets of $9,274,660 due to exploration expenditure incurred on mineral interests.
SIGNIFICANT EVENTS AFTER THE BALANCE DATE No matter or circumstance has arisen since the end of the year that has significantly affected or may significantly affect the Company's operations, the results of those operations, or the state of affairs of the Company in future financial years. F
or p
erso
nal u
se o
nly

26
DIRECTORS’ REPORT LIKELY DEVELOPMENTS AND EXPECTED RESULTS The Company will continue its exploration activity and development of its Western Australian iron ore assets with the object of identifying commercial resources and is planning to make the transition from strategic explorer to significant iron ore producer in 2010. Polaris is planning to commence mining Stage 1 of its Yilgarn Iron Ore Project in 2010 based on the Carina iron ore deposit located 60km north of Koolyanobbing in Western Australia. A recently completed pre-feasibility study strongly indicated the viability of the project and drilling is ongoing. The Company maintains its belief that the relatively simple ore geometry, moderate strip ratio and proximity to infrastructure of the Carina deposit should allow for its relatively rapid development. A pre-feasibility study will continue at Poondano to assess the economics of mining and exporting up to 1.5Mtpa of iron ore through Port Hedland (30-40km away). ENVIRONMENTAL REGULATION The exploration activities of the Group are subject to environmental regulations imposed by various regulatory authorities, particularly those relating to ground disturbance and the protection of rare and endangered flora and fauna. The Group has complied with all material environmental requirements up to the date of this report. The directors believe that the Company has adequate systems in place for the management of its environmental responsibilities and are not aware of any breaches of the regulations during the period covered by this report. OPTIONS As at the date of this report, unissued ordinary shares under options were as follows: Quoted Options: 14,605,241 options at an exercise price of $0.181 expiring 31/12/08 (ASX: POLO) Unquoted Options: 2,500,000 options at an exercise price of $0.231 expiring on 31/12/08 150,000 options at an exercise price of $0.281 expiring on 31/12/10 14,900,000 options at an exercise price of $0.281 expiring on 14/07/11 500,000 options at an exercise price of $0.40 expiring 31/12/11 100,000 options at an exercise price of $0.50 expiring 31/12/11 6,325,000 options at an exercise price of $0.531 expiring on 31/12/11 50,000 options at an exercise price of $0.55 expiring 31/12/11 5,047,062 options at an exercise price of $0.621 expiring on 04/01/10 50,000 options at an exercise price of $0.631 expiring on 31/12/11 5,875,000 options at an exercise price of $0.731 expiring on 31/12/11 Option holders do not have any right, by virtue of the option, to participate in any share issue of the Company or any related body corporate or in the interest issue of any other registered scheme. 25,000 options at an exercise price of $0.531 expiring on 31/12/11 and 25,000 and options at an exercise price of $0.731 expiring on 31/12/11 lapsed during the year. No options expired or were cancelled during the year. INDEMNIFICATION AND INSURANCE OF DIRECTORS The Company has entered into a Deed of Indemnity, Insurance and Access with each of the Directors to indemnify them to the maximum extent permitted by law against liabilities and legal expenses incurred in, or arising out of the conduct of the business of the Company or the discharge of the duties as a director. Also pursuant to the Deed, the Company has paid premiums to insure the Directors against liabilities incurred in the conduct of the business of the Company and has provided right of access to Company records. In accordance with common commercial practice, the insurance policy prohibits disclosure of the amount of the premium and the nature of the liability insured against. The amount of the premium is included as part of the directors remuneration in the Remuneration Report.
For
per
sona
l use
onl
y

27
DIRECTORS’ REPORT REMUNERATION REPORT This report outlines the remuneration arrangements in place for directors, secretaries and senior managers of Polaris Metals NL (the Company). Remuneration policy The Remuneration Committee of the Board of Directors is responsible for determining and reviewing compensation arrangements for the directors and executives. The Remuneration Committee assesses the appropriateness of the nature and amount of remuneration on a periodic basis by reference to relevant employment market conditions with the overall objective of ensuring maximum stakeholder benefit from the retention of a high quality board and executive team. Remuneration levels for directors and executives are competitively set to attract the most qualified and experienced candidates, taking into account prevailing market conditions and individual's experience and qualifications. Remuneration packages contain the following key elements: (a) Short-term benefits − salary/fees and non monetary benefits including the provision of motor vehicles; (b) Post-employment benefits – including superannuation; (c) Share-based payments − share options granted under the Company’s option plan; and In accordance with best practice corporate governance, the structure of non-executive director and executive remuneration is separate and distinct. Non-executive director remuneration The Board seeks to set aggregate remuneration at a level which provides the Company with the ability to attract and retain directors of the highest calibre, whilst incurring a cost which is acceptable to the shareholders. Each of the non-executive directors receives a fixed fee for their services as directors. There is no direct link between remuneration paid to any of the directors and corporate performance such as bonus payments for achievement of certain key performance indicators. The Constitution and the ASX Listing Rules specify that the aggregate remuneration of non-executive directors shall be determined from time to time by a general meeting. An amount not exceeding the amount determined is then divided between the directors as agreed. The latest determination was at the Annual General Meeting held on 14 November 2007 when shareholders approved an aggregate remuneration of $400,000 per year. Non-executive directors’ base fees are presently $70,000 per annum and the Chairman $80,000 per annum. The amount of aggregate remuneration sought to be approved by shareholders and the manner in which it is apportioned amongst directors is reviewed annually. The board considers the fees paid to non-executive directors of comparable companies when undertaking the annual review process. Executive remuneration Executives receive a fixed remuneration set to provide a base level commensurate with their position and responsibilities within the Company and so as to align the interests of executives with those of shareholders and ensure total remuneration is competitive by market standards. There is no direct link between remuneration paid and corporate performance such as bonus payments for achievement of certain key performance indicators. In addition the Company may issue options to executives under the Company’s Option Plan to recognise ability and effort, provide incentive to improve company performance, attract appropriate persons and promote loyalty. Remuneration levels are reviewed annually by the Remuneration Committee by reviewing company performance, personal performance, market trends, industry comparisons, employment market conditions and, where appropriate, external advice. Executives are employed under contracts with no fixed term and can be terminated by either party by one months notice in writing.
For
per
sona
l use
onl
y

28
DIRECTORS’ REPORT Details of remuneration for the year ended 30 June 2008
Short-term Post
Employment
Share- based
payments Total
Remun- eration
consisting of options
Salary
& Fees
Non Monetary
Benefits Other
Benefits
Superannu-ation
Benefits Options $ $ $ $ $ $ % Non-executive directors:
Lewis Cross - Chairman - - 1,939 66,762 252,372 321,073 79% Kevin Schultz (Managing Director from 1/7/07 to 2/1/08) 125,164 4,186 1,939 56,755 252,372 440,416 57% Vernon Strange 40,000 - 1,939 3,600 252,372 297,911 85% Colin McCavana (resigned 14/11/07) - - 726 26,350 - 27,076 - Ian Buchhorn - - 1,939 43,600 252,372 297,911 85% Executive directors:
Jonathan Lea - Managing Director (appointed 2/1/08) 208,564 783 959 18,771 252,372 481,449 52%
Alan Tough - Operations Director (appointed 2/1/08) 125,000 - 959 - - 125,959 - Company secretary: Trevor Verran 54,840 3,249 - 64,635 126,186 248,910 51% Group executives: Samantha Tough 36,290 - - 3,266 - 39,556 - Antony Truelove 126,433 16,900 - 11,379 - 154,712 - Daniel Calvert 103,370 - - 9,303 - 112,673 - Group executives are officers of Southern Cross Goldfields Limited (SXG) and the above remuneration of group executives is for the period 1/7/07 to 11/3/08 when SXG was a subsidiary of the Company. Details of remuneration for the year ended 30 June 2007
Short-term Post
Employment
Share-based
payments Total
Remun- eration
consisting of options
Salary
& Fees
Non Monetary
Benefits Other
Benefits
Superannu-ation
Benefits Options $ $ $ $ $ $ % Non-executive directors: Lewis Cross - Chairman 15,000 - 2,837 36,321 - 54,158 - Vernon Strange 35,833 - 2,837 3,225 - 41,895 - Colin McCavana - - 2,837 39,058 - 41,895 - Ian Buchhorn (appointed 18/9/06) - - 2,837 32,064 - 34,901 - Executive director: Kevin Schultz - Managing Director 143,670 4,561 2,837 26,046 - 177,114 - Company Secretary: Trevor Verran 69,966 3,249 - 22,568 5,000 100,784 5%
For
per
sona
l use
onl
y

29
DIRECTORS’ REPORT Options granted as part of remuneration
Value of options granted
during the year*
Value of options
exercised during the
year
Value of options
lapsed during the year
Total value of options
granted, exercised and lapsed during
the year $ $ $ $
Directors: Lewis Cross 535,546 - - 535,546 Jonathan Lea 535,546 - - 535,546 Kevin Schultz 535,546 - - 535,546 Vernon Strange 535,546 - - 535,546 Ian Buchhorn 535,546 - - 535,546 Company Secretary: Trevor Verran 267,773 - - 267,773 * The value of options granted during the year is the fair value of the options calculated at grant date using a Black Scholes pricing model. The total value of the options granted is included in the table above. This is allocated to remuneration over the vesting period from the grant date of 22 November 2007 to vesting dates of 22 November 2008 and 22 November 2009. The above options with various vesting conditions were granted on 22 November 2007 following shareholder approval at the 2007 annual general meeting. 50% of these options are exercisable at $0.531 each on or before 31 December 2011 and the remaining 50% are exercisable at $0.731 each on or before 31 December 2011.
CORPORATE GOVERNANCE In recognising the need for the highest standards of corporate behaviour and accountability, the directors of Polaris Metals NL support and have adhered to the principles of corporate governance. The Company’s corporate governance statement is contained in the following section of this annual report. PROCEEDINGS ON BEHALF OF COMPANY No person has applied for leave of Court to bring proceedings on behalf of the Company or intervene in any proceedings to which the Company is a party for the purpose of taking responsibility on behalf of the Company for all or any part of those proceedings. The Company was not a party to any such proceedings during the year. AUDITOR’S INDEPENDENCE DECLARATION The lead auditor's independence declaration under Section 307C of the Corporations Act 2001 is set out on page 65 and forms part of the Director's Report for the year ended 30 June 2008. NON-AUDIT SERVICES The auditor independence requirements of the Corporations Act 2001 were not compromised during the year since there were no non-audit services provided by the Group’s auditor, Ord Partners. Signed in accordance with a resolution of the directors. ………………………………….. Jonathan Lea Managing Director Perth, Western Australia 30 September, 2008
For
per
sona
l use
onl
y

30
CORPORATE GOVERNANCE STATEMENT INTRODUCTION Polaris Metals NL ("the Company") is committed to achieving and demonstrating the highest standards of corporate governance and recognises the need to maintain policies and practices which reflect the requirements and expectations of all who deal with the Company. This statement outlines the Company’s main corporate governance practices during the year ended 30 June 2008. Your Directors are pleased to advise that substantial compliance with the recommendations of the ASX Corporate Governance Council has been achieved and exceptions to the ASX recommendations are noted in the Statement. The following additional information about the Company's Corporate Governance practices is set out on the Company's website at www.polarismetals.com.au:
• Corporate Governance Disclosures and Explanations; • Statement of Board and Management Functions; • Nomination Committee Charter; • Policy and Procedure for Selection and Appointment of New Directors; • Code of Conduct for Company Executives; • Policy for Trading in Company Securities; • Audit Committee Charter; • Procedure for Selection, Appointment and Rotation of External Auditor; • Summary of Compliance Procedures for ASX Listing Rule Disclosure; • Shareholder Communication Strategy; • Company's Risk Management Policy and Internal Compliance and Control System; • Statement of process for performance evaluation of the Board, Board committees, individual directors and
key executives; • Remuneration Committee Charter; and • Corporate Code of Conduct.
BOARD COMPOSITION The Board is comprised of a majority of non-executive directors with four non-executive directors and two executive directors. The directors in office at the date of this statement are: Lewis Cross - Non executive Chairman Jonathan Lea - Managing Director Alan Tough - Executive Director Kevin Schultz - Non-executive Director Ian Buchhorn - Non-executive Director Kenneth Hellsten - Non-executive Director A profile of each director including their experience and expertise is set out in the Directors’ Report section of the Annual Report. The Board (subject to members’ voting rights in general meeting) is responsible for selection of new Board members and succession planning, and has regard to a candidate’s experience and competence in areas such as mining, exploration, geology, finance and administration. The Company maintains a mix of Directors on the Board from different business backgrounds with complementary skills and experience. The wide commercial experience of its Board members assists the Company in meeting its corporate objectives and plans. The Board delegates responsibility for the Company’s administration and operation to its Managing Director, who is accountable to the Board. Under the Company’s constitution, the maximum number of directors on the Board is currently set at ten and at the Annual General Meeting each year one third of the directors in office retire by rotation for re-election by the shareholders.
For
per
sona
l use
onl
y

31
CORPORATE GOVERNANCE STATEMENT DIRECTOR INDEPENDENCE In considering independence of directors, the Board refers to the criteria for independence as recommended by the ASX. To the extent that it is necessary for the Board to consider issues of materiality, the Board refers to the thresholds for qualitative and quantitative materiality as adopted by the Board and contained in the Board Charter, which is disclosed in full on the Company’s website. Applying the criteria for independence, two directors are currently considered to be independent. The current independent directors of the Company are Lewis Cross and Kevin Schultz. ROLE OF THE BOARD Directors are responsible to shareholders for the short-term and long-term performance of the Company and their focus is to enhance the interests of shareholders and other key stakeholders and to ensure the Company is properly managed. The primary functions of the Board include responsibility for:
• supervising the Company’s framework of control and accountability systems to enable risk to be assessed and managed;
• ensuring the Company is properly managed; • approving and monitoring the progress of major capital expenditure, capital management, and
acquisitions and divestitures; • approval of the annual budget; • monitoring the financial performance of the Company; • approving and monitoring financial and other reporting; • overall corporate governance of the Company, including conducting regular reviews of the balance of
responsibilities within the Company to ensure division of functions remain appropriate to the needs of the Company;
• liaising with the Company’s external auditors and Audit Committee; and • monitoring and ensuring compliance with all of the Company's legal obligations, in particular those
obligations relating to the environment, native title, cultural heritage and occupational health and safety. The Board must convene regular meetings with such frequency as is sufficient to appropriately discharge its responsibilities (not less than one per month). During the financial year the Board met fourteen times. INDEPENDENT PROFESSIONAL ADVICE If a director considers it necessary to obtain independent professional advice to properly discharge the responsibility of their office as a director, then, provided the director first obtains approval for incurring such expense from the chairman, the Company will pay the reasonable expenses associated with obtaining such advice. PERFORMANCE ASSESSMENT The Board undertakes an annual self assessment of its collective performance, the performance of the Chairman and of its committees. The Chairman meets privately with each Director to discuss individual and collective performance of Directors. FINANCIAL REPORTING In accordance with the requirements of S295A of the Corporations Act 2001, the CEO and CFO have declared to the Board that the Company’s financial reports are complete and present a true and fair view, in all material respects, of the financial condition and operational results of the Company and are in accordance with relevant accounting standards. The Board receives monthly reports from management on the financial and operational performance of the Company. NOMINATION COMMITTEE The full Board carries out the functions of the Nomination Committee. The Board did not meet formally as the Nomination Committee during the financial year; however any relevant matters were discussed on an as-required basis from time to time during regular meetings of the Board.
For
per
sona
l use
onl
y

32
CORPORATE GOVERNANCE STATEMENT AUDIT COMMITTEE The members of the Audit Committee comprise a majority of independent directors and currently consist of Lewis Cross, Kevin Schultz and Kenneth Hellsten. The Managing Director and Chief Financial Officer attend committee meetings by invitation. As a Certified Practising Accountant, Lewis Cross possesses "financial expertise" for the purposes of the Audit Committee. Kevin Schultz and Kenneth Hellsten are qualified to be members of the Audit Committee by virtue of having considerable management experience in the mining industry. The main functions of the Audit Committee are to:
• monitor the integrity of the financial statements of the Company; • review the Company’s internal financial control system and risk management systems; • monitor and review the effectiveness of the Company’s internal audit function; • make recommendations to the Board in relation to the appointment of the external auditor and to approve
the remuneration and terms of engagement of the external auditor; • monitor and review the external auditor’s independence, objectivity and effectiveness; and • develop and implement policy on the engagement of the external auditor to supply non-audit services.
The Audit Committee met once during the financial year. REMUNERATION The Board has established a Remuneration Committee comprising a majority of independent directors and currently consists of Lewis Cross, Kevin Schultz and Kenneth Hellsten. The main functions of the Remuneration Committee are to review the competitiveness of the Company’s executive compensation packages and make recommendations to the Board with the overall objective of ensuring maximum stakeholder benefit from the attraction, retention and motivation of a high quality board and executives. Remuneration levels for executives are competitively set to attract the most qualified and experienced candidates, taking into account prevailing market conditions and individual's experience and qualifications. Non-executive directors receive a fixed fee for their services as directors and are not entitled to any bonuses or incentive payments. Non-executive directors do not receive retirement benefits (other than statutory superannuation payments). The Remuneration Committee met twice during the financial year. Further information on directors’ and executives’ remuneration is set out in the Director’s Report section of the Annual Report. RISK MANAGEMENT The Board is responsible for ensuring the adequacy of the Company’s risk management framework and system of internal control and for regularly reviewing its effectiveness. Regular controls established by the Board include:
• detailed monthly management financial statements and cash flow reports; and • project expenditure must first be approved by the Board.
The Board recognises the need to identify any areas of significant business risk and to develop and implement strategies to mitigate these risks. The Company maintains comprehensive insurance policies and has purchased Director’s and Officer’s Insurance cover for its Board of directors. Both the CEO and CFO have made a declaration to the Board in accordance with the requirements of Principle 7 of the ASX’s Corporate Governance Council Principles of Good Corporate Governance and Best Practice Recommendations.
For
per
sona
l use
onl
y
33
CORPORATE GOVERNANCE STATEMENT COMMUNICATION WITH SHAREHOLDERS The Company communicates to shareholders through the Company’s Annual Report, Annual General Meeting, ASX Announcements, shareholder newsletters and the Company’s website. Financial reports, quarterly reports and all other announcements are made available to shareholders on the website. Shareholders can also subscribe to receive newsletters and ASX announcements via email on the website. The Board encourages full participation of shareholders at the Company’s General Meeting to ensure a high level of accountability and identification with its strategy and goals. CONTINUOUS DISCLOSURE The Company Secretary has been nominated as the person responsible for communication with the Australian Securities Exchange (ASX). This role includes responsibility for ensuring compliance with the continuous disclosure requirements in the ASX Listing Rules and overseeing and coordinating information disclosure to the ASX, analysts, brokers, shareholders, the media and the public. All information disclosed to the ASX is posted on the Company’s website as soon as it is disclosed to the ASX. When analysts are briefed, the material used in the presentations is released to the ASX prior to the commencement of the briefing. This information is also posted on the Company’s website. The Company is committed to ensuring that all stakeholders and the market are provided with relevant and accurate information regarding its activities in a timely manner. EXPLANATIONS FOR DEPARTURES FROM BEST PRACTICE RECOMMENDATIONS During the financial year, the Company has complied with the Corporate Governance Principles and Recommendations as published by the ASX Corporate Governance Council, other than in relation to the matters specified below. Recommendation 2.1 requires the majority of the Board to be independent directors. Only two of the directors satisfy the criteria for independence as recommended by the ASX. Given the size and scope of the Company's operations the Board considers that it is appropriately structured to discharge its duties in a manner that is in the best interests of the Company and its shareholders from both a long-term strategic and day-to-day operations perspective. The Board is of the view that it has achieved an appropriate balance between independent representation and maintaining sufficient relevant experience for the Board to fulfill its objectives. Recommendation 2.4 requires listed entities to establish a nomination committee. The Company does not have a separately established nomination committee. The role of the Nomination Committee is carried out by the full Board. The Board considers that given its size, no efficiencies or other benefits would be gained by establishing a separate Nomination Committee. Recommendation 4.2 requires the Audit Committee to consist of at least three members. Throughout the year the Audit Committee comprised only two members. Given the composition of the Board (ie only two independent directors) the Audit Committee was restricted to two members in order to ensure only independent representation on the Audit Committee. The Board considered that a two member committee was sufficient to properly fulfill the objectives of the Audit Committee. Since the end of the financial year an addition member has been appointed and the Audit Committee now consists of three members comprising a majority of independent directors.
For
per
sona
l use
onl
y

34
INCOME STATEMENT FOR THE YEAR ENDED 30 JUNE 2008
Notes Consolidated Company
2008 2007 2008 2007 $ $ $ $ REVENUE FROM CONTINUING OPERATIONS Interest revenue 386,757 227,221 380,793 227,221 Rendering of services - 34,031 - 34,031 TOTAL REVENUE 386,757 261,252 380,793 261,252 OTHER INCOME Net gain on disposal of investments - 440,000 - 440,000 Net gain on disposal of exploration assets - 30,044 50,216 75,222 Impairment reversal of loan to controlled entity - - 152,992 - Gain on derecognition of subsidiary 1,233,767 - - - TOTAL INCOME 1,620,524 731,296 584,001 776,474 EXPENSES Compliance and regulatory expenses 96,157 67,547 95,616 67,335 Consulting expenses 166,720 63,977 136,086 63,977 Impairment of investment in controlled entity - - 126,320 78,568 Impairment of loan to controlled entity - - 13,947 152,992 Depreciation and amortisation expense 71,649 39,068 64,386 38,829 Employee benefits expense 1,004,570 531,259 775,110 519,580 Exploration expenditure written off 1,090,390 455,674 506,902 291,012 Finance costs 6,894 8,134 6,333 8,134 Insurance expense 53,826 29,860 28,431 29,860 Legal expenses 337,036 84,327 220,036 56,298 Rent expense 161,131 70,630 92,101 70,630 Other expenses 245,824 90,969 150,895 90,919 Share-based payments 1,499,058 16,203 1,499,058 16,203 Share of loss of equity accounted investees 636,057 315,425 636,057 315,425 TOTAL EXPENSES 5,369,312 1,773,073 4,351,278 1,799,762 LOSS BEFORE INCOME TAX (3,748,788) (1,041,777) (3,767,277) (1,023,288) Income tax 4 - - - - LOSS FOR YEAR (3,748,788) (1,041,777) (3,767,277) (1,023,288) Basic and diluted loss per share (cents per share) 5 (3.08) (1.13)
The accompanying notes form part of these financial statements.
For
per
sona
l use
onl
y

35
BALANCE SHEET AS AT 30 JUNE 2008
Notes Consolidated Company
2008 2007 2008 2007 $ $ $ $ ASSETS Current Assets Cash and cash equivalents 6 13,161,942 4,619,043 13,161,942 4,617,626 Other receivables 7 303,602 34,485 303,602 32,156 Non-current assets classified as held for sale 8 - 4,100,707 - 3,235,693 Total Current Assets 13,465,544 8,754,235 13,465,544 7,885,475 Non-current Assets Other receivables 7 22,906 18,156 159,419 893,363 Investments accounted for using the equity method 9 2,236,276 1,560,009 2,236,276 1,560,009 Available-for-sale financial assets 10 5,546,000 - 5,546,000 - Other financial assets 11 109,000 - 109,000 126,320 Property, plant & equipment 12 405,129 349,774 405,129 346,385 Exploration and evaluation assets 13 17,075,630 7,800,970 16,939,117 7,664,458 Intangible assets 14 37,598 - 37,598 - Total Non-current Assets 25,432,539 9,728,909 25,432,539 10,590,535 TOTAL ASSETS 38,898,083 18,483,144 38,898,083 18,476,010 LIABILITIES Current Liabilities Trade and other payables 15 1,675,819 244,462 1,675,819 218,839 Interest-bearing loans and borrowings 16 - 57,636 - 57,636 Provisions 17 85,743 50,199 85,743 50,199 Total Current Liabilities 1,761,562 352,297 1,761,562 326,674 Non-current Liabilities Interest-bearing loans and borrowings 16 - 30,906 - 30,906 Total Non-current Liabilities - 30,906 - 30,906 TOTAL LIABILITIES 1,761,562 383,203 1,761,562 357,580 NET ASSETS 37,136,521 18,099,941 37,136,521 18,118,430 EQUITY Issued capital 19 35,876,373 19,358,192 35,876,373 19,358,192 Other reserves 20 8,132,938 1,865,751 8,132,938 1,865,751 Accumulated losses 21 (6,872,790) (3,124,002) (6,872,790) (3,105,513) TOTAL EQUITY 37,136,521 18,099,941 37,136,521 18,118,430
The accompanying notes form part of these financial statements.
For
per
sona
l use
onl
y

36
STATEMENT OF CHANGES IN EQUITY FOR THE YEAR ENDED 30 JUNE 2008
Consolidated Company 2008 2007 2008 2007 $ $ $ $ Total equity at beginning of year 18,099,941 4,722,217 18,118,430 4,722,217 Income and expense recognised directly in equity: Share of changes recognised directly in associate’s equity (45,655) 1,835,248 (45,655) 1,835,248 Change in fair value of available-for-sale financial assets 3,793,784 - 3,793,784 - Total income and expense recognised directly in equity 3,748,129 1,835,248 3,748,129 1,835,248 Loss for the year (3,748,788) (1,041,777) (3,767,277) (1,023,288) Total recognised income and expense for the year (659) 793,471 (19,148) 811,960 Shares issued during the year 20,079,009 12,852,068 20,079,009 12,852,068 Share issue costs (1,141,023) (284,018) (1,141,023) (284,018) Options issued for acquisition of mining tenements 1,020,000 - 1,020,000 - Share-based payments 1,499,058 16,203 1,499,058 16,203 Reduction in capital on in-specie distribution to shareholders (2,419,805) - (2,419,805) - 19,037,239 12,584,253 19,037,239 12,584,253 Total equity at end of year 37,136,521 18,099,941 37,136,521 18,118,430
The accompanying notes form part of these financial statements.
For
per
sona
l use
onl
y

37
CASH FLOW STATEMENT FOR THE YEAR ENDED 30 JUNE 2008
Notes Consolidated Company 2008 2007 2008 2007 $ $ $ $ CASH FLOWS FROM OPERATING ACTIVITIES Receipts from customers - 34,031 - 34,031 Payments to suppliers and employees (1,942,211) (906,953) (1,425,805) (873,881) Interest received 383,006 228,504 377,042 228,504 Interest paid (6,894) (8,134) (6,333) (8,134) NET CASH FLOWS USED IN OPERATING ACTIVITIES 22(a) (1,566,099) (652,552) (1,055,096) (619,480) CASH FLOWS FROM INVESTING ACTIVITIES Proceeds on disposal of investment - 450,000 - 450,000 Proceeds from repayment of loan to controlled entities 2,346,167 - 3,137,535 - Proceeds from repayment of loan to jointly controlled entity - 340,319 - 340,319 Proceeds from repayment of loan to other entity - 41,728 - 41,728 Proceeds on disposal of property, plant and equipment 40,709 - 40,709 - Purchase of property, plant and equipment (244,053) (216,523) (177,221) (212,896) Purchase of intangible assets (50,500) - (43,235) - Purchase of available-for-sale financial assets (2,330,000) - (2,330,000) - Purchase of investment - (50,000) - (50,000) Payments for exploration (8,024,099) (2,730,569) (7,437,397) (2,539,632) Payments for performance bonds (109,000) - (109,000) - Cash disposed of on derecognition of subsidiary (25,800) - - - Loans to controlled entities - - (2,259,796) (229,053) Loan to jointly controlled entity - (236,889) - (236,889) NET CASH FLOWS USED IN INVESTING ACTIVITIES (8,396,576) (2,401,934) (9,178,405) (2,436,423) CASH FLOWS FROM FINANCING ACTIVITIES Proceeds from issue of shares 20,008,009 7,252,068 20,008,009 7,252,068 Payment of share issue costs (1,413,266) (284,018) (1,141,023) (284,018) Repayment of borrowings (89,169) (29,449) (89,169) (29,449) NET CASH FLOWS PROVIDED BY FINANCING ACTIVITIES 18,505,574 6,938,601 18,777,817 6,938,601 NET INCREASE IN CASH AND CASH EQUIVALENTS 8,542,899 3,884,115 8,544,316 3,882,698 Cash and cash equivalents at beginning of year 4,619,043 734,928 4,617,626 734,928 CASH AND CASH EQUIVALENTS AT END OF YEAR 22(b) 13,161,942 4,619,043 13,161,942 4,617,626
The accompanying notes form part of these financial statements.
For
per
sona
l use
onl
y

38
NOTES TO THE FINANCIAL STATEMENTS 1. CORPORATE INFORMATION The financial report of Polaris Metals NL (the Company) for the year ended 30 June 2008 was authorised for issue in accordance with a resolution of the directors on 19 September 2008. Polaris Metals NL is a public company incorporated in Australia and listed on the Australian Securities Exchange. 2. SUMMARY OF SIGNIFICANT ACCOUNTING POLICIES (a) Basis of preparation The financial report is a general-purpose financial report, which has been prepared in accordance with the requirements of the Corporations Act 2001, Australian Accounting Standards, other authoritative pronouncements of the Australian Accounting Standards Board and Australian Interpretations. The financial report has also been prepared on a historical cost basis, except for available-for-sale investments, which have been measured at fair value. Cost is based on the fair values of the consideration given in exchange for assets. The financial report complies with Australian Accounting Standards, which include Australian equivalents to International Financial Reporting Standards ('AIFRS'). Compliance with AIFRS ensures that the financial report, comprising the financial statements and notes thereto, complies with International Financial Reporting Standards. In the application of AIFRS, management is required to make judgments, estimates and assumptions about carrying values of assets and liabilities that are not readily apparent from other sources. The estimates and associated assumptions are based on historical experience and various other factors that are believed to be reasonable under the circumstance, the results of which form the basis of making the judgments. Actual results may differ from these estimates. The estimates and underlying assumptions are reviewed on an ongoing basis. Revisions to accounting estimates are recognised in the period in which the estimate is revised if the revision affects only that period or in the period of the revision and future periods if the revision affects both current and future periods. Judgments made by management in the application of AIFRS that have significant effects on the financial statements and estimates with a significant risk of material adjustments in the next year are disclosed, where applicable, in the relevant notes to the financial statements. (b) Adoption of new and revised accounting standards The Company has adopted the following Standards and Interpretations mandatory for annual periods beginning on or after 1 January 2007. The adoption of these standards and interpretations has only affected the disclosure in these financial statements. There has been no affect on profit and loss or the financial position of the Company.
• AASB 7 Financial Instruments: Disclosures; • AASB 2005-10 Amendments to Australian Accounting Standards (AASB 132, 101, 114, 117, 133, 139, 1,
4, 1023 and 1038); • AASB 2007-04 Amendments to Australian Accounting Standards arising from ED 151 and other
amendments; and • AASB 2007-7 Amendments to Australian Accounting Standards (AASB 1, 2, 4, 5, 107 and 108).
(c) Basis of consolidation The consolidated financial statements comprise the financial statements of Polaris Metals NL and its subsidiaries (“the Group”). The financial statements of subsidiaries are prepared for the same reporting period as the parent Company, using consistent accounting policies. Adjustments are made to bring into line any dissimilar accounting policies that may exist. All intercompany balances and transactions, including unrealised profits arising from intra-group transactions, have been eliminated in full. Unrealised losses are eliminated unless costs cannot be recovered. Subsidiaries are consolidated from the date on which control is transferred to the Group and cease to be consolidated from the date on which control is transferred out of the Group. Where there is loss of control of a subsidiary, the consolidated financial statements include the results for the part of the reporting period during which the parent Company has control. On acquisition, the assets, liabilities and contingent liabilities of a subsidiary are measured at their fair values at the date of acquisition. Subsequent to initial recognition, investments in subsidiaries are measured at cost less any impairment provision on the Company’s accounts.
For
per
sona
l use
onl
y

39
NOTES TO THE FINANCIAL STATEMENTS (d) Going Concern The financial report has been prepared on the going concern basis, which contemplates continuity of normal business activities and the realisation of assets and settlement of liabilities in the ordinary course of business. The going concern of the Company is dependent upon the Company obtaining additional funds through successful capital raisings and/or the future profitability of the Company. The directors believe that they will be able to access the capital markets for further funds if necessary until such point as the Group is cashflow positive. (e) Cash and cash equivalents Cash and cash equivalents in the balance sheet comprise cash at bank and in hand and short-term deposits with an original maturity of three months or less. For the purposes of the Cash Flow Statement, cash and cash equivalents consist of cash and cash equivalents as defined above, net of outstanding bank overdrafts. (f) Receivables Receivables are recorded at amounts due less any allowance for doubtful debts. (g) Investments in associates The Group’s investment in its associates is accounted for using the equity method of accounting in the consolidated financial statements. The associates are entities over which the Group has significant influence and that are neither subsidiaries nor joint ventures. Under the equity method, investments in the associates are carried in the consolidated balance sheet at cost plus post acquisition changes in the Group's share of net assets of the associates. Goodwill relating to an associate is included in the carrying amount of the investment and is not amortised. After application of the equity method, the Group determines whether it is necessary to recognise any impairment loss with respect to the Group’s net investment in associates. The Group's share of its associates' post-acquisition profits or losses is recognised in the income statement, and its share of post-acquisition movements in reserves is recognised in reserves. The cumulative post-acquisition movements are adjusted against the carrying amount of the investment. Dividends receivable from associates are recognised in the parent entity's income statement, while in the consolidated financial statements they reduce the carrying amount of the investment. When the Group's share of losses in an associate equals or exceeds its interest in the associate, including any unsecured long-term receivables and loans, the Group does not recognise further losses, unless it has incurred obligations or made payments on behalf of the associate. The reporting dates of the associates and the Group are identical and the associates' accounting policies conform to those used by the Group for like transactions and events in similar circumstances. (h) Investment in jointly controlled entities Interests in jointly controlled entities are accounted for under the equity method in the consolidated financial statements and the cost method in the Company financial statements. (i) Financial assets The Group classifies it financial assets either financial assets at fair value through profit or loss, loans and receivables, held-to-maturity investments, or available-for-sale financial assets. The classification depends on the purpose for which the investments were acquired. Financial assets are initially recognised at fair value plus transaction costs for all financial assets not carried at fair value through profit or loss. Financial assets are derecognised when the rights to receive cash flows from the financial assets have expired or have been transferred and the Group has transferred substantially all the risks and rewards of ownership. Available-for-sale financial assets Available-for-sale financial assets, comprising principally marketable equity securities, are non-derivatives that are either designated in this category or not classified in any of the other categories. They are included in non-current assets unless management intends to dispose of the investment within 12 months of the reporting date.
For
per
sona
l use
onl
y

40
NOTES TO THE FINANCIAL STATEMENTS Investments are designated as available-for-sale if they do not have fixed maturities and fixed or determinable payments and management intends to hold them for the medium to long term. After initial recognition available-for-sale securities are measured at fair value with gains or losses being recognised as a separate component of equity until the investment is derecognised or until the investment is determined to be impaired, at which time the cumulative gain or loss previously reported in equity is recognised in profit or loss. Other financial assets Other non-derivative financial instruments are measured at amortised cost using the effective interest method, less any impairment losses. (j) Property, plant and equipment Plant and equipment is stated at cost less accumulated depreciation and any impairment in value. Depreciation is calculated on a straight-line basis over the estimated useful life of the asset which is between 3 to 13 years depending on the nature of the asset. The carrying values of plant and equipment are reviewed for impairment when events or changes in circumstances indicate the carrying value may not be recoverable. (k) Exploration, evaluation and development expenditure In respect of each separate area of interest, exploration and evaluation expenditure is either expensed as incurred or capitalised, and recognised as an exploration and evaluation asset. Exploration and evaluation expenditure is only recognised as an exploration and evaluation asset where right of tenure of the area of interest is current and expected to be recouped through sale or successful development and exploitation of the area of interest, or, where exploration and evaluation activities in the area of interest have not yet reached a stage that permits reasonable assessment of the existence of economically recoverable reserves. Development costs related to an area of interest are carried forward to the extent that they are expected to be recouped either through sale or successful exploitation of the area of interest. When an area of interest is abandoned or the directors decide that it is not commercial, any accumulated costs in respect of that area are written off in the financial period the decision is made. Each area of interest is also reviewed at the end of each accounting period and accumulated costs written off to the extent that they will not be recoverable in the future. Amortisation is not charged on costs carried forward in respect of areas of interest in the development phase until production commences. (l) Intangible assets Computer software Acquired computer software licences are stated at cost less accumulated amortisation and any impairment in value. Amortisation is calculated on a straight-line basis over the estimated useful life of the computer software (not exceeding 3 years). Intangible assets are tested for impairment where an indicator of impairment exists. Useful lives are also examined on an annual basis and adjustments, where applicable, are made on a prospective basis. (m) Non-current assets held for sale Non-current assets classified as held for sale are preseted separately from other assets in the balance sheet. Non-current assets classified as held for sale are measured at the lower of carrying amount and fair value less costs to sell. Non-current assets are classified as held for sale if their carrying amount will be recovered through a sale transaction rather than through continuing use. This condition is regarded as met only when the sale is highly probable and the asset is available for immediate sale in its present condition. The sale of the asset is expected to be completed within one year from the date of classification.
(n) Leases Operating lease payments are recognised as an expense in the income statement on a straight-line basis over the lease term.
For
per
sona
l use
onl
y

41
NOTES TO THE FINANCIAL STATEMENTS (o) Impairment of assets At each reporting date, the Group assesses whether there is any indication that an asset may be impaired. Where an indicator of impairment exists, the Group makes a formal estimate of recoverable amount. Where the carrying amount of an asset exceeds its recoverable amount the asset is considered impaired and is written down to its recoverable amount. Recoverable amount is the greater of fair value less costs to sell and value in use. It is determined for an individual asset, unless the asset's value in use cannot be estimated to be close to its fair value less costs to sell and it does not generate cash inflows that are largely independent of those from other assets or groups of assets, in which case, the recoverable amount is determined for the cash-generating unit to which the asset belongs. In assessing value in use, the estimated future cash flows are discounted to their present value using a pre-tax discount rate that reflects current market assessments of the time value of money and the risks specific to the asset. (p) Trade and other payables Trade and other payables represent liabilities for goods and services provided to the Group prior to the end of the financial period and which are unpaid. Trade and other payables are carried at cost which is the fair value of the consideration to be paid in the future for goods and services received, whether or not billed to the Group. The amounts are unsecured and are usually paid within 30 days of recognition. Payables to related parties are carried at the principal amount. Interest, when charged by the lender, is recognised as an expense on an accrual basis. (q) Interest-bearing loans and borrowings All loans and borrowings are initially recognised at cost, being the fair value of the consideration received net of transaction costs associated with the borrowing. After initial recognition, interest-bearing loans and borrowings are subsequently measured at amortised cost with any difference between the initial recognised amount and the redemption value being recognised in the income statement over the period of the borrowing using the effective interest rate method. (r) Issued capital Ordinary shares are classified as equity. Issued and paid up capital is recognised at the fair value of the consideration received by the Company. Any transaction costs arising on the issue of ordinary shares are recognised directly in equity as a reduction of the share proceeds received. (s) Revenue Revenue is recognised to the extent that it is probable that the economic benefits will flow to the Group and the revenue can be reliably measured. The following specific recognition criteria must also be met before revenue is recognised: Interest Interest income is recognised in the income statement on an accruals basis, using the effective interest rate method. Rendering of services Revenue from a contract to provide services is recognised by reference to the stage of completion of the contract.
(t) Employee benefits Provision is made for the Group’s liability for employee benefits arising from services rendered by employees to balance date. Employee benefits that are expected to be settled within one year have been measured at the amounts expected to be paid when the liability is settled, plus related on-costs. Employee benefits payable later than one year have been measured at the present value of the estimated future cash outflows to be made for those benefits.
For
per
sona
l use
onl
y

42
NOTES TO THE FINANCIAL STATEMENTS (u) Share-based payments Equity-settled share-based payments granted after 7 November 2002 that were unvested as of 1 January 2005, are measured at fair value at the date of grant. Options over ordinary shares are granted to employees as part of remuneration from time to time, on a discretionary basis under an employee option plan. The cost of these share-based payments is measured by reference to the fair value at the date at which they are granted using an option pricing model. The options are subject to service vesting conditions and their fair value is recognised as an expense together with a corresponding increase in other reserve equity over the vesting period. The proceeds received net of any directly attributable transaction costs are credited to share capital when the options are exercised. (v) Income taxes The income tax expense or revenue for the period is the tax payable on the current period’s taxable income or loss adjusted by changes in deferred tax assets and liabilities attributable to temporary differences between the tax bases of assets and liabilities and their carrying amounts in the financial statements, and to unused tax losses. Deferred tax is accounted for using the balance sheet liability method in respect of temporary differences arising between the tax bases of assets and liabilities and their carrying amounts in the financial statements. Deferred tax assets and liabilities are recognised for temporary differences at the tax rates expected to apply when the assets are recovered or liabilities settled, based on those tax rates which are enacted. The relevant tax rates are applied to the cumulative amounts of deductible and taxable temporary differences arising from the initial recognition of an asset or liability. Deferred tax assets and liabilities are offset when they relate to income taxes levied by the same taxation authority and the Company intends to settle its current tax assets and liabilities on a net basis. Deferred tax assets are recognised for deductible temporary differences and unused tax losses only if it is probable that future taxable profits will be available to utilise those temporary differences and losses. (w) Goods and services tax Revenues, expenses and assets are recognised net of the amount of goods and services tax (“GST”), except where the GST incurred is not recoverable from the taxation authority, in which case the GST is recognised as part of the cost of acquisition of the asset or as part of the expense. Receivables and payables are stated with the amount of GST included. The net amount of GST recoverable from, or payable to, the taxation authority is included as part of receivables or payables in the balance sheet. Cash flows are included in the Cash Flow Statement on a gross basis and the GST component of cash flows arising from investing and financing activities which is recoverable from, or payable to, the taxation authority are classified as operating cash flows. (x) Earnings per share Basic earnings per share is calculated by dividing the profit or loss attributable to shareholders of the Company by the weighted average number of ordinary shares outstanding during the period. Diluted earnings per share is determined by adjusting the profit or loss attributable to ordinary shareholders and the weighted average number of ordinary shares outstanding for the effects of all dilutive potential ordinary shares, which comprise share options. (y) Comparatives Where necessary, comparatives have been reclassified and repositioned for consistency with current year disclosures. 3. SEGMENT INFORMATION The Company operates in only one business and geographical segment, being the mineral exploration industry in Australia.
For
per
sona
l use
onl
y

43
NOTES TO THE FINANCIAL STATEMENTS
Consolidated Company 2008 2007 2008 2007 $ $ $ $ 4. INCOME TAX Reconciliation of income tax to loss before income tax Loss before income tax (3,748,788) (1,041,777) (3,767,277) (1,023,288) Tax benefit calculated at 30% on loss before income tax (1,124,636) (312,533) (1,130,183) (306,986) Add/(less) tax effect of: Share-based payments not deductible 449,717 - 449,717 - In-specie distribution 1,022,917 - 1,022,917 - Other 69,377 5,632 69,377 5,632 Tax losses and temporary differences not recognised (417,375) 306,901 (411,828) 301,354 Income tax - - - - Unrecognised tax assets and liabilities Deferred tax assets Unused tax losses 5,905,618 4,518,279 5,905,618 4,144,860 Deductible temporary differences: Investment in associate 28,175 - 28,175 - Provision for employee entitlements 25,723 15,060 25,723 15,060 Share issue costs 342,040 123,036 342,040 123,036 Other 4,350 7,868 8,534 149,972 6,305,906 4,664,243 6,310,090 4,432,928 Deferred tax liabilities Assessable temporary differences: Non-current assets classified as held for sale - (1,230,212) - (970,708) Investment in associate - (426,003) - (426,003) Available-for-sale financial assets (1,621,800) - (1,621,800) - Property, plant & equipment (121,539) (104,932) (121,539) (103,915) Exploration and evaluation assets (5,122,689) (2,276,115) (5,081,735) (2,299,337) Intangible assets (11,279) - (11,279) - Other (1,125) - (1,125) - (6,878,432) (4,037,262) (6,837,478) (3,799,963) Net unrecognised tax balances (572,526) 626,981 (527,388) 632,965
The net deferred tax assets and deferred tax liabilities are not recognised since it is not probable that future taxable profits will be available to utilise deductible temporary differences and losses. F
or p
erso
nal u
se o
nly

44
NOTES TO THE FINANCIAL STATEMENTS
Consolidated 2008 2007 $ $ 5. LOSS PER SHARE Loss used in calculating basic and diluted loss per share (3,748,788) (1,041,777)
Number of
shares Number of
shares Weighted average number of ordinary shares used in calculating basic loss per share 121,834,102 92,263,522 Weighted average number of ordinary shares used in calculating diluted loss per share 169,982,041 117,146,147 As the company has incurred a loss, the diluted loss per share is disclosed as the same as basic loss per share. Consolidated Company 2008 2007 2008 2007 $ $ $ $ 6. CASH AND CASH EQUIVALENTS Cash at bank and in hand 13,984 23,362 13,984 21,945 Bank deposits at call 1,397,958 1,241,568 1,397,958 1,241,568 Bank short term deposits 11,750,000 3,354,113 11,750,000 3,354,113 13,161,942 4,619,043 13,161,942 4,617,626 7. OTHER RECEIVABLES Current: GST receivable (a) 108,154 20,404 108,154 18,075 Prepayments 22,164 - 22,164 - Other receivables (a) 173,284 14,081 173,284 14,081 Loan to subsidiary (b) - - - 152,992 Less provision for impairment (b) - - - (152,992) 303,602 34,485 303,602 32,156 Non-current: Loan to subsidiary (b) - - 150,460 875,207 Less provision for impairment (b) - - (13,947) - Other receivables (c) 22,906 18,156 22,906 18,156 22,906 18,156 159,419 893,363 (a) GST receivable and current other receivables are non-interest bearing and normally received within 30 days. Due to the short term nature of these receivables, their carrying amount is a reasonable approximation of fair value.
For
per
sona
l use
onl
y

45
NOTES TO THE FINANCIAL STATEMENTS
Consolidated Company 2008 2007 2008 2007 $ $ $ $
(b) The loan to subsidiaries are non-interest bearing with no fixed repayment date and the carrying amount of the loan approximates its fair value. The loans are provided to fund exploration expenditure. The ultimate recoupment of the loan is dependent upon sale or successful exploitation of the area of interest. An impairment provision is recognised for the subsidiaries net asset deficiency. (c) Non-current other receivables represent bonds on lease of office premises and earn interest at a weighted average rate of 3.3% (2007: 3.3%) 8. NON-CURRENT ASSETS CLASSIFIED AS HELD FOR SALE Exploration and evaluation assets - 4,100,707 - 3,235,693 In the previous financial year the Company proposed to sell various gold and base metal tenements in Western Australia to Southern Cross Goldfields Limited (SXG) and the carrying values of those tenements at 30 June 2007 were classified as held for sale. In the current financial year, the Company entered into an agreement to sell those various gold and base metal tenements in Western Australia to SXG for the consideration of 21,999,999 shares and 15,000,000 share options in SXG at a deemed value of $2,420,000 for the shares (11 cents per share) and $780,000 for the share options (exercisable at 20 cents each on or before 31 December 2012). 9. INVESTMENTS ACCOUNTED FOR USING THE EQUITY METHOD Investment in associates: Northern Uranium Limited - 1,560,009 - 1,560,009 Southern Cross Goldfields Limited 2,236,276 - 2,236,276 - 2,236,276 1,560,009 2,236,276 1,560,009 Northern Uranium Limited Carrying amount at beginning of year 1,560,009 16,788 1,560,009 16,788 Investments at cost - 23,398 - 23,398 Share of changes recognised directly in equity (45,655) 1,835,248 (45,655) 1,835,248 Share of loss (542,138) (315,425) (542,138) (315,425) 972,216 1,560,009 972,216 1,560,009 Transfer to available-for-sale for financial assets (972,216) - (972,216) - Carrying amount at end of year - 1,560,009 - 1,560,009
Northern Uranium Limited was incorporated in Australia on 31 May 2006 and the Company holds 10,000,001 shares representing an ownership interest of 19.76% at 30 June 2008 (2007: 20.32%). The principal activity of Northern Uranium Limited is exploration and evaluation of uranium mineral interests. Northern Uranium Limited is listed on the Australian Securities Exchange and the fair value of the investment based on the published price quotation at 30 June 2008 was $3,650,000 (2007: $15,080,001). The Company ceased to have significant influence over Northern Uranium Limited on 31 March 2008 and the investment was reclassified from an investment in associate to an available-for-sale financial asset. Southern Cross Goldfields Limited Carrying amount at beginning of year - - - - Investments at cost 4,750,000 - 4,750,000 - In-specie distribution to shareholders (2,419,805) (2,419,805) Share of loss (93,919) - (93,919) - Carrying amount at end of year 2,236,276 - 2,236,276 -
For
per
sona
l use
onl
y

46
NOTES TO THE FINANCIAL STATEMENTS
Southern Cross Goldfields Limited (SXG) was incorporated in Australia on 12 March 2007 and the Company holds 11,651,774 shares representing an ownership interest of 17.97% at 30 June 2008 (2007: 100%). SXG was a subsidiary until 11 March 2008 and was reclassified as an associate when it ceased to be a subsidiary. Although the Company holds less than 20% of the voting power of SXG at 30 June 2008 it is classified as an investment in associate since the Company has significant influence from representation on the SXG board of directors. The principal activity of SXG is exploration and evaluation of mineral interests. SXG is listed on the Australian Securities Exchange and the fair value of the investment based on the published price quotation at 30 June 2008 was $2,621,649 (2007: not listed). Summarised financial information of associates: Northern Uranium Limited Consolidated Company 31/03/08 30/06/07 31/03/08 30/06/07 $ $ $ $ Current assets 4,979,817 7,788,007 4,979,817 7,788,007 Non-current assets 139,831 75,723 139,831 75,723 5,119,648 7,863,730 5,119,648 7,863,730 Current liabilities 199,528 186,518 199,528 186,518 Net assets 4,920,120 7,677,212 4,920,120 7,677,212 Revenue 330,679 230,832 330,679 230,832
Net loss 2,801,532 2,043,495 2,801,532 2,043,495 Share of associate loss 542,138 (315,425) 542,138 (315,425) Share of associate exploration expenditure commitments not later than one year 292,574 219,302 292,574 219,302 Southern Cross Goldfields Limited Consolidated Company 30/06/08 30/06/08 $ $ Adjusted to conform with the Company's accounting policies: Current assets 4,068,026 4,068,026 Non-current Assets 7,407,681 7,407,681 11,475,707 11,475,707 Current liabilities 635,128 635,128 Net assets 10,840,579 10,840,579 Revenue (12/3/08 to 30/06/08) 141,014 141,014
Net loss (12/3/08 to 30/06/08) 515,377 515,377
Share of associate loss (12/3/08 to 30/06/08) 93,919 93,919
Share of exploration expenditure commitments not later than one year 220,696 220,696 Share of operating lease commitments: Not later than one year 13,714 13,714 Later than 1 year but not later than 5 years 15,455 15,455 29,169 29,169
For
per
sona
l use
onl
y

47
NOTES TO THE FINANCIAL STATEMENTS
Consolidated Company 2008 2007 2008 2007 $ $ $ $ 10. AVAILABLE-FOR-SALE FINANCIAL ASSETS At fair value: Australian listed equity securities (a) 4,310,000 - 4,310,000 - Australian unlisted equity securities (b) 1,236,000 - 1,236,000 - 5,546,000 - 5,546,000 - (a) The fair value of Australian listed equity securities has been determined directly by reference to published price quotations in an active market.
(b) Australian unlisted equity securities represent options in a listed company. The fair value has been determined using a Binominal option pricing model inputting a share price of $0.225, an exercise price of $0.20, a risk free interest rate of 6.5%, an expiry date of 31 December 2012 and a volatility factor of 50% . 11. OTHER FINANCIAL ASSETS Bank term deposits (a) 109,000 - 109,000 - Investment in subsidiaries at cost (b) - - 600,000 600,000 Less provision for impairment - - (600,000) (473,680) 109,000 - 109,000 126,320 (a) The bank term deposits are held as security for bank guarantee performance bonds for the potential rehabilitation of exploration assets. As such the term deposits are not accessible to the Group and the Company.
(b) The consolidated financial statements include the financial statements of Polaris Metals NL and its wholly owned subsidiaries, Eclipse Minerals Pty Ltd (Eclipse) and Southern Cross Goldfields Limited (SXG) which were incorporated in Australia. Polaris Metals NL is the parent entity within the Group. The ownership interest of the Company in Eclipse at 30 June 2008 is 100% (2007: 100%). SXG ceased to be a subsidiary on 11 March 2008. The Company's ownership interest in SXG on 11 March 2008 was reclassified as an available-for-sale financial asset on derecognition of SXG as a subsidiary. The ownership interest of the Company in SXG at 30 June 2008 was17.97% . The ownership interest of the Company in SXG at 30 June 2007 was 100%. 12. PROPERTY, PLANT AND EQUIPMENT Computing equipment Gross carrying amount at beginning of year 38,049 25,142 34,421 25,142 Additions 64,150 12,907 30,918 9,279 Disposals (48,004) - (11,144) - Gross carrying amount at end of year 54,195 38,049 54,195 34,421 Accumulated depreciation at beginning of year 23,114 12,393 22,875 12,393 Depreciation expense 15,004 10,721 10,918 10,482 Disposals (13,459) - (9,134) - Accumulated depreciation at end of year 24,659 23,114 24,659 22,875 Carrying amount at beginning of year 14,935 12,749 11,546 12,749 Carrying amount at end of year 29,536 14,935 29,536 11,546
For
per
sona
l use
onl
y

48
NOTES TO THE FINANCIAL STATEMENTS
Consolidated Company 2008 2007 2008 2007 $ $ $ $ Exploration equipment Gross carrying amount at beginning of year 34,075 18,575 34,075 18,575 Additions 41,368 15,500 41,368 15,500 Disposals (9,800) - (9,800) - Gross carrying amount at end of year 65,643 34,075 65,643 34,075 Accumulated depreciation at beginning of year 11,130 6,349 11,130 6,349 Depreciation expense 10,049 4,781 10,049 4,781 Disposals (9,800) - (9,800) - Accumulated depreciation at end of year 11,379 11,130 11,379 11,130 Carrying amount at beginning of year 22,945 12,226 22,945 12,226 Carrying amount at end of year 54,264 22,945 54,264 22,945 Office furniture and equipment Gross carrying amount at beginning of year 37,538 24,514 37,538 24,514 Additions 48,691 13,024 15,091 13,024 Disposals (35,963) - (2,363) - Gross carrying amount at end of year 50,266 37,538 50,266 37,538 Accumulated depreciation at beginning of year 9,146 3,905 9,146 3,905 Depreciation expense 7,263 5,241 5,632 5,241 Disposals (3,994) - (2,363) - Accumulated depreciation at end of year 12,415 9,146 12,415 9,146 Carrying amount at beginning of year 28,392 20,609 28,392 20,609 Carrying amount at end of year 37,851 28,392 37,851 28,392 Vehicles, caravans and trailers Gross carrying amount at beginning of year 361,703 186,610 361,703 186,610 Additions 89,844 175,093 89,844 175,093 Disposals (75,253) - (75,253) - Gross carrying amount at end of year 376,294 361,703 376,294 361,703 Accumulated depreciation at beginning of year 78,201 42,842 78,201 42,842 Depreciation expense 50,202 35,359 50,202 35,359 Disposals (35,587) - (35,587) - Accumulated depreciation at end of year 92,816 78,201 92,816 78,201 Carrying amount at beginning of year 283,502 143,768 283,502 143,768 Carrying amount at end of year 283,478 283,502 283,478 283,502 Total Property plant and equipment Gross carrying amount at beginning of year 471,365 254,841 467,737 254,841 Additions 244,053 216,524 177,221 212,896 Disposals (169,020) - (98,560) - Gross carrying amount at end of year 546,398 471,365 546,398 467,737
For
per
sona
l use
onl
y

49
NOTES TO THE FINANCIAL STATEMENTS
Consolidated Company 2008 2007 2008 2007 $ $ $ $ Accumulated depreciation at beginning of year 121,591 65,489 121,352 65,489 Depreciation expense 82,518 56,102 76,801 55,863 Disposals (62,840) - (56,884) - Accumulated depreciation at end of year 141,269 121,591 141,269 121,352 Carrying amount at beginning of year 349,774 189,352 346,385 189,352 Carrying amount at end of year 405,129 349,774 405,129 346,385 Property plant and equipment pledged as security
Plant and equipment at 30 June 2007 includes motor vehicles with a carrying value of $113,560 pledged as security under a hire purchase agreement for the associated hire purchase liability. The hire purchase liability was paid out during the financial year and there is no plant and equipment at 30 June 2008 pledged as security. 13. EXPLORATION AND EVALUATION ASSETS
Costs carried forward in respect of areas of interest in pre-production exploration and evaluation phases Carrying amount at beginning of year 7,800,970 2,934,235 7,664,458 1,975,379 Transfer from/(to) assets classified as held for sale 4,100,707 (3,101,585) 3,235,693 (2,236,570) Additions 10,289,126 8,423,994 8,904,284 8,216,661 Written off (1,090,390) (455,674) (506,902) (291,012) Disposals (4,024,783) - (2,358,416) - Carrying amount at end of year 17,075,630 7,800,970 16,939,117 7,664,458
The recoverability of the carrying amount of the exploration and evaluation assets is dependent on the continuance of the Group’s rights to tenure of the interest, the results of future exploration, and the successful development and commercial exploitation, or alternatively, sale of the respective areas of interest. 14. INTANGIBLE ASSETS Computer software Gross carrying amount at beginning of year 17,600 17,600 17,600 17,600 Additions 50,500 - 43,235 - Disposals (14,500) - (7,235) - Gross carrying amount at end of year 53,600 17,600 53,600 17,600 Accumulated amortisation at beginning of year 17,600 14,873 17,600 14,873 Amortisation expense 7,183 2,727 5,637 2,727 Disposals (8,781) - (7,235) - Accumulated amortisation at end of year 16,002 17,600 16,002 17,600 Carrying amount at beginning of year - 2,727 - 2,727 Carrying amount at end of year 37,598 - 37,598 -
For
per
sona
l use
onl
y

50
NOTES TO THE FINANCIAL STATEMENTS
Consolidated Company 2008 2007 2008 2007 $ $ $ $ 15. TRADE AND OTHER PAYABLES Trade payables 1,154,079 173,800 1,154,079 148,177 Non-trade payables and accrued expenses 521,740 70,662 521,740 70,662 1,675,819 244,462 1,675,819 218,839 Trade and other payables are non-interest bearing and are normally settled on 30 day terms. Due to the short term nature of these payables, their carrying amount is a reasonable approximation of fair value. 16. INTEREST-BEARING LOANS AND BORROWINGS Current: Hire purchase liabilities - secured - 57,636 - 57,636 Non-current: Hire purchase liabilities - secured - 30,906 - 30,906 Hire purchase liabilities are in respect of the purchase of motor vehicles and the liabilities are repayable by monthly installments over terms from 4 to 5 years. Interest is recognised at an average rate of 7.7% (2007: 7.7%). Hire purchase liabilities are secured by a charge over the motor vehicles. The hire purchase liabilities were paid out during the financial year and there are no motor vehicles at 30 June 2008 secured by a charge. 17. PROVISIONS Employee benefits provision for annual leave 85,743 50,199 85,743 50,199 18. SHARE-BASED PAYMENTS 3,000,000 options were granted to directors and management on 18 December 2003, exercisable immediately from the date of grant and expiring on 31 December 2008. Shareholders approved the grant of options to directors at the 2003 annual general meeting. 11,700,000 options with various vesting conditions were granted to directors, employees and consultants on 22 November 2007 following shareholder approval at the 2007 annual general meeting. 5,850,000 (tranche 1) of these options are exercisable at 53.1 cents each on or before 31 December 2011 and the remaining 5,850,000 (tranche 2) options are exercisable at 73.1 cents each on or before 31 December 2011. An Option Plan for employees was established and approved by shareholders at the 2004 annual general meeting. 650,000 options were granted in the 2005 financial year and 775,000 in the 2007 financial year under the plan to employees with 50% of the options exercisable after 6 months employment from the grant date and the remaining 50% of the options exercisable after 12 months employment from the grant date. 650,000 options were granted to employees under the plan during the current financial year exercisable after 12 months employment from the grant date with the exercise price set as the average closing price of 5 days trading prior to commencement of employment plus 10% rounded down to the nearest 5 cent increment. Options granted carry no dividend or voting rights.
For
per
sona
l use
onl
y

51
NOTES TO THE FINANCIAL STATEMENTS
The following share-based payment arrangements were in existence during the period: Grant date Number Expiry Exercise Fair value date price at grant at 30/06/08 date 18 December 2003 3,000,000 31/12/2008 $0.231 $0.024 20 December 2004 500,000 31/12/2008 $0.231 $0.022 20 October 2006 650,000 31/12/2010 $0.281 $0.020 3 November 2006 125,000 31/12/2010 $0.281 $0.050 23 November 2007 5,850,000 31/12/2011 $0.531 $0.296 23 November 2007 5,850,000 31/12/2011 $0.731 $0.239 06 February 2008 50,000 31/12/2011 $0.731 $0.254 20 March 2008 50,000 31/12/2011 $0.631 $0.202 20 May 2008 500,000 31/12/2011 $0.531 $0.311 26 June 2008 50,000 31/12/2011 $0.550 $0.170 16,625,000 The number and weighted average exercise prices of options granted as share based payments are as follows: 2008 2008 2007 2007
Number of
options
Weighted average exercise
price Number of
options
Weighted average exercise
price Outstanding at beginning of year 4,275,000 $0.255 3,650,000 $0.250 Granted during the year 12,350,000 $0.646 775,000 $0.300 Exercised during the year (1,625,000) $0.269 - - Lapsed during the year (50,000) $0.631 (150,000) $0.250 Outstanding at end of year 14,950,000 $0.557 4,275,000 $0.259
Exercisable and vested at end of the year 2,650,000 $0.234 3,887,500 $0.255 The weighted average share price at the date of exercise of options exercised during the year was $0.547 (2007: not applicable). The range of exercise prices for options outstanding at the end of the year was $0.231 to $0.731 (2007: $0.25 to $0.30) and a weighted average remaining contractual life of 2.99 years (2007: 1.86 years). The weighted average fair value of $0.269 for options granted during the year was calculated using a Black and Scholes option pricing model inputting a weighted average share price of $0.596, a weighted average exercise price of $0.646, a weighted average risk free interest rate of 6.78%, an expiry date of 31 December 2011, a volatility factor of 50% based on historical volatility and expected changes to future volatility taking into account the transition from explorer to miner. The fair value of the options is recognised as an expense over the period from grant to vesting date. The amount recognised as part of employee benefits expense during the year was $1,499,058 (2007: $16,203). F
or p
erso
nal u
se o
nly

52
NOTES TO THE FINANCIAL STATEMENTS
Consolidated Company 2008 2007 2008 2007 $ $ $ $ 19. ISSUED CAPITAL (a) Fully paid ordinary shares Balance at beginning of year: 111,043,823 (2007: 50,310,002) shares 19,358,192 6,790,142 19,358,192 6,790,142 Nil (2007: 30,445,623) shares issued for cash under cash placements - 7,250,374 - 7,250,374 36,965,768 (2007: nil) shares issued for cash under rights issues 18,313,511 - 18,313,511 - 100,000 (2007: 30,279,730) shares issued for acquisition of mining tenements 71,000 5,600,000 71,000 5,600,000 7,861,268 (2007: 8,468) shares issued for cash on exercise of options 1,694,498 1,694 1,694,498 1,694 In-specie distribution (2,419,805) - (2,419,805) - Share issue costs (1,141,023) (284,018) (1,141,023) (284,018) Balance at end of year: 155,970,859 (2007: 111,043,823) shares 35,876,373 19,358,192 35,876,373 19,358,192 The Company does not have authorised capital or par value in respect of its issued shares.
Ordinary shares have the right to receive dividends as declared and, in the event of winding up the Company, to participate in the proceeds from the sale of all surplus assets in proportion to the number of and amounts paid up on shares held. Ordinary shares entitle their holder to one vote, either in person or by proxy, at a meeting of the Company. (b) Options over ordinary shares Consolidated Company 2008 2007 2008 2007 Number Number Number Number
Exercise price of $0.181 (2007: $0.20) expiring 31/12/08: Balance at beginning of year 20,741,509 20,749,977 20,741,509 20,749,977 Issued during the year - - - - Exercised during the year (6,136,268) (8,468) (6,136,268) (8,468) Balance at end of year 14,605,241 20,741,509 14,605,241 20,741,509 Exercise price of $0.231 (2007: $0.25) expiring 31/12/08: Balance at beginning of year 3,500,000 3,650,000 3,500,000 3,650,000 Issued during the year - - - - Exercised during the year (1,000,000) - (1,000,000) - Lapsed during the year - (150,000) - (150,000) Balance at end of year 2,500,000 3,500,000 2,500,000 3,500,000
For
per
sona
l use
onl
y

53
NOTES TO THE FINANCIAL STATEMENTS
Consolidated Company 2008 2007 2008 2007 Number Number Number Number Exercise price of $0.281 (2007: $0.30) expiring 31/12/10: Balance at beginning of year 775,000 - 775,000 - Issued during the year - 775,000 - 775,000 Exercised during the year (625,000) - (625,000) - Balance at end of year 150,000 775,000 150,000 775,000 Exercise price of $0.281 (2007: $0.30) expiring 14/07/11: Balance at beginning of year 15,000,000 - 15,000,000 - Issued during the year - 15,000,000 - 15,000,000 Exercised during the year (100,000) - (100,000) - Balance at end of year 14,900,000 15,000,000 14,900,000 15,000,000 Exercise price of $0.531 expiring 31/12/11: Balance at beginning of year - - - - Issued during the year 6,350,000 - 6,350,000 - Lapsed during the year (25,000) - (25,000) - Balance at end of year 6,325,000 - 6,325,000 - Exercise price of $0.55 expiring 31/12/11: Balance at beginning of year - - - - Issued during the year 50,000 - 50,000 - Balance at end of year 50,000 - 50,000 - Exercise price of $0.621 (2007: $0.64) expiring 04/01/10: Balance at beginning of year 5,047,062 - 5,047,062 - Issued during the year - 5,047,062 - 5,047,062 Balance at end of year 5,047,062 5,047,062 5,047,062 5,047,062 Exercise price of $0.631 expiring 31/12/11: Balance at beginning of year - - - - Issued during the year 50,000 - 50,000 - Balance at end of year 50,000 - 50,000 - Exercise price of $0.731 expiring 31/12/11: Balance at beginning of year - - - - Issued during the year 5,900,000 - 5,900,000 - Lapsed during the year (25,000) - (25,000) - Balance at end of year 5,875,000 - 5,875,000 - The exercise price of outstanding options on 23 June 2008 was reduced by $0.019 as a result of the capital reduction by an in-specie distribution of shares in Southern Cross Goldfields Limited to the Company's shareholders.
For
per
sona
l use
onl
y

54
NOTES TO THE FINANCIAL STATEMENTS
Consolidated Company 2008 2007 2008 2007 $ $ $ $ 20. OTHER RESERVES Share based payments reserve (a) 1,529,561 30,503 1,529,561 30,503 Associate investment reserve (b) - 1,835,248 - 1,835,248 Share option reserve (c) 1,020,000 - 1,020,000 - Equity revaluation reserve (d) 5,583,377 - 5,583,377 - 8,132,938 1,865,751 8,132,938 1,865,751 (a) Share based payments reserve Balance at beginning of year 30,503 14,300 30,503 14,300 Recognition of share-based payment expense 1,499,058 16,203 1,499,058 16,203 Balance at end of year 1,529,561 30,503 1,529,561 30,503 The share based payments reserve is used to recognise the fair value of options provided to employees as part of their remuneration. (b) Associate investment reserve Balance at beginning of year 1,835,248 - 1,835,248 - Share of changes recognised directly in associate’s equity (45,655) 1,835,248 (45,655) 1,835,248 Transfer to equity revaluation reserve (1,789,593) - (1,789,593) - Balance at end of year - 1,835,248 - 1,835,248 The associate investment reserve is used for changes in proportionate interest in associate arising from changes recognised directly in associate’s equity. (c) Share option reserve Balance at beginning of year - - - - Recognition of fair value of options issued as consideration for the acquisition of mining tenements 1,020,000 - 1,020,000 - Balance at end of year 1,020,000 - 1,020,000 - The share option reserve is used to recognise the fair value of options issued as consideration for the acquisition of mining tenements. (d) Equity revaluation reserve Balance at beginning of year - - - - Change in fair value of available-for-sale financial assets 3,793,784 - 3,793,784 - Transfer from associate investment reserve 1,789,593 - 1,789,593 - Balance at end of year 5,583,377 - 5,583,377 - The equity revaluation reserve records movements in the fair value of available-for-sale financial assets.
For
per
sona
l use
onl
y

55
NOTES TO THE FINANCIAL STATEMENTS
Consolidated Company 2008 2007 2008 2007 $ $ $ $ 21. ACCUMULATED LOSSES Balance at beginning of year (3,124,002) (2,082,225) (3,105,513) (2,082,225) Net loss for year (3,748,788) (1,041,777) (3,767,277) (1,023,288) Balance at end of year (6,872,790) (3,124,002) (6,872,790) (3,105,513) 22. NOTES TO THE CASH FLOW STATEMENT (a) Reconciliation of net loss to cash flows used in operating activities Net loss (3,748,788) (1,041,777) (3,767,277) (1,023,288) Add/(less) non-cash items: Net gain on disposal of investments - (440,000) - (440,000) Net gain on disposal of exploration assets - (30,044) (50,216) (75,222) Gain on derecognition of subsidiary (1,233,767) - - - Depreciation and amortisation expense 71,649 39,068 64,386 38,829 Impairment of investment in controlled entity - - 126,320 78,568 Impairment of loan to controlled entity - - 13,947 152,992 Impairment reversal of loan to controlled entity - - (152,992) - Exploration expenditure written off 1,090,390 455,674 506,902 291,012 Share-based payment 1,499,058 16,203 1,499,058 16,203 Share of loss of associate 636,057 315,425 636,057 315,425 Change in assets and liabilities: (Increase)/decrease in other receivables (212,305) (12,164) (122,054) (9,835) Increase in trade and other payables 290,367 44,092 154,793 34,865 Increase in provisions 41,240 971 35,979 971 Net cash flows used in operating activities (1,566,099) (652,552) (1,055,097) (619,480) (b) Reconciliation of cash Cash balance comprises: Cash and cash equivalents 13,161,942 4,619,043 13,161,942 4,617,626 (c) Financing facilities available
At reporting date, the following hire purchase and credit card facility had been negotiated and was available: Total facility 210,000 210,000 210,000 210,000 Facility used at reporting date 6,233 93,254 6,233 93,254 Facility unused at reporting date 203,767 116,746 203,767 116,746
For
per
sona
l use
onl
y

56
NOTES TO THE FINANCIAL STATEMENTS
Consolidated Company 2008 2007 2008 2007 $ $ $ $ 23. OPERATING LEASES The Company leases office premises at unit 20 and 23, 123A Colin Street, West Perth under operating leases for a term of 3 years from 15 November 2005 and 2.1 years from 16 October 2006 respectively. Both leases have an option to renew for a further 3 years. The rent payable in respect of unit 20 is reviewed for CPI increases one year from commencement and reviewed to reflect market rentals two years from commencement. The rent payable in respect of unit 23 has a fixed increase adjustment of 5% each anniversary date. The Company leases storage premises at 5 Coolgardie Terrace, Perth under an operating lease for a term of 1 year from 23 June 2008 with an option to renew for a further 1 year. If the option to renew is exercised the rent will be reviewed for CPI increase. The Company’s subsidiary, Southern Cross Goldfields Limited leased office premises at Level 2, 123B Colin Street, West Perth under an operating lease for three years with a right of renewal for a further three years at which time all terms are renegotiable. Lease amounts are subject to an annual rent increase of 4%.
During the financial year ended 30 June 2008, $161,131 was recognised as an expense in the income statement in respect of operating leases (2007: $70,630). Non-cancellable operating lease rentals not provided for in the financial report are payable as follows: Not later than one year 62,548 76,305 62,548 76,305 Later than one year and not later than five years - 28,615 - 28,615 62,548 104,920 62,548 104,920
24. KEY MANAGEMENT PERSONNEL DISCLOSURES Key management personnel Directors: Lewis Cross - Non-executive Chairman Jonathan Lea - Managing Director (appointed 2 January 2008) Alan Tough - Executive Director (appointed 2 January 2008) Kevin Schultz - Non-executive Director (Managing Director from 1 July 2007 to 2 January 2008) Vernon Strange - Non-executive Director (resigned 3 July 2008) Colin McCavana - Non-executive Director (resigned 14 November 2007) Ian Buchhorn - Non-executive Director Kenneth Hellsten - Non-executive Director (appointed 3 July 2008) The Remuneration Committee of the Board of Directors is responsible for determining and reviewing compensation arrangements for the directors, and the executive team. The Remuneration Committee assesses the appropriateness of the nature and amount of emoluments of such officers on a periodic basis by reference to relevant employment market conditions with the overall objective of ensuring maximum stakeholder benefit from the retention of a high quality board and executive team. Remuneration levels for executives are completely set to attract the most qualified and experienced candidates, taking into account prevailing market conditions and individual's experience and qualifications. Each of the non-executive directors receives a fixed fee for their services as directors. There is no direct link between remuneration paid to any of the directors and corporate performance such as bonus payments for achievement of certain key performance indicators. The aggregate maximum remuneration for all non-executive directors approved by shareholders at the 2007 Annual General Meeting, is fixed at $400,000 per annum. Non-executive directors’ base fees are presently $70,000 per annum and the Chairman $80,000 per annum.
For
per
sona
l use
onl
y

57
NOTES TO THE FINANCIAL STATEMENTS
Compensation of key management personnel for the year ended 30 June 2008
Short-term Post
Employment
Share-based
payments Total
Salary &
Fees
Non Monetary
Benefits Other
Benefits
Superannu-ation
Benefits Options $ $ $ $ $ $ Lewis Cross - - 1,939 66,762 252,372 321,073 Jonathan Lea 208,564 783 959 18,771 252,372 481,449 Alan Tough 125,000 - 959 - - 125,959 Kevin Schultz 125,164 4,186 1,939 56,755 252,372 440,416 Vernon Strange 40,000 - 1,939 3,600 252,372 297,911 Colin McCavana - - 726 26,350 - 27,076 Ian Buchhorn - - 1,939 43,600 252,372 297,911 Total 498,728 4,969 10,400 215,838 1,261,860 1,991,795 Compensation of key management personnel for the year ended 30 June 2007
Short-term Post
Employment
Share-based
payments Total
Salary &
Fees
Non Monetary
Benefits Other
Benefits
Superannu-ation
Benefits Options $ $ $ $ $ Lewis Cross 15,000 - 2,837 36,321 - 54,158 Kevin Schultz 143,670 4,561 2,837 26,046 - 177,114 Vernon Strange 35,833 - 2,837 3,225 - 41,895 Colin McCavana - - 2,837 39,058 - 41,895 Ian Buchhorn - - 2,837 32,064 - 34,901 Total 194,504 4,561 14,185 136,714 - 349,964
Compensation options for the year ended 30 June 2008
Grant
date Number granted
Number vested
Value at grant date
Exercise price
First exercise
date
Last exercise
date Lewis Cross 22/11/07 1,000,000 - 0.296 $0.531 22/11/08 31/12/11 Lewis Cross 22/11/07 1,000,000 - 0.239 $0.731 22/11/09 31/12/11 Jonathan Lea 22/11/07 1,000,000 - 0.296 $0.531 22/11/08 31/12/11 Jonathan Lea 22/11/07 1,000,000 - 0.239 $0.731 22/11/09 31/12/11 Kevin Schultz 22/11/07 1,000,000 - 0.296 $0.531 22/11/08 31/12/11 Kevin Schultz 22/11/07 1,000,000 - 0.239 $0.731 22/11/09 31/12/11 Vernon Strange 22/11/07 1,000,000 - 0.296 $0.531 22/11/08 31/12/11 Vernon Strange 22/11/07 1,000,000 - 0.239 $0.731 22/11/09 31/12/11 Ian Buchhorn 22/11/07 1,000,000 - 0.296 $0.531 22/11/08 31/12/11 Ian Buchhorn 22/11/07 1,000,000 - 0.239 $0.731 22/11/09 31/12/11 10,000,000
For
per
sona
l use
onl
y

58
NOTES TO THE FINANCIAL STATEMENTS
Option holdings of key management personnel (i) Options with an exercise price of $0.231 and an expiry date of 31 December 2008:
Held at 1
July 2007 Purchases
(sales) Held at 30 June 2008
Vested & exercis-
able at 30 June 2008
Lewis Cross 500,000 - 500,000 500,000 Kevin Schultz 1,000,000 - 1,000,000 1,000,000 Vernon Strange 500,000 - 500,000 500,000 Colin McCavana (resigned 14/11/07) 500,000 - 500,000 500,000 Ian Buchhorn - - - - Total 2,500,000 - 2,500,000 2,500,000 (ii) Options with an exercise price of $0.181 and an expiry date of 31 December 2008:
Held at 1
July 2007 Exercised Purchases
(sales) Held at 30 June 2008
Vested & exercis-
able at 30 June 2008
Lewis Cross 1,020,001 (1,000,001) - 20,000 20,000 Alan Tough - - 15,000 15,000 15,000 Kevin Schultz 951,207 - (650,000) 301,207 301,207 Vernon Strange 1,975,405 - (900,000) 1,075,405 1,075,405 Colin McCavana (resigned 14/11/07) 2,480,533 - - 2,480,533 2,480,533 Total 6,427,146 (1,000,001) (1,535,000) 3,892,145 3,892,145 (iii) Options with an exercise price of $0.531 and an expiry date of 31 December 2011:
Held at 1
July 2007
Granted as
compens- ation
Purchases (sales)
Held at 30 June 2008
Vested & exercis-
able at 30 June 2008
Lewis Cross - 1,000,000 - 1,000,000 - Jonathan Lea - 1,000,000 - 1,000,000 - Kevin Schultz - 1,000,000 - 1,000,000 - Vernon Strange - 1,000,000 - 1,000,000 - Ian Buchhorn - 1,000,000 - 1,000,000 - Total - 5,000,000 - 5,000,000 - (iv) Options with an exercise price of $0.731 and an expiry date of 31 December 2011:
Held at 1
July 2007
Granted as
compens- ation
Purchases (sales)
Held at 30 June 2008
Vested & exercis-
able at 30 June 2008
Lewis Cross - 1,000,000 - 1,000,000 - Jonathan Lea - 1,000,000 - 1,000,000 - Kevin Schultz - 1,000,000 - 1,000,000 - Vernon Strange - 1,000,000 - 1,000,000 - Ian Buchhorn - 1,000,000 - 1,000,000 - Total - 5,000,000 - 5,000,000 -
For
per
sona
l use
onl
y

59
NOTES TO THE FINANCIAL STATEMENTS
Shareholdings of key management personnel
Held at 1
July 2007 Exercise of
options Purchases
(sales) Held at 30 June 2008
Lewis Cross 1,040,001 1,000,001 100,000 2,140,002 Jonathan Lea - - 54,588 54,588 Alan Tough - - 30,000 30,000 Kevin Schultz 961,207 - - 961,207 Vernon Strange 1,058,873 - (540,000) 518,873 Colin McCavana (resigned 14/11/07) 2,680,533 - - 2,680,533 Ian Buchhorn 150,000 - 1,070,224 1,220,224 Total 5,890,614 1,000,001 714,812 7,605,427 Other transactions with key management personnel Transaction 2008 2007 $ $ Vernon Strange (i) Rent, hire and services 152,846 58,881 Vernon Strange (ii) Tenements acquisition - 15,000 Kevin Schultz (iii) Exploration facilities 24,000 36,000 (i) The Company used the services of Southern Cross Drilling Services, a personally-related entity of Vernon Strange. Amounts were billed based on normal market rates for such services and were due and payable under normal payment terms.
(ii) In 2007 the Company paid an option to acquire exploration and mining tenements from Vernon Strange on terms and conditions that were no more favourable than those available, or which might reasonably be expected to be available, on similar transactions to unrelated entities on an arm’s length basis.
(iii) The Company used the facilities of Overseas Mining Services Pty Ltd, a personally-related entity of Kevin Schultz. Amounts were billed based on normal market rates for such facilities and were due and payable under normal payment terms. 2008 2007 $ $ Aggregate amount recognised as expense from the above transactions 87,984 45,003 Assets and liabilities arising from the above transactions at reporting date: Non-current assets: Exploration and evaluation assets 88,862 64,878 Current liabilities: Trade payables 1,715 2,723 F
or p
erso
nal u
se o
nly

60
NOTES TO THE FINANCIAL STATEMENTS
25. RELATED PARTY DISCLOSURES a) Subsidiaries and associates Details of the Company's investment in its subsidiaries, Eclipse Minerals Pty Ltd (Eclipse) and Southern Cross Goldfields Limited (SXG) are disclosed in note 11.
Details of the Company's investment in its associates, Northern Uranium Limited and Southern Cross Goldfields Limited (SXG) are disclosed in note 9.
The Company made loans totalling $66,622 (2007: $76,061) to Eclipse during the year for the purpose of exploration expenditure on its mineral tenements. Eclipse repaid $791,369 on the loan following the sale of mining tenements to SXG during the year. The balance of the loan at 30 June 2008 is $136,513 after providing for impairment of $13,947 (2007: $875,207) and is disclosed as non-current other receivables of the Company in note 7. The loan is non-interest bearing with no fixed repayment date.
In December 2007, the Company entered into an agreement to sell various gold and base metal tenements in Western Australia to SXG for the consideration of 21,999,999 shares and 15,000,000 share options in SXG at a deemed value of $2,420,000 for the shares (11 cents per share) and $780,000 for the share options (exercisable at 20 cents each on or before 31 December 2012). Consideration of $791,369 was allocated to mining tenements held by Eclipse that were included in the sale to SXG. On 21 December 2007, SXG lodged a prospectus for an Initial Public Offer (IPO) to raise $10,000,000 through the issue of 50,000,000 shares at 20 cents each. On 12 March 2008 SXG successfully allotted the IPO shares and ceased to be a subsidiary of the Company. As part of the IPO, the Company purchased 11,650,000 shares at 20 cents each to ensure minimum subscription was achieved and these shares were placed in voluntary escrow for 12 months.
On 6 November 2007, the Company entered into a letter agreement (as amended on 19 December 2007) to advance funds of up to $2,298,167 to SXG. The Company made loans totalling $2,193,175 (2007: 152,992) to SXG during the year for the purpose of acquiring mineral tenements, exploration, administration and IPO costs. The loan totaling $2,346,167 was fully repaid on 14 March 2008. Interest of $20,869 at the rate of 8% per annum from 31 January 2008 to 14 March 2008 was charged on the loan. b) Key management personnel Details of remuneration, share and option holdings of directors and key management personnel and other transactions with key management personnel are disclosed in note 24. 26. EXPENDITURE COMMITMENTS Exploration expenditure commitments
In order to maintain current rights of tenure to exploration tenements, the Company and the Group are required to perform minimum exploration work to meet the minimum expenditure requirements specified by various State governments. These obligations can be reduced by selective relinquishment of exploration tenure or renegotiation. Due to the nature of the Company's operations in exploring and evaluating areas of interest, exploration expenditure commitments beyond twelve months cannot be reliably determined. It is anticipated that expenditure commitments in subsequent years will be similar to that for the forthcoming twelve months. These obligations are not provided for in the financial report and are payable. Consolidated Company 2008 2007 2008 2007 $ $ $ $ Not later than one year 1,691,240 2,608,260 1,691,240 2,506,400
For
per
sona
l use
onl
y

61
NOTES TO THE FINANCIAL STATEMENTS
Consolidated Company 2008 2007 2008 2007 $ $ $ $ Hire purchase commitments
At 30 June 2007 the Company had hire purchase contracts for motor vehicles with a carrying value of $113,560. These hire purchase contracts were paid out during the financial year and there are no hire purchase commitments at 30 June 2008. The hire purchase contracts had the following repayment commitments as at 30 June 2007: Not later than one year - 57,636 - 57,636 Later than one year but not later than five years - 30,906 - 30,906 - 88,542 - 88,542 27. CONTINGENCIES
In May 2007 Western Australia’s Environmental Protection Authority (“EPA”) published a study in which it recommended the establishment of “A class reserves” for the protection of certain allegedly environmentally sensitive areas in Banded Iron Formation (BIF) ranges of Western Australia. Some of the proposed A class reserves overlap with mining tenements granted to Polaris (the “Overlapping Areas”). The EPA study has been submitted to the Minister for the Environment. A Government Working Group has been established and is consulting with key stakeholders (including Polaris) to revise the boundaries of specific proposed A class reserves. The purpose of this review is to excise high mineral prospective areas out of the proposed A class reserve boundary. Polaris is currently in dialogue with the Working Group on this issue. 28. SUBSEQUENT EVENTS The Company has entered into an agreement to lease office premises at Level 2, 1109 Hay Street, West Perth under an operating lease for a term of 3 years commencing 1 October 2008 and expiring 30 September 2011 with an option to renew for a further 3 years. The annual rent payable is $211,280 and will be reviewed for CPI increases one year from commencement and reviewed to reflect market rentals two years from commencement. 29. AUDITORS REMUNERATION Amounts paid to the auditor for audit and review of financial reports 27,775 22,000 27,775 22,000 30. IN SPECIE DISTRIBUTION
On 20 December 2007 The Company entered into an agreement with its wholly owned subsidiary, Southern Cross Goldfields Limited (SXG) for the disposal of its non-iron ore assets in return for the issue of 22 million SXG shares and 15 million SXG options. Approval was obtained at a general meeting of shareholders held on 25 February 2008 for a reduction of capital and distribution in specie whereby the issued share capital of the Company be reduced by the Company making a pro-rata in specie distribution of up to 22,000,000 fully paid ordinary shares in SXG within six months of SXG listing on the Australian Securities Exchange (ASX). SXG was listed on the ASX on 20 March 2008. The Company made an in-specie distribution of 21,998,226 fully paid ordinary shares in SXG to its shareholders on 23 June 2008. Each Polaris shareholder received 1 SXG share for every 5.846 Polaris shares held on the record date of 4 March 2008. The Company was granted a waiver from vendor restriction requirements imposed on the shares the subject of the in specie distribution.
For
per
sona
l use
onl
y

62
NOTES TO THE FINANCIAL STATEMENTS
31. FINANCIAL RISK MANAGEMENT
The Group's principal financial instruments comprise cash and short-term deposits, receivables, available for sale investments, payables and hire purchase contracts. The main purpose of these financial instruments is to fund the Group’s operations. The main risks arising from the Group's financial instruments are credit risk, liquidity risk and market risk (including interest rate risk and equity price risk). To monitor existing financial assets and liabilities as well as to enable an effective controlling of future risks, the Company has established comprehensive risk reporting. The Group uses different methods to measure and manage different types of risks to which it is exposed. These include monitoring levels of exposure to interest rate and assessments of market forecasts for interest rate and liquidity risk is monitored through future rolling cash flow forecasts. The carrying amounts of all financial assets and liabilities (including liabilities contractual maturities) at balance date are as follows: Consolidated Company 2008 2007 2008 2007 $ $ $ $ Financial assets Cash and cash equivalents 6 13,161,942 4,619,043 13,161,942 4,617,626 Other receivables 7 326,508 52,641 463,021 925,519 Available-for-sale financial assets 10 5,546,000 - 5,546,000 - Other financial assets 11 109,000 - 109,000 126,320 Total financial assets 19,143,450 4,671,684 19,279,963 5,669,465 Financial liabilities Trade and other payables: 15 - 6 months or less 1,675,819 244,462 1,675,819 218,839 Hire purchase liabilities: 16 - 6 months or less - 15,932 - 15,932 - 6 to 12 months - 41,704 - 41,704 - 1 to 2 years - 20,721 - 20,721 - 2 to 3 years - 10,185 - 10,185 Total financial liabilities 1,675,819 333,004 1,675,819 307,381 The carrying amount of all financial assets and liabilities approximates their fair value. Credit risk Credit risk arises from the financial assets of the Group, which comprise cash and cash equivalents, other receivables and available-for-sale financial assets. Receivable balances are monitored on an ongoing basis with the result that the Group’s exposure to bad debts is not significant. The Group has adopted the policy of only dealing with credit worthy counterparties. The Group's exposure to credit risk arises from potential default of the counter party, with a maximum exposure equal to the carrying amount of these instruments.
For
per
sona
l use
onl
y

63
NOTES TO THE FINANCIAL STATEMENTS
Liquidity risk Liquidity risk is the risk that the Group will not be able to meet its financial obligations as they fall due. The Group’s approach to managing liquidity is to ensure that it will always have sufficient liquidity to meet its liabilities when due. The Group currently does not have major funding in place. However, the Group continuously monitors forecasts and actual cash flows and the maturity profiles of financial assets and liabilities to manage its liquidity risk. The decision on how the Company will raise future capital will depend on market conditions existing at that time. The Group manages liquidity risk by continuously monitoring forecast and actual cash flows and matching the maturity profiles of financial assets and liabilities. Surplus funds are generally only invested in short term bank deposits. Market risk Market risk is the risk that changes in market prices, such as interest rates and equity prices will affect the Group’s income or the value of its holdings of financial instruments. The objective of market risk management is to manage and control market risk exposures within acceptable parameters, while optimising the return.
Interest rate risk The Group’s exposure to the risk of changes in market interest rates relates primarily to cash assets and variable interest rates. At balance date the group had the following mix of financial assets and liabilities exposed to Australian variable interest rate risk: Consolidated Company 2008 2007 2008 2007 $ $ $ $ Cash and cash equivalents 13,161,942 4,619,043 13,161,942 4,617,626
The following sensitivity analysis shows the effect on profit after tax to a 1.0% change in interest rates with other variables held constant on the interest rate exposures in existence at balance date (there would be no effect on other equity to a change in the interest rates). Impact on profit after tax to: 1.0% increase in interest rates 54,968 38,841 54,121 38,841 1.0% decrease in interest rates (54,968) (38,841) (54,121) (38,841)
Equity price risk The Group is exposed to equity securities price risk from investments held that are classified on the balance sheet as available for sale. Material investments are managed on an individual basis and all buy and sell decisions are approved by the Board. The following sensitivity analysis shows the effect on equity after tax to a 50% change in market value of the Australian listed equity securities and a 50% change in the market share price input into the Binominal option pricing model for the unlisted Australian listed equity securities with other variables held constant. Impact on equity after tax to: 50% increase in equity price 3,188,657 - 3,188,657 - 50% decrease in equity price (3,010,466) - (3,010,466) -
For
per
sona
l use
onl
y

64
DIRECTORS' DECLARATION In accordance with a resolution of the directors of Polaris Metals NL, I state that: (1) In the opinion of the directors:
(a) the financial statements and notes of the Company and of the Group are in accordance with the Corporations Act 2001, including
(i) giving a true and fair view of the Company’s and Group’s financial position as at 30 June
2008, and of their performance for the year ended on that date; and (ii) complying with Accounting Standards, the Corporations Regulations 2001 and other
mandatory professional reporting requirements; and (b) there are reasonable grounds to believe that the Company will be able to pay its debts as and when
they become due and payable. (2) This declaration has been made after receiving the declarations required to be made to the directors in
accordance with section 295A of the Corporations Act 2001 for the financial year ended 30 June 2008. On behalf of the Board Jonathan Lea Managing Director Dated at Perth this 30th day of September 2008
For
per
sona
l use
onl
y

Chartered Accountants
65
Ian K Macpherson CA
Robert W Parker CA
Craig A Vivian CA
Level 2, 47 Colin Street West Perth WA 6005
PO Box 359 West Perth WA 6872
���� +61 8 9321 3514 ���� +61 8 9321 3523
[email protected] www.ordnexia.com.au
P A R T N E R S
CHARTERED ACCOUNTANTS
O R D
30 September 2008
To the Board of Directors of Polaris Metals NL
Dear Sirs
AUDITORS INDEPENDENCE DECLARATION UNDER SECTION 307C OF THE
CORPORATIONS ACT 2001
I declare that, to the best of my knowledge and belief, in relation to the audit for the year
ended 30 June 2008, there have been:
• no contraventions of the auditor independence requirements as set out in the
Corporations Act 2001 in relation to the audit; and
• no contraventions of any applicable code of professional conduct in relation to
the audit.
Yours faithfully
ORD PARTNERS
Ian Macpherson
Partner
Enclosed: Type Enclosure Here
For
per
sona
l use
onl
y

Chartered Accountants
66
Ian K Macpherson CA
Robert W Parker CA
Craig A Vivian CA
Level 2, 47 Colin Street West Perth WA 6005
PO Box 359 West Perth WA 6872
���� +61 8 9321 3514 ���� +61 8 9321 3523
[email protected] www.ordnexia.com.au
P A R T N E R S
CHARTERED ACCOUNTANTS
O R D
INDEPENDENT AUDITOR’S REPORT TO THE MEMBERS OF
POLARIS METALS NL
We have audited the accompanying financial report of Polaris Metals NL, which
comprises the balance sheet as at 30 June 2008, and the income statement, statement of
changes in equity and cash flow statement for the year ended on that date, a summary of
significant accounting policies, other explanatory notes and the directors’ declaration of
the consolidated entity comprising the company and the entities it controlled at the year’s
end or from time to time during the financial year.
Directors’ responsibility for the financial report
The directors of the company are responsible for the preparation and fair presentation of
the financial report in accordance with Australian Accounting Standards (including the
Australian Accounting Interpretations) and the Corporations Act 2001. This responsibility
includes establishing and maintaining internal control relevant to the preparation and fair
presentation of the financial report that is free from material misstatement, whether due to
fraud or error; selecting and applying appropriate accounting policies; and making
accounting estimates that are reasonable in the circumstances. In Note 2, the directors also
state, in accordance with Accounting Standard AASB 101 Presentation of Financial
Statements, that compliance with Australian equivalents to International Financial
Reporting Standards ensures that the financial report, comprising the financial statements
and notes complies with International Financial Reporting Standards.
The directors of the company are also responsible for the remuneration disclosures
contained in the financial report.
Auditor’s responsibility
Our responsibility is to express an opinion on the financial report based on our audit. We
conducted our audit in accordance with Australian Auditing Standards. These Auditing
Standards require that we comply with relevant ethical requirements relating to audit
engagements and plan and perform the audit to obtain reasonable assurance whether the
financial report is free from material misstatement.
An audit involves performing procedures to obtain audit evidence about the amounts and
disclosures in the financial report. The procedures selected depend on the auditor’s
judgement, including the assessment of the risks of material misstatement of the financial
report, whether due to fraud or error. In making those risk assessments, the auditor
considers internal control relevant to the entity’s preparation and fair presentation of the
financial report in order to design audit procedures that are appropriate in the
circumstances, but not for the purpose of expressing an opinion on the effectiveness of the
entity’s internal control.
An audit also includes evaluating the appropriateness of
accounting policies used and the reasonableness of accounting estimates made by the
directors, as well as evaluating the overall presentation of the financial report and
remuneration disclosure contained in the directors’ report.
We believe that the audit evidence we have obtained is sufficient and appropriate to
provide a basis for our audit opinion.
For
per
sona
l use
onl
y

-Polaris Metals NL
67
O R D
Independence
In conducting our audit, we have complied with the independence requirements of the Corporations Act 2001. We
confirm that the independence declaration required by the Corporations Act 2001, provided to the directors of Polaris
Metals NL on 30 September 2008, would be in the same terms if provided to the directors as at the date of this auditor’s
report.
Auditor’s opinion
In our opinion:
(a) the financial report of Polaris Metals NL is in accordance with the Corporations Act 2001, including:
(i) giving a true and fair view of the company’s and consolidated entity’s financial position as at 30 June 2008
and of its performance for the year ended on that date; and
(ii) complying with Australian Accounting Standards (including the Australian Accounting Interpretations) and
the Corporations Regulations 2001; and
(b) the financial report also complies with International Financial Reporting Standards as disclosed in Note 2.
ORD PARTNERS Chartered Accountants
Ian Macpherson
Partner
Perth, 30 September 2008
Enclosed: Type Enclosure Here
For
per
sona
l use
onl
y