Embed Size (px)
Citation preview

ANNUAL REPORT 2009
For
per
sona
l use
onl
y

NOTICE OF ANNuAl GENErAl MEETING The Annual General Meeting of Norfolk Group Limited will be held at:
11.00am (AEST) on Tuesday 25 August 2009 Cavalier Room Christie Conference Centre 56 Berry StreetNorth Sydney NSW 2060 AUSTRALIA
CONTENTs04 Key financials06 Highlights07 Chairman’s report08 Managing Director’s report10 Management profiles12 Board profiles13 Review of operations29 Corporate governance statement32 Directors’ report47 Financial report93 Independent auditor’s report95 Shareholder informationIBC Corporate directory
Our INTErNATIONAl FOOTprINT
UAE
India
Australia
New Zealand
For
per
sona
l use
onl
y

NOrFOlK Is A lEADING INTErNATIONAl prOVIDEr OF INTEGrATED BuIlDING AND ENGINEErING sErVICEs
NORFOLK ANNUAL REPORT 2009 1
For
per
sona
l use
onl
y

NOrFOlK GrOup: ACHIEVING VAluE THrOuGH sTrONG BrANDING, DIVErsITY AND AlIGNMENT wITH GrOwTH sECTOrs
Companies acquired from Tyco services (Australia & New Zealand)
Norfolk Group formed, Glenn wallace appointed as Managing Director
Focus on operational improvements and profitability of companies
Increased share of recurring revenue, maintenance contracts and alliance-style contracting
2004 2005 2006
Our HIsTOrYNOrFOlK GrOup wAs EsTABlIsHED IN 2004 TO MANAGE COMpANIEs ACquIrED FrOM TYCO sErVICEs (AusTrAlIA & NEw ZEAlAND). A FOCus ON OpErATIONAl IMprOVEMENTs TO rEAlIsE THE Full GrOwTH pOTENTIAl OF THE COMpANIEs lED TO THE suCCEssFul lIsTING OF NOrFOlK GrOup lIMITED ON THE AsX IN JulY 2007.
2 NORFOLK ANNUAL REPORT 2009
For
per
sona
l use
onl
y

27 July – successful listing on the AsX
Acquisition of Trans-American Air- conditioning (India)
Acquisition of Gold Coast Air-conditioning and The plumbing Doctor (Canberra region)
Deliver record full year financial result of $34.3 million EBIT
Along with alliance partners, sign $1 billion contract for railCorp program Alliance (largest ever contract for Norfolk Group)
secure first international rail project with New Zealand Government
Full year financial result includes year-on-year increase in HVAC service revenue of 14%
Norfolk Mechanical India grown to 20 branches, established start-up operations in united Arab Emirates
2007 2008 2009
Market leader with strong brandsMarket leader in the Australian electrical engineering, contracting and services market, and number one in the non-residential Australian heating, ventilation and air conditioning (‘HVAC’) maintenance services market.
Haden dates from 1816 and celebrates its 40th year of operations in Australia in 2009, and O’Donnell Griffin dates from 1906.
specialised and highly skilled, directly employed workforceNorfolk Group employs approximately 3,600 people, including more than 1,800 highly skilled engineers, electricians, signalling and communications/data technicians, plumbers, air conditioning and refrigeration technicians, and 340 apprentices to secure the future skills base for Norfolk and to inject new ideas and energy into the business.
The business is supported by a strong management team who are focused on creating a profitable and sustainable future.
Technology-based solutions The Norfolk team specialises in harnessing the latest technology to deliver environmentally sustainable heating, ventilation, air conditioning and refrigeration, electrical services for power generation and transmission, rail signalling and electrification, facilities management, and building products and systems.
Network and scalabilityBroad geographical reach across Australia, New Zealand, India and the United Arab Emirates, more than 150 locations with the ability to scale-up to meet demand and the capacity to undertake and resource large, complex projects, provide Norfolk Group with an important competitive edge.
Alignment with growth sectorsProducts, services and experience in key growth sectors:
Transport infrastructure �
Water supply �
Power generation, including solar �
Education �
Healthcare �
Defence �
Custodial and accommodation services �
Industrial and manufacturing �
Communications �
Mining and resources �
NORFOLK ANNUAL REPORT 2009 3
For
per
sona
l use
onl
y

KEY FINANCIAls
FINANCIAl pErFOrMANCE FY2009 FY2009 FY2008AU$ Million Statutory Normalised1 Pro forma
Revenue 744.2 744.2 744.8
EBITDA 20.2 33.7 38.6
EBIT 15.4 28.9 33.5
EBIT Margin (%) 2.1 3.9 4.5
NPAT from continuing operations 5.6 15.0 19.5
NPAT including discontinued operations 4.4 13.8 20.0
EPS (cents) from continuing operations2 4.3 11.5 15.0
1 Excludes one-off impairment charge (SSR Project) and discontinued operations (Trafalgar)
2 Based on issued capital (130,000,000) undiluted
Revenue of $744.2 million (FY2008: $744.8 million) � 2
Normalised EBIT of $28.9 million � 1
Normalised NPAT of $15.0 million � 1
EBIT margin 3.9% � 1
Net operating cash flow solid at $20.2 million � 2
1 Excludes one-off impairment charge (SSR Project) and discontinued operations (Trafalgar)
2 Excludes discontinued operations (Trafalgar)
CAsH FlOw suMMArY1
FY2009 FY2008 AU$ Million Statutory Pro forma
EBITDA 20.2 38.6
Change in Working Capital 11.3 0.3
Net Interest Paid (7.0) (6.1)
Income Tax Paid (4.3) (4.4)
Net Operating Cash Flow 20.2 28.4
1 Excludes discontinued operations (Trafalgar)
4 NORFOLK ANNUAL REPORT 2009
For
per
sona
l use
onl
y

KEY FINANCIAls
IndiaNew ZealandAustralia
8.9%
10.1%
4.2%
–0.8%
5.7%5.9%
EBIT MARGIN % BY COUNTRY
IndiaNew ZealandAustralia
0.20.34.2–0.8
36.437.7
FY20081FY20092
OPERATING EBIT AU$ MILLION BY COUNTRY
1 Pro forma excluding discontinued operations (Trafalgar)2 Excludes one-off impairment charge (SSR Project) and discontinued operations (Trafalgar)
$5.0mdecline in NZ
EBIT AU$ MILLION
NORMALISED STATUTORY
0
10
20
30
40
EBITSSR Impairment
EBITCorporateFire & Property Services
MechanicalElectrical & Communications
17.0
16.2
4.0 8.3
28.9 13.5
15.4
37.2
Alliance contracting 5.5%
Maintenance and recurring services 54.5%
Installation and other non-recurring services 40%
GROSS PROFIT CONTRIBUTION
NORFOLK ANNUAL REPORT 2009 5
For
per
sona
l use
onl
y

FY2009 HIGHlIGHTs > MAINTAINED FOCus ON quAlITY EArNINGs
THrOuGH rECurrING MAINTENANCE sErVICEs AND AllIANCE CONTrACTING
> DIVErsITY AND sTABIlITY OF EArNINGs THrOuGH BrOAD rANGE OF prODuCTs AND sErVICEs, GrOwTH sECTOr EXpOsurE AND GEOGrApHICAl FOOTprINT
> EXpANsION OF INDIAN OpErATIONs FrOM 11 TO 20 BrANCHEs, EsTABlIsHED sTArT-up OpErATIONs IN uNITED ArAB EMIrATEs
> rOBusT BAlANCE sHEET AND sTrONG OpErATING CAsH FlOw pOsITION
> $570 MIllION OF FY2010 rEVENuE uNDErpINNED BY CONTrACTs, wOrK OrDErs AND EXIsTING sErVICE rElATIONsHIps (As AT 31 MArCH 2009)
6 NORFOLK ANNUAL REPORT 2009
For
per
sona
l use
onl
y

CHAIrMAN’s rEpOrT
I am pleased to present the 2009 Annual Report to our shareholders, in what has been a challenging year for Norfolk Group Limited.
Relatively early in our financial year cycle it became evident that New Zealand in particular was going to confront very tough economic conditions that, in quick succession and with little warning, would flow through to our Australian operations.
The impact of the fast-changing economy led to Norfolk revising its full-year forecast in early October and again at the time of delivering our first half results for the 2009 financial year in late November.
Taking into account the full impact of the now well-documented global financial crisis, the Board believes it is a solid result by Norfolk to have delivered a normalised EBIT result within the revised range of $27 million to $30 million.
While the EBIT result for the 2009 financial year was solid, the company made the decision to discontinue Trafalgar’s underperforming operations.
Disappointingly, we were required to incur a one-off impairment charge of $13.5 million in relation to outstanding claims relating to the Southern Suburbs Rail (‘SSR’) Project in Western Australia. Notwithstanding this charge to the 2009 financial accounts, Norfolk is continuing to pursue its rights in relation to the SSR Project.
It’s worth noting that the SSR Project was contracted in 2004, prior to Norfolk’s formation and subsequent listing on the ASX in 2007, and that current policies and practices would not permit Norfolk to enter into a contract with such onerous conditions.
Share price performanceThe performance of Norfolk’s share price over the year has also been disappointing. The combination of our revised outlook for the year and a declining market overall dragged our share price lower, leading to a number of institutional investors becoming ‘forced sellers’ as the profile of the company no longer matched their investment mandate.
We are pleased that there has been some recovery in our stock since the lows in early 2009 and continue to believe that through a commitment to our strategy and in turn the delivery of strong results, the true value of the company will ultimately be reflected in its share price.
Retention of dividend Given the very challenging market environment, the Board concluded in May that Norfolk should not pay a final 2009 dividend. Instead, the funds will be retained by the company to pay down debt.
Future growth opportunitiesI would like to take this opportunity to congratulate the management of Norfolk for achieving some excellent outcomes in the 2009 financial year that will support the future growth of the company, including:
O’Donnell Griffin’s signing of the Group’s largest- �ever contract with RailCorp (Rail Corporation of NSW) as part of the Novo Rail Alliance;
The outstanding performance of Haden’s service �division, which delivered a year-on-year increase in revenue of 14 per cent;
The growth of Norfolk Mechanical India, which �now has branches in 20 cities across India; and
Resolve FM’s successful tender to deliver �facility management services to the University of Wollongong’s newly established Innovation Campus.
To conclude, Norfolk maintains its commitment to growing all its businesses over the longer term to deliver value for shareholders. We thank you for, and look forward to, your continued support.
ROD KELLER Chairman Norfolk Group Limited
Taking into account the full impact of the now well-documented global financial crisis, the Board believes it is a solid result by Norfolk to have delivered a normalised EBIT result within the revised range of $27 million to $30 million.
NORFOLK ANNUAL REPORT 2009 7
For
per
sona
l use
onl
y

MANAGING DIrECTOr’s rEpOrT
The 2009 financial year has been challenging for Norfolk Group, largely attributable to the impact of the global financial crisis and in particular the rapid decline in the New Zealand economy.
However, through decisive action and recalibrating our businesses to better suit the changed environment – including the consolidation of our electrical and mechanical operations in New Zealand – I am pleased that we achieved a normalised EBIT result of $28.9 million, which fell within our revised forecast range.
This achievement was the direct result of processes to identify trouble spots in the business and the initiation of programs to rectify them promptly and effectively. Critically, we recognised a need to improve our performance in relation to working capital and to take proactive steps to reduce our debt position.
At the end of the period our net debt level was $49.5 million. Notwithstanding this outcome, our average debt draw down throughout the period was considerably higher. In the changed and more conservative economic circumstances of today, management will focus on delivering reductions to our average debt level over the next period. While securing debt financing is more difficult in this climate, the finance team has been pro-active in seeking the support of our bankers to help us deliver the facilities required to support the business in the long term.
The work we have done around cost management has also been pleasing and I want to take this opportunity to assure our shareholders that management is committed to a sustained effort in this area across everything we do.
Increased pressure on funding for a number of our customers – particularly those in construction and development – added to our challenge through the delay in a number of projects that we had budgeted for in the 2009 financial year.
And finally, a disappointing outcome in relation to the resolution of payments for an historical project – Southern Suburbs Rail Project in Western Australia – has also conspired against us this financial year, but I am relieved to report that based on all current information and advice, we hope to be in a position to move forward from this project.
HSECAt Norfolk we continue to take health and safety very seriously and I am pleased to report that the Group achieved the ambitious target of a 20 per cent reduction in Total Recordable Injury Frequency Rate (‘TRIFR’) year-on-year. We are targeting a further 20 per cent reduction in the coming year.
While we take the view that any injury is one too many, it is worth noting that of Norfolk’s 143 sites in Australia and New Zealand, 45 per cent of them recorded no injuries at all in the last 12 months.
The positive results of our health and safety measures can be attributed to Norfolk’s commitment to its Safety All Ways program launched last year.
The Safety All Ways program encompasses a full calendar of training and educational activities, including monthly ‘Tool Box Talks’, each dedicated to a specific area of health and safety in the workplace. Topics covered in the last year include hand injuries, electric shocks, vehicle safety and safety at home during the summer holiday season.
Our peopleOur people continue to be the lifeblood of Norfolk’s existence. Over the last 12 months there have been some extraordinary efforts and, on behalf of the Senior Management Team and the Board, I want to thank our 3,600 employees for helping to deliver a solid performance considering the challenging environment.
I would also like to acknowledge the contribution of David Lee to the Norfolk Group. David resigned during the financial year and we wish him well in the future.
In May this year we appointed David Rafter to the position of Chief Executive – Norfolk Electrical & Communication and Norfolk International, and we look forward to his contribution in this role following a successful period as Chief Executive – Norfolk Mechanical.
It has been a tragic year in Australia for natural disasters, with major floods in Queensland, the ‘Black Saturday’ bushfire disaster in Victoria and ongoing drought in large parts of the country. In spite of the trying conditions, Norfolk Group employees’ ability to respond beyond the call of duty has stood out.
Across the Group we have received a number of testimonial letters from clients and the various State Emergency Services, praising members of the Norfolk family for their heroics, hard work and overwhelming displays of support.
Both cash and ‘in kind’ donations were made to a number of appeals across the year to support victims of the major disasters. I would like to thank employees who committed personal time and resources to these causes.
Creating future growth Norfolk’s strategic advantage lies in the strength of its position in the key sectors in which its companies operate. For example, we are the market leader in the Australian electrical engineering, contracting and services market (O’Donnell Griffin) and number one in the non-residential HVAC maintenance services market (Haden) in Australia.
In addition, we continue to focus on quality earnings through our recurring revenue, maintenance services, alliance contracting, exposure to key growth markets, building long-term relationships with our customers and our investment in our people.
8 NORFOLK ANNUAL REPORT 2009
For
per
sona
l use
onl
y

MANAGING DIrECTOr’s rEpOrT
During the difficult economic environment, Norfolk has worked diligently to boost its engagement with its customers, in particular our important National Key Accounts (‘NKAs’) and blue-chip customers, through a series of customer symposiums that will be extended across the Group in the future.
The performance of Haden’s service business was a highlight, with year-on-year growth in revenue of 14 per cent, and we will maintain our commitment to organically growing our stable of NKAs, particularly in the service division. Current NKAs include IBM, David Jones, National Australia Bank, Caltex and Ericsson.
For the last two years the Norfolk Electrical & Communications division has placed specific focus on the transport infrastructure, water and power generation sectors, and in the current environment we believe we are well-placed to attract new business through federal and state government investment.
Resolve FM has actively positioned itself in the market to deliver outstanding technical solutions for its customers and will maintain its focus on the commercial property, tertiary education, industrial and automotive, custodial and corrective services, defence and health sectors.
Norfolk Building Products has endured a difficult 12 months, which led to the divestment of the Trafalgar fire business. However, the companies in New Zealand delivered some high profile projects and a solid return, despite challenging economic conditions in a recessionary market.
The result was largely attributable to strong sales performances by Energy Products International (‘EPI’) and Metalbilt Doors, and a keen focus on cost management across all companies.
We will continue our conservative expansion internationally, with the establishment of a joint venture mechanical, electrical and plumbing (‘MEP’) business in the United Arab Emirates during the year, to complement our operations in India.
Outlook While the economic outlook remains uncertain, Norfolk Group has some very exciting opportunities ahead that support the company’s strategy:
Stable sector focus: we have had a strong �focus on the more stable government and infrastructure sector opportunities for some time and there has been some outstanding work done to ensure we are well-placed for new projects in the transport infrastructure, education, health, water, power generation, defence and justice areas.
Recurring service revenue: a key component �of our strategy has been to increase the percentage of our total revenue from recurring services, which we have achieved in difficult economic times and expect to continue.
Technology leaders: we have worked hard to �develop deep expertise in niche sectors through the harnessing of technology; our rail and water sector expertise are two examples. We will continue to train and develop our people right across the Group to become building services solutions experts.
Maintaining our margins in a far more competitive environment will be a challenge; indeed, in some cases we have made the strategic decision to engage in work at a lower margin in order to maintain market share.
Overall, we are looking to deliver a positive return for shareholders through a continued focus on cost efficiencies, combined with specialisation and the harnessing of technology to deliver market-leading solutions for our customers.
We believe Norfolk is well positioned for a solid performance in 2010. We enter this financial year with approximately $570 million of revenue underpinned by contracts, work orders and ongoing service commitments (as at 31 March 2009).
The 2010 financial year will present new challenges – that is the nature of being in business – and we look forward to meeting those challenges and to your continued support of Norfolk Group.
Sincerely,
GLENN WALLACE Managing Director Norfolk Group Limited
The work we have done around cost management has also been pleasing and I want to take this opportunity to assure our shareholders that management is committed to a sustained effort in this area across everything we do.
NORFOLK ANNUAL REPORT 2009 9
For
per
sona
l use
onl
y

Glenn wallace Managing Director
Glenn Wallace is the Managing Director of Norfolk and was appointed in 2004, following his role in the successful acquisition of the businesses now forming Norfolk Group.
With more than 16 years experience in management roles in New Zealand and Australia, Glenn works with other members of management to develop the strategy and business development tactics for Norfolk.
Prior to joining Norfolk, Glenn held a number of senior roles including Managing Director of Tyco (Australia & New Zealand), having held various roles within Tyco since joining the company as National Sales Manager in 1987, and Managing Director of the Tiri Group from 2003. He is a non-executive director of Maui Capital Limited.
Glenn has a Diploma in Leadership Management from the Macquarie Business School, and completed the Advanced Management Program at the University of Hawaii in 1996. He is a NSW Council Member in the Australian Industry Group and is a Member of the Australian Institute of Company Directors.
James Fletcher General Manager, Norfolk Building Products
James Fletcher was appointed Norfolk Project Manager in August 2006, Manager of Strategic Development and New Ventures in May 2007 and more recently General Manager of Norfolk Building Products. In this role he is responsible for the ongoing growth and development of five companies focussed on manufacturing and distribution.
Prior to joining Norfolk, James held various roles with Fletcher Aluminium (part of Fletcher Building), his last role as International Markets Manager. Prior to this he was a commercial litigation barrister and solicitor at New Zealand law firm Bell Gully.
James holds a Bachelor of Arts from Victoria University Wellington, and a Bachelor of Laws (Hons) degree from Auckland University. James was admitted to the Bar as a Barrister and Solicitor of the High Court of New Zealand in 1995.
Anthony O’shannessy Chief Financial Officer
Anthony O’Shannessy was appointed Financial Director of Norfolk in January 2005 and subsequently to the position of Chief Financial Officer. He is responsible for the control and administration of the financial activities of the company.
Prior to working with Norfolk, Anthony was the Divisional Finance Manager for the electrical and mechanical division of Tyco. He commenced his career at a chartered accounting firm specialising in tax. He later joined ABB, a global engineering organisation, and held roles in financial management in Australia and Europe.
Anthony holds a Bachelor of Business Studies (Accounting) from Bendigo CAE, is a Fellow of CPA Australia and is a graduate of the Australian Institute of Company Directors.
David rafter Chief Executive, Electrical & Communications and International
David Rafter was appointed to the positions of Chief Executive, Electrical & Communications and International, in May 2009.
The role covers the Electrical & Communications business in Australia and all electrical/mechanical businesses operating outside Australia; Norfolk Electrical & Mechanical in New Zealand, Norfolk Mechanical India and Haden MEP (UAE).
David was appointed to the role of General Manager of Haden in 2005 and subsequently promoted to the position of Chief Executive, Mechanical.
Prior to this, David was the National Manager of the Service Division for Tyco Australia’s Electrical and Mechanical Business Unit and also held senior positions at Resolve FM and Telstra Corporation’s Property Services business.
David holds a Master of Business Administration from Charles Sturt University, a Masters of Building Services Design Science from the University of Sydney and is a Member of the Australian Institute of Company Directors.
richard smith General Manager, Resolve FM
Richard Smith was appointed to the role of General Manager at Resolve FM in July 2007. Previously, Richard was Group General Manager – Services for Barclay Mowlem, where he established its Services Division, a combination of both the Facility Management and Maintenance Operations.
Richard has also held positions as General Manager of Strategic Planning and Development for both Barclay Mowlem and Transfield. He has extensive experience in Public-Private Partnerships (PPPs) and Build, Own, Operate, Transfer (BOOT) deals, and has managed such investments for Transfield. Prior to these, Richard spent 14 years with CSR Limited in a variety of divisions and roles.
Richard holds a Master of Business Administration from Macquarie University and a Bachelor of Engineering (Chemical) from Canterbury University.
MANAGEMENT prOFIlEs
10 NORFOLK ANNUAL REPORT 2009
For
per
sona
l use
onl
y

Fiona lovell General Counsel and Company Secretary
Fiona Lovell joined Norfolk in 2008 as a Senior Legal Counsel and was appointed General Counsel and Company Secretary in April 2009. As General Counsel, Fiona is responsible for the management of legal services across the Group, and for providing legal advice to the Norfolk Board and senior management. As Company Secretary, Fiona is responsible for the effective administration of the Board and for ensuring compliance with regulations, including the ASX listing rules. Fiona is also a member of the Norfolk Senior Management Team.
Fiona has a strong background in corporate and commercial matters, specialising in complex or large-scale litigation. Prior to joining Norfolk, Fiona worked as a solicitor in private practice and advised a number of listed entities.
Fiona holds a Bachelor of Arts/Bachelor of Laws (Hons), a Graduate Diploma in International Law from the University of Sydney and a Graduate Diploma in Applied Finance and Investment from the Securities Institute of Australia.
Chief Executive, Mechanical
The company is undergoing a comprehensive internal and external recruitment process to identify and appoint the most suitable candidate for the role of Chief Executive, Mechanical.
John Gardner Group Marketing, Communication & Investor Relations Director
John Gardner joined Norfolk as Group Marketing, Communication & Investor Relations Director in June 2008. John is responsible for the marketing, brand development, communication (internal and external), PR, media relations and investor relations for the Norfolk Group companies.
Prior to joining Norfolk, John was Managing Director of financial PR firm Savage & Partners (part of Ogilvy PR Worldwide), based in Sydney. He has advised publicly-listed companies of all sizes, across a range of sectors, on their public relations, media, issues management, investor relations and transaction communication. John has also worked in Perth and London.
John holds a Bachelor of Commerce (Marketing & PR) from Curtin University in Perth, a Diploma of Investor Relations (AIRA) and post graduate qualifications in the Corporate Governance of an ASX-Listed Company. He is a Member of the Public Relations Institute of Australia (MPRIA).
David Gregson Chief Information Officer
David Gregson was appointed Chief Information Officer in 2004. He is responsible for the overall management and strategic direction of information and communications technology of Norfolk. He proactively manages the effective application of technology to meet business objectives and to ensure appropriate competencies exist within Norfolk.
Previously, David held IT and engineering positions at Wormald, AMP Property, Resolve FM and the Corporate division of Tyco, where he also worked as a Six Sigma Black Belt.
David has a Bachelor of Engineering (Electrical) from the University of Technology Sydney.
Darren robinson Group Human Resources Director
Darren Robinson was appointed Group Human Resources Director in June 2007. He is responsible for driving the HR capabilities within Norfolk and providing excellence in company culture, training and development of our people and enhancing the employment brand of the Norfolk Group companies.
Darren has an extensive background in HR, where his career has spanned a number of sectors in roles from HR management, OHS&E, training and development, industrial relations and change management. He has held HR management positions with key industry companies Energy Australia, Amatek (Fletcher Building Group), Caltex Australia and BHP Minerals.
Darren holds a Master of Business Administration from Deakin University and a Master of Education (Information Technology) from the University of Wollongong.
MANAGEMENT prOFIlEs
NORFOLK ANNUAL REPORT 2009 11
For
per
sona
l use
onl
y

rod Keller Non-executive Chairman
Rod Keller has a Bachelor of Engineering (Mechanical) from the University of Sydney and is a Fellow of the Institute of Engineers, Australia.
Rod brings over 36 years experience in the engineering sector and has previously held management positions with Fletcher Construction Australia, the State Government of South Australia, Esso Australia, Woodside Petroleum and Santos and was Managing Director of GPU International Australia from 1995 to 1999. Rod became Chairman on 7 April 2008.
Rod is currently a non-executive director of Macquarie Communications Infrastructure Limited and Macquarie Communications Infrastructure Management Limited.
Glenn wallace Managing Director
Glenn Wallace has a Diploma in Leadership Management from the Macquarie Business School, and completed the Advanced Management Program at the University of Hawaii in 1996. He is a NSW Council member in the Australian Industry Group and is a Member of the Australian Institute of Company Directors.
Glenn is the Managing Director of Norfolk and was appointed to the role in 2004, following his role in the successful acquisition of the businesses now forming Norfolk.
With more than 16 years experience in management roles in both New Zealand and Australia, Glenn works with other members of management to develop the strategy and business development tactics for Norfolk. Prior to joining Norfolk, Glenn held a number of senior roles including Managing Director of Tyco, having held various roles within Tyco since joining the company as National Sales Manager in 1987, and Managing Director of the Tiri Group from 2003.
peter Abery Non-executive Director
Peter Abery holds a Bachelor and a Masters degree in Engineering (Electrical Engineering) from the University of Natal and a Masters of Business Administration from the University of South Africa. He is a Member of the Australian Institute of Company Directors, a Member of the Institute of Engineering and Technology (London) and a Member of the Chartered Institute of Management (United Kingdom). He is a graduate of the Harvard Business School’s International Senior Managers Program.
Peter is currently a director of Nomad Building Solutions and pieNetworks, and was previously a director and Chairman of Digital Television Services, and a non-executive director of National Grid Australia.
Peter has been Chief Executive Officer or Managing Director of a number of companies including HPM Industries, National Grid Wireless (formerly Crown Castle UK), Crown Castle Australia, Vodafone Network and QPSX Communications, and held senior positions with Telstra Corporation and AWA.
paul Chrystall Non-executive Director
Paul Chrystall holds a Bachelor of Commerce from the University of Auckland, during the completion of which he received various senior prizes, including the Alfred P Foggarty Award for excellence in Economics
Paul is currently Managing Director of Maui Capital Limited, a private equity firm with an Australasian mandate, and has been a director of Norfolk since 2004. He was, until September 2007, the Head of Private Equity at Goldman Sachs JBWere (NZ) Limited and prior to joining Goldman Sachs JBWere (NZ) Limited in April 2001, Paul held a number of senior corporate finance roles in a variety of industries.
peter lowe Non-Executive Director (appointed 8 April 2008)
Peter Lowe holds a Bachelor of Commerce and Master of Business Administration from the University of Melbourne and is a Member of the Australian Institute of Company Directors and a Fellow of CPA Australia.
Peter’s principal experience is in finance and corporate strategy in listed corporates. He is currently Chairman of United Energy Distribution Holdings Pty Ltd, and Multinet Group Holdings Pty Ltd, since July 2003 and Alinta Network Holdings Pty Ltd, since August 2007. He is also a director of Citywide Solutions Pty Ltd, Aurora Energy Pty Ltd and Snowy Hydro Limited.
Peter has previously held senior manager positions with CPA Australia, UtiliCorp United Inc, United Energy Limited and Fosters Brewing Group Limited.
BOArD prOFIlEs
12 NORFOLK ANNUAL REPORT 2009
For
per
sona
l use
onl
y

rEVIEw OF OpErATIONs
THE uNDErlYING pErFOrMANCE OF A NuMBEr OF BusINEssEs wAs sTrONG AND sOME OuTsTANDING NEw CONTrACT wINs DurING THE YEAr – INCluDING MAJOr prOJECTs IN TrANspOrT INFrAsTruCTurE, CONsTruCTION, HEAlTHCArE AND EDuCATION – wIll uNDErpIN THE MEDIuM-TErM GrOwTH OF THE COMpANY.
NORFOLK ANNUAL REPORT 2009 13
For
per
sona
l use
onl
y

ElECTRICAl & COmm1 mEChANICAl FIRE & PROPERTY SERvICES2
Total revenue: $375.5 million $282.1 million $87.8 millionEBIT contribution: $17.1 million $16.2 million $4.0 millionEBIT margin: 4.5% 5.8% 4.5%Employees: 1,360 (approx) 1,850 (approx) 410 (approx)
1 Excludes one-off impairment charge (SSR Project)
2 Excludes discontinued operations (Trafalgar)
rEVIEw OF OpErATIONs
THE DIVErsITY OF EArNINGs THrOuGH ITs rANGE OF prODuCTs AND sErVICEs, TArGET sECTOrs AND GEOGrApHICAl FOOTprINT, suppOrTs THE lONG-TErM GrOwTH OF NOrFOlK GrOup.
14 NORFOLK ANNUAL REPORT 2009
For
per
sona
l use
onl
y

Electrical & Communications 45.8%
Mechanical 43.6%
Fire & Property Services 10.6%
Electrical & Communications 50.4%
Mechanical 37.9%
Fire & Property Services 11.7%
EBIT CONTRIBUTION1
REVENUE CONTRIBUTION1
1 Excludes one-off impairment charge and discontinued operations
NORFOLK ANNUAL REPORT 2009 15
For
per
sona
l use
onl
y

Norfolk’s Electrical & Communications division continues to be a market leader in the Australian electrical engineering, contracting and services market.
Through its positioning across key market sectors including transport infrastructure, power generation, water supply, communications, mining and resources, Norfolk Electrical & Communications is well-placed to capitalise on major government and private enterprise projects to expand its revenue base and long-term earnings capacity.
Complementing this positioning is the division’s strong focus on developing the service and maintenance business to deliver a stable, national client base of recurring business.
The Electrical & Communications division includes O’Donnell Griffin, Diverse Data Communications, Newpower Electrical and WF Energy Controls.
Financial results summaryFor the year ending 31 March 2009, the division delivered revenue of $375.5 million (FY2008: $395.1 million) for normalised EBIT of $17.1 million, and an EBIT margin of 4.5 per cent.
The main impacts on financial performance for the period were the decline in economic conditions in New Zealand and the unpredictability of macro-economic conditions in Australia, leading to some contract delays and cancellations.
During the financial year, the company incurred a one-off impairment charge of $13.5 million in relation to a receivable for the SSR Project in Western Australia, which was completed in 2007.
The impairment impacted EBIT for the 2009 financial year, but did not impact Norfolk’s 2009 cash flow or the calculation of bank covenants.
O’Donnell Griffin Rail During the 2009 financial year, O’Donnell Griffin Rail has continued to secure high profile contracts, including a fourth consecutive contract for BHP Billiton’s Rapid Growth Project (RGP4), a rail signalling contract on the Wodonga Rail Bypass project (part of the South Improvement Alliance) and its first international rail contract with ONTRACK, which owns and manages New Zealand’s rail network on behalf of the Government.
In December 2008, O’Donnell Griffin, along with alliance partners Laing O’Rourke and Connell Wagner, signed a contract with Rail Corporation New South Wales (‘RailCorp’) and the New South Wales State Government, for their involvement with the RailCorp Program Alliance project, valued at up to $1 billion (see case study).
rEVIEw OF OpErATIONs
ElECTrICAl & COMMuNICATIONs DIVIsION
16 NORFOLK ANNUAL REPORT 2009
For
per
sona
l use
onl
y

With the anticipated increase in government spending on infrastructure, O’Donnell Griffin Rail is ideally positioned for long-term growth. Further off-shore opportunities are also being targeted for growth.
ResourcesIn spite of the downturn and fall in commodity prices, O’Donnell Griffin has maintained focus on a comprehensive mine-to-market strategy, offering specialist expertise across the transport flow of commodities from the mine to the end market.
This has included a long-term contract for the Dalrymple Bay Coal Terminal Redevelopment near Mackay in Queensland and the successful completion of the OZ Minerals Prominent Hill mine project in South Australia.
In the Pilbara, O’Donnell Griffin has worked with BHP Billiton and recently completed a contract with iron ore producer Fortescue Metal Group.
O’Donnell Griffin in South Australia won the National Electrical & Communications Association (‘NECA’) SA 2008 Award of Excellence in the ‘Industrial Installation’ category and a Certificate of Commendation at the NECA National Awards.
WaterSuccessful completion of the Warragamba Dam Electrical Upgrade and the commencement of the contract work to upgrade the SCADA and Telemetry Control (IICATS) on Sydney Water Corporation’s Illawarra and Prospect water and waste water system cemented O’Donnell Griffin’s key position in the water industry.
In South Australia, O’Donnell Griffin was recently selected by SA Water on a panel of approved providers for electrical works and is the only specialist provider selected in this discipline. The company is also confident of securing considerable works on the Adelaide Desalination Plant project, having assisted the successful consortium achieve that status.
CAsE sTUdy: O’dONNELL GRiffiN dRivEs NOvO RAiL ALLiANCE dURiNG ThE 2009 fiNANCiAL yEAR, O’dONNELL GRiffiN RAiL jOiNEd fORCEs wiTh LAiNG O’ROURkE ANd CONNELL wAGNER TO fORm ThE NOvO RAiL ALLiANCE, TO OffER RAiLCORP A ‘whOLE Of PROjECT’ CAPAbiLiTy iNCLUdiNG iNdUsTRy-LEAdiNG PROGRAm mANAGEmENT, RAiL sysTEm dEsiGN ANd RAiL iNfRAsTRUCTURE dELivERy.
The alliance program will involve the delivery of essential signalling, electrical and track projects over five years, with the option of a further five-year extension. This program will also develop critical technical skills and assist RailCorp with business transformation.
O’Donnell Griffin’s component of the alliance contract is estimated to be worth up to $400 million over the next five years, making it the largest-ever, single contract for the Norfolk Group. O’Donnell Griffin Rail’s Peter Winder was appointed General Manager for the Novo Rail Alliance, working with Dave Howe, General Manager of O’Donnell Griffin Rail, and Francis Dwornik, Engineering Director of O’Donnell Griffin Rail.
NORFOLK ANNUAL REPORT 2009 17
For
per
sona
l use
onl
y

PowerO’Donnell Griffin has maintained an active role in power generation and co-generation, securing a number of key contracts for standby power works and power station upgrades, as well as building relationships with key industry players Origin Energy and Energex.
In Queensland, the company was awarded the Callide B Power Station Control System upgrade contract by CS Energy. O’Donnell Griffin has also successfully completed the first unit shutdown and changeover of the Siemens control system for the Tarong Power Station. The company is delivering this work in consortium with Siemens.
During the year, one of Australia’s largest retailers of residential solar electricity systems, Origin Energy, appointed O’Donnell Griffin to install its new domestic solar energy roof-top panels in New South Wales, Queensland, South Australia and Western Australia.
Field automation supporting National ServiceIt was a strong year for Norfolk Electrical & Communications service and maintenance, with the development of a National Service Team and the adoption of state-of-the-art field automation tools.
Armed with new equipment, technicians are already delivering improved efficiencies through faster customer response times as well as better information management.
Ongoing national service contracts include Optus, Crown Castle, Origin Energy and the Hunter Water Corporation.
Diverse Data Communications In the 2009 financial year Diverse Data Communications began working more closely with O’Donnell Griffin to deliver true technology-driven solutions for customers.
The integrated approach helped Diverse Data secure the INTACT contract for fibre optic network activities across schools and government buildings in the Australian Capital Territory, positioning it well for the ‘National Broadband’ project planned for the coming financial year.
The Norfolk Data Centre Group has gradually transitioned to a design-build-construct-service-manage data centre business in response to new technology, tightening legislation and growing ‘green’ requirements.
According to data from TechTarget, published in 2008, up to 80 per cent of data centres globally could face redundancy issues in the next three to five years. Diverse Data is well positioned to leverage this opportunity.
Newpower Electrical The declining New Zealand economy highlighted inefficiencies in the Newpower Electrical business, resulting in some prudent restructure measures. During the year, a number of branches were downsized or consolidated with other Norfolk businesses to reduce sales and administration costs.
rEVIEw OF OpErATIONsElECTrICAl & COMMuNICATIONs
18 NORFOLK ANNUAL REPORT 2009
For
per
sona
l use
onl
y

With support from O’Donnell Griffin Rail, Newpower secured a three-year contract with ONTRACK for the installation of traction overhead lines. The company also won significant construction contracts with Solid Energy (NZ) in Rotorua and Progressive Supermarkets in Auckland.
WF Energy Controls WF Energy Controls is currently redefining its strategy to ensure its position in the area of energy management and controls for the long term.
During the year, WF Energy Controls has fully automated the class accuracy test set within its National Association of Testing Authorities-accredited laboratory to increase throughput, and developed a new metering current transformer range to meet the new AS60044.1 standard, thereby maintaining its number one position in the Australian market.
WF Energy Controls has also maintained its ‘supplier of choice’ status with the major electricity distribution companies throughout Australia, and successfully maintained its triple AS/NZS certification in Quality, Safety and the Environment.
OutlookThe Norfolk Electrical & Communications division is well positioned for growth through leveraging existing and new opportunities in the transport infrastructure, water, power generation, communications and resources sectors.
With an increased profile and a track record of delivering technically sound projects, O’Donnell Griffin is in a particularly strong position to benefit from state and federal government investment. O’Donnell Griffin is also taking active steps to extend its water industry expertise to other geographies in Australia, building on the capabilities developed through a number of existing and potential projects with Sydney Water.
O’Donnell Griffin’s power generation team is increasing its profile in Victoria and New South Wales and looking to identify new market opportunities on co-generation works in those markets.
The relationship with Origin Energy will expand further in both coverage and scope of work delivered.
The Australian economy will continue to be underpinned by the strength of commodities prices. As global economies begin to improve and the demand for resources returns, we will be well-placed to draw on our deep experience in the resources sector.
The companies within the Norfolk Electrical & Communications division will continue to focus on delivering outstanding technical solutions for customers, and targeting long-term ‘alliance’ contract work; alliance-style activity currently delivers almost 13 per cent of the division’s gross profit.
While the outlook across the board remains positive, the pressure on margins has increased, with costs also being cut on some existing contracts.
rEVIEw OF OpErATIONsElECTrICAl & COMMuNICATIONs
NORFOLK ANNUAL REPORT 2009 19
For
per
sona
l use
onl
y

Norfolk’s Mechanical division has more than 65 branches across Australia, New Zealand, India and more recently, the United Arab Emirates. The division provides a range of services including the design, construction, installation and maintenance of HVAC and refrigeration systems, duct cleaning services, plumbing and pipeline services.
The Mechanical division has a portfolio of leading brands, including Haden, Climatech, Smith Brothers Plumbing, Ductclean, Tempest, Airforce and Airfield (Norfolk Mechanical India) and Haden MEP (UAE).
Haden remains number one in the non-residential Australian HVAC maintenance services market.
Financial results summaryFor the year ending 31 March 2009, the Mechanical division contributed revenue of $282.1 million (FY2008: $260.8 million), for EBIT of $16.2 million and an EBIT margin of 5.8 per cent.
Highlights for the period included year-on-year growth in revenue of 14 per cent by Haden’s service division to $143.6 million.
Impacts on financial performance for the period were the decline in economic conditions in New Zealand and the unpredictability of macro-economic conditions in Australia, particularly in relation to green field construction projects, many of which were delayed.
HadenServiceThe Haden service division delivered a strong result in 2009, due to an ongoing strategy of growing recurring service revenues across the Group, the organic growth of its branch network, and the extreme summer season in the southern states of Australia.
New service contract wins include a project for Visy Pulp & Paper near Wagga Wagga in New South Wales, Serco Sodexo Defence Services in North Queensland, electricity generation company Delta Electricity and global shopping centre giant Westfield.
The acquisition of a small air conditioning service and installation business in Alice Springs early in the financial year has resulted in a maintenance contract with the Department of Planning and Infrastructure.
In Western Australia, Haden extended Norfolk’s relationship with BHP Billiton through a HVAC and refrigeration, preventative maintenance and emergency services contract for the mining operations at Mount Whaleback in Newman. The BHP Billiton contract has justified the establishment of a new Haden branch in Newman.
MECHANICAl DIVIsION
rEVIEw OF OpErATIONs
20 NORFOLK ANNUAL REPORT 2009
For
per
sona
l use
onl
y

Significant growth in service contract revenue was achieved at Haden Wagga Wagga, which was opened as a green field branch in calendar 2008, and at Haden’s recently established branches in Newman and Bunbury, both in Western Australia.
National Key Accounts The strategy of targeting large national and international corporations to build its portfolio of National Key Account (‘NKAs’) service clients has been rewarded in the 2009 financial year with year-on-year growth in revenue of 54 per cent.
Under the NKA structure, Haden offers a competitive edge through the delivery of dedicated, multi-state and multi-site management, and its directly employed team of specialised technicians.
New NKA clients in the period include National Australia Bank, Caltex, David Jones, and both Ericsson and IBM as a result of the Strategic Alliance Program signed with Jones Lang LaSalle in 2008 to provide services across Asia-Pacific and India.
Haden has taken a ‘client-led’ approach in developing its portfolio of NKAs and will continue to target large, national and international corporations, with mission-critical operations and specialised service needs.
A key part of Norfolk Mechanical’s expansion strategy is to continue to identify ‘geographical gaps’ and strengthen its position where there is a clear demand for its services.
CAsE sTUdy: hAdEN bUiLdiNG A hEALThy REPUTATiON iN ThE 2009 fiNANCiAL yEAR, hAdEN wAs APPOiNTEd As ThE mEChANiCAL sERviCEs PROvidER fOR ThE hEdLANd REGiONAL REsOURCE CENTRE; A $138 miLLiON dEvELOPmENT TO REPLACE ThE PORT hEdLANd hOsPiTAL iN wEsTERN AUsTRALiA. ThE PROjECT is dUE fOR COmPLETiON iN 2010.
In recent times, Haden completed the HVAC design and construct project for the Newcastle Mater Misericordiae Hospital in NSW, boosting its profile as a mechanical services provider in the healthcare sector.
Haden’s experience also includes a project for Geelong Hospital – Accident & Emergency and Epworth Hospital (Richmond), both in Victoria.
NORFOLK ANNUAL REPORT 2009 21
For
per
sona
l use
onl
y

rEVIEw OF OpErATIONsMECHANICAl
Construction Haden’s construction business endured difficult trading conditions as the global financial environment declined, creating a drag on the commercial construction sector and leading to a number of project delays.
However, significant wins for the period include the Bovis Lend Lease 420 George Street Project, a 4.5 Star ABGR (NABERS) premium commercial grade A office tower in the heart of the Sydney CBD, and the Hedland Regional Resource Centre Project to replace the existing health campus in Port Hedland, Western Australia, supporting Haden’s strategy of targeting government-funded projects.
Haden was also successful in winning the construction component of the William McCormack Place Stage 2, a 5 Star ABGR (NABERS) grade A commercial office tower in the regional city of Cairns, Far North Queensland. Haden’s role in the new Cairns Domestic Airport, working with Hansen Yuncken, is expected to be completed by the end of calendar 2009.
Haden was selected by the University of Queensland to deliver the mechanical air conditioning upgrade works to the Chemical Engineering and Hawkins Building, and Haden’s New South Wales business has received a letter of intent for the government-backed Macquarie University Library Project, working with builders AW Edwards.
Other construction projects for the year include a CSIRO Laboratory and the 6 Mort Street Project, both in Canberra, the panda enclosure at the Adelaide Zoo, and the Hindmarsh Church Office Building and Building 3, also in Adelaide.
During the year, George Komorowski was appointed General Manager – Haden Construction. George has worked for Haden for over 25 years and brings a wealth of experience to the role.
Climatech Climatech made the strategic decision to secure lower margin construction projects in New Zealand in order to retain market share during that country’s deep economic recession. While revenue stayed flat for the year, the EBIT margin was significantly impacted by tough economic conditions which created more competitive conditions and tighter margins.
Notwithstanding the difficult trading conditions, Climatech secured some high profile contracts including the Christchurch Civic Offices, working with Hawkins Construction Ltd, the Hastings Court House (Ministry of Justice, New Zealand), the Countdown Supermarket in Milford (Progressive Enterprises) and the New World Supermarket in Morrinsville (Stanley Construction).
Through its agreement with Cylon Controls for building management systems and supporting its focus on delivering environmentally sustainable solutions for customers, Climatech secured projects with Maori Television and Air New Zealand.
22 NORFOLK ANNUAL REPORT 2009
For
per
sona
l use
onl
y

rEVIEw OF OpErATIONsMECHANICAl
Smith Brothers Plumbing The challenging economic environment leading to a decline in construction opportunities impacted growth of Smith Brothers Plumbing in South Australia. However, increased demand for the Pipeline Technology Services business led to the investment in another Jet Vac unit, and has enabled the expansion of this business in the Australian Capital Territory and New South Wales.
Smith Brothers Plumbing expects to expand the Pipeline Technology Services business into another metropolitan market in the 2010 financial year.
TempestThe lower cost, ease of installation HVAC modular system alternative offered by Tempest led to strong growth in the 2009 financial year, including the securing of a contract with Credit Corporation in Papua New Guinea.
The diversification of its client base, the expansion into new markets and the introduction of new products including ‘flat pack’ systems have delivered a high growth trajectory for Tempest. The Plaza at Palmerston North in New Zealand is a major project for Tempest and requests for design and build projects are increasing.
Norfolk Mechanical India During the year, Norfolk Mechanical India – operating under the Airforce and Airfield brands – expanded operations from 11 to 20 branches, delivering an approximately 33 per cent increase in revenue.
The service division secured strong contract wins with a number of blue-chip customers, including IBM (through the Jones Lang LaSalle agreement), Citibank, Shopper’s Stop, Honeywell Technology Solutions and Knight Frank.
Haden MEP (UAE) During the year, Norfolk Group signed a joint venture with Abu Dhabi-based investment company Novus Capital for the delivery of MEP services.
The JV will better enable Norfolk Group to leverage opportunities within the construction sector in the United Arab Emirates (‘UAE’). The conservative approach into the UAE is consistent with Norfolk’s expansion in India. The company has established a local team and branch, and is actively bidding for maintenance and construction opportunities.
Outlook The outlook for the Norfolk Mechanical division is positive, through an ongoing focus of building recurring service revenue and growing the portfolio of NKAs. A recovery in the Australian construction market, including major government works to come out of the recently announced stimulus packages, bodes well for Haden, which has executed a dedicated marketing campaign to target the ‘Building the Education Revolution’ investment.
Anticipated improvements in operations in New Zealand through a reduction in fixed costs, consolidation of businesses and signs of a gradually improving economy should deliver stronger returns in the coming year.
An ongoing dedication to customer retention and expansion through Haden’s customer symposium program will insulate the business during further economic uncertainty over the 2010 financial year.
NORFOLK ANNUAL REPORT 2009 23
For
per
sona
l use
onl
y

The Fire & Property Services division includes Norfolk’s property services and building products businesses. Companies within the division include Resolve FM, Metalbilt, NZ Fire Doors, Danks Roller Doors and Energy Products International.
The property services businesses include the coordination and delivery of a range of services, including:
integrated facilities management �
operational and sustainable maintenance �
asset management �
workplace solutions �
support services �
call centre capabilities. �
Norfolk Building Products includes the manufacture, distribution and installation of the following products:
roller shutter doors and grilles �
sectional overhead and bi-fold doors �
fire-rated roller shutters and sliding doors, �fire and smoke curtains
fire-rated and non-rated doors, including �E-Core® fire doors
heating and cooling, and air filtration systems. �
Financial results summaryFor the year ending 31 March 2009, excluding discontinued operations, the division delivered revenue of $87.8 million (FY2008: $88.9 million), for EBIT of $4.0 million and an EBIT margin of 4.5 per cent.
The main impacts on financial performance for the period were the rapid decline in the New Zealand economy, and the general unpredictability of macro-economic conditions in Australia.
Resolve FM Despite the declining economic conditions, Resolve FM recorded a solid performance in the 2009 financial year. Of particular note was the winning of a number of high quality new contracts with the University of Wollongong (New South Wales) for its Innovation Campus, Ford Motor Company, Australian Air Express, KPMG, Mercedes and the Department of Immigration and Citizenship’s (‘DIAC’s’) detention centre on Christmas Island.
Resolve FM also continues to work with General Motors Holden, DIAC – including their detention and transit centres, South Windsor Correctional Centre (New South Wales), American Express, Credit Suisse, the Department of Human Services (Victoria) and the Department of Housing (HomesWest) in Western Australia.
rEVIEw OF OpErATIONs
FIrE & prOpErTY sErVICEs DIVIsION
CAsE sTUdy: mETALbiLT ON ThE bACk Of UPGRAdE wORk AT Ami sTAdiUm iN ChRisTChURCh AhEAd Of ThE 2011 RUGby wORLd CUP, mETALbiLT hAs dEvELOPEd ANd TEsTEd iTs OwN fiRE RATEd ROLLER dOOR sysTEm.
The Fyreshield™ roller door system was tested and approved by a recognised authority in Wellington and Metalbilt is now well-placed to secure further stadium upgrade work ahead of the World Cup.
24 NORFOLK ANNUAL REPORT 2009
For
per
sona
l use
onl
y

Resolve FM has actively positioned itself in the market to deliver outstanding technical solutions for its customers and throughout the year maintained its focus on the commercial property, tertiary education, industrial and automotive, custodial and accommodation services, defence and health sectors.
During the year Resolve FM had the opportunity to bid for its first Public-Private Partnership (‘PPP’) project in corrective services. Going forward, the company expects further PPP opportunities to eventuate within its areas of focus, contributing to a solid base of long-term contracts.
In the second half of the year, Resolve FM stepped up its call centre activities with increased technical capabilities to deliver tailored call centre solutions. Since then, calls handled through the centre have increased from 2,000 to 20,000 calls per month.
Resolve FM has revised the structure of the company into regions to better reflect the needs of customers and considerable emphasis has been placed on business development initiatives that will flow into 2010. The company will continue to consider strong-margin, national and international opportunities on the back of existing customer relationships.
Following the tragedy of the bushfires in Victoria, Resolve FM carried out a number of refurbishments of caravans to be used as temporary accommodation for bushfire survivors, on behalf of the Department of Human Services.
The outlook for the facilities management sector is promising, with flow-through of government stimulus packages expected to positively impact accommodation upgrade activities and with the tightening economy driving a higher focus on cost reductions. Specialist facility management companies, like Resolve FM, can bring the necessary expertise to deliver cost reductions through strategic outsourcing.
Through its commitment to key sectors – commercial property, tertiary education, industrial and automotive, custodial and corrective services, defence and health – and an increased focus on the delivery of technical solutions for clients, Resolve FM is looking forward to achieving further growth.
CAsE sTUdy: REsOLvE fm ThE UNivERsiTy Of wOLLONGONG (UOw), ONE Of AUsTRALiA’s LEAdiNG UNivERsiTiEs, hAs EsTAbLishEd A NEw CAmPUs CALLEd ThE iNNOvATiON CAmPUs (iC). ThE iC wiLL hOUsE UOw REsEARCh bUiLdiNGs ANd sOmE (PRivATELy OwNEd) COmmERCiAL bUiLdiNGs, ALL sPECifiCALLy dEsiGNEd TO ATTRACT LEAdiNG ORGANisATiONs TO ENGAGE wiTh ThE UNivERsiTy ANd ThE OThER CO-LOCATEd bUsiNEssEs.
Resolve FM won the facility management of the iC on its ability to provide solutions and meet the objectives the university required for such a unique environment. The campus presently has three new purpose-built buildings for research and commercial tenants, with a new research building currently being constructed and a new commercial building in design phase.
NORFOLK ANNUAL REPORT 2009 25
For
per
sona
l use
onl
y

Building Products Australia Due to the impending expiry of the property lease at its Brookvale, New South Wales manufacturing plant and head office in March 2009, Trafalgar Building Products undertook a total review of its business.
The review, which began in late October 2008, concluded that the relocation costs and necessary reinvestment in plant and equipment would not meet acceptable return on investment criteria. Consequently, the decision was made to restructure and/or divest all or parts of the business.
The first stage of this process involved the closure of the fire door and E-Core® core manufacturing businesses at Brookvale and the sale of the frame assembly and fire door distribution business in Victoria, reducing headcount by 75 per cent. At the same time, Trafalgar outsourced E-Core® core manufacture to offshore suppliers.
Stage two of the restructure/divestment involved separate sale transactions for the passive fire protection products distribution business and the E-Core® door system business. While in process at the financial year end, these transactions were ultimately completed to the satisfaction of the company post financial year end.
New ZealandThe solid result of Norfolk’s Building Products’ companies in New Zealand was largely attributable to strong sales performances by Energy Products International (‘EPI’) and Metalbilt Doors, and a keen focus on cost management across all companies.
EPI saw strong demand for its air handling units, boilers, radiators and chillers in a number of infrastructure areas including education, hospitals and airports, and a number of government buildings. Key customers and projects during the year included The No. 1 Featherston Street building in Wellington, Braemar, Waikato, Wairau and Hutt Hospitals, Rotorua Court buildings, Auckland Airport, the National Archives, University of Canterbury Biological Science, Vogel Integrated Campus, Fonterra and Weta Digital.
The strength of Metalbilt’s existing customer base and its backlog of work – including Fletcher Construction, Hawkins Construction, Mainzeal Property & Construction, Brookfield-Multiplex, Ebert Construction, Calder Stewart, Hayden & Rollett and Bridgestone – was instrumental in the attraction of high-quality installation and service projects in a broad range of market sectors, with particular emphasis on education, hospitals, industry, food distribution and processing and airports.
With its new Fyreshield™ fire rated roller door system, Metalbilt secured the installation contract for the AMI Stadium upgrade in Christchurch in the lead-up to the 2011 Rugby World Cup, and has secured a service contract with Kmart across its New Zealand stores. More recently, Metalbilt has secured contracts with Eden Park Stadium in Auckland and the New Zealand Defence Force.
Both NZ Fire Doors and Danks Roller Doors experienced difficult conditions due to a fall in construction and industrial developments in New Zealand. Despite the challenges, NZ Fire Doors secured projects with the Britomart Transport Centre in Auckland and a number of universities and hospitals.
Research and development activities that commenced in mid-2008 are expected to flow through to sales opportunities as the market recovers. The focus on innovation has already resulted in Metalbilt’s development of the only New Zealand designed, tested and manufactured range of fire rated, roller shutter door systems (‘Fyreshield™’).
Although uncertain economic conditions prevail, Norfolk Building Products will maintain its focus on infrastructure projects and commercial construction with fire protection needs (i.e. sports stadiums), secondary and tertiary education, airports, hospitals and public buildings.
The door businesses will also focus on building their earnings through the delivery of recurring service and maintenance work.
rEVIEw OF OpErATIONsFIrE & prOpErTY sErVICEs
26 NORFOLK ANNUAL REPORT 2009
For
per
sona
l use
onl
y

HsEC rEpOrT
During the year, Norfolk Group has maintained its focus on improving safety performance through the continuation of the Safety All Ways program. The Norfolk Senior Management Team reaffirms its commitment to developing a strong and sustainable safety culture across the Group at all levels. Safety performance is linked to the short-term incentive plans of all employees of Norfolk Group, including senior management.
Key highlightsEighty of our sites and major contracts have achieved 12 months Lost Time Injury (LTI) free during the financial year. Of the Norfolk Group’s 143 sites in Australia and New Zealand, 45 per cent have recorded no injuries in the last 12 months.
The Group achieved the ambitious target of a 20 per cent reduction in Total Recordable Injury Frequency Rate (‘TRIFR’) year-on-year. This is a significant achievement and demonstrates both management and employee commitment to maintaining a safe work environment and prevention of injuries.
The Norfolk Group is moving towards all of its businesses being accredited to the following safety standards: AS/NZS 4801:2001, AS/NZS ISO 14001:2004 and AS/NZS 19001:2000. This will provide the company with recognised compliant and standardised systems and processes that support our business model.
In 2008 The Brief Group was engaged to conduct an audit of Norfolk sites for the purpose of providing recommendations for improvement. The report confirmed a number of previously identified improvement areas and recommendations for future safety initiatives. A safety committee was established to review the audit recommendations and implement prioritised initiatives.
Norfolk has reduced workers compensation costs by reducing the number of incidents and subsequent claims compared to the previous year. The 2008–09 year has reported a 32 per cent reduction in claims cost on the prior year. Despite an increase in wages nationally across the Group, there has been a reduction in premium payments of approximately 1.3 per cent on the 2007–08 year and 3.0 per cent on the 2006–07 period.
HEAlTH sAFETY ENVIrONMENT & COMMuNITY (HsEC) rEpOrT
NORFOLK ANNUAL REPORT 2009 27
For
per
sona
l use
onl
y

Norfolk has experienced a significant reduction in claims lodged over the reported period. Claims numbers have been reduced from 302 in the 2006–07 year, to just 188 in 2008–09. This considerable improvement has primarily been driven by the three states of Western Australia, Victoria and Queensland, with Western Australia experiencing a decrease of 64 per cent in claim numbers since 2006–07.
Initiatives for the forward yearA number of initiatives have been planned for implementation in the coming year to continue the improvement in safety performance. These include:
The development of an online safety induction �program to ensure compliance to Norfolk safety standards and policies. This online training program allows new employees and contractors to complete the program in a flexible learning environment via the internet or intranet system.
Standardised Toolbox Safety Talks which focus �key safety messages and activities that are based on specific safety initiatives or incidents that have been identified through incident investigations and analysis of injury data. Toolbox Safety Talks are an important method for delivering key safety messages and reaching all employees at all levels of the business.
Online incident reporting will improve reporting �of all incidents including ‘near hit’ reporting through ‘real time’ reporting. Greater analysis of incident data will provide opportunities to target emerging incident trends and focus on mitigating workplace risks.
Manager and supervisor safety training across �the Group has been identified as a key area for strengthening our safety culture. This training will provide managers and supervisors with the skills and information to continually drive the Safety All Ways message.
The 2010 financial year provides Norfolk Group with an opportunity to further improve its safety systems and processes and most importantly its safety performance. The company is targeting a further 20 per cent reduction in the TRIFR for the coming year. Norfolk will continue to take the health and safety of its people very seriously, at all levels of the business.
HsEC rEpOrT
28 NORFOLK ANNUAL REPORT 2009
For
per
sona
l use
onl
y

COrpOrATE GOVErNANCE sTATEMENT
The Australian Securities Exchange Listing Rules require companies to disclose the extent to which they have complied with the best practice recommendations of the ASX Corporate Governance Council (the ‘ASX Council’) – the Corporate Governance Principles and Recommendations and accordingly, in accordance with ASX Listing Rule 4.10.3, Norfolk Group Limited will disclose when it has not adhered to any of the recommendations.
Norfolk’s Board Charter and Corporate Governance Statement as well as its Statement of Corporate Governance are available on the Company website (www.norfolkgl.com). The Board Charter and Corporate Governance Statement set out many aspects of the Company’s governance including Board and Committee composition and responsibilities and their charters, appointment of directors, and policies on corporate conduct, securities trading, performance reviews, continuous disclosure and shareholder communications.
Foundations for management and oversightThe Board has the overall responsibility to shareholders for all governance matters of the Group. The Board remains primarily responsible for the strategic direction and financial performance of Norfolk Group, while delegating the responsibilities of management to the Managing Director and the senior management team.
The Board aims to fulfil its responsibilities by creating value for all stakeholders that is sustainable and beneficial. Stakeholders include shareholders, employees, customers, the community and the environment. The Board adopted a Charter that includes, among other items, the specific roles and responsibilities of the Board. Without limiting the Board’s function, its specific responsibilities include:
Approving objectives, strategies and financial plans and monitoring the Company’s performance against �these plans;
Appointing the Managing Director and reviewing his performance and remuneration; �
Monitoring compliance with the regulatory requirements, and ensuring all Norfolk Group employees act �with integrity and diligence in the interests of the Company and stakeholders; and
Reviewing and approving all significant policies and procedures across the Group. �
Board structureAs at 31 March 2009, the Board was comprised of five directors, three of whom were independent directors.
Name and qualifications Position Term in office
Peter Abery Non-executive director Appointed 31 May 2007Glenn Wallace Managing Director Appointed 31 May 2007Paul Chrystall Non-executive director Appointed 31 May 2007Rodney Keller Chairman Appointed 31 May 2007Peter Lowe Non-executive director Appointed 8 April 2008
Each director is required to disclose any interest which might create a potential conflict of interest with the director’s duties as a director of Norfolk Group Limited or which would affect the director’s independence.
Directors are appointed in accordance with the Constitution of Norfolk Group Limited and are re-elected to that position by shareholders every three years.
The Company supports the appointment of directors who bring a wide range of business and professional skills and experience, details of which are recorded in the Directors’ Report.
The Board has reviewed the position of all current directors in light of the Company’s adopted definition of independence. This definition is consistent with the guidelines provided by the ASX Council. The Board will continue to monitor compliance with those guidelines but notes that currently no director has any external business relationship with the company.
Director Capacity Position Office held from
Rodney Keller Non-Executive Independent 31 May 2007Glenn Wallace Executive Not independent 31 May 2007Peter Abery Non-Executive Independent 31 May 2007Paul Chrystall Non-Executive Not independent 31 May 2007Peter Lowe Non-Executive Independent 8 April 2008
NORFOLK ANNUAL REPORT 2009 29
For
per
sona
l use
onl
y

COrpOrATE GOVErNANCE sTATEMENT
Chairman and Managing DirectorThe Chairman is responsible for leading the Board, ensuring directors are properly briefed in all matters relevant to their role and responsibilities, facilitating Board discussions and managing the Board’s relationship with the company senior executives.
The Managing Director is responsible for implementing Norfolk Group strategies and policies.
The Board Charter specifies that these are separate roles to be undertaken by separate people and specific responsibilities are delegated to the Managing Director and senior management under the Delegation of Authority put in place by the Board.
Independent professional adviceNon-executive directors have the right to seek independent professional advice in the furtherance of their duties as directors at the Company’s expense. The Chairman’s prior approval of any expenditure is required; however, this will not be unreasonably withheld.
Performance of Chairman and directorsThe full Board is responsible for reviewing the performance of the Chairman. It is the responsibility of the Chairman, with advice from the Board and the Nomination and Remuneration Committee, to assess the performance of the Board, its committees, each of the directors and senior executives. The Board has a formal performance review process which involves open and constructive dialogue between the respective parties, taking into account the objectives and measurable results that have been achieved.
The performance of the Managing Director is reviewed annually by the Chairman and non-executive directors. The performance of other key executives is reviewed annually by the Managing Director against predetermined goals and criteria and then is also reviewed by the Nomination and Remuneration Committee and, if required, the Board.
The Board has had an ongoing process for the regular self-assessment and review of the performance of the Board and towards the end of the financial year, established and implemented a more formal process comprising the completion of a detailed questionnaire by directors for consideration by the Chairman and discussion with the Board. It is proposed that in the 2010 financial year the Board will establish and implement processes for the evaluation of the performance of the Audit and Risk Committee and the Nomination and Remuneration Committee as well as the individual directors.
Board committee structureThe Board’s function is to address issues in its broadest context. It is through the committee structure that specific areas of detail are examined.
Currently there are two committees in place:
Audit and Risk Committee �
Nomination and Remuneration Committee. �
Audit and Risk CommitteeThe Company established an Audit and Risk Committee which is comprised of only non-executive directors, the majority of whom are independent.
This Committee was chaired by Deborah O’Toole (non-executive director) until 22 May 2008 when she stepped down and was replaced by Peter Lowe (non-executive director). This Committee includes Paul Chrystall and Peter Abery. Rod Keller stepped down from being a member of the Committee with effect from 29 April 2008 when Peter Abery and Peter Lowe were appointed. The Committee is responsible for risk management and oversight of Norfolk Group’s financial reporting policies and other operational risk areas.
Furthermore, the Committee monitors the internal controls and the integrity of Norfolk Group’s financial statements in compliance with the regulatory requirements. The Committee is also responsible for the appointment, evaluation and oversight of the external auditor, and ensuring that the independence of the external assurance function is maintained.
The Committee’s Charter sets out that membership will only comprise non-executive directors, the majority of whom will be independent. The Committee shall appoint a Chairman who is not the Chairman of the Board. The Committee shall comprise a minimum of two members and shall include at least one member who is a ‘financial expert’ as defined by the Board.
The Committee, together with executives, has established a process for the identification, review and management of significant risks across the Group. Having considered Norfolk Group’s risk profile and the sufficiency of the risk management policies across Norfolk Group, the Committee recommended to the Board to defer the definition and establishment of a formal internal audit function, subject to ongoing review. The risk management framework has been implemented and continues to be refined, and as part of that process the Board has received a report from the Managing Director and senior management as to the effectiveness of the Company’s existing management of its significant business risks.
The Committee and the Board acknowledge that the integrity of Norfolk Group’s financial reporting depends upon the existence of a sound system of risk oversight and management and internal controls. The Committee and the Board receive appropriate sign-off from the Managing Director and the Chief Financial Officer in this regard.
30 NORFOLK ANNUAL REPORT 2009
For
per
sona
l use
onl
y

COrpOrATE GOVErNANCE sTATEMENT
Nomination and Remuneration CommitteeThe Nomination and Remuneration Committee is chaired by Peter Abery (non-executive director) with two other members, Peter Lowe (non-executive director) and Glenn Wallace (Managing Director). Rod Keller stepped down from being a member of the Committee with effect from 29 April 2008 when Glenn Wallace and Peter Lowe were appointed. The Committee is responsible, among other things, for making recommendations to the Board with respect to the Company’s compensation policies, including equity-based programs. This Committee is also responsible for making recommendations to the Board for identifying individuals suitably qualified to become Board members. The Committee comprises a majority of independent directors.
The Committee reviews, considers and evaluates the remuneration and performance of executive directors and senior management. The Managing Director reviews senior management performance against performance standards, position requirements, key personal targets and development plans and reports to the Committee. This report is considered by the Committee as part of the Committee’s review of remuneration and performance.
External auditorsNorfolk Group’s policy requires Norfolk Group to appoint external auditors who clearly demonstrate quality and independence. The performance of the external auditor is reviewed annually and applications for tender of external audit services are requested as deemed appropriate, taking into consideration assessment of performance, existing value and tender costs. PricewaterhouseCoopers was appointed as the external auditor in 2007. It is PricewaterhouseCoopers’ policy to rotate audit engagement partners on listed companies at least every five years.
An analysis of fees paid to the external auditor is provided in the directors’ report and in note 29 to the financial statements. It is the policy of the external auditors to provide an annual declaration of their independence and an independent auditor’s report.
The external auditors will attend the annual general meeting and be available to answer shareholder questions about the conduct of the audit and the preparation and content of the audit report.
Policies and proceduresA summary of the Company’s key policies and procedures is provided below.
Code of conductThese policies (articulated in the Board Charter and Corporate Governance Statement) set out the ethical standards that govern the conduct of all directors and employees. The Company recognises the interests of all stakeholders in the community and their role in creating shareholder value.
All directors and employees are required, at all times, to conduct themselves in a manner consistent with the principles of honesty and integrity.
The Code requires directors and employees, among other things, to comply with the law, to disclose relevant interests that they may have and to act in the best interests of the Company. The Code also covers confidentiality of information and respect of privacy.
Continuous Disclosure Policy and External Communication Policy The Company recognises the importance of timely disclosure of the Company’s activities to shareholders and the market, in accordance with the legal and regulatory obligations. This policy (articulated in the Board Charter and Corporate Governance Statement) sets out the principles that guide the Company in fulfilling its responsibilities to act with integrity to satisfy the disclosure and effective communication requirements of the Australian Securities Exchange (‘ASX’) and the Corporations Act.
The policy requires that once information is disclosed to the ASX, it should also be made available on the Company’s website.
Securities Trading PolicyThis policy (articulated in the Board Charter and Corporate Governance Statement) provides guidance to all directors, officers and staff dealing in Norfolk Group Limited securities.
During the year, the Board amended the Board Charter and Corporate Governance Statement to include a revised Securities Trading Policy in order to reinforce the prohibition on trading by any director or employee who is aware of unpublished price sensitive information about the Company (insider trading) in addition to the existing prohibition on designated persons trading during blackout periods. The revised Securities Trading Policy also requires the disclosure to the Board of any margin loan arrangements by directors and key members of management and establishes a clear policy regarding managing exposure to fluctuations in price in relation to the Company’s securities under any equity-based component by key members of management.
Significant accounting policies Details of significant accounting policies are set out in note 1 to this financial report.
Publicly available informationThe ASX Council best practice recommendations provide that specific documents should be made publicly available, ideally on the Company’s website. The Company has an existing policy for communication with shareholders and undertakes to update its website on a regular basis to provide all material announcements and information. In addition, the Company attempts to respond to shareholder queries as soon as possible when such queries are raised.
NORFOLK ANNUAL REPORT 2009 31
For
per
sona
l use
onl
y

The directors have pleasure in submitting the financial report of the consolidated group consisting of Norfolk Group Limited and the companies it controlled during the year ended 31 March 2009 (‘Norfolk Group’). In order to comply with the provisions of the Corporations Act 2001, the directors report as follows.
DirectorsThe following persons, unless otherwise stated, were directors of Norfolk Group Limited during or since the end of the financial period:
Peter Abery Paul Chrystall Glenn Wallace – Managing DirectorRodney Keller – ChairmanPeter Lowe (appointed 8 April 2008)Deborah O’Toole (resigned 24 July 2008)
Details of the members of the Board, their experience, qualifications and special responsibilities are set out below.
Principal activitiesThe principal activities of the Norfolk Group during the financial year ended 31 March 2009 were to provide integrated electrical communications, HVAC, passive fire protection and property services and products.
The Norfolk Group has operations in Australia, New Zealand, India and the UAE.
Dividends – Norfolk Group LimitedDuring the financial year Norfolk Group Limited made payments of fully franked dividends as follows:
5.7 cents per fully paid share, paid on 29 July 2008 �
2 cents per fully paid share, paid on 29 January 2009. �
The total amount paid in dividends during the financial year was $10,010,000.
Review of operationsThe profit for the Norfolk Group after providing for income tax and minority interests amounted to $4,335,000.
For the review of operations please refer to the Chairman’s report, the Managing Director’s report and the Review of Operations sections of this annual report.
Significant changes in the state of affairsDuring the financial year there were no significant changes in the state of affairs of Norfolk Group other than those referred to in the financial statements or notes in this annual report.
Subsequent eventsOn 7 May 2009, agreement was reached with the Group’s bank financiers that the impairment of the SSR Project receivable would not be included within the calculation of the financial covenants that form part of the Group’s major bank loan and overdraft facility agreement (‘Facility Agreement’). The agreement reached on 7 May 2009 contains some undertakings which are in the process of being formally documented into the Facility Agreement.
As this agreement was not reached prior to 31 March 2009, borrowings under the bank facility are shown as current liabilities in the balance sheet.
The bank overdraft facility is a $20,000,000 facility which may be drawn at any time and is subject to annual review. At balance date $nil was utilised (2008: $nil). The bank loan facility is a $90,000,000 facility which may be drawn at any time in either Australian or New Zealand dollars and has a term ending in July 2010. At balance date $60,833,000 was utilised (2008: $62,443,000).
No other matter or circumstance has arisen since 31 March 2009 that has significantly affected, or may significantly affect, the consolidated entity’s operations in future financial years, the results of those operations in future financial years, or the consolidated entity’s state of affairs in future financial years.
Likely developments and expected results of operationsPlease refer to the Chairman’s report and the Managing Director’s report. The directors have not included any further information on the likely developments or expected future results of the operations of Norfolk Group as the directors have reasonable grounds to believe that the inclusion of such information would result in unreasonable prejudice to Norfolk Group.
Environmental regulationNorfolk Group is subject to a range of environmental regulations and continually looks at ways to reduce its impact on the environment and improve its environmental performance. During the financial year there were no environmental incidents which required reporting.
Company SecretaryThe Company Secretary of Norfolk Group Limited during the financial year was Paul Jeffares BA (Hons), LLB, MBA and Fellow of the Chartered Institute of Secretaries. Paul was appointed to the position of Company Secretary on 28 September 2007 and resigned from the position on 9 April 2009. Before joining Norfolk Group Limited, Paul had held general counsel positions with AGL, Duke Energy International and National Australia Bank, as well as being a partner at law firms Ebsworth & Ebsworth and Gadens.
Fiona Lovell was appointed Company Secretary of Norfolk Group Limited from 9 April 2009. Fiona holds a Bachelor of Arts, Bachelor of Laws (Hons), Grad Dip in Applied Finance and Investments and Grad Dip in International Law.
Directors’ and officers’ insuranceDuring the financial year, Norfolk Group paid a premium in respect of a contract to insure the directors and officers of Norfolk Group against liabilities incurred in acting as a director or officer to the extent permitted by the Corporations Act 2001. The contract of insurance prohibits disclosure of the nature of liability and the amount of the premium.
DIrECTOrs’ rEpOrT
32 NORFOLK ANNUAL REPORT 2009
For
per
sona
l use
onl
y

Norfolk Group has also entered into a Deed of Access and Indemnity with each of the directors. Pursuant to the Deed the Company indemnifies, to the extent permitted by law, each director for any loss or liability incurred by the director:
as a director of Norfolk Group Limited or of a related body corporate of Norfolk Group Limited; or �
as a result of facts or circumstances relating to the director’s service as a director of Norfolk Group Limited �or a related body corporate of Norfolk Group Limited.
Information on directorsRodney Keller – Chairman – Independent Non-Executive Director
Educational qualifications Rod Keller has a Bachelor of Engineering (Mechanical) from the University of Sydney and is a Fellow of the Institute of Engineers, Australia.
Experience and expertise Rod brings over 36 years’ experience in the engineering sector and has previously held management positions with Fletcher Construction Australia, the State Government of South Australia, Esso Australia, Woodside Petroleum and Santos and was Managing Director of GPU International Australia from 1995 to 1999. Rod became Chairman on 7 April 2008.
Other current directorships Rod is currently a non-executive director of Macquarie Communications Infrastructure Limited and Macquarie Communications Infrastructure Management Limited.
Former directorships in last three years
He was Chairman of the GasNet Australia Group from its listing in 2000 to its takeover in 2006 and was a non-executive director of Dyno Nobel Limited.
Special responsibilities Chairman of the Board of Directors and until 29 April 2008 member of the Audit and Risk Committee and the Nomination and Remuneration Committee.
Interest in shares and options 25,000 held by Rodney Keller and Dianne Keller as trustees for the Keller Superannuation Fund.
Glenn Wallace – Managing Director – Executive Director
Educational qualifications Glenn Wallace has a Diploma in Leadership Management from the Macquarie Business School, and completed the Advanced Management Program at the University of Hawaii in 1996. He is a NSW Council member in the Australian Industry Group and is a Member of the Australian Institute of Company Directors.
Experience and expertise Glenn is the Managing Director of Norfolk and was appointed to the role in 2004, following his role in the successful acquisition of the businesses now forming Norfolk.
With more than 16 years’ experience in management roles in both New Zealand and Australia, Glenn works with other members of management to develop the strategy and business development tactics for Norfolk. Prior to joining Norfolk, Glenn held a number of senior roles including Managing Director of Tyco, having held various roles within Tyco since joining the company as National Sales Manager in 1987, and Managing Director of the Tiri Group from 2003.
Other current directorships Maui Capital Limited.
Former directorships in last three years
Nil.
Special responsibilities Managing Director and member of the Nomination and Remuneration Committee.
Interest in shares and options 2,600,000 held by Henson Limited.
DIrECTOrs’ rEpOrT
NORFOLK ANNUAL REPORT 2009 33
For
per
sona
l use
onl
y

Peter Abery – Independent Non-Executive Director
Educational qualifications Peter Abery holds a Bachelor and a Masters degree in Engineering (Electrical Engineering) from the University of Natal and a Masters of Business Administration from the University of South Africa. He is a Member of the Australian Institute of Company Directors, a Member of the Institute of Engineering and Technology (London) and a Member of the Chartered Institute of Management (United Kingdom). He is also a graduate of the Harvard Business School’s International Senior Managers Program.
Experience and expertise Peter has a strong understanding of the industries in which Norfolk operates gained through many years of working in the engineering and related sectors. Peter is currently a director of Nomad Building Solutions and pieNetworks, and previously was a director and Chairman of Digital Television Services (a joint venture in the United Kingdom between BSkyB, the BBC and Crown Castle) and a non-executive director of National Grid Australia (Basslink Limited).
Peter has previously been Chief Executive Officer or Managing Director of a number of Australian and English companies including HPM Industries, National Grid Wireless (formerly Crown Castle UK), Crown Castle Australia, Vodafone Network and QPSX Communications, and has held senior management positions with Telstra Corporation and AWA.
Other current directorships Director of Nomad Building Solutions Limited and pieNetworks Limited.
Director of unlisted company Salter Australia Holdings Pty Ltd.
Former directorships in last three years
Basslink Limited (formerly National Grid Australia Limited).
Special responsibilities Chairman of the Nomination and Remuneration Committee and member of the Audit and Risk Committee.
Interest in shares and options 50,000 shares held by Peter Abery directly and 50,000 shares held by Yreba Investments Pty Ltd ATF the Yreba Investments Superannuation Fund.
Paul Chrystall – Non-Independent Non-Executive Director
Educational qualifications Paul Chrystall holds a Bachelor of Commerce from the University of Auckland, during the completion of which he received various senior prizes, including the Alfred P Foggarty Award for excellence in Economics.
Experience and expertise Paul is currently Managing Director of Maui Capital Limited, a private equity firm with an Australasian mandate, and has been a director of Norfolk since 2004. He was, until September 2007, the Head of Private Equity at Goldman Sachs JBWere (NZ) Limited and prior to joining Goldman Sachs JBWere (NZ) Limited in April 2001, Paul held a number of senior corporate finance roles in a variety of industries.
Other current directorships Maui Capital Limited.
Maui Capital Indigo Fund Limited and subsidiaries.
Maui Capital Indigo General Partnership Limited.
Sea + City Projects Limited.
Former directorships in last three years
Paul was the Principal Executive and Managing Director of each of the Hauraki Private Equity No. 1 Fund and the Hauraki Private Equity No. 2 Fund Limited managed by JBWere (NZ) Private Equity Limited and was either Chairman or a director of Guardian Healthcare Group Limited, Hirepool Limited, Tiri Group Limited, Vision Senior Living Limited and BildNZ Limited.
Special responsibilities Member of the Audit and Risk Committee.
Interest in shares and options Paul has no beneficial interest in Norfolk. He is a director of Maui Capital Indigo Fund Limited, its subsidiaries, and Maui Capital Indigo General Partnership Limited who lodged a Notice of initial substantial holder and Notice of change of interests of substantial holder in relation to Norfolk on 9 June 2009.
DIrECTOrs’ rEpOrT
34 NORFOLK ANNUAL REPORT 2009
For
per
sona
l use
onl
y

Peter Lowe – Independent Non-Executive Director – appointed 8 April 2008
Educational qualifications Peter Lowe holds a Bachelor of Commerce and Master of Business Administration from the University of Melbourne and is a Member of the Australian Institute of Company Directors and a Fellow of CPA Australia.
Experience and expertise Peter’s principal experience is in finance and corporate strategy in listed corporates. He is currently Chairman of United Energy Distribution Holdings Pty Ltd and Multinet Group Holdings Pty Ltd, since July 2003 and Alinta Network Holdings Pty Ltd, since August 2007. He is also a director of Citywide Solutions Pty Ltd, Aurora Energy Pty Ltd and Snowy Hydro Limited.
Peter has previously held senior manager positions with CPA Australia, UtiliCorp United Inc, United Energy Limited and Fosters Brewing Group Limited.
Other current directorships Nil.
Former directorships in last three years
Clever Communications Limited (formerly Access Providers Limited).
GasNet Limited.
Special responsibilities Assumed the role of Chairman of the Audit and Risk Committee and became a member of the Nomination and Remuneration Committee with effect from 29 April 2008.
Interest in shares and options 44,237 held by Peter Lowe and Judith Lowe as trustees for the Lowedid Superannuation Fund.
Meetings of directors This table sets out the number of meetings each director attended and the number of meetings held during the reporting period while each director was a director or was a member of the relevant committee. The table does not indicate where a director attended a committee meeting in an ex officio capacity.
Board of Directors Audit and Risk CommitteeNomination and Remuneration
Committee
Held Attended Held Attended Held Attended
Rod Keller 13 13 – – – –
Glenn Wallace 13 13 – – 4 4
Peter Abery 13 13 7 7 4 4
Paul Chrystall 13 12 7 7 – –
Peter Lowe1 13 12 7 7 4 4
Deborah O’Toole2 6 6 3 3 – –
1 Peter Lowe joined the Board as independent non-executive director on 8 April 20082 Deborah O’Toole resigned as independent non-executive director on 24 July 2008
DIrECTOrs’ rEpOrT
NORFOLK ANNUAL REPORT 2009 35
For
per
sona
l use
onl
y

Remuneration report (audited)The remuneration report is set out under the following main headings:
A Principles used to determine the nature and amount of remuneration
B Details of remuneration
C Service agreements
D Share-based compensation
The information provided under headings A–D includes remuneration disclosures that are required under Accounting Standard AASB 124 ‘Related Party Disclosures’. These disclosures have been transferred from the financial report and have been audited.
A Principles used to determine the nature and amount of remuneration
The objective of the Group’s executive reward framework is to ensure reward for performance is competitive and appropriate for the results delivered. The framework aligns executive reward with achievement of strategic objectives and the creation of value for shareholders, and conforms to market best practice for delivery of reward.
The Nomination and Remuneration Committee is responsible for making recommendations to the Board with respect to the Company’s compensation policies, including equity-based programs. The Committee reviews, considers and evaluates the remuneration and performance of executive directors and senior management. The Managing Director reviews senior management performance against performance standards, position requirements, key personal targets and development plans and reports to the Committee. This report is considered by the Committee as part of the Committee’s review of remuneration and performance.
The Board ensures that executive reward satisfies the following key criteria for good reward governance practices:
competitiveness and reasonableness �
acceptability to shareholders �
performance linkage � /alignment of executive compensation
transparency �
capital management. �
In consultation with external remuneration consultants, the Group has structured an executive remuneration framework that is market competitive and complementary to the reward strategy of the organisation.
Alignment to shareholders’ interests:
has economic profit as a core component of �plan design
focuses on sustained growth in shareholder wealth, �consisting of dividends and growth in share price, and delivering constant return on assets as well as focusing the executive on key non-financial drivers of value
attracts and retains high calibre executives. �
Alignment to program participants’ interests:
rewards capability and experience �
reflects competitive reward for contribution to growth �in shareholder wealth
provides a clear structure for earning rewards �
provides recognition for contribution. �
Non-executive directors’ feesFees and payments to non-executive directors reflect the demands which are made on, and the responsibilities of, the directors. Non-executive directors’ fees and payments are reviewed annually by the Board. The Board has also agreed to the advice of independent remuneration consultants to ensure non-executive directors’ fees and payments are appropriate and in line with the market. The Chairman’s fees are determined independently to the fees of non-executive directors based on comparative roles in the external market. The Chairman is not present at any discussions relating to determination of his own remuneration.
The current base remuneration level for non-executive directors was set with effect at 27 July 2007 and has subsequently been reviewed but no changes have been made. The aggregate maximum annual remuneration for non-executive directors was reviewed and increased at the 2008 Annual General Meeting by $155,000 from $395,000 to $550,000. Increasing the amount of non-executive directors’ fees payable provides flexibility to increase non-executive directors’ fees in line with market conditions and also to appoint additional directors with skills that are complementary to the current directors if the opportunity or requirement arises.
The base fee is $140,000 for the Chairman and $85,000 for the non-executive directors. There are no additional fees paid to non-executive directors.
Non-Executive Directors’ Share Acquisition PlanNon-executive directors do not receive share options. The Company has adopted a Non-Executive Directors’ Share Acquisition Plan (‘NEDSAP’) to facilitate the tax efficient acquisition of shares by non-executive directors to further align their interests with those of shareholders. Under the NEDSAP, eligible non-executive directors may sacrifice a portion of their annual directors’ fees for shares in lieu. The shares are issued or acquired at the market price of shares, at the time of issue or acquisition, and determined in accordance with NEDSAP rules. All Australian resident non-executive directors are eligible to participate in the NEDSAP at the invitation of the Board.
DIrECTOrs’ rEpOrT
36 NORFOLK ANNUAL REPORT 2009
For
per
sona
l use
onl
y

Under the terms of the NEDSAP, the eligible non-executive directors must not sell, transfer or create a security interest or otherwise deal in the shares until a withdrawal notice has been accepted by the Board, or its delegated authority. A withdrawal notice may only be lodged within a share trading window determined by the Board and may not be lodged until:
the vesting conditions, if any, in respect of the shares �have been satisfied or waived
the earlier of the expiration of any restriction period set �by the Board, the time when the eligible non-executive director ceases to be a non-executive director or an earlier time at the Board’s discretion.
The legal title to shares issued or acquired under NEDSAP will be held by a trust, for the benefit of the eligible non-executive director. To date no shares have been acquired under NEDSAP.
Directors’ feesThe Constitution provides that the directors are entitled to the remuneration the directors determine, but the remuneration of non-executive directors must not exceed, in aggregate, a maximum annual amount fixed by the Company in general meeting for that purpose.
Executive payThere are several components of remuneration provided to reward executives, presenting a balance of fixed and at-risk components as well as short- and longer-term rewards.
The Company’s executive remuneration has been structured to ensure that it:
is reasonable �
provides a competitive compensation program �to retain, attract and reward key employees
achieves clear alignment between total remuneration �and delivered business and personal performance over the short and long terms
is an appropriately balanced mix of fixed and at- �risk compensation.
In light of the competitive labour markets within which it operates at the current time, the Company places great importance on the need to retain key employees, thereby avoiding disruption to operations. Accordingly, the use of both time-based and performance-based reward is designed to ensure the Company’s leadership is retained and delivers sustainable, long-term shareholder returns. The directors believe that the at-risk components of the remuneration framework will effectively align management’s interests with those of shareholders.
The executive pay and reward framework has three components:
base pay and benefits including superannuation �
short-term performance incentives �
long-term performance incentives. �
The short-term performance incentives and long-term performance incentives represent remuneration which is at risk as it is based upon performance measures. The table below lists the relevant mix of remuneration for executives for the year ended 31 March 2009.
% of total maximum remuneration
Fixed remuneration
‘At-risk’ performance based
Name STI LTI
Glenn Wallace 63 22 15
James Fletcher 63 22 15
Paul Jeffares 68 20 12
Anthony O’Shannessy 63 20 17
David Rafter 66 19 15
Darren Robinson 69 20 11
Richard Smith 69 19 12
Base payBase pay is structured as a total employment cost package which may be delivered as a combination of cash and prescribed non-financial benefits at the executives’ discretion. Non-financial benefits may include car allowances and superannuation sacrifices.
Executives are offered a competitive base pay that comprises the fixed component of pay and rewards. External remuneration consultants provide analysis and advice to ensure base pay is set to reflect the market for a comparable role. Base pay for executives is reviewed annually to ensure the executive’s pay is competitive with the market. An executive’s pay is also reviewed on promotion.
There are no guaranteed base pay increases included in any executive’s contract.
Short-term performance incentivesThe Company has established its Short Term Incentive Plan (‘STIP’) to provide incentives for employees to achieve specific objectives that are determined by the Board on an annual basis. The STIP aims to:
focus employees on achieving key financial �performance, safety performance and operational performance targets
align individual efforts with annual operating �performance objectives
reward superior individual and Company performance. �
DIrECTOrs’ rEpOrT
NORFOLK ANNUAL REPORT 2009 37
For
per
sona
l use
onl
y

The STIP is based on a ‘balanced score card’ approach whereby specific key performance indicators (‘KPIs’) are identified and specific targets are set. The STIP rewards senior executives and other Company employees for their achievement and contribution during a financial year of these specific KPIs. The incentive earned under the STIP, if any, will vary depending on relative performance against individual targets, as detailed more fully below. Except in certain circumstances, all participants in the STIP must remain employed with the Company on the date incentives are paid to receive any award.
The potential incentives available under the STIP are set within four levels that range between 15% and 35% of an employee’s base salary depending on the employee’s seniority, role and ability to affect Company results. Of that potential incentive, 70% is directly linked to achievement of financial performance targets, 20% is linked to achievement of safety performance targets and the balance (10%) is linked to achievement of personal performance targets relevant to the employee’s role.
The Board approves the annual targets, both financial and non-financial, for the STIP.
1. Financial Performance TargetsFinancial Performance Targets are set at both threshold and stretch levels. The Company’s philosophy in setting those targets is to establish threshold targets that represent the desired minimum outcome for each goal and stretch targets that are realistically achievable with excellent execution of the Company’s annual plan. The Board, in consultation with external remuneration consultants, determined the most appropriate measures in the current year for determining the incentives payable under the STIP are EBIT and Net Operating Cash Flow. In relation to the Managing Director and the Chief Financial Officer, NPAT is deemed to be a more suitable financial measure substituting EBIT and will be implemented in the 2009–10 period.
Achievement of budgeted financial targets provides for 33% of the nominated incentive component. A maximum of 100% of the incentive is available on achievement of 120% of the budgeted target (calculated on a sliding scale). No incentive is available on achievement of under-budget results. At the end of the financial period, after reviewing the Company’s audited financial results, the Board assesses the level of achievement against financial and non-financial targets and provides approval processes.
A minimum criterion has been established in relation to short-term incentives. Eligible employees must achieve financial targets to be able to access either safety performance or personal performance incentive components.
2. Safety Performance TargetsSafety Performance Targets have been set to reflect the Company’s focus on reducing incidents and injuries and the impacts for our employees and associated costs. Total Recordable Injury Frequency Rate (‘TRIFR’) as defined and used in the group management accounts is the key measure of Company safety performance as it includes both Lost Time Injuries and Medically Treated Injuries statistics.
An aggressive target of 20% reduction in the prior year (March 2008) TRIFR performance was established for the current financial year. The Safety Performance Target is an absolute measure and only available on achievement of the full 20% reduction in TRIFR.
3. Personal Performance TargetsPersonal Performance Targets are allocated a maximum 10% of the total incentive potential to reflect the specific individual performance that contributes to supporting the success of the business unit or organisational goals.
For each cash bonus included in the remuneration table, the percentage of the available bonus that was paid in the financial year, and the percentage that was forfeited because the person did not meet the service and performance criteria, are set out below. No part of the bonuses is payable in future years.
Short-term incentive (in respect to the 2009 financial year
and paid in the 2010 financial year)
Paid Forfeited
Name % %
Glenn Wallace 27 73
James Fletcher – 100
Paul Jeffares – 100
David Lee – 100
Anthony O’Shannessy 44 56
David Rafter 42 58
Darren Robinson – 100
Richard Smith 30 70
Long-term performance incentivesThe Company has adopted the Long Term Incentive Plan (‘LTIP’) under which eligible participants may be granted either performance rights (entitling the grantee to shares for no consideration) or performance options (entitling the grantee to shares for an exercise price determined by the Board), in each case exercisable on achievement of pre-set time or performance hurdles.
DIrECTOrs’ rEpOrT
38 NORFOLK ANNUAL REPORT 2009
For
per
sona
l use
onl
y

The LTIP was reviewed and amended in 2008 to more closely reflect the changing market trend in executive remuneration and on advice from external remuneration consultants. The LTIP is currently based on a combination of relative Total Shareholder Return (‘TSR’) and Earnings Per Share (‘EPS’) hurdles.
Conditions in relation to TSR IncentivesTSR Incentives may not be exercised unless:
(a) Norfolk achieves a TSR ranking at the 50th percentile relative to its Peer Group, then 50% of TSR Incentives have been deemed to meet the Vesting Conditions; and
(b) additional TSR Incentives have been deemed to meet the Vesting Conditions, on a linear sliding scale, if the Company achieves a TSR relative to its Peer Group of greater than median with all TSR Incentives meeting the Vesting Conditions if the Company achieves a TSR which ranks it in the top 25% of its Peer Group.
As at 31 March 2009, Norfolk Group Limited’s TSR was below the 50th percentile of its Peer Group.
Conditions in relation to EPS IncentivesEPS Incentives may be exercised:
(a) at 8% Compound Annual Growth Rate (‘CAGR’), one third of EPS Incentives have been deemed to meet the Vesting Conditions; and
(b) additional EPS Incentives have been deemed to meet the Vesting Conditions, on a linear sliding scale, if the Company achieves a CAGR of greater than 8% with all EPS Incentives being exercisable if the Company achieves a CAGR of 15%.
The CAGR and the TSR relative to the Peer Group is tested on the third anniversary of the Grant Date. The ‘Peer Group’ refers to the companies determined by the ASX to form the ‘ASX Top 300’ or such other group of companies as determined most appropriate by the Board from time to time.
The exercise price of performance options will be determined by the Board, but typically will be the market price of the shares, at the date of grant, determined in accordance with the LTIP rules.
The Board has discretion to determine eligible participants under the LTIP.
The performance incentives that are the subject of the LTIP lapse in certain circumstances, including on:
expiry �
cessation of employment for cause �
cessation of employment for other specified reasons if �not exercised within a period determined by the Board.
The Board has discretion to set vesting conditions, determine other lapse events and set restrictions on the disposal of, or other dealing with, the performance incentives that are the subject of the LTIP or shares issued on exercise of a performance incentive.
Note: At the time this report was compiled, the Federal Government introduced legislation affecting the tax treatment of employee share and option plans. As a result of this legislative change and the uncertainty of existing and future share and option schemes, the Board has endorsed a suspension of the LTIP until the government position is clarified and legislation is passed to law.
Additional InformationEPS – Earnings Per Share. �
The EPS for the financial period 2007 � –08 was 14.19 cents.
The EPS for the financial year 2008 � –09 was 4.26 cents.
No EPS related incentives vested during 2007 � –08 or 2008–09.
B Details of remunerationAmounts of remunerationDetails of the remuneration of the directors, the key management personnel of the Group (as defined in AASB 124 ‘Related Party Disclosures’) and specified executives of Norfolk Group Limited are set out in the following tables.
The key management personnel of the Group are the directors of Norfolk Group Limited and those executives who report directly to the Managing Director, being:
Anthony O’Shannessy � – Chief Financial Officer
Darren Robinson – Group Human Resource Director �
David Lee � – Chief Executive – Electrical & Communications division (resigned on 27 February 2009)
David Rafter � – Chief Executive – Mechanical division
Richard Smith � – General Manager – Resolve FM
James Fletcher – General Manager – Building Products �Australasia
Paul Jeffares – General Counsel and Legal Secretary �(resigned on 9 April 2009).
In the following tables, the salary and fees, non-monetary short-term benefits and superannuation benefits are fixed and thus do not vary based on performance. The bonus and share-based payments elements of remuneration vary based on performance.
DIrECTOrs’ rEpOrT
NORFOLK ANNUAL REPORT 2009 39
For
per
sona
l use
onl
y

Group – 2009
Short-term Post- Other Share-based benefits employment payments benefits
Salary Non- Super- and fees Bonus monetary annuation Termination Options1 TotalName $ $ $ $ $ $ $
Non-executive directorsPeter Abery 77,982 – – 7,018 – – 85,000Paul Chrystall 85,000 – – – – – 85,000Rod Keller (Chairman) 128,440 – – 11,560 – – 140,000Peter Lowe 77,982 – – 7,018 – – 85,000Deborah O’Toole2 25,994 – – 2,339 – – 28,333
Executive directorGlenn Wallace 786,256 75,000 – 13,744 – 111,111 986,111
Executive managementJames Fletcher 205,812 – – – – 9,722 215,534Paul Jeffares3 264,908 – – 23,842 – 9,722 298,472David Lee4 369,119 – – 30,881 – 123,604 523,604Anthony O’Shannessy 353,755 50,000 – 13,745 – 123,604 541,104David Rafter 343,687 50,000 43,781 32,532 – 123,604 593,604Darren Robinson 289,693 – – 23,732 – 26,389 339,814Richard Smith 234,274 25,000 35,726 22,050 – 23,287 340,337
1 Value of performance options granted under the LTIP2 Deborah O’Toole resigned 24 July 20083 Paul Jeffares resigned 9 April 20094 David Lee resigned 27 February 2009
Parent – 2009The parent employed all non-executive directors. All other directors and executive management were employed by subsidiaries of the parent.
DIrECTOrs’ rEpOrT
40 NORFOLK ANNUAL REPORT 2009
For
per
sona
l use
onl
y

Group – 2008
Short-term Post- Other Share-based benefits employment payments benefits
Salary Non- Super- and fees Bonus monetary annuation Termination Options1 TotalName $ $ $ $ $ $ $
Non-executive directorsPeter Abery(former Chairman) 34,000 – – 89,666 – – 123,666Paul Chrystall 42,500 – – – – – 42,500Rod Keller (Chairman) 61,545 – – 14,102 – – 75,647Deborah O’Toole 68,884 – – 6,200 – – 75,084
Executive director Glenn Wallace 512,738 160,000 – – – – 672,738
Executive managementDavid Lee 270,780 20,000 – 22,615 – 75,342 388,737Anthony O’Shannessy 248,414 80,000 – 10,703 – 75,342 414,459David Rafter 228,427 100,000 37,978 25,767 – 75,342 467,514Darren Robinson 196,738 26,667 – 16,038 – 11,111 250,554Ian Stewart2 36,421 – 12,882 23,644 242,452 – 315,399
1 Value of performance options granted under the LTIP2 Ian Stewart resigned 14 September 2007
The 2008 table is for the period from 31 May 2007 to 31 March 2008.
Parent – 2008The parent employed all non-executive directors. All other directors and executive management were employed by subsidiaries of the parent.
DIrECTOrs’ rEpOrT
NORFOLK ANNUAL REPORT 2009 41
For
per
sona
l use
onl
y

C Service agreementsRemuneration and other terms of employment for key management personnel are formalised in service agreements. Details of these agreements are as follows:
Short-term incentive Commencement Term of linked Restraint Name date with Group agreement to KPIs of trade Notice of termination
Glenn Wallace 1 November 2004 Ongoing Yes Yes 12 months by Company/ 6 months by employee
James Fletcher 14 June 2006 Ongoing Yes Yes 6 months by Company/ 6 months by employee
Paul Jeffares 3 September 2007 Ongoing Yes Yes 6 months by Company/ 6 months by employee
Anthony O’Shannessy 14 June 2004 Ongoing Yes Yes 6 months by Company/ 6 months by employee
David Rafter 17 July 1995 Ongoing Yes Yes 6 months by Company/ 6 months by employee
Darren Robinson 16 July 2007 Ongoing Yes Yes 6 months by Company/ 6 months by employee
Richard Smith 16 July 2007 Ongoing Yes Yes 3 months by Company/ 3 months by employee
There are no guaranteed termination payments included in the above service agreements.
On appointment to the Board, all non-executive directors enter into a service agreement with the Company in the form of a letter of appointment. The letter summarises the Board policies and terms, including compensation, relevant to the office of director.
D Share-based compensationAs part of the LTIP, eligible key executives and management were granted Performance Options, each being an entitlement to a share option.
As at 31 March 2009, the number of Performance Options on issue was 5,443,224.
The terms and conditions of each grant of options affecting remuneration in this or future reporting periods are as follows:
Value per Date vested Exercise option at Grant date and exercisable Expiry date price grant date
27 July 2007 (SBR) 27 July 2010 27 July 2012 $0.00 $1.9527 July 2007 (LTI) 27 July 2010 27 July 2012 $1.95 $0.4226 August 2008 (LTI) 26 August 2011 26 August 2013 $1.24 $0.28
Options granted carry no dividend or voting rights.
DIrECTOrs’ rEpOrT
42 NORFOLK ANNUAL REPORT 2009
For
per
sona
l use
onl
y

Details of options over ordinary shares issued to directors and key management personnel during the year ended 31 March 2009 are set out below:
Sales Bonus RightsGroup – 2009
Number of Number of Number of Opening options granted options vested options cancelled Closing Name balance during the period during the period during the period balance
David Lee 208,846 – – 208,846 –Anthony O’Shannessy 208,846 – – – 208,846David Rafter 208,846 – – – 208,846Richard Smith 40,000 – – – 40,000
Performance OptionsGroup – 2009
Number of Number of Number of Opening options granted options vested options cancelled Closing Name balance during the period during the period during the period balance
Glenn Wallace – 476,351 – – 476,351Anthony O’Shannessy 238,175 353,232 – – 591,407David Lee 238,175 353,232 – 591,407 –David Rafter 238,175 353,232 – – 591,407Darren Robinson 119,088 176,616 – – 295,704James Fletcher – 176,616 – – 176,616Paul Jeffares – 176,616 – – 176,616Richard Smith – 176,616 – – 176,616
Details of options over ordinary shares issued to directors and key management personnel during the period ended 31 March 2008 are set out below:
Sales Bonus RightsGroup – 2008
Number of Number of Number of Opening options granted options vested options cancelled Closing Name balance during the period during the period during the period balance
David Lee – 208,846 – – 208,846Anthony O’Shannessy – 208,846 – – 208,846David Rafter – 208,846 – – 208,846
Performance OptionsGroup – 2008
Number of Number of Number of Opening options granted options vested options cancelled Closing Name balance during the period during the period during the period balance
Glenn Wallace – – – – –Anthony O’Shannessy – 238,175 – – 238,175David Lee – 238,175 – – 238,175David Rafter – 238,175 – – 238,175Darren Robinson – 119,088 – – 119,088
DIrECTOrs’ rEpOrT
NORFOLK ANNUAL REPORT 2009 43
For
per
sona
l use
onl
y

With the exception of the SBR, the option price is based on the offer price at the time of listing (2007 issue) and market price (2008 issue).
The plan rules contain a restriction on removing the ‘at risk’ aspect of the instruments granted to executives. Plan participants may not enter into any transaction designed to remove the ‘at risk’ aspect of an instrument before it vests.
The assessed fair value at grant date of options granted to the individuals is allocated equally over the period from grant date to vesting date, and the amount is included in the remuneration table above. Fair value at grant date is determined using a Black-Scholes option pricing model that takes into account the exercise price, the term of the option, the impact of dilution, the share price at grant date and expected price volatility of the underlying share, the expected dividend yield and the risk-free interest rate for the term of the option.
The model inputs for options granted during the year ended 31 March 2009 included:
(a) options are granted for no consideration and vest based on a combination of Norfolk Group Limited’s TSR ranking within a Peer Group and EPS. Vested options are exercisable for a period of two years after vesting
(b) exercise price: $1.24 (2008: $1.95)
(c) grant date: 26 August 2008 (2008: 27 July 2007)
(d) expiry date: 26 August 2013 (2008: 27 July 2012)
(e) share price at grant date: $1.28 (2008: $1.95 being the listing price)
(f) expected price volatility of the Company’s shares: 45% (2008: 35%)
(g) expected dividend yield: 8.9% (2008: 2.5%)
(h) risk-free interest rate: 5.7% (2008: 6.2%).
For each grant of options included in the tables above, the percentage of the available grant that vested and that which was forfeited because the person did not meet the service and performance criteria in the financial year are set out below. The options vest after three years, provided the vesting conditions are met (as set out under ‘Long-term performance incentives’ above). No options will vest if the conditions are not satisfied, hence the minimum value of the options yet to vest is nil. The maximum value of the options yet to vest has been determined as the amount of the grant options fair value of the options that is yet to be expensed.
Financial years Minimum Maximum in which total value of total value of Year options may grant yet to grant yet to granted Vested Forfeited vest vest vestName % % % $ $ $
Glenn Wallace 2008 – – 2011 – 88,889
James Fletcher 2009 – – 2012 – 40,278
Paul Jeffares 2009 – – 2012 – 40,278
David Lee 2008 – 100 2011 – – 2008 – 100 2011 – – 2009 – 100 2012 – –
Anthony O’Shannessy 2008 – – 2011 – 94,435 2008 – – 2011 – 44,444 2009 – – 2012 – 80,556
David Rafter 2008 – – 2011 – 94,435 2008 – – 2011 – 44,444 2009 – – 2012 – 80,556
Darren Robinson 2008 – – 2011 – 22,222 2009 – – 2012 – 40,278
Richard Smith 2008 – – 2011 – 18,087 2009 – – 2012 – 40,278
DIrECTOrs’ rEpOrT
44 NORFOLK ANNUAL REPORT 2009
For
per
sona
l use
onl
y

Shares under optionUnissued ordinary shares of Norfolk Group Limited under option at the date of this report are as follows:
Grant date Expiry date Issue price of shares Number under option
27 July 2007 (SBR) 27 July 2012 $0.00 1,239,53627 July 2007 (LTI) 27 July 2012 $1.95 1,190,87726 August 2008 (LTI) 26 August 2013 $1.24 3,012,811
Proceedings on behalf of the CompanyNo person has applied to the Court under section 237 of the Corporations Act 2001 for leave to bring, or intervene in, proceedings on behalf of any entity within the Norfolk Group.
Non-audit servicesDetails of the amounts paid or payable to the auditor for non-audit services provided during the financial year by the auditor are outlined in note 29 of the financial report.
The directors are satisfied that the provision of non-audit services during the financial year by the auditor (or by another person or firm on the auditor’s behalf) is compatible with the general standard of independence for auditors imposed by the Corporations Act 2001.
The directors are of the opinion that the services as disclosed in note 29 of the financial report do not compromise the external auditor’s independence for the following reasons:
all non-audit services have been reviewed and approved to ensure that they do not impact the integrity and objectivity �of the auditor
none of the non-audit services undermine the general principles relating to auditor independence as set out in the Code �of Conduct APES 110 ‘Code of Ethics for Professional Accountants’ issued by the Accounting Professional and Ethical Standards Board, including reviewing or auditing the auditor’s own work, acting in a management or decision-making capacity for Norfolk Group, acting as advocate for Norfolk Group or jointly sharing economic risks and rewards.
Auditor’s independence declarationThe auditor’s independence declaration is set out at page 46 and forms part of the directors’ report for the financial year ended 31 March 2009.
Rounding of amountsNorfolk Group Limited is a company of the kind referred to in Australian Securities and Investments Commission Class Order 98/100 dated 10 July 1998. In accordance with that Class Order amounts in the financial report and the directors’ report have been rounded to the nearest thousand dollars unless specifically stated otherwise.
AuditorPricewaterhouseCoopers continues in office in accordance with section 327 of the Corporations Act 2001.
Buy-backNorfolk Group Limited does not currently have any on-market buy-back of shares.
This report is made in accordance with a resolution of the directors.
On behalf of the directors
Rod KellerChairmanNorfolk Group Limited 23 June 2009Sydney
DIrECTOrs’ rEpOrT
NORFOLK ANNUAL REPORT 2009 45
For
per
sona
l use
onl
y

AuDITOr’s INDEpENDENCE DEClArATION
Auditor’s independence declarationAs lead auditor for the audit of Norfolk Group Limited for the year ended 31 March 2009, I declare that to the best of my knowledge and belief, there have been:
a) no contraventions of the auditor independence requirements of the Corporations Act 2001 in relation to the audit; and
b) no contraventions of any applicable code of professional conduct in relation to the audit.
This declaration is in respect of Norfolk Group Limited and the entities it controlled during the year.
Eddie Wilkie SydneyPartner 23 June 2009PricewaterhouseCoopers
Liability limited by a scheme approved under Professional Standards Legislation
PricewaterhouseCoopersABN 52 780 433 757
Darling Park Tower 2201 Sussex StreetGPO BOX 2650SYDNEY NSW 1171DX 77 SydneyAustraliaTelephone +61 2 8266 0000Facsimile +61 2 8266 9999www.pwc.com/au
46 NORFOLK ANNUAL REPORT 2009
For
per
sona
l use
onl
y

FINANCIAL REPORT FOR ThE YEAR ENDED 31 mARCh 2009
CONTENTs48 Income statements49 Balance sheets50 Statements of changes in equity51 Cash flow statements52 Notes to the financial statements92 Directors’ declaration93 Independent auditor’s report to
the members of Norfolk Group Limited
General informationThis financial report covers both Norfolk Group Limited as an individual entity and the consolidated entity consisting of Norfolk Group Limited and its subsidiaries. The financial report is presented in Australian dollars.
Norfolk Group Limited is a listed public company limited by shares, incorporated and domiciled in Australia.
Its registered office and principal place of business is:
Level 550 Berry StreetNorth Sydney NSW 2060
A description of the nature of the consolidated entity’s operations and its principal activities is included in the directors’ report, which is not part of this financial report.
The financial report was authorised for issue by the directors on 23 June 2008. The directors have the power to amend and reissue the financial report.
NORFOLK ANNUAL REPORT 2009 47
For
per
sona
l use
onl
y

Group Parent Group 10 months Parent 10 months 2009 2008 2009 2008 Note $’000 $’000 $’000 $’000
Revenue from continuing operating activities 4 744,207 585,326 15,760 2,415Other income 5 164 323 – –
Expenses
Cost of sales (624,996) (486,072) – –Selling and distribution costs (38,949) (28,772) – –Marketing expenses (704) (1,060) – –Occupancy expenses (7,659) (6,043) – –Administrative expenses – Other 6,12 (42,696) (32,008) (85,381) (328)Administrative expenses – Impairment of SSRP receivable 9 (13,487) – – –Finance costs 6 (7,254) (5,168) (4,703) (4,281)
Profit/(loss) before income tax 8,626 26,526 (74,324) (2,194)
Income tax (expense)/benefit 7 (3,055) (8,057) 1,389 1,383
Profit/(loss) from continuing operations 5,571 18,469 (72,935) (811)
Profit/(loss) from discontinued operations 39 (1,204) 446 – –
Profit/(loss) for the year 4,367 18,915 (72,935) (811)
Profit attributable to minority interest (32) (23) – –
Profit/(loss) after income tax expense attributable to members of Norfolk Group limited 24 4,335 18,892 (72,935) (811)
Cents Cents
Basic earnings per share from continuing operations 37 4.26 14.19 Diluted earnings per share from continuing operations 37 4.22 13.92
Basic earnings per share 37 3.33 14.53 Diluted earnings per share 37 3.30 14.26
INCOME sTATEMENTs FOr THE YEAr ENDED 31 MArCH 2009
The above income statements should be read in conjunction with the accompanying notes.
48 NORFOLK ANNUAL REPORT 2009
For
per
sona
l use
onl
y

BAlANCE sHEETs As AT 31 MArCH 2009
Group Group Parent Parent 2009 2008 2009 2008 Note $’000 $’000 $’000 $’000
Current assetsCash and cash equivalents 8 13,263 12,012 169 121Trade and other receivables 9 170,369 186,552 319 347Inventories 10 8,043 10,315 – –
191,675 208,879 488 468
Current assets classified as held for sale 39 688 – – –
Total current assets 192,363 208,879 488 468
Non-current assetsDerivative financial instruments 11 – 564 – –Other financial assets 12 – – 244,393 329,258Property, plant and equipment 13 10,845 11,383 – –Intangibles 14 46,837 45,652 – –Deferred tax 15 18,633 10,042 6,320 8,481
Total non-current assets 76,315 67,641 250,713 337,739
Total assets 268,678 276,520 251,201 338,207
Current liabilitiesTrade and other payables 16 157,131 162,374 33,901 43,022Borrowings 17 61,821 3,665 48,000 –Income tax 18 6,708 99 7,110 –Derivative financial instruments 11 1,537 – – –Provisions 19 6,929 6,643 – –
Total current liabilities 234,126 172,781 89,011 43,022
Non-current liabilitiesBorrowings 20 942 62,812 – 50,000Provisions 21 2,739 3,301 – –
Total non-current liabilities 3,681 66,113 – 50,000
Total liabilities 237,807 238,894 89,011 93,022
Net assets 30,871 37,626 162,190 245,185
EquityContributed equity 22 243,919 243,919 243,919 243,919Reserves 23 (226,320) (225,208) 2,027 2,077Retained profits/(accumulated losses) 24 13,217 18,892 (83,756) (811)
Parent entity interest 30,816 37,603 162,190 245,185Minority interest 25 55 23 – –
Total equity 30,871 37,626 162,190 245,185
The above balance sheets should be read in conjunction with the accompanying notes.
NORFOLK ANNUAL REPORT 2009 49
For
per
sona
l use
onl
y

Retained profits/ Contributed (accumulated Parent Minority Total equity Reserves losses) interest interest equity $‘000 $‘000 $‘000 $‘000 $‘000 $‘000
Group Balance 31 May 2007 – – – – – –Foreign currency translation differences – 234 – 234 – 234
Net income/(expense) recognised directly in equity – 234 – 234 – 234Profit/(loss) after income tax (expense)/benefit – – 18,892 18,892 23 18,915
Total recognised income/(expense) for the period – 234 18,892 19,126 23 19,149Contributions of equity, net of transaction costs 243,919 – – 243,919 – 243,919Acquisition of entities under common control – (227,519) – (227,519) – (227,519)Share-based payments – 2,077 – 2,077 – 2,077
Balance 31 march 2008 243,919 (225,208) 18,892 37,603 23 37,626
Balance 1 April 2008 243,919 (225,208) 18,892 37,603 23 37,626Foreign currency translation differences – (190) – (190) – (190)Changes in the fair value of cash flow hedges – (1,246) – (1,246) – (1,246)Tax effect of changes in the fair value of cash flow hedges – 374 – 374 – 374
Net income/(expense) recognised directly in equity – (1,062) – (1,062) – (1,062)Profit after income tax (expense)/benefit – – 4,335 4,335 32 4,367
Total recognised income/(expense) for the period – (1,062) 4,335 3,273 32 3,305Dividends – – (10,010) (10,010) – (10,010)Share-based payments – (50) – (50) – (50)
Balance 31 march 2009 243,919 (226,320) 13,217 30,816 55 30,871
Parent Balance 31 May 2007 – – – – – –Profit/(loss) after income tax (expense)/benefit – – (811) (811) – (811)
Total recognised income/(expense) for the period – – (811) (811) – (811)Contributions of equity, net of transaction costs 243,919 – – 243,919 – 243,919Share-based payments – 2,077 – 2,077 – 2,077
Balance 31 march 2008 243,919 2,077 (811) 245,185 – 245,185
Balance 1 April 2008 243,919 2,077 (811) 245,185 – 245,185Profit/(loss) after income tax (expense)/benefit – – (72,935) (72,935) – (72,935)
Total recognised income/(expense) for the period – – (72,935) (72,935) – (72,935)Dividends – – (10,010) (10,010) – (10,010)Share-based payments – (50) – (50) – (50)
Balance 31 march 2009 243,919 2,027 (83,756) 162,190 – 162,190
sTATEMENTs OF CHANGEs IN EquITY FOr THE YEAr ENDED 31 MArCH 2009
The above statements of changes in equity should be read in conjunction with the accompanying notes.
50 NORFOLK ANNUAL REPORT 2009
For
per
sona
l use
onl
y

Group Parent Group 10 Months Parent 10 Months 2009 2008 2009 2008 Note $’000 $’000 $’000 $’000
Cash flows from operating activities Receipts from customers (inclusive of GST) 780,847 646,297 – –Payments to suppliers (inclusive of GST) (750,570) (598,499) (431) (304)
30,277 47,798 (431) (304)Dividends received – – 15,760 2,372Interest received 423 366 – –Other revenue 718 178 – –Interest and other finance costs paid (7,422) (5,736) (4,660) (4,281)Income taxes paid (4,253) (3,245) – –
Net cash inflow/(outflow) from operating activities 36 19,743 39,361 10,669 (2,213)
Cash flows from investing activities Payment for purchase of businesses, net of cash acquired 33 (1,161) (6,094) – –Payment for purchase of subsidiaries, net of cash acquired 33 (136) (191,846) – (183,185)Payments for property, plant, equipment and software 13,14 (5,130) (2,322) – –Loans to subsidiaries – – – (47,638)Proceeds from sale of property, plant and equipment 1,197 2,196 – –Proceeds from sale of discontinued activities (net of cash disposed of) – 1,111 – –
Net cash inflow/(outflow) from investing activities (5,230) (196,955) – (230,823)
Cash flows from financing activitiesProceeds from issue of shares – 183,157 – 183,157Payment of dividends (9,962) – (9,962) –Proceeds from borrowings – 62,443 – 50,000Repayment of borrowings (1,450) (73,727) (659) –Repayment of finance lease liabilities (1,805) (2,267) – –
Net cash inflow/(outflow) from financing activities (13,217) 169,606 (10,621) 233,157
Net increase/(decrease) in cash and cash equivalents 1,296 12,012 48 121Effect of exchange rate changes on cash and cash equivalents (45) – – –
Cash and cash equivalents at the beginning of the financial period 12,012 – 121 –
Cash and cash equivalents at the end of the financial period 13,263 12,012 169 121
Financing arrangements 17
CAsH FlOw sTATEMENTs FOr THE YEAr ENDED 31 MArCH 2009
The above cash flow statements should be read in conjunction with the accompanying notes.
NORFOLK ANNUAL REPORT 2009 51
For
per
sona
l use
onl
y

NOTEs TO THE FINANCIAl sTATEMENTs 31 MArCH 2009
Note 1. Significant accounting policiesThe principal accounting policies adopted in the preparation of the financial report are set out below.
Accounting periodThe financial report is for the year ended 31 March 2009. The comparative information disclosed is for the financial period from 31 May 2007 (the date of incorporation of Norfolk Group Limited) to 31 March 2008. The Norfolk Group of Companies was acquired on 21 June 2007 and the comparative information includes its results for the financial period from 21 June 2007 to 31 March 2008.
Basis of accountingThis general purpose financial report has been prepared in accordance with Australian equivalents to International Financial Reporting Standards (‘AIFRS’), other authoritative pronouncements of the Australian Accounting Standards Board, Urgent Issues Group Interpretations and the Corporations Act 2001.
Going concernHaving considered the matters below, the directors have prepared the financial report on a going concern basis. The Group will realise its assets and settle its liabilities and commitments in the normal course of business and for at least the amounts stated in the financial report.
As at 31 March 2009, the Group has a deficiency of net current assets of $41,763,000. This deficiency of net current assets is a result of the classification of the Group’s borrowings as current at year end. The Group has generated operating profits and positive cash flows during the financial year ending on that date.
On 7 May 2009, agreement was reached with the Group’s bank financiers that the impairment of the SSRP receivable would not be included within the calculation of the financial covenants that form part of the Group’s major bank loan and overdraft facility agreement (‘Facility Agreement’). The agreement reached on 7 May 2009 contains some undertakings which are in the process of being formally documented into the Facility Agreement. Shareholder approval under section 260A of the Corporations Act 2001 may be required to finalise this documentation. If such approval is required the deadline agreed with the Group’s bank financiers for the completion of the documentation is 11 September 2009. If such approval is not required the deadline agreed with the Group’s bank financiers for the completion of the documentation is 20 business days from the date which legal clarification is received. As this agreement was not reached prior to 31 March 2009, borrowings under the bank facility are shown as current liabilities in the balance sheet as at 31 March 2009.
The current bank overdraft facility is a $20,000,000 facility which may be drawn at any time and is subject to annual review. At balance date $nil was utilised. The bank loan facility agreed in the letter dated 7 May 2009 is a $90,000,000 facility which may be drawn at any time in either Australian or New Zealand dollars and has a term ending in July 2010. At balance date $60,833,000 was utilised.
Management is currently in negotiations with the Group’s bank financiers to put in place a new three year finance facility.
Compliance with IFRSAustralian Accounting Standards include AIFRS. Compliance with AIFRS ensures that the consolidated entity financial report conforms with International Financial Reporting Standards (‘IFRS’).
Historical cost conventionThis financial report has been prepared under the historical cost convention, as modified where applicable by the revaluation of available-for-sale financial assets, financial assets and liabilities at fair value through profit or loss, investment property and certain classes of property, plant and equipment.
Critical accounting estimatesThe preparation of this financial report in conformity with AIFRS requires the use of certain critical accounting estimates. It also requires management to exercise its judgement in the process of applying the consolidated entity’s accounting policies. The areas involving a higher degree of judgement or complexity, or areas where assumptions and estimates are significant to the financial report, are disclosed in note 2.
Principles of consolidationThe consolidated financial report incorporates the assets and liabilities of all subsidiaries of Norfolk Group Limited (‘Company’, ‘parent’ or ‘parent entity’) as at 31 March 2009 and the results of all subsidiaries for the year then ended. Norfolk Group Limited and its subsidiaries together are referred to in this financial report as the ‘consolidated entity’ or ‘Group’.
Subsidiaries are all those entities over which the consolidated entity has the power to govern the financial and operating policies, generally accompanying a shareholding of more than one-half of the voting rights. Subsidiaries are fully consolidated from the date on which control is transferred to the consolidated entity. They are de-consolidated from the date that control ceases.
Intercompany transactions, balances and unrealised gains on transactions between companies in the consolidated entity are eliminated.
Investments in subsidiaries are accounted for at cost, less any impairment, in the parent entity.
Minority interests in the results and equity of subsidiaries are shown separately in the income statement and balance sheet of the consolidated entity.
Segment reportingA business segment is identified for a group of assets and operations engaged in providing products or services that are subject to risks and returns that are different from those of other business segments. A geographical segment is identified when products or services are provided within a particular economic environment and are subject to risks and returns that are different from those of segments operating in other economic environments.
52 NORFOLK ANNUAL REPORT 2009
For
per
sona
l use
onl
y

Foreign currency translationItems included in the financial statements of each of the Group’s entities are measured using the currency of the primary economic environment in which the entity operates (the ‘functional currency’). The consolidated financial statements are presented in Australian dollars, which is Norfolk Group Limited’s functional and presentation currency.
Foreign currency transactions are translated into Australian dollars using the exchange rates prevailing at the dates of the transactions. Foreign exchange gains and losses resulting from the settlement of such transactions and from the translation at period-end exchange rates of monetary assets and liabilities denominated in foreign currencies are recognised in the income statement.
The results and financial position of all Group entities that have a functional currency different from the presentation currency are translated into the presentation currency as follows. Assets and liabilities are translated at the closing rate at the date of that balance sheet. Income and expenses for each income statement are translated at average exchange rates and all resulting exchange differences are recognised as a separate component of equity.
Revenue recognitionRevenue comprises the fair value for the sale of goods and services, net of GST, rebates and discounts and after eliminating sales within the Group. Sales of goods are recognised when the Group has delivered products to the customer, the customer has accepted the products and recoverability of the related receivables is reasonably assured. Revenue is recognised as follows:
Service contractsRevenue for preventative maintenance contracts is recognised progressively over the contract term.
Revenue for minor service works is recognised on completion of the rendering of the service when the revenue can be reliably measured.
Installation contractsInstallation contracts have revenue and profit recognised in accordance with the percentage completion method. Contracts have profit recognised in accordance with the stage of completion. Percentage of completion is calculated by costs incurred to date being divided by the total forecast costs. For contracts which span a significant length of time, profit is not recognised until it is clearly demonstrated that the contract will be profitable. For larger contracts this assessment is generally made only once 50% of the contract completion is achieved.
Contract value and estimates of the costs are reviewed periodically during the life of the project and any adjustments to the percentage complete are recognised in that period in the income statement.
Variations for extra works performed or changes in contract scope are recognised in contract revenues to the extent where:
it is probable that the revenue will be certified by �the customer
the amounts of revenue can be reliably measured. �
Claims are included in contract revenue only when:
negotiations have reached an advanced stage such that �it is probable that the customer will accept the claim
the amount that it is probable will be accepted by the �customer can be measured reliably.
Where it is probable that a loss will arise from a contract, the excess of total costs over revenue is recognised as an expense immediately.
Where contract billings are less than the amount of revenue included in the income statement, an amount is presented in trade and other receivables as amounts recoverable on contracts.
If there are contracts where progress billings exceed the aggregate costs incurred plus profits (revenue recognised), the amount is presented under trade and other payables as amounts due to customers from contract work.
Interest receivedInterest revenue is recognised when it is received or when the right to receive payment is established.
Other revenueOther revenue is recognised when it is received or when the right to receive payment is established.
Income taxThe income tax expense or benefit for the period is the tax payable on the current period’s taxable income based on the current company tax rate adjusted by changes in deferred tax assets and liabilities attributable to temporary differences between the tax bases of assets and liabilities and their carrying amounts in the financial report, and to unused tax losses where applicable.
Deferred tax assets and liabilities are recognised for temporary differences at the tax rates expected to apply when the assets are recovered or liabilities are settled, based on those tax rates which are enacted or substantively enacted.
Deferred tax assets are recognised for deductible temporary differences and unused tax losses only if it is probable that future taxable amounts will be available to utilise those temporary differences and losses.
Norfolk Group Limited and its wholly owned Australian subsidiaries have formed an income tax consolidated group from 12 July 2007 under the tax consolidation regime. Norfolk Group Limited is responsible for recognising the current tax assets and liabilities for the tax consolidated group. The tax consolidated group has entered a tax funding agreement whereby each company in the Group contributes to the income tax payable in proportion to their tax payable.
NOTEs TO THE FINANCIAl sTATEMENTs 31 MArCH 2009
NORFOLK ANNUAL REPORT 2009 53
For
per
sona
l use
onl
y

NOTEs TO THE FINANCIAl sTATEMENTs 31 MArCH 2009
Note 1. Significant accounting policies (continued)Cash and cash equivalentsFor cash flow statement presentation purposes, cash and cash equivalents includes cash on hand, deposits held at call with financial institutions, other short-term, highly liquid investments with original maturities of three months or less that are readily convertible to known amounts of cash and which are subject to an insignificant risk of changes in value and bank overdrafts. Bank overdrafts are shown within borrowings in current liabilities on the balance sheet.
Trade receivablesTrade and other receivables are recognised initially at fair value and subsequently measured at amortised cost using the effective interest method, less provision for impairment. A provision for impairment of trade receivables is established when there is objective evidence that the Group will not be able to collect all amounts due according to the original terms of the receivables. Significant financial difficulties of the debtor, probability that the debtor will enter bankruptcy or financial reorganisation, and default or delinquency in payments are considered indicators that the trade receivable is impaired. The amount of the provision is the difference between the asset’s carrying amount and the present value of the estimated future cash flows, discounted at the effective interest rate. The amount of the provision is expensed in the income statement.
InventoriesFinished goods are stated at the lower of cost and net realisable value. Cost comprises purchase and delivery costs, net of rebates and discounts received or receivable.
Derivative financial instrumentsDerivatives are initially recognised at fair value on the date a derivative contract is entered into and are subsequently remeasured to their fair value at each reporting date. The accounting for subsequent changes in fair value depends on whether the derivative is designated as a hedging instrument, and if so, the nature of the item being hedged.
The Group has designated certain derivatives as hedges of the cash flows of recognised assets and liabilities and highly probable forecast transactions (cash flow hedges). The Group documents at inception of the hedging transaction the relationship between hedging instruments and hedged items, as well as its risk management objective and strategy for undertaking various hedging transactions. The Group also documents its assessments, both at hedge inception and on an ongoing basis, of whether the derivatives that are used in hedging transactions have been and will continue to be highly effective in offsetting changes in cash flows of hedged items.
The effective portion of changes in the fair value of derivatives that are designated and qualify as cash flow hedges is recognised in equity in the hedging reserve. The gain or loss relating to the ineffective portion is recognised immediately in the income statement. Changes in the fair value of any derivative instrument that has not been designated as a hedge and therefore does not qualify for hedge accounting are recognised immediately in the income statement.
The fair values of derivative financial instruments used for hedging purposes are disclosed in note 11. Movements in the hedging reserve in shareholders’ equity are shown in note 23.
Investments and other financial assetsInvestments and other financial assets are stated at the lower of their carrying amount and fair value less costs to sell. The fair values of quoted investments are based on current bid prices. For unlisted investments, the consolidated entity establishes fair value by using valuation techniques. These include the use of recent arm’s-length transactions, reference to other instruments that are substantially the same, discounted cash flow analysis, and option pricing models.
Property, plant and equipmentProperty, plant and equipment is stated at historical cost less accumulated depreciation and impairment losses. Historical cost includes directly attributable expenditure that has been incurred in bringing the assets to the location and condition necessary for their intended service. Where material parts of an item of property, plant and equipment have different useful lives, they are accounted for as separate items of property, plant and equipment. Property, plant and equipment is depreciated using the straight-line method so as to allocate the costs of assets to their residual values over their estimated useful lives as follows:
Leasehold improvements 1–10 years
Motor vehicles 4–5 years
Plant and equipment 3–10 years
LeasesA distinction is made between finance leases, which effectively transfer from the lessor to the lessee substantially all the risks and benefits incident to ownership of leased non-current assets, and operating leases, under which the lessor effectively retains substantially all such risks and benefits.
Finance leases are capitalised. A lease asset and liability are established at the present value of minimum lease payments. Lease payments are allocated between the principal component of the lease liability and the finance costs.
The leased asset is depreciated on a straight-line basis over the term of the lease, or where it is likely that the consolidated entity will obtain ownership of the asset, the life of the asset.
Other operating lease payments are charged to the income statement in the periods in which they are incurred, as this represents the pattern of benefits derived from the leased assets.
54 NORFOLK ANNUAL REPORT 2009
For
per
sona
l use
onl
y
Intangible assetsGoodwillWhere an entity or operation is acquired, the identifiable net assets acquired are measured at fair value. The excess of the fair value of the cost of acquisition over the fair value of the identifiable net assets acquired is brought to account as goodwill. Goodwill is not amortised. Instead, goodwill is tested for impairment annually, or more frequently if events or changes in circumstances indicate that it might be impaired, and is carried at cost less accumulated impairment losses.
BrandsBrands arose as a result of the acquisition of O’Donnell Griffin Pty Limited, Haden Engineering Pty Limited and Norfolk Building Products Limited.
Brands are considered to have indefinite useful lives and are tested annually for impairment. Brands are carried at cost less accumulated impairment losses.
Computer softwareComputer software is stated at historical cost less amortisation. Historical cost includes directly attributable expenditure that has been incurred in bringing the assets to the location and condition necessary for their intended service. Computer software is amortised over its useful economic life, being 3–7 years.
Impairment of assetsGoodwill and intangible assets that have an indefinite useful life are not subject to amortisation and are tested annually for impairment. Other assets are reviewed for impairment whenever events or changes in circumstances indicate that the carrying amount may not be recoverable. An impairment loss is recognised for the amount by which the asset’s carrying amount exceeds its recoverable amount.
Trade and other payablesThese amounts represent liabilities for goods and services provided to the consolidated entity prior to the end of the financial period and which are unpaid. The amounts are unsecured and are usually paid within 30–60 days of recognition.
BorrowingsBorrowings are initially recognised at fair value, net of transaction costs incurred. Borrowings are subsequently measured at amortised cost. Any difference between the proceeds (net of transaction costs) and the redemption amount is recognised in the income statement over the period of the borrowings using the effective interest method. Fees paid on the establishment of loan facilities are recognised as transaction costs of the loan to the extent that it is probable that some or all of the facility will be drawn down. In this case, the fee is deferred until the draw down occurs. To the extent there is no evidence that it is probable that some or all of the facility will be drawn down, the fee is capitalised as a prepayment for liquidity services and amortised over the period of the facility to which it relates.
Borrowings are removed from the balance sheet when the obligation specified in the contract is discharged, cancelled or expired. The difference between the carrying amount of a financial liability that has been extinguished or transferred to another party and the consideration paid, including any non-cash assets transferred or liabilities assumed, is recognised in other income or finance cost.
Borrowings are classified as current liabilities unless the Group has an unconditional right to defer settlement of the liability for at least 12 months after the reporting date.
Borrowing costsBorrowing costs incurred for the construction of any qualifying asset are capitalised during the period of time that is required to complete and prepare the asset for its intended use or sale. Other borrowing costs are expensed.
ProvisionsProvisions are recognised when the consolidated entity has a present obligation (legal or constructive) as a result of a past event, it is probable the consolidated entity will be required to settle the obligation, and a reliable estimate can be made of the amount of the obligation. The amount recognised as a provision is the best estimate of the consideration required to settle the present obligation at the reporting date, taking into account the risks and uncertainties surrounding the obligation.
Employee benefitsWages and salaries, annual leave and sick leaveLiabilities for wages and salaries, including non-monetary benefits, annual leave and accumulating sick leave expected to be settled within 12 months of the reporting date, are recognised within other payables in respect of employees’ services up to the reporting date and are measured at the amounts expected to be paid when the liabilities are settled.
Long service leaveThe liability for long service leave is recognised in provisions and is measured as the present value of expected future payments to be made in respect of services provided by employees up to the reporting date using the projected unit credit method. Consideration is given to expected future wage and salary levels, experience of employee departures and periods of service.
Share-based paymentsShare-based compensation benefits are provided to the Managing Director and other eligible participants via the Norfolk Group Long Term Incentive Plan (‘the plan’). The fair value of options or shares granted under the plan and the fair value of rights granted to key executives under the Sale Bonus Rights Plan are each recognised as an employee benefit expense with a corresponding increase in equity. The fair value is measured at the grant date and recognised over the period during which the employees become unconditionally entitled to the options or shares. In relation to options, the fair value at grant date is determined using a Black-Scholes option pricing model that takes into account the exercise price, the term of the option, the impact of dilution, the share price at grant date, the expected
NOTEs TO THE FINANCIAl sTATEMENTs 31 MArCH 2009
NORFOLK ANNUAL REPORT 2009 55
For
per
sona
l use
onl
y

NOTEs TO THE FINANCIAl sTATEMENTs 31 MArCH 2009
Note 1. Significant accounting policies (continued)price volatility for the underlying share, the expected dividend yield and the risk-free interest rate for the term of the option.
Contributed equityOrdinary shares are classified as equity.
Incremental costs directly attributable to the issue of new shares or options are shown in equity as a deduction, net of tax, from the proceeds. Incremental costs directly attributable to the issue of new shares or options for the acquisition of a business are not included in the cost of the acquisition as part of the purchase consideration.
DividendsProvision is made for the amount of any dividend declared, being appropriately authorised and no longer at the discretion of the Company, on or before the end of the financial period but not distributed at balance date.
Business combinationsAccounting for business combinations under common controlThe acquisition by the Company of the Norfolk Group of Companies is regarded as a business combination involving companies under common control. Common control transactions are specifically scoped out of AASB 3 ‘Business Combinations’. Common control transactions are accounted for in the consolidated accounts prospectively from the date of obtaining the ownership interest. The directors have elected to use existing book values of assets and liabilities of the entities subject to the business combination (the Norfolk Group of Companies) and record the difference between the purchase price paid by the Company and the existing book value of the Norfolk Group of Companies immediately prior to the business combination as a reserve within equity described as common control reserve. Where equity instruments are issued as part of the consideration, the value of the instruments is their market price as at the acquisition date. Transaction costs arising on the issue of equity instruments are recognised directly in equity. Any dividends received from the Norfolk Group of Companies which are paid out of their pre-acquisition retained profits will not be recorded as income by the Company but will be credited against the cost of the investment in the Norfolk Group of Companies.
Purchase method of accountingThe purchase method of accounting is used to account for all non common control business combinations regardless of whether equity instruments or other assets are acquired. Cost is measured as the fair value of the assets given, shares issued or liabilities incurred or assumed at the date of exchange plus costs directly attributable to the acquisition. Identifiable assets acquired and liabilities and contingent liabilities assumed in a business combination are measured initially at their fair values at the acquisition date irrespective of the extent of any minority interest. The excess of cost of acquisition over the fair value of the Group’s share of the identifiable net assets acquired is recorded as goodwill.
Earnings per shareBasic earnings per shareBasic earnings per share is calculated by dividing the profit attributable to equity holders of the Company, excluding any costs of servicing equity other than ordinary shares, by the weighted average number of ordinary shares outstanding during the financial period, adjusted for bonus elements in ordinary shares issued during the period.
Diluted earnings per shareDiluted earnings per share adjusts the figures used in the determination of basic earnings per share to take into account the after income tax effect of interest and other financing costs associated with dilutive potential ordinary shares and the weighted average number of shares assumed to have been issued for no consideration in relation to dilutive potential ordinary shares.
Goods and Services Tax (GST)Revenues, expenses and assets are recognised net of the amount of associated GST, unless the GST incurred is not recoverable from the Australian Taxation Office (ATO). In this case it is recognised as part of the cost of acquisition of the asset or as part of the expense.
Receivables and payables are stated inclusive of the amount of GST receivable or payable. The net amount of GST recoverable from, or payable to, the ATO is included in other receivables or other payables in the balance sheet.
Cash flows are presented on a gross basis. The GST components of cash flows arising from investing or financing activities which are recoverable from, or payable to, the ATO are presented as operating cash flows.
Non-current assets (or disposal groups) held for sale and discontinued operationsNon-current assets (or disposal groups) are classified as held for sale if their carrying amount will be recovered principally through a sale transaction rather than through continuing use. They are measured at the lower of their carrying amount and fair value less costs to sell, except for assets such as deferred tax assets, assets arising from employee benefits, financial assets and investment property that are carried at fair value and contractual rights under insurance contracts, which are specifically exempt from this requirement.
An impairment loss is recognised for any initial or subsequent write-down of the asset (or disposal group) to fair value less costs to sell. A gain is recognised for any subsequent increases in fair value less costs to sell of an asset (or disposal group), but not in excess of any cumulative impairment loss previously recognised. A gain or loss not previously recognised by the date of the sale of the non-current asset (or disposal group) is recognised at the date of derecognition.
56 NORFOLK ANNUAL REPORT 2009
For
per
sona
l use
onl
y

Non-current assets (including those that are part of a disposal group) are not depreciated or amortised while they are classified as held for sale. Interest and other expenses attributable to the liabilities of a disposal group classified as held for sale continue to be recognised.
Non-current assets classified as held for sale and the assets of a disposal group classified as held for sale are presented separately from the other assets in the balance sheet. The liabilities of a disposal group classified as held for sale are presented separately from other liabilities in the balance sheet.
A discontinued operation is a component of the entity that has been disposed of or is classified as held for sale and that represents a separate major line of business or geographical area of operations, is part of a single co-ordinated plan to dispose of such a line of business or area of operations, or is a subsidiary acquired exclusively with a view to resale. The results of discontinued operations are presented separately on the face of the income statement.
Rounding of amountsThe Company is of a kind referred to in Class Order 98/100, issued by the Australian Securities and Investments Commission, relating to the ‘rounding-off’ of amounts in the financial report. Amounts in the financial report have been rounded off in accordance with that Class Order to the nearest thousand dollars, or in certain cases, the nearest dollar.
New accounting standards and interpretationsCertain new accounting standards and interpretations have been published that are not mandatory for the 31 March 2009 reporting periods. The consolidated entity’s assessments of the impact of these new standards and interpretations are set out below.
AASB 8 ‘Operating Segments’ and AASB 2007–3 ‘Amendments to Australian Accounting Standards arising from AASB 8’AASB 8 and AASB 2007–3 are effective for annual reporting periods commencing on or after 1 January 2009. AASB 8 will result in a significant change in the approach to segment reporting, as it requires adoption of a ‘management approach’ to reporting on financial performance. The information being reported will be based on what the key decision makers use internally for evaluating segment performance and deciding how to allocate resources to operating segments. The Group has not yet decided when to adopt AASB 8. Application of AASB 8 may result in different segments, different segment results and different types of information being reported in the segment note of the financial report. However, at this stage, it is not expected to affect any of the amounts recognised in the financial statements.
Revised AASB 123 ‘Borrowing Costs’ and AASB 2007–6 ‘Amendments to Australian Accounting Standards arising from AASB 123 (AASB 1, AASB 101, AASB 107, AASB 111, AASB 116 & AASB 138 and Interpretations 1 & 12)’The revised AASB 123 is applicable to annual reporting periods commencing on or after 1 January 2009. It has removed the option to expense all borrowing costs and – when adopted – will require the capitalisation of all borrowing costs directly attributable to the acquisition, construction or production of a qualifying asset. There will be no impact on the financial report of the Group, as the Group already capitalises borrowing costs relating to qualifying assets.
Revised AASB 101 ‘Presentation of Financial Statements’ and AASB 2007–8 ‘Amendments to Australian Accounting Standards arising from AASB 101’A revised AASB 101 was issued in September 2007 and is applicable for annual reporting periods beginning on or after 1 January 2009. It requires the presentation of a statement of comprehensive income and makes changes to the statement of changes in equity, but will not affect any of the amounts recognised in the financial statements. If an entity has made a prior period adjustment or has reclassified items in the financial statements, it will need to disclose a third balance sheet (statement of financial position), this one being as at the beginning of the comparative period. The Group intends to apply the revised standard from 1 April 2009.
Revised AASB 3 ‘Business Combinations’, AASB 127 ‘Consolidated and Separate Financial Statements’ and AASB 2008–3 ‘Amendments to Australian Accounting Standards arising from AASB 3 and AASB 127’ (effective 1 July 2009)The revised AASB 3 continues to apply the acquisition method to business combinations, but with some significant changes. For example, all payments to purchase a business are to be recorded at fair value at the acquisition date, with contingent payments classified as debt subsequently remeasured through the income statement. There is a choice on an acquisition-by-acquisition basis to measure the non-controlling interest in the acquiree either at fair value or at the non-controlling interest’s proportionate share of the acquiree’s net assets. All acquisition-related costs must be expensed. This is different to the Group’s current policy which is set out above.
The revised AASB 127 requires the effects of all transactions with non-controlling interests to be recorded in equity if there is no change in control and these transactions will no longer result in goodwill or gains and losses. The standard also specifies the accounting when control is lost. Any remaining interest in the entity is remeasured to fair value, and a gain or loss is recognised in profit or loss. This is consistent with the Group’s current accounting policy if significant influence is not retained.
The Group will apply the revised standards prospectively to all business combinations and transactions with non-controlling interests from 1 April 2010.
NOTEs TO THE FINANCIAl sTATEMENTs 31 MArCH 2009
NORFOLK ANNUAL REPORT 2009 57
For
per
sona
l use
onl
y

NOTEs TO THE FINANCIAl sTATEMENTs 31 MArCH 2009
Note 1. Significant accounting policies (continued)AASB 2008–1 ‘Amendments to Australian Accounting Standard – Share-based Payments: Vesting Conditions and Cancellations’ (effective 1 January 2009)AASB 2008–1 clarifies that vesting conditions are service conditions and performance conditions only and that other features of a share-based payment are not vesting conditions. It also specifies that all cancellations, whether by the entity or by other parties, should receive the same accounting treatment. The Group has applied the revised standard from 1 January 2009, but it has not affected the accounting for the Group’s share-based payments.
AASB 2008–6 ‘Further Amendments to Australian Accounting Standards arising from the Annual Improvements Project’ (effective 1 July 2009)The amendments to AASB 5 Discontinued Operations and AASB 1 First-Time Adoption of Australian-Equivalents to International Financial Reporting Standards are part of the IASB’s annual improvements project published in May 2008. They clarify that all of a subsidiary’s assets and liabilities are classified as held for sale if a partial disposal sale plan results in loss of control. Relevant disclosures should be made for this subsidiary if the definition of a discontinued operation is met. The Group will apply the amendments prospectively to all partial disposals of subsidiaries from 1 July 2009.
AASB 2008–7 ‘Amendments to Australian Accounting Standards – Cost of an Investment in a Subsidiary, Jointly Controlled Entity or Associate’ (effective 1 July 2009)In July 2008, the AASB approved amendments to AASB 1 First-time Adoption of International Financial Reporting Standards and AABS 127 Consolidated and Separate Financial Statements. The Group will apply the revised rules prospectively from 1 July 2009. After that date, all dividends received from investments in subsidiaries, jointly controlled entities or associates will be recognised as revenue, even if they are paid out of pre-acquisition profits, but the investments may need to be tested for impairment as a result of the dividend payment. Under the Group’s current policy, these dividends are deducted from the cost of the investment. Furthermore, when a new intermediate parent entity is created in internal reorganisations it will measure its investment in subsidiaries at the carrying amounts of the net assets of the subsidiary rather than the subsidiary’s fair value.
AASB Interpretation 16 ‘Hedges of a Net Investment in a Foreign Operation’ (effective 1 October 2008)AASB–I 16 clarifies which foreign currency risks qualify as hedged risk in the hedge of a net investment in a foreign operation and that hedging instruments may be held by any entity or entities within the group. It also provides guidance on how an entity should determine the amounts to be reclassified from equity to profit or loss for both the hedging instrument and the hedged item. The Group will apply the interpretation prospectively from 1 April 2009, but is not expected to have a material impact on the Group’s financial statements as the Group does not hedge its net investment in foreign operations.
AASB 2008–8 ‘Amendment to Australian Accounting Standards – Eligible Hedged Items’ (effective 1 July 2009)AASB 2008–8 amends AASB 139 Financial Instruments: Recognition and Measurement and must be applied retrospectively in accordance with AASB 108 Accounting Policies, Changes in Accounting Estimates and Errors. The amendment makes two significant changes. It prohibits designating inflation as a hedgeable component of a fixed rate debt. It also prohibits including time value in the one-sided hedged risk when designating options as hedges. The Group will apply the amended standard from 1 July 2009. It is not expected to have a material impact on the Group’s financial statements.
Note 2. Critical accounting estimates and judgementsEstimates and judgements are continually evaluated and are based on historical experience and other factors, including expectations of future events that may have a financial impact on the consolidated entity and that are believed to be reasonable under the circumstances.
Critical accounting estimates and assumptionsThe consolidated entity makes estimates and assumptions concerning the future. The resulting accounting estimates will, by definition, seldom equal the related actual results. The estimates and assumptions that have a significant risk of causing a material adjustment to the carrying amounts of assets and liabilities within the next financial year are discussed below.
Determining whether goodwill is impaired requires an estimation of the value in use of the cash-generating units to which goodwill has been allocated. The value in use calculation requires the consolidated entity to estimate the future cash flows expected to arise from the cash-generating unit and a suitable discount rate in order to calculate present value.
The assessment of costs to complete for installation contracts and the level of unapproved variations and claims to recognise is based on past experience for similar contracts and in accordance with the accounting policy detailed above.
Critical judgements in applying the consolidated entity’s accounting policiesThere are no critical judgements that are likely to affect the current or future financial periods.
58 NORFOLK ANNUAL REPORT 2009
For
per
sona
l use
onl
y

Note 3. Segment information – continuing operationsPrimary reporting – business segmentsThe consolidated entity is organised into four operating divisions: Electrical & Communications, Mechanical, Fire & Property Services and Corporate Services. These divisions are the basis on which the consolidated entity reports its primary segment information. The principal products and services of each of these divisions are as follows:
Electrical & Communications Designs, installs, commissions and maintains electrical and communications systems and products and also designs and manufactures energy control and measuring technology.
mechanical Provides a range of services including the design, construction, installation and maintenance of HVAC (heating, ventilation and air-conditioning) and refrigeration systems, duct cleaning services, plumbing and pipeline services.
Fire & Property Services Offers a broad range of products and services. This includes the manufacture, distribution and installation of fire containment and building products as well as the delivery of integrated facilities management.
Corporate Services Provides corporate services to the three divisions.
Fire & Intersegment Total Electrical & Property Corporate eliminations/ continuing Communications Mechanical Services Services unallocated operations 2009 $’000 $’000 $’000 $’000 $’000 $’000
Sales to external customers 374,423 281,560 87,089 – – 743,072Intersegment sales 653 369 586 – (1,608) –Other revenue 472 151 107 405 – 1,135
Total revenue 375,548 282,080 87,782 405 (1,608) 744,207Other income 90 89 (15) – – 164
Total segment revenue 375,638 282,169 87,767 405 (1,608) 744,371
Segment result – other 17,057 16,199 3,952 (8,264) – 28,944Impairment of SSRP receivable (13,487) – – – – (13,487)Inter-segment management fee – – – – – –
Total segment result 3,570 16,199 3,952 (8,264) – 15,457
Finance costs (net) (6,831)
Profit before income tax expense 8,626
Income tax expense (3,055)
Profit after income tax expense 5,571
Segment assets 141,711 117,396 32,736 323,286 (346,451) 268,678
Total assets 268,678
Segment liabilities 99,445 78,758 21,421 79,794 (41,611) 237,807
Total liabilities 237,807
Acquisition of non-current segment assets 1,801 2,959 330 1,337 – 6,427
Depreciation and amortisation expense 1,940 1,675 450 651 – 4,716
NOTEs TO THE FINANCIAl sTATEMENTs 31 MArCH 2009
NORFOLK ANNUAL REPORT 2009 59
For
per
sona
l use
onl
y

NOTEs TO THE FINANCIAl sTATEMENTs 31 MArCH 2009
Note 3. Segment information – continuing operations (continued)
Fire & Intersegment Total Electrical & Property Corporate eliminations/ continuing Communications Mechanical Services Services unallocated operations 2008 $’000 $’000 $’000 $’000 $’000 $’000
Sales to external customers 296,621 221,232 66,652 – – 584,505Intersegment sales 156 3,744 567 – (4,467) –Other revenue 644 78 220 13,399 (13,520) 821
Total revenue 297,421 225,054 67,439 13,399 (17,987) 585,326
Other income 58 203 98 (36) – 323
Total segment revenue 297,479 225,257 67,537 13,363 (17,987) 585,649
Segment result – other 17,944 14,287 3,960 (415) (4,448) 31,328
Inter-segment management fee (4,692) (2,785) (1,111) 8,588 – –
Total segment result 13,252 11,502 2,849 8,173 (4,448) 31,328
Finance costs (net) (4,802)
Profit before income tax expense 26,526
Income tax expense (8,057)
Profit after income tax expense 18,469
Segment assets 161,967 104,486 35,865 346,963 (372,761) 276,520
Total assets 276,520
Segment liabilities 107,235 60,813 22,927 114,730 (66,811) 238,894
Total liabilities 238,894
Acquisition of non-current segment assets 10,559 33,535 17,913 1,416 – 63,423
Depreciation and amortisation expense 1,794 1,427 504 579 – 4,304
60 NORFOLK ANNUAL REPORT 2009
For
per
sona
l use
onl
y

Secondary reporting – geographical segmentsThe consolidated entity operates in three geographical segments: Australia, New Zealand and Other.
Acquistion of Sales to external Segment non-current customers assets segment assets 2009 $’000 $’000 $’000
Australia 639,166 230,235 6,113New Zealand 100,762 37,446 228Other 3,144 997 86
743,072 268,678 6,427
Acquistion of Sales to external Segment non-current customers assets segment assets 2008 $’000 $’000 $’000
Australia 500,621 243,893 56,534New Zealand 81,230 31,871 4,886Other 2,654 756 2,003
584,505 276,520 63,423
Note 4. Revenue
Group Parent Group 10 months Parent 10 months 2009 2008 2009 2008 $’000 $’000 $’000 $’000
From continuing operationsSales revenue 743,072 584,505 – –Dividends received – – 15,760 2,415Interest received 423 366 – –Other revenue 712 455 – –
Revenue from continuing operations 744,207 585,326 15,760 2,415
Note 5. Other income
Group Parent Group 10 months Parent 10 months 2009 2008 2009 2008 $’000 $’000 $’000 $’000
From continuing operationsNet gain on sale of property, plant and equipment 164 323 – –
NOTEs TO THE FINANCIAl sTATEMENTs 31 MArCH 2009
NORFOLK ANNUAL REPORT 2009 61
For
per
sona
l use
onl
y

NOTEs TO THE FINANCIAl sTATEMENTs 31 MArCH 2009
Note 6. ExpensesProfit/(loss) before income tax from continuing operations includes the following specific expenses:
Group Parent Group 10 months Parent 10 months 2009 2008 2009 2008 $’000 $’000 $’000 $’000
Depreciation Leasehold improvements 519 324 – –Plant and equipment 1,817 1,106 – –Motor vehicles 1,746 1,693 – –
Total depreciation 4,082 3,123 – –
Amortisation Computer software 634 1,181 – –
Total amortisation 634 1,181 – –
Finance costs Interest and finance charges paid/payable 6,403 5,732 4,703 4,281(Gain)/loss on interest rate swaps and options 851 (564) – –
Finance costs expensed 7,254 5,168 4,703 4,281
Rental expense relating to operating leases Minimum lease payments 17,761 15,570 – –
Total rental expense relating to operating leases 17,761 15,570 – –
Defined contribution superannuation expense Defined contribution superannuation expense 15,919 10,469 25 110
Employee benefits expense Employee benefits expense 256,195 175,233 429 328
Impairment of investment in subsidiaries Impairment of investment in subsidiaries – – 84,865 –
62 NORFOLK ANNUAL REPORT 2009
For
per
sona
l use
onl
y

Note 7. Income tax expense/(benefit)
Group Parent Group 10 months Parent 10 months 2009 2008 2009 2008 Note $’000 $’000 $’000 $’000
Income tax expense/(benefit) Current tax 9,963 893 (3,550) –Deferred tax (7,796) 7,526 1,984 (1,383)Adjustments for deferred tax of prior periods 667 – 177 –Adjustments for current tax of prior periods (296) – – –
Aggregate income tax expense/(benefit) 2,538 8,419 (1,389) (1,383)
Income tax expense/(benefit) attributable to: Profit/(loss) from continuing operations 3,055 8,057 (1,389) (1,383)Profit/(loss) from discontinued operations (517) 362 – –
Aggregate income tax expense/(benefit) 2,538 8,419 (1,389) (1,383)
Deferred income tax expense/(benefit) included in income tax expense/(benefit) comprises:Decrease/(increase) in deferred tax assets 15 (7,129) 7,526 2,161 (1,383)
(7,129) 7,526 2,161 (1,383)
Numerical reconciliation of income tax expense/(benefit) to prima facie tax payableProfit/(loss) from continuing operations before income tax (expense)/benefit 8,626 26,526 (74,324) (2,194)
Profit/(loss) from discontinued operations before income tax (expense)/benefit (1,721) 808 – –
6,905 27,334 (74,324) (2,194)
Tax at the Australian tax rate of 30% 2,071 8,200 (22,298) (658)Tax effect amounts which are not deductible/(taxable) in calculating taxable income Non-taxable dividends – – (4,728) (725)Deferred tax assets not recognised 1 – – 25,460 –Sundry items 96 219 – –
2,167 8,419 (1,566) (1,383)
Adjustments for deferred tax of prior periods 667 – 177 –Adjustments for current tax of prior periods (296) – – –
Income tax expense/(benefit) 2,538 8,419 (1,389) (1,383)
1 The impairment of the investment in subsidiaries results in a temporary difference of $25,460,000. No deferred tax asset has been recognised for this temporary difference as it is unlikely to reverse in the foreseeable future
The parent and its wholly owned Australian resident entities became part of the same tax-consolidated group from 12 July 2007 and are therefore taxed as a single entity from that date. The head entity within the tax-consolidated group is Norfolk Group Limited.
Entities within the tax-consolidated group have entered into tax-funding arrangements and tax-sharing agreements with the head entity. Under the terms of the tax-funding arrangements, the tax-consolidated group and each of the entities within the tax-consolidated group agree to pay a tax equivalent payment to the head entity.
NOTEs TO THE FINANCIAl sTATEMENTs 31 MArCH 2009
NORFOLK ANNUAL REPORT 2009 63
For
per
sona
l use
onl
y

NOTEs TO THE FINANCIAl sTATEMENTs 31 MArCH 2009
Note 8. Current assets – cash and cash equivalents
Group Group Parent Parent 2009 2008 2009 2008 $’000 $’000 $’000 $’000
Cash on hand 158 159 – –Cash at bank 13,105 11,853 169 121
13,263 12,012 169 121
Note 9. Current assets – trade and other receivables
Group Group Parent Parent 2009 2008 2009 2008 $’000 $’000 $’000 $’000
Trade receivables 131,831 107,263 – –Less: Provision for impairment of receivables (14,980) (1,614) – –
116,851 105,649 – –
Other receivables 1,566 58 107 –Unbilled contract works 47,179 76,225 – –Prepayments 4,773 4,620 169 304Dividends receivable – – 43 43
170,369 186,552 319 347
Trade receivables includes $3,089,000 (2008: $4,634,000) of customer retentions.
Bad and doubtful trade receivablesThe consolidated entity has recognised an expense of $13,743,000 (2008: $396,000 income) in respect of bad and doubtful trade receivables during the period ended 31 March 2009. The expense has been included in ‘administrative expenses’ in the income statement.
Impairment of receivablesThe aging of the impairment of receivables recognised above is as follows:
Group Group Parent Parent 2009 2008 2009 2008 Note $’000 $’000 $’000 $’000
Over 6 months 14,980 1,614 – –
Movements in the provision for impairment of receivables are as follows: – –Opening balance 1,614 – – –Foreign exchange differences (12) – – –Additions through business combinations 33 – 2,131 – –Provision for impairment recognised during the year1 13,743 – – –Receivables written off during the period as uncollectible (365) (121) – –Unused amounts reversed – (396) – –
Closing balance 14,980 1,614 – –
1 Included in this amount is a one-off impairment charge of $13,487,000 in relation to a receivable from the SSR Project in Western Australia. The Company is continuing to pursue its rights in relation to this project
64 NORFOLK ANNUAL REPORT 2009
For
per
sona
l use
onl
y

Past due but not impairedCustomers with balances past due but without provision for doubtful debts amount to $10,779,000 at 31 March 2009 (2008: $9,783,000). Management did not consider there to be a credit risk on the aggregate balances after reviewing agency credit information and recognising a tacit extension to the recorded credit terms of customers based on recent collection practices.
The aging of receivables past due but not impaired is as follows:
Group Group Parent Parent 2009 2008 2009 2008 $’000 $’000 $’000 $’000
1 to 3 months 7,776 7,091 – –3 to 6 months 1,775 2,611 – –Over 6 months 1,228 81 – –
10,779 9,783 – –
The Group’s policy requires customers to pay the Group in accordance with agreed payment terms. The Group’s settlement terms are generally 30 days from date of invoice. All credit and recovery risk associated with trade receivables has been provided for in the balance sheet. Trade receivables have been aged according to their original due date in the above aging analysis.
The Group has used the following basis to assess the impairment provision for trade receivables:
a provision based on historical bad debt experience �
an individual account-by-account specific risk assessment based on past credit history �
any prior knowledge of debtor insolvency or other credit risk. �
The Group holds no significant security or guarantees against receivables.
Note 10. Current assets – inventories
Group Group Parent Parent 2009 2008 2009 2008 $’000 $’000 $’000 $’000
Finished goods – at cost 8,964 11,596 – –Less: Provision for obsolescence (921) (1,281) – –
Finished goods – at net realisable value 8,043 10,315 – –
Write-downs of inventory to net realisable value recognised as an expense during the period ended 31 March 2009 amounted to $211,000 (2008: $15,000).
Contracts in progress are made up as follows:
Group Group Parent Parent 2009 2008 2009 2008 Note $’000 $’000 $’000 $’000
Contract costs incurred plus recognised profits less recognised losses 572,316 779,114 – –Less: Progress billings (563,411) (745,748) – –
8,905 33, 366 – –
Contract work billed in advance 16 (38,274) (42,859) – –Unbilled contract works 9 47,179 76,225 – –
8,905 33,366 – –
NOTEs TO THE FINANCIAl sTATEMENTs 31 MArCH 2009
NORFOLK ANNUAL REPORT 2009 65
For
per
sona
l use
onl
y

NOTEs TO THE FINANCIAl sTATEMENTs 31 MArCH 2009
Note 11. Derivative financial instruments
Group Group Parent Parent 2009 2008 2009 2008 $’000 $’000 $’000 $’000
Non-current assets Interest rate swap contracts – 100 – –Interest rate call options – 464 – –Current liabilities Interest rate swap contracts (1,540) – – –Interest rate call options 3 – – –
(1,537) 564 – –
Norfolk is party to derivative financial instruments in the normal course of business in order to hedge exposure to fluctuations in interest rate movements in accordance with the Group’s financial risk management policies.
Interest rate swapsOn 31 July 2007 Norfolk Group Holdings Pty Limited, a subsidiary, entered into an interest rate swap transaction with the ANZ Banking Group Limited hedging variable rate borrowings in Australian dollars. The contract fixed rate is 7.10% p.a. for AU$20 million and expires on 1 August 2010. The contract requires settlement of payable or receivables every three months, commencing 3 November 2008. At balance date the payable amount by Norfolk was $1,189,000 (2008: $129,000 receivable).
On 31 July 2007 Norfolk Building Products Limited, a subsidiary, entered into an interest rate swap transaction with the Westpac Banking Corporation hedging variable rate borrowings in New Zealand dollars. The contract fixed rate is 8.3475% p.a. for NZ$6 million and expires on 2 August 2010. The contract requires settlement of payable or receivables every three months, commencing 1 November 2008. At balance date the payable amount by Norfolk was $351,000 (2008: $29,000).
Interest rate call optionsOn 31 July 2007 Norfolk Group Holdings Pty Limited, a subsidiary, entered into an interest option contract with the ANZ Banking Group Limited as its underlying interest security for a debt obligation. The purchase interest rate cap contract strike rate is 7.20% p.a. for AU$40 million and expires on 1 August 2010. The contract requires settlement of payable or receivables every three months, commencing 3 November 2008. At balance date the receivable amount due to Norfolk was $3,000 (2008: $435,000).
On 31 July 2007 Norfolk Building Products Limited, a subsidiary, entered into an interest option contract with the Westpac Banking Corporation as its underlying interest security for a debt obligation. The purchase interest rate cap contract strike rate is 8.21% p.a. for NZ$6 million and expires on 2 August 2010. The contract requires settlement of payable or receivables every three months, commencing 1 November 2008. At balance date the receivable amount due to Norfolk was $nil (2008: $29,000).
Note 12. Non-current assets – other financial assets
Group Group Parent Parent 2009 2008 2009 2008 Note $’000 $’000 $’000 $’000
Shares in subsidiaries – at cost 34 – – 329,258 329,258Provision for impairment – – (84,865) –
– – 244,393 329,258
An impairment charge against the carrying value of the investment in subsidiaries in the parent was recorded after a review of the value in use calculation, taking into account the current economic environment. Key assumptions used in the value in use calculation include a post-tax discount rate of 9.5% (pre-tax rate 13.5%), expected future profits and future annual growth for the first five years and a terminal value. Sensitivity analysis is used to determine whether the carrying value is supported by different assumptions.
66 NORFOLK ANNUAL REPORT 2009
For
per
sona
l use
onl
y

Note 13. Non-current assets – property, plant and equipment
Group Group Parent Parent 2009 2008 2009 2008 $’000 $’000 $’000 $’000
Leasehold improvements – at cost 4,291 4,205 – –Less: Accumulated depreciation (2,696) (2,410) – –
1,595 1,795 – –
Plant and equipment – at cost 14,686 13,620 – –Less: Accumulated depreciation (9,589) (9,430) – –
5,097 4,190 – –
Plant and equipment under lease 718 430 – –Less: Accumulated depreciation (296) (77) – –
422 353 – –
Motor vehicles – at cost 6,401 5,500 – –Less: Accumulated depreciation (4,597) (3,548) – –
1,804 1,952 – –
Motor vehicles under lease 5,705 8,162 – –Less: Accumulated depreciation (3,778) (5,069) – –
1,927 3,093 – –
10,845 11,383 – –
ReconciliationsReconciliations of the book values at the beginning and end of the current and previous financial periods are set out below:
Plant Vehicles Leasehold Plant and under Motor under improvements equipment lease vehicles lease Group Note $’000 $’000 $’000 $’000 $’000 $’000
GroupAdditions 354 1,300 – 668 – 2,322Additions through business combinations 33 1,868 4,196 430 4,224 3,492 14,210Disposals (76) (191) – (1,606) – (1,873)Foreign exchange differences (27) (72) – (4) – (103)Depreciation expense (324) (1,043) (77) (1,330) (399) (3,173)
Balance 31 march 2008 1,795 4,190 353 1,952 3,093 11,383
Additions 339 2,806 112 593 662 4,512Additions through business combinations 33 – 5 – 68 – 73Disposals (6) (101) – – (881) (988)Foreign exchange differences (14) (20) – (1) – (35)Depreciation expense (519) (1,783) (43) (808) (947) (4,100)
Balance 31 march 2009 1,595 5,097 422 1,804 1,927 10,845
NOTEs TO THE FINANCIAl sTATEMENTs 31 MArCH 2009
NORFOLK ANNUAL REPORT 2009 67
For
per
sona
l use
onl
y

NOTEs TO THE FINANCIAl sTATEMENTs 31 MArCH 2009
Note 14. Non-current assets – intangibles
Group Group Parent Parent 2009 2008 2009 2008 $’000 $’000 $’000 $’000
Goodwill – at cost 39,274 38,025 – –
Brands – at cost 6,147 6,226 – –
Computer software – at cost 4,222 3,935 – –Less: Accumulated amortisation (2,806) (2,534) – –
1,416 1,401 – –
46,837 45,652 – –
ReconciliationsReconciliations of the book values at the beginning and end of the current and previous financial periods are set out below:
Computer Goodwill Brands software Group Note $’000 $’000 $’000 $’000
Group Additions through business combinations 33 38,025 6,226 2,639 46,890Foreign exchange differences – – (46) (46)Amortisation expense – – (1,192) (1,192)
Balance 31 march 2008 38,025 6,226 1,401 45,652
Additions – – 619 619Additions through business combinations 1,330 – – 1,330Transfer of assets – (52) 52 –Foreign exchange differences (81) (27) (9) (117)Amortisation expense – – (647) (647)
Balance 31 march 2009 39,274 6,147 1,416 46,837
Impairment tests for goodwill and brandsGoodwill and brands are allocated to the Group’s cash generating units (‘CGUs’).
A segment level summary of the goodwill allocation is presented below:
Goodwill Brands Goodwill Brands 2009 2009 2008 2008 $’000 $’000 $’000 $’000
Electrical & Communications division 1,409 765 1,409 765Mechanical division 23,255 4,666 21,977 4,666Fire & Property Services division 14,610 716 14,639 795
39,274 6,147 38,025 6,226
68 NORFOLK ANNUAL REPORT 2009
For
per
sona
l use
onl
y

The recoverable amount of a CGU is determined based on value in use calculations. These calculations use cash flow projections based on financial budgets approved by management for a 12 month period. Cash flows beyond the 12 month period are calculated using the estimated growth rates stated below. The growth rate, unless a higher rate is justified, does not exceed the long-term average growth rate for the industry in which the CGU operates.
Brands have been assessed as having an indefinite useful life. This has been determined based on management’s intention to maintain the use of the Brands carried, the historical application of the Brands and the profitability of the businesses utilising the Brands.
Key assumptions used for value in use calculations
EBIT margin1 Revenue growth rate2 Discount rate3
2009 2008 2009 2008 2009 2008 % % % % % %
Electrical & Communications division 5.3 5.2 3.0 4.9 13.5 17.1Mechanical division 5.4 5.9 3.1 3.0 13.5 17.1Fire & Property Services division 3.5 5.0 4.7 8.6 13.5 17.1
1 Weighted average EBIT margin2 Weighted average growth rate used to extrapolate cash flows beyond the budget period3 In performing the value in use calculations for each CGU, the Group has applied pre-tax discount rates to discount the forecast future
attributable pre-tax cash flows
These assumptions have been used for the analysis of each CGU within the business segment. Management determined budgeted EBIT margins and revenue growth rates based on past performance and its expectations for the future. The weighted average EBIT margins and revenue growth rates used are consistent with forecasts included in industry reports. The discount rates used reflect specific risks relating to the relevant segments in which they operate.
Impact of possible changes in key assumptionsThe recoverable amount of the goodwill for Resolve FM Pty Limited (a component of the Fire and Property Services segment) is estimated to be $20,279,000. This exceeds the carrying amount of the Resolve FM goodwill at 31 March 2009 by $5,521,000. If the future annual revenue growth rate for Resolve FM Pty Limited were to reduce to 3% p.a., the recoverable amount of this CGU’s goodwill would equal its carrying amount.
The recoverable amount of the goodwill of Ductclean Australia Pty Limited (a component of the Mechanical segment) is estimated to be $1,828,000. This approximates the carrying amount of the Ductclean Australia Pty Limited goodwill of $1,813,000 at 31 March 2009. Any decrease in the future annual revenue growth rate or EBIT margin or increase in discount rate for Ductclean Australia Pty Limited would result in a reduction in its goodwill carrying amount.
Management does not consider a change in any of the other key assumptions on which management has based its determination of the above CGU’s goodwill carrying value to be reasonably possible.
NOTEs TO THE FINANCIAl sTATEMENTs 31 MArCH 2009
NORFOLK ANNUAL REPORT 2009 69
For
per
sona
l use
onl
y

NOTEs TO THE FINANCIAl sTATEMENTs 31 MArCH 2009
Note 15. Non-current assets – deferred tax
Group Group Parent Parent 2009 2008 2009 2008 Note $’000 $’000 $’000 $’000
The balance comprises temporary differences attributable to: Amounts recognised in profit or loss:Doubtful debts 448 436 – –Employee benefits 8,429 10,949 608 –Accrued expenses 1,181 823 – –Losses recognised 4,133 4,375 3,012 4,375Inventory provisions 279 356 – –Other provisions 2,056 799 – –Property, plant and equipment (14) (42) – –Prepayments (633) (359) – –Work in progress (217) (10,898) – –Retentions (238) (547) – –Other 135 44 – –
15,559 5,936 3,620 4,375
Amounts recognised in equity:Transaction costs on share issue 2,700 4,106 2,700 4,106Cash flow hedges 374 – – –
3,074 4,106 2,700 4,106
Deferred tax asset 18,633 10,042 6,320 8,481
Deferred tax asset to be recovered within 12 months 13,702 4,236 4,521 6,017Deferred tax asset to be recovered after more than 12 months 4,931 5,806 1,799 2,464
18,633 10,042 6,320 8,481
movements:Opening balance 10,042 – 8,481 –Foreign exchange differences (21) – – –Additions through business combinations 33 – 13,462 – –Transfer of tax losses 1,109 – – 2,992Credited/(charged) to the income statement 7 7,129 (7,526) (2,161) 1,383Credited/(charged) to equity 374 4,106 – 4,106
Closing balance 18,633 10,042 6,320 8,481
Note 16. Current liabilities – trade and other payables
Group Group Parent Parent 2009 2008 2009 2008 $’000 $’000 $’000 $’000
Trade payables 77,079 64,542 – –Contract work billed in advance 38,274 42,859 – –Employee benefits 27,125 23,984 – –Other payables 14,653 30,989 33,901 43,022
157,131 162,374 33,901 43,022
70 NORFOLK ANNUAL REPORT 2009
For
per
sona
l use
onl
y

Amounts not expected to be settled within the next 12 monthsEmployee benefits include accruals for annual leave. The entire obligation is presented as current, since the Group does not have an unconditional right to defer settlement. However, based on past experience, the Group does not expect all employees to take the full amount of accrued leave within the next 12 months. The following amounts reflect leave that is not expected to be taken within the next 12 months:
Group Group Parent Parent 2009 2008 2009 2008 $’000 $’000 $’000 $’000
Annual leave obligation expected to be settled after 12 months 4,494 5,974 – –
Note 17. Current liabilities – borrowings
Group Group Parent Parent 2009 2008 2009 2008 $’000 $’000 $’000 $’000
Bank loans 60,833 – 48,000 –Lease liabilities 988 3,665 – –
61,821 3,665 48,000 –
Refer to notes 1 and 35 for further information.
Financing arrangementsAccess was available at balance date to the following lines of credit:
Group Group Parent Parent 2009 2008 2009 2008 $’000 $’000 $’000 $’000
Total facilities Bank overdraft 20,000 20,000 20,000 20,000Bank loans 110,000 110,000 110,000 110,000
130,000 130,000 130,000 130,000
Used at balance date Bank overdraft – – – –Bank loans 60,833 62,443 48,000 50,000
60,833 62,443 48,000 50,000
Unused at balance date Bank overdraft 20,000 20,000 20,000 20,000Bank loans 49,167 47,557 62,000 60,000
69,167 67,557 82,000 80,000
The Australian and New Zealand entities within the Group are jointly and severally liable for the above facilities and a cross guarantee has been provided to the lenders.
The fair value of borrowings (current and non-current) approximates their book value.
Note 18. Current liabilities – income tax
Group Group Parent Parent 2009 2008 2009 2008 $’000 $’000 $’000 $’000
Provision for income tax 6,708 99 7,110 –
NOTEs TO THE FINANCIAl sTATEMENTs 31 MArCH 2009
NORFOLK ANNUAL REPORT 2009 71
For
per
sona
l use
onl
y

NOTEs TO THE FINANCIAl sTATEMENTs 31 MArCH 2009
Note 19. Current liabilities – provisions
Group Group Parent Parent 2009 2008 2009 2008 $’000 $’000 $’000 $’000
Provisions – long service leave 5,204 5,261 – –Provisions – warranties 754 1,382 – –Provisions – other 971 – – –
6,929 6,643 – –
WarrantiesProvision is made for the estimated warranty claims in respect of products sold or work undertaken which still remains under warranty at balance date. These claims are expected to be settled in the next financial year. Management estimates the provision based on historical warranty claim information and any recent trends that may suggest future claims could differ from historical amounts.
Movements in provisionsMovements in each class of provision during the current and previous financial periods, other than employee benefits, are set out below:
LTI plan Warranties Other Group Note $’000 $’000 $’000 $’000
Group – 2009Carrying amount at the start of the period – 1,382 – 1,382Foreign exchange movements – (13) – (13)Transfer from payables – – 834 834Additional provisions recognised – 1,055 137 1,192Amounts used during the period – (1,318) – (1,318)Unused amounts reversed – (352) – (352)
Carrying amount at the end of the period – 754 971 1,725
Group – 2008 Carrying amount at the start of the period – – – –Additions through business combinations 33 667 3,615 584 4,866Additional provisions recognised – 1,081 – 1,081Amounts used during the period (667) (2,265) (84) (3,016)Unused amounts reversed – (1,049) (500) (1,549)
Carrying amount at the end of the period – 1,382 – 1,382
Amounts not expected to be settled within the next 12 monthsThe current provision for long service leave includes all unconditional entitlements where employees have completed the required period of service and also those where employees are entitled to pro-rata payments in certain circumstances. The entire amount is presented as current, since the Group does not have an unconditional right to defer settlement. However, based on past experience, the Group does not expect all employees to take the full amount of accrued long service leave or require payment within the next 12 months. The following amounts reflect leave that is not expected to be taken or paid within the next 12 months:
Group Group Parent Parent 2009 2008 2009 2008 $’000 $’000 $’000 $’000
Long service leave obligation expected to be settled after 12 months 3,791 4,108 – –
72 NORFOLK ANNUAL REPORT 2009
For
per
sona
l use
onl
y

Note 20. Non-current liabilities – borrowings
Group Group Parent Parent 2009 2008 2009 2008 $’000 $’000 $’000 $’000
Bank loans – 62,443 – 50,000Lease liabilities 942 369 – –
942 62,812 – 50,000
Total secured lease liabilitiesThe total secured lease liabilities (current and non-current) are as follows:
Lease liabilities 1,930 4,034 – –
Assets pledged as securityThe lease liabilities are effectively secured as the rights to the leased assets recognised in the balance sheet revert to the lessor in the event of default.
Further information regarding bank loans is disclosed in note 17.
Note 21. Non-current liabilities – provisions
Group Group Parent Parent 2009 2008 2009 2008 $’000 $’000 $’000 $’000
Provisions – long service leave 1,682 2,244 – –Provisions – warranties 1,057 1,057 – –
2,739 3,301 – –
WarrantiesProvision is made for the estimated warranty claims in respect of products sold or work undertaken which still remains under warranty at balance date. These claims are not expected to be settled in the next financial year. Management estimates the provision based on historical warranty claim information and any recent trends that may suggest future claims could differ from historical amounts.
Movements in provisionsMovements in each class of provision during the current and previous financial periods, other than employee benefits, are set out below:
LTI plan Warranties Group Note $’000 $’000 $’000
Group – 2009Carrying amount at the start of the period – 1,057 1,057Additions through business combinations – – –Amounts used during the period – – –Unused amounts reversed – – –
Carrying amount at the end of the period – 1,057 1,057
Group – 2008Carrying amount at the start of the period – – –Additions through business combinations 33 755 2,032 2,787Amounts used during the period (755) – (755)Unused amounts reversed – (975) (975)
Carrying amount at the end of the period – 1,057 1,057
NOTEs TO THE FINANCIAl sTATEMENTs 31 MArCH 2009
NORFOLK ANNUAL REPORT 2009 73
For
per
sona
l use
onl
y

NOTEs TO THE FINANCIAl sTATEMENTs 31 MArCH 2009
Note 22. Equity – contributed
Group Group Parent Parent 2009 2009 2009 2009 Shares $’000 Shares $’000
Ordinary shares – fully paid 130,000,000 243,919 130,000,000 243,919
movements in ordinary share capital
Details Date No of shares Price $’000
New corporation 31 May 2007 2 $1.00 –Cancellation of initial shares 23 July 2007 (2) $1.00 –Issue of shares pursuant to issue of Prospectus 23 July 2007 130,000,000 $1.95 253,500Less costs related to the issue of shares, net of deferred tax (9,581)
Balance 31 march 2008 130,000,000 243,919
Balance 31 march 2009 130,000,000 243,919
Ordinary sharesOrdinary shares entitle the holder to participate in dividends and the proceeds on winding up the Company in proportion to the number of and amounts paid on the shares held. The fully paid ordinary shares have no par value.
On a show of hands every holder of ordinary shares present in a meeting, in person or by proxy, is entitled to one vote, and upon a poll each share is entitled to one vote.
Note 23. Equity – reserves
Group Group Parent Parent 2009 2008 2009 2008 $’000 $’000 $’000 $’000
Foreign currency reserve 44 234 – –Share-based payments reserve 2,027 2,077 2,027 2,077Hedging reserve – cash flow hedges (872) – – –Common control reserve (227,519) (227,519) – –
(226,320) (225,208) 2,027 2,077
74 NORFOLK ANNUAL REPORT 2009
For
per
sona
l use
onl
y

Foreign Share-based Hedging Common currency payments reserve control Group $’000 $’000 $’000 $’000 $’000
Group Balance 31 March 2008 234 2,077 – (227,519) (225,208)Currency translation differences (190) – – – (190)Changes in the fair value of cash flow hedges – – (1,246) – (1,246)Tax effect of changes in the fair value of cash flow hedges – – 374 – 374Share-based payments – (50) – – (50)
Balance 31 march 2009 44 2,027 (872) (227,519) (226,320)
Balance 31 May 2007 – – – – –Currency translation differences 234 – – – 234Acquisition of entities under common control – – – (227,519) (227,519)Acquisition entities obligation settled through issue of options – 1,610 – – 1,610Share-based payments – 467 – – 467
Balance 31 march 2008 234 2,077 – (227,519) (225,208)
Parent Balance 31 March 2008 – 2,077 – – 2,077Acquisition entities obligation settled through issue of options – – – – – Share-based payments – (50) – – (50)
Balance 31 march 2009 – 2,027 – – 2,027
Balance 31 May 2007 – – – – –Acquisition entities obligation settled through issue of options – 1,610 – – 1,610Share-based payments – 467 – – 467
Balance 31 march 2008 – 2,077 – – 2,077
Foreign currency reserveExchange differences arising on translation of the foreign controlled entities are taken to the foreign currency reserve. The reserve is recognised in profit and loss when the net investment is disposed of.
Share-based payments reserveThe share-based payments reserve is used to recognise the fair value of share-based payments provided to employees as part of their compensation. This reserve includes benefits for past services as well as future service periods.
Common control reserveAny difference between the cost of acquisition (fair value of consideration paid) and the amounts at which the assets and liabilities acquired are recorded for business combinations under common control (refer to note 1 for business combinations accounting policy) have been recognised in the common control reserve.
Hedging reserveThe hedging reserve is used to record gains or losses on a hedging instrument in a cash flow hedge that are recognised directly in equity as described in note 1. Amounts are recognised in profit and loss when the associated hedged transaction affects profit and loss.
NOTEs TO THE FINANCIAl sTATEMENTs 31 MArCH 2009
NORFOLK ANNUAL REPORT 2009 75
For
per
sona
l use
onl
y

NOTEs TO THE FINANCIAl sTATEMENTs 31 MArCH 2009
Note 24. Equity – retained profits/(accumulated losses)
Group Group Parent Parent 2009 2008 2009 2008 $’000 $’000 $’000 $’000
Retained profits/(accumulated losses) at the beginning of the financial period 18,892 – (811) –Profit/(loss) after income tax (expense)/benefit 4,335 18,892 (72,935) (811)Dividends (10,010) – (10,010) –
Retained profits/(accumulated losses) at the end of the financial period 13,217 18,892 (83,756) (811)
Note 25. Equity – minority interest
Group Group Parent Parent 2009 2008 2009 2008 $’000 $’000 $’000 $’000
Retained profits 55 23 – –
Note 26. Equity – dividends
Parent Parent 2009 2008 $’000 $’000
Final fully franked dividend for the period ended 31 March 2008 of 5.7 cents per issued ordinary share 7,410 –Interim fully franked dividend for the year ended 31 March 2009 of 2.0 cents per issued ordinary share1 2,600 –
Total dividends provided for or paid 10,010 –
1 Paid out of profits for the half year ended 30 September 2008
No final dividend was declared
Franking credits available for subsequent financial years based on a tax rate of 30% 7,110 –
The above amounts represent the balance of the franking account as at the end of the financial period, adjusted for:
franking credits that will arise from the payment of the amount of the provision for income tax �
franking credits that will arise from the payment of dividends recognised as a liability at the reporting date �
franking credits that will arise from the receipt of dividends recognised as receivables at the reporting date. �
Note 27. Financial risk managementFinancial risk management objectivesThe Group’s activities expose it to a variety of financial risks: market risk (including currency risk and interest rate risk), credit risk and liquidity risk. The Group’s overall risk management programme focuses on the unpredictability of financial markets and seeks to minimise potential adverse effects on the financial performance of the Group. The Group uses derivative financial instruments such as foreign exchange contracts and interest rate swaps to hedge certain risk exposures. Derivatives are exclusively used for hedging purposes, i.e. not as trading or other speculative instruments. The Group uses different methods to measure different types of risk to which it is exposed. These methods include sensitivity analysis in the case of interest rate and foreign exchange and aging analysis for credit risk.
Risk management is carried out by senior finance employees (‘finance’) under policies approved by the Board of Directors. Finance identifies, evaluates and hedges financial risks within the Group’s operating units.
76 NORFOLK ANNUAL REPORT 2009
For
per
sona
l use
onl
y

Market riskForeign exchange riskThe Group operates internationally and is exposed to foreign exchange risk arising from various currency exposures, primarily with respect to the NZ dollar and the Indian rupee.
Foreign exchange risk arises when future commercial transactions and recognised assets and liabilities are denominated in a currency that is not the entity’s functional currency and net investments in foreign operations. The risk is measured using sensitivity analysis and cash flow forecasting.
Management has set up a policy requiring Group companies to manage their foreign exchange risk. The Group companies are required to hedge their foreign exchange risk exposure arising from future commercial transactions. The Group does not hedge its net investments in foreign operations.
The Group’s risk management policy is to hedge all significant future transactions in foreign currency. The carrying amount of the Group’s financial assets and liabilities at the reporting date is denominated in Australian dollars except as set out below:
2009 2009 2008 2008 NZD rupee NZD rupee $’000 $’000 $’000 $’000
Trade receivables 18,848 568 16,898 429Bank loans 12,833 – 12,443 –Trade payables 8,300 216 6,168 395Other payables 6,615 217 7,190 –
Based on the financial instruments held at 31 March 2009, the Group and the parent are not exposed to any foreign exchange risk outside of translational adjustments.
Price riskThe Group and the parent entity are not exposed to price risk.
Cash flow and fair value interest rate riskThe Group’s main interest rate risk arises from long-term borrowings. Borrowings issued at variable rates expose the Group to cash flow interest rate risk. Group policy is to maintain approximately 50% of its borrowings at fixed rate using interest rate swaps to achieve this when necessary. During 2009, the Group’s borrowings at variable rates were denominated in Australian dollars and New Zealand dollars. As at the reporting date, the Group had the following variable rate borrowings and interest rate swap contracts outstanding:
2009 2008 Weighted Weighted average average interest 2009 interest 2008 rate Balance rate Balance % $’000 % $’000
Bank loans 7.29 60,833 8.25 62,443Interest rate swaps and options (notional principal amount) 7.33 69,935 7.33 70,386
Net exposure to cash flow interest rate risk (9,102) (7,943)
An analysis by maturities is provided in ‘liquidity risk’ below.
The Group’s facility agreement requires it to manage its cash flow interest rate risk by using floating to fixed interest rate swaps. Such interest rate swaps have the economic effect of converting borrowings from floating rates to fixed rates. Under the interest rate swaps, the Group agrees with other parties to exchange, at specified intervals (mainly quarterly), the difference between fixed contract rates and floating rate interest amounts calculated by reference to the agreed notional principal amounts.
At 31 March 2009, if interest rates had changed by –/+ 100 basis points from the period end rates with all other variables held constant, post-tax profit on an annualised basis would have been $427,000 (2008: $437,500) for the Group and $336,000 (2008: $350,000) for the parent lower/higher, mainly as a result of higher/lower interest expense on borrowings. Accordingly, the equity would have been lower/higher by $427,000 (2008: $437,500) and $336,000 (2008: $350,000) respectively for the Group and parent.
NOTEs TO THE FINANCIAl sTATEMENTs 31 MArCH 2009
NORFOLK ANNUAL REPORT 2009 77
For
per
sona
l use
onl
y

NOTEs TO THE FINANCIAl sTATEMENTs 31 MArCH 2009
Note 27. Financial risk management (continued)Credit riskCredit risk is managed on a Group and segmental basis. Credit risk arises from cash and cash equivalents, derivative financial instruments and deposits with banks and financial institutions, as well as credit exposures to customers, including outstanding receivables. Credit control assesses the credit quality of the customer, taking into account its financial position, past experience and other factors. Individual risk limits are set based on internal and external ratings in accordance with limits set by the Board. The compliance with credit limits by customers is regularly monitored by divisional management.
The maximum exposure to credit risk at the reporting date is the carrying amount of the financial assets totalling $183,632,000 (2008:$199,128,000). For some trade receivables the Group may obtain security in the form of guarantees, deeds of undertaking or letters of credit which can be called upon if the counterparty is in default under the terms of the agreement.
The Group has no significant concentration of credit risk but is exposed in general to the construction and infrastructure sector.
There are no notable differences between the credit risk exposures in Australia and New Zealand.
Further details on the Group’s credit risk is included in note 9.
Liquidity riskPrudent liquidity risk management requires maintaining sufficient cash and the availability of funding through an adequate availability of credit under committed credit facilities. The Group manages liquidity risk by continuously monitoring forecast and actual cash flows and matching the maturity profiles of financial assets and liabilities. Due to the dynamic nature of the underlying businesses, the Group aims at maintaining flexibility in funding by keeping committed credit lines available.
Financing arrangementsUndrawn borrowing facilities at the reporting date to which the Group and the parent entity had access are disclosed in note 17.
The bank overdraft facility may be drawn at any time and is subject to annual review. Subject to the continuance of satisfactory credit ratings and the matters detailed in note 1, the bank loan facility may be drawn at any time in either Australian or New Zealand dollars and has a term ending in July 2010.
Liquidity and interest risk tablesThe following tables detail the Group’s and parent entity’s remaining contractual maturity for its non-derivative financial instruments. The tables have been drawn up based on the undiscounted cash flows of financial liabilities based on the earliest date on which the Group and parent can be required to pay. The tables include both interest and principal cash flows, disclosed as remaining contractual maturities, and these totals differ from their carrying amount in the balance sheet for interest-bearing liabilities due to the interest component.
Weighted average Remaining interest 1 year Over 1 to Over 2 to Over 3 to contractual rate or less 2 years 3 years 4 years maturities 2009 % $’000 $’000 $’000 $’000 $’000
Group Non-interest bearing Trade payables – 77,079 – – – 77,079Other payables – 52,927 – – – 52,927Derivatives Derivative financial instruments – 1,537 – – – 1,537Interest bearing – variable rate Bank loans 3.96 60,833 – – – 60,833Interest bearing – fixed rate Lease liabilities 8.43 1,113 809 15 187 2,124
193,489 809 15 187 194,500
Parent Non-interest bearing Other payables – – – – – –Interest bearing – variable rate Bank loans 3.92 48,000 – – – 48,000
48,000 – – – 48,000
78 NORFOLK ANNUAL REPORT 2009
For
per
sona
l use
onl
y

Weighted average Remaining interest 1 year Over 1 to Over 2 to Over 3 to contractual rate or less 2 years 3 years 4 years maturities 2008 % $’000 $’000 $’000 $’000 $’000
Group Non-interest bearingTrade payables – 64,542 – – – 64,542Other payables – 73,848 – – – 73,848Interest bearing – variable rate Bank loans 8.25 5,152 5,152 63,731 – 74,035Interest bearing – fixed rate Lease liabilities 7.59 4,167 386 – – 4,553
147,709 5,538 63,731 – 216,978
Parent Non-interest bearingOther payables – 5,623 – – – 5,623Interest bearing – variable rate Bank loans 8.22 4,110 4,110 51,028 – 59,248
9,733 4,110 51,028 – 64,871
Fair value estimationThe fair value of financial assets and financial liabilities must be estimated for recognition and measurement or for disclosure purposes.
The fair value of financial instruments that are not traded in an active market is determined using valuation techniques. The Group uses a variety of methods and makes assumptions that are based on market conditions existing at each balance date. Techniques, such as estimated discounted cash flows, are used to determine fair value for the remaining financial instruments. The fair value of interest rate swaps is calculated as the present value of the estimated future cash flows.
The carrying values less impairment provision of trade receivables and payables are assumed to approximate their fair values due to their short-term nature. The fair value of financial liabilities for disclosure purposes is estimated by discounting the future contractual cash flows at the current market interest rate that is available to the Group for similar financial instruments.
Note 28. Key management personnel disclosuresDirectorsThe following persons were directors of Norfolk Group Limited during the financial period:
Rod Keller Non-executive Chairman
Peter Abery Non-executive director
Glenn Wallace Executive director
Paul Chrystall Non-executive director
Peter Lowe (appointed 8 April 2008) Non-executive director
Deborah O’Toole (resigned 24 July 2008) Non-executive director
NOTEs TO THE FINANCIAl sTATEMENTs 31 MArCH 2009
NORFOLK ANNUAL REPORT 2009 79
For
per
sona
l use
onl
y
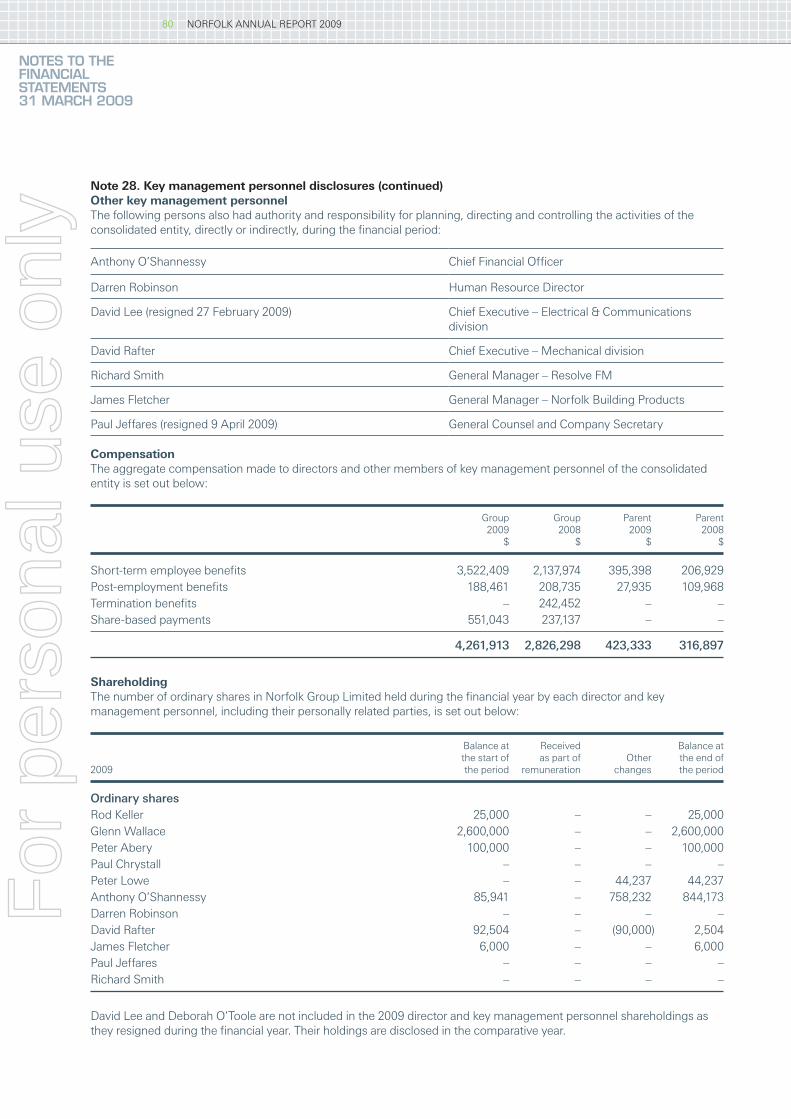
NOTEs TO THE FINANCIAl sTATEMENTs 31 MArCH 2009
Note 28. Key management personnel disclosures (continued)Other key management personnelThe following persons also had authority and responsibility for planning, directing and controlling the activities of the consolidated entity, directly or indirectly, during the financial period:
Anthony O’Shannessy Chief Financial Officer
Darren Robinson Human Resource Director
David Lee (resigned 27 February 2009) Chief Executive – Electrical & Communications division
David Rafter Chief Executive – Mechanical division
Richard Smith General Manager – Resolve FM
James Fletcher General Manager – Norfolk Building Products
Paul Jeffares (resigned 9 April 2009) General Counsel and Company Secretary
CompensationThe aggregate compensation made to directors and other members of key management personnel of the consolidated entity is set out below:
Group Group Parent Parent 2009 2008 2009 2008 $ $ $ $
Short-term employee benefits 3,522,409 2,137,974 395,398 206,929Post-employment benefits 188,461 208,735 27,935 109,968Termination benefits – 242,452 – –Share-based payments 551,043 237,137 – –
4,261,913 2,826,298 423,333 316,897
ShareholdingThe number of ordinary shares in Norfolk Group Limited held during the financial year by each director and key management personnel, including their personally related parties, is set out below:
Balance at Received Balance at the start of as part of Other the end of 2009 the period remuneration changes the period
Ordinary sharesRod Keller 25,000 – – 25,000Glenn Wallace 2,600,000 – – 2,600,000Peter Abery 100,000 – – 100,000Paul Chrystall – – – –Peter Lowe – – 44,237 44,237Anthony O’Shannessy 85,941 – 758,232 844,173Darren Robinson – – – –David Rafter 92,504 – (90,000) 2,504James Fletcher 6,000 – – 6,000Paul Jeffares – – – –Richard Smith – – – –
David Lee and Deborah O’Toole are not included in the 2009 director and key management personnel shareholdings as they resigned during the financial year. Their holdings are disclosed in the comparative year.
80 NORFOLK ANNUAL REPORT 2009
For
per
sona
l use
onl
y

Balance at Received Balance at the start of as part of Other the end of 2008 the period remuneration changes the period
Ordinary sharesRod Keller – – 25,000 25,000Glenn Wallace – – 2,600,000 2,600,000Peter Abery – – 100,000 100,000Paul Chrystall – – – –Deborah O’Toole – – 10,000 10,000Anthony O’Shannessy – – 85,941 85,941Darren Robinson – – – – David Lee – – 128,911 128,911David Rafter – – 92,504 92,504
Performance Option holdingThe number of Performance Options over ordinary shares in Norfolk Group Limited held during the financial year by each director and key management personnel, including their personally related parties, is set out below:
Balance at Received Balance at the start of as part of Other the end of 2009 the period remuneration changes the period
Options over ordinary sharesRod Keller – – – –Peter Abery – – – –Paul Chrystall – – – –Peter Lowe – – – –Glenn Wallace – 476,351 – 476,351Anthony O’Shannessy 447,021 353,232 – 800,253Darren Robinson 119,088 176,616 – 295,704David Lee1 447,021 353,232 800,253 –David Rafter 447,021 353,232 – 800,253Paul Jeffares – 176,616 – 176,616
1 David Lee’s Performance Options and rights have been forfeited as he resigned during the year
Balance at Received Balance at the start of as part of Other the end of 2008 the period remuneration changes the period
Options over ordinary sharesRod Keller – – – –Peter Abery – – – –Paul Chrystall – – – –Deborah O’Toole – – – –Glenn Wallace – – – –Anthony O’Shannessy – 447,021 – 447,021Darren Robinson – 119,088 – 119,088David Lee – 447,021 – 447,021David Rafter – 447,021 – 447,021Ian Stewart – – – –
None of the above options have vested or are exercisable.
NOTEs TO THE FINANCIAl sTATEMENTs 31 MArCH 2009
NORFOLK ANNUAL REPORT 2009 81
For
per
sona
l use
onl
y

NOTEs TO THE FINANCIAl sTATEMENTs 31 MArCH 2009
Note 28. Key management personnel disclosures (continued)Further disclosuresThe full key management personnel disclosures are included in the remuneration report section of the directors’ report only, thus not duplicating that information in the financial report. These transferred disclosures have been audited.
Note 29. Remuneration of auditorsDuring the period the following fees were paid or payable for services provided by PricewaterhouseCoopers, the auditor of the Company, and its related practices:
Group Group Parent Parent 2009 2008 2009 2008 $ $ $ $
Audit services – PricewaterhouseCoopersAudit or review of the financial report 579,827 678,487 – –
579,827 678,487 – –
Other services – PricewaterhouseCoopers Other assurance services 11,460 38,186 – –Tax compliance advice 103,784 46,121 – –Tax consulting and advice on tax consolidations – 96,000 – –Employee share scheme advice – 55,100 – –Investigating accountant services – 1,500,000 – –
115,244 1,735,407 – –
695,071 2,413,894 – –
Audit services – related practicesAudit or review of the financial report 77,513 77,513 – –
Other services – related practicesOther assurance services 2,460 2,989 – –Tax compliance advice 15,784 12,529
Note 30. Contingent liabilities
Group Group Parent Parent 2009 2008 2009 2008 $’000 $’000 $’000 $’000
Bank guarantees 28,930 37,539 – –
Total bank guarantee facilities as at 31 March 2009 were $50,000,000 and the unused portion was $21,070,000. This facility is subject to annual review.
82 NORFOLK ANNUAL REPORT 2009
For
per
sona
l use
onl
y

Note 31. Commitments for expenditure
Group Group Parent Parent 2009 2008 2009 2008 Note $’000 $’000 $’000 $’000
lease commitments – operatingCommitted at reporting date but not recognised as liabilities, payable:Within one year 15,937 16,848 – –One to five years 23,121 26,570 – –More than five years 1,805 2,433 – –
40,863 45,851 – –
lease commitments – financeCommitted at reporting date and recognised as liabilities, payable: Within one year 996 4,167 – –One to five years 1,128 386 – –
Total commitment 2,124 4,553 – –Less: Future finance charges (194) (519) – –
Net commitment recognised as liabilities 1,930 4,034 – –
Representing: Lease liabilities – current 17 988 3,665 – –Lease liabilities – non-current 20 942 369 – –
1,930 4,034 – –
Description of operating leasesThe Group has operating leases for land, buildings, motor vehicles and plant and equipment with the following lease terms:
land and buildings – 1 to 10 years �
motor vehicles – 1 to 4 years �
plant and equipment – 1 to 5 years. �
The leases have varying terms, escalation clauses and renewal rights. On renewal, the terms of the leases are renegotiated.
The Group has no significant operating leases that are considered onerous.
Note 32. Related party transactionsThe parent entity in the group is Norfolk Group Limited.
SubsidiariesInterests in subsidiaries are set out in note 34.
Key management personnelDisclosures relating to key management personnel are set out in note 28 and the remuneration report section of the directors’ report.
NOTEs TO THE FINANCIAl sTATEMENTs 31 MArCH 2009
NORFOLK ANNUAL REPORT 2009 83
For
per
sona
l use
onl
y

NOTEs TO THE FINANCIAl sTATEMENTs 31 MArCH 2009
Note 32. Related party transactions (continued)Transactions with related partiesThe following transactions occurred with related parties:
Group Group Parent Parent 2009 2008 2009 2008 $’000 $’000 $’000 $’000
Other income: Dividends received/receivable from subsidiaries – – 15,760 2,415Other transactions: Acquisition consideration paid to Hauraki Fund No. 2 – cash – 183,185 – 183,185Acquisition consideration paid to Hauraki Fund No. 2 – issue of shares – 55,517 – 55,517Sale of subsidiaries to subsidiary – – – 253,825Share-based payments recharged – – – 2,077Transfer tax losses from wholly owned subsidiaries – – – 2,992Tax contributions from wholly owned subsidiaries – – 7,110 –Investments in subsidiary – – – 75,000
Receivable from and payable to related partiesThe following balances are outstanding at the reporting date with related parties:
Group Group Parent Parent 2009 2008 2009 2008 $’000 $’000 $’000 $’000
Other payables:Payables to subsidiaries – – 33,810 37,399
Terms and conditionsAll transactions were made on normal commercial terms and conditions and at market rates except that no interest is charged on related party balances.
Note 33. Business combinations
2008 2008 Norfolk Group Other 2009 acquisition acquisitions $’000 $’000 $’000
Outflow of cash to acquire business, net of cash acquired:Total purchase consideration 1,161 253,825 7,946Add: Bank overdraft – 6,809 – Less: 21.9% shareholding issued to vendor – (55,517) – Less: Payments to be made in future periods – (15,123) – Purchase consideration in respect of prior acquisitions 136 – –
Outflow of cash 1,297 189,994 7,946
84 NORFOLK ANNUAL REPORT 2009
For
per
sona
l use
onl
y

(a) Central Refrigeration and Air-Conditioning On 1 May 2008, Haden Engineering Pty Ltd, a subsidiary of the Company, acquired the business of Central Refrigeration and Air-Conditioning for $1,161,000. This is a commercial and residential refrigeration and air-conditioning service business and operates in the Mechanical division of the consolidated entity. The acquired business contributed revenues of $2,533,000 and net profit of $355,000 to the consolidated entity for the year ended 31 March 2009.
Acquiree’s carrying amount Fair value $’000 $’000
Plant and machinery 5 5Motor vehicles 68 68 Employee benefits (71) (71)
Net assets acquired 2 2 Goodwill 1,159
Total purchase consideration 1,161
Representing:Cash paid to vendor 1,161
1,161
Goodwill mainly relates to the assembled workforce acquired.
(b) Norfolk Group of CompaniesOn 21 June 2007, Norfolk Group Limited, the parent entity, acquired 100% of the ordinary share capital of the Norfolk Group of Companies. The acquired companies contributed revenues of $594,828,000 and net profit before interest and taxes of $32,275,000 to the consolidated entity for the period ended 31 March 2008.
If the acquisition had occurred on 1 April 2007, the Norfolk Group of Companies would have contributed revenue and net profit before interest and taxes of $758,625,000 and $34,107,000 respectively. Details of the acquisition are as follows:
Acquiree’s carrying amount $’000
Trade and other receivables 173,851Income tax refund due 445Inventories 13,826Leasehold improvements 1,868Plant and equipment 4,581Motor vehicles 7,605Goodwill 30,108Brands 6,226Computer software 2,639Deferred tax asset 13,462Trade and other payables (123,311)Provision for income tax (2,896)Employee benefits (7,608)Other provisions (7,653)Bank overdraft (6,809)Bank loans (75,508)Lease liabilities (4,520)
Net assets acquired 26,306Common control reserve 227,519
Total purchase consideration 253,825
NOTEs TO THE FINANCIAl sTATEMENTs 31 MArCH 2009
NORFOLK ANNUAL REPORT 2009 85
For
per
sona
l use
onl
y

NOTEs TO THE FINANCIAl sTATEMENTs 31 MArCH 2009
Note 33. Business combinations (continued)Norfolk Group Limited was incorporated on 31 May 2007 to become the ultimate Australian parent company of the Norfolk Group of Companies. These companies were acquired on 21 June 2007 by Norfolk Group Limited.
The acquisition by Norfolk Group Limited of the Norfolk Group of Companies has been treated as a business combination under common control and has been accounted for by the Group prospectively from the date of obtaining the ownership interest. Assets and liabilities have been recognised on consolidation at the consolidated carrying amounts in the financial statements, measured in accordance with Australian equivalents to International Financial Reporting Standards. The difference between the purchase price paid by Norfolk Group Limited and the amounts at which the assets and liabilities have been recorded has been recognised in the Business Combinations under Common Control Reserve at $227,519,000.
(c) Trans American Air-conditioning Pvt Limited (subsequently renamed Norfolk Mechanical (India) Pvt Limited)On 7 August 2007, the Group acquired 85% of the ordinary share capital of Trans American Air-conditioning Pvt Limited for $1,852,000 net of cash acquired. The fair value of the assets and liabilities on acquisition was net liabilities of $151,000 resulting in $2,003,000 of goodwill arising on consolidation. The acquired business contributed revenue of $2,051,000 and net profit before income tax of $186,000 to the consolidated entity for the period from acquisition to 31 March 2008.
(d) Gold Coast Air-conditioningOn 9 November 2007, Haden Engineering Pty Limited, a subsidiary, acquired the business of Gold Coast Air-conditioning for $2,787,000. This is an air-conditioning service business and operates in the Mechanical division of the consolidated entity. The acquired business contributed revenues of $311,000 and net profit of $12,000 to the consolidated entity for the period ended 31 March 2008. Details of the acquisition are as follows:
Acquiree’s carrying amount Fair value $’000 $’000
Motor vehicles 66 66Employee benefits (33) (33)
Net assets acquired 33 33Goodwill 2,754
Total purchase consideration 2,787
Representing: Cash paid to vendor 2,652Direct costs paid relating to the acquisition 135
2,787
86 NORFOLK ANNUAL REPORT 2009
For
per
sona
l use
onl
y

(e) The Plumbing DoctorOn 14 November 2007, Haden Engineering Pty Limited, a subsidiary, acquired the business of The Plumbing Doctor for $3,307,000. This is a commercial and residential plumbing service business and operates in the Mechanical division of the consolidated entity. The acquired business contributed revenues of $1,547,000 and net profit of $33,000 to the consolidated entity for the period ended 31 March 2008. Details of the acquisition are as follows:
Acquiree’s carrying amount Fair value $’000 $’000
Trade receivables 435 435Inventories 7 7Plant and equipment 142 45Motor vehicles 133 45Trade payables (287) (287)Employee benefits – (93)Other provisions – (5)
Net assets acquired 430 147Goodwill 3,160
Total purchase consideration 3,307
Representing:Cash paid to vendor 3,275Direct costs paid relating to the acquisition 32
3,307
Note 34. SubsidiariesThe consolidated financial statements incorporate the assets, liabilities and results of the following subsidiaries in accordance with the accounting policy described in note 1:
Equity holding Equity holding Country of 2009 2008 Name of entity incorporation % %
Norfolk Group Holdings Pty Limited1 Australia 100.00 100.00 Norfolk Facility Management Holdings Pty Limited2 Australia – 100.00 O’Donnell Griffin Pty Limited1 Australia 100.00 100.00 O’Donnell Griffin Asia Pty Limited1 Australia 100.00 100.00 Haden Engineering Pty Limited1 Australia 100.00 100.00 Ductclean Australia Pty Limited1 Australia 100.00 100.00A.C.N. 076 421 755 Pty Limited1 Australia 100.00 100.00 Resolve FM Pty Limited1 Australia 100.00 100.00 Resolve Engineering Pty Limited1 Australia 100.00 100.00 Egan Bros. Building Services Pty Limited1 Australia 100.00 100.00 Rel Corp Management Services Pty Limited1 Australia 100.00 100.00 Trafalgar Building Products Pty Limited1 Australia 100.00 100.00 Norfolk Electrical (Aust) Pty Limited1 Australia 100.00 100.00 Norfolk Resolve (Aust) Pty Limited1 Australia 100.00 100.00 Norfolk Building Products (Aust) Pty Limited1 Australia 100.00 100.00 Norfolk Mechanical (Aust) Pty Limited1 Australia 100.00 100.00 Haden MEP Holdings Pty Limited Australia 100.00 –Norfolk Electrical and Mechanical Limited New Zealand 100.00 100.00 Norfolk Building Products Limited (NZL) New Zealand 100.00 100.00 Norfolk Hong Kong Limited Hong Kong 100.00 100.00 Norfolk Mechanical (Hong Kong) Limited Hong Kong 100.00 100.00 Norfolk Mechanical (India) Pvt Limited India India 85.00 85.00
NOTEs TO THE FINANCIAl sTATEMENTs 31 MArCH 2009
NORFOLK ANNUAL REPORT 2009 87
For
per
sona
l use
onl
y

NOTEs TO THE FINANCIAl sTATEMENTs 31 MArCH 2009
Note 34. Subsidiaries (continued)1 Entity party to a deed of cross guarantee under which each company guarantees the debts of the others. By entering into the deed, the
wholly owned entities have been relieved from the requirement to prepare a financial report and directors’ report under Class Order 98/1418 (as amended) issued by the Australian Securities and Investments Commission (ASIC). These companies represent a ‘Closed Group’ for the purposes of the Class Order, and as there are no other parties to the Deed of Cross Guarantee that are controlled by Norfolk Group Holdings Pty Limited, they also represent the ‘Extended Closed Group’. The consolidated income statement and balance sheet of the ‘Closed Group’ is reported in the Norfolk Group Holdings Pty Limited financial report
2 Company deregistered during the year
The portion of ownership interest is equal to the proportion of voting power held.
Note 35. Events occurring after balance dateOn 7 May 2009, agreement was reached with the Group’s bank financiers that the impairment of the SSRP receivable would not be included within the calculation of the financial covenants that form part of the Group’s major bank loan and overdraft facility agreement (‘Facility Agreement’). The agreement reached on 7 May 2009 contains some undertakings which are in the process of being formally documented into the Facility Agreement. As this agreement was not reached prior to 31 March 2009, borrowings under the bank facility are shown as current liabilities in the balance sheet.
The bank overdraft facility is a $20,000,000 facility which may be drawn at any time and is subject to annual review. At balance date $nil was utilised (2008: $nil). The bank loan facility is a $90,000,000 facility which may be drawn at any time in either Australian or New Zealand dollars and has a term ending in July 2010. At balance date $60,833,000 was utilised (2008: $62,443,000)
No other matter or circumstance has arisen since 31 March 2009 that has significantly affected, or may significantly affect, the consolidated entity’s operations in future financial years, the results of those operations in future financial years, or the consolidated entity’s state of affairs in future financial years.
Note 36. Reconciliation of profit/(loss) after income tax to net cash flows from operating activities
Group Parent Group 10 months Parent 10 months 2009 2008 2009 2008 $’000 $’000 $’000 $’000
Profit/(loss) after income tax (expense)/benefit 4,367 18,915 (72,935) (811)Depreciation and amortisation 4,747 4,365 – –Net loss/(profit) on sale of non-current assets (209) (323) – –Impairment of investment in subsidiaries – – 84,865 –Foreign currency differences – 383 – –Share-based payments (50) 2,077 (50) 2,077Unrealised (gain)/loss on interest rate swaps 851 (564) – –
Change in operating assets and liabilities:(Increase)/decrease in trade and other receivables 27,638 (8,757) – (43)(Increase)/decrease in inventories 1,359 3,518 – –(Increase)/decrease in deferred tax assets (8,244) 7,971 2,161 (1,284)(Increase)/decrease in prepayments (153) (4,620) – (304)Increase/(decrease) in trade and other payables (16,731) 26,644 178 (1,848)Increase/(decrease) in provision for income tax 6,529 (2,797) (3,550) –Increase/(decrease) in employee benefits (618) (229) – –Increase/(decrease) in other provisions 257 (7,222) – –
Net cash inflow/(outflow) from operating activities 19,743 39,361 10,669 (2,213)
88 NORFOLK ANNUAL REPORT 2009
For
per
sona
l use
onl
y

Note 37. Earnings per share
Group Group 2009 2008 $’000 $’000
Profit from continuing operations 5,571 18,469Profit from continuing operations attributable to minority interests (32) (23)
Profit from continuing operations attributable to members of Norfolk Group Limited used in calculating earnings per share 5,539 18,446Profit/(loss) from discontinued operations (1,204) 446
Profit attributable to members of Norfolk Group Limited used in calculating earnings per share 4,335 18,892
Weighted average number of ordinary shares used in calculating basic earnings per share 130,000,000 130,000,000Adjustments for calculation of diluted earnings per share: Options 1,239,538 2,512,467Weighted average number of ordinary shares used in calculating diluted earnings per share 131,239,538 132,512,467
Cents Cents
Basic earnings per share from continuing operations 4.26 14.19Diluted earnings per share from continuing operations 4.22 13.92 Basic earnings per share 3.33 14.53Diluted earnings per share 3.30 14.26
Note 38. Share-based paymentsThe Company has adopted the following share plans to satisfy the various remuneration, incentive and retention demands on it as a contemporary public company. The various plans that the Company has adopted are summarised below.
At the time this report was compiled, the Federal Government introduced legislation affecting the tax treatment of employee share and option plans, effective 12 May 2009. As a result of this legislative change and the uncertainty of existing and future share and option schemes, the Board has endorsed a suspension of all plans until the government position is clarified and legislation is passed to law.
Exempt Employee Share Plan (‘ESP’)The Company has adopted the ESP pursuant to which eligible employees of Norfolk may take advantage of concessions embodied in the Australian tax legislation to encourage broad-based employee equity participation, a concept the Board supports. Under current legislation, eligible employees can acquire up to $1,000 worth of shares income tax-free each tax year by sacrificing a portion of their annual remuneration or bonus. The shares are issued or acquired at the market price of the shares, at the time of issue or acquisition, determined in accordance with the ESP rules. Under the ESP, the Board also has the discretion to issue shares at a discount to the prevailing market price. All permanent employees of Norfolk with more than 12 months of service are eligible to participate in the ESP, at the invitation of the Board.
Under the terms of the ESP, the eligible employee must not sell, transfer or create a security interest or otherwise deal in the shares until the earlier of:
the end of three years after the time of issue or acquisition of the shares; and �
the time when the eligible employee ceases to be employed by Norfolk. �
The shares issued or acquired under the ESP will be subject to an administrative holding lock for this purpose.
No shares have been issued under this plan.
NOTEs TO THE FINANCIAl sTATEMENTs 31 MArCH 2009
NORFOLK ANNUAL REPORT 2009 89
For
per
sona
l use
onl
y

NOTEs TO THE FINANCIAl sTATEMENTs 31 MArCH 2009
Note 38. Share-based payments (continued)Deferred Employee Share Plan (‘DSP’)The Company has adopted the DSP to facilitate a range of remuneration and incentive purposes. Under the DSP, eligible employees of Norfolk may sacrifice a portion of their annual remuneration or bonus and receive shares in lieu. In addition, eligible employees may be granted free shares at the Board’s discretion. Any shares issued or acquired under the DSP may be subject to specific vesting and performance requirements. Where shares are issued or acquired by remuneration/bonus sacrifice, the shares are issued or acquired at the market price of the shares, at the time of issue or acquisition, determined in accordance with the DSP rules. All permanent employees of Norfolk with at least 12 months of service are eligible to participate in the DSP, at the invitation of the Board. Under the terms of the DSP, the eligible employee must not sell, transfer or create a security interest or otherwise deal in the shares until a withdrawal notice has been accepted by the Board or its delegated authority. A withdrawal notice may only be lodged within a share trading window determined by the Board and may not be lodged until:
the Vesting Conditions, if any, in respect of the share have been satisfied or waived �
the earlier of the expiration of any restriction period set by the Board, the time when the eligible employee ceases �to be employed by Norfolk or an earlier time at the Board’s discretion.
The legal title to shares issued or acquired under the DSP will be held by a trust, for the benefit of the eligible employee, for this purpose.
No shares have been issued under this plan.
Non-Executive Director Share Acquisition Plan (‘NEDSAP’)The Company has adopted the NEDSAP to facilitate the tax efficient acquisition of shares by non-executive directors to further align their interests with those of shareholders. Under the NEDSAP, eligible non-executive directors may sacrifice a portion of their annual directors’ fees and receive shares in lieu. The shares are issued or acquired at the market price of shares, at the time of issue or acquisition, determined in accordance with the NEDSAP rules. All non-executive directors are eligible to participate in the NEDSAP at the invitation of the Board. Under the terms of the NEDSAP, the eligible non-executive directors must not sell, transfer or create a security interest or otherwise deal in the shares until a withdrawal notice has been accepted by the Board, or its delegated authority. A withdrawal notice may only be lodged within a share trading window determined by the Board and may not be lodged until:
the Vesting Conditions, if any, in respect of the share have been satisfied or waived �
the earlier of the expiration of any restriction period set by the Board, the time when the eligible non-executive director �ceases to be a non-executive director or an earlier time at the Board’s discretion.
The legal title to shares issued or acquired under the NEDSAP will be held by a trust, for the benefit of the eligible non-executive director, for this purpose.
No shares have been issued under this plan.
Long Term Incentive Plan (‘LTIP’)The Company has adopted the LTIP pursuant to which eligible participants may be granted sale bonus rights, performance rights (entitling the grantee to shares for no consideration) or performance options (entitling the grantee to shares for an exercise price determined by the Board), in each case exercisable on achievement of pre-set time or performance hurdles.
In relation to performance options granted in respect of listing:
50% of options are exercisable if the Company achieves a total shareholder return CAGR (Compound Annual Growth �Rate) of 15%
additional options are exercisable, on a linear sliding scale, if the Company achieves a total shareholder return CAGR of �greater than 15%, with all options being exercisable if the Company achieves a total shareholder return CAGR of 20%.
The exercise price of performance options will be determined by the Board, but typically will be the market price of the shares, at the date of grant, determined in accordance with the LTIP rules. The Board has discretion to determine eligible participants under the LTIP. The performance incentives that are the subject of the LTIP lapse in certain circumstances, including on:
expiry �
cessation of employment for cause �
cessation of employment for other specified reasons if not exercised within a period determined by the Board. �
90 NORFOLK ANNUAL REPORT 2009
For
per
sona
l use
onl
y

In relation to performance options granted during the financial year:
The LTIP is based on a combination of relative TSR (Total Shareholder Return) and EPS (Earnings Per Share) hurdles.
TSR Incentives may not be exercised unless:
Norfolk achieves a TSR ranking at the 50th percentile relative to its Peer Group, then 50% of TSR Incentives have �been deemed to meet the Vesting Conditions
additional TSR Incentives have been deemed to meet the Vesting Conditions, on a linear sliding scale, if the �Company achieves a TSR relative to its Peer Group of greater than median with all TSR Incentives meeting the Vesting Conditions if the Company achieves a TSR which ranks it in the top 25% of its Peer Group.
EPS Incentives may be exercised:
at 8% CAGR, one third of EPS Incentives have been deemed to meet the Vesting Conditions �
additional EPS Incentives have been deemed to meet the Vesting Conditions, on a linear sliding scale, �if the Company achieves a CAGR of greater than 8% with all EPS Incentives being exercisable if the Company achieves a CAGR of 15%.
The CAGR and the TSR relative to the Peer Group is tested on the third anniversary of the Grant Date. The ‘Peer Group’ refers to the companies determined by the ASX to form the ‘ASX Top 300’ or such other group of companies as determined most appropriate by the Board from time to time.
The Board has discretion to set vesting conditions, determine other lapse events and set restrictions on the disposal of, or other dealing with, the performance incentives that are the subject of the LTIP or shares issued on exercise of a performance incentive.
Set out below are summaries of the number of options granted under the plan for the current and previous financial periods.
Balance Granted Cancelled Balance at Exercise at the start during during the end of Grant date Expiry date price of the year the year the year the year
200927 July 2007 27 July 2012 $0. 00 1,559,766 – 320,228 1,239,53627 July 2007 27 July 2012 $1.95 952,701 476,351 238,175 1,190,87726 August 2008 26 August 2013 $1.24 – 3,424,443 411,631 3,012,811
200827 July 2007 27 July 2012 $0. 00 – 1,559,766 – 1,559,76627 July 2007 27 July 2012 $1.95 – 952,701 – 952,701
Note 39. Discontinued operation(a) DescriptionDuring the 2009 financial year, the Company undertook a review of the Trafalgar fire business. The outcome of that review was a decision to restructure and ultimately divest Trafalgar’s assets, which was completed post-31 March 2009. The Trafalgar business is reported in this financial report as a discontinued operation.
Financial information relating to the discontinued operation for the year is set out below.
(b) Financial performance and cash flow informationThe financial performance and cash flow information presented are for the year ended 31 March 2009 and for the period from 31 May 2007 to 31 March 2008.
NOTEs TO THE FINANCIAl sTATEMENTs 31 MArCH 2009
NORFOLK ANNUAL REPORT 2009 91
For
per
sona
l use
onl
y

NOTEs TO THE FINANCIAl sTATEMENTs 31 MArCH 2009
DIrECTOrs’ DEClArATION
Note 39. Discontinued operation (continued)
Group Parent Group 10 months Parent 10 months 2009 2008 2009 2008 $’000 $’000 $’000 $’000
Revenue 10,391 12,253 – –Expenses 12,112 11,445 – –
Profit/(loss) before income tax (1,721) 808 – –
Income tax benefit/(expense) 517 (362) – –
Profit/(loss) from discontinued operations (1,204) 446 – –
Net cash inflow/(outflow) from operating activities (583) 826 – –Net cash inflow/(outflow) from investing activities 139 1,220 – –Net cash inflow/(outflow) from financing activities (63) (71) – –
Net increase/(decrease) in cash generated by the business (507) 1,975 – –
(c) Current assets classified as held for saleThe carrying value of assets classified as held for sale is:
Group Group Parent Parent 2009 2008 2009 2008 $’000 $’000 $’000 $’000
Inventories 688 – – –
Total assets classified as held for sale 688 – – –
Directors’ declarationIn the directors’ opinion:
(a) the financial statements and notes set out on pages 47 to 92 are in accordance with the Corporations Act 2001, including:
(i) complying with Accounting Standards, the Corporations Regulations 2001 and other mandatory professional reporting requirements; and
(ii) giving a true and fair view of the Company’s and consolidated entity’s financial position as at 31 March 2009 and of their performance for the financial year ended on that date; and
(b) there are reasonable grounds to believe that the Company will be able to pay its debts as and when they become due and payable; and
(c) at the date of this declaration, there are reasonable grounds to believe that the members of the Extended Closed Group identified in note 34 will be able to meet any obligations or liabilities to which they are, or may become, subject by virtue of the deed of cross guarantee described in note 34.
The directors have been given the declarations by the Managing Director and Chief Financial Officer required by section 295A of the Corporations Act 2001.
This declaration is made in accordance with a resolution of the directors.
Rod KellerChairmanNorfolk Group Limited 23 June 2009Sydney
92 NORFOLK ANNUAL REPORT 2009
For
per
sona
l use
onl
y

INDEpENDENT AuDITOr’s rEpOrT
Independent auditor’s report to the members of Norfolk Group LimitedReport on the financial report We have audited the accompanying financial report of Norfolk Group Limited (the company), which comprises the balance sheet as at 31 March 2009, and the income statement, statement of changes in equity and cash flow statement for the year ended on that date, a summary of significant accounting policies, other explanatory notes and the directors’ declaration for both Norfolk Group Limited and the Norfolk Group (the consolidated entity). The consolidated entity comprises the company and the entities it controlled at the year’s end or from time to time during the financial year.
Directors’ responsibility for the financial reportThe directors of the company are responsible for the preparation and fair presentation of the financial report in accordance with Australian Accounting Standards (including the Australian Accounting Interpretations) and the Corporations Act 2001. This responsibility includes establishing and maintaining internal controls relevant to the preparation and fair presentation of the financial report that is free from material misstatement, whether due to fraud or error; selecting and applying appropriate accounting policies; and making accounting estimates that are reasonable in the circumstances. In Note 1, the directors also state, in accordance with Accounting Standard AASB 101 Presentation of Financial Statements, that compliance with the Australian equivalents to International Financial Reporting Standards ensures that the consolidated financial statements and notes, comply with International Financial Reporting Standards.
Auditor’s responsibility Our responsibility is to express an opinion on the financial report based on our audit. We conducted our audit in accordance with Australian Auditing Standards. These Auditing Standards require that we comply with relevant ethical requirements relating to audit engagements and plan and perform the audit to obtain reasonable assurance whether the financial report is free from material misstatement.
An audit involves performing procedures to obtain audit evidence about the amounts and disclosures in the financial report. The procedures selected depend on the auditor’s judgement, including the assessment of the risks of material misstatement of the financial, whether due to fraud or error. In making those risk assessments, the auditor considers internal control relevant to the entity’s preparation and fair presentation of the financial in order to design audit procedures that are appropriate in the circumstances, but not for the purpose of expressing an opinion on the effectiveness of the entity’s internal control. An audit also includes evaluating the appropriateness of accounting policies used and the reasonableness of accounting estimates made by the directors, as well as evaluating the overall presentation of the financial report.
PricewaterhouseCoopersABN 52 780 433 757
Darling Park Tower 2201 Sussex StreetGPO BOX 2650SYDNEY NSW 1171DX 77 SydneyAustraliaTelephone +61 2 8266 0000Facsimile +61 2 8266 9999www.pwc.com/au
Liability limited by a scheme approved under Professional Standards Legislation
NORFOLK ANNUAL REPORT 2009 93
For
per
sona
l use
onl
y

INDEpENDENT AuDITOr’s rEpOrT
Our procedures include reading the other information in the Annual Report to determine whether it contains any material inconsistencies with the financial report.
For further explanation of an audit, visit our website www.pwc.com/au/financialstatementaudit.
Our audit did not involve an analysis of the prudence of business decisions made by directors or management.
We believe that the audit evidence we have obtained is sufficient and appropriate to provide a basis for our audit opinions.
IndependenceIn conducting our audit, we have complied with the independence requirements of the Corporations Act 2001.
Auditor’s opinion In our opinion:
(a) the financial report of Norfolk Group Limited is in accordance with the Corporations Act 2001, including:
(i) giving a true and fair view of the company and consolidated entity’s financial position as at 31 March 2009 and of their performance for the year ended on that date; and
(ii) complying with Australian Accounting Standards (including the Australian Accounting Interpretations) and the Corporations Regulations 2001; and
(b) the consolidated financial statements and notes also comply with International Financial Reporting Standards as disclosed in Note 1.
Report on the Remuneration ReportWe have audited the Remuneration Report included in pages 36 to 45 of the directors’ report for the year ended 31 March 2009. The directors of the company are responsible for the preparation and presentation of the Remuneration Report in accordance with section 300A of the Corporations Act 2001. Our responsibility is to express an opinion on the Remuneration Report, based on our audit conducted in accordance with Australian Auditing Standards.
Auditor’s opinion In our opinion, the Remuneration Report of Norfolk Group Limited for the year ended 31 March 2009, complies with section 300A of the Corporations Act 2001.
PricewaterhouseCoopers
Eddie Wilkie SydneyPartner 23 June 2009
Liability limited by a scheme approved under Professional Standards Legislation
94 NORFOLK ANNUAL REPORT 2009
For
per
sona
l use
onl
y

The shareholder information set out below was applicable as at 5 June 2009.
Distribution of equitable securitiesAnalysis of number of equitable security holders by size of holding:
Ordinary shares
1 to 1,000 2231,001 to 5,000 7235,001 to 10,000 46410,001 to 50,000 69150,001 to 100,000 94100,001 and over 86
2,281
Holding less than a marketable parcel 121
Equity security holdersTwenty largest quoted equity security holdersThe names of the twenty largest security holders of quoted equity securities are listed below:
Ordinary shares % of total Number shares held issued
Special Managed Investment Company No.7 Limited 25,870,000 19.90Bell Potter Nominees Ltd 16,127,334 12.41Grandlodge Pty Ltd 11,095,395 8.53MCIF Nominee Limited 9,709,438 7.47National Nominees Limited 3,463,664 2.66J P Morgan Nominees Australia Limited 2,969,378 2.28Henson Limited 2,600,000 2.00RBC Dexia Investor Services Australia Nominees Pty Limited 1,879,288 1.45Argo Investments Limited 1,852,814 1.43RBC Dexia Investor Services Australia Nominees Pty Limited 1,451,119 1.12HSBC Custody Nominees (Australia) Limited 1,390,627 1.07Cogent Nominees Pty Limited 1,261,626 0.97PGA (Investments) Pty Ltd 1,000,000 0.77Custodial Services Limited 720,954 0.55ANZ Nominees Limited 701,090 0.54Grandlodge Pty Ltd 665,488 0.51Citicorp Nominees Pty Limited 621,528 0.48Depofo Pty Ltd 600,000 0.46Fortis Clearing Nominees Pty Limited 599,877 0.46Mr John Hedley 580,000 0.45
85,159,620 65.51
sHArEHOlDEr INFOrMATION 5 JuNE 2009
NORFOLK ANNUAL REPORT 2009 95
For
per
sona
l use
onl
y

Unquoted equity securities
Number Number on issue of holders
Options over ordinary shares issued 5,443,224 31
Substantial holdersSubstantial holders in the Company are set out below:
Ordinary shares % of total Number held shares issued By notice dated
Goldman Sachs JBWere Group 28,596,102 22.00 27 July 2007Monadelphous Limited 16,127,334 12.40 27 February 2009Grandlodge Pty Ltd 12,092,361 9.29 4 June 2009Maui Group 9,281,830 7.14 1 June 2009
Voting rightsThe voting rights attached to ordinary shares are set out below:
Ordinary sharesOn a show of hands every member present at a meeting in person or by proxy shall have one vote and upon a poll each share shall have one vote.
There are no other classes of equity securities.
sHArEHOlDEr INFOrMATION 5 JuNE 2009
96 NORFOLK ANNUAL REPORT 2009
For
per
sona
l use
onl
y

Norfolk Group LimitedACN 125 709 971 Registered Office Level 5, 50 Berry StreetNorth Sydney NSW 2060
Head OfficeLevel 5, 50 Berry StreetNorth Sydney NSW 2060
Norfolk Websitewww.norfolkgl.com
AuditorsPricewaterhouseCoopersDarling Park Tower 2201 Sussex StreetSydney NSW 2000
BanksWestpac Banking Corporation275 Kent StreetSydney NSW 2000
Australia and New Zealand Banking Group LimitedLevel 1, 20 Martin PlaceSydney NSW 2000
Share RegisterLink Market Services LimitedLevel 12, 680 George StreetSydney NSW 2000
prec
inct
.com
.au
Notice of Annual General Meeting The Annual General Meeting of Norfolk Group Limited will be held at:
11.00am (AEST) on Tuesday 25 August 2009 Cavalier Room Christie Conference Centre 56 Berry StreetNorth Sydney NSW 2060
COrpOrATE DIrECTOrY
For
per
sona
l use
onl
y

For
per
sona
l use
onl
y