Embed Size (px)
Citation preview

successFor over 65 years, Vitasoy has grown and multiplied its
from a little bean – and is still going strong
Stock Code 股份代號: 0345
focus drive
06/07ANNUAL REPORT 年 報

formula for success
The cover design depicts a team ofBeanies exerting themselves enthusiastically and wholeheartedly to win in a game of tug-of-war. The underlying message is that just like the Beanies, the Vitasoy Group asa whole is working closely together to achieve a well-defined goal through intra-group cooperation and joint effort.
封面設計上一群小黃豆皆全力以赴、眾志成城,奮力贏取拔河比賽冠軍。寓意維他奶集團仝人同心協力、互相合作,致力達到明確的目標。

02
04
07
15
29
40
44
57
59
60
62
64
65
68
147
contents
Directors and Corporate Information
Financial Highlights
Chairman’s Statement
Management Report
Corporate Governance Report
Directors and Senior Management
Report of the Directors
Independent Auditor’s Report
Consolidated Income Statement
Consolidated Balance Sheet
Balance Sheet
Consolidated Statement of Changes in Equity
Consolidated Cash Flow Statement
Notes to the Financial Statements
Five Year Summary

02
Directors and Corporate Information
Vitasoy International Holdings Ltd. Annual Report 2006/07
Board of Directors
Executive ChairmanMr. Winston Yau-lai LO
Independent Non-executive DirectorsDr. The Hon. Sir David Kwok-po LIMr. Iain F. BRUCEMr. Jan P. S. ERLUND
(appointed on 6th July, 2006)Mr. Chi-kian SHIU
(retired on 11th September, 2006)
Non-executive DirectorsMs. Myrna Mo-ching LOMs. Yvonne Mo-ling LO
Executive DirectorsMr. Ambrose Kam-shing CHANMr. Eric Fat YUMr. John Shek-hung LAU
Company Secretary
Ms. Paggie Ah-hing TONG
Registered & Head Office
No. 1 Kin Wong Street, Tuen Mun,New Territories, Hong Kong
Auditors
KPMG
Principal Bankers
The Bank of East Asia, LimitedCitibank, N.A.The Bank of Tokyo-Mitsubishi, LimitedAustralia and New Zealand Banking Group LimitedRabobankBNP Paribas
Jan P. S. ERLUND
Australia and New Zealand Banking Group Limited

03
Directors and Corporate Information
Principal Lawyer
Stephenson Harwood & Lo
Share Registrar
Computershare Hong Kong Investor Services Limited46/F., Hopewell Centre, 183 Queen’s Road East,Wanchai, Hong Kong
Website Addresses
Vitasoy International Holdings Limited– www.vitasoy.com (English & Chinese)– www.vitasoy.com.hk (English & Chinese)
Vitaland Services Limited– www.vitaland.com.hk (Chinese only)
Hong Kong Gourmet Limited– www.hkgourmet.com.hk (Chinese only)
Shenzhen Vitasoy (Guang Ming) Foods and BeverageCompany Limited
Vitasoy (Shanghai) Company Limited– www.vitasoy-chn.com (Chinese only)
Vitasoy USA Inc.– www.vitasoy-usa.com (English only)
Vitasoy Australia Products Pty. Ltd.– www.vitasoy.com.au (English only)
Key Dates
Closure of Register3rd September, 2007 (Monday) to6th September, 2007 (Thursday)
Annual General Meetingat 12:00 noon, 6th September, 2007 (Thursday),Chater Rooms I & II, Function Room Level,The Ritz-Carlton Hong Kong, 3 Connaught Road Central,Hong Kong
Final and Special Dividends Payable20th September, 2007 (Thursday)
18346
– www.vitasoy.com – www.vitasoy.com.hk
– www.vitaland.com.hk
– www.hkgourmet.com.hk
– www.vitasoy-chn.com
Vitasoy USA Inc.– www.vitasoy-usa.com
Vitasoy Australia Products Pty. Ltd.– www.vitasoy.com.au
I II
04
Financial Highlights
Vitasoy International Holdings Ltd. Annual Report 2006/07
Turnover Gross Profit
Profit Attributable toEBITDA Equity Shareholders of the Company
Year Ended 31st March
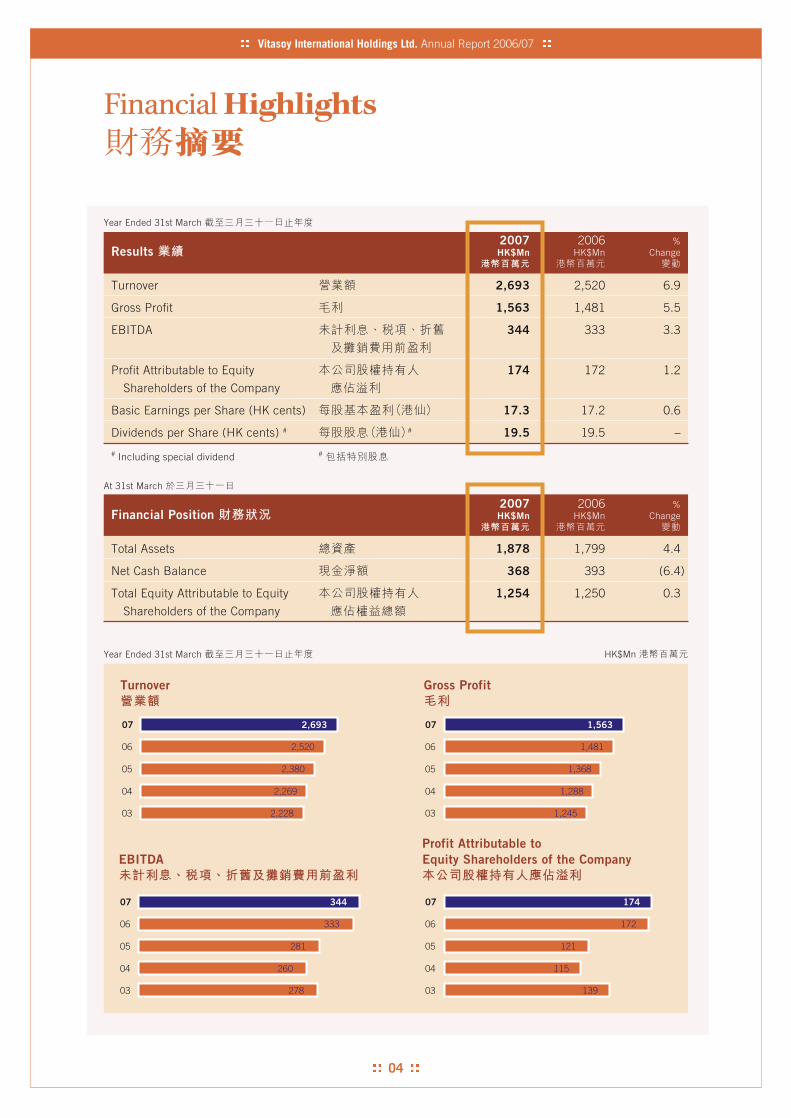
2007 2006 %Results HK$Mn HK$Mn Change
Turnover 2,693 2,520 6.9
Gross Profit 1,563 1,481 5.5
EBITDA 344 333 3.3
Profit Attributable to Equity 174 172 1.2
Shareholders of the Company
Basic Earnings per Share (HK cents) 17.3 17.2 0.6
Dividends per Share (HK cents) # # 19.5 19.5 –
# Including special dividend #
At 31st March
2007 2006 %Financial Position HK$Mn HK$Mn Change
Total Assets 1,878 1,799 4.4
Net Cash Balance 368 393 (6.4)
Total Equity Attributable to Equity 1,254 1,250 0.3
Shareholders of the Company
Year Ended 31st March HK$Mn

Financial Highlights
05
Hong Kong Mainland China
North America Others
Australia and New Zealand
Sales Analysis by Location of Customers
Year Ended 31st March
Soymilk Juice Drinks
Tea Others
Lunch Boxes and Snacks
Tofu
Milk
Water
Sales Analysis by Categories
Year Ended 31st March

Innovation
Branding

Chairman's Statement
I am pleased to report that for the year ended31st March, 2007, the Group’s profit attributableto equity shareholders of the Company wasHK$174 million, representing a moderate increaseof 1.2% year-on-year. Total turnover was HK$2,693million, up 6.9%. The Group’s gross profit forthe year increased to HK$1,563 million, up 5.5%from the previous year. Earnings per share wereHK$0.173. The Group’s earnings before interest,taxation, depreciation and amortisationexpenses (EBITDA) stood at HK$344million, up 3.3%, while EBITDA marginwas 12.8% of sales.
174,000,0001.2%
2,693,000,000 6.9%
1,563,000,0005.5% 0.173
(EBITDA) 344,000,000
3.3% EBITDA12.8%
Winston Yau-lai LOExecutive Chairman
08
Chairman's Statement
Vitasoy International Holdings Ltd. Annual Report 2006/07
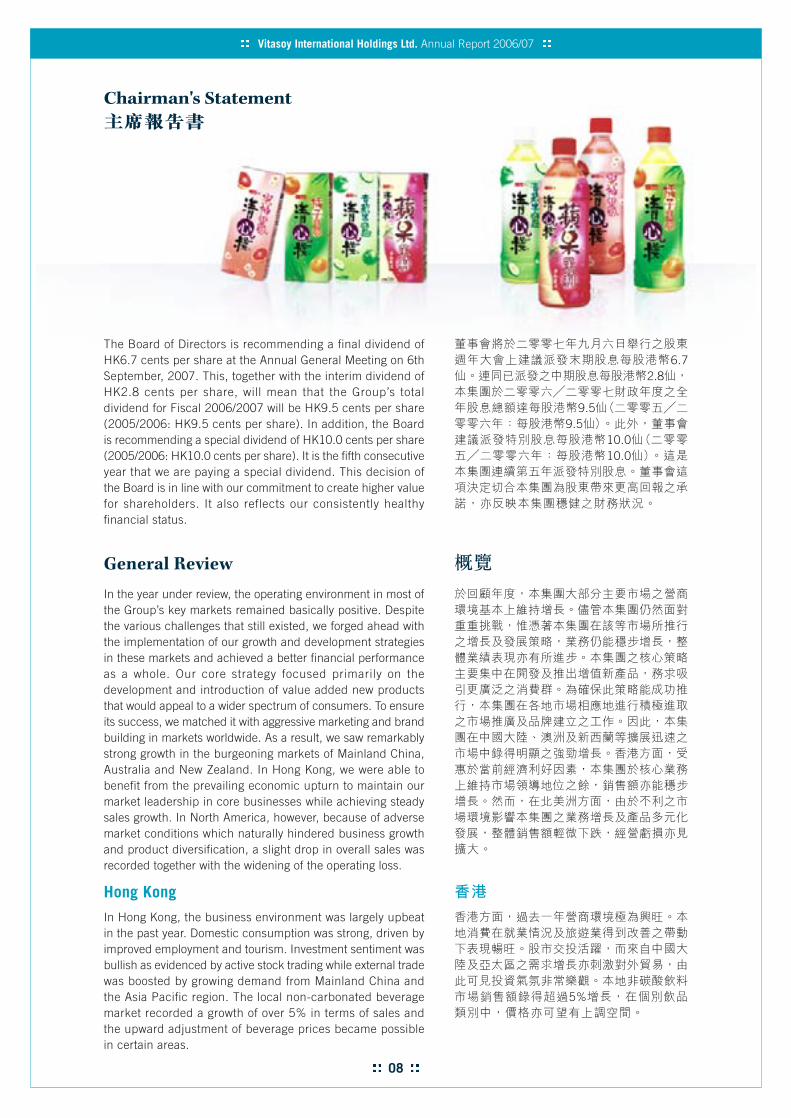
The Board of Directors is recommending a final dividend ofHK6.7 cents per share at the Annual General Meeting on 6thSeptember, 2007. This, together with the interim dividend ofHK2.8 cents per share, will mean that the Group’s totaldividend for Fiscal 2006/2007 will be HK9.5 cents per share(2005/2006: HK9.5 cents per share). In addition, the Boardis recommending a special dividend of HK10.0 cents per share(2005/2006: HK10.0 cents per share). It is the fifth consecutiveyear that we are paying a special dividend. This decision ofthe Board is in line with our commitment to create higher valuefor shareholders. It also reflects our consistently healthyfinancial status.
General Review
In the year under review, the operating environment in most ofthe Group’s key markets remained basically positive. Despitethe various challenges that still existed, we forged ahead withthe implementation of our growth and development strategiesin these markets and achieved a better financial performanceas a whole. Our core strategy focused primarily on thedevelopment and introduction of value added new productsthat would appeal to a wider spectrum of consumers. To ensureits success, we matched it with aggressive marketing and brandbuilding in markets worldwide. As a result, we saw remarkablystrong growth in the burgeoning markets of Mainland China,Australia and New Zealand. In Hong Kong, we were able tobenefit from the prevailing economic upturn to maintain ourmarket leadership in core businesses while achieving steadysales growth. In North America, however, because of adversemarket conditions which naturally hindered business growthand product diversification, a slight drop in overall sales wasrecorded together with the widening of the operating loss.
Hong KongIn Hong Kong, the business environment was largely upbeatin the past year. Domestic consumption was strong, driven byimproved employment and tourism. Investment sentiment wasbullish as evidenced by active stock trading while external tradewas boosted by growing demand from Mainland China andthe Asia Pacific region. The local non-carbonated beveragemarket recorded a growth of over 5% in terms of sales andthe upward adjustment of beverage prices became possiblein certain areas.
Chairman's Statement
6.72.8
9.59.5
10.010.0
5%

09
Chairman's Statement
Last year we saw steady sales growth in Hong Kong and, moreimportantly, we managed to maintain our operating margin,despite an increase in costs. Total sales in the local marketincreased by a healthy 3.8% in the full year, which wasprimarily driven by the introduction of new products that drewkeen response from the market.
The Group’s tuck shop business in Hong Kong under VitalandServices Limited continued to perform well. By the end of Fiscal2006/2007, the number of Vitaland tuck shops reached 303,versus 292 a year ago, and we commanded a significantmarket share in the school tuck shop business. The cateringbusiness of our subsidiary, Hong Kong Gourmet Limited, alsosustained its growth trend as we continued to drive penetrationin the local market.
The Group’s exports from Hong Kong improved further. Exportsales grew by 5.7% year-on-year. Exports to Macau roseconsiderably while sales in Singapore also increased after thechange of distributors.
North AmericaAs already mentioned, the performance of the Group’soperation in North America was hindered by an unfavourablemarket environment. In 2006, total soy food sales in the USshrank by 2% due mainly to declining tofu sales.
Sales revenue generated by the Group’s North Americanoperation decreased slightly by 0.2% in Fiscal 2006/2007.While there was an increase in revenue coming from newproducts as well as imported goods and pasta, the sales ofaseptic soymilk and tofu decreased. All in all, the operatingloss widened due mainly to the launching of two new productlines, namely, refrigerated sauces and salad dressings, thatdid not perform as satisfactorily as expected. In view of that,these product lines were subsequently discontinued.
We will maintain our advantages inareas we excel in and further enhance ourmarket positions in various markets.
3.8%
303 292
5.7%
2%
0.2%
Chairman's Statement
10
Chairman's Statement
Vitasoy International Holdings Ltd. Annual Report 2006/07
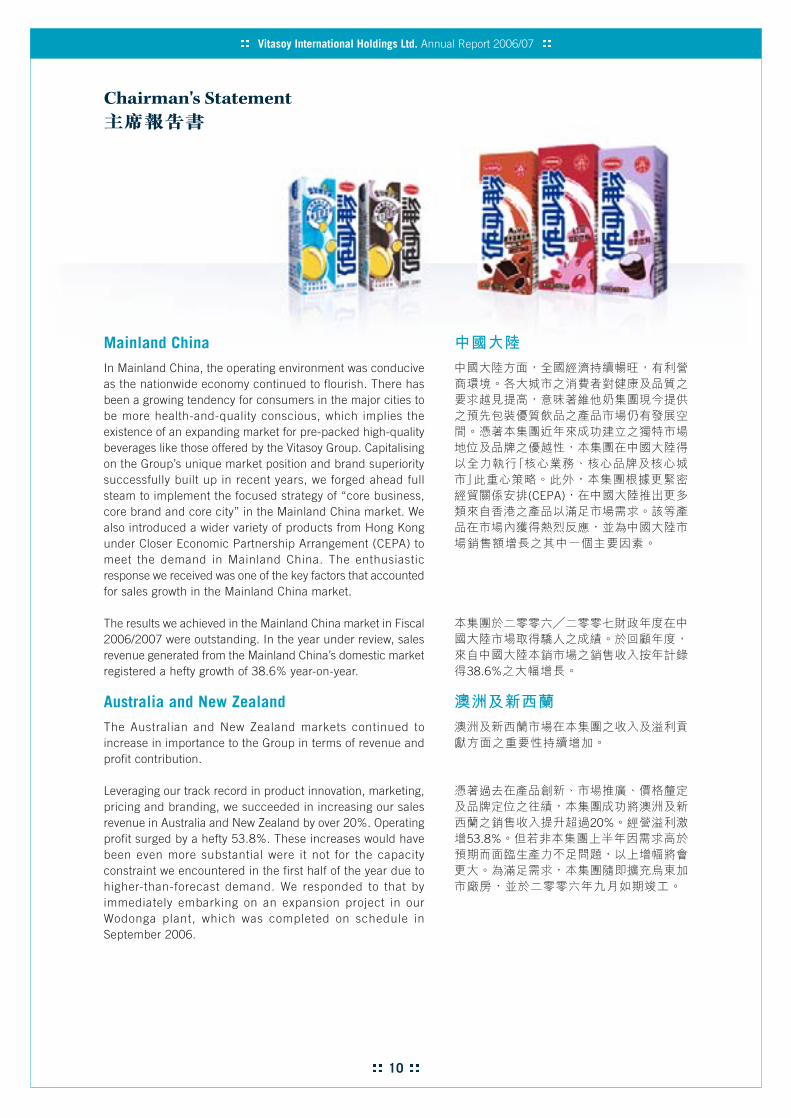
Mainland ChinaIn Mainland China, the operating environment was conduciveas the nationwide economy continued to flourish. There hasbeen a growing tendency for consumers in the major cities tobe more health-and-quality conscious, which implies theexistence of an expanding market for pre-packed high-qualitybeverages like those offered by the Vitasoy Group. Capitalisingon the Group’s unique market position and brand superioritysuccessfully built up in recent years, we forged ahead fullsteam to implement the focused strategy of “core business,core brand and core city” in the Mainland China market. Wealso introduced a wider variety of products from Hong Kongunder Closer Economic Partnership Arrangement (CEPA) tomeet the demand in Mainland China. The enthusiasticresponse we received was one of the key factors that accountedfor sales growth in the Mainland China market.
The results we achieved in the Mainland China market in Fiscal2006/2007 were outstanding. In the year under review, salesrevenue generated from the Mainland China’s domestic marketregistered a hefty growth of 38.6% year-on-year.
Australia and New ZealandThe Australian and New Zealand markets continued toincrease in importance to the Group in terms of revenue andprofit contribution.
Leveraging our track record in product innovation, marketing,pricing and branding, we succeeded in increasing our salesrevenue in Australia and New Zealand by over 20%. Operatingprofit surged by a hefty 53.8%. These increases would havebeen even more substantial were it not for the capacityconstraint we encountered in the first half of the year due tohigher-than-forecast demand. We responded to that byimmediately embarking on an expansion project in ourWodonga plant, which was completed on schedule inSeptember 2006.
Chairman's Statement
(CEPA)
38.6%
20%53.8%
11
Chairman's Statement
Outlook and Strategy
Looking ahead, we believe the operating environment will varyfrom market to market. Our challenge will be to maintain ouradvantages in areas we excel in and further enhance ourmarket positions in various markets. At the same time, we willrefine our business focus where necessary to ensure viabilityand long-term development.
Hong KongThe Hong Kong economy is expected to prosper and fueldomestic consumption in general which should in turn benefitthe beverage sector. We are pleased to see that the marketdemand for non-carbonated and healthier beverages has beengrowing. Concurrently, consumers’ needs are becomingincreasingly sophisticated while competition in terms ofproduct innovation and pricing to meet such needs is alsointensifying. While inflation is not considered a major issuefor Hong Kong as a whole, we realise that we must manageour operating costs proactively in view of fluctuating rawmaterial prices, higher staff-related expenses and, to someextent, imported inflation from Mainland China.
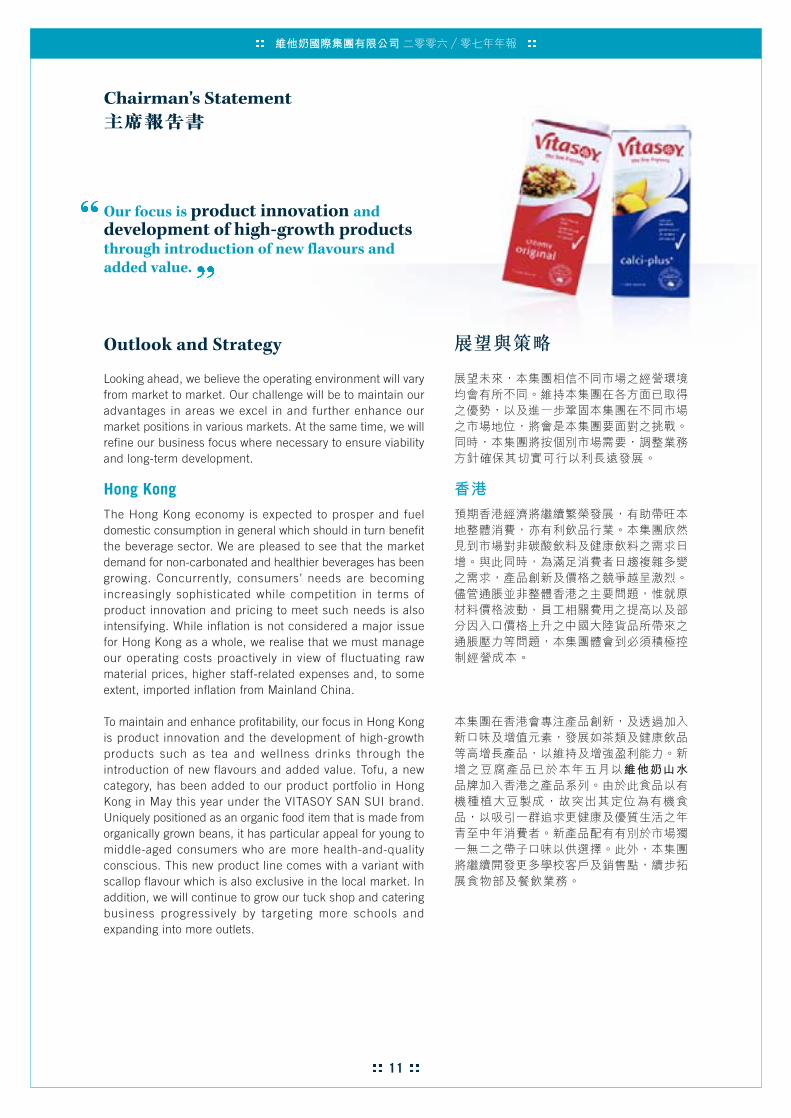
To maintain and enhance profitability, our focus in Hong Kongis product innovation and the development of high-growthproducts such as tea and wellness drinks through theintroduction of new flavours and added value. Tofu, a newcategory, has been added to our product portfolio in HongKong in May this year under the VITASOY SAN SUI brand.Uniquely positioned as an organic food item that is made fromorganically grown beans, it has particular appeal for young tomiddle-aged consumers who are more health-and-qualityconscious. This new product line comes with a variant withscallop flavour which is also exclusive in the local market. Inaddition, we will continue to grow our tuck shop and cateringbusiness progressively by targeting more schools andexpanding into more outlets.
Our focus is product innovation anddevelopment of high-growth productsthrough introduction of new flavours andadded value.
Chairman's Statement

12
Chairman's Statement
Vitasoy International Holdings Ltd. Annual Report 2006/07
Chairman's Statement
North AmericaFor North America, the operating environment is expected toremain challenging in view of the market condition. The soyfood market, however, might expect to see only slight growththis year.
Our goal in the coming months is to narrow the operatingloss substantially. We will achieve that through a three-pronged strategy. Firstly, we will re-focus on core productsand core competencies to increase sales revenue. We willreinforce the market position of NASOYA as a dominant tofu/pasta brand. To drive tofu sales, we will put more resourceson the emerging growth channels such as food service andclub stores. Leveraging our heritage and product innovation,we shall introduce more variants of seasonal soymilk anddevelop private label programmes for tofu. We will alsoenhance the image of VITASOY as a healthy beverageinnovator to grow the sales of aseptic soymilk. Secondly, wewill focus on the reduction of overheads with a view toimproving the cost base. Thirdly, given the strong marketpositions established by our NASOYA and AZUMAYA productlines in North America, we find that there is room for pricerevision. This move, to be taken in July 2007, should allowus to improve our operating results.
Mainland ChinaThe fast-expanding Mainland China market is likely to maintainits pace of growth. Greater affluence and health awarenessshould create higher demand for quality products, includingfunctional beverages that carry the health and natural concept.At the same time, the immense growth potential of this marketwill inevitably attract more competitors. This could alsostimulate the demand growth and we are confident to benefitfrom this healthy competition.
In the year ahead and beyond, we will continue with thestrategy of “core business, core brand and core city” inMainland China. Given our strong sales and profit-makingmomentum, we will increase our investment in brand buildingto further enhance our market position and corporate imageas “the soy expert”. We are in the process of rolling out more
We will increase our investment inbrand building to further enhanceour market position and corporate imageas “the soy expert”.
NASOYA
NASOYA AZUMAYA
CEPA
13
Chairman's StatementChairman's Statement
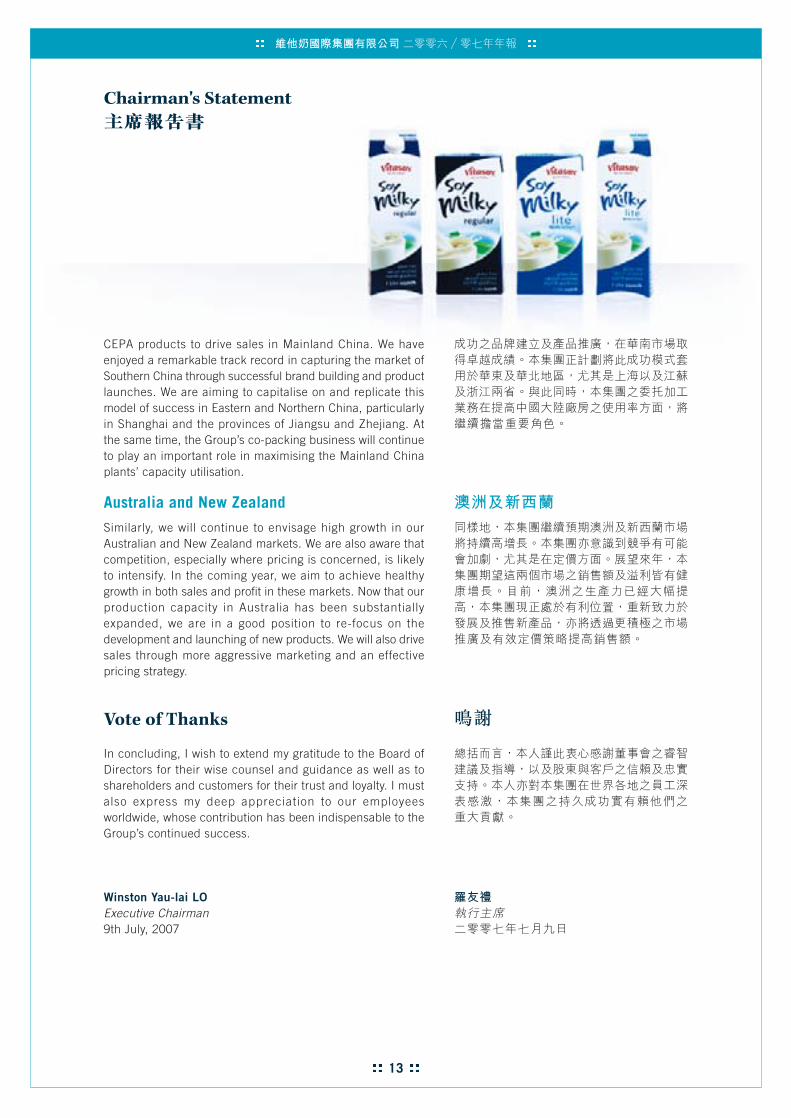
CEPA products to drive sales in Mainland China. We haveenjoyed a remarkable track record in capturing the market ofSouthern China through successful brand building and productlaunches. We are aiming to capitalise on and replicate thismodel of success in Eastern and Northern China, particularlyin Shanghai and the provinces of Jiangsu and Zhejiang. Atthe same time, the Group’s co-packing business will continueto play an important role in maximising the Mainland Chinaplants’ capacity utilisation.
Australia and New ZealandSimilarly, we will continue to envisage high growth in ourAustralian and New Zealand markets. We are also aware thatcompetition, especially where pricing is concerned, is likelyto intensify. In the coming year, we aim to achieve healthygrowth in both sales and profit in these markets. Now that ourproduction capacity in Australia has been substantiallyexpanded, we are in a good position to re-focus on thedevelopment and launching of new products. We will also drivesales through more aggressive marketing and an effectivepricing strategy.
Vote of Thanks
In concluding, I wish to extend my gratitude to the Board ofDirectors for their wise counsel and guidance as well as toshareholders and customers for their trust and loyalty. I mustalso express my deep appreciation to our employeesworldwide, whose contribution has been indispensable to theGroup’s continued success.
Winston Yau-lai LOExecutive Chairman9th July, 2007

Natural
Fresh
15
Management Report
Turnover
In the year under review, the Group’s totalturnover reached HK$2,693 million, up 6.9%from Fiscal 2005/2006, with Mainland China,Australia and New Zealand being the key driversof growth.
In the Hong Kong market, turnover improvedmore conspicuously in the second half of the yearby 5.6% after a modest growth of 2.0% in thefirst half. Profiting from the good response toproducts under CEPA and the success of the“core business, core brand and core city”strategy, the Group’s Mainland China operationposted a full-year sales increase of 38.6%. Totake advantage of the Group’s new productioncapacity in Australia, promotion activities were re-scheduled for the second half of Fiscal 2006/2007. This strategy led to an upsurge of sales inthe second half by 25.9%, which was almostdouble that of the first half. Sales in NorthAmerica saw a slight decline of 0.2% mainly dueto the softening of the mainstream market foraseptic soymilk and tofu, which was primarilyoffset by increase in revenue from new products,imported goods and pasta.
2,693,000,000
6.9%
2.0%5.6%
38.6%CEPA
25.9%
0.2%
16
Management Report
Vitasoy International Holdings Ltd. Annual Report 2006/07
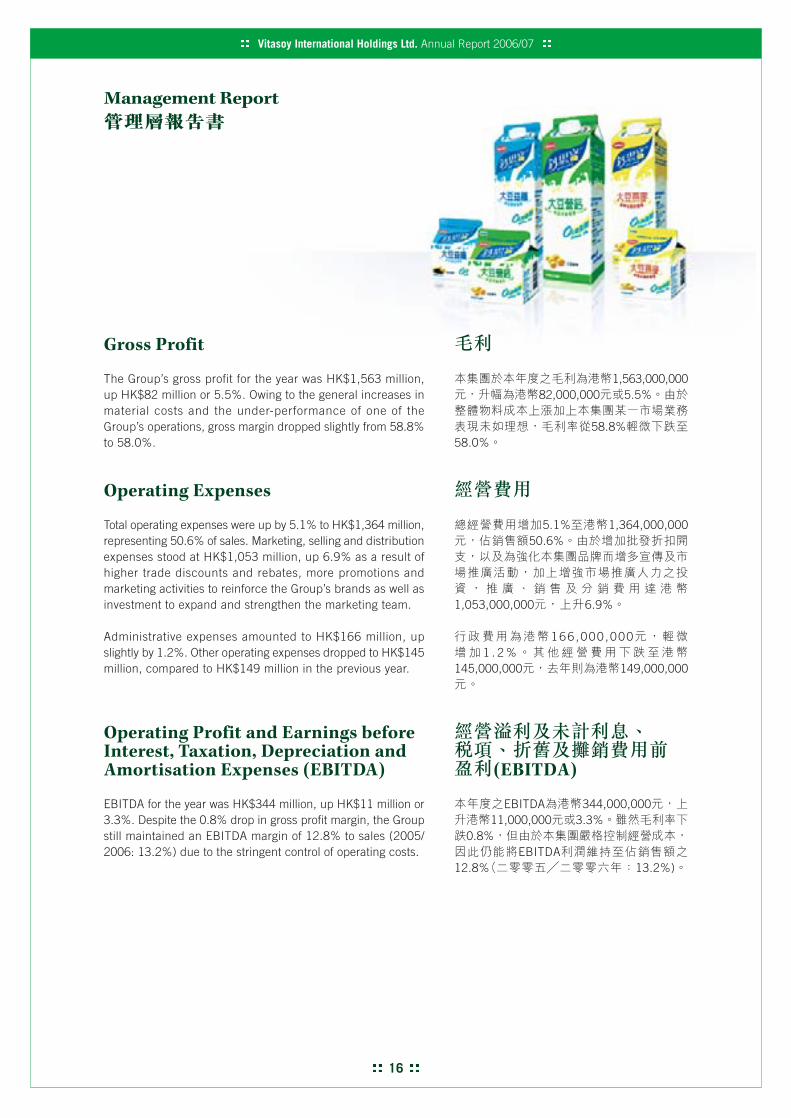
Gross Profit
The Group’s gross profit for the year was HK$1,563 million,up HK$82 million or 5.5%. Owing to the general increases inmaterial costs and the under-performance of one of theGroup’s operations, gross margin dropped slightly from 58.8%to 58.0%.
Operating Expenses
Total operating expenses were up by 5.1% to HK$1,364 million,representing 50.6% of sales. Marketing, selling and distributionexpenses stood at HK$1,053 million, up 6.9% as a result ofhigher trade discounts and rebates, more promotions andmarketing activities to reinforce the Group’s brands as well asinvestment to expand and strengthen the marketing team.
Administrative expenses amounted to HK$166 million, upslightly by 1.2%. Other operating expenses dropped to HK$145million, compared to HK$149 million in the previous year.
Operating Profit and Earnings beforeInterest, Taxation, Depreciation andAmortisation Expenses (EBITDA)
EBITDA for the year was HK$344 million, up HK$11 million or3.3%. Despite the 0.8% drop in gross profit margin, the Groupstill maintained an EBITDA margin of 12.8% to sales (2005/2006: 13.2%) due to the stringent control of operating costs.
Management Report
1,563,000,00082,000,000 5.5%
58.8%58.0%
5.1% 1,364,000,00050.6%
1,053,000,000 6.9%
166 ,000 ,0001 . 2 %
145,000,000 149,000,000
(EBITDA)
EBITDA 344,000,00011,000,000 3.3%
0.8%EBITDA
12.8% 13.2%)

17
Management Report
Profit Attributable to Equity Shareholdersof the Company
For the year ended 31st March, 2007, profit attributable to equityshareholders of the Company was HK$174 million, representinga moderate increase of 1.2% from Fiscal 2005/2006.
Liquidity and Financial Resources
The Group’s financial position has remained very strong. Asat 31st March, 2007, the Group was in a healthy net cashposition of HK$368 million (31st March, 2006: HK$393million). Banking facilities available to but not used by theGroup amounted to HK$301 million.
As at 31st March, 2007, the Group’s borrowings (includingobligations under finance leases) amounted to HK$132 million(31st March, 2006: HK$125 million), most of which were atfloating interest rates. The maturity profiles of the borrowingswere spread over a period of ten years, with HK$35 millionrepayable in the first year, HK$75 million repayable in thesecond year and HK$22 million in the remaining years. Theborrowings denominated in US and Australian dollars werethe equivalent of HK$16 mill ion and HK$116 mill ionrespectively. The gearing ratio (total borrowings/total equityattributable to equity shareholders of the Company) was 10.5%(31st March, 2006: 10.0%).
The Group incurred capital expenditure totalling HK$135million in 2006/2007 (2005/2006: HK$64 million), which wasprimarily funded by cash generated from various operations.
Charges on Group Assets
As at 31st March, 2007, certain assets of the Group withan aggregate carrying value of HK$35 million (31st March,2006: HK$40 million) were pledged under certain loans andlease agreements.
Management Report
174,000,000
1.2%
368,000,000393,000,000
301,000,000
132,000,000
125,000,000
3 5 , 0 0 0 , 0 0 075,000,00022,000,000
16,000,000 116,000,000
10.5%10.0%
135,000,00064,000,000 )
35,000,00040,000,000
18
Management Report
Vitasoy International Holdings Ltd. Annual Report 2006/07
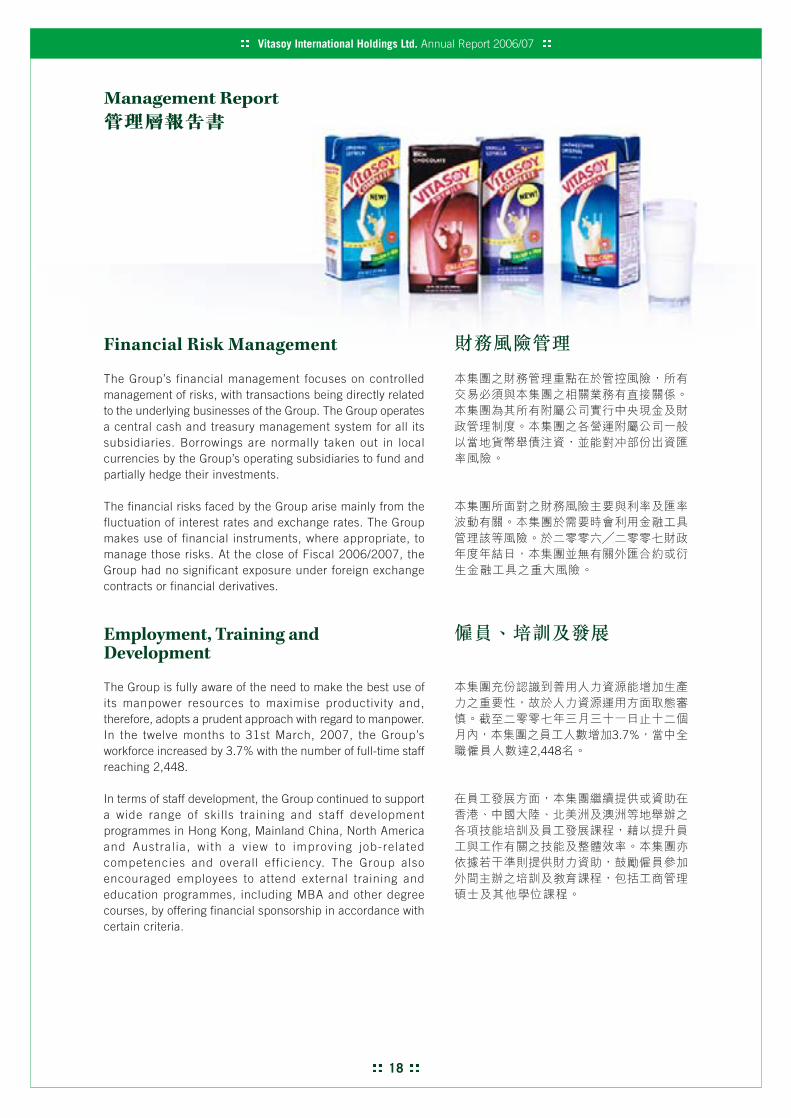
Financial Risk Management
The Group’s financial management focuses on controlledmanagement of risks, with transactions being directly relatedto the underlying businesses of the Group. The Group operatesa central cash and treasury management system for all itssubsidiaries. Borrowings are normally taken out in localcurrencies by the Group’s operating subsidiaries to fund andpartially hedge their investments.
The financial risks faced by the Group arise mainly from thefluctuation of interest rates and exchange rates. The Groupmakes use of financial instruments, where appropriate, tomanage those risks. At the close of Fiscal 2006/2007, theGroup had no significant exposure under foreign exchangecontracts or financial derivatives.
Employment, Training andDevelopment
The Group is fully aware of the need to make the best use ofits manpower resources to maximise productivity and,therefore, adopts a prudent approach with regard to manpower.In the twelve months to 31st March, 2007, the Group’sworkforce increased by 3.7% with the number of full-time staffreaching 2,448.
In terms of staff development, the Group continued to supporta wide range of skil ls training and staff developmentprogrammes in Hong Kong, Mainland China, North Americaand Austral ia, with a v iew to improving job-relatedcompetencies and overall eff iciency. The Group alsoencouraged employees to attend external training andeducation programmes, including MBA and other degreecourses, by offering financial sponsorship in accordance withcertain criteria.
Management Report
3.7%2,448

19
Management Report
The Group’s remuneration policies and packages remainedunchanged during the year. The remuneration packages forthe staff (including the executive directors) that covered basicsalaries, discretionary bonuses, share options and other long-term benefits were pegged to the Group’s and individualemployee’s performance, and were meant to reflect the valuegenerated by everyone during the year.
Corporate Social Responsibility
Safety and Health of EmployeesThe Group is fully committed to ensuring the safety and healthof its employees. The safety and health committees establishedin the Group’s various operations are responsible for constantlyimproving safety and health in the workplace by carrying outregular risk assessment of work sites and by establishingpolicies and guidelines for improvement and taking correctiveaction where necessary. Regular and intensive training onsafety and health is also provided for staff.
Health and WellnessDuring the year, the Group participated in various activities topromote health and wellness in the community. These includedHong Kong College of Cardiology’s Jump Rope for HeartCarnival, United Christian Nethersole Hospital’s interschoolhealthy meal competition, Chinese University of Hong Kong’sBone Health Education Carnival, and Children’s HeartFoundation’s health exhibition and charity walk.
On the other hand, through the launching of VITASOY SANSUI Tofu and Fresh CALCI-PLUS Soymilk Drink, the Groupcontinued to promote a healthy diet among consumers. Topromote healthy eating at school, the Group engaged dieticiansto help design the lunch menu for students and suppliedhealthier snacks to schools.
Management Report
20
Management Report
Vitasoy International Holdings Ltd. Annual Report 2006/07
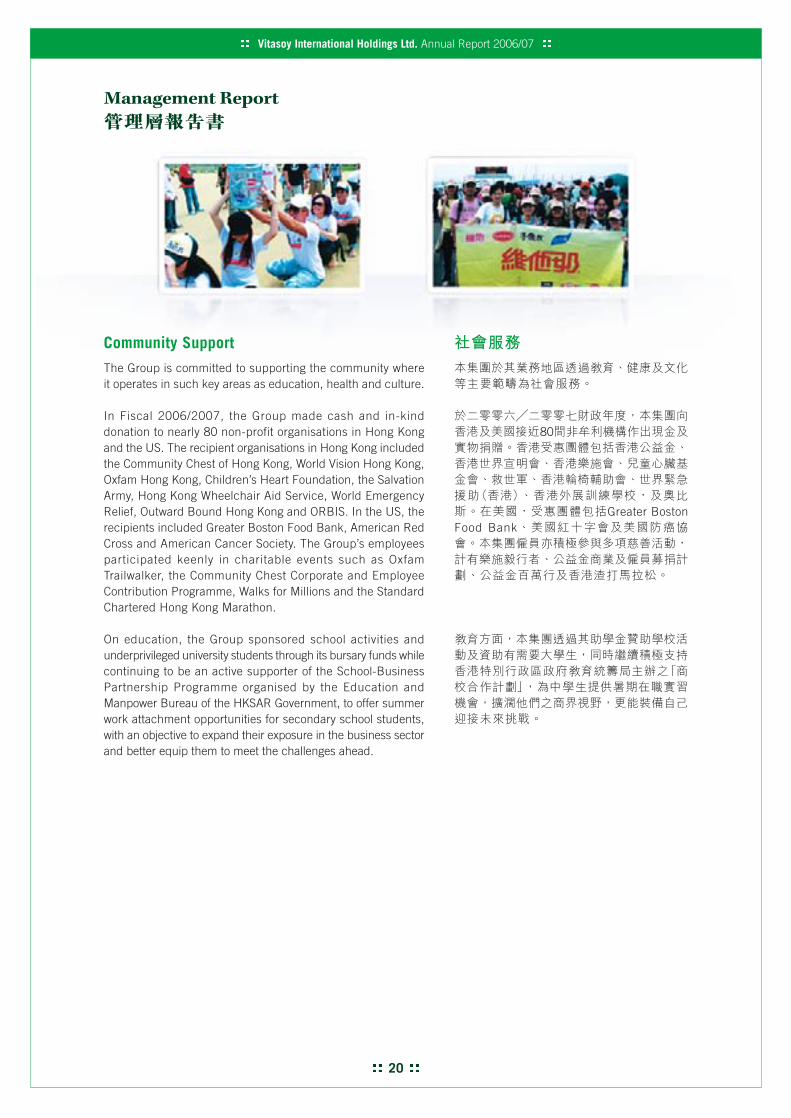
Community SupportThe Group is committed to supporting the community whereit operates in such key areas as education, health and culture.
In Fiscal 2006/2007, the Group made cash and in-kinddonation to nearly 80 non-profit organisations in Hong Kongand the US. The recipient organisations in Hong Kong includedthe Community Chest of Hong Kong, World Vision Hong Kong,Oxfam Hong Kong, Children’s Heart Foundation, the SalvationArmy, Hong Kong Wheelchair Aid Service, World EmergencyRelief, Outward Bound Hong Kong and ORBIS. In the US, therecipients included Greater Boston Food Bank, American RedCross and American Cancer Society. The Group’s employeesparticipated keenly in charitable events such as OxfamTrailwalker, the Community Chest Corporate and EmployeeContribution Programme, Walks for Millions and the StandardChartered Hong Kong Marathon.
On education, the Group sponsored school activities andunderprivileged university students through its bursary funds whilecontinuing to be an active supporter of the School-BusinessPartnership Programme organised by the Education andManpower Bureau of the HKSAR Government, to offer summerwork attachment opportunities for secondary school students,with an objective to expand their exposure in the business sectorand better equip them to meet the challenges ahead.
Management Report
80
Greater BostonFood Bank

21
Management Report
EnvironmentThe Group continued to support environmental protection byminimising all kinds of industrial wastes generated from itsproduction processes, and ensuring that its waste treatmentsystems perform their best at all times. The lunch boxes andutensils used in the Group’s tuck shops are made of recyclableor reusable materials.
Recognitions and Awards
In Hong Kong, we again received the Caring Company logofrom the Hong Kong Council of Social Service, while VitalandServices Limited was awarded the Certificate of OutstandingPerformance by the Employees Retraining Board. VitalandServices Limited and Hong Kong Gourmet Limited were
honoured with the Caring EmployerAward and Caring EmployerHonourable Award respectively bythe New Territories AssociationRetraining Centre.
In Mainland China, VITASOYbrand was voted as one of the topthree Hong Kong brands in the“PRC In ternet Users ’ MostFavourable Hong Kong Brands2 0 0 7 ” , a n o n l i n e s u r v e yconducted on Sohu.com, andalso voted as one of the “PRC
Consumers’ Most Favourable Hong Kong Brands (GoldenBrands) 2007”. In addition, Hong Kong Gourmet Limited wasawarded the Hazard Analysis and Critical Control Point(HACCP) accreditation.
Management Report
20072007
(HACCP)

22
Management Report
Vitasoy International Holdings Ltd. Annual Report 2006/07
Management Report
Hong Kong
Production Efficiency
2006/2007 2005/2006By Location of Assets (Production Plants) HK$ million HK$ million Movement
Revenue 1,474 1,419 3.9%Segment Result 222 213 4.2%Segment Net Operating Assets 475 463 2.6%
The Group’s production plant in Tuen Mun supports bothdomestic sales and exports to markets in Europe, Macau,Southeast Asia and the Americas. During the year, newpackaging equipment was installed to cater to the market shiftto slimmer packaging. For the year ended 31st March, 2007,revenue generated by this plant and the Group’s tuck shopbusiness reached HK$1,474 million, an increase of 3.9% overthe previous year. The segment result for the year was HK$222million (2005/2006: HK$213 million).
Market Performance
2006/2007 2005/2006By Location of Customers HK$ million HK$ million Movement
Revenue – Hong Kong – Domestic Market 1,669 1,608 3.8%
Revenue – Export Markets – 92 87 5.7%
(1) Hong Kong Domestic MarketThe Hong Kong economy continued to expand at a steadypace in 2006. Driven by domestic demand, investmentand external trade, GDP for 2006 registered a robustincrease of 6.8%. Despite this growth, inflationarypressure remained mi ld. Under th is economicenvironment, the non-carbonated drinks market grew byover 5%. Signs of effective price increment in the retailmarket began to emerge towards the end of the year.
1,474,000,0003.9%
222,000,000213,000,000
(1)
6.8%
5%
23
Management Report
Hong Kong (continued)
Market Performance (continued)
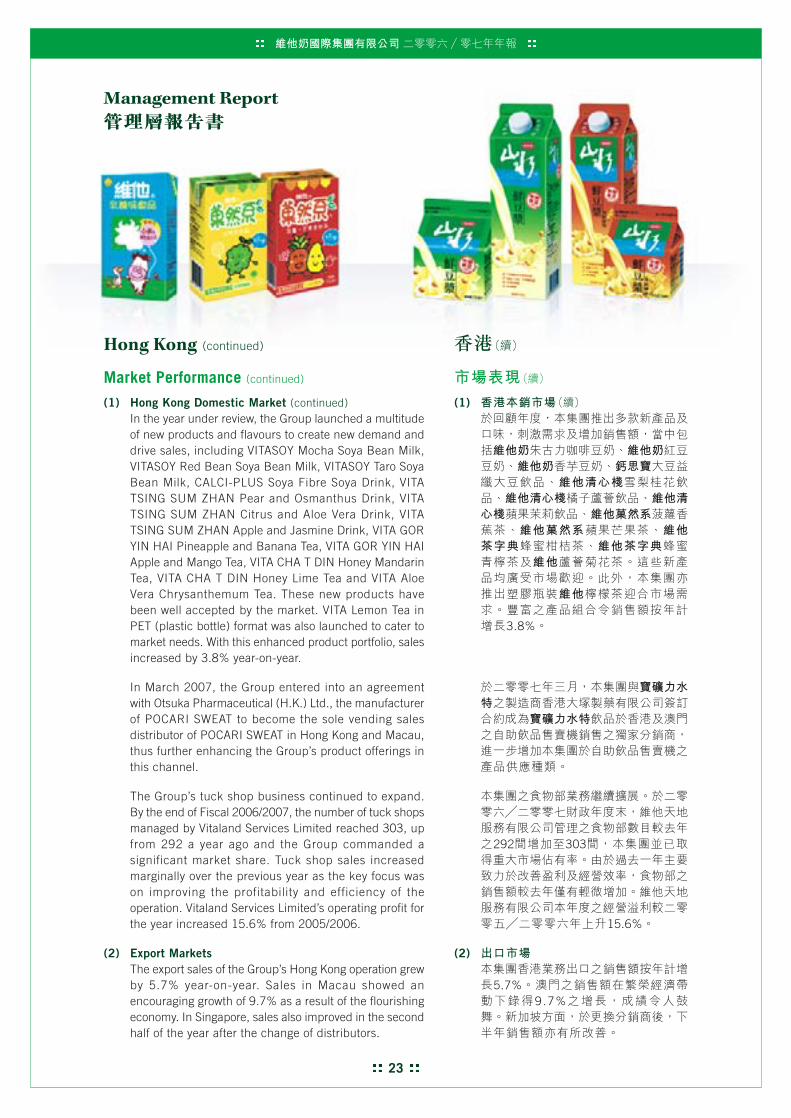
(1) Hong Kong Domestic Market (continued)In the year under review, the Group launched a multitudeof new products and flavours to create new demand anddrive sales, including VITASOY Mocha Soya Bean Milk,VITASOY Red Bean Soya Bean Milk, VITASOY Taro SoyaBean Milk, CALCI-PLUS Soya Fibre Soya Drink, VITATSING SUM ZHAN Pear and Osmanthus Drink, VITATSING SUM ZHAN Citrus and Aloe Vera Drink, VITATSING SUM ZHAN Apple and Jasmine Drink, VITA GORYIN HAI Pineapple and Banana Tea, VITA GOR YIN HAIApple and Mango Tea, VITA CHA T DIN Honey MandarinTea, VITA CHA T DIN Honey Lime Tea and VITA AloeVera Chrysanthemum Tea. These new products havebeen well accepted by the market. VITA Lemon Tea inPET (plastic bottle) format was also launched to cater tomarket needs. With this enhanced product portfolio, salesincreased by 3.8% year-on-year.
In March 2007, the Group entered into an agreementwith Otsuka Pharmaceutical (H.K.) Ltd., the manufacturerof POCARI SWEAT to become the sole vending salesdistributor of POCARI SWEAT in Hong Kong and Macau,thus further enhancing the Group’s product offerings inthis channel.
The Group’s tuck shop business continued to expand.By the end of Fiscal 2006/2007, the number of tuck shopsmanaged by Vitaland Services Limited reached 303, upfrom 292 a year ago and the Group commanded asignificant market share. Tuck shop sales increasedmarginally over the previous year as the key focus wason improving the profitability and efficiency of theoperation. Vitaland Services Limited’s operating profit forthe year increased 15.6% from 2005/2006.
(2) Export MarketsThe export sales of the Group’s Hong Kong operation grewby 5.7% year-on-year. Sales in Macau showed anencouraging growth of 9.7% as a result of the flourishingeconomy. In Singapore, sales also improved in the secondhalf of the year after the change of distributors.
Management Report
(1)
3.8%
292 303
15.6%
(2)
5.7%9.7%

24
Management Report
Vitasoy International Holdings Ltd. Annual Report 2006/07
Management Report
North America
Production Efficiency
2006/2007 2005/2006By Location of Assets (Production Plant) HK$ million HK$ million Movement
Revenue 379 386 (1.8%)Segment Result (49) (20) (145.0%)Segment Net Operating Assets 182 205 (11.2%)
The Group’s production plant in Massachusetts supports theNorth American market. During the year, the plant generatedHK$379 mill ion in revenue, a slight decline of 1.8%.Operating loss increased to HK$49 million due mainly to thecosts associated with the new products launches, decliningtofu sales, and additional trade expenses to drive asepticsoymilk sales.
Market Performance
2006/2007 2005/2006By Location of Customers HK$ million HK$ million Movement
Revenue – North American Market 439 440 (0.2%)
Total soy food sales in North America showed a decline of2.0%. Soymilk sales registered a 10.5% growth versus theprevious year, mainly attributable to refrigerated soymilk. Tofusales, which represented 6.6% of the total soy food market,saw a decline of 1.2% last year.
Revenue generated from the North American market wasHK$439 million, a marginal decrease of 0.2%. This was theresult of the softening of aseptic soymilk and tofu sales, whichwas primarily offset by increase in revenue from new products,imported goods and pasta. In view of the under-performanceof the new product lines, we have re-adjusted our businessstrategy to focus more heavily on core products andcompetencies as well as cost management in order to narrowthe operating loss substantially in the coming year.
379,000,0001.8%
49,000,000
2.0%10.5%
6.6% 1.2%
439,000,0000.2%
25
Management ReportManagement Report
2006/2007 2005/2006By Location of Assets (Production Plants) HK$ million HK$ million Movement
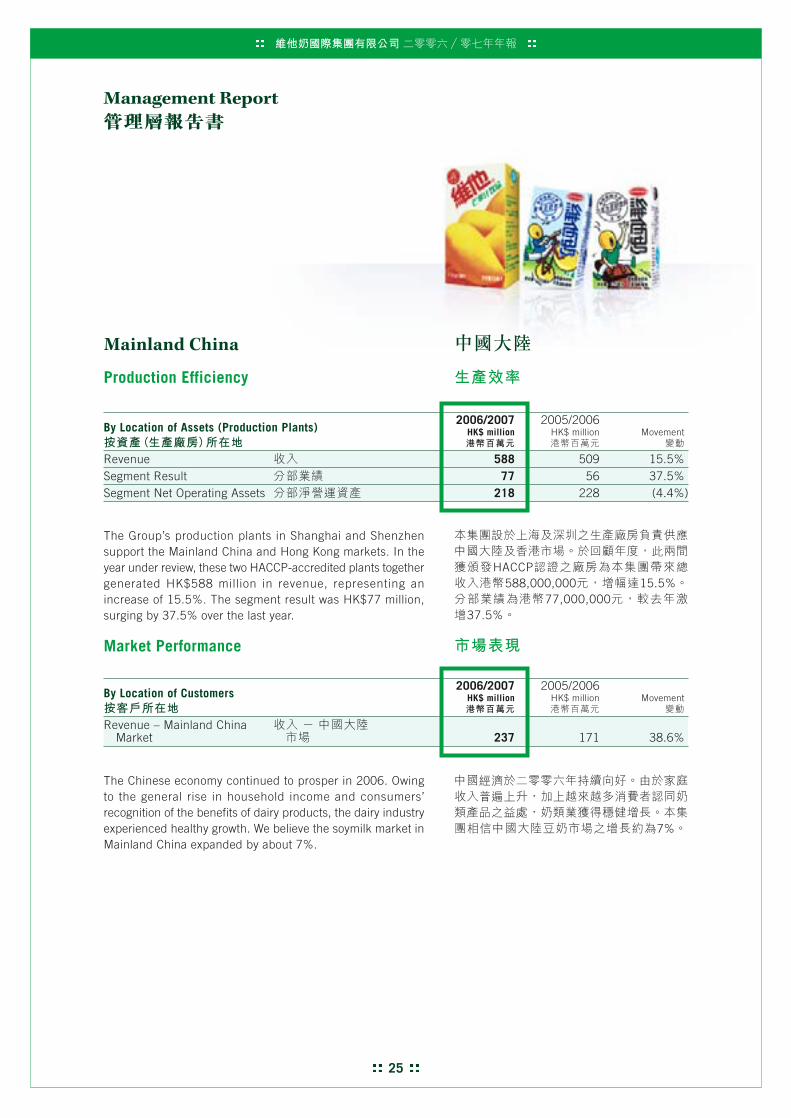
Revenue 588 509 15.5%Segment Result 77 56 37.5%Segment Net Operating Assets 218 228 (4.4%)
The Group’s production plants in Shanghai and Shenzhensupport the Mainland China and Hong Kong markets. In theyear under review, these two HACCP-accredited plants togethergenerated HK$588 million in revenue, representing anincrease of 15.5%. The segment result was HK$77 million,surging by 37.5% over the last year.
Market Performance
2006/2007 2005/2006By Location of Customers HK$ million HK$ million Movement
Revenue – Mainland China Market 237 171 38.6%
The Chinese economy continued to prosper in 2006. Owingto the general rise in household income and consumers’recognition of the benefits of dairy products, the dairy industryexperienced healthy growth. We believe the soymilk market inMainland China expanded by about 7%.
Mainland China
Production Efficiency
HACCP588,000,000 15.5%
77,000,00037.5%
7%
26
Management Report
Vitasoy International Holdings Ltd. Annual Report 2006/07
Mainland China (continued)
Market Performance (continued)
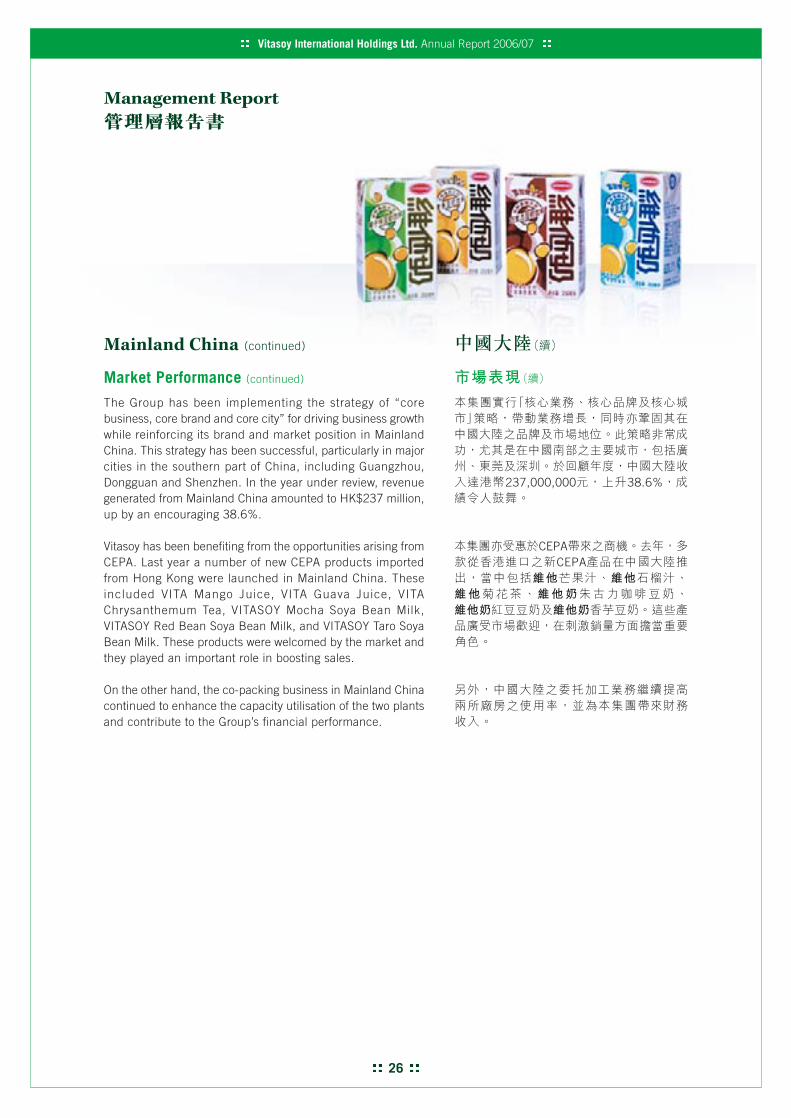
The Group has been implementing the strategy of “corebusiness, core brand and core city” for driving business growthwhile reinforcing its brand and market position in MainlandChina. This strategy has been successful, particularly in majorcities in the southern part of China, including Guangzhou,Dongguan and Shenzhen. In the year under review, revenuegenerated from Mainland China amounted to HK$237 million,up by an encouraging 38.6%.
Vitasoy has been benefiting from the opportunities arising fromCEPA. Last year a number of new CEPA products importedfrom Hong Kong were launched in Mainland China. Theseincluded VITA Mango Juice, VITA Guava Juice, VITAChrysanthemum Tea, VITASOY Mocha Soya Bean Milk,VITASOY Red Bean Soya Bean Milk, and VITASOY Taro SoyaBean Milk. These products were welcomed by the market andthey played an important role in boosting sales.
On the other hand, the co-packing business in Mainland Chinacontinued to enhance the capacity utilisation of the two plantsand contribute to the Group’s financial performance.
Management Report
237,000,000 38.6%
CEPACEPA
27
Management Report
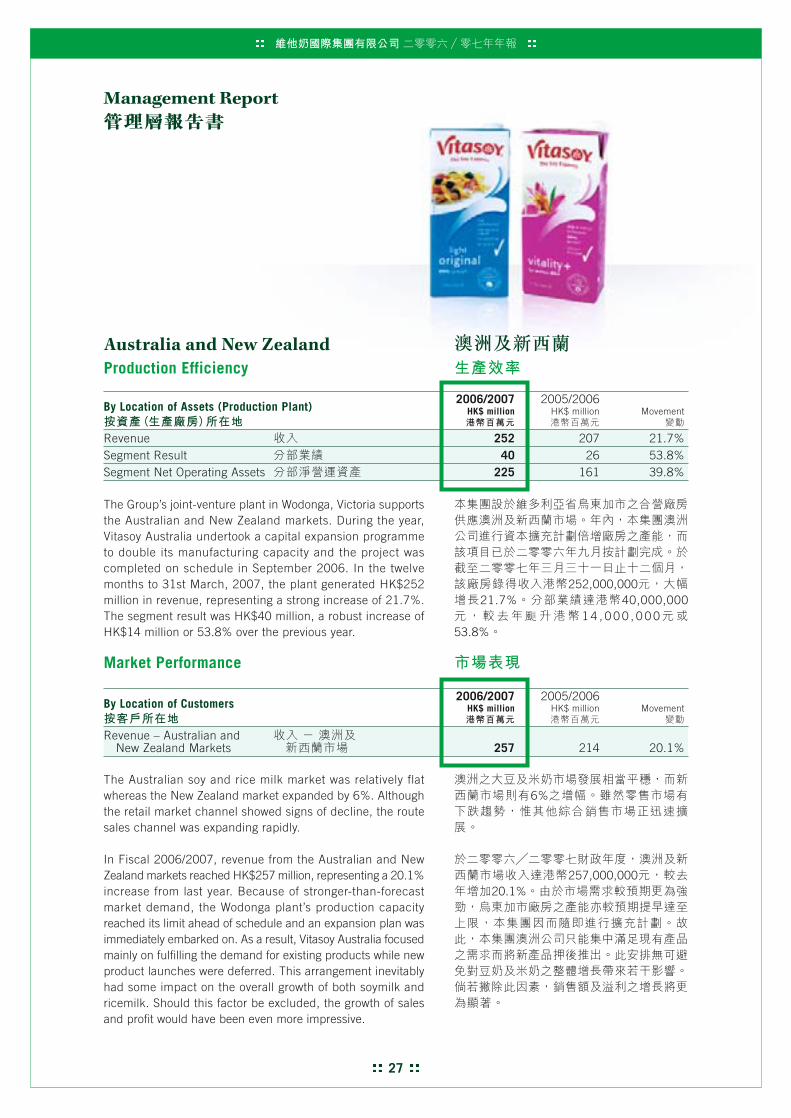
2006/2007 2005/2006By Location of Assets (Production Plant) HK$ million HK$ million Movement
Revenue 252 207 21.7%Segment Result 40 26 53.8%Segment Net Operating Assets 225 161 39.8%
The Group’s joint-venture plant in Wodonga, Victoria supportsthe Australian and New Zealand markets. During the year,Vitasoy Australia undertook a capital expansion programmeto double its manufacturing capacity and the project wascompleted on schedule in September 2006. In the twelvemonths to 31st March, 2007, the plant generated HK$252million in revenue, representing a strong increase of 21.7%.The segment result was HK$40 million, a robust increase ofHK$14 million or 53.8% over the previous year.
Market Performance
2006/2007 2005/2006By Location of Customers HK$ million HK$ million Movement
Revenue – Australian and New Zealand Markets 257 214 20.1%
The Australian soy and rice milk market was relatively flatwhereas the New Zealand market expanded by 6%. Althoughthe retail market channel showed signs of decline, the routesales channel was expanding rapidly.
In Fiscal 2006/2007, revenue from the Australian and NewZealand markets reached HK$257 million, representing a 20.1%increase from last year. Because of stronger-than-forecastmarket demand, the Wodonga plant’s production capacityreached its limit ahead of schedule and an expansion plan wasimmediately embarked on. As a result, Vitasoy Australia focusedmainly on fulfilling the demand for existing products while newproduct launches were deferred. This arrangement inevitablyhad some impact on the overall growth of both soymilk andricemilk. Should this factor be excluded, the growth of salesand profit would have been even more impressive.
Australia and New ZealandProduction Efficiency
Management Report
252,000,00021.7% 40,000,000
1 4 , 0 0 0 , 0 0 053.8%
6%
257,000,00020.1%

Experience
Professionalism
29
Corporate Governance Report
Corporate Governance Practices
We are firmly committed to statutory andregulatory corporate governance standards andadherence to the principles of corporategovernance emphasising transparency,independence, accountability, responsibility andfairness. The Board of Directors reviews thecorporate governance practices from time to timeto ensure alignment of interests and expectationsfrom our shareholders, the investing public andthe other stakeholders.
The Company has, throughout the year ended31st March, 2007, complied with the codeprovisions set out in the Code on CorporateGovernance Practices contained in Appendix 14of the Rules Governing the Listing of Securities onThe Stock Exchange of Hong Kong Limited (the“Listing Rules”) except for the Code ProvisionA.2.1 for the separation of the roles of ExecutiveChairman and Chief Executive Officer.
14
A.2.1
30
Corporate Governance Report
Vitasoy International Holdings Ltd. Annual Report 2006/07
Board of Directors
The general management of the Company’s business is vestedin the Board. The Board has established various committeesto manage and oversee the specified affairs of the Company.The Board has delegated the day-to-day management powerof the Company to the Executive Directors and seniormanagement of the Company.
The Board is committed to the Company’s mission to creatingvalue for our shareholders. The Board is responsible fordeveloping the strategic directions for the Company andcontinuous monitoring of the performance of the generalmanagement of the Company. Therefore Strategic Planninghas become a very crucial part of the Board’s function and alot of focus and attention has been devoted to such a plan.Strategic planning horizons are generally five years. The Boardhas adopted its latest Five Year Strategic Plan in 2005 andwill be adopting an updated Strategic Plan during the financialyear of 2007/2008. It is the practice of the Board to continueto review and update its Strategic Plan for the Company on aregular basis given the changes in the business environment.
A defined schedule of matters reserved for Board decisionhas been adopted by the Board. Apart from the strategicplanning, certain important matters involving finance andshareholders’ interests are reserved for approval by the Board,including, for example, annual budget, financial statementsagainst budget, dividend policy, material investments, materialacquisitions and disposals; major financing activities andappointment of Director(s) following the recommendation(s)by the Remuneration and Nomination Committee.
Board Composition
The Board currently comprises five Non-executive Directorsand four Executive Directors. Three of the Non-executiveDirectors are independent, from different business andprofessional fields. The Independent non-executive Directorsrepresent one-third of the Board. The category, position andbrief biographical information of each Director, together withthe relationship amongst each other, are set out in the“Directors and Senior Management” section in this AnnualReport. The Directors, including the Non-executive Directors,have brought a wide spectrum of valuable business experience,knowledge and professionalism to the Board for its efficientand effective delivery of the Board functions.

31
Corporate Governance Report
The Company has received, from each of the IndependentNon-executive Directors, an annual confirmation of hisindependence pursuant to Rule 3.13 of the Listing Rules. TheCompany considers all of the Independent Non-executiveDirectors are independent.
The Company has arranged Directors’ and Officers’ LiabilityInsurance for the Directors and Officers of the Company.
Chairman and Chief Executive Officer
Code Provision A.2.1 of the Listing Rules sets out that the rolesof the Chairman and Chief Executive Officer should be separateand should not be performed by the same individual. Mr.Winston Yau-lai LO is the Executive Chairman and ChiefExecutive Officer of the Company. At the present stage, the rolesof the Chairman of the Board and Chief Executive Officer of theCompany are performed basically by Mr. Winston Yau-lai LO.However, the Board of Directors and the Executive Chairman ofthe Company fully recognise that the respective roles of theChairman of the Board and the Chief Executive Officer shouldbe separated in the course of time to ensure better checks andbalances and hence better corporate governance.
We regret to note the resignation of Mr. Ambrose Kam-shingCHAN, Chief Executive, Asia. We have recently promoted Mr.Laurence P. EISENTRAGER, Chief Executive, Hong Kong tothe Group Chief Executive Officer reporting to the Chairmanof the Board effective from 1st August, 2007, upon thedeparture of Mr. Ambrose Kam-shing CHAN on 26th July,2007. Mr. Laurence P. EISENTRAGER will start to assume theexecutive responsibilities from the Executive Chairman andthis is expected to take place in the course of the next 18months. We still envisage that the transition process ofassigning the responsibilities of the Executive Chairman to theGroup Chief Executive Officer will progress smoothly.
3.13
A.2.1
32
Corporate Governance Report
Vitasoy International Holdings Ltd. Annual Report 2006/07
Board Proceedings
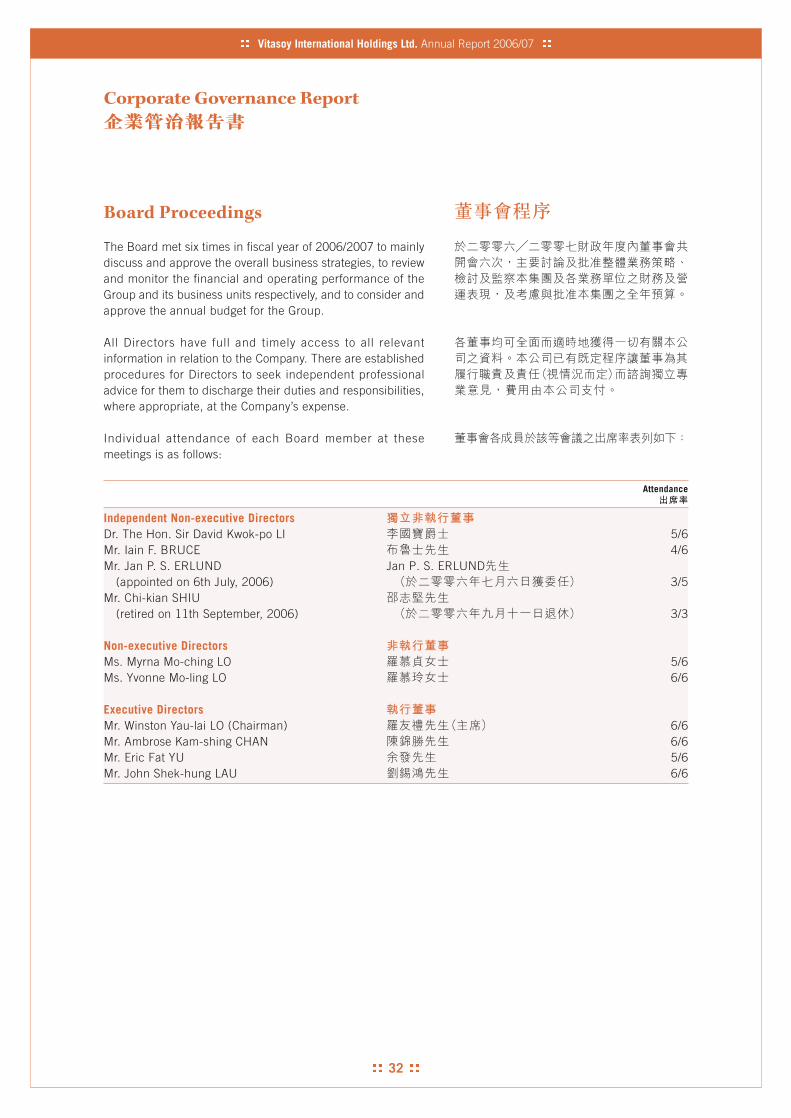
The Board met six times in fiscal year of 2006/2007 to mainlydiscuss and approve the overall business strategies, to reviewand monitor the financial and operating performance of theGroup and its business units respectively, and to consider andapprove the annual budget for the Group.
All Directors have full and timely access to all relevantinformation in relation to the Company. There are establishedprocedures for Directors to seek independent professionaladvice for them to discharge their duties and responsibilities,where appropriate, at the Company’s expense.
Individual attendance of each Board member at thesemeetings is as follows:
Attendance
Independent Non-executive DirectorsDr. The Hon. Sir David Kwok-po LI 5/6Mr. Iain F. BRUCE 4/6Mr. Jan P. S. ERLUND Jan P. S. ERLUND
(appointed on 6th July, 2006) 3/5Mr. Chi-kian SHIU
(retired on 11th September, 2006) 3/3
Non-executive DirectorsMs. Myrna Mo-ching LO 5/6Ms. Yvonne Mo-ling LO 6/6
Executive DirectorsMr. Winston Yau-lai LO (Chairman) 6/6Mr. Ambrose Kam-shing CHAN 6/6Mr. Eric Fat YU 5/6Mr. John Shek-hung LAU 6/6
33
Corporate Governance Report
Appointment, Re-election andRemoval of Directors
The appointment of a new Director is made on therecommendation of the Remuneration and NominationCommittee of the Company or by shareholders in generalmeeting. Any Director who is appointed by the Board shallretire at the next General Meeting.
The Non-executive Directors of the Company do not have aspecific term of appointment. Under the Company’s currentArticles of Association, all Directors are subject to retirementby rotation at least every three years and one-third (or thenumber nearest to but not exceeding one-third) of Directorsshall retire from office every year at the Company’s AnnualGeneral Meeting. The term of appointment of a Director cannotexceed three years.
Induction programmes are arranged for the newly appointedDirectors on the general business of the Company. Onappointment, new Directors will also be given an inductionprogramme kit advising them of their responsibilities and dutiesas Directors under various regulatory requirements and theBoard procedures, including the Terms of Reference of theBoard Committees.
Responsibilities of Directors
Directors acknowledge their responsibilities for preparing thefinancial statements of the Company. Directors are not awareof any material uncertainties relating to events or conditionsthat may cast significant doubt upon the Company’s ability tocontinue as a going concern. The Annual Financial Statementsfor 2006/2007 are prepared on a going-concern basis. All thenew accounting standards and policies adopted by theCompany have been thoroughly discussed and approved atthe Audit Committee before adoption by the Board.
The Group has adopted i ts own Code for Securit iesTransactions by Directors (the “Code”) on terms no lessexacting than the required standards set out in the Model Codefor Securities Transactions by Directors of Listed Companiescontained in Appendix 10 of the Listing Rules. Specific enquirywas made of all Directors and all Directors have confirmedcompliance with the required standard set out in the Code forthe year ended 31st March, 2007.
10
34
Corporate Governance Report
Vitasoy International Holdings Ltd. Annual Report 2006/07
Board Committees
The Board has established an Executive Committee, aRemuneration and Nomination Committee and an AuditCommittee.
Executive CommitteeThe Executive Committee was established in 2001. Its currentmembers include all four Executive Directors, who are:
Mr. Winston Yau-lai LO (Chairman)Mr. Ambrose Kam-shing CHANMr. Eric Fat YUMr. John Shek-hung LAU
The Executive Committee operates as a general managementcommittee under the direct authority of the Board to deal withcertain operational matters of the Group.
Remuneration and Nomination Committee
The Compensation Committee was established in February1994 and was renamed as “Remuneration and NominationCommittee” on 2nd February, 2005 with increased scope ofauthority. This Committee now comprises three IndependentNon-executive Directors and two Non-executive Directors andits current members are :
Independent Non-executive DirectorsDr. The Hon. Sir David Kwok-po LI (Chairman)Mr. Iain F. BRUCEMr. Jan P. S. ERLUND
Non-executive DirectorsMs. Myrna Mo-ching LOMs. Yvonne Mo-ling LO
The Committee was set up to consider and approve theremuneration packages of Executive Directors and SeniorManagement of the Group, including salaries, benefits in kindand bonuses; the bonus schemes and the other long-termincentive schemes, including share option and other plans. TheCommittee also reviews the structure, size and composition(including the skills, knowledge and experience) of the Boardfrom time to time and recommends to the Board on appointmentsof Directors and the succession planning for Directors.
Jan P. S. ERLUND
35
Corporate Governance Report
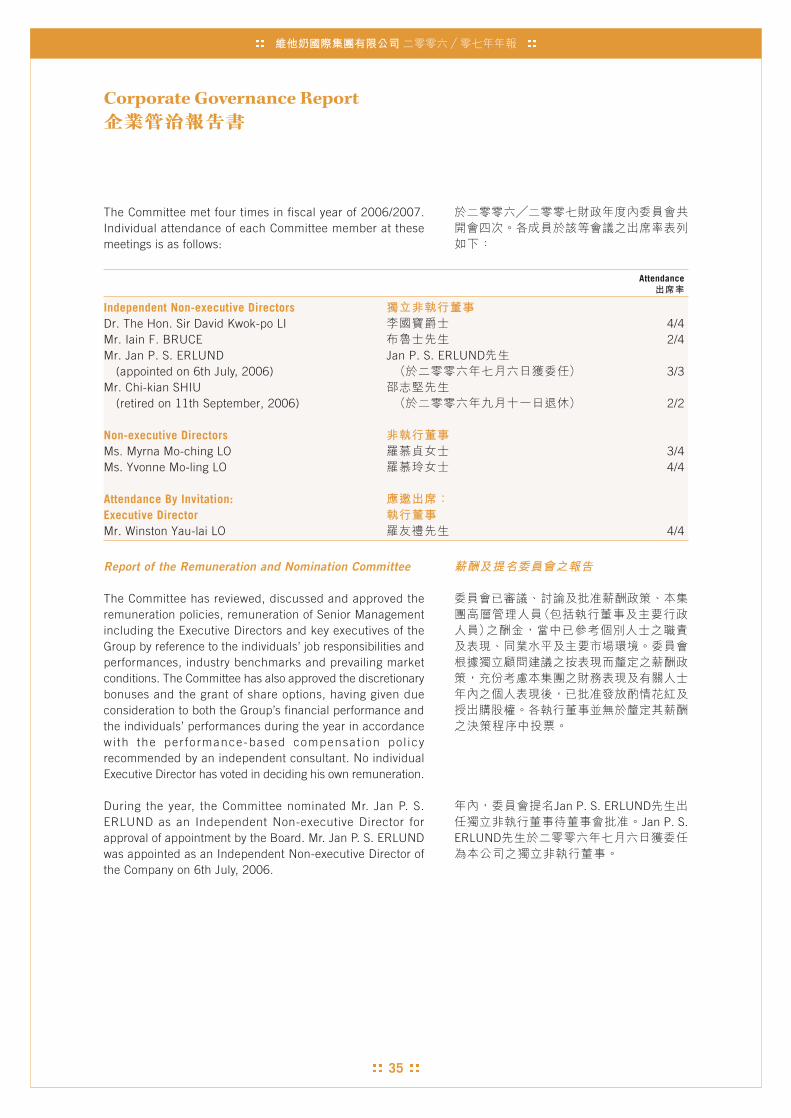
The Committee met four times in fiscal year of 2006/2007.Individual attendance of each Committee member at thesemeetings is as follows:
Attendance
Independent Non-executive DirectorsDr. The Hon. Sir David Kwok-po LI 4/4Mr. Iain F. BRUCE 2/4Mr. Jan P. S. ERLUND Jan P. S. ERLUND
(appointed on 6th July, 2006) 3/3Mr. Chi-kian SHIU
(retired on 11th September, 2006) 2/2
Non-executive DirectorsMs. Myrna Mo-ching LO 3/4Ms. Yvonne Mo-ling LO 4/4
Attendance By Invitation:Executive DirectorMr. Winston Yau-lai LO 4/4
Report of the Remuneration and Nomination Committee
The Committee has reviewed, discussed and approved theremuneration policies, remuneration of Senior Managementincluding the Executive Directors and key executives of theGroup by reference to the individuals’ job responsibilities andperformances, industry benchmarks and prevailing marketconditions. The Committee has also approved the discretionarybonuses and the grant of share options, having given dueconsideration to both the Group’s financial performance andthe individuals’ performances during the year in accordancewi th the per fo rmance-based compensat ion po l icyrecommended by an independent consultant. No individualExecutive Director has voted in deciding his own remuneration.
During the year, the Committee nominated Mr. Jan P. S.ERLUND as an Independent Non-executive Director forapproval of appointment by the Board. Mr. Jan P. S. ERLUNDwas appointed as an Independent Non-executive Director ofthe Company on 6th July, 2006.
Jan P. S. ERLUNDJan P. S.
ERLUND

36
Corporate Governance Report
Vitasoy International Holdings Ltd. Annual Report 2006/07
Audit CommitteeThe Audit Committee was established in 1999. Its currentmembers include three Independent Non-executive Directors,who are:
Mr. Iain F. BRUCE (Chairman)Dr. The Hon. Sir David Kwok-po LIMr. Jan P. S. ERLUND
The Audit Committee’s terms of reference are to makerecommendations to the Board on the appointment,reappointment and removal of the External Auditors and anyquestions of resignation or dismissal, their audit fees, mattersrelating to the independence of the External Auditors; to meetwith the External Auditors to discuss the nature and scope ofthe audit, and matters of concern when requested to do so bythe External Auditors; to review the interim financial reportand annual financial statements before they are submitted tothe Board; to discuss problems and reservations arising fromthe interim review and final audit, and any other matters theExternal Auditors may wish to discuss, and to review theExternal Auditors’ management letter and management’sresponse; to review the internal audit programmes and toensure co-ordination between the Internal and ExternalAuditors, and ensure that the internal audit function isadequately resourced and has appropriate standing within theGroup; and to consider any findings of major investigations ofinternal control matters as delegated by the Board or on itsown initiative, and management’s response.
The Audit Committee met three times in fiscal year of 2006/2007. Individual attendance of each Committee member atthese meetings is as follows:
Attendance
Independent Non-executive DirectorsMr. Iain F. BRUCE 3/3Dr. The Hon. David Kwok-po LI 3/3Mr. Jan P. S. ERLUND Jan P. S. ERLUND
(appointed on 6th July, 2006) 1/2Mr. Chi-kian SHIU
(retired on 11th September, 2006) 1/1
Attendance by Invitation:Executive Chairman 3/3Group Senior Director - Finance and Administration 3/3Group Internal Audit Director 3/3External Auditors 3/3
Jan P. S. ERLUND
37
Corporate Governance Report
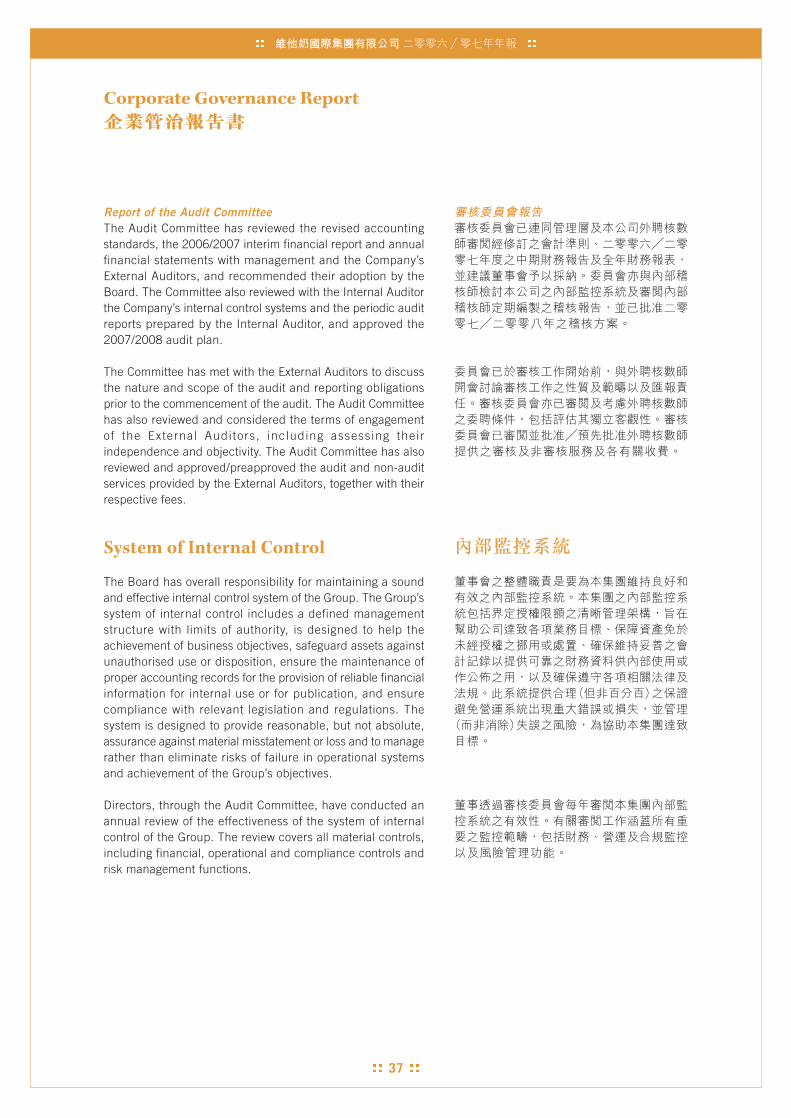
Report of the Audit CommitteeThe Audit Committee has reviewed the revised accountingstandards, the 2006/2007 interim financial report and annualfinancial statements with management and the Company’sExternal Auditors, and recommended their adoption by theBoard. The Committee also reviewed with the Internal Auditorthe Company’s internal control systems and the periodic auditreports prepared by the Internal Auditor, and approved the2007/2008 audit plan.
The Committee has met with the External Auditors to discussthe nature and scope of the audit and reporting obligationsprior to the commencement of the audit. The Audit Committeehas also reviewed and considered the terms of engagementof the External Audi tors, including assessing theirindependence and objectivity. The Audit Committee has alsoreviewed and approved/preapproved the audit and non-auditservices provided by the External Auditors, together with theirrespective fees.
System of Internal Control
The Board has overall responsibility for maintaining a soundand effective internal control system of the Group. The Group’ssystem of internal control includes a defined managementstructure with limits of authority, is designed to help theachievement of business objectives, safeguard assets againstunauthorised use or disposition, ensure the maintenance ofproper accounting records for the provision of reliable financialinformation for internal use or for publication, and ensurecompliance with relevant legislation and regulations. Thesystem is designed to provide reasonable, but not absolute,assurance against material misstatement or loss and to managerather than eliminate risks of failure in operational systemsand achievement of the Group’s objectives.
Directors, through the Audit Committee, have conducted anannual review of the effectiveness of the system of internalcontrol of the Group. The review covers all material controls,including financial, operational and compliance controls andrisk management functions.

38
Corporate Governance Report
Vitasoy International Holdings Ltd. Annual Report 2006/07
The Audit Committee recognises the importance of maintaininga sound and effective internal control system to safeguard theshareholders’ investments and the Company’s assets, andbelieves this is a continuous process. In order to evaluate andto further improve the effectiveness of its internal controlsystem, the Company engaged one of the leading accountingfirms (“Consultant”) last year to conduct a Risks Assessmentand benchmark the Company’s performance against theinternal control framework of COSO (Committee of SponsoringOrganisations of the Treadway Commission in the UnitedStates). All the findings for improvement and recommendationsmade by the Consultant, which require management’sattention, have been properly addressed. Adopting one of therectification actions suggested, the Company has upgradedthe Internal Audit Department to a group function during theyear under review.
Internal Audit
The Group Internal Audit Department carries out annual riskassessment on auditable areas in accordance with a Risk-based Internal Audit Rolling Plan reviewed and pre-approvedby the Audit Committee. In addition to its scheduled reviews,the Group Internal Audit Department also conducts other adhoc reviews whenever deemed necessary. The results ofsignificant internal audit reviews (and as applicable, agreedrectification plans) are reported to the Company’s seniorexecutives and Audit Committee periodically. The GroupInternal Audit Department also follows up the rectificationactions to ensure that satisfactory controls are maintained.
External Auditors
KPMG has been appointed as the External Auditors of theCompany by shareholders at the last Annual General Meeting.An amount of HK$2.8 million (2005/2006: HK$2.8 million)was charged for the fiscal year of 2006/2007 for KPMG’sstatutory audits for the Company and subsidiaries. Theamount for the other non-audit services provided by KPMGfor the Company and subsidiaries during the year was HK$2.6million (2005/2006: HK$2.3 million). The non-audit servicesmainly comprised consultation and tax advisory services.
The responsibilities of the External Auditors with respect tothe 2006/2007 financial statements are set out in the sectionof “Independent Auditor’s Report” on pages 57 and 58.
2,800,0002,800,000
2,600,0002,300,000
57 58

39
Corporate Governance Report
Communications with Shareholdersand Investors
We believe accountability and transparency are indispensablefor ensuring good corporate governance and, in this regard,timely communication with our shareholders, includinginstitutional investors, is crucial. We manage investor relationssystematically as a key part of our operations.
The Company’s Annual General Meeting is one of the importantforums to communicate with its shareholders. During the 2006Annual General Meeting, the Chairman of the Board briefedshareholders the business review and the outlook of the Groupand answered questions raised by shareholders. The chairmanof the Audit Committee, and a member of the Remunerationand Nomination Committee were also in attendance at theAnnual General Meeting to answer questions raised byshareholders.
Separate resolutions in respect of each substantial issue,including the appointment and re-election of Directors wereproposed by the Chairman at the Annual General Meeting.The Company’s Articles of Association provide the rights ofshareholders, and the procedures to demand a poll vote onresolutions at general meetings. Such rights and procedureswere detailed in the circular relating to the Annual GeneralMeeting, and were explained by the Chairman of the Boardduring the Annual General Meeting before voting on theresolutions. An independent scrutineer was appointed to countthe votes and the voting results were announced at the AnnualGeneral Meeting.
We also maintain a website (www.vitasoy.com) to keep ourshareholders and the investing public posted of our latestbus iness deve lopments , f ina l and in te r im resu l tsannouncements, financial reports, public announcements,corporate governance policy and practices, and other relevantshareholder information.
During the year, we continued to follow a policy of maintainingan open and regular dialogue with institutional and minorityshareholders, fund managers, analysts and the media throughdifferent means, including meetings, presentations, telephoneconferences, correspondences, media briefings and pressreleases to distribute information on the Group’s latestdevelopments and strategies. We also continued to beproactive in responding to general enquiries raised by theinvesting public, individual and institutional investors andinvestment analysts.
(www.vitasoy.com)
40
Directors and Senior Management
Vitasoy International Holdings Ltd. Annual Report 2006/07
Board of Directors
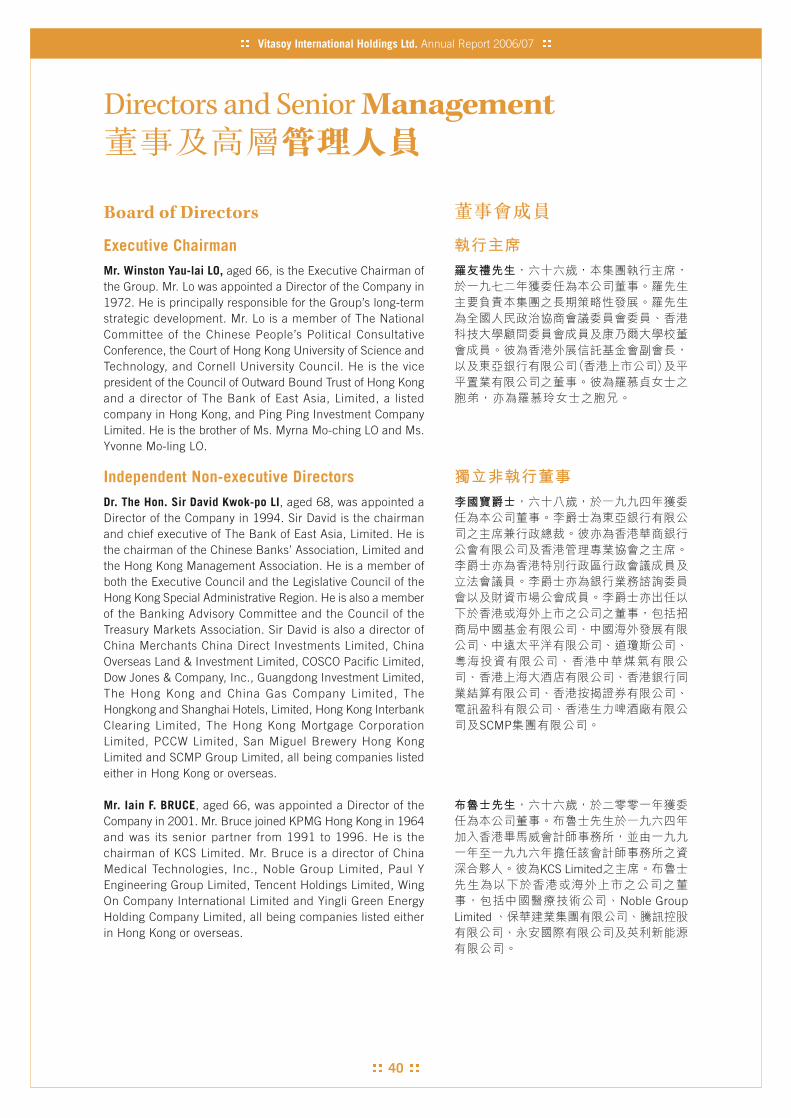
Executive ChairmanMr. Winston Yau-lai LO, aged 66, is the Executive Chairman ofthe Group. Mr. Lo was appointed a Director of the Company in1972. He is principally responsible for the Group’s long-termstrategic development. Mr. Lo is a member of The NationalCommittee of the Chinese People’s Political ConsultativeConference, the Court of Hong Kong University of Science andTechnology, and Cornell University Council. He is the vicepresident of the Council of Outward Bound Trust of Hong Kongand a director of The Bank of East Asia, Limited, a listedcompany in Hong Kong, and Ping Ping Investment CompanyLimited. He is the brother of Ms. Myrna Mo-ching LO and Ms.Yvonne Mo-ling LO.
Independent Non-executive Directors
Dr. The Hon. Sir David Kwok-po LI, aged 68, was appointed aDirector of the Company in 1994. Sir David is the chairmanand chief executive of The Bank of East Asia, Limited. He isthe chairman of the Chinese Banks’ Association, Limited andthe Hong Kong Management Association. He is a member ofboth the Executive Council and the Legislative Council of theHong Kong Special Administrative Region. He is also a memberof the Banking Advisory Committee and the Council of theTreasury Markets Association. Sir David is also a director ofChina Merchants China Direct Investments Limited, ChinaOverseas Land & Investment Limited, COSCO Pacific Limited,Dow Jones & Company, Inc., Guangdong Investment Limited,The Hong Kong and China Gas Company Limited, TheHongkong and Shanghai Hotels, Limited, Hong Kong InterbankClearing Limited, The Hong Kong Mortgage CorporationLimited, PCCW Limited, San Miguel Brewery Hong KongLimited and SCMP Group Limited, all being companies listedeither in Hong Kong or overseas.
Mr. Iain F. BRUCE, aged 66, was appointed a Director of theCompany in 2001. Mr. Bruce joined KPMG Hong Kong in 1964and was its senior partner from 1991 to 1996. He is thechairman of KCS Limited. Mr. Bruce is a director of ChinaMedical Technologies, Inc., Noble Group Limited, Paul YEngineering Group Limited, Tencent Holdings Limited, WingOn Company International Limited and Yingli Green EnergyHolding Company Limited, all being companies listed eitherin Hong Kong or overseas.
SCMP
KCS Limited
Noble GroupLimited
41
Directors and Senior Management
Board of Directors (continued)
Independent Non-executive Directors (continued)
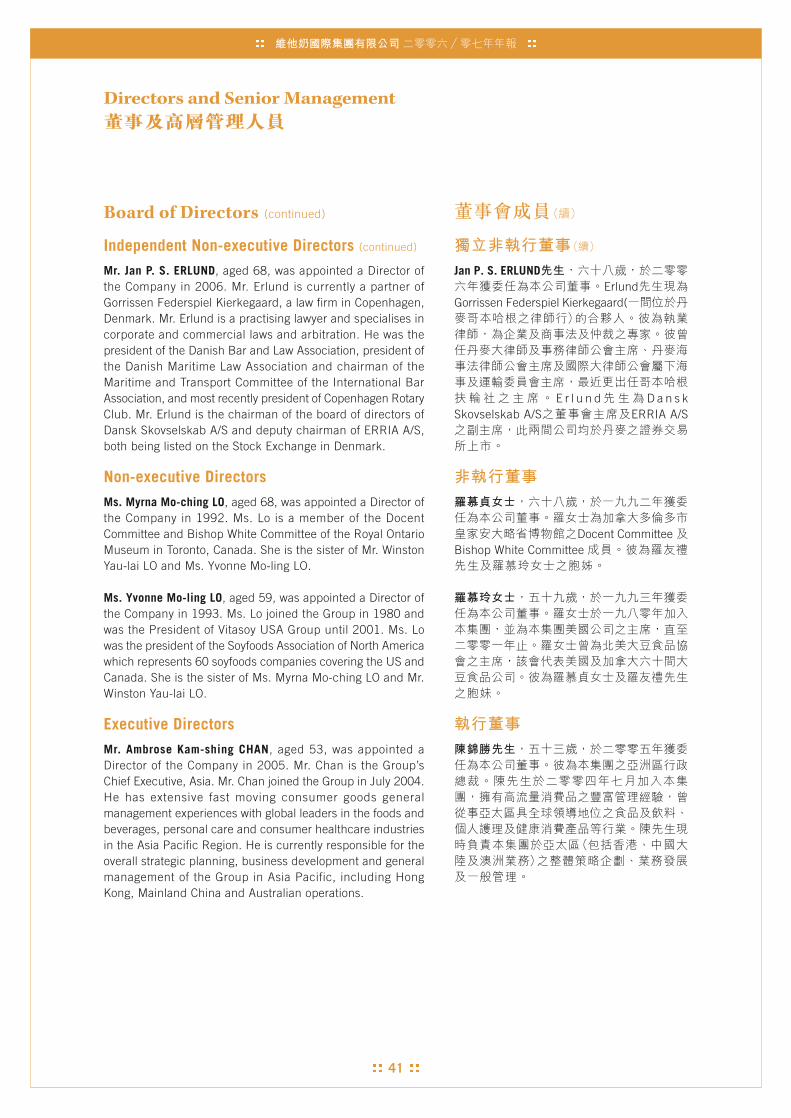
Mr. Jan P. S. ERLUND, aged 68, was appointed a Director ofthe Company in 2006. Mr. Erlund is currently a partner ofGorrissen Federspiel Kierkegaard, a law firm in Copenhagen,Denmark. Mr. Erlund is a practising lawyer and specialises incorporate and commercial laws and arbitration. He was thepresident of the Danish Bar and Law Association, president ofthe Danish Maritime Law Association and chairman of theMaritime and Transport Committee of the International BarAssociation, and most recently president of Copenhagen RotaryClub. Mr. Erlund is the chairman of the board of directors ofDansk Skovselskab A/S and deputy chairman of ERRIA A/S,both being listed on the Stock Exchange in Denmark.
Non-executive Directors
Ms. Myrna Mo-ching LO, aged 68, was appointed a Director ofthe Company in 1992. Ms. Lo is a member of the DocentCommittee and Bishop White Committee of the Royal OntarioMuseum in Toronto, Canada. She is the sister of Mr. WinstonYau-lai LO and Ms. Yvonne Mo-ling LO.
Ms. Yvonne Mo-ling LO, aged 59, was appointed a Director ofthe Company in 1993. Ms. Lo joined the Group in 1980 andwas the President of Vitasoy USA Group until 2001. Ms. Lowas the president of the Soyfoods Association of North Americawhich represents 60 soyfoods companies covering the US andCanada. She is the sister of Ms. Myrna Mo-ching LO and Mr.Winston Yau-lai LO.
Executive Directors
Mr. Ambrose Kam-shing CHAN, aged 53, was appointed aDirector of the Company in 2005. Mr. Chan is the Group’sChief Executive, Asia. Mr. Chan joined the Group in July 2004.He has extensive fast moving consumer goods generalmanagement experiences with global leaders in the foods andbeverages, personal care and consumer healthcare industriesin the Asia Pacific Region. He is currently responsible for theoverall strategic planning, business development and generalmanagement of the Group in Asia Pacific, including HongKong, Mainland China and Australian operations.
Jan P. S. ERLUNDErlund
Gorrissen Federspiel Kierkegaard(
E r l u n d D a n s kSkovselskab A/S ERRIA A/S
Docent Committee Bishop White Committee
42
Directors and Senior Management
Vitasoy International Holdings Ltd. Annual Report 2006/07
Board of Directors (continued)
Executive Directors (continued)
Mr. Eric Fat YU, aged 57, was appointed a Director of theCompany in 1989. Mr. Yu is the Group’s Senior Director –Manufacturing and Project Management. He had experiencein engineering works and project management whilst workingpreviously with a number of companies overseas. He joinedthe Group in 1974. He is now responsible for the formulationof the Group’s manufacturing policy and strategy and themanagement of the Group’s new joint venture project.
Mr. John Shek-hung LAU, aged 60, was appointed a Director ofthe Company in 1990. Mr. Lau is the Group’s Senior Director– Finance and Administration. He joined the Group in 1988having worked previously with a number of multinationalcompanies both in Hong Kong and overseas. He is currentlyresponsible for the finance and administration of the Group.
Senior Management
Hong Kong OperationMr. Laurence P. EISENTRAGER, aged 55, Chief Executive, HongKong. Mr. Eisentrager is responsible for the generalmanagement and development of the Group’s operations inHong Kong. He joined the Group in 2002 and was the GeneralManager of the Group’s operation in Australia until 2005. Hehas very extensive experience in the food and beverageindustry in Hong Kong, Australia and internationally.
North American OperationMr. Walter M. RIGLIAN, aged 53, General Manager of VitasoyUSA Inc.. Mr. Rigl ian is responsible for the generalmanagement and development of the Group’s operations inNorth America. He joined the Group in 2005. He has extensiveexperience in sales, marketing, and new product development.Prior to joining Vitasoy USA Inc., Mr. Riglian held numeroussenior management positions with several renowned multi-national companies in the natural products, grocery andproduce industries.
Walter M. RIGLIAN VitasoyUSA Inc. Riglian
VitasoyUSA Inc. Riglian
43
Directors and Senior Management
Senior Management (continued)
Mainland China OperationMr. Jack Jie YUAN, aged 38, Managing Director of Vitasoy(China) Investments Company Limited. Mr. Yuan is responsiblefor the general management and development of the Group’soperation in Mainland China. Mr. Yuan joined the Group in2004 as the General Manager of the Group’s Shenzhen jointventure operation. He has extensive experience in the beverageindustry and had previously worked with a number ofmultinational companies in Mainland China.
Australian and New Zealand Operation
Mr. Scott A. PANNELL, aged 37, General Manager of VitasoyAustralia Products Pty. Ltd.. Mr. Pannell is responsible for thegeneral management and development of the Group’soperations in Australia and New Zealand. He joined the Groupin 2005. He has very extensive experience in the fast movingconsumer goods (FMCG) industry within Australia and NewZealand. He has experience in working in manufacturingbusinesses operating within the retail grocery, route andconvenience and food service markets. Prior to joining VitasoyAustralia, he was general manager of National Foods’ NewZealand dairy foods operation, with this role following on fromhis general management position with National Foods KingIsland Dairy Group. Previous to these roles, he held senior salesand marketing roles with several renowned FMCG companies.
Scott A. PANNELL VitasoyAustralia Products Pty. Ltd.Pannell
National Foods
National Foods King Island Dairy Group

44
Report of the Directors
Vitasoy International Holdings Ltd. Annual Report 2006/07
The Directors have pleasure in submitting their annual reporttogether with the audited financial statements for the yearended 31st March, 2007.
Principal place of business
Vitasoy International Holdings Limited (“the Company”) is acompany incorporated and domiciled in Hong Kong and hasits registered office and principal place of business at No. 1Kin Wong Street, Tuen Mun, New Territories, Hong Kong.
Principal activities
The principal activities of the Company are the manufactureand sale of food and beverages. The principal activities andother particulars of the subsidiaries are set out in note 14 tothe financial statements.
The analysis of geographical locations of the operations of theCompany and its subsidiaries (“the Group”) during thefinancial year are set out in note 12 to the financial statements.
Major customers and suppliers
The information in respect of the Group’s sales and purchasesattributable to the major customers and suppliers respectivelyduring the financial year is as follows:
Percentages of the Group’s totalSales Purchases
The largest customer 14%Five largest customers in aggregate 36%The largest supplier 28%Five largest suppliers in aggregate 39%
At no time during the year have the Directors, their associatesor any shareholder of the Company (which to the knowledge ofthe Directors owns more than 5% of the Company’s sharecapital) had any interest in these major customers and suppliers.
14
12
5%
45
Report of the Directors
Financial statements
The profit of the Group for the year ended 31st March, 2007and the state of the Company’s and the Group’s affairs as atthat date are set out in the financial statements on pages 59to 146.
Transfer to reserves
Profit attributable to shareholders, before dividends, ofHK$201,312,000 (2006: HK$185,025,000) has beentransferred to reserves. Other movements in reserves are setout in note 25 to the financial statements.
An interim dividend of HK2.8 cents per ordinary share (2006:HK2.8 cents per ordinary share) was paid on 5th January,2007. The Directors now recommend the payment of a finaldividend of HK6.7 cents per ordinary share (2006: HK6.7 centsper ordinary share) and a special dividend of HK10.0 centsper ordinary share (2006: HK10.0 cents per ordinary share)in respect of the year ended 31st March, 2007.
Charitable donations
Charitable donations made by the Group during the yearamounted to HK$96,000 (2006: HK$92,000).
Fixed assets
Movements in fixed assets of the Company and the Group duringthe year are set out in note 13 to the financial statements.
Bank loans
Particulars of bank loans of the Group as at 31st March, 2007are set out in note 23 to the financial statements.
59 146
201,312,000185,025,000
25
2.82.8
6.76.7
10.0 10.0
96,000 92,000
13
23
46
Report of the Directors
Vitasoy International Holdings Ltd. Annual Report 2006/07
Share capital
Details of the movements in share capital of the Companyduring the year are set out in note 25 to the financialstatements. Shares were issued during the year on exerciseof share options.
There were no purchases, sales or redemptions of theCompany’s listed securities by the Company or any of itssubsidiaries during the year.
Directors
The Directors during the financial year and up to the date ofthis report are set out on page 2.
In accordance with Article 104 of the Company’s Articles ofAssociation, Mr. Winston Yau-lai LO , Mr. John Shek-hung LAUand Ms. Myrna Mo-ching LO retire from the board by rotationat the forthcoming Annual General Meeting and, being eligible,offer themselves for re-election.
None of the Directors proposed for re-election at theforthcoming Annual General Meeting has a service contractwith the Company or any of its subsidiaries which is notdeterminable by the Company or any of its subsidiaries withinone year without payment of compensation, other than normalstatutory obligations.
Non-executive Directors are appointed under the same termsfor rotational retirement as other Directors, pursuant to theArticles of Association of the Company.
25
2
104
47
Report of the Directors
Directors’ interests and short positionsin shares, underlying shares anddebentures
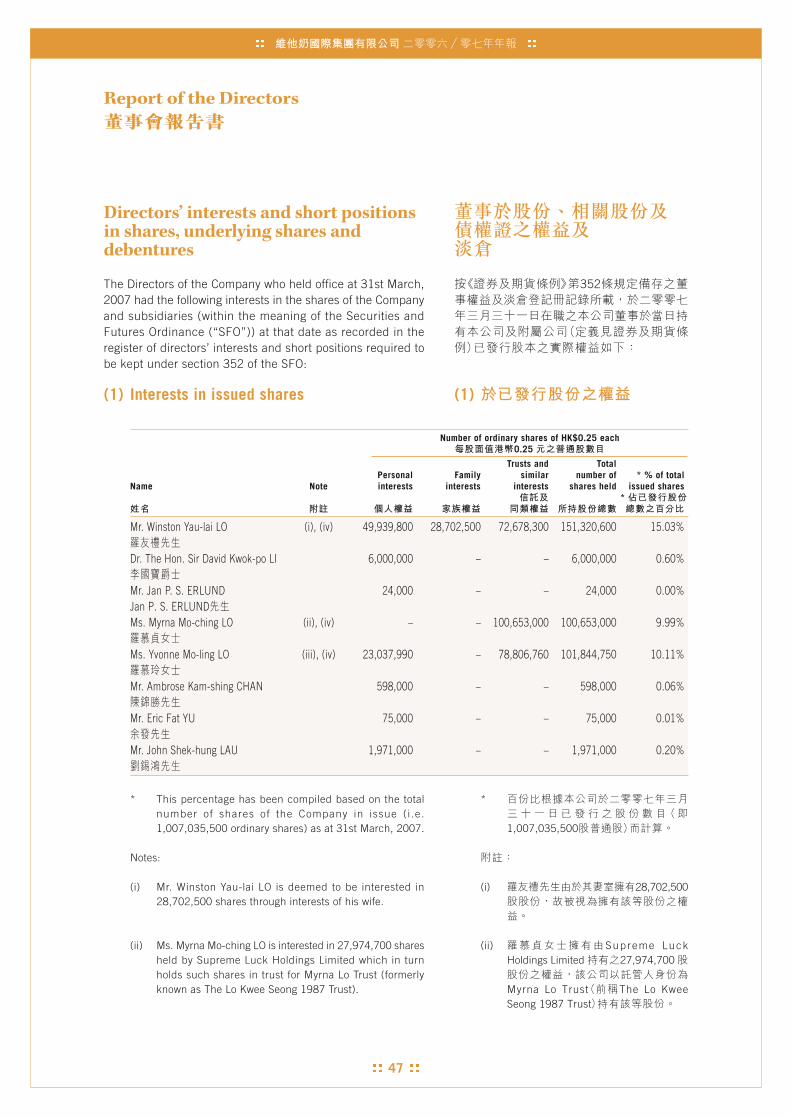
The Directors of the Company who held office at 31st March,2007 had the following interests in the shares of the Companyand subsidiaries (within the meaning of the Securities andFutures Ordinance (“SFO”)) at that date as recorded in theregister of directors’ interests and short positions required tobe kept under section 352 of the SFO:
(1) Interests in issued shares
Number of ordinary shares of HK$0.25 each0.25
Trusts and TotalPersonal Family similar number of * % of total
Name Note interests interests interests shares held issued shares*
Mr. Winston Yau-lai LO (i), (iv) 49,939,800 28,702,500 72,678,300 151,320,600 15.03%
Dr. The Hon. Sir David Kwok-po LI 6,000,000 – – 6,000,000 0.60%
Mr. Jan P. S. ERLUND 24,000 – – 24,000 0.00%Jan P. S. ERLUNDMs. Myrna Mo-ching LO (ii), (iv) – – 100,653,000 100,653,000 9.99%
Ms. Yvonne Mo-ling LO (iii), (iv) 23,037,990 – 78,806,760 101,844,750 10.11%
Mr. Ambrose Kam-shing CHAN 598,000 – – 598,000 0.06%
Mr. Eric Fat YU 75,000 – – 75,000 0.01%
Mr. John Shek-hung LAU 1,971,000 – – 1,971,000 0.20%
* This percentage has been compiled based on the totalnumber of shares of the Company in issue ( i .e.1,007,035,500 ordinary shares) as at 31st March, 2007.
Notes:
(i) Mr. Winston Yau-lai LO is deemed to be interested in28,702,500 shares through interests of his wife.
(ii) Ms. Myrna Mo-ching LO is interested in 27,974,700 sharesheld by Supreme Luck Holdings Limited which in turnholds such shares in trust for Myrna Lo Trust (formerlyknown as The Lo Kwee Seong 1987 Trust).
352
(1)
*
1,007,035,500
(i) 28,702,500
(ii) Supreme LuckHoldings Limited 27,974,700
Myrna Lo Trust The Lo KweeSeong 1987 Trust
48
Report of the Directors
Vitasoy International Holdings Ltd. Annual Report 2006/07
Directors’ interests and short positionsin shares, underlying shares anddebentures (continued)
(1) Interests in issued shares (continued)
Notes: (continued)
(iii) Ms. Yvonne Mo-ling LO is interested in 6,128,460 sharesheld by Yvonne Lo Charitable Remainder Unitrust. Ms.Yvonne Mo-ling LO is a beneficiary of Yvonne Lo CharitableRemainder Unitrust and is therefore deemed to beinterested in such shares.
(iv) Each of Mr. Winston Yau-lai LO, Ms. Myrna Mo-ching LOand Ms. Yvonne Mo-ling LO is interested in 72,678,300shares held by The Bank of East Asia (Nominees) Limitedwhich holds such shares as a nominee for the K. S. LoFoundation, a charitable trust. Each of them is a trusteeof the K. S. Lo Foundation and is therefore deemed to beinterested in such shares.
(2) Interests in underlying sharesCertain Directors of the Company have been grantedoptions under the Company’s share option scheme,details of which are set out in the section “Share optionscheme” below.
All interests in the shares and underlying shares of theCompany are long positions.
Apart from the foregoing, and other than certain nomineeshares in subsidiaries held by the Directors in trust for theCompany, none of the Directors of the Company or any of theirspouses or children under eighteen years of age has interestsor short positions in the shares, underlying shares ordebentures of the Company, any of its subsidiaries or otherassociated corporations, as recorded in the register requiredto be kept under section 352 of the SFO or as otherwise notifiedto the Company pursuant to the Model Code for SecuritiesTransactions by Directors of Listed Companies.
(1)
(iii) Yvonne Lo CharitableRemainder Unitrust 6,128,460
Yvonne LoCharitable Remainder Unitrust
(iv)
K. S. Lo Foundation72,678,300
K. S. Lo Foundation
(2)
352
49
Report of the Directors
Share option scheme
On 4th September, 2002, the Company adopted a share optionscheme under which the Directors might, at their discretion,grant options to employees and Directors of the Company orany of its subsidiaries to subscribe for ordinary shares ofHK$0.25 each in the Company. This scheme was valid for 10years ending 3rd September, 2012, unless otherwise cancelledor amended. The purpose of this scheme was to provideincentives and rewards to employees for their contribution tothe Group. The principal terms of this scheme were as follows:
– The exercise price of the options is the highest of (a) theclosing price of the shares on The Stock Exchange ofHong Kong Limited (the “Stock Exchange”) on the dateof grant, which must be a business day; (b) the averageof the closing prices of the shares on the Stock Exchangefor the five business days immediately preceding the dateof grant; and (c) the nominal value of the shares.
– The options were exercisable for a period to be notifiedby the Directors to each option holder, such period notto exceed 10 years from the date of grant.
– There was no minimum period which an option must beheld before it could be exercised, but the Directors wereempowered to impose at their discretion any suchminimum period at the date of offer.
– The maximum number of shares which may be issuedupon exercise of all options to be granted must not exceed10% of the shares in issue on the date of approval andadoption of the scheme.
– The maximum aggregate number of shares over whichoptions could be granted to any one participant, whenadded to the number of shares issued or issuable to thatparticipant under the share option scheme must notexceed 25% of the maximum aggregate number of sharesfor the time being issued and issuable under the shareoption scheme.
– An offer of the grant of an option remained open foracceptance by an eligible Director or employee for aperiod of 28 days from the date of offer or such longer orshorter period as the Directors might in their discretiondetermine. An eligible Director or employee had to payHK$10 on acceptance of the option as a consideration.
0.25
(a)
(b)
(c)
10%
25%
28
10
50
Report of the Directors
Vitasoy International Holdings Ltd. Annual Report 2006/07
Share option scheme (continued)
– Unless approved by shareholders of the Company in ageneral meeting, the total number of shares issued andwhich may fall to be issued upon exercise of the optionsgranted (including exercised, cancelled and outstandingoptions) to any one participant in any 12-month periodup to the date of grant shall not exceed 1% of the sharesin issue as at the date of grant.
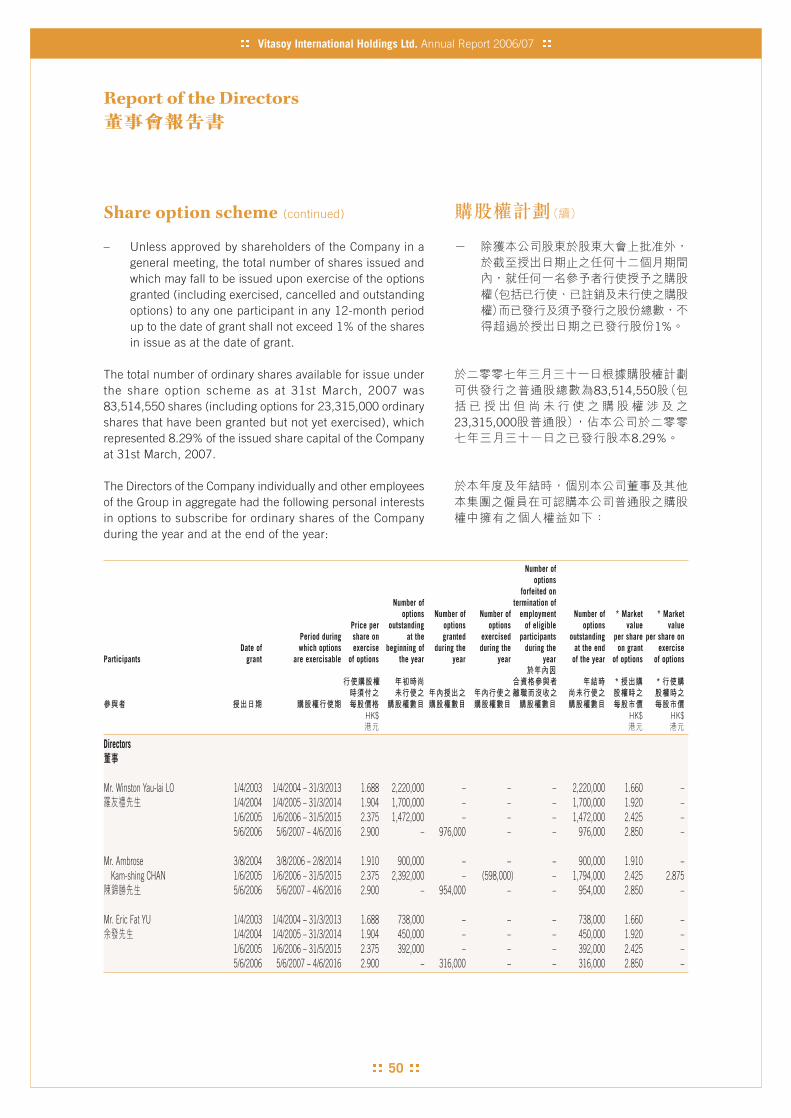
The total number of ordinary shares available for issue underthe share option scheme as at 31st March, 2007 was83,514,550 shares (including options for 23,315,000 ordinaryshares that have been granted but not yet exercised), whichrepresented 8.29% of the issued share capital of the Companyat 31st March, 2007.
The Directors of the Company individually and other employeesof the Group in aggregate had the following personal interestsin options to subscribe for ordinary shares of the Companyduring the year and at the end of the year:
Number ofoptions
forfeited onNumber of termination of
options Number of Number of employment Number of * Market * MarketPrice per outstanding options options of eligible options value value
Period during share on at the granted exercised participants outstanding per share per share onDate of which options exercise beginning of during the during the during the at the end on grant exercise
Participants grant are exercisable of options the year year year year of the year of options of options
* *
HK$ HK$ HK$
Directors
Mr. Winston Yau-lai LO 1/4/2003 1/4/2004 – 31/3/2013 1.688 2,220,000 – – – 2,220,000 1.660 –1/4/2004 1/4/2005 – 31/3/2014 1.904 1,700,000 – – – 1,700,000 1.920 –1/6/2005 1/6/2006 – 31/5/2015 2.375 1,472,000 – – – 1,472,000 2.425 –5/6/2006 5/6/2007 – 4/6/2016 2.900 – 976,000 – – 976,000 2.850 –
Mr. Ambrose 3/8/2004 3/8/2006 – 2/8/2014 1.910 900,000 – – – 900,000 1.910 –Kam-shing CHAN 1/6/2005 1/6/2006 – 31/5/2015 2.375 2,392,000 – (598,000) – 1,794,000 2.425 2.875
5/6/2006 5/6/2007 – 4/6/2016 2.900 – 954,000 – – 954,000 2.850 –
Mr. Eric Fat YU 1/4/2003 1/4/2004 – 31/3/2013 1.688 738,000 – – – 738,000 1.660 –1/4/2004 1/4/2005 – 31/3/2014 1.904 450,000 – – – 450,000 1.920 –1/6/2005 1/6/2006 – 31/5/2015 2.375 392,000 – – – 392,000 2.425 –5/6/2006 5/6/2007 – 4/6/2016 2.900 – 316,000 – – 316,000 2.850 –
1%
83,514,550
23,315,0008.29%
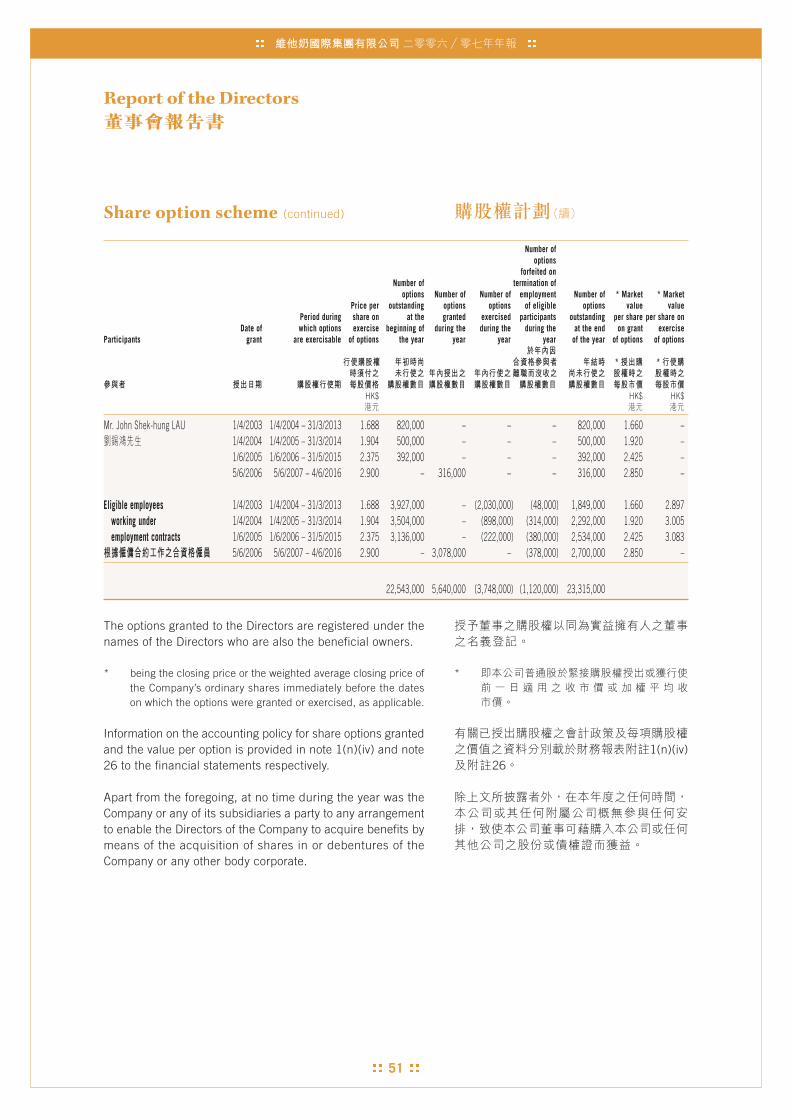
51
Report of the Directors
Share option scheme (continued)
Number ofoptions
forfeited onNumber of termination of
options Number of Number of employment Number of * Market * MarketPrice per outstanding options options of eligible options value value
Period during share on at the granted exercised participants outstanding per share per share onDate of which options exercise beginning of during the during the during the at the end on grant exercise
Participants grant are exercisable of options the year year year year of the year of options of options
* *
HK$ HK$ HK$
Mr. John Shek-hung LAU 1/4/2003 1/4/2004 – 31/3/2013 1.688 820,000 – – – 820,000 1.660 –1/4/2004 1/4/2005 – 31/3/2014 1.904 500,000 – – – 500,000 1.920 –1/6/2005 1/6/2006 – 31/5/2015 2.375 392,000 – – – 392,000 2.425 –5/6/2006 5/6/2007 – 4/6/2016 2.900 – 316,000 – – 316,000 2.850 –
Eligible employees 1/4/2003 1/4/2004 – 31/3/2013 1.688 3,927,000 – (2,030,000) (48,000) 1,849,000 1.660 2.897working under 1/4/2004 1/4/2005 – 31/3/2014 1.904 3,504,000 – (898,000) (314,000) 2,292,000 1.920 3.005employment contracts 1/6/2005 1/6/2006 – 31/5/2015 2.375 3,136,000 – (222,000) (380,000) 2,534,000 2.425 3.083
5/6/2006 5/6/2007 – 4/6/2016 2.900 – 3,078,000 – (378,000) 2,700,000 2.850 –
22,543,000 5,640,000 (3,748,000) (1,120,000) 23,315,000
The options granted to the Directors are registered under thenames of the Directors who are also the beneficial owners.
* being the closing price or the weighted average closing price ofthe Company’s ordinary shares immediately before the dateson which the options were granted or exercised, as applicable.
Information on the accounting policy for share options grantedand the value per option is provided in note 1(n)(iv) and note26 to the financial statements respectively.
Apart from the foregoing, at no time during the year was theCompany or any of its subsidiaries a party to any arrangementto enable the Directors of the Company to acquire benefits bymeans of the acquisition of shares in or debentures of theCompany or any other body corporate.
*
1(n)(iv)26

52
Report of the Directors
Vitasoy International Holdings Ltd. Annual Report 2006/07
Share option scheme (continued)
Note:
Except for the options granted on 3rd August, 2004, all the optionsare exercisable progressively and the maximum percentage of theoptions which may be exercised is determined in stages as follows:
Percentage ofoptions granted
On or after 1st year anniversaryof the date of grant 25%
On or after 2nd year anniversaryof the date of grant another 25%
On or after 3rd year anniversaryof the date of grant another 25%
On or after 4th year anniversaryof the date of grant another 25%
Substantial shareholders’ and otherpersons’ interests and short positionsin shares and underlying shares
The Company has been notified of the following interests inthe Company’s issued shares at 31st March, 2007 amountingto 5% or more of the ordinary shares in issue. These interestsare in addition to those disclosed above in respect of theDirectors.
Number of ordinary shares of HK$0.25 each0.25
Trusts and Total * % of totalPersonal Family Corporate similar number of issued
Substantial shareholders Note interests interests interests interests shares held shares*
Ms. Irene CHAN (i), (ii) 23,514,700 750,000 – 72,678,300 96,943,000 9.63%
Mr. Kai-tun LO (ii) 18,508,950 – – 72,678,300 91,187,250 9.06%
Mr. Peter Tak-shing LO (ii) 7,548,000 – – 72,678,300 80,226,300 7.97%
Arisaig Greater China Fund (“Arisaig”) (iii) 64,301,500 – – – 64,301,500 6.39%Arisaig Partners (Mauritius) Limited (“Arisaig Mauritius”) (iv) – – 64,301,500 – 64,301,500 6.39%Mr. Lindsay William Ernest COOPER (“Cooper”) (v) – – 64,301,500 – 64,301,500 6.39%Commonwealth Bank of Australia (vi) – – 60,339,000 – 60,339,000 5.99%
* This percentage has been compiled based on the total numberof shares of the Company in issue (i.e. 1,007,035,500 ordinaryshares) as at 31st March, 2007.
5%
*1,007,035,500

53
Report of the Directors
Substantial shareholders’ and otherpersons’ interests and short positionsin shares and underlying shares (continued)
Notes:
(i) Ms. Irene CHAN is interested in 750,000 shares held for herdaughter Alexandra CHAN who is under the age of 18.
(ii) Each of Ms. Irene CHAN, Mr. Kai-tun LO and Mr. Peter Tak-shing LO is interested in 72,678,300 shares held by The Bankof East Asia (Nominees) Limited which holds such shares as anominee for the K. S. Lo Foundation, a charitable trust. Each ofthem is a trustee of the K. S. Lo Foundation and is thereforedeemed to be interested in such shares.
(iii) These interests are held by Arisaig in the capacity of beneficialowner.
(iv) These interests are held by Arisaig Mauritius in the capacity ofinvestment manager of Arisaig. These interests are duplicatedby the interests disclosed in Note (iii) above.
(v) These interests represent Cooper’s interests through his indirect33% interest in Arisaig Mauritius. These interests are duplicatedby the interests disclosed in Notes (iii) and (iv) above.
(vi) These interests represent Commonwealth Bank of Australia’sinterests through its indirect 100% interest in First StateInvestment Management (UK) Limited (which holds 49,185,000shares of the Company’s ordinary shares) and First StateInvestments (Hong Kong) Limited (which holds 11,154,000shares of the Company’s ordinary shares).
All interests in the shares and underlying shares of theCompany are long positions.
Apart from the foregoing, no other interests required to berecorded in the register kept under section 336 of the SFOhave been notified to the Company.
Sufficiency of public float
Based on the information that is publicly available to theCompany and within the knowledge of the Directors of theCompany as at the date of this annual report, the Company hasmaintained the prescribed public float under the Listing Rules.
(i)Alexandra CHAN 750,000
(ii)
K. S. Lo Foundation72,678,300 K. S. Lo Foundation
(iii) Arisaig
(iv) Arisaig Mauritius Arisaig
(iii)
(v) Cooper Ar isa igMauritius 33%
(iii) (iv)
(vi) FirstState Investment Management (UK) Limited
49,185,000
11,154,000
336
54
Report of the Directors
Vitasoy International Holdings Ltd. Annual Report 2006/07
Directors’ interests in contracts
No contract of significance to which the Company or any of itssubsidiaries was a party, and in which a Director of theCompany had a material interest, subsisted at the end of theyear or at any time during the year.
Directors’ and officers’ liabilityinsurance
Directors’ and officers’ liability insurance was maintainedduring the year.
Connected transactions
(1) On 10th December, 2002, the Company entered into aMilk Supply Agreement with Shenzhen Guang MingHoldings Limited (“Guangming”), a substant ia lshareholder holding 30% of the registered capital of theCompany’s subsidiary, Shenzhen Vitasoy (Guang Ming)Foods and Beverage Company Limited (“ShenzhenVitasoy”), under which Guangming would supply milkproducts and provide milk processing and packagingservices to the Company for a period of 3 yearscommencing 14th March, 2003.
On 21st March, 2006, the Company entered into a newMilk Supply Agreement (the “New Agreement”) withGuangming, under which Guangming would supply milkproducts and provide milk processing and packagingservices to the Company for a period of 3 yearscommencing 1st April, 2006.
During the year, HK$2,515,000 (2006: HK$2,827,000)was charged by Guangming.
The transactions constituted continuing connectedtransactions under Rule 14A.34(1) of the Listing Rules,wh ich a re on l y sub jec t t o the repor t ing andannouncement requirements and are exempt from theindependent shareholders’ approval requirement.
(1)
30%
2,515,0002,827,000
14A.34(1)

55
Report of the Directors
Connected transactions (continued)
The Directors, including the Independent Non-executiveDirectors, considered that the transactions during the yearended 31st March, 2007:
(i) were entered in the ordinary and usual course ofbusiness of the Company and in accordance withthe terms of the New Agreement;
(ii) were on normal commercial terms and were fair andreasonable and in the interest of the shareholdersas a whole; and
(iii) were either on normal commercial terms, or if therewere not sufficient comparable transactions to judgewhether they were on normal commercial terms, onterms no less favourable than terms available fromindependent third parties.
In addition, the independent auditor of the Companyconfirmed that:
(i) the transactions were approved by the board ofdirectors;
(ii) the transactions were entered into in accordancewith the agreed prices as set out in the NewAgreement; and
(iii) the consideration for the transactions had notexceeded the annual cap of HK$5,000,000 for theyear ended 31st March, 2007.
(2) On 22nd March, 2007, the Company’s subsidiary, VitasoyAustralia Products Pty. Ltd. (“VAP”), entered into anagreement whereby National Foods Milk Limited(“NFML”), a fellow subsidiary of National Foods HoldingLimited, a substantial shareholder holding 49% of theissued share capital of VAP, would provide services toVAP in relation to soy food and beverage productsmanufactured, imported and/or distributed by VAPtargeted for mainstream market (“VAP Products”).
As part of the services provided, NFML would be theexclusive distributor in Australia of the VAP Products. Inreturn, VAP would pay a management fee equal to 3.5%of gross sales of VAP Products distributed by NFML inAustralia. The agreement commenced on 1st April, 2007and will continue until 31st March, 2010 unless terminatedearlier in accordance with the terms of the agreement.
(i)
(ii)
(iii)
(i)
(ii)
(iii)
5,000,000
(2)Vitasoy Australia Products Pty.
Ltd. VAPNational Foods Holding LimitedVAP49%
National Foods Milk LimitedNFML VAP
VAPVAP
NFMLVAP VAP
NFMLVAP 3.5%
56
Report of the Directors
Vitasoy International Holdings Ltd. Annual Report 2006/07
Connected transactions (continued)
The transactions constituted continuing connectedtransactions under Rule 14A.34(1) of the Listing Rules,wh ich a re on l y sub jec t t o the repor t ing andannouncement requirements and are exempt from theindependent shareholders’ approval requirement. TheDi rec tors se t the amounts o f AUD2,000,000,AUD2,200,000 and AUD2,500,000 as the annual capamounts for the transactions for the years ending 31stMarch, 2008, 2009 and 2010 respect ively. Anannouncement was made by the Company on 22ndMarch, 2007 in this respect.
Employee retirement plans
Particulars of employee retirement plans of the Company andthe Group are set out in note 15 to the financial statements.
Five year summary
A summary of the results and of the assets and liabilities ofthe Group for the last five financial years is set out on pages147 and 148 of the annual report.
Auditors
KPMG retire and, being eligible, offer themselves for re-appointment. A resolution for the re-appointment of KPMG asauditors of the Company is to be proposed at the forthcomingAnnual General Meeting.
By Order of the BoardWinston Yau-lai LOExecutive Chairman
Hong Kong, 9th July, 2007
14A.34(1)
2,000,0002,200,000 2,500,000
15
147 148
Independent Auditor's Report
57
Independent auditor’s report to the shareholders ofVitasoy International Holdings Limited(Incorporated in Hong Kong with limited liability)
We have audited the consolidated financial statements ofVitasoy International Holdings Limited (“the Company”) setout on pages 59 to 146, which comprise the consolidated andCompany balance sheets as at 31st March, 2007, and theconsolidated income statement, the consolidated statementof changes in equity and the consolidated cash flow statementfor the year then ended, and a summary of significantaccounting policies and other explanatory notes.
Directors’ responsibility for thefinancial statements
The Directors of the Company are responsible for thepreparation and the true and fair presentation of thesefinancial statements in accordance with Hong Kong FinancialReporting Standards issued by the Hong Kong Institute ofCertified Public Accountants and the Hong Kong CompaniesOrdinance. This responsib i l i ty inc ludes des igning,implementing and maintaining internal control relevant tothe preparation and the true and fair presentation of financialstatements that are free from material misstatement, whetherdue to fraud or error; selecting and applying appropriateaccounting policies; and making accounting estimates thatare reasonable in the circumstances.
Auditor’s responsibility
Our responsibility is to express an opinion on these financialstatements based on our audit. This report is made solely toyou, as a body, in accordance with section 141 of the HongKong Companies Ordinance, and for no other purpose. We donot assume responsibility towards or accept liability to anyother person for the contents of this report.
59 146
141

58
Vitasoy International Holdings Ltd. Annual Report 2006/07
Independent Auditor's Report
Auditor’s responsibility (continued)
We conducted our audit in accordance with Hong KongStandards on Auditing issued by the Hong Kong Institute ofCertified Public Accountants. Those standards require thatwe comply with ethical requirements and plan and performthe audit to obtain reasonable assurance as to whether thefinancial statements are free from material misstatement.
An audit involves performing procedures to obtain auditevidence about the amounts and disclosures in the financialstatements. The procedures selected depend on the auditor’sjudgement, including the assessment of the risks of materialmisstatement of the financial statements, whether due to fraudor error. In making those risk assessments, the auditorconsiders internal control relevant to the entity’s preparationand true and fair presentation of the financial statements inorder to design audit procedures that are appropriate in thecircumstances, but not for the purpose of expressing anopinion on the effectiveness of the entity’s internal control. Anaudit also includes evaluating the appropriateness ofaccounting policies used and the reasonableness of accountingestimates made by the Directors, as well as evaluating theoverall presentation of the financial statements.
We believe that the audit evidence we have obtained is sufficientand appropriate to provide a basis for our audit opinion.
Opinion
In our opinion, the consolidated financial statements give atrue and fair view of the state of affairs of the Company and ofthe Group as at 31st March, 2007 and of the Group’s profitand cash flows for the year then ended in accordance withHong Kong Financial Reporting Standards and have beenproperly prepared in accordance with the Hong KongCompanies Ordinance.
KPMGCertified Public Accountants8th Floor, Prince’s Building10 Chater RoadCentral, Hong Kong
9th July, 2007
108

59
For the year ended 31st March, 2007 (Expressed in Hong Kong dollars)
Consolidated Income Statement
The notes on pages 68 to 146 form part of these financial statements.
2007 2006Note $’000 $’000
Turnover 3 & 12 2,693,461 2,520,409
Cost of sales (1,130,130) (1,039,615)
Gross profit 1,563,331 1,480,794Other revenue 4 51,740 51,507
Marketing, selling anddistribution expenses (1,052,980) (985,153)
Administrative expenses (166,104) (164,116)Other operating expenses (145,472) (149,257)
Profit from operations 250,515 233,775
Finance costs 5(a) (8,068) (8,372)
Profit before taxation 5 242,447 225,403Income tax 6(a) (41,135) (40,378)
Profit for the year 201,312 185,025
Attributable to:
Equity shareholders of the Company 9 & 25(a) 173,901 172,076Minority interests 25(a) 27,411 12,949
Profit for the year 25(a) 201,312 185,025
Dividends payable to equityshareholders of the Companyattributable to the year: 10(a)
Interim dividend declaredduring the year 28,197 28,091
Final dividend proposed after thebalance sheet date 67,669 67,370
Special dividend proposed after thebalance sheet date 100,999 100,552
196,865 196,013
Earnings per share 11
Basic 17.3 cents 17.2 cents
Diluted 17.2 cents 17.1 cents
68 146
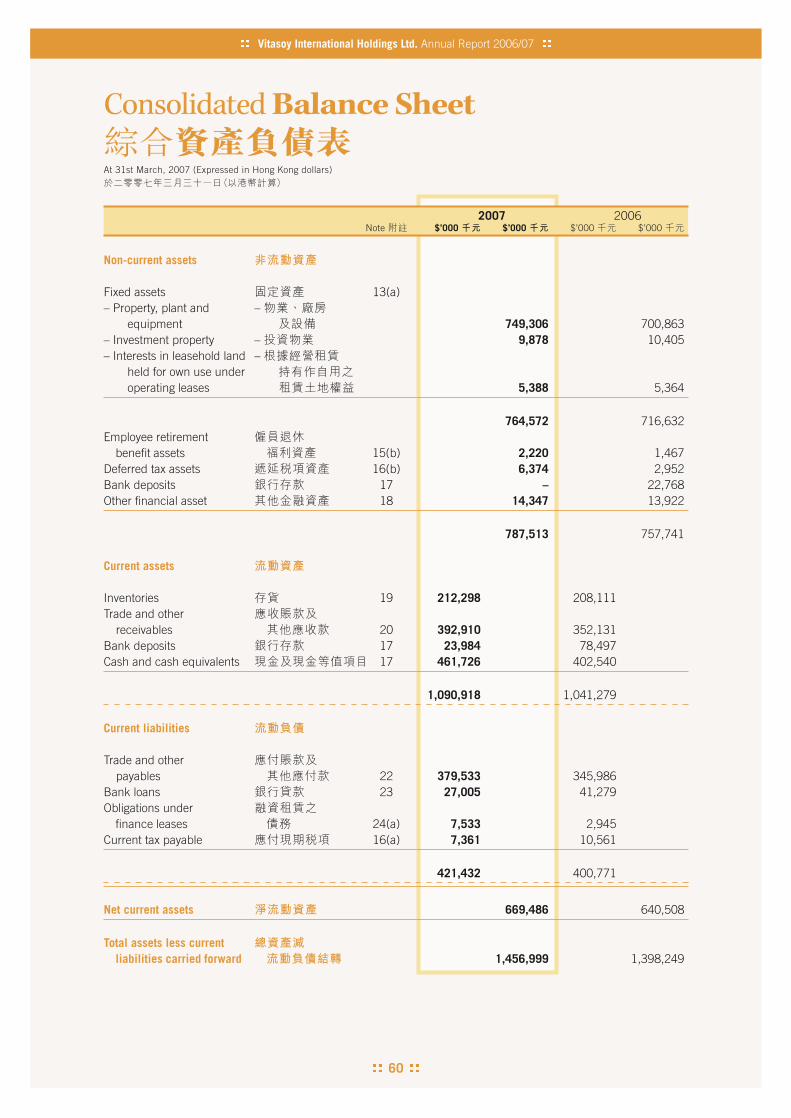
Vitasoy International Holdings Ltd. Annual Report 2006/07
At 31st March, 2007 (Expressed in Hong Kong dollars)
Consolidated Balance Sheet
60
2007 2006Note $’000 $’000 $’000 $’000
Non-current assets
Fixed assets 13(a)– Property, plant and –
equipment 749,306 700,863– Investment property – 9,878 10,405– Interests in leasehold land –
held for own use underoperating leases 5,388 5,364
764,572 716,632Employee retirement
benefit assets 15(b) 2,220 1,467Deferred tax assets 16(b) 6,374 2,952Bank deposits 17 – 22,768Other financial asset 18 14,347 13,922
787,513 757,741
Current assets
Inventories 19 212,298 208,111Trade and other
receivables 20 392,910 352,131Bank deposits 17 23,984 78,497Cash and cash equivalents 17 461,726 402,540
1,090,918 1,041,279
Current liabilities
Trade and otherpayables 22 379,533 345,986
Bank loans 23 27,005 41,279Obligations under
finance leases 24(a) 7,533 2,945Current tax payable 16(a) 7,361 10,561
421,432 400,771
Net current assets 669,486 640,508
Total assets less currentliabilities carried forward 1,456,999 1,398,249

61
Consolidated Balance Sheet
At 31st March, 2007 (Expressed in Hong Kong dollars)
2007 2006Note $’000 $’000 $’000 $’000
Total assets less currentliabilities brought forward 1,456,999 1,398,249
Non-current liabilities
Bank loans 23 69,960 78,050Obligations under
finance leases 24(a) 27,773 2,763Employee retirement
benefit liabilities 15(b) 2,418 2,951Deferred tax liabilities 16(b) 11,360 5,551
111,511 89,315
NET ASSETS 1,345,488 1,308,934
CAPITAL AND RESERVES 25(a)
Share capital 251,759 250,822Reserves 1,002,602 999,546
Total equity attributableto equity shareholdersof the Company 1,254,361 1,250,368
Minority interests 91,127 58,566
TOTAL EQUITY 1,345,488 1,308,934
The notes on pages 68 to 146 form part of these financial statements.
Approved and authorised for issue by the Board of Directorson 9th July, 2007
Winston Yau-lai LO John Shek-hung LAUDirector Director
68 146

At 31st March, 2007 (Expressed in Hong Kong dollars)
Vitasoy International Holdings Ltd. Annual Report 2006/07
Balance Sheet
62
2007 2006Note $’000 $’000 $’000 $’000
Non-current assets
Fixed assets 13(b)– Property, plant and –
equipment 178,659 155,460– Investment property – 9,878 10,405
188,537 165,865Interest in subsidiaries 14 286,763 143,425Employee retirement
benefit assets 15(b) 2,436 1,659Bank deposits 17 – 22,768Other financial asset 18 14,347 13,922
492,083 347,639
Current assets
Inventories 19 84,963 90,418Trade and other
receivables 20 259,335 229,562Amounts due from
subsidiaries 21 210,496 400,646Bank deposits 17 11,532 50,055Cash and cash
equivalents 17 311,624 269,447
877,950 1,040,128
Current liabilities
Trade and otherpayables 22 189,521 168,827
Obligations underfinance leases 24(b) 936 –
Current tax payable 16(a) 4,658 6,164
195,115 174,991
Net current assets 682,835 865,137
Total assets less currentliabilities carried forward 1,174,918 1,212,776

63
Balance Sheet
At 31st March, 2007 (Expressed in Hong Kong dollars)
2007 2006Note $’000 $’000 $’000 $’000
Total assets less currentliabilities brought forward 1,174,918 1,212,776
Non-current liabilities
Obligations underfinance leases 24(b) 5,637 –
Employee retirementbenefit liabilities 15(b) 2,283 2,834
Deferred tax liabilities 16(b) 10,591 5,050
18,511 7,884
NET ASSETS 1,156,407 1,204,892
CAPITAL AND RESERVES 25(b)
Share capital 251,759 250,822Reserves 904,648 954,070
TOTAL EQUITY 1,156,407 1,204,892
Approved and authorised for issue by the Board of Directorson 9th July, 2007
Winston Yau-lai LO John Shek-hung LAUDirector Director
The notes on pages 68 to 146 form part of these financial statements. 68 146
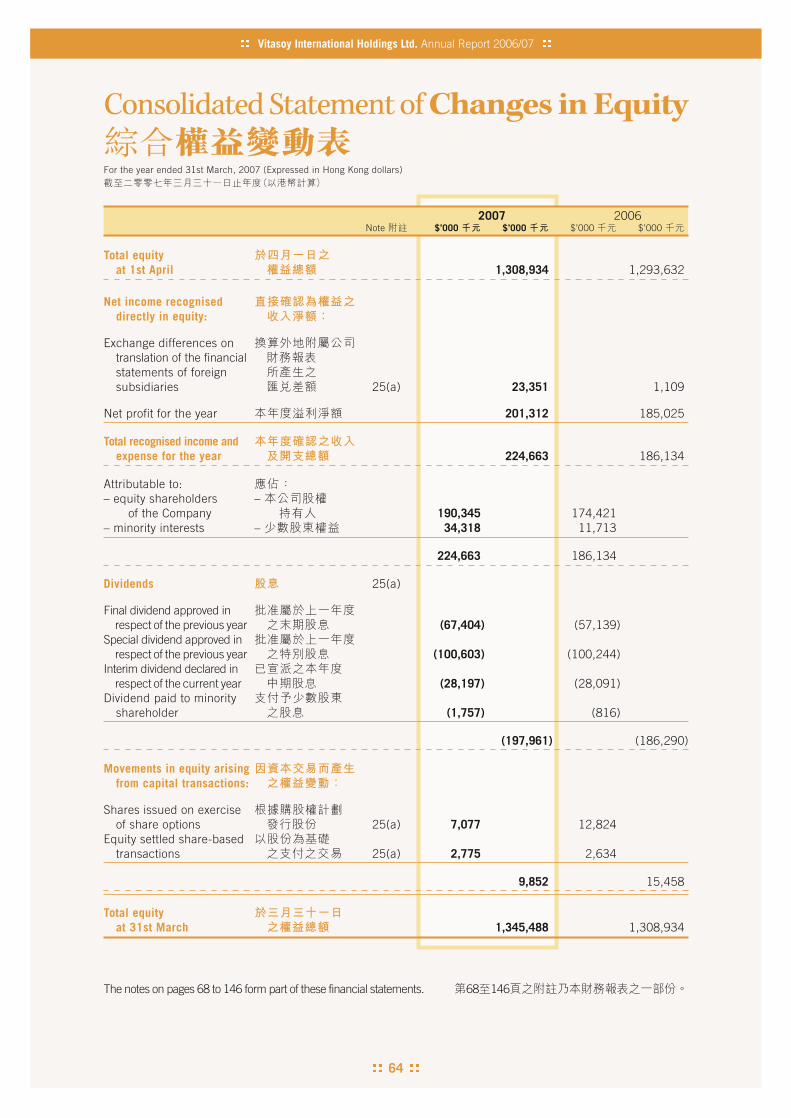
64
For the year ended 31st March, 2007 (Expressed in Hong Kong dollars)
Vitasoy International Holdings Ltd. Annual Report 2006/07
Consolidated Statement of Changes in Equity
2007 2006Note $’000 $’000 $’000 $’000
Total equityat 1st April 1,308,934 1,293,632
Net income recogniseddirectly in equity:
Exchange differences ontranslation of the financialstatements of foreignsubsidiaries 25(a) 23,351 1,109
Net profit for the year 201,312 185,025
Total recognised income andexpense for the year 224,663 186,134
Attributable to:– equity shareholders –
of the Company 190,345 174,421– minority interests – 34,318 11,713
224,663 186,134
Dividends 25(a)
Final dividend approved inrespect of the previous year (67,404) (57,139)
Special dividend approved inrespect of the previous year (100,603) (100,244)
Interim dividend declared inrespect of the current year (28,197) (28,091)
Dividend paid to minorityshareholder (1,757) (816)
(197,961) (186,290)
Movements in equity arisingfrom capital transactions:
Shares issued on exerciseof share options 25(a) 7,077 12,824
Equity settled share-basedtransactions 25(a) 2,775 2,634
9,852 15,458
Total equityat 31st March 1,345,488 1,308,934
The notes on pages 68 to 146 form part of these financial statements. 68 146
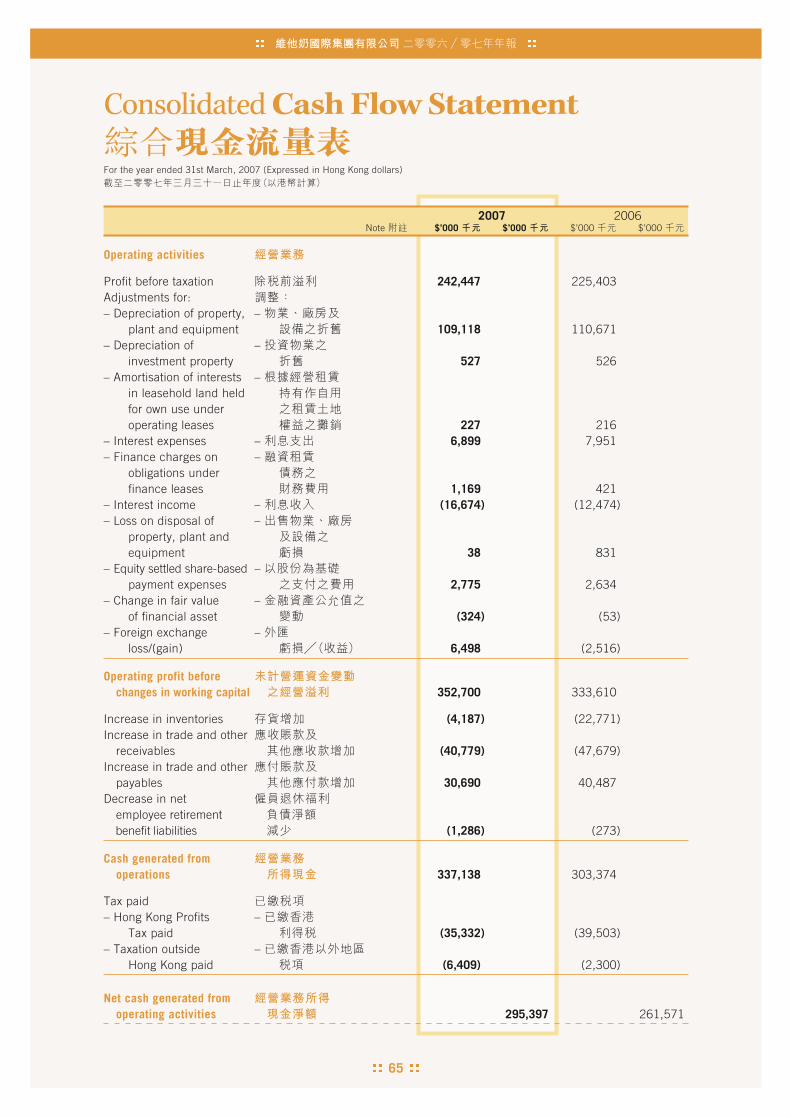
65
For the year ended 31st March, 2007 (Expressed in Hong Kong dollars)
Consolidated Cash Flow Statement
2007 2006Note $’000 $’000 $’000 $’000
Operating activities
Profit before taxation 242,447 225,403Adjustments for:– Depreciation of property, –
plant and equipment 109,118 110,671– Depreciation of –
investment property 527 526– Amortisation of interests –
in leasehold land heldfor own use underoperating leases 227 216
– Interest expenses – 6,899 7,951– Finance charges on –
obligations underfinance leases 1,169 421
– Interest income – (16,674) (12,474)– Loss on disposal of –
property, plant andequipment 38 831
– Equity settled share-based – payment expenses 2,775 2,634
– Change in fair value – of financial asset (324) (53)
– Foreign exchange – loss/(gain) 6,498 (2,516)
Operating profit beforechanges in working capital 352,700 333,610
Increase in inventories (4,187) (22,771)Increase in trade and other
receivables (40,779) (47,679)Increase in trade and other
payables 30,690 40,487Decrease in net
employee retirementbenefit liabilities (1,286) (273)
Cash generated fromoperations 337,138 303,374
Tax paid– Hong Kong Profits –
Tax paid (35,332) (39,503)– Taxation outside –
Hong Kong paid (6,409) (2,300)
Net cash generated fromoperating activities 295,397 261,571
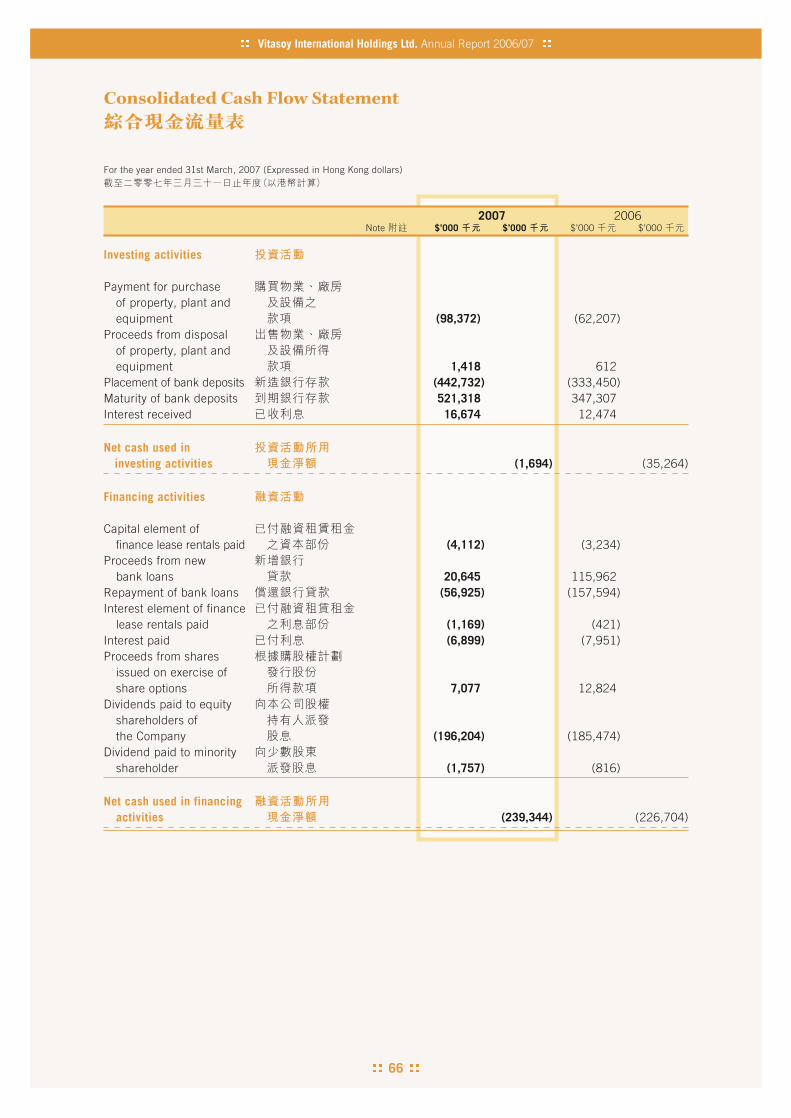
66
For the year ended 31st March, 2007 (Expressed in Hong Kong dollars)
Vitasoy International Holdings Ltd. Annual Report 2006/07
Consolidated Cash Flow Statement
2007 2006Note $’000 $’000 $’000 $’000
Investing activities
Payment for purchaseof property, plant andequipment (98,372) (62,207)
Proceeds from disposalof property, plant andequipment 1,418 612
Placement of bank deposits (442,732) (333,450)Maturity of bank deposits 521,318 347,307Interest received 16,674 12,474
Net cash used ininvesting activities (1,694) (35,264)
Financing activities
Capital element offinance lease rentals paid (4,112) (3,234)
Proceeds from newbank loans 20,645 115,962
Repayment of bank loans (56,925) (157,594)Interest element of finance
lease rentals paid (1,169) (421)Interest paid (6,899) (7,951)Proceeds from shares
issued on exercise ofshare options 7,077 12,824
Dividends paid to equityshareholders ofthe Company (196,204) (185,474)
Dividend paid to minorityshareholder (1,757) (816)
Net cash used in financingactivities (239,344) (226,704)

67
Consolidated Cash Flow Statement
For the year ended 31st March, 2007 (Expressed in Hong Kong dollars)
2007 2006Note $’000 $’000 $’000 $’000
Net increase/(decrease)in cash and cashequivalents 54,359 (397)
Cash and cash equivalentsat 1st April 402,540 402,673
Effect of foreign exchangerate changes 4,827 264
Cash and cash equivalentsat 31st March 17 461,726 402,540
The notes on pages 68 to 146 form part of these financial statements. 68 146
68
(Expressed in Hong Kong dollars unless otherwise indicated)
Vitasoy International Holdings Ltd. Annual Report 2006/07
Notes to the Financial Statements
1 Significant accounting policies
(a) Statement of compliance
These financial statements have been prepared inaccordance with all applicable Hong Kong FinancialReporting Standards (“HKFRSs”), which collectivelyinclude all applicable individual Hong Kong FinancialReporting Standards, Hong Kong Accounting Standards(“HKASs”) and Interpretations issued by the Hong KongInstitute of Certified Public Accountants (“HKICPA”),accounting principles generally accepted in Hong Kongand the requirements of the Hong Kong CompaniesOrdinance. These financial statements also comply withthe applicable disclosure provisions of the RulesGoverning the Listing of Securities on The Stock Exchangeof Hong Kong Limited (the “Listing Rules”). A summaryof the significant accounting policies adopted by theGroup is set out below.
The HKICPA has issued certain new and revised HKFRSsthat are first effective or available for early adoption forthe current accounting period of the Group and theCompany. Note 2 provides information on the changesin accounting policies resulting from initial application ofthese developments to the extent that they are relevantto the Group for the current and prior accounting periodsreflected in these financial statements.
(b) Basis of preparation of the financial statements
The consolidated financial statements for the year ended31st March, 2007 comprise the Company and itssubsidiaries (together referred to as the “Group”).
The measurement basis used in the preparation of thefinancial statements is the historical cost basis exceptthat financial assets at fair value through profit or lossare stated at their fair values as explained in theaccounting policy set out in note 1(d).
The preparation of financial statements in conformity withHKFRSs requires management to make judgements,estimates and assumptions that affect the application ofpolicies and reported amounts of assets, liabilities, incomeand expenses. The estimates and associated assumptionsare based on historical experience and various otherfactors that are believed to be reasonable under thecircumstances, the results of which form the basis ofmaking the judgements about carrying values of assetsand liabilities that are not readily apparent from othersources. Actual results may differ from these estimates.
1
(a)
2
(b)
1(d)

69
Notes to the Financial Statements
(Expressed in Hong Kong dollars unless otherwise indicated)
1 Significant accounting policies (continued)
(b) Basis of preparation of the financial statements(continued)
The estimates and underlying assumptions are reviewedon an ongoing basis. Revisions to accounting estimatesare recognised in the period in which the estimate isrevised if the revision affects only that period, or in theperiod of the revision and future periods if the revisionaffects both current and future periods.
Judgements made by management in the application ofHKFRSs that have significant effect on the financialstatements and estimates with a significant risk of materialadjustment in the next year are discussed in note 32.
(c) Subsidiaries and minority interests
Subsidiaries are entities controlled by the Group. Controlexists when the Group has the power to govern the financialand operating policies of an entity so as to obtain benefitsfrom its activities. In assessing control, potential votingrights that presently are exercisable are taken into account.
An investment in a subsidiary is consolidated into theconsolidated financial statements from the date thatcontrol commences until the date that control ceases.Intra-group balances and transactions and any unrealisedprofits arising from intra-group transactions are eliminatedin full in preparing the consolidated financial statements.Unrealised losses resulting from intra-group transactionsare eliminated in the same way as unrealised gains butonly to the extent that there is no evidence of impairment.
Minority interests represent the portion of the net assetsof subsidiaries attributable to equity interests that are notowned by the Company, whether directly or indirectlythrough subsidiaries, and in respect of which the Grouphas not agreed any additional terms with the holders ofthose interests which would result in the Group as a wholehaving a contractual obligation in respect of those intereststhat meets the definition of a financial liability. Minorityinterests are presented in the consolidated balance sheetwithin equity, separately from equity attributable to theequity shareholders of the Company. Minority interests inthe results of the Group are presented on the face of theconsolidated income statement as an allocation of the totalprofit or loss for the year between minority interests andthe equity shareholders of the Company.
1
(b)
32
(c)
70
(Expressed in Hong Kong dollars unless otherwise indicated)
Vitasoy International Holdings Ltd. Annual Report 2006/07
Notes to the Financial Statements
1 Significant accounting policies (continued)
(c) Subsidiaries and minority interests (continued)
Where losses applicable to the minority exceed theminority’s interest in the equity of a subsidiary, the excess,and any further losses applicable to the minority, arecharged against the Group’s interest except to the extentthat the minority has a binding obligation to, and is ableto, make additional investment to cover the losses. If thesubsidiary subsequently reports profits, the Group’sinterest is allocated all such profits until the minority’sshare of losses previously absorbed by the Group hasbeen recovered.
In the Company’s balance sheet, an investment in asubsidiary is stated at cost less impairment losses (seenote 1(j)).
(d) Financial assets at fair value through profit orloss
Financial assets at fair value through profit or loss areinitially recognised at cost. Financial assets at fair valuethrough profit or loss are measured at fair value at eachbalance sheet date, with any resultant gain or loss beingrecognised in profit or loss.
(e) Investment property
Investment properties are land and/or buildings whichare owned or held under a leasehold interest to earn rentalincome and/or for capital appreciation.
Investment properties are stated in the balance sheet atcost less accumulated depreciation and impairmentlosses (see note 1(j)).
Depreciation is calculated to write off the cost ofinvestment properties, less their estimated residualvalues, if any, using the straight-line method over theshorter of the unexpired terms of leases and theirestimated useful lives, being no more than 50 years afterthe date of completion.
Both the useful life and the residual value, if any, arereviewed annually.
1
(c)
1(j)
(d)
(e)
1(j)
50
71
Notes to the Financial Statements
(Expressed in Hong Kong dollars unless otherwise indicated)
1 Significant accounting policies (continued)
(f) Property, plant and equipment
The following property, plant and equipment are statedin the balance sheet at cost less accumulateddepreciation and impairment losses (see note 1(j)):
– freehold land and buildings;
– land held under operating leases and buildingsthereon, where the fair values of the leaseholdinterest in the land and buildings cannot bemeasured separately at the inception of the leaseand the building is not clearly held under anoperating lease;
– buildings held for own use which are situated onleasehold land, where the fair value of the buildingcould be measured separately from the fair value ofthe leasehold land at the inception of the lease; and
– other items of plant and equipment.
Gain or loss arising from the retirement or disposal of anitem of property, plant and equipment are determined asthe difference between the net disposal proceed and thecarrying amount of the item and are recognised in profitor loss on the date of retirement or disposal.
Depreciation is calculated to write off the cost of items ofproperty, plant and equipment, less their estimatedresidual value, if any, using the straight-line method overtheir estimated useful lives as follows:
(i) Leasehold land and buildings over the shorter of theunexpired terms of leases and their estimated usefullives, being no more than 50 years after the date ofcompletion.
No depreciation is provided for freehold land.
(ii) Other plant and equipment at the following rates:
Factory machinery and equipment 6 – 25%Fixtures, furniture and
office equipment 9 – 33%Motor vehicles 18 – 25%
1
(f)
1(j)
–
–
–
–
(i)
50
(ii)
6 25%
9 33%18 25%

72
(Expressed in Hong Kong dollars unless otherwise indicated)
Vitasoy International Holdings Ltd. Annual Report 2006/07
Notes to the Financial Statements
1 Significant accounting policies (continued)
(f) Property, plant and equipment (continued)
Where parts of an item of property, plant and equipmenthave different useful lives, the cost of the item is allocatedon a reasonable basis between the parts and each partis depreciated separately.
Both the useful life of an asset and its residual value, ifany, are reviewed annually.
(g) Leased assets
An arrangement, comprising a transaction or a series oftransactions, is or contains a lease if the Groupdetermines that the arrangement conveys a right to usea specific asset or assets for an agreed period of time inreturn for a payment or a series of payments. Such adetermination is made based on an evaluation of thesubstance of the arrangement and is regardless ofwhether the arrangement takes the legal form of a lease.
(i) Classification of assets leased to the GroupAssets that are held by the Group under leases whichtransfer to the Group substantially all the risks andrewards of ownership are classified as being heldunder finance leases. Leases which do not transfersubstantially all the risks and rewards of ownershipto the Group are classified as operating leases.
However, for land held for own use under anoperating lease, where the fair value of the landcannot be measured separately from the fair valueof a building situated thereon at the inception ofthe lease, is accounted for as being held under afinance lease, unless the building is also clearly heldunder an operating lease. For these purposes, theinception of the lease is the time that the lease wasfirst entered into by the Group, or taken over fromthe previous lessee.
1
(f)
(g)
(i)
73
Notes to the Financial Statements
(Expressed in Hong Kong dollars unless otherwise indicated)
1 Significant accounting policies (continued)
(g) Leased assets (continued)
(ii) Assets acquired under finance leasesWhere the Group acquires the use of assets underfinance leases, the amounts representing the fairvalue of the leased assets, or, if lower, the presentvalue of the minimum lease payments of such assetsare included in property, plant and equipment andthe corresponding liabilities, net of finance charges,are recorded as obligations under finance leases.Depreciation is provided at rates which write off thecost of the assets over the term of the relevant leaseor, where it is likely the Group will obtain ownershipof the asset, the life of the asset, as set out in note1(f). Impairment losses are accounted for inaccordance with the accounting policy as set out innote 1(j). Finance charges implicit in the leasepayments are charged to profit or loss over the periodof the leases so as to produce an approximatelyconstant periodic rate of charge on the remainingbalance of the obligations for each accounting period.
(iii) Operating lease chargesWhere the Group has the use of assets held underoperating leases, payments made under the leasesare charged to profit or loss in equal instalments overthe accounting periods covered by the lease term.
The cost of acquiring land held under an operatinglease is amortised on a straight-line basis over theperiod of the lease term.
(h) Inventories
Inventories are carried at the lower of cost and netrealisable value.
Cost is calculated using the first-in, first-out method andcomprises all costs of purchase, costs of conversion andother costs incurred in bringing the inventories to theirpresent locations and conditions.
Net realisable value is the estimated selling price in theordinary course of business less the estimated costs ofcompletion and the estimated costs necessary to makethe sale.
1
(g)
(ii)
1(f)1(j)
(iii)
(h)
74
(Expressed in Hong Kong dollars unless otherwise indicated)
Vitasoy International Holdings Ltd. Annual Report 2006/07
Notes to the Financial Statements
1 Significant accounting policies (continued)
(h) Inventories (continued)
When inventories are sold, the carrying amount of thoseinventories is recognised as an expense in the period inwhich the related revenue is recognised. The amount ofany write-down of inventories to net realisable value andall losses of inventories are recognised as an expense inthe period the write-down or loss occurs. The amount ofany reversal of any write-down of inventories is recognisedas a reduction in the amount of inventories recognisedas an expense in the period in which the reversal occurs.
(i) Receivables
Receivables are initially recognised at fair value andthereafter stated at amortised cost less impairment lossesfor bad and doubtful debts (see note 1(j)), except wherethe receivables are interest-free loans made to relatedparties without any fixed repayment terms or the effectof discounting would be immaterial. In such cases, thereceivables are stated at cost less impairment losses forbad and doubtful debts (see note 1(j)).
(j) Impairment of assets
(i) Impairment of receivablesReceivables that are stated at cost or amortised costare reviewed at each balance sheet date to determinewhether there is objective evidence of impairment. Ifany such evidence exists, any impairment loss isdetermined and recognised as follows:
– For receivables that are carried at cost, theimpairment loss is measured as the differencebetween the asset’s carrying amount and theestimated future cash flows, discounted at thecurrent market rate of return for a similar assetwhere the effect of discounting is material.Impairment losses are reversed i f in asubsequent per iod the amount o f theimpairment loss decreases.
1
(h)
(i)
( 1(j))
( 1(j))
(j)
(i)
–

75
Notes to the Financial Statements
(Expressed in Hong Kong dollars unless otherwise indicated)
1 Significant accounting policies (continued)
(j) Impairment of assets (continued)
(i) Impairment of receivables (continued)– For receivables that are carried at amortised
cost, the impairment loss is measured as thedifference between the asset’s carrying amountand the present value of estimated future cashflows, discounted at the asset’s original effectiveinterest rate (i.e. the effective interest ratecomputed at initial recognition of the asset),where the effect of discounting is material.
If in a subsequent period the amount of animpairment loss decreases and the decreasecan be linked objectively to an event occurringafter the impairment loss was recognised, theimpairment loss is reversed through profit orloss. A reversal of an impairment loss shall notresult in the asset’s carrying amount exceedingthat which would have been determined had noimpairment loss been recognised in prior years.
(ii) Impairment of other assetsInternal and external sources of information arereviewed at each balance sheet date to identifyindications that the following assets may be impairedor an impairment loss previously recognised nolonger exists or may have decreased:
– property, plant and equipment;
– investment property;
– interests in leasehold land held for own useunder operating leases; and
– interest in subsidiaries.
If any such indication exists, the asset’s recoverableamount is estimated.
1
(j)
(i)–
(ii)
–
–
–
–
76
(Expressed in Hong Kong dollars unless otherwise indicated)
Vitasoy International Holdings Ltd. Annual Report 2006/07
Notes to the Financial Statements
1 Significant accounting policies (continued)
(j) Impairment of assets (continued)
(ii) Impairment of other assets (continued)– Calculation of recoverable amount
The recoverable amount of an asset is thegreater of its net selling price and value in use.In assessing value in use, the estimated futurecash flows are discounted to their presentvalue using a pre-tax discount rate that reflectscurrent market assessments of time value ofmoney and the risks specific to the asset.Where an asset does not generate cash inflowslargely independent of those from otherassets, the recoverable amount is determinedfor the smallest group of assets that generatescash inflows independently (i.e. a cash-generating unit).
– Recognition of impairment losses
An impairment loss is recognised in profit orloss whenever the carrying amount of an asset,or the cash-generating unit to which it belongs,exceeds its recoverable amount. Impairmentlosses recognised in respect of cash-generatingunits are allocated to reduce the carryingamount of the assets in the unit (or group ofunits) on a pro rata basis, except that thecarrying value of an asset will not be reducedbelow its individual fair value less costs to sell,or value in use, if determinable.
– Reversals of impairment losses
An impairment loss is reversed if there has beena favourable change in the estimates used todetermine the recoverable amount. A reversalof an impairment loss is limited to the asset’scarrying amount that would have beendetermined had no impairment loss beenrecognised in prior years. Reversals ofimpairment losses are credited to profit or lossin the year in which the reversals are recognised.
1
(j)
(ii)–
–
–

77
Notes to the Financial Statements
(Expressed in Hong Kong dollars unless otherwise indicated)
1 Significant accounting policies (continued)
(k) Interest-bearing borrowings
Interest-bearing borrowings are recognised initially at fairvalue less attributable transaction costs. Subsequent toinitial recognition, interest-bearing borrowings are statedat amortised cost with any difference between the amountinitially recognised and redemption value being recognisedin profit or loss over the period of the borrowings, togetherwith any interest and fees payable, using the effectiveinterest method.
(l) Payables
Payables are initially recognised at fair value. Except forfinancial guarantee liabilities measured in accordancewith note 1(p)(i), payables are subsequently stated atamortised cost unless the effect of discounting would beimmaterial, in which case they are stated at cost.
(m) Cash and cash equivalents
Cash and cash equivalents comprise cash at bank andon hand, demand deposits with banks and other financialinstitutions, and short-term, highly liquid investmentsthat are readily convertible into known amounts of cashand which are subject to an insignificant risk of changesin value, having been within three months of maturityat acquisition.
(n) Employee benefits
(i) Short term employee benefits and contributions todefined contribution retirement plansSalaries, annual bonuses, paid annual leave,contributions to defined contribution retirement plansand the cost of non-monetary benefits are accruedin the year in which the associated services arerendered by employees. Where payment or settlementis deferred and the effect would be material, theseamounts are stated at their present values.
1
(k)
(l)
1(p)(i)
(m)
(n)
(i)

78
(Expressed in Hong Kong dollars unless otherwise indicated)
Vitasoy International Holdings Ltd. Annual Report 2006/07
Notes to the Financial Statements
1 Significant accounting policies (continued)
(n) Employee benefits (continued)
(ii) Defined benefit retirement plan obligationThe Group’s net obligation in respect of a definedbenefit retirement plan is calculated by estimatingthe amount of future benefit that employees haveearned in return for their services in the current andprior periods; that benefit is discounted to determinethe present value and the fair value of any planassets is deducted. The discount rate is the yield atthe balance sheet date on high quality corporatebonds that have maturity dates approximating theterms of the Group’s obligation. The calculation isperformed by a qualified actuary using the projectedunit credit method.
In calculating the Group’s obligation in respect of aplan, if any cumulative unrecognised actuarial gainor loss exceeds ten percent of the greater of thepresent value of the defined benefit obligation andthe fair value of plan assets, that portion isrecognised in profit or loss over the expected averageremain ing work ing l i ves o f the employeesparticipating in the plan. Otherwise, the actuarialgain or loss is not recognised.
Where the calculation of the Group’s net obligationresults in a negative amount, the asset recognisedis l imited to the net total of any cumulativeunrecognised net actuarial losses and past servicecosts and the present value of any future refundsfrom the plan or reductions in future contributionsto the plan.
(iii) Long service payments obligationThe Group’s net obligation in respect of lump sumlong service amounts payable on cessation ofemployment in certain circumstances under theHong Kong Employment Ordinance is the amountof future benefit that employees have earned inreturn for their services in the current and priorperiods; that benefit is discounted to determine thepresent value and reduced by entitlements accruedunder the Group’s retirement plans that areattributable to contributions made by the Group. Thediscount rate is the yield at the balance sheet dateon high quality corporate bonds that have maturitydates approximating the terms of the Group’sobligation. The obligation is calculated by a qualifiedactuary using the projected unit credit method.
1
(n)
(ii)
(iii)

79
Notes to the Financial Statements
(Expressed in Hong Kong dollars unless otherwise indicated)
1 Significant accounting policies (continued)
(n) Employee benefits (continued)
(iv) Share-based paymentsThe fair value of share options granted to employeesis recognised as an employee cost wi th acor responding increase in a share-basedcompensation reserve within equity. The fair valueis measured at grant date using the binomial latticemodel, taking into account the terms and conditionsupon which the options were granted. Where theemployees have to meet vesting conditions beforebecoming unconditionally entitled to the options, thetotal estimated fair value of the options is spreadover the vesting period, taking into account theprobability that the options will vest.
During the vesting period, the number of shareoptions that is expected to vest is reviewed. Anyadjustment to the cumulative fair value recognisedin prior years is charged/credited to the profit orloss for the year of the review, unless the originalemployee expenses qualify for recognition as anasset, with a corresponding adjustment to theshare-based compensation reserve. On vestingdate, the amount recognised as an expense isadjusted to reflect the actual number of optionsthat vest (with a corresponding adjustment to theshare-based compensation reserve). The equityamount i s recogn ised in the share-basedcompensation reserve until either the option isexercised (when it is transferred to the sharepremium account) or the option expires (when it isreleased directly to retained profits).
(o) Income tax
(i) Income tax for the year comprises current tax andmovements in deferred tax assets and liabilities.
(ii) Current tax is the expected tax payable on thetaxable income for the year, using tax rates enactedor substantively enacted at the balance sheet date,and any adjustment to tax payable in respect ofprevious years.
1
(n)
(iv)
(o)
(i)
(ii)
80
(Expressed in Hong Kong dollars unless otherwise indicated)
Vitasoy International Holdings Ltd. Annual Report 2006/07
Notes to the Financial Statements
1 Significant accounting policies (continued)
(o) Income tax (continued)
(iii) Deferred tax assets and liabilit ies arise fromdeductible and taxable temporary differencesrespectively, being the differences between thecarrying amounts of assets and liabilities for financialreporting purposes and their tax bases. Deferred taxassets also arise from unused tax losses and unusedtax credits.
Apart from certain limited exceptions, all deferredtax liabilities, and all deferred tax assets to the extentthat it is probable that future taxable profits will beavailable against which the asset can be utilised,are recognised.
The amount of deferred tax recognised is measuredbased on the expected manner of realisation orsettlement of the carrying amount of the assets andliabilities, using tax rates enacted or substantivelyenacted at the balance sheet date. Deferred taxassets and liabilities are not discounted.
The carrying amount of a deferred tax asset isreviewed at each balance sheet date and is reducedto the extent that it is no longer probable that sufficienttaxable profits will be available to allow the relatedtax benefit to be utilised. Any such reduction isreversed to the extent that it becomes probable thatsufficient taxable profits will be available.
(iv) Current tax balances and deferred tax balances, andmovements therein, are presented separately fromeach other and are not offset. Current tax assets areoffset against current tax liabilities, and deferred taxassets against deferred tax liabilities, if the Companyor the Group has the legally enforceable right to setoff current tax assets against current tax liabilitiesand the following additional conditions are met:
– in the case of current tax assets and liabilities,the Company or the Group intends either tosettle on a net basis, or to realise the asset andsettle the liability simultaneously; or
1
(o)
(iii)
(iv)
–
81
Notes to the Financial Statements
(Expressed in Hong Kong dollars unless otherwise indicated)
1 Significant accounting policies (continued)
(o) Income tax (continued)
– in the case of deferred tax assets and liabilities,if they relate to income taxes levied by the sametaxation authority on either:
– the same taxable entity; or
– different taxable entities, which, in eachfuture period in which significant amountsof deferred tax liabilities or assets areexpected to be settled or recovered,intend to realise the current tax assets andsettle the current tax liabilities on a netbasis or realise and settle simultaneously.
(p) Financial guarantees issued, provisions andcontingent liabilities
(i) Financial guarantees issuedFinancial guarantees are contracts that require theissuer (i.e. the guarantor) to make specified paymentsto reimburse the beneficiary of the guarantee (the“holder”) for a loss the holder incurs because aspecified debtor fails to make payment when due inaccordance with the terms of a debt instrument.
Where the Group or the Company issues a financialguarantee, the fair value of the guarantee (being thetransaction price, unless the fair value can otherwisebe reliably estimated) is initially recognised asdeferred income within trade and other payables.Where consideration is received or receivable forthe issuance of the guarantee, the consideration isrecognised in accordance with the Group’s policiesapplicable to that category of asset. Where no suchconsiderat ion is received or receivable, animmediate expense is recognised in profit or losson initial recognition of any deferred income.
1
(o)
–
–
–
(p)
(i)
82
(Expressed in Hong Kong dollars unless otherwise indicated)
Vitasoy International Holdings Ltd. Annual Report 2006/07
Notes to the Financial Statements
1 Significant accounting policies (continued)
(p) Financial guarantees issued, provisions andcontingent liabilities (continued)
(i) Financial guarantees issued (continued)The amount of the guarantee initially recognised asdeferred income is amortised in profit or loss overthe term of the guarantee as income from financialguarantees issued. In addition, provisions arerecognised in accordance with note 1(p)(ii) if andwhen (i) it becomes probable that the holder of theguarantee will call upon the Group or the Companyunder the guarantee, and (ii) the amount of that claimon the Group or the Company is expected to exceedthe amount currently carried in trade and otherpayables in respect of that guarantee i.e. the amountinitially recognised, less accumulated amortisation.
(ii) Other provisions and contingent liabilitiesProvisions are recognised for liabilities of uncertaintiming or amount when the Group or the Companyhas a legal or constructive obligation arising as aresult of a past event, it is probable that an outflowof economic benefits will be required to settle theobligation and a reliable estimate can be made.Where the time value of money is material, provisionsare stated at the present value of the expenditureexpected to settle the obligation.
Where it is not probable that an outflow of economicbenefits will be required, or the amount cannot beestimated reliably, the obligation is disclosed as acontingent liability, unless the probability of outflowof economic benefits is remote. Possible obligations,whose existence will only be confirmed by theoccurrence or non-occurrence of one or more futureevents are also disclosed as contingent liabilitiesunless the probability of outflow of economic benefitsis remote.
1
(p)
(i)
i
ii
1(p) ii
(ii)
83
Notes to the Financial Statements
(Expressed in Hong Kong dollars unless otherwise indicated)
1 Significant accounting policies (continued)
(q) Revenue recognition
Provided it is probable that the economic benefits willflow to the Group and the revenue and costs, if applicable,can be measured reliably, revenue is recognised in profitor loss as follows:
(i) Sale of goodsRevenue is recognised when goods are delivered atthe customers’ premises which is taken to be thepoint in time when the customer has accepted thegoods and the related risks and rewards ofownership. Revenue excludes value added tax orother sales taxes and is after deduction of returns.
(ii) Service feesService fees are recognised when the relatedservices are provided.
(iii) Rental income from operating leasesRental income receivable under operating leases isrecognised in profit or loss in equal instalments overthe periods covered by the lease term.
(iv) Interest incomeInterest income is recognised as it accrues usingthe effective interest method.
(v) DividendsDividend income from unlisted investments isrecognised when the shareholder’s right to receivepayment is established.
(r) Translation of foreign currencies
Foreign currency transactions during the year aretranslated at the foreign exchange rates ruling at thetransaction dates. Monetary assets and liabilitiesdenominated in foreign currencies are translated at theforeign exchange rates ruling at the balance sheet date.Exchange gains and losses are recognised in profit or loss.
Non-monetary assets and liabilities that are measuredin terms of historical cost in a foreign currency aretranslated using the foreign exchange rates ruling at thetransaction dates.
1
(q)
(i)
(ii)
(iii)
(iv)
(v)
(r)
84
(Expressed in Hong Kong dollars unless otherwise indicated)
Vitasoy International Holdings Ltd. Annual Report 2006/07
Notes to the Financial Statements
1 Significant accounting policies (continued)
(r) Translation of foreign currencies (continued)
The results of foreign operations are translated into HongKong dollars at the exchange rates approximating theforeign exchange rates ruling at the dates of thetransactions. Balance sheet items are translated intoHong Kong dollars at the foreign exchange rates rulingat the balance sheet date. The resulting exchangedifferences are recognised directly in a separatecomponent of equity.
On disposal of a foreign operation, the cumulative amountof the exchange differences recognised in equity whichrelate to that foreign operation is included in thecalculation of the profit or loss on disposal.
(s) Borrowing costs
Borrowing costs are expensed in profit or loss in the periodin which they are incurred.
(t) Related parties
For the purposes of these financial statements, a party isconsidered to be related to the Group if:
(i) the party has the ability, directly or indirectly throughone or more intermediaries, to control the Group orexercise significant influence over the Group inmaking financial and operating decisions, or hasjoint control over the Group;
(ii) the Group and the party are subject to commoncontrol;
(iii) the party is an associate of the Group or a jointventure in which the Group is a venturer;
(iv) the party is a member of key management personnelof the Group or a close family member of such anindividual, or is an entity under the control, jointcontrol or significant influence of such individuals;
(v) the party is a close family member of a party referredto in (i) or is an entity under the control, joint controlor significant influence of such individuals; or
1
(r)
(s)
(t)
(i)
(ii)
(iii)
(iv)
(v) (i)

85
Notes to the Financial Statements
(Expressed in Hong Kong dollars unless otherwise indicated)
1 Significant accounting policies (continued)
(t) Related parties (continued)
(vi) the party is a post-employment benefit plan whichis for the benefit of employees of the Group or ofany entity that is a related party of the Group.
Close family members of an individual are those familymembers who may be expected to influence, or beinfluenced by, that individual in their dealings with the entity.
(u) Segment reporting
A segment is a distinguishable component of the Groupthat is engaged in providing products or services withina particular economic environment (geographicalsegment), which is subject to risks and rewards that aredifferent from those of other segments.
Segment revenue, expenses, results, assets and liabilitiesinclude items directly attributable to a segment as wellas those that can be allocated on a reasonable basis tothat segment. For example, segment assets may includeinventories, trade receivables and property, plant andequipment. Segment revenue, expenses, assets, andliabilities are determined before intra-group balances andintra-group transactions are eliminated as part of theconsolidation process, except to the extent that such intra-group balances and transactions are between groupentities within a single segment.
Segment capital expenditure is the total cost incurredduring the year to acquire segment assets (both tangibleand intangible) that are expected to be used for morethan one period.
Unallocated items mainly comprise financial andcorporate assets, interest-bearing loans, borrowings, taxbalances, corporate and financing expenses.
1
(t)
(vi)
(u)
86
(Expressed in Hong Kong dollars unless otherwise indicated)
Vitasoy International Holdings Ltd. Annual Report 2006/07
Notes to the Financial Statements
2 Changes in accounting policies
The HKICPA has issued certain new and revised HKFRSsthat are first effective or available for early adoption forthe current accounting period of the Group.
Note 1 summaries the accounting policies of the Groupafter the adoption of these developments to the extentthat they are relevant to the Group. The adoption of thesedevelopments did not result in significant changes inaccounting policies for the current and prior accountingperiods reflected in these financial statements, exceptas follows.
Financial guarantees issued (Amendments toHKAS 39, Financial instruments: Recognition andmeasurement: Financial guarantee contracts)
In prior years, financial guarantees issued by the Companyto its subsidiaries were disclosed as contingent liabilitiesin accordance with HKAS 37, Provisions, contingentliabilities and contingent assets. No provisions were madein respect of these guarantees unless it was more likelythan not that the guarantee would be called upon.
With effect from 1st April, 2006, in order to comply withthe amendments to HKAS 39 in respect of financialguarantee contracts, the Company has changed itsaccounting policy for financial guarantees issued. Underthe new policy, financial guarantees issued are accountedfor as financial liabilities under HKAS 39 and measuredinitially at fair value, where the fair value can be reliablymeasured. Subsequently, they are measured at the higherof the amount initially recognised, less accumulatedamortisation, and the amount of the provision, if any, thatshould be recognised in accordance with HKAS 37.Further details of the new policy are set out in note 1(p)(i).
The Company has not recognised any deferred incomein respect of the guarantees as the fair value of suchguarantee was insignificant. The adoption of thisaccounting policy has not affected the Company’s profitfor the years ended 31st March, 2006 and 2007, or theCompany’s net assets at those year end dates.
The Group has not applied any new standard orinterpretation that is not yet effective for the currentaccounting period (see note 33).
2
1
39
37
39
39
37
1(p)(i)
33
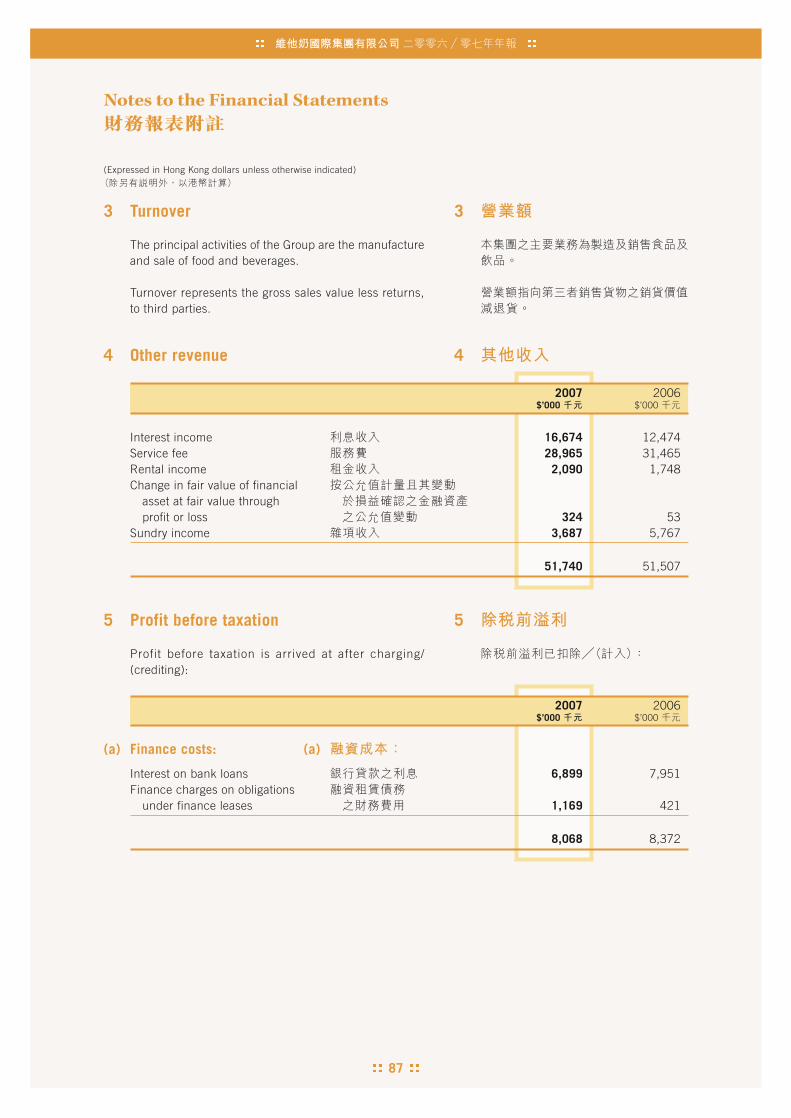
87
Notes to the Financial Statements
(Expressed in Hong Kong dollars unless otherwise indicated)
3 Turnover
The principal activities of the Group are the manufactureand sale of food and beverages.
Turnover represents the gross sales value less returns,to third parties.
4 Other revenue
2007 2006$’000 $’000
Interest income 16,674 12,474Service fee 28,965 31,465Rental income 2,090 1,748Change in fair value of financial
asset at fair value throughprofit or loss 324 53
Sundry income 3,687 5,767
51,740 51,507
5 Profit before taxation
Profit before taxation is arrived at after charging/(crediting):
2007 2006$’000 $’000
(a) Finance costs: (a)
Interest on bank loans 6,899 7,951Finance charges on obligations
under finance leases 1,169 421
8,068 8,372
3
4
5
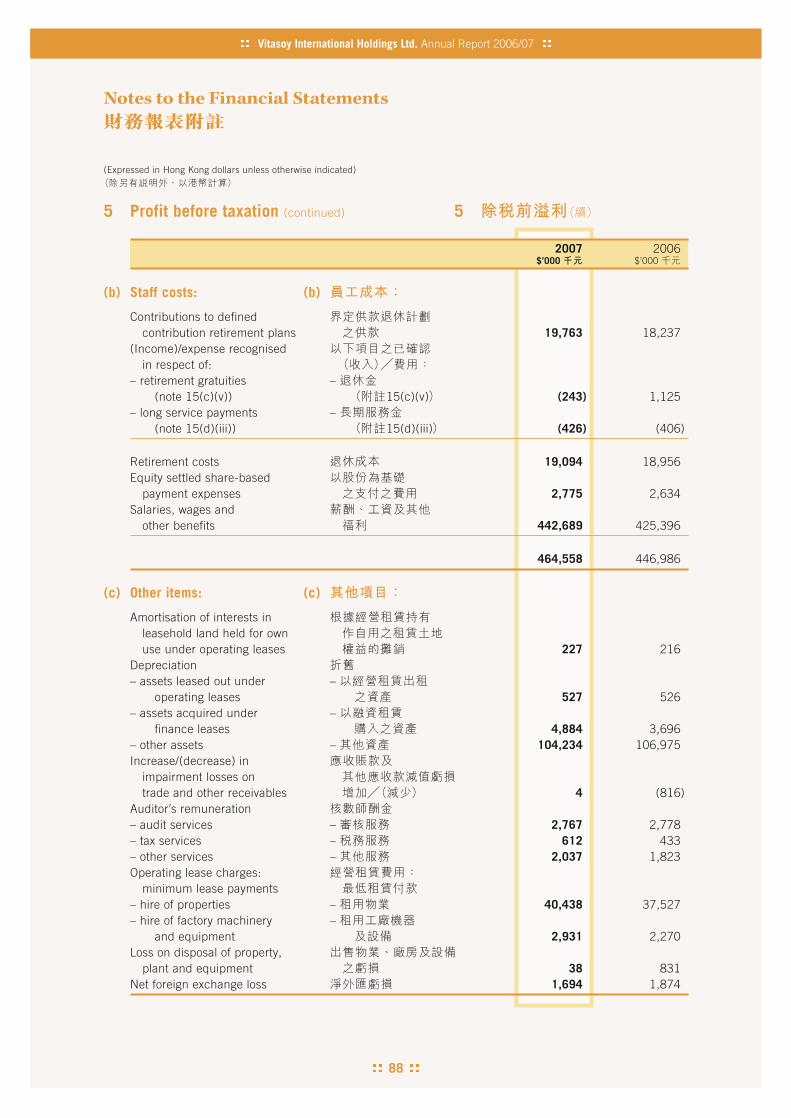
88
(Expressed in Hong Kong dollars unless otherwise indicated)
Vitasoy International Holdings Ltd. Annual Report 2006/07
Notes to the Financial Statements
5 Profit before taxation (continued)
2007 2006$’000 $’000
(b) Staff costs: (b)
Contributions to definedcontribution retirement plans 19,763 18,237
(Income)/expense recognisedin respect of:
– retirement gratuities – (note 15(c)(v)) 15(c)(v) (243) 1,125
– long service payments – (note 15(d)(iii)) 15(d)(iii) (426) (406)
Retirement costs 19,094 18,956Equity settled share-based
payment expenses 2,775 2,634Salaries, wages and
other benefits 442,689 425,396
464,558 446,986
(c) Other items: (c)
Amortisation of interests inleasehold land held for ownuse under operating leases 227 216
Depreciation– assets leased out under –
operating leases 527 526– assets acquired under –
finance leases 4,884 3,696– other assets – 104,234 106,975Increase/(decrease) in
impairment losses ontrade and other receivables 4 (816)
Auditor’s remuneration– audit services – 2,767 2,778– tax services – 612 433– other services – 2,037 1,823Operating lease charges:
minimum lease payments– hire of properties – 40,438 37,527– hire of factory machinery –
and equipment 2,931 2,270Loss on disposal of property,
plant and equipment 38 831Net foreign exchange loss 1,694 1,874
5

89
Notes to the Financial Statements
(Expressed in Hong Kong dollars unless otherwise indicated)
6 Income tax in the consolidatedincome statement
(a) Income tax in the consolidatedincome statement represents:
2007 2006$’000 $’000
Current tax– Hong Kong Profits Tax
Provision for the year 32,831 36,992Over-provision in respect
of prior years (539) (145)
32,292 36,847
Current tax– Outside Hong Kong
Provision for the year 6,199 3,920Under-provision in respect
of prior years 50 396
6,249 4,316
Deferred tax
Origination and reversal oftemporary differences 2,594 (785)
41,135 40,378
The provision for Hong Kong Profits Tax is calculated at17.5% (2006: 17.5%) of the estimated assessable profitsfor the year. Taxation for subsidiaries outside Hong Kongis charged at the appropriate current rates of taxationruling in the relevant tax jurisdictions.
On 16th March, 2007, the National People’s Congresspassed the China Corporate Income Tax Law which willbe effective from 1st January, 2008. The new tax law hasno impact on the Group’s deferred tax assets and deferredtax liabilities as at 31st March, 2007.
6
(a)
17.5% 17.5%

90
(Expressed in Hong Kong dollars unless otherwise indicated)
Vitasoy International Holdings Ltd. Annual Report 2006/07
Notes to the Financial Statements
6 Income tax in the consolidatedincome statement (continued)
(b) Reconci l iat ion between tax expense andaccounting profit at applicable tax rates:
2007 2006$’000 $’000
Profit before taxation 242,447 225,403
Notional tax on profit beforetaxation, calculatedat the rates applicable toprofits in the taxjurisdictions concerned 37,568 36,170
Tax effect of non-deductibleexpenses 1,846 1,767
Tax effect of non-taxablerevenue (5,059) (1,814)
Tax effect of unused taxlosses not recognised 18,807 4,004
Tax effect of recognising taxlosses and deductibletemporary differences notpreviously recognised (11,538) –
(Over)/under-provisionin prior years (489) 251
Actual tax expense 41,135 40,378
6
(b)
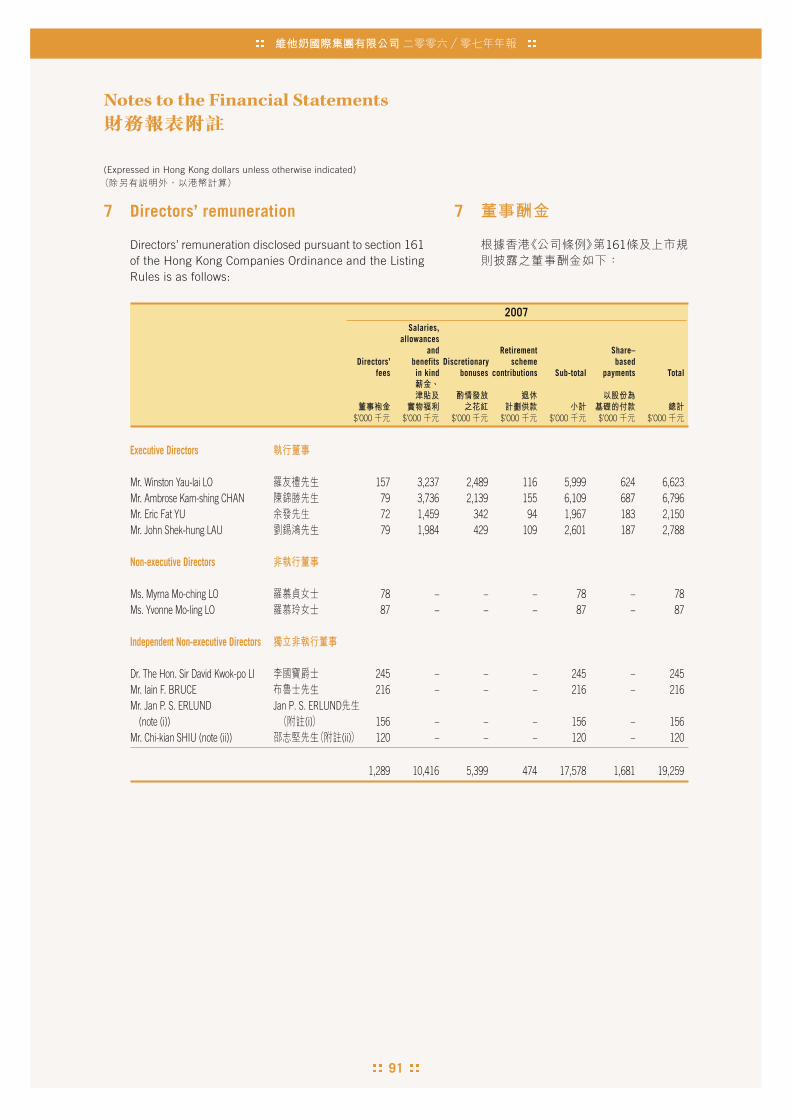
91
Notes to the Financial Statements
(Expressed in Hong Kong dollars unless otherwise indicated)
7 Directors’ remuneration
Directors’ remuneration disclosed pursuant to section 161of the Hong Kong Companies Ordinance and the ListingRules is as follows:
2007Salaries,
allowancesand Retirement Share–
Directors’ benefits Discretionary scheme basedfees in kind bonuses contributions Sub-total payments Total
$’000 $’000 $’000 $’000 $’000 $’000 $’000
Executive Directors
Mr. Winston Yau-lai LO 157 3,237 2,489 116 5,999 624 6,623Mr. Ambrose Kam-shing CHAN 79 3,736 2,139 155 6,109 687 6,796Mr. Eric Fat YU 72 1,459 342 94 1,967 183 2,150Mr. John Shek-hung LAU 79 1,984 429 109 2,601 187 2,788
Non-executive Directors
Ms. Myrna Mo-ching LO 78 – – – 78 – 78Ms. Yvonne Mo-ling LO 87 – – – 87 – 87
Independent Non-executive Directors
Dr. The Hon. Sir David Kwok-po LI 245 – – – 245 – 245Mr. Iain F. BRUCE 216 – – – 216 – 216Mr. Jan P. S. ERLUND Jan P. S. ERLUND
(note (i)) (i) 156 – – – 156 – 156Mr. Chi-kian SHIU (note (ii)) (ii) 120 – – – 120 – 120
1,289 10,416 5,399 474 17,578 1,681 19,259
7
161

92
(Expressed in Hong Kong dollars unless otherwise indicated)
Vitasoy International Holdings Ltd. Annual Report 2006/07
Notes to the Financial Statements
7 Directors’ remuneration (continued)
Directors’ remuneration disclosed pursuant to section 161of the Hong Kong Companies Ordinance and the ListingRules is as follows: (continued)
2006Salaries,
allowances Retirement Share–Directors’ and benefits Discretionary scheme based
fees in kind bonuses contributions Sub-total payments Total
$’000 $’000 $’000 $’000 $’000 $’000 $’000
Executive Directors
Mr. Winston Yau-lai LO 153 3,598 2,712 126 6,589 636 7,225Mr. Ambrose Kam-shing CHAN 54 3,143 1,005 177 4,379 537 4,916Mr. Eric Fat YU 76 1,434 308 92 1,910 177 2,087Mr. John Shek-hung LAU 76 1,898 387 107 2,468 187 2,655Mr. Fransis Ming-yin KONG
(note (iii)) (iii) 2 556 936 38 1,532 – 1,532
Non-executive Directors
Ms. Myrna Mo-ching LO 84 – – – 84 – 84Ms. Yvonne Mo-ling LO 84 – – – 84 – 84
Independent Non-executive Directors
Dr. The Hon. Sir David Kwok-po LI 248 – – – 248 – 248Mr. Iain F. BRUCE 255 – – – 255 – 255Mr. Chi-kian SHIU (note (ii)) (ii) 250 – – – 250 – 250
1,282 10,629 5,348 540 17,799 1,537 19,336
Share-based payments represent the estimated value ofshare options granted to the Directors under theCompany’s share option scheme. The value of these shareoptions is measured according to the Group’s accountingpolicies for share-based payment transactions as set outin note 1(n)(iv).
The details of these benefits in kind, including theprincipal terms and number of options granted, aredisclosed under the paragraph “Share option scheme”in the Report of the Directors and note 26.
Notes:
(i) Mr. Jan P. S. ERLUND was appointed as an IndependentNon-executive Director on 6th July, 2006.
(ii) Mr. Chi-kian SHIU retired as an Independent Non-executive Director on 11th September, 2006.
(iii) Mr. Fransis Ming-yin KONG resigned as an ExecutiveDirector on 18th April, 2005.
7
161
1(n)(iv)
26
(i) Jan P. S. ERLUND
(ii)
(iii)
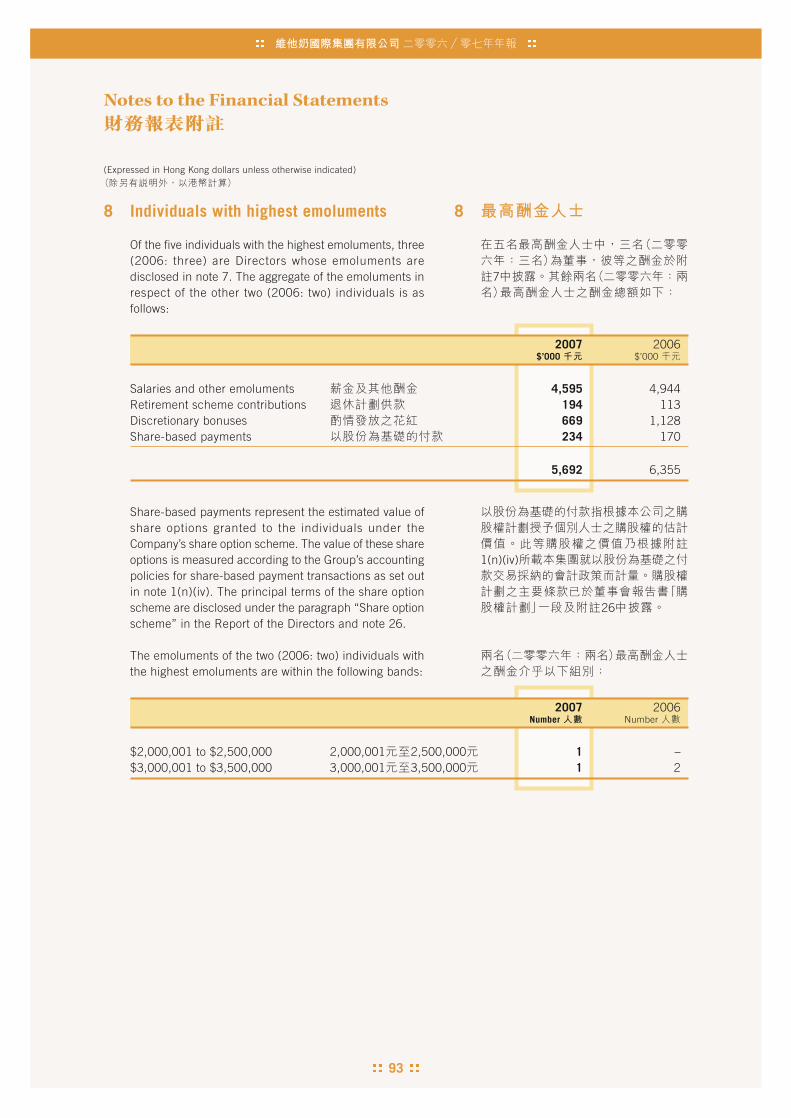
93
Notes to the Financial Statements
(Expressed in Hong Kong dollars unless otherwise indicated)
8 Individuals with highest emoluments
Of the five individuals with the highest emoluments, three(2006: three) are Directors whose emoluments aredisclosed in note 7. The aggregate of the emoluments inrespect of the other two (2006: two) individuals is asfollows:
2007 2006$’000 $’000
Salaries and other emoluments 4,595 4,944Retirement scheme contributions 194 113Discretionary bonuses 669 1,128Share-based payments 234 170
5,692 6,355
Share-based payments represent the estimated value ofshare options granted to the individuals under theCompany’s share option scheme. The value of these shareoptions is measured according to the Group’s accountingpolicies for share-based payment transactions as set outin note 1(n)(iv). The principal terms of the share optionscheme are disclosed under the paragraph “Share optionscheme” in the Report of the Directors and note 26.
The emoluments of the two (2006: two) individuals withthe highest emoluments are within the following bands:
2007 2006Number Number
$2,000,001 to $2,500,000 2,000,001 2,500,000 1 –$3,000,001 to $3,500,000 3,000,001 3,500,000 1 2
8
7
1(n)(iv)
26

94
(Expressed in Hong Kong dollars unless otherwise indicated)
Vitasoy International Holdings Ltd. Annual Report 2006/07
Notes to the Financial Statements
9 Profit attributable to equity shareholdersof the Company
The consolidated profit attributable to equity shareholdersof the Company includes a profit of $124,084,000 (2006:$134,963,000) which has been dealt with in the financialstatements of the Company.
Reconciliation of the above amount to the Company’sprofit for the year:
2007 2006$’000 $’000
Amount of consolidated profitattributable to equity shareholdersdealt with in the Company’sfinancial statements 124,084 134,963
Final dividends from subsidiariesattributable to the profits of theprevious financial year, approvedand paid during the year 13,783 5,774
Company’s profit for the year(note 25(b)) 25(b) 137,867 140,737
10 Dividends
(a) Dividends payable to equity shareholders of theCompany attributable to the year
2007 2006$’000 $’000
Interim dividend declared andpaid of 2.8 cents per ordinary 2.8share (2006: 2.8 cents perordinary share) (note 25) 2.8 25 28,197 28,091
Final dividend proposed afterthe balance sheet date of6.7 cents per ordinary 6.7share (2006: 6.7 cents per ordinary share) 6.7 67,669 67,370
Special dividend proposed afterthe balance sheet date of10.0 cents per ordinary 10.0share (2006: 10.0 centsper ordinary share) 10.0 100,999 100,552
196,865 196,013
The final and special dividends proposed after thebalance sheet date have not been recognised as liabilitiesat the balance sheet date.
9
124,084,000134,963,000
10
(a)

95
Notes to the Financial Statements
(Expressed in Hong Kong dollars unless otherwise indicated)
10
(b)
10 Dividends (continued)
(b) Dividends payable to equity shareholders of theCompany attributable to the previous financial year,approved and paid during the year
2007 2006$’000 $’000
Final dividend in respect ofthe previous financial year,approved and paid duringthe year, of 6.7 cents per 6.7ordinary share (2006: 5.7 cents per ordinary share) 5.7(note 25) 25 67,404 57,139
Special dividend in respect ofthe previous financial year,approved and paid duringthe year, of 10.0 cents per 10.0ordinary share (2006: 10.0cents per ordinary share) 10.0(note 25) 25 100,603 100,244
168,007 157,383
11 Earnings per share
(a) Basic earnings per share
The calculation of basic earnings per share is based onthe profit attributable to equity shareholders of theCompany of $173,901,000 (2006: $172,076,000) andthe weighted average number of 1,006,101,000 ordinaryshares (2006: 1,001,624,000 ordinary shares) in issueduring the year, calculated as follows:
Weighted average number of ordinary shares
2007 2006Number of Number of
shares shares
’000 ’000
Issued ordinary shares at 1st April(note 25(c)) 25(c) 1,003,288 993,928
Effect of share options exercised 2,813 7,696
Weighted average number ofordinary shares for the year(note (b)) (b) 1,006,101 1,001,624
11
(a)
173,901,000172,076,000
1,006,101,0001,001,624,000

96
(Expressed in Hong Kong dollars unless otherwise indicated)
Vitasoy International Holdings Ltd. Annual Report 2006/07
Notes to the Financial Statements
11 Earnings per share (continued)
(b) Diluted earnings per share
The calculation of diluted earnings per share is based onthe profit attributable to equity shareholders of theCompany of $173,901,000 (2006: $172,076,000) andthe weighted average number of 1,012,797,000 ordinaryshares (2006: 1,008,726,000 ordinary shares) afteradjusting for the effects of all dilutive potential ordinaryshares, calculated as follows:
Weighted average number of ordinary shares (diluted)
2007 2006Number of Number of
shares shares
’000 ’000
Weighted average number ofordinary shares for the year(note (a)) (a) 1,006,101 1,001,624
Effect of deemed issue ofordinary shares underthe Company’s share optionscheme for nil consideration 6,696 7,102
Weighted average number ofordinary shares (diluted)for the year 1,012,797 1,008,726
11
(b)
173,901,000172,076,000
1,012,797,0001,008,726,000

97
Notes to the Financial Statements
(Expressed in Hong Kong dollars unless otherwise indicated)
12 Segment reporting
Segment information is presented in respect of theGroup’s geographical segments. Information relating togeographical segments based on the location of assetsis chosen because this is in line with the Group’s internalmanagement information reporting system.
No business segment analysis of the Group is presentedas all the Group’s turnover and trading result aregenerated from the manufacture and sale of food andbeverages.
Australia andHong Kong North America Mainland China New Zealand Unallocated Consolidated
2007 2006 2007 2006 2007 2006 2007 2006 2007 2006 2007 2006$’000 $’000 $’000 $’000 $’000 $’000 $’000 $’000 $’000 $’000 $’000 $’000
Revenue from externalcustomers 1,474,331 1,418,752 378,689 385,713 588,389 509,078 252,052 206,866 – – 2,693,461 2,520,409
Other revenue fromexternal parties 5,955 6,120 54 289 28,632 32,571 – – 17,099 12,527 51,740 51,507
Total revenue 1,480,286 1,424,872 378,743 386,002 617,021 541,649 252,052 206,866 17,099 12,527 2,745,201 2,571,916
Segment result 221,620 213,148 (49,357) (19,583) 76,766 55,907 40,337 26,495 289,366 275,967Unallocated operating
income and expenses (38,851) (42,192)
Profit from operations 250,515 233,775Finance costs (8,068) (8,372)Income tax (41,135) (40,378)
Profit for the year 201,312 185,025
Depreciation andamortisation for the year 47,722 48,701 15,131 18,949 31,252 32,942 15,767 10,821 109,872 111,413
(Decrease)/increase inimpairment losses ontrade and otherreceivables (1,168) (849) 927 – (206) 33 451 – 4 (816)
12
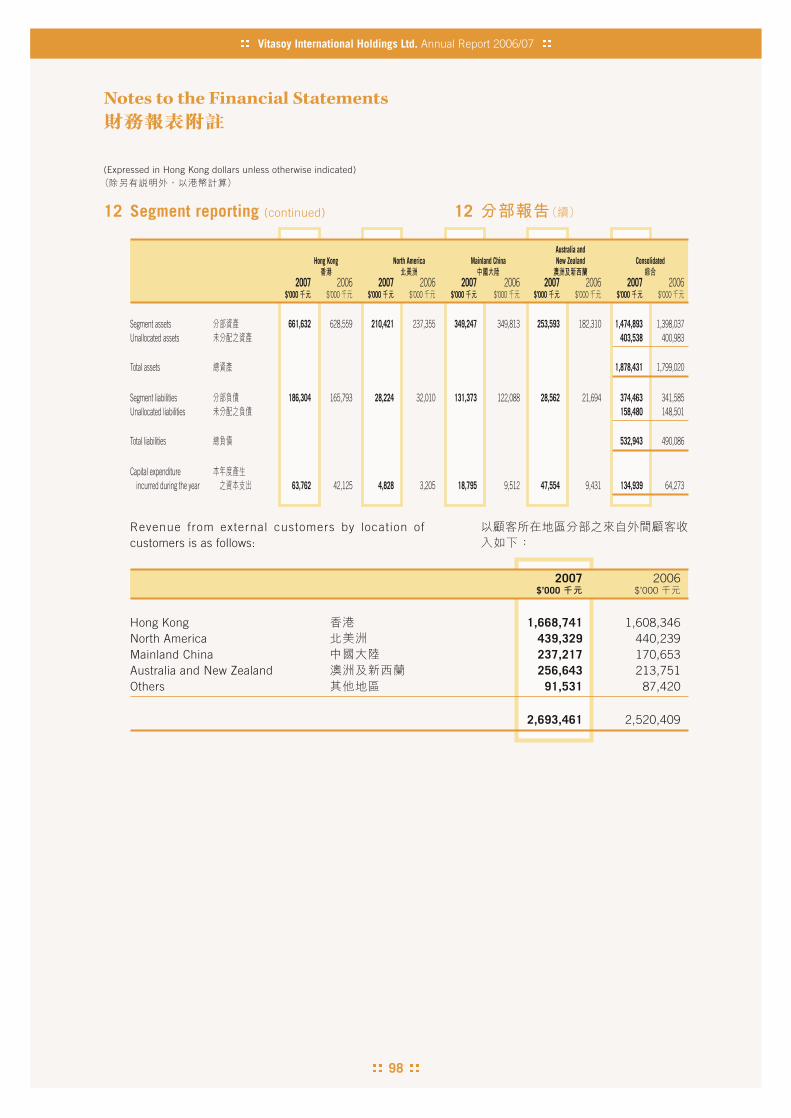
98
(Expressed in Hong Kong dollars unless otherwise indicated)
Vitasoy International Holdings Ltd. Annual Report 2006/07
Notes to the Financial Statements
12 Segment reporting (continued)
Australia andHong Kong North America Mainland China New Zealand Consolidated
2007 2006 2007 2006 2007 2006 2007 2006 2007 2006$’000 $’000 $’000 $’000 $’000 $’000 $’000 $’000 $’000 $’000
Segment assets 661,632 628,559 210,421 237,355 349,247 349,813 253,593 182,310 1,474,893 1,398,037Unallocated assets 403,538 400,983
Total assets 1,878,431 1,799,020
Segment liabilities 186,304 165,793 28,224 32,010 131,373 122,088 28,562 21,694 374,463 341,585Unallocated liabilities 158,480 148,501
Total liabilities 532,943 490,086
Capital expenditureincurred during the year 63,762 42,125 4,828 3,205 18,795 9,512 47,554 9,431 134,939 64,273
Revenue from external customers by location ofcustomers is as follows:
2007 2006$’000 $’000
Hong Kong 1,668,741 1,608,346North America 439,329 440,239Mainland China 237,217 170,653Australia and New Zealand 256,643 213,751Others 91,531 87,420
2,693,461 2,520,409
12

99
Notes to the Financial Statements
(Expressed in Hong Kong dollars unless otherwise indicated)
13 Fixed assets
(a) The Group
Interests inProperty, plant and equipment leasehold
land heldLand and Factory Fixtures, for own usebuildings machinery furniture under Total
held for and and office Motor Investment operating fixedown use equipment equipment vehicles Sub-total property leases assets
$’000 $’000 $’000 $’000 $’000 $’000 $’000 $’000
Cost:
At 1st April, 2005 533,708 920,288 132,292 63,860 1,650,148 22,698 7,123 1,679,969
Exchange adjustments (2,874) 1,082 308 216 (1,268) – 214 (1,054)
Additions 3,502 38,215 13,459 9,097 64,273 – – 64,273
Disposals (297) (19,329) (6,051) (3,807) (29,484) – – (29,484)
At 31st March, 2006 534,039 940,256 140,008 69,366 1,683,669 22,698 7,337 1,713,704
Accumulated amortisation
and depreciation:
At 1st April, 2005 145,616 596,813 99,765 53,613 895,807 11,767 1,704 909,278
Exchange adjustments 516 3,428 266 159 4,369 – 53 4,422
Charge for the year 18,468 73,587 14,928 3,688 110,671 526 216 111,413
Written back on disposals (158) (18,474) (5,690) (3,719) (28,041) – – (28,041)
At 31st March, 2006 164,442 655,354 109,269 53,741 982,806 12,293 1,973 997,072
Net book value:
At 31st March, 2006 369,597 284,902 30,739 15,625 700,863 10,405 5,364 716,632
13
(a)
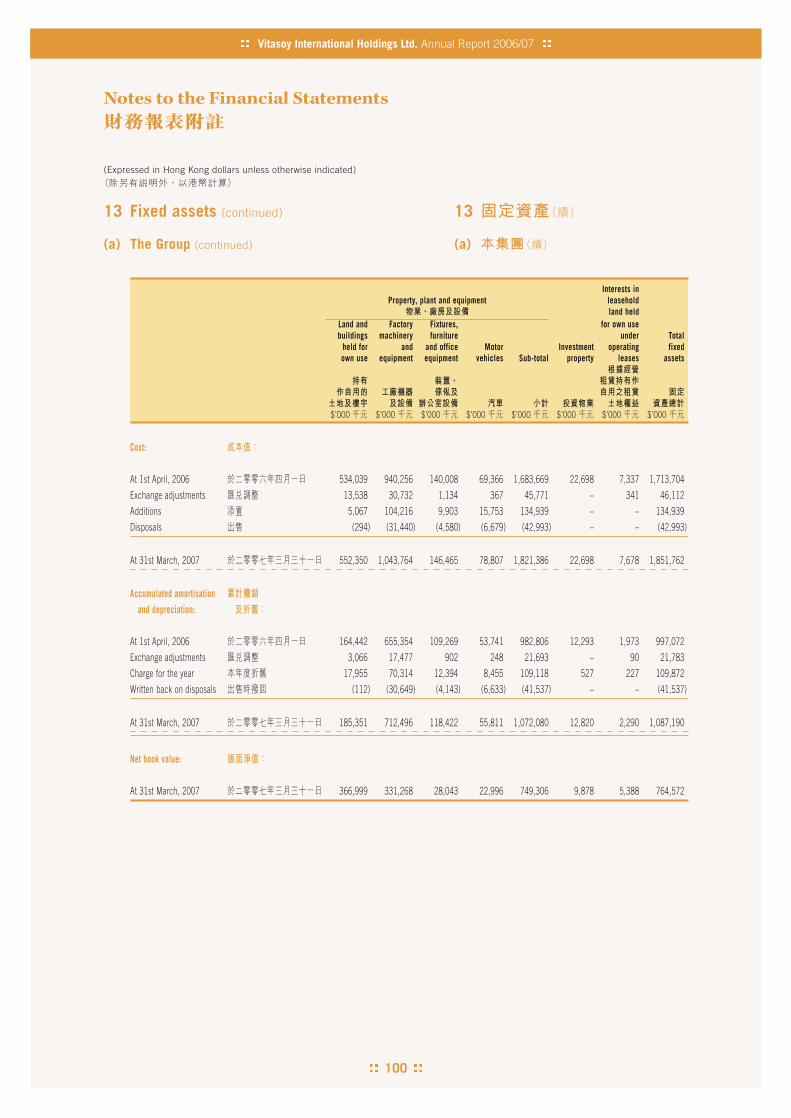
100
(Expressed in Hong Kong dollars unless otherwise indicated)
Vitasoy International Holdings Ltd. Annual Report 2006/07
Notes to the Financial Statements
13 Fixed assets (continued)
(a) The Group (continued)
Interests inProperty, plant and equipment leasehold
land heldLand and Factory Fixtures, for own usebuildings machinery furniture under Total
held for and and office Motor Investment operating fixedown use equipment equipment vehicles Sub-total property leases assets
$’000 $’000 $’000 $’000 $’000 $’000 $’000 $’000
Cost:
At 1st April, 2006 534,039 940,256 140,008 69,366 1,683,669 22,698 7,337 1,713,704
Exchange adjustments 13,538 30,732 1,134 367 45,771 – 341 46,112
Additions 5,067 104,216 9,903 15,753 134,939 – – 134,939
Disposals (294) (31,440) (4,580) (6,679) (42,993) – – (42,993)
At 31st March, 2007 552,350 1,043,764 146,465 78,807 1,821,386 22,698 7,678 1,851,762
Accumulated amortisation
and depreciation:
At 1st April, 2006 164,442 655,354 109,269 53,741 982,806 12,293 1,973 997,072
Exchange adjustments 3,066 17,477 902 248 21,693 – 90 21,783
Charge for the year 17,955 70,314 12,394 8,455 109,118 527 227 109,872
Written back on disposals (112) (30,649) (4,143) (6,633) (41,537) – – (41,537)
At 31st March, 2007 185,351 712,496 118,422 55,811 1,072,080 12,820 2,290 1,087,190
Net book value:
At 31st March, 2007 366,999 331,268 28,043 22,996 749,306 9,878 5,388 764,572
13
(a)
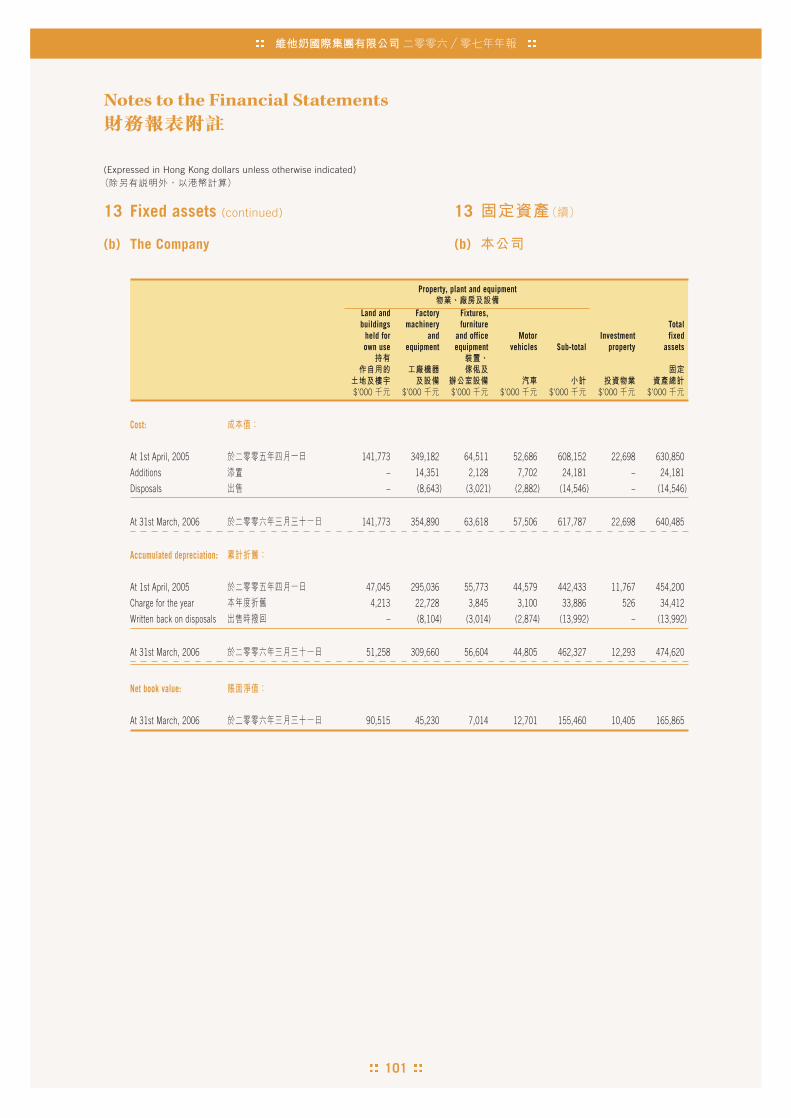
101
Notes to the Financial Statements
(Expressed in Hong Kong dollars unless otherwise indicated)
13 Fixed assets (continued)
(b) The Company
Property, plant and equipment
Land and Factory Fixtures,buildings machinery furniture Total
held for and and office Motor Investment fixedown use equipment equipment vehicles Sub-total property assets
$’000 $’000 $’000 $’000 $’000 $’000 $’000
Cost:
At 1st April, 2005 141,773 349,182 64,511 52,686 608,152 22,698 630,850
Additions – 14,351 2,128 7,702 24,181 – 24,181
Disposals – (8,643) (3,021) (2,882) (14,546) – (14,546)
At 31st March, 2006 141,773 354,890 63,618 57,506 617,787 22,698 640,485
Accumulated depreciation:
At 1st April, 2005 47,045 295,036 55,773 44,579 442,433 11,767 454,200
Charge for the year 4,213 22,728 3,845 3,100 33,886 526 34,412
Written back on disposals – (8,104) (3,014) (2,874) (13,992) – (13,992)
At 31st March, 2006 51,258 309,660 56,604 44,805 462,327 12,293 474,620
Net book value:
At 31st March, 2006 90,515 45,230 7,014 12,701 155,460 10,405 165,865
13
(b)

102
(Expressed in Hong Kong dollars unless otherwise indicated)
Vitasoy International Holdings Ltd. Annual Report 2006/07
Notes to the Financial Statements
13 Fixed assets (continued)
(b) The Company (continued)
Property, plant and equipment
Land and Factory Fixtures,buildings machinery furniture Total
held for and and office Motor Investment fixedown use equipment equipment vehicles Sub-total property assets
$’000 $’000 $’000 $’000 $’000 $’000 $’000
Cost:
At 1st April, 2006 141,773 354,890 63,618 57,506 617,787 22,698 640,485
Additions – 41,122 2,825 11,094 55,041 – 55,041
Disposals – (24,993 ) (845 ) (6,793 ) (32,631 ) – (32,631 )
At 31st March, 2007 141,773 371,019 65,598 61,807 640,197 22,698 662,895
Accumulated depreciation:
At 1st April, 2006 51,258 309,660 56,604 44,805 462,327 12,293 474,620
Charge for the year 4,214 19,581 3,008 4,951 31,754 527 32,281
Written back on disposals – (24,906 ) (844 ) (6,793 ) (32,543 ) – (32,543 )
At 31st March, 2007 55,472 304,335 58,768 42,963 461,538 12,820 474,358
Net book value:
At 31st March, 2007 86,301 66,684 6,830 18,844 178,659 9,878 188,537
13
(b)

103
Notes to the Financial Statements
(Expressed in Hong Kong dollars unless otherwise indicated)
13 Fixed assets (continued)
(c) The analysis of net book value of properties isas follows:
The Group The Company
2007 2006 2007 2006$’000 $’000 $’000 $’000
In Hong Kong– medium-term leases 211,518 220,430 96,179 100,920Outside Hong Kong– freehold 114,701 106,642 – –– medium-term leases 33,348 34,397 – –– short-term leases 22,698 23,897 – –
382,265 385,366 96,179 100,920
Representing:
Land and buildings heldfor own use 366,999 369,597 86,301 90,515
Investment property 9,878 10,405 9,878 10,405Interests in leasehold land
held for own use underoperating leases 5,388 5,364 – –
382,265 385,366 96,179 100,920
(d) Fixed assets held under finance leases
In addition to the leasehold land classified as being heldunder finance leases, the Group and the Company havefactory machinery and equipment held under financeleases expiring from 1 to 10 years. None of the leasesincludes contingent rentals.
During the year, additions to the factory machinery andequipment of the Group and the Company financed byfinance leases amounted to $33,710,000 (2006:$Nil) and$6,573,000 (2006: $Nil) respectively.
At the balance sheet date, the net book value of thefactory machinery and equipment held under financeleases of the Group and the Company amounted to$35,292,000 (2006: $6,466,000) and $6,573,000(2006: $Nil) respectively. The Group’s and the Company’sobligations under finance leases are secured by thelessor’s charge over the leased assets.
13
(c)
(d)
33,710,0006,573,000
35,292,0006,466,000 6,573,000
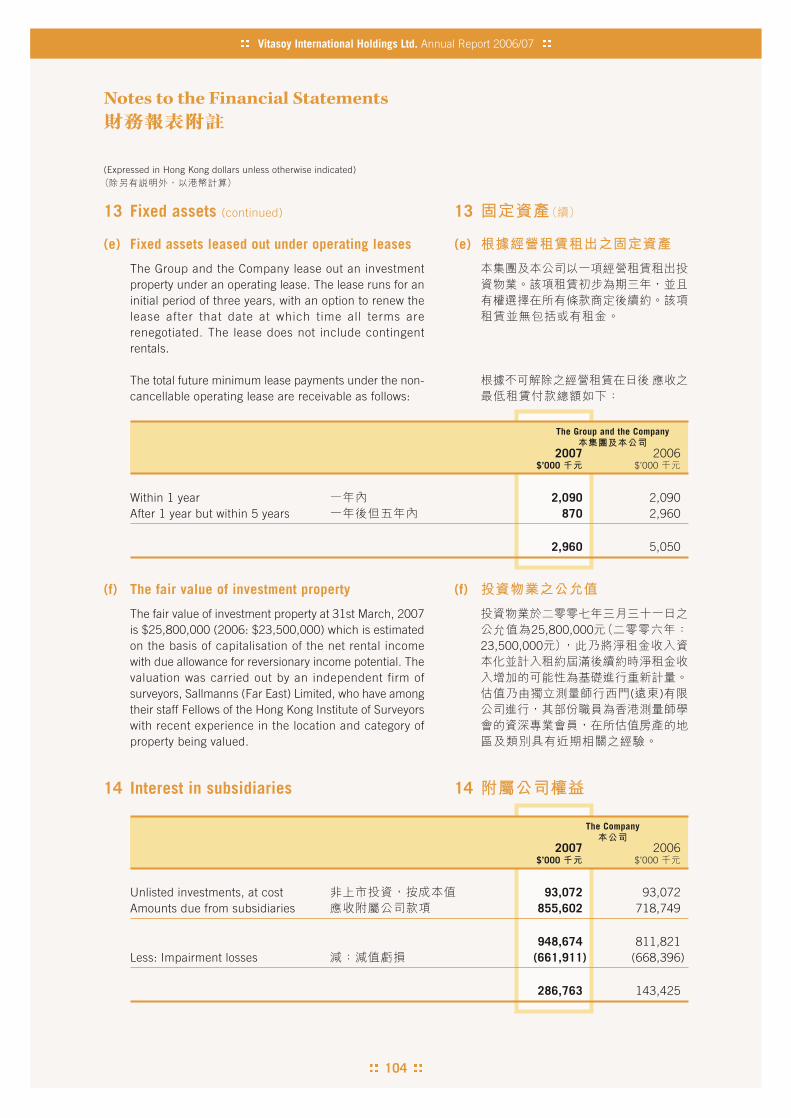
104
(Expressed in Hong Kong dollars unless otherwise indicated)
Vitasoy International Holdings Ltd. Annual Report 2006/07
Notes to the Financial Statements
13 Fixed assets (continued)
(e) Fixed assets leased out under operating leases
The Group and the Company lease out an investmentproperty under an operating lease. The lease runs for aninitial period of three years, with an option to renew thelease after that date at which time all terms arerenegotiated. The lease does not include contingentrentals.
The total future minimum lease payments under the non-cancellable operating lease are receivable as follows:
The Group and the Company
2007 2006$’000 $’000
Within 1 year 2,090 2,090After 1 year but within 5 years 870 2,960
2,960 5,050
(f) The fair value of investment property
The fair value of investment property at 31st March, 2007is $25,800,000 (2006: $23,500,000) which is estimatedon the basis of capitalisation of the net rental incomewith due allowance for reversionary income potential. Thevaluation was carried out by an independent firm ofsurveyors, Sallmanns (Far East) Limited, who have amongtheir staff Fellows of the Hong Kong Institute of Surveyorswith recent experience in the location and category ofproperty being valued.
14 Interest in subsidiaries
The Company
2007 2006$’000 $’000
Unlisted investments, at cost 93,072 93,072Amounts due from subsidiaries 855,602 718,749
948,674 811,821Less: Impairment losses (661,911) (668,396)
286,763 143,425
13
(e)
(f)
25,800,00023,500,000
( )
14

105
Notes to the Financial Statements
(Expressed in Hong Kong dollars unless otherwise indicated)
14 Interest in subsidiaries (continued)
At 31st March, 2007 and 2006, amounts due fromsubsidiaries are unsecured, interest-free and have nofixed terms of repayment. The entire balance is expectedto be recovered after more than one year.
Impairment losses on interest in subsidiaries representthe write down of the carrying values of the investmentcost and receivables from certain subsidiaries to theirrecoverable amounts.
The following l ist contains the particulars of thesubsidiaries of the Group. The class of shares held isordinary unless otherwise stated.
All of these are controlled subsidiaries as defined undernote 1(c) and have been consolidated into the Group’sfinancial statements.
Place of Particulars ofincorporation issued and Proportion of Principal
Name of company and operation paid-up capital ownership interest activities
held by the held by aCompany subsidiary
% %
Vitasoy Holdings Netherlands US$6,100 100 – Investment holdingN.V. Antilles 6,100
Vitasoy International Netherlands EUR22,500 – 100 Investment holdingB.V. 22,500
Vitasoy (UK) Investments United Kingdom GBP2 100 – Investment holdingCompany Limited 2
Vitasoy USA Inc. United States Common stock: – 100 Manufacture andof America US$12,061,000 sale of soy related
products12,061,000
Convertible series A – 100preferred stock:US$38,400,000
A38,400,000
14
1(c)
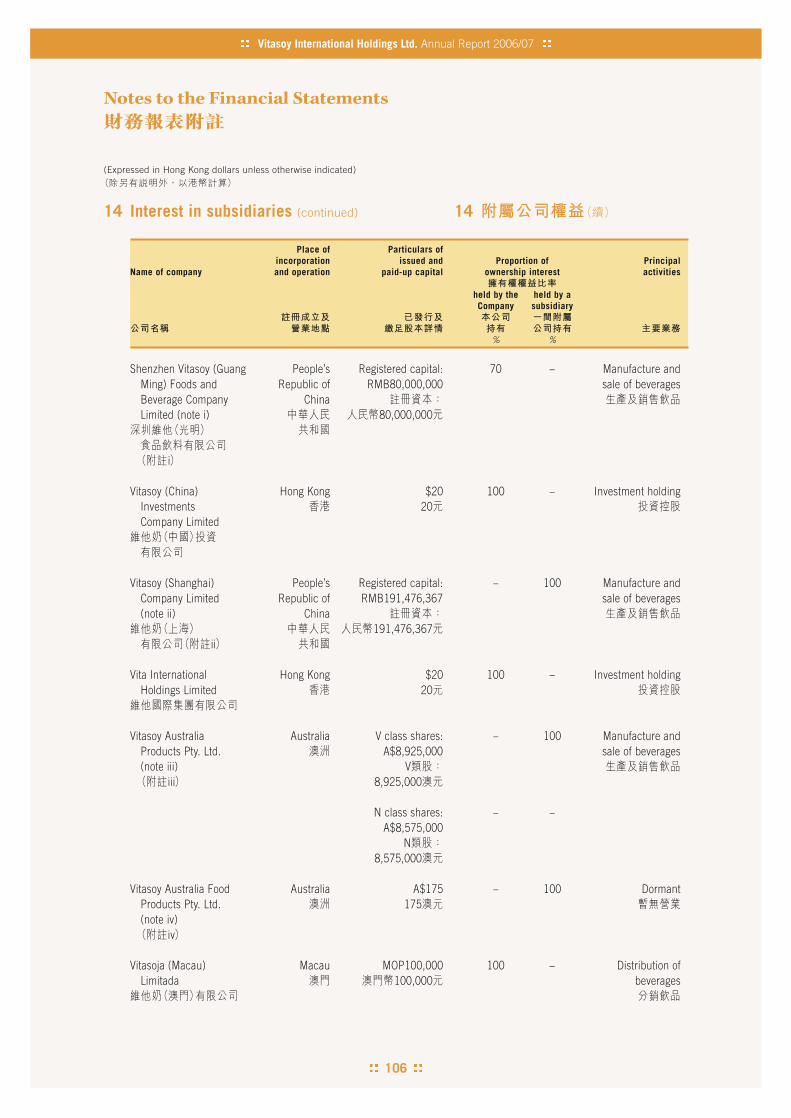
106
(Expressed in Hong Kong dollars unless otherwise indicated)
Vitasoy International Holdings Ltd. Annual Report 2006/07
Notes to the Financial Statements
14 Interest in subsidiaries (continued)
Place of Particulars ofincorporation issued and Proportion of Principal
Name of company and operation paid-up capital ownership interest activities
held by the held by aCompany subsidiary
% %
Shenzhen Vitasoy (Guang People’s Registered capital: 70 – Manufacture andMing) Foods and Republic of RMB80,000,000 sale of beveragesBeverage Company ChinaLimited (note i) 80,000,000
i
Vitasoy (China) Hong Kong $20 100 – Investment holdingInvestments 20Company Limited
Vitasoy (Shanghai) People’s Registered capital: – 100 Manufacture andCompany Limited Republic of RMB191,476,367 sale of beverages(note ii) China
191,476,367ii
Vita International Hong Kong $20 100 – Investment holdingHoldings Limited 20
Vitasoy Australia Australia V class shares: – 100 Manufacture andProducts Pty. Ltd. A$8,925,000 sale of beverages(note iii) V
iii 8,925,000
N class shares: – –A$8,575,000
N8,575,000
Vitasoy Australia Food Australia A$175 – 100 DormantProducts Pty. Ltd. 175(note iv)
iv
Vitasoja (Macau) Macau MOP100,000 100 – Distribution ofLimitada 100,000 beverages
14
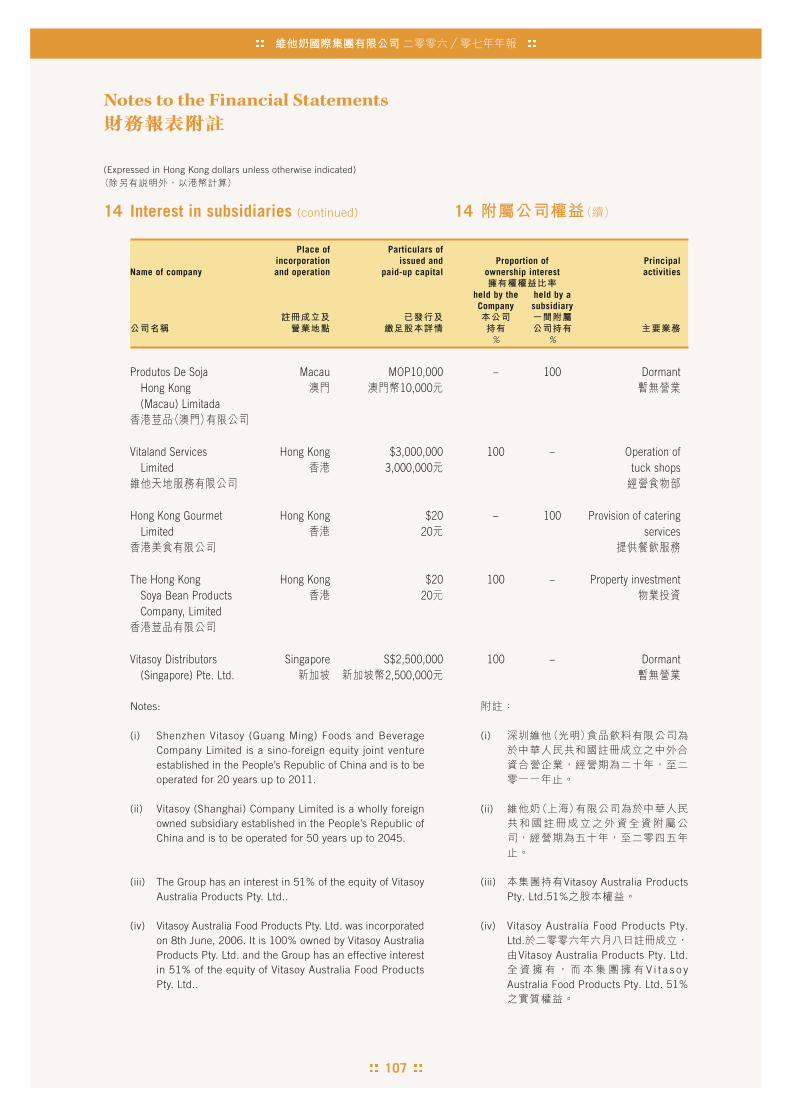
107
Notes to the Financial Statements
(Expressed in Hong Kong dollars unless otherwise indicated)
14 Interest in subsidiaries (continued)
Place of Particulars ofincorporation issued and Proportion of Principal
Name of company and operation paid-up capital ownership interest activities
held by the held by aCompany subsidiary
% %
Produtos De Soja Macau MOP10,000 – 100 DormantHong Kong 10,000(Macau) Limitada
Vitaland Services Hong Kong $3,000,000 100 – Operation ofLimited 3,000,000 tuck shops
Hong Kong Gourmet Hong Kong $20 – 100 Provision of cateringLimited 20 services
The Hong Kong Hong Kong $20 100 – Property investmentSoya Bean Products 20Company, Limited
Vitasoy Distributors Singapore S$2,500,000 100 – Dormant(Singapore) Pte. Ltd. 2,500,000
Notes:
(i) Shenzhen Vitasoy (Guang Ming) Foods and BeverageCompany Limited is a sino-foreign equity joint ventureestablished in the People’s Republic of China and is to beoperated for 20 years up to 2011.
(ii) Vitasoy (Shanghai) Company Limited is a wholly foreignowned subsidiary established in the People’s Republic ofChina and is to be operated for 50 years up to 2045.
(iii) The Group has an interest in 51% of the equity of VitasoyAustralia Products Pty. Ltd..
(iv) Vitasoy Australia Food Products Pty. Ltd. was incorporatedon 8th June, 2006. It is 100% owned by Vitasoy AustraliaProducts Pty. Ltd. and the Group has an effective interestin 51% of the equity of Vitasoy Australia Food ProductsPty. Ltd..
14
(i)
(ii)
(iii) Vitasoy Australia ProductsPty. Ltd.51%
(iv) Vitasoy Australia Food Products Pty.Ltd.
Vitasoy Australia Products Pty. Ltd.V i t a s o y
Australia Food Products Pty. Ltd. 51%
108
Vitasoy International Holdings Ltd. Annual Report 2006/07
(Expressed in Hong Kong dollars unless otherwise indicated)
Notes to the Financial Statements
15 Employee retirement benefits
The Group operates and participates in a number ofdefined contribution and defined benefit retirement plansin Hong Kong and outside Hong Kong.
(a) Defined contribution retirement plans
(i) The Group operates a def ined contr ibut ionretirement plan, Vitasoy International HoldingsLimited Staff Provident Fund, which is available forall eligible staff employed by the Group in Hong Kongand Macau before 1st August, 2000. The plan isfunded by contributions from employees and theGroup, both of which contribute sums representing5 – 7.5% of basic salaries. Forfeited contributionsare credited to members’ accounts in accordancewith the rules of the plan. The plan is administeredby trustees with the assets held separately fromthose of the Group. The employees are entitled to100% of the employer’s contributions after 10complete membership years, or at an increasingscale of between 50% to 90% after completion of 5to 9 membership years.
Staff employed by the Group in Hong Kong notjoining the defined contribution retirement plan arerequired to join the Group’s mandatory providentfund plan under the Hong Kong MandatoryProvident Fund Schemes Ordinance. The mandatoryprovident fund plan is a defined contributionretirement plan administered by an independentcorporate trustee. Under the plan, the Group andthe employees are each required to makecontributions to the plan at 5% of the employees’relevant income, subject to a cap of monthly relevantincome of $20,000. Contributions to the plan vestimmediately.
(ii) Employees of the subsidiaries in the People’sRepublic of China (the “PRC”) are members of thecentral pension scheme operated by the PRCgovernment. The Group is required to contribute acertain percentage of employees’ remuneration tothe central pension scheme to fund the benefits.The only obligation for the Group with respect tothe central pension scheme is the associatedrequired contribution under the central pensionscheme. Contributions to the plan vest immediately.
15
(a)
(i)
5 7.5%
105
950% 90%
20,000 5%
(ii)

109
(Expressed in Hong Kong dollars unless otherwise indicated)
Notes to the Financial Statements
15 Employee retirement benefits (continued)
(a) Defined contribution retirement plans (continued)
(iii) For employees in Australia, contributions are madeby the Group to a registered superannuation fundfor its employees, at 9% of the employees’ salaries.The assets of the scheme are held separately by anindependent administered fund. Contributions to theplan vest immediately.
(iv) Eligible employees in the United States of Americaare covered by a defined contribution retirementplan under section 401(k) of the Internal RevenueCode. The plan provides for voluntary employeecontributions, which represent a salary deferral forU.S. income tax purposes, of up to 100% of eachemployee’s annual salary, subject to a cap ofUS$15,000. The Group also contributes an annualamount in respect of each employee’s sel fcontribution. The amount of the Group’s annualcontribution is limited by the lesser of (i) 50% ofeach employee’s annual contribution, and (ii) 6%of each employee’s gross annual salary. Theemployees are entitled to 100% of the employer’scontributions after 4 complete years’ service, or atan increasing scale of between 25% to 75% aftercompletion of 1 to 3 years’ service.
Where there are employees who leave prior to vestingfully in the contributions, the forfeited employer’scontributions shall be used to reduce the futurecontributions of the employer. During the year,forfeited contributions of $51,000 (2006: $174,000)were utilised. At the balance sheet date, the totalamount of forfeited contributions which are availableto reduce the contributions payable in the futureyears was $72,000 (2006: $47,000).
15
(a)
(iii)9%
(iv) InternalRevenue Code 401(k)
100% 15,000
(i)50% (ii)
6%4
1 325%
75%
51,000174,000
72,00047,000
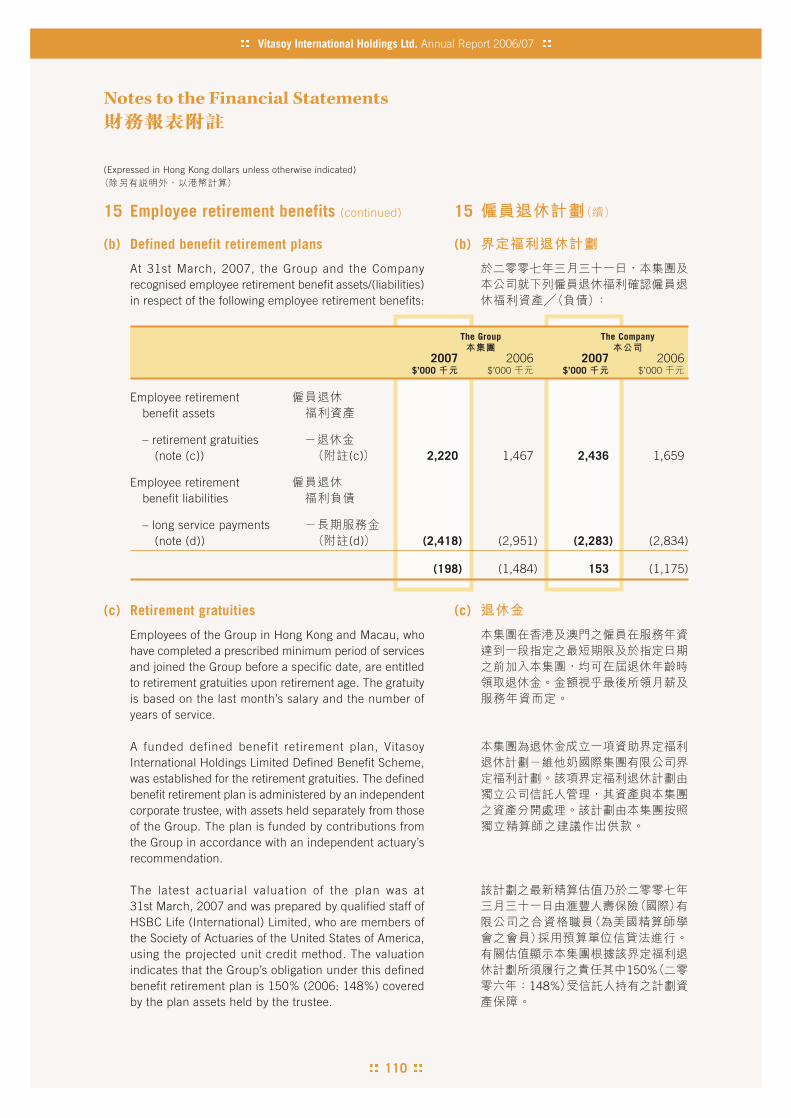
110
Vitasoy International Holdings Ltd. Annual Report 2006/07
(Expressed in Hong Kong dollars unless otherwise indicated)
Notes to the Financial Statements
15 Employee retirement benefits (continued)
(b) Defined benefit retirement plans
At 31st March, 2007, the Group and the Companyrecognised employee retirement benefit assets/(liabilities)in respect of the following employee retirement benefits:
The Group The Company
2007 2006 2007 2006$’000 $’000 $’000 $’000
Employee retirementbenefit assets
– retirement gratuities(note (c)) (c) 2,220 1,467 2,436 1,659
Employee retirementbenefit liabilities
– long service payments(note (d)) (d) (2,418) (2,951) (2,283) (2,834)
(198) (1,484) 153 (1,175)
(c) Retirement gratuities
Employees of the Group in Hong Kong and Macau, whohave completed a prescribed minimum period of servicesand joined the Group before a specific date, are entitledto retirement gratuities upon retirement age. The gratuityis based on the last month’s salary and the number ofyears of service.
A funded defined benefit retirement plan, VitasoyInternational Holdings Limited Defined Benefit Scheme,was established for the retirement gratuities. The definedbenefit retirement plan is administered by an independentcorporate trustee, with assets held separately from thoseof the Group. The plan is funded by contributions fromthe Group in accordance with an independent actuary’srecommendation.
The latest actuarial valuation of the plan was at31st March, 2007 and was prepared by qualified staff ofHSBC Life (International) Limited, who are members ofthe Society of Actuaries of the United States of America,using the projected unit credit method. The valuationindicates that the Group’s obligation under this definedbenefit retirement plan is 150% (2006: 148%) coveredby the plan assets held by the trustee.
15
(b)
(c)
150%148%
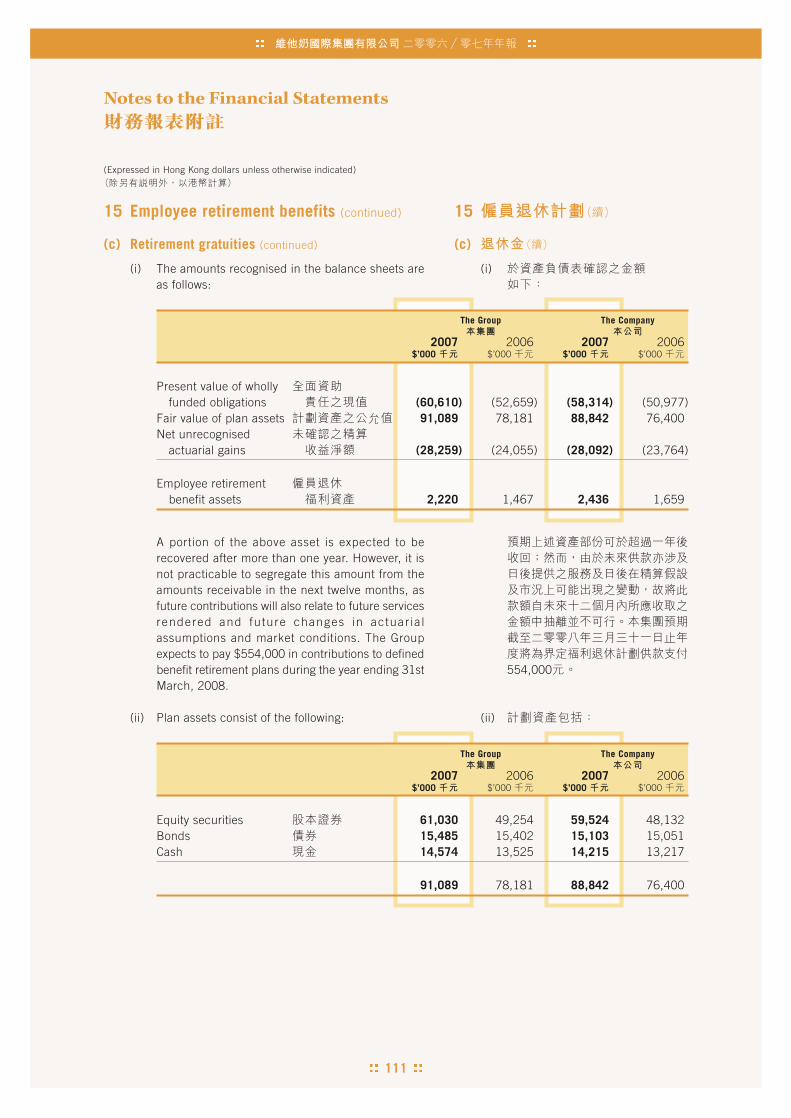
111
(Expressed in Hong Kong dollars unless otherwise indicated)
Notes to the Financial Statements
15 Employee retirement benefits (continued)
(c) Retirement gratuities (continued)
(i) The amounts recognised in the balance sheets areas follows:
The Group The Company
2007 2006 2007 2006$’000 $’000 $’000 $’000
Present value of whollyfunded obligations (60,610) (52,659) (58,314) (50,977)
Fair value of plan assets 91,089 78,181 88,842 76,400Net unrecognised
actuarial gains (28,259) (24,055) (28,092) (23,764)
Employee retirementbenefit assets 2,220 1,467 2,436 1,659
A portion of the above asset is expected to berecovered after more than one year. However, it isnot practicable to segregate this amount from theamounts receivable in the next twelve months, asfuture contributions will also relate to future servicesrendered and future changes in actuar ia lassumptions and market conditions. The Groupexpects to pay $554,000 in contributions to definedbenefit retirement plans during the year ending 31stMarch, 2008.
(ii) Plan assets consist of the following:
The Group The Company
2007 2006 2007 2006$’000 $’000 $’000 $’000
Equity securities 61,030 49,254 59,524 48,132Bonds 15,485 15,402 15,103 15,051Cash 14,574 13,525 14,215 13,217
91,089 78,181 88,842 76,400
15
(c)
(i)
554,000
(ii)
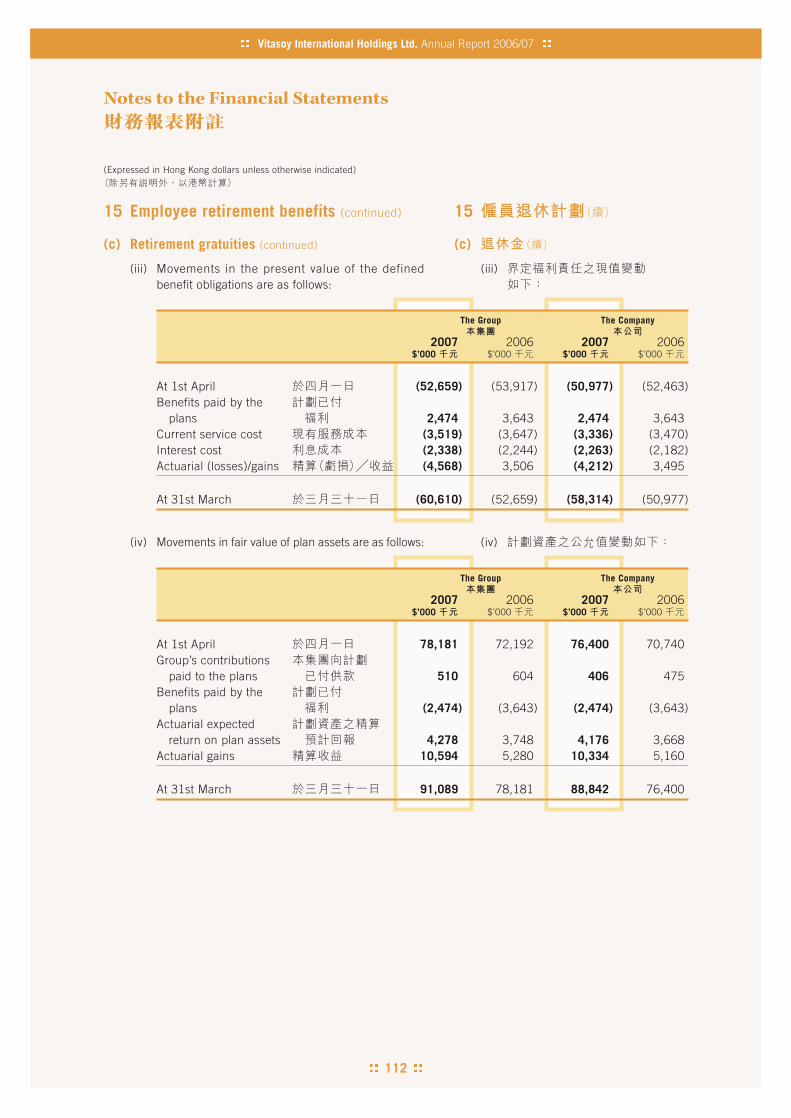
112
Vitasoy International Holdings Ltd. Annual Report 2006/07
(Expressed in Hong Kong dollars unless otherwise indicated)
Notes to the Financial Statements
15 Employee retirement benefits (continued)
(c) Retirement gratuities (continued)
(iii) Movements in the present value of the definedbenefit obligations are as follows:
The Group The Company
2007 2006 2007 2006$’000 $’000 $’000 $’000
At 1st April (52,659) (53,917) (50,977) (52,463)Benefits paid by the
plans 2,474 3,643 2,474 3,643Current service cost (3,519) (3,647) (3,336) (3,470)Interest cost (2,338) (2,244) (2,263) (2,182)Actuarial (losses)/gains (4,568) 3,506 (4,212) 3,495
At 31st March (60,610) (52,659) (58,314) (50,977)
(iv) Movements in fair value of plan assets are as follows:
The Group The Company
2007 2006 2007 2006$’000 $’000 $’000 $’000
At 1st April 78,181 72,192 76,400 70,740Group’s contributions
paid to the plans 510 604 406 475Benefits paid by the
plans (2,474) (3,643) (2,474) (3,643)Actuarial expected
return on plan assets 4,278 3,748 4,176 3,668Actuarial gains 10,594 5,280 10,334 5,160
At 31st March 91,089 78,181 88,842 76,400
15
(c)
(iii)
(iv)
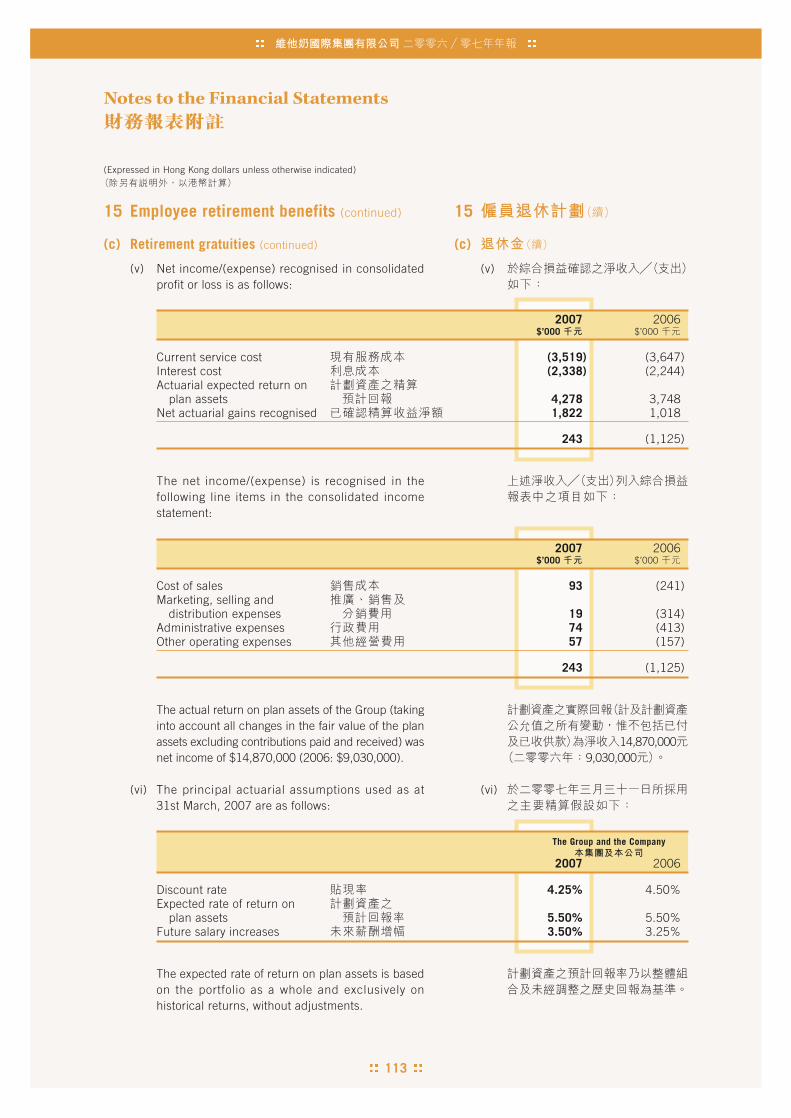
113
(Expressed in Hong Kong dollars unless otherwise indicated)
Notes to the Financial Statements
15 Employee retirement benefits (continued)
(c) Retirement gratuities (continued)
(v) Net income/(expense) recognised in consolidatedprofit or loss is as follows:
2007 2006$’000 $’000
Current service cost (3,519) (3,647)Interest cost (2,338) (2,244)Actuarial expected return on
plan assets 4,278 3,748Net actuarial gains recognised 1,822 1,018
243 (1,125)
2007 2006$’000 $’000
Cost of sales 93 (241)Marketing, selling and
distribution expenses 19 (314)Administrative expenses 74 (413)Other operating expenses 57 (157)
243 (1,125)
The net income/(expense) is recognised in thefollowing line items in the consolidated incomestatement:
The actual return on plan assets of the Group (takinginto account all changes in the fair value of the planassets excluding contributions paid and received) wasnet income of $14,870,000 (2006: $9,030,000).
(vi) The principal actuarial assumptions used as at31st March, 2007 are as follows:
The Group and the Company
2007 2006
Discount rate 4.25% 4.50%Expected rate of return on
plan assets 5.50% 5.50%Future salary increases 3.50% 3.25%
The expected rate of return on plan assets is basedon the portfolio as a whole and exclusively onhistorical returns, without adjustments.
15
(c)
(v)
14,870,0009,030,000
(vi)
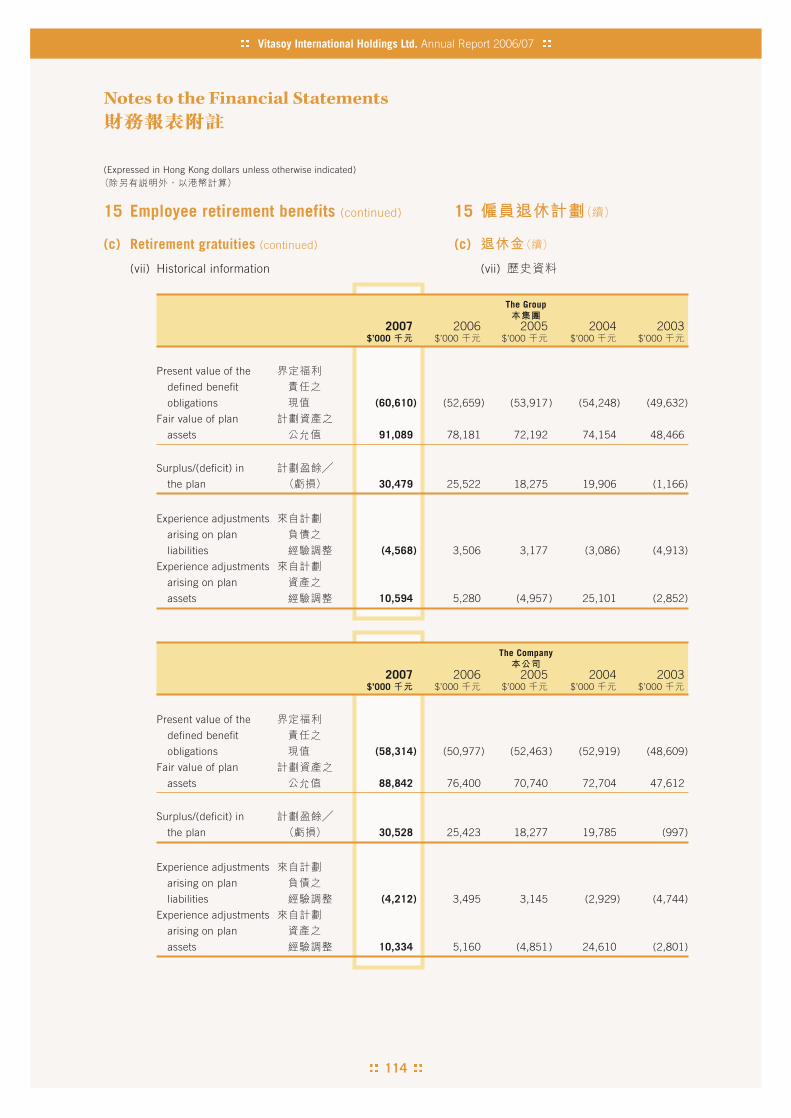
114
Vitasoy International Holdings Ltd. Annual Report 2006/07
(Expressed in Hong Kong dollars unless otherwise indicated)
Notes to the Financial Statements
15 Employee retirement benefits (continued)
(c) Retirement gratuities (continued)
(vii) Historical information
The Group
2007 2006 2005 2004 2003$’000 $’000 $’000 $’000 $’000
Present value of the
defined benefit
obligations (60,610) (52,659) (53,917) (54,248) (49,632)
Fair value of plan
assets 91,089 78,181 72,192 74,154 48,466
Surplus/(deficit) in
the plan 30,479 25,522 18,275 19,906 (1,166)
Experience adjustments
arising on plan
liabilities (4,568) 3,506 3,177 (3,086) (4,913)
Experience adjustments
arising on plan
assets 10,594 5,280 (4,957) 25,101 (2,852)
The Company
2007 2006 2005 2004 2003$’000 $’000 $’000 $’000 $’000
Present value of the
defined benefit
obligations (58,314) (50,977) (52,463) (52,919) (48,609)
Fair value of plan
assets 88,842 76,400 70,740 72,704 47,612
Surplus/(deficit) in
the plan 30,528 25,423 18,277 19,785 (997)
Experience adjustments
arising on plan
liabilities (4,212) 3,495 3,145 (2,929) (4,744)
Experience adjustments
arising on plan
assets 10,334 5,160 (4,851) 24,610 (2,801)
15
(c)
(vii)

115
(Expressed in Hong Kong dollars unless otherwise indicated)
Notes to the Financial Statements
15 Employee retirement benefits (continued)
(d) Long service payments
Under the Hong Kong Employment Ordinance, the Groupis obliged to make lump sum payments on cessation ofemployment in certain circumstances to certainemployees who have completed at least five years ofservice with the Group. The amount payable is dependenton the employees’ final salary and years of service, andis reduced by entitlements accrued under the Group’sretirement plans that are attributable to contributionsmade by the Group. The Group does not set aside anyassets to fund any remaining obligations.
An actuarial valuation of long service payments was alsocarried out at 31st March, 2007, by qualified staff ofHSBC Life (International) Limited, who are members ofthe Society of Actuaries of the United States of America,using the projected unit credit method.
(i) The amounts recognised in the balance sheets areas follows:
The Group The Company
2007 2006 2007 2006$’000 $’000 $’000 $’000
Present value ofunfunded obligations (121) (602) (10) (437)
Net unrecognisedactuarial gains (2,297) (2,349) (2,273) (2,397)
Employee retirementbenefits liabilities (2,418) (2,951) (2,283) (2,834)
15
(d)
(i)

116
Vitasoy International Holdings Ltd. Annual Report 2006/07
(Expressed in Hong Kong dollars unless otherwise indicated)
Notes to the Financial Statements
15 Employee retirement benefits (continued)
(d) Long service payments (continued)
(ii) Movements in the present value of the unfundedobligations are as follows:
The Group The Company
2007 2006 2007 2006$’000 $’000 $’000 $’000
At 1st April (602) (1,225) (437) (1,031)Benefits paid by the
plans 107 388 107 322Current service cost (13) (31) (8) (11)Interest cost (26) (50) (19) (42)Actuarial gains 413 316 347 325
At 31st March (121) (602) (10) (437)
(iii) Net income recognised in consolidated profit or lossis as follows:
2007 2006$’000 $’000
Current service cost (13) (31)Interest cost (26) (50)Net actuarial gains recognised 465 487
426 406
2007 2006$’000 $’000
Cost of sales 111 108Marketing, selling and
distribution expenses 92 76Administrative expenses 153 152Other operating expenses 70 70
426 406
The net income is recognised in the following lineitems in the consolidated income statement:
15
(d)
(ii)
(iii)

117
(Expressed in Hong Kong dollars unless otherwise indicated)
Notes to the Financial Statements
The Group The Company
2007 2006 2007 2006$’000 $’000 $’000 $’000
Provision for Hong KongProfits Tax for the year 32,831 36,992 29,633 33,620
Provisional Profits Taxpaid (28,127) (29,248) (24,975) (27,456)
4,704 7,744 4,658 6,164Taxation outside Hong Kong 2,657 2,817 – –
7,361 10,561 4,658 6,164
15 Employee retirement benefits (continued)
(d) Long service payments (continued)
(iv) The principal actuarial assumptions used as at 31stMarch, 2007 are as follows:
The Group and the Company
2007 2006
Discount rate 4.25% 4.50%Future salary increases 3.50% 3.25%
16 Income tax in the balance sheet
(a) Current tax payable in the balance sheetsrepresents:
15
(d)
(iv)
16
(a)

118
Vitasoy International Holdings Ltd. Annual Report 2006/07
(Expressed in Hong Kong dollars unless otherwise indicated)
Notes to the Financial Statements
16 Income tax in the balance sheet (continued)
(b) Deferred tax assets and liabilities recognised:
The components of deferred tax assets/(liabilities)recognised in the balance sheets and the movementsduring the year are as follows:
The Group
Depreciationallowances
in excess Future Employeeof related benefit of retirement
depreciation tax losses benefits Provisions Total
$’000 $’000 $’000 $’000 $’000
Deferred tax arisingfrom:
At 1st April, 2005 (34,120) 19,373 3,501 7,862 (3,384)Credited/(charged)
to profit or loss 2,435 (2,037) (1,621) 2,008 785
At 31st March, 2006 (31,685) 17,336 1,880 9,870 (2,599)
At 1st April, 2006 (31,685) 17,336 1,880 9,870 (2,599)Exchange adjustments (189) 149 – 247 207(Charged)/credited
to profit or loss (2,906) (533) (1,799) 2,644 (2,594)
At 31st March, 2007 (34,780) 16,952 81 12,761 (4,986)
16
(b)

119
(Expressed in Hong Kong dollars unless otherwise indicated)
Notes to the Financial Statements
16 Income tax in the balance sheet (continued)
(b) Deferred tax assets and liabilities recognised:(continued)
The Company
Depreciationallowances
in excess Employeeof related retirement
depreciation benefits Provisions Total
$’000 $’000 $’000 $’000
Deferred tax arising from:
At 1st April, 2005 (10,140) 3,364 2,319 (4,457)
Credited/(charged)
to profit or loss 985 (1,601) 23 (593)
At 31st March, 2006 (9,155) 1,763 2,342 (5,050)
At 1st April, 2006 (9,155) 1,763 2,342 (5,050)
Charged to profit or loss (3,647) (1,790) (104) (5,541)
At 31st March, 2007 (12,802) (27) 2,238 (10,591)
16
(b)
The Group The Company
2007 2006 2007 2006$’000 $’000 $’000 $’000
Net deferred tax assetsrecognised on thebalance sheets 6,374 2,952 – –
Net deferred tax liabilitiesrecognised on thebalance sheets (11,360) (5,551) (10,591) (5,050)
(4,986) (2,599) (10,591) (5,050)
Summary
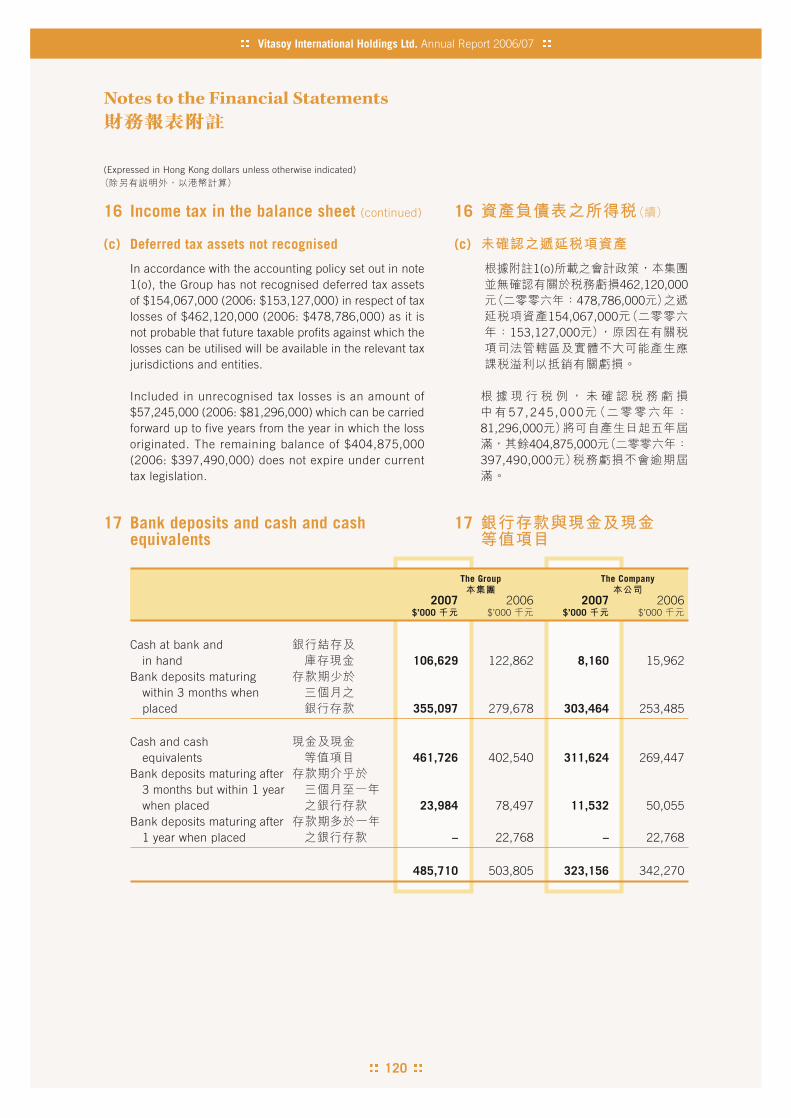
120
Vitasoy International Holdings Ltd. Annual Report 2006/07
(Expressed in Hong Kong dollars unless otherwise indicated)
Notes to the Financial Statements
16 Income tax in the balance sheet (continued)
(c) Deferred tax assets not recognised
In accordance with the accounting policy set out in note1(o), the Group has not recognised deferred tax assetsof $154,067,000 (2006: $153,127,000) in respect of taxlosses of $462,120,000 (2006: $478,786,000) as it isnot probable that future taxable profits against which thelosses can be utilised will be available in the relevant taxjurisdictions and entities.
Included in unrecognised tax losses is an amount of$57,245,000 (2006: $81,296,000) which can be carriedforward up to five years from the year in which the lossoriginated. The remaining balance of $404,875,000(2006: $397,490,000) does not expire under currenttax legislation.
17 Bank deposits and cash and cashequivalents
The Group The Company
2007 2006 2007 2006$’000 $’000 $’000 $’000
Cash at bank andin hand 106,629 122,862 8,160 15,962
Bank deposits maturingwithin 3 months whenplaced 355,097 279,678 303,464 253,485
Cash and cashequivalents 461,726 402,540 311,624 269,447
Bank deposits maturing after3 months but within 1 yearwhen placed 23,984 78,497 11,532 50,055
Bank deposits maturing after1 year when placed – 22,768 – 22,768
485,710 503,805 323,156 342,270
16
(c)
1(o)462,120,000
478,786,000154,067,000
153,127,000
57 ,245 ,00081,296,000
404,875,000397,490,000
17
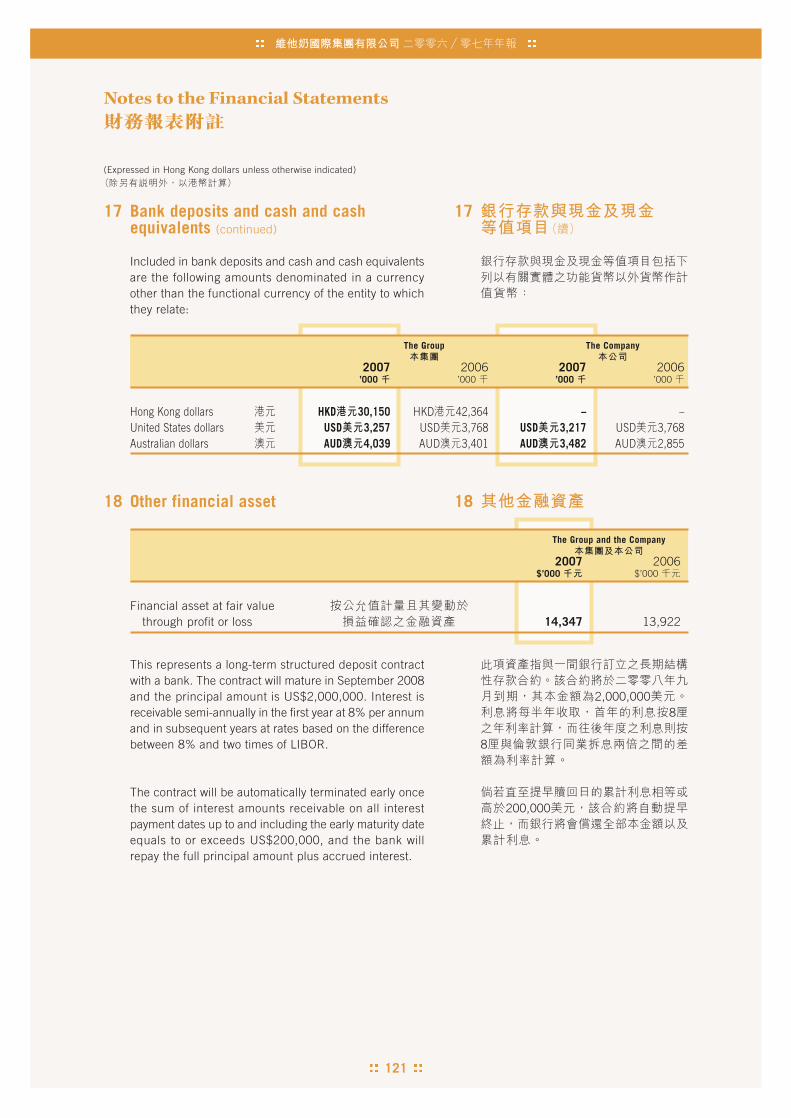
121
(Expressed in Hong Kong dollars unless otherwise indicated)
Notes to the Financial Statements
17 Bank deposits and cash and cashequivalents (continued)
Included in bank deposits and cash and cash equivalentsare the following amounts denominated in a currencyother than the functional currency of the entity to whichthey relate:
This represents a long-term structured deposit contractwith a bank. The contract will mature in September 2008and the principal amount is US$2,000,000. Interest isreceivable semi-annually in the first year at 8% per annumand in subsequent years at rates based on the differencebetween 8% and two times of LIBOR.
The contract will be automatically terminated early oncethe sum of interest amounts receivable on all interestpayment dates up to and including the early maturity dateequals to or exceeds US$200,000, and the bank willrepay the full principal amount plus accrued interest.
18 Other financial asset
The Group and the Company
2007 2006$’000 $’000
Financial asset at fair valuethrough profit or loss 14,347 13,922
17
The Group The Company
2007 2006 2007 2006’000 ’000 ’000 ’000
Hong Kong dollars HKD 30,150 HKD 42,364 – –United States dollars USD 3,257 USD 3,768 USD 3,217 USD 3,768Australian dollars AUD 4,039 AUD 3,401 AUD 3,482 AUD 2,855
18
2,000,0008
8
200,000

122
Vitasoy International Holdings Ltd. Annual Report 2006/07
(Expressed in Hong Kong dollars unless otherwise indicated)
Notes to the Financial Statements
18 Other financial asset (continued)
The financial asset is denominated in a currency otherthan the functional currency of the entity to which itrelates:
The Group and the Company
2007 2006’000 ’000
United States dollars USD 1,834 USD 1,792
19 Inventories
(a) Inventories in the balance sheets comprise:
The Group The Company
2007 2006 2007 2006$’000 $’000 $’000 $’000
Raw materials 112,959 111,128 51,029 58,102Finished goods 99,339 96,983 33,934 32,316
212,298 208,111 84,963 90,418
(b) The analysis of the amount of inventoriesrecognised as an expense is as follows:
The Group
2007 2006$’000 $’000
Carrying amounts of inventories sold 1,212,754 1,122,840Write down of inventories 13,366 5,574
1,226,120 1,128,414
18
19
(a)
(b)

123
(Expressed in Hong Kong dollars unless otherwise indicated)
Notes to the Financial Statements
20 Trade and other receivables
The Group The Company
2007 2006 2007 2006$’000 $’000 $’000 $’000
Trade debtors and billsreceivable 350,034 315,013 250,271 223,152
Deposits, prepaymentsand other debtors 42,876 37,118 9,064 6,410
392,910 352,131 259,335 229,562
All of the trade and other receivables are expected to berecovered within one year, except rental and utilitydeposits amounting to $5,937,000 (2006: $7,201,000)for the Group and $740,000 (2006: $464,000) for theCompany which are expected to be recovered after morethan one year.
Included in trade and other receivables are trade debtorsand bills receivable (net of impairment losses for badand doubtful debts) with the following ageing analysis asof the balance sheet date:
The Group The Company
2007 2006 2007 2006$’000 $’000 $’000 $’000
By date of invoice
0 – 3 months 293,623 267,932 196,365 177,2764 – 6 months 56,351 45,802 53,906 44,795Over 6 months 60 1,279 – 1,081
350,034 315,013 250,271 223,152
The Group’s credit policy is set out in note 27(a).
20
5,937,0007,201,000
740,000 464,000
27(a)
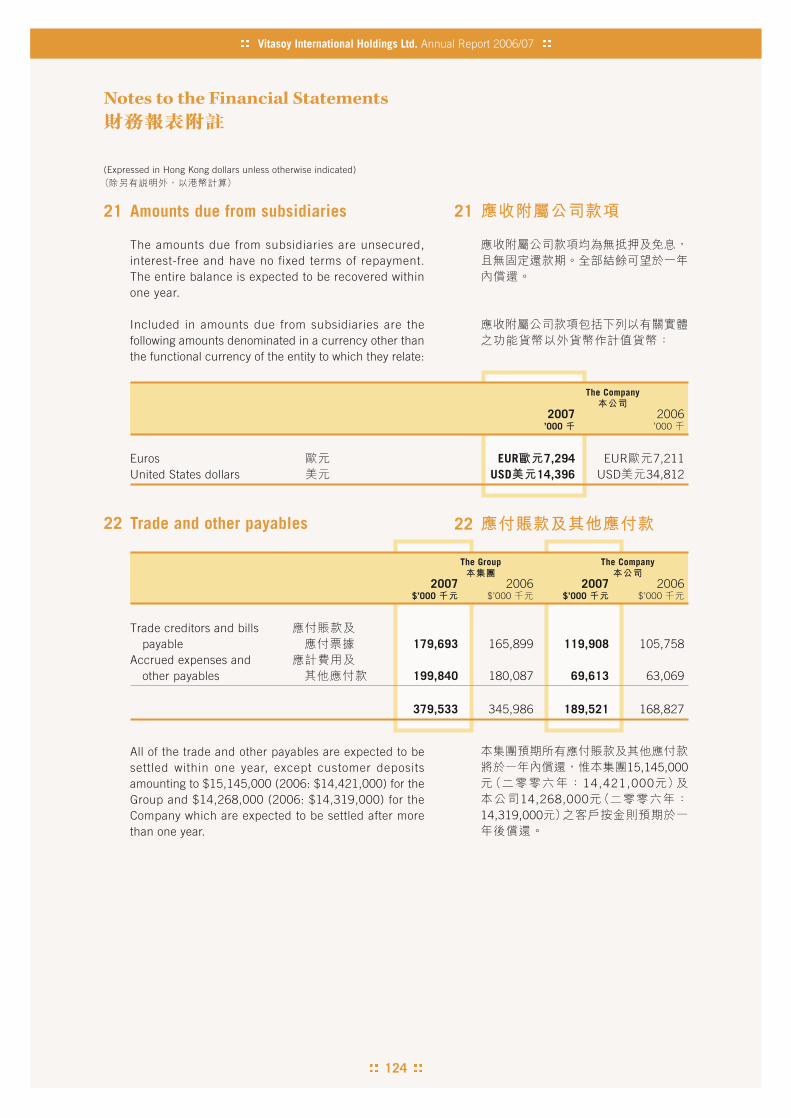
124
Vitasoy International Holdings Ltd. Annual Report 2006/07
(Expressed in Hong Kong dollars unless otherwise indicated)
Notes to the Financial Statements
21 Amounts due from subsidiaries
The amounts due from subsidiaries are unsecured,interest-free and have no fixed terms of repayment.The entire balance is expected to be recovered withinone year.
Included in amounts due from subsidiaries are thefollowing amounts denominated in a currency other thanthe functional currency of the entity to which they relate:
The Company
2007 2006’000 ’000
Euros EUR 7,294 EUR 7,211United States dollars USD 14,396 USD 34,812
All of the trade and other payables are expected to besettled within one year, except customer depositsamounting to $15,145,000 (2006: $14,421,000) for theGroup and $14,268,000 (2006: $14,319,000) for theCompany which are expected to be settled after morethan one year.
22 Trade and other payables
The Group The Company
2007 2006 2007 2006$’000 $’000 $’000 $’000
Trade creditors and billspayable 179,693 165,899 119,908 105,758
Accrued expenses andother payables 199,840 180,087 69,613 63,069
379,533 345,986 189,521 168,827
21
22
15,145,00014,421,000
14,268,00014,319,000

125
(Expressed in Hong Kong dollars unless otherwise indicated)
Notes to the Financial Statements
22 Trade and other payables (continued)
Included in trade and other payables are trade creditorsand bills payable with the following ageing analysis as ofthe balance sheet date:
The Group The Company
2007 2006 2007 2006$’000 $’000 $’000 $’000
By date of invoice
0 – 3 months 175,410 162,219 115,780 102,9034 – 6 months 1,583 2,178 1,428 1,363Over 6 months 2,700 1,502 2,700 1,492
179,693 165,899 119,908 105,758
Included in trade and other payables are the followingamounts denominated in a currency other than thefunctional currency of the entity to which they relate:
The Group The Company
2007 2006 2007 2006’000 ’000 ’000 ’000
United States dollars USD 1,360 USD 683 USD 996 USD 683
22
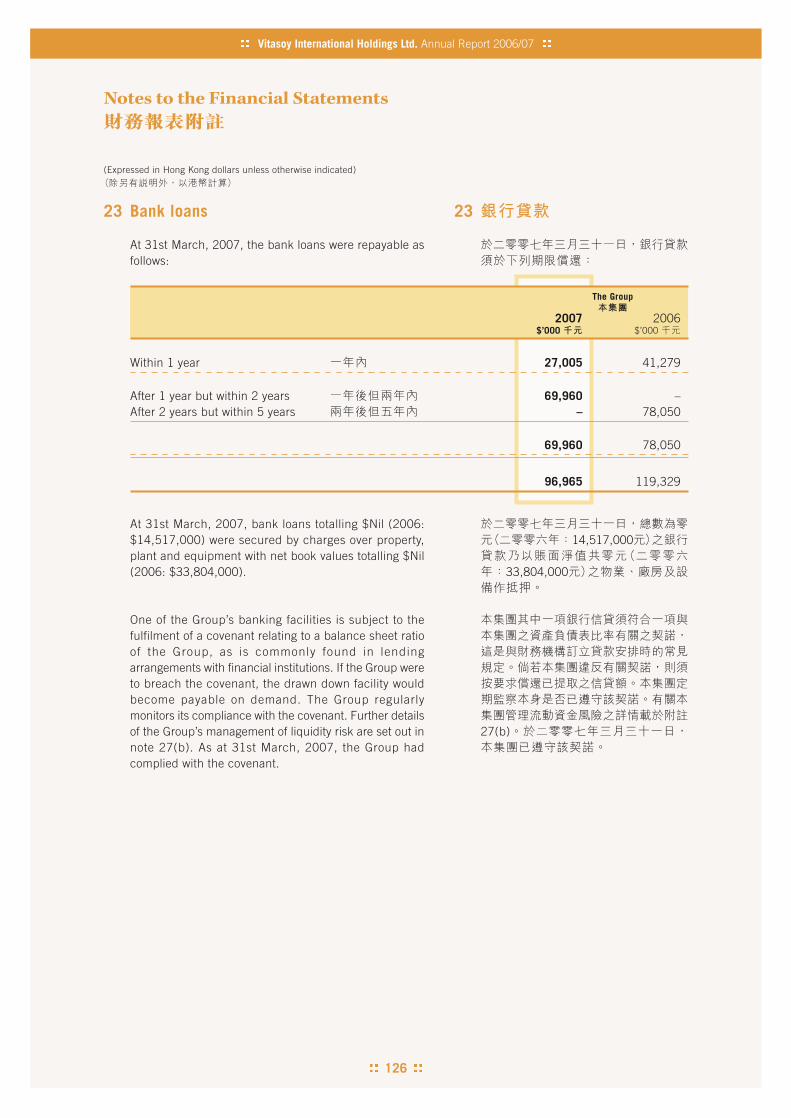
126
Vitasoy International Holdings Ltd. Annual Report 2006/07
(Expressed in Hong Kong dollars unless otherwise indicated)
Notes to the Financial Statements
23 Bank loans
At 31st March, 2007, the bank loans were repayable asfollows:
The Group
2007 2006$’000 $’000
Within 1 year 27,005 41,279
After 1 year but within 2 years 69,960 –After 2 years but within 5 years – 78,050
69,960 78,050
96,965 119,329
At 31st March, 2007, bank loans totalling $Nil (2006:$14,517,000) were secured by charges over property,plant and equipment with net book values totalling $Nil(2006: $33,804,000).
One of the Group’s banking facilities is subject to thefulfilment of a covenant relating to a balance sheet ratioof the Group, as is commonly found in lendingarrangements with financial institutions. If the Group wereto breach the covenant, the drawn down facility wouldbecome payable on demand. The Group regularlymonitors its compliance with the covenant. Further detailsof the Group’s management of liquidity risk are set out innote 27(b). As at 31st March, 2007, the Group hadcomplied with the covenant.
23
14,517,000
33,804,000
27(b)
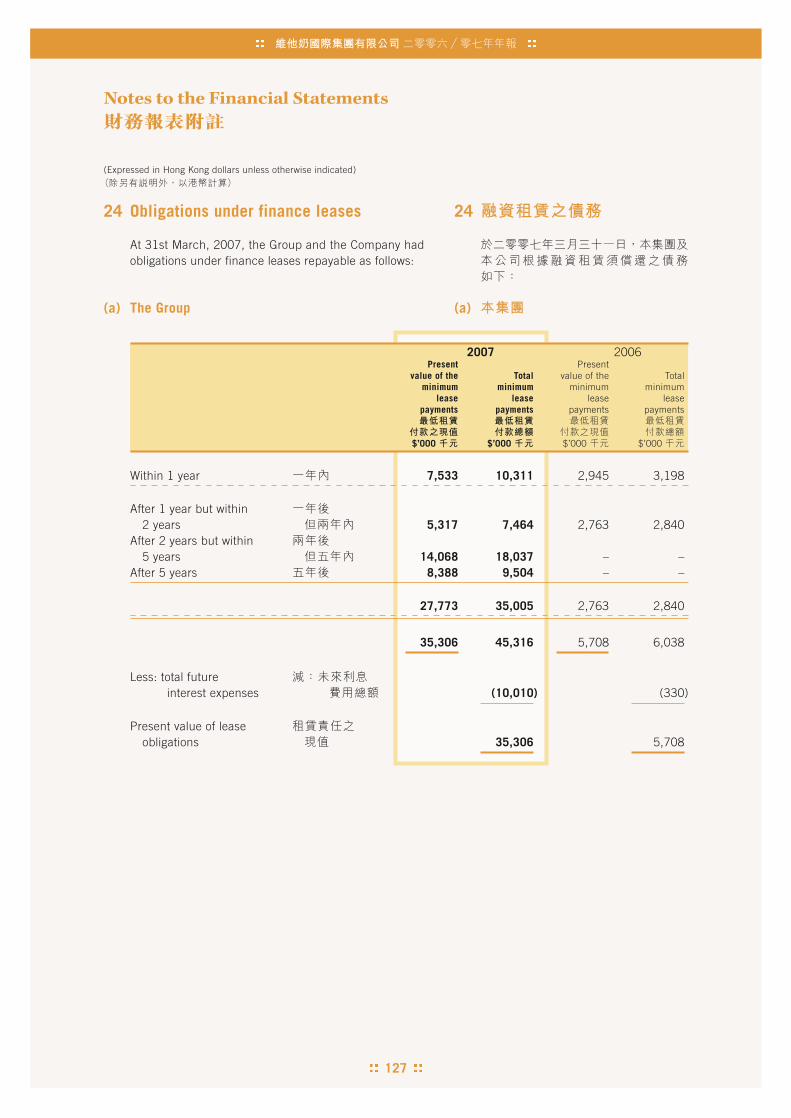
127
(Expressed in Hong Kong dollars unless otherwise indicated)
Notes to the Financial Statements
24 Obligations under finance leases
At 31st March, 2007, the Group and the Company hadobligations under finance leases repayable as follows:
(a) The Group
2007 2006Present Present
value of the Total value of the Totalminimum minimum minimum minimum
lease lease lease leasepayments payments payments payments
$’000 $’000 $’000 $’000
Within 1 year 7,533 10,311 2,945 3,198
After 1 year but within2 years 5,317 7,464 2,763 2,840
After 2 years but within5 years 14,068 18,037 – –
After 5 years 8,388 9,504 – –
27,773 35,005 2,763 2,840
35,306 45,316 5,708 6,038
Less: total futureinterest expenses (10,010) (330)
Present value of leaseobligations 35,306 5,708
24
(a)
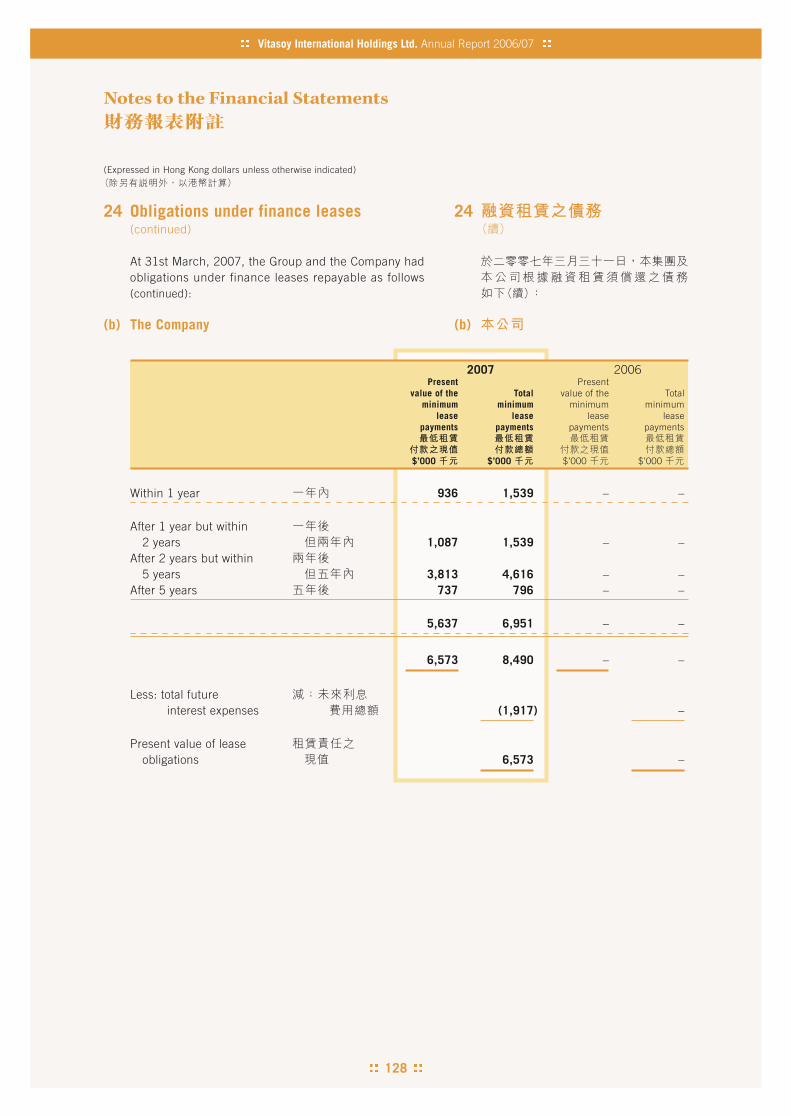
128
Vitasoy International Holdings Ltd. Annual Report 2006/07
(Expressed in Hong Kong dollars unless otherwise indicated)
Notes to the Financial Statements
24 Obligations under finance leases(continued)
At 31st March, 2007, the Group and the Company hadobligations under finance leases repayable as follows(continued):
(b) The Company
2007 2006Present Present
value of the Total value of the Totalminimum minimum minimum minimum
lease lease lease leasepayments payments payments payments
$’000 $’000 $’000 $’000
Within 1 year 936 1,539 – –
After 1 year but within2 years 1,087 1,539 – –
After 2 years but within5 years 3,813 4,616 – –
After 5 years 737 796 – –
5,637 6,951 – –
6,573 8,490 – –
Less: total futureinterest expenses (1,917) –
Present value of leaseobligations 6,573 –
24
(b)

129
(Expressed in Hong Kong dollars unless otherwise indicated)
Notes to the Financial Statements
25 Capital and reserves
(a) The Group
Attributable to equity shareholders of the Company
Capital Share-basedShare Share redemption Capital Legal General Exchange compensation Retained Minority Total
capital premium reserve reserve reserve reserve reserve reserve profits Total interests equity
$’000 $’000 $’000 $’000 $’000 $’000 $’000 $’000 $’000 $’000 $’000 $’000
At 1st April, 2005 248,482 287,259 1,101 91,914 6,526 2,261 (26,003) 3,997 630,426 1,245,963 47,669 1,293,632Exchange differences on
translation of thefinancial statementsof foreign subsidiaries – – – – – – 2,345 – – 2,345 (1,236) 1,109
Transfer from retainedprofits to legal reserve – – – – 304 – – – (304) – – –
Transfer from capitalreserve to retained profits – – – (4,086) – – – – 4,086 – – –
Shares issued on exerciseof share options 2,340 10,484 – – – – – – – 12,824 – 12,824
Transfer from share-basedcompensation reserveto share premium onexercise of share options – 712 – – – – – (712) – – – –
Equity settled share-basedtransactions – – – – – – – 2,634 – 2,634 – 2,634
Final dividend approved inrespect of the previousyear (note 10(b)) 10(b) – – – – – – – – (57,139) (57,139) – (57,139)
Special dividend approvedin respect of the previousyear (note 10(b)) 10(b) – – – – – – – – (100,244) (100,244) – (100,244)
Interim dividend declaredin respect of the currentyear (note 10(a)) 10(a) – – – – – – – – (28,091) (28,091) – (28,091)
Dividend paid to minorityshareholder – – – – – – – – – – (816) (816)
Profit for the year – – – – – – – – 172,076 172,076 12,949 185,025
At 31st March, 2006 250,822 298,455 1,101 87,828 6,830 2,261 (23,658) 5,919 620,810 1,250,368 58,566 1,308,934
25
(a)

130
Vitasoy International Holdings Ltd. Annual Report 2006/07
(Expressed in Hong Kong dollars unless otherwise indicated)
Notes to the Financial Statements
25 Capital and reserves (continued)
(a) The Group (continued)
Attributable to equity shareholders of the Company
Capital Share-basedShare Share redemption Capital Legal General Exchange compensation Retained Minority Total
capital premium reserve reserve reserve reserve reserve reserve profits Total interests equity
$’000 $’000 $’000 $’000 $’000 $’000 $’000 $’000 $’000 $’000 $’000 $’000
At 1st April, 2006 250,822 298,455 1,101 87,828 6,830 2,261 (23,658) 5,919 620,810 1,250,368 58,566 1,308,934Exchange differences on
translation of the financialstatements of foreignsubsidiaries – – – – – – 16,444 – – 16,444 6,907 23,351
Transfer from retainedprofits to legal reserve – – – – 662 – – – (662) – – –
Transfer from capitalreserve to retained profits – – – (4,087) – – – – 4,087 – – –
Shares issued on exerciseof share options 937 6,140 – – – – – – – 7,077 – 7,077
Transfer from share-basedcompensation reserve toshare premium on exerciseof share options – 1,358 – – – – – (1,358) – – – –
Equity settled share-basedtransactions – – – – – – – 2,775 – 2,775 – 2,775
Final dividend approved inrespect of the previousyear (note 10(b)) 10(b) – – – – – – – – (67,404) (67,404) – (67,404)
Special dividend approved inrespect of the previousyear (note 10(b)) 10(b) – – – – – – – – (100,603) (100,603) – (100,603)
Interim dividend declared inrespect of the current year(note 10(a)) 10(a) – – – – – – – – (28,197) (28,197) – (28,197)
Dividend paid to minorityshareholder – – – – – – – – – – (1,757) (1,757)
Profit for the year – – – – – – – – 173,901 173,901 27,411 201,312
At 31st March, 2007 251,759 305,953 1,101 83,741 7,492 2,261 (7,214) 7,336 601,932 1,254,361 91,127 1,345,488
25
(a)
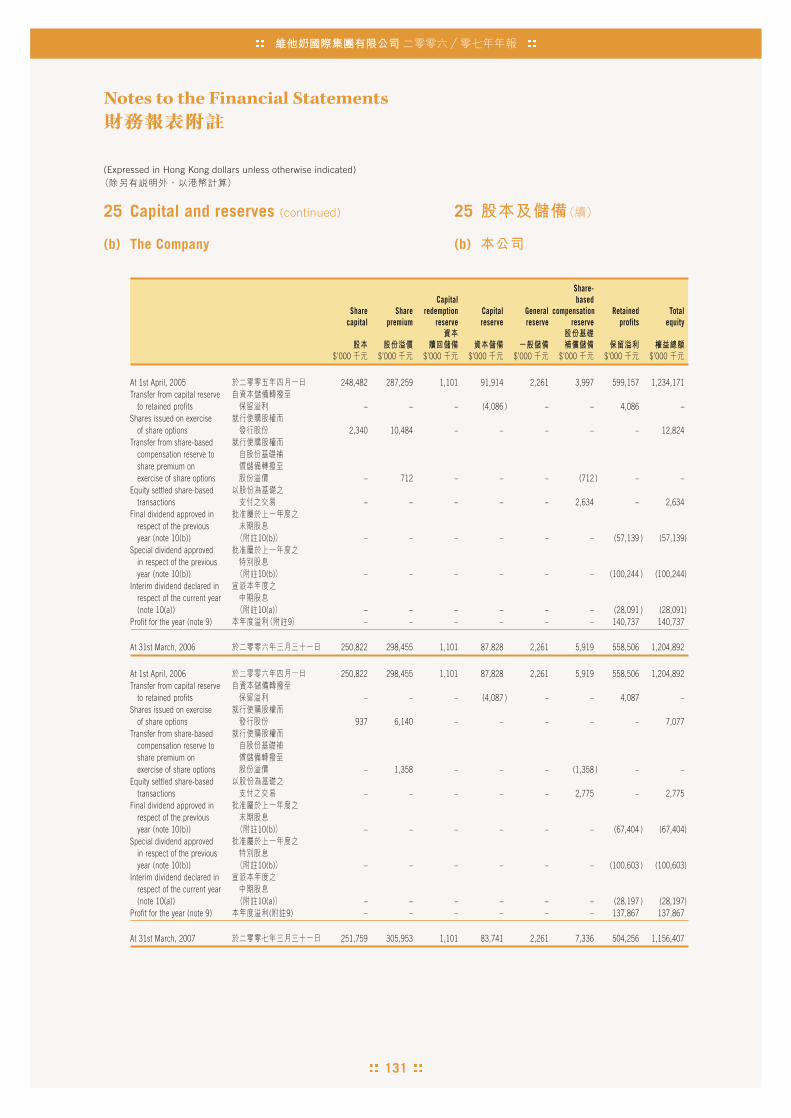
131
(Expressed in Hong Kong dollars unless otherwise indicated)
Notes to the Financial Statements
25 Capital and reserves (continued)
(b) The Company
Share-Capital based
Share Share redemption Capital General compensation Retained Totalcapital premium reserve reserve reserve reserve profits equity
$’000 $’000 $’000 $’000 $’000 $’000 $’000 $’000
At 1st April, 2005 248,482 287,259 1,101 91,914 2,261 3,997 599,157 1,234,171Transfer from capital reserve
to retained profits – – – (4,086 ) – – 4,086 –Shares issued on exercise
of share options 2,340 10,484 – – – – – 12,824Transfer from share-based
compensation reserve toshare premium onexercise of share options – 712 – – – (712 ) – –
Equity settled share-basedtransactions – – – – – 2,634 – 2,634
Final dividend approved inrespect of the previousyear (note 10(b)) 10(b) – – – – – – (57,139 ) (57,139)
Special dividend approvedin respect of the previousyear (note 10(b)) 10(b) – – – – – – (100,244 ) (100,244)
Interim dividend declared inrespect of the current year(note 10(a)) 10(a) – – – – – – (28,091 ) (28,091)
Profit for the year (note 9) 9 – – – – – – 140,737 140,737
At 31st March, 2006 250,822 298,455 1,101 87,828 2,261 5,919 558,506 1,204,892
At 1st April, 2006 250,822 298,455 1,101 87,828 2,261 5,919 558,506 1,204,892Transfer from capital reserve
to retained profits – – – (4,087 ) – – 4,087 –Shares issued on exercise
of share options 937 6,140 – – – – – 7,077Transfer from share-based
compensation reserve toshare premium onexercise of share options – 1,358 – – – (1,358 ) – –
Equity settled share-basedtransactions – – – – – 2,775 – 2,775
Final dividend approved inrespect of the previousyear (note 10(b)) 10(b) – – – – – – (67,404 ) (67,404)
Special dividend approvedin respect of the previousyear (note 10(b)) 10(b) – – – – – – (100,603 ) (100,603)
Interim dividend declared inrespect of the current year(note 10(a)) 10(a) – – – – – – (28,197 ) (28,197)
Profit for the year (note 9) ( 9) – – – – – – 137,867 137,867
At 31st March, 2007 251,759 305,953 1,101 83,741 2,261 7,336 504,256 1,156,407
25
(b)
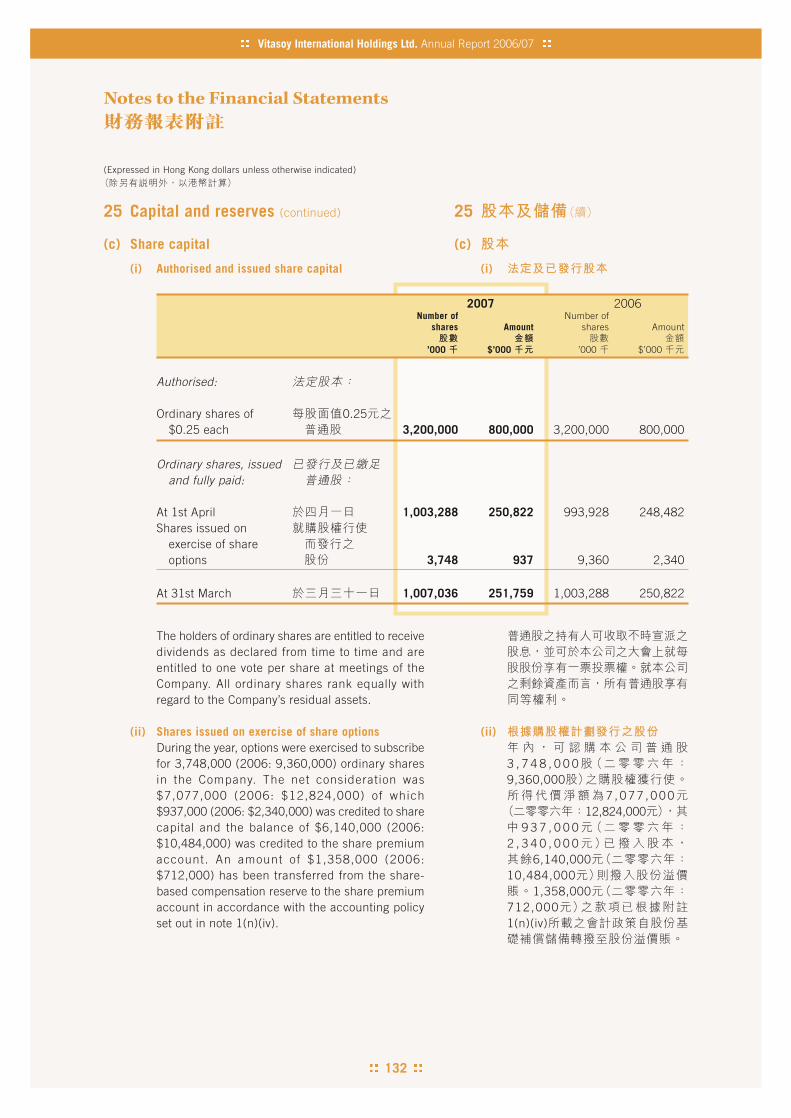
132
Vitasoy International Holdings Ltd. Annual Report 2006/07
(Expressed in Hong Kong dollars unless otherwise indicated)
Notes to the Financial Statements
25 Capital and reserves (continued)
(c) Share capital
(i) Authorised and issued share capital
2007 2006Number of Number of
shares Amount shares Amount
’000 $’000 ’000 $’000
Authorised:
Ordinary shares of 0.25$0.25 each 3,200,000 800,000 3,200,000 800,000
Ordinary shares, issuedand fully paid:
At 1st April 1,003,288 250,822 993,928 248,482Shares issued on
exercise of shareoptions 3,748 937 9,360 2,340
At 31st March 1,007,036 251,759 1,003,288 250,822
The holders of ordinary shares are entitled to receivedividends as declared from time to time and areentitled to one vote per share at meetings of theCompany. All ordinary shares rank equally withregard to the Company’s residual assets.
(ii) Shares issued on exercise of share optionsDuring the year, options were exercised to subscribefor 3,748,000 (2006: 9,360,000) ordinary sharesin the Company. The net consideration was$7,077,000 (2006: $12,824,000) of which$937,000 (2006: $2,340,000) was credited to sharecapital and the balance of $6,140,000 (2006:$10,484,000) was credited to the share premiumaccount. An amount of $1,358,000 (2006:$712,000) has been transferred from the share-based compensation reserve to the share premiumaccount in accordance with the accounting policyset out in note 1(n)(iv).
25
(c)
(i)
(ii)
3 , 7 4 8 , 0 0 09,360,000
7 , 0 7 7 , 0 0 012,824,000
9 3 7 , 0 0 02 , 3 4 0 , 0 0 0
6,140,00010,484,000
1,358,000712,0001(n)(iv)
133
(Expressed in Hong Kong dollars unless otherwise indicated)
Notes to the Financial Statements
25 Capital and reserves (continued)
(d) Nature and purpose of reserves
(i) Share premium and capital redemption reserveThe application of the share premium account andthe capital redemption reserve is governed bysections 48B and 49H respectively of the Hong KongCompanies Ordinance.
(ii) Capital reserveAs part of the restructuring of the Group in February1994, the Company disposed of a property to a formersubsidiary and consideration was received in the formof cash and another property. A total gain,representing the difference between the historicalcarrying value of the property disposed of and thefair value of the consideration received, resulted.
The gain arising from this transaction was dividedinto realised and unrealised portions in the ratio ofthe amount of cash and the fair value of the propertyreceived (“the property”). The unrealised gain wastaken to capital reserve and is real ised ondepreciation of the property. During the year,$4,087,000 (2006: $4,086,000) was transferredfrom capital reserve to retained profits.
(iii) Legal reserveThe legal reserve has been set up by ShenzhenVitasoy (Guang Ming) Foods and Beverage CompanyLimi ted and V i taso ja (Macau) L imi tada inaccordance with regulations in the People’s Republicof China and Macau respectively.
(iv) Exchange reserveThe exchange reserve comprises al l foreignexchange differences arising from the translation ofthe financial statements of foreign operations. Thereserve is dealt with in accordance with theaccounting policy set out in note 1(r).
(v) Share-based compensation reserveShare-based compensation reserve comprises thefair value of the actual or estimated number ofunexercised share options granted to employees ofthe Group or the Company recognised in accordancewith the accounting policy adopted for share-basedpayments in note 1(n)(iv).
25
(d)
(i)
48B49H
(ii)
4,087,0004,086,000
(iii)
(iv)
1(r)
(v)
1(n)(iv)

134
Vitasoy International Holdings Ltd. Annual Report 2006/07
(Expressed in Hong Kong dollars unless otherwise indicated)
Notes to the Financial Statements
25 Capital and reserves (continued)
(e) Distributability of reserves
At 31st March, 2007, the amounts of reserves availablefor distribution to equity shareholders of the Companyare as follows:
The Company
2007 2006$’000 $’000
General reserve 2,261 2,261Retained profits 504,256 558,506
506,517 560,767
After the balance sheet date the Directors proposed afinal dividend and a special dividend of 6.7 cents perordinary share (2006: 6.7 cents per ordinary share) and10.0 cents per ordinary share (2006: 10.0 cents perordinary share) respectively, amounting to $168,668,000(2006: $167,922,000). These dividends have not beenrecognised as liabilities at the balance sheet date.
26 Equity settled share-based transactions
The Company adopted a share option scheme on4th September, 2002 whereby the Directors of theCompany were authorised, at their discretion, to inviteemployees of the Group, including Directors of anycompany in the Group, to take up options to subscribefor ordinary shares of $0.25 each in the Company. Theexercise price of the options is determined by theDirectors of the Company and is the highest of (i) theclosing price of the shares on The Stock Exchange ofHong Kong Limited (the “Stock Exchange”) on the dateof grant, which must be a business day; (ii) the averageof the closing prices of the shares on the Stock Exchangefor the five business days immediately preceding the dateof grant; and (iii) the nominal value of the shares.
There is no minimum period for which an option mustbe held before it can be exercised, but the Directors ofthe Company are empowered to impose at their discretionany such minimum period at the date of offer. The optionsare exercisable for a period not to exceed 10 years fromthe date of grant. Each option gives the holder the rightto subscribe for one share in the Company.
6.76.7 10.0
10.0168,668,000
167,922,000
26
0.25
(i)
(ii)
(iii)
25
(e)

135
(Expressed in Hong Kong dollars unless otherwise indicated)
Notes to the Financial Statements
26 Equity settled share-based transactions(continued)
(a) The terms and condit ions of the unexpired andunexercised share options at balance sheet date are asfollows, whereby all options are settled by physicaldelivery of shares:
2007 2006Contractual Remaining Remaining
life of Exercise contractual Number of contractual Number ofDate of grant Exercise period options price life options life options
$ ’000 ’000
1/4/2003 1/4/2004 – 31/3/2013 (note ) 10 years 1.688 6 years 5,627 7 years 7,705
1/4/2004 1/4/2005 – 31/3/2014 (note ) 10 years 1.904 7 years 4,942 8 years 6,154
3/8/2004 3/8/2006 – 2/8/2014 10 years 1.910 7 years 900 8 years 900
1/6/2005 1/6/2006 – 31/5/2015 (note ) 10 years 2.375 8 years 6,584 9 years 7,784
5/6/2006 5/6/2007 – 4/6/2016 (note ) 10 years 2.900 9 years 5,262 – –
23,315 22,543
Note:
Except for the options granted on 3rd August, 2004, all theoptions are exercisable progressively and the maximumpercentage of the options which may be exercised is determinedin stages as follows:
Percentage ofoptions granted
On or after 1st year anniversary of the date of grant 25%On or after 2nd year anniversary of the date of grant another 25%On or after 3rd year anniversary of the date of grant another 25%On or after 4th year anniversary of the date of grant another 25%
26
(a)
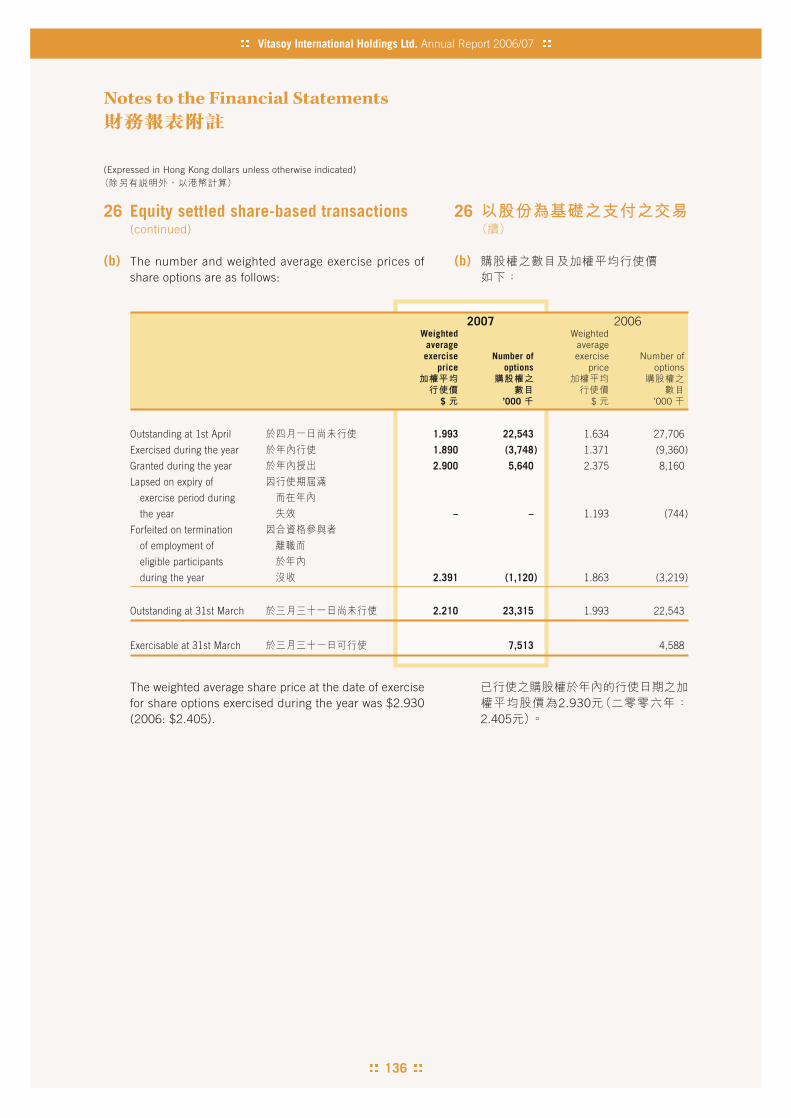
136
Vitasoy International Holdings Ltd. Annual Report 2006/07
(Expressed in Hong Kong dollars unless otherwise indicated)
Notes to the Financial Statements
26 Equity settled share-based transactions(continued)
(b) The number and weighted average exercise prices ofshare options are as follows:
2007 2006Weighted Weighted
average averageexercise Number of exercise Number of
price options price options
$ ’000 $ ’000
Outstanding at 1st April 1.993 22,543 1.634 27,706
Exercised during the year 1.890 (3,748) 1.371 (9,360)
Granted during the year 2.900 5,640 2.375 8,160
Lapsed on expiry of
exercise period during
the year – – 1.193 (744)
Forfeited on termination
of employment of
eligible participants
during the year 2.391 (1,120) 1.863 (3,219)
Outstanding at 31st March 2.210 23,315 1.993 22,543
Exercisable at 31st March 7,513 4,588
The weighted average share price at the date of exercisefor share options exercised during the year was $2.930(2006: $2.405).
26
(b)
2.9302.405
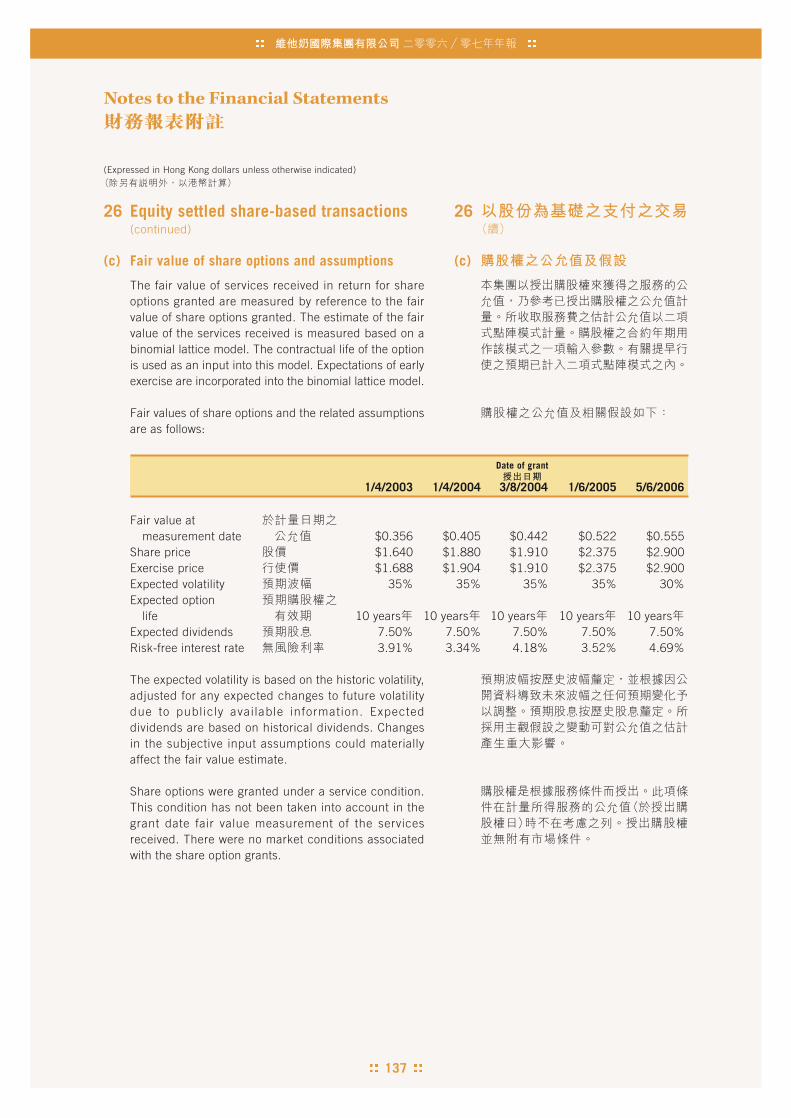
137
(Expressed in Hong Kong dollars unless otherwise indicated)
Notes to the Financial Statements
26 Equity settled share-based transactions(continued)
(c) Fair value of share options and assumptions
The fair value of services received in return for shareoptions granted are measured by reference to the fairvalue of share options granted. The estimate of the fairvalue of the services received is measured based on abinomial lattice model. The contractual life of the optionis used as an input into this model. Expectations of earlyexercise are incorporated into the binomial lattice model.
Fair values of share options and the related assumptionsare as follows:
Date of grant
1/4/2003 1/4/2004 3/8/2004 1/6/2005 5/6/2006
Fair value atmeasurement date $0.356 $0.405 $0.442 $0.522 $0.555
Share price $1.640 $1.880 $1.910 $2.375 $2.900Exercise price $1.688 $1.904 $1.910 $2.375 $2.900Expected volatility 35% 35% 35% 35% 30%Expected option
life 10 years 10 years 10 years 10 years 10 yearsExpected dividends 7.50% 7.50% 7.50% 7.50% 7.50%Risk-free interest rate 3.91% 3.34% 4.18% 3.52% 4.69%
The expected volatility is based on the historic volatility,adjusted for any expected changes to future volatilitydue to publ icly avai lable information. Expecteddividends are based on historical dividends. Changesin the subjective input assumptions could materiallyaffect the fair value estimate.
Share options were granted under a service condition.This condition has not been taken into account in thegrant date fair value measurement of the servicesreceived. There were no market conditions associatedwith the share option grants.
26
(c)

138
Vitasoy International Holdings Ltd. Annual Report 2006/07
(Expressed in Hong Kong dollars unless otherwise indicated)
Notes to the Financial Statements
27 Financial instruments
Exposure to credit, liquidity, interest rate and currencyrisks arises in the normal course of the Group’s business.These risks are l imited by the Group’s f inancialmanagement policies and practices described below.
(a) Credit risk
The Group’s credit risk is primarily attributable to tradeand other receivables. Management has a credit policyin place and the exposures to these credit risks aremonitored on an ongoing basis.
The credit terms given to the customers vary and aregenerally based on the financial strength of the individualcustomer. In order to effectively manage the credit risksassociated with trade debtors, credit evaluations ofcustomers are performed periodically.
At the balance sheet date, the Group has a certainconcentration of credit risk as 19.1% (2006: 17.4%) and58.7% (2006: 58.3%) of the total trade and otherreceivables was due from the Group’s largest customerand the five largest customers respectively.
The Group’s cash and bank deposits are placed withf inancial inst i tut ions with sound credit rat ings.Management does not expect any inves tmentcounterparty to fail to meet its obligations.
The maximum exposure to credit risk is represented bythe carrying amount of each financial asset in thebalance sheet.
(b) Liquidity risk
The Group’s policy is to regularly monitor current andexpected liquidity requirements, to ensure that itmaintains sufficient reserves of cash and adequatecommitted l ines of funding from major f inancialinstitutions to meet its liquidity requirements in the shortand longer term.
27
(a)
19.1%1 7 . 4 % 5 8 . 7 %58.3%
(b)
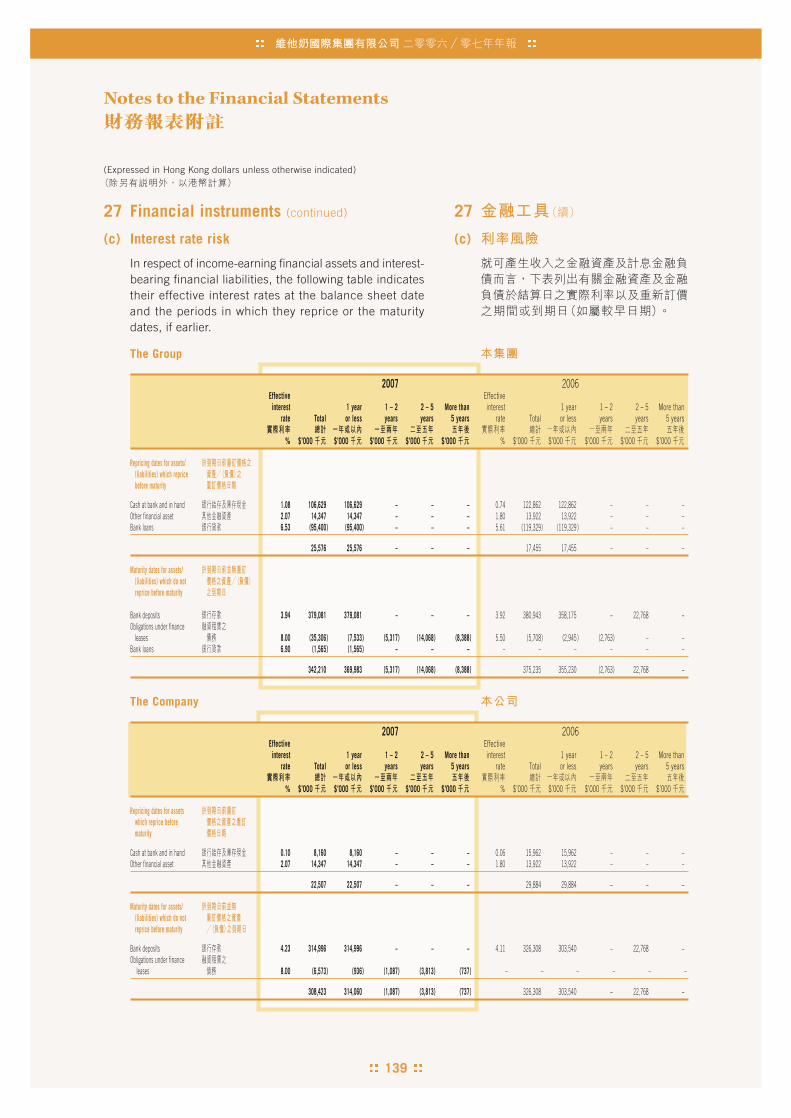
139
(Expressed in Hong Kong dollars unless otherwise indicated)
Notes to the Financial Statements
27 Financial instruments (continued)
(c) Interest rate risk
In respect of income-earning financial assets and interest-bearing financial liabilities, the following table indicatestheir effective interest rates at the balance sheet dateand the periods in which they reprice or the maturitydates, if earlier.
The Group
2007 2006Effective Effectiveinterest 1 year 1 – 2 2 – 5 More than interest 1 year 1 – 2 2 – 5 More than
rate Total or less years years 5 years rate Total or less years years 5 years
% $’000 $’000 $’000 $’000 $’000 % $’000 $’000 $’000 $’000 $’000
Repricing dates for assets/(liabilities) which repricebefore maturity
Cash at bank and in hand 1.08 106,629 106,629 – – – 0.74 122,862 122,862 – – –Other financial asset 2.07 14,347 14,347 – – – 1.80 13,922 13,922 – – –Bank loans 6.53 (95,400) (95,400) – – – 5.61 (119,329) (119,329 ) – – –
25,576 25,576 – – – 17,455 17,455 – – –
Maturity dates for assets/(liabilities) which do notreprice before maturity
Bank deposits 3.94 379,081 379,081 – – – 3.92 380,943 358,175 – 22,768 –Obligations under finance
leases 8.00 (35,306) (7,533) (5,317) (14,068) (8,388) 5.50 (5,708) (2,945 ) (2,763) – –Bank loans 6.90 (1,565) (1,565) – – – – – – – – –
342,210 369,983 (5,317) (14,068) (8,388) 375,235 355,230 (2,763) 22,768 –
27
(c)
The Company
2007 2006Effective Effectiveinterest 1 year 1 – 2 2 – 5 More than interest 1 year 1 – 2 2 – 5 More than
rate Total or less years years 5 years rate Total or less years years 5 years
% $’000 $’000 $’000 $’000 $’000 % $’000 $’000 $’000 $’000 $’000
Repricing dates for assetswhich reprice beforematurity
Cash at bank and in hand 0.10 8,160 8,160 – – – 0.06 15,962 15,962 – – –Other financial asset 2.07 14,347 14,347 – – – 1.80 13,922 13,922 – – –
22,507 22,507 – – – 29,884 29,884 – – –
Maturity dates for assets/(liabilities) which do notreprice before maturity
Bank deposits 4.23 314,996 314,996 – – – 4.11 326,308 303,540 – 22,768 –Obligations under finance
leases 8.00 (6,573) (936) (1,087) (3,813) (737) – – – – – –
308,423 314,060 (1,087) (3,813) (737) 326,308 303,540 – 22,768 –

140
Vitasoy International Holdings Ltd. Annual Report 2006/07
(Expressed in Hong Kong dollars unless otherwise indicated)
Notes to the Financial Statements
27 Financial instruments (continued)
(d) Foreign currency risk
The Group is exposed to foreign currency risk primarilythrough sales and purchases that are denominated in acurrency other than the functional currency of theoperations to which they relate. The currency giving riseto this risk is primarily United States dollars. Managementmonitors the Group’s exposure to foreign currency riskand will consider hedging significant foreign currencyexposure should the need arise.
All the Group’s borrowings are denominated in thefunctional currency of the entity taking out the loan.Given this, management does not expect that there willbe any significant currency risk associated with theGroup’s borrowings.
(e) Fair values
All financial instruments are carried at amounts notmaterially different from their fair values as at 31st March,2007 and 2006.
The amounts due from subsidiaries are unsecured,interest-free and have no fixed repayment terms. Giventhese terms, it is not meaningful to disclose fair values.
(f) Estimation of fair values
The fair value of the long-term structured deposit contract(note 18) is estimated by discounted cash flow techniques.Estimated future cash flows are based on management’sbest estimates and the discount rate is a market relatedrate for a similar instrument at the balance sheet date.
27
(d)
(e)
(f)
( 18)

141
(Expressed in Hong Kong dollars unless otherwise indicated)
Notes to the Financial Statements
28 Commitments
(a) At 31st March, 2007, the total future minimum leasepayments under non-cancellable operating leases arepayable as follows:
The Group
2007 2006Factory Factory
machinery machineryand and
Properties equipment Properties equipment
$’000 $’000 $’000 $’000
Within 1 year 29,655 846 24,888 735After 1 year but within
5 years 21,751 956 22,178 858After 5 years 60 47 86 –
51,466 1,849 47,152 1,593
2007 2006Factory Factory
machinery machineryand and
Properties equipment Properties equipment
$’000 $’000 $’000 $’000
Within 1 year 1,484 – 876 –After 1 year but within
5 years 1,010 – – –
2,494 – 876 –
The Company
The Group leases a number of properties and items offactory machinery and equipment under operating leases.The leases run for an initial period of one to eight years,with an option to renew the lease when all terms arerenegotiated. None of the leases includes contingentrentals.
28
(a)

142
Vitasoy International Holdings Ltd. Annual Report 2006/07
(Expressed in Hong Kong dollars unless otherwise indicated)
Notes to the Financial Statements
28 Commitments (continued)
(b) Capital commitments outstanding at 31st March, 2007not provided for in the financial statements were asfollows:
The Group The Company
2007 2006 2007 2006$’000 $’000 $’000 $’000
Contracted for 6,180 11,520 221 249Authorised but not
contracted for 75,099 77,557 53,437 40,457
81,279 89,077 53,658 40,706
29 Contingent liabilities
(a) As at 31st March, 2007, the Company has issuedguarantees to banks in respect of banking facilitiesgranted to its subsidiaries. The Directors do not considerit probable that a claim will be made against the Companyunder any of the guarantees. The maximum liability ofthe Company at the balance sheet date under theguarantees issued is the facilities drawn down by thesubsidiaries of $40,488,000 (2006: $58,673,000).
The Company has not recognised any deferred incomein respect of the guarantees as the fair value of suchguarantee was insignificant.
(b) The Company has given undertakings to certainwholly-owned subsidiaries to provide them with suchfinancial assistance as is necessary to maintain them asgoing concerns.
29
(a)
40,488,00058,673,000
(b)
28
(b)
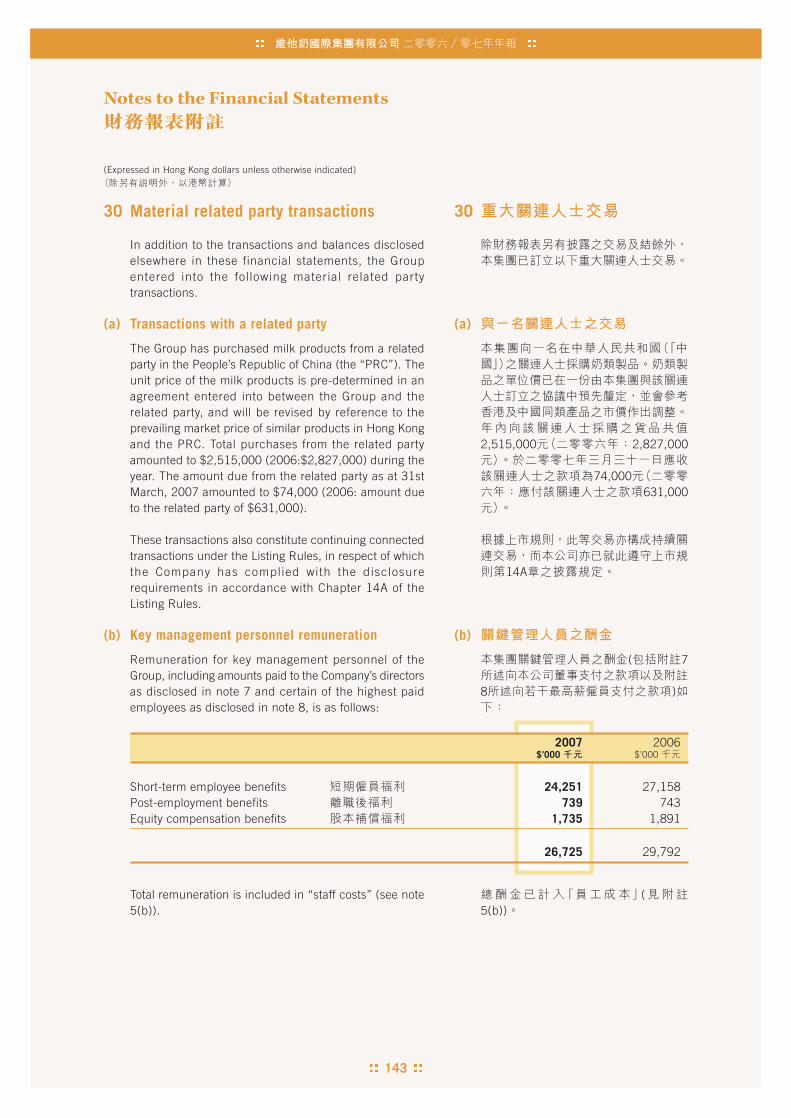
143
(Expressed in Hong Kong dollars unless otherwise indicated)
Notes to the Financial Statements
30 Material related party transactions
In addition to the transactions and balances disclosedelsewhere in these financial statements, the Groupentered into the fol lowing material related partytransactions.
(a) Transactions with a related party
The Group has purchased milk products from a relatedparty in the People’s Republic of China (the “PRC”). Theunit price of the milk products is pre-determined in anagreement entered into between the Group and therelated party, and will be revised by reference to theprevailing market price of similar products in Hong Kongand the PRC. Total purchases from the related partyamounted to $2,515,000 (2006:$2,827,000) during theyear. The amount due from the related party as at 31stMarch, 2007 amounted to $74,000 (2006: amount dueto the related party of $631,000).
These transactions also constitute continuing connectedtransactions under the Listing Rules, in respect of whichthe Company has complied with the disclosurerequirements in accordance with Chapter 14A of theListing Rules.
(b) Key management personnel remuneration
Remuneration for key management personnel of theGroup, including amounts paid to the Company’s directorsas disclosed in note 7 and certain of the highest paidemployees as disclosed in note 8, is as follows:
2007 2006$’000 $’000
Short-term employee benefits 24,251 27,158Post-employment benefits 739 743Equity compensation benefits 1,735 1,891
26,725 29,792
Total remuneration is included in “staff costs” (see note5(b)).
30
(a)
2,515,000 2,827,000
74,000631,000
14A
(b)
( 7
8 )
(5(b))
144
Vitasoy International Holdings Ltd. Annual Report 2006/07
(Expressed in Hong Kong dollars unless otherwise indicated)
Notes to the Financial Statements
31 Non-adjusting post balance sheetevent
Subsequent to the balance sheet date the Directorsproposed a final dividend and a special dividend. Furtherdetails are disclosed in note 10.
32 Accounting estimates and judgements
Notes 15, 26 and 27(f) contain information about theassumptions and their risk factors relating to definedbenefit retirement obligations, fair value of share optionsgranted and fair value of financial asset at fair valuethrough profit or loss respectively. Apart from the above,the Group believes the following critical accountingpolicies also involve significant judgements and estimatesused in the preparation of the financial statements:
(a) Impairment of property, plant and equipment andinvestment property
If the circumstances indicate that the carrying values ofproperty, plant and equipment and investment propertymay not be recoverable, the assets may be considered“impaired”, and an impairment loss may be recognisedin accordance with HKAS 36, Impairment of assets. Thecarrying amounts of property, plant and equipment andinvestment property are reviewed periodically in order toassess whether the recoverable amounts have declinedbelow the carrying amounts. These assets are tested forimpa i rmen t wheneve r e ven t s o r changes i ncircumstances indicate that their recorded carryingamounts may not be recoverable. When such a declinehas occurred, the carrying amount is reduced torecoverable amount. The recoverable amount is thegreater of the net selling price and the value in use. Indetermining the value in use, expected cash flowsgenerated by the asset are discounted to their presentvalue, which requires significant judgement relating tolevel of sale volume, selling price and amount of operatingcosts. The Group uses all readily available information inde te rmin ing an amount tha t i s a reasonab leapproximation of recoverable amount, including estimatesbased on reasonable and supportable assumptions andprojections of sale volume, selling price and amount ofoperating costs.
31
10
32
15 26 27(f)
(a)
36

145
(Expressed in Hong Kong dollars unless otherwise indicated)
Notes to the Financial Statements
32 Accounting estimates and judgements(continued)
(b) Depreciation of property, plant and equipment andinvestment property
Property, plant and equipment and investment propertyare depreciated on a straight-line basis over their estimateduseful lives, after taking into account the estimated residualvalues. The Group reviews the estimated useful lives ofthe assets regularly in order to determine the amount ofdepreciation expense to be recorded during any reportingperiod. The useful lives are based on the Group’s historicalexperience with similar assets and taking into accountanticipated technological changes. The depreciationexpense for future periods is adjusted if there are significantchanges from previous estimates.
(c) Impairment loss for bad and doubtful debts
The Group maintains an impairment loss for bad anddoubtful debts for estimated losses resulting from theinability of the debtors to make required payments. TheGroup bases the estimates of future cash flows on theageing of the trade receivables balance, debtors’ credit-worthiness, and historical write-off experience. If thefinancial condition of the debtors were to deteriorate,actual write-offs would be higher than estimated.
(d) Write down of inventories
The Group performs regular review of the carryingamounts of inventories with reference to aged inventoriesanalysis, expected future consumption and managementjudgement. Based on this review, write down ofinventories will be made when the carrying amounts ofinventories decline below their estimated net realisablevalues. However, actual consumption may be differentfrom estimation and profit or loss could be affected bydifferences in this estimation.
32
(b)
(c)
(d)
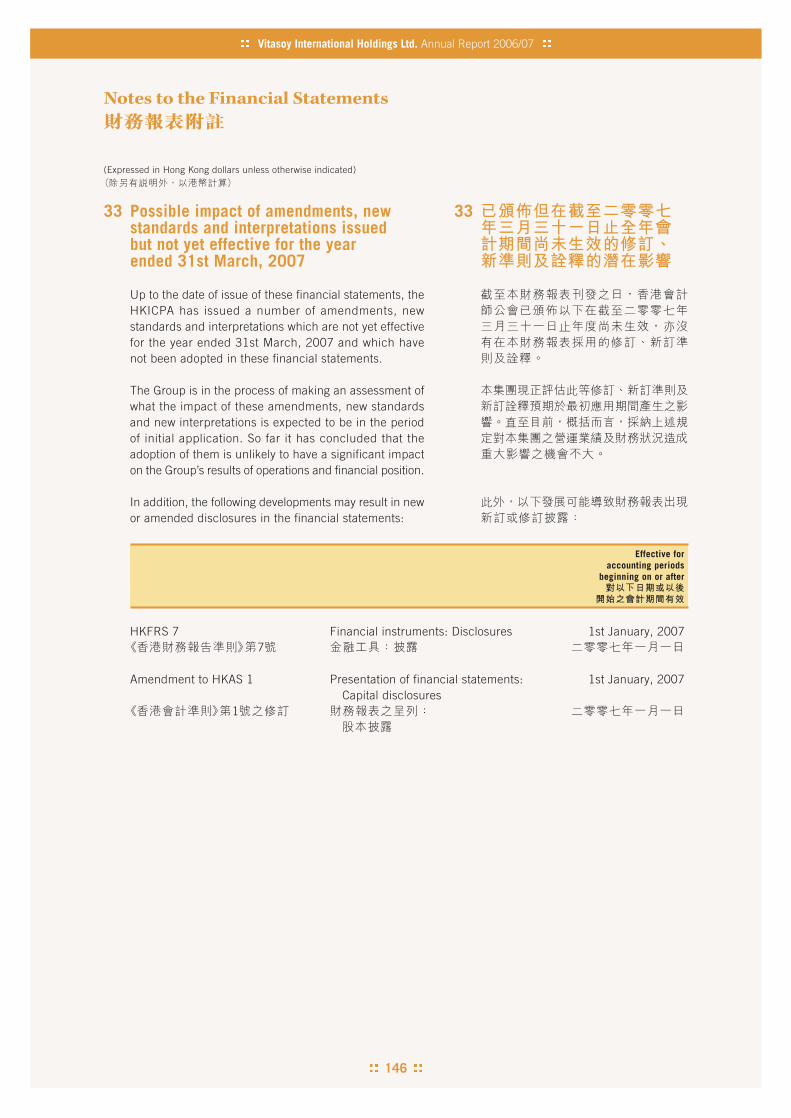
146
Vitasoy International Holdings Ltd. Annual Report 2006/07
(Expressed in Hong Kong dollars unless otherwise indicated)
Notes to the Financial Statements
33 Possible impact of amendments, newstandards and interpretations issuedbut not yet effective for the yearended 31st March, 2007
Up to the date of issue of these financial statements, theHKICPA has issued a number of amendments, newstandards and interpretations which are not yet effectivefor the year ended 31st March, 2007 and which havenot been adopted in these financial statements.
The Group is in the process of making an assessment ofwhat the impact of these amendments, new standardsand new interpretations is expected to be in the periodof initial application. So far it has concluded that theadoption of them is unlikely to have a significant impacton the Group’s results of operations and financial position.
In addition, the following developments may result in newor amended disclosures in the financial statements:
Effective foraccounting periods
beginning on or after
HKFRS 7 Financial instruments: Disclosures 1st January, 20077
Amendment to HKAS 1 Presentation of financial statements: 1st January, 2007Capital disclosures
1
33
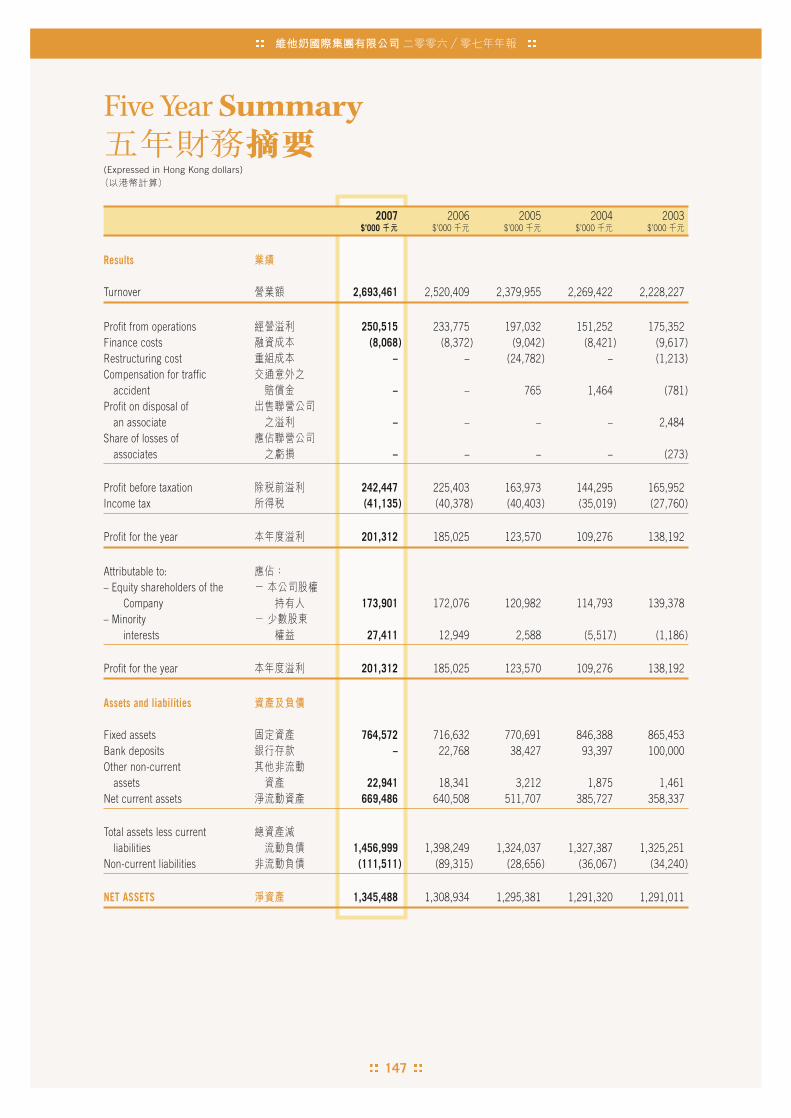
147
Five Year Summary
(Expressed in Hong Kong dollars)
2007 2006 2005 2004 2003$’000 $’000 $’000 $’000 $’000
Results
Turnover 2,693,461 2,520,409 2,379,955 2,269,422 2,228,227
Profit from operations 250,515 233,775 197,032 151,252 175,352Finance costs (8,068) (8,372) (9,042) (8,421) (9,617)Restructuring cost – – (24,782) – (1,213)Compensation for traffic
accident – – 765 1,464 (781)Profit on disposal of
an associate – – – – 2,484Share of losses of
associates – – – – (273)
Profit before taxation 242,447 225,403 163,973 144,295 165,952Income tax (41,135) (40,378) (40,403) (35,019) (27,760)
Profit for the year 201,312 185,025 123,570 109,276 138,192
Attributable to:– Equity shareholders of the
Company 173,901 172,076 120,982 114,793 139,378– Minority
interests 27,411 12,949 2,588 (5,517) (1,186)
Profit for the year 201,312 185,025 123,570 109,276 138,192
Assets and liabilities
Fixed assets 764,572 716,632 770,691 846,388 865,453Bank deposits – 22,768 38,427 93,397 100,000Other non-current
assets 22,941 18,341 3,212 1,875 1,461Net current assets 669,486 640,508 511,707 385,727 358,337
Total assets less currentliabilities 1,456,999 1,398,249 1,324,037 1,327,387 1,325,251
Non-current liabilities (111,511) (89,315) (28,656) (36,067) (34,240)
NET ASSETS 1,345,488 1,308,934 1,295,381 1,291,320 1,291,011
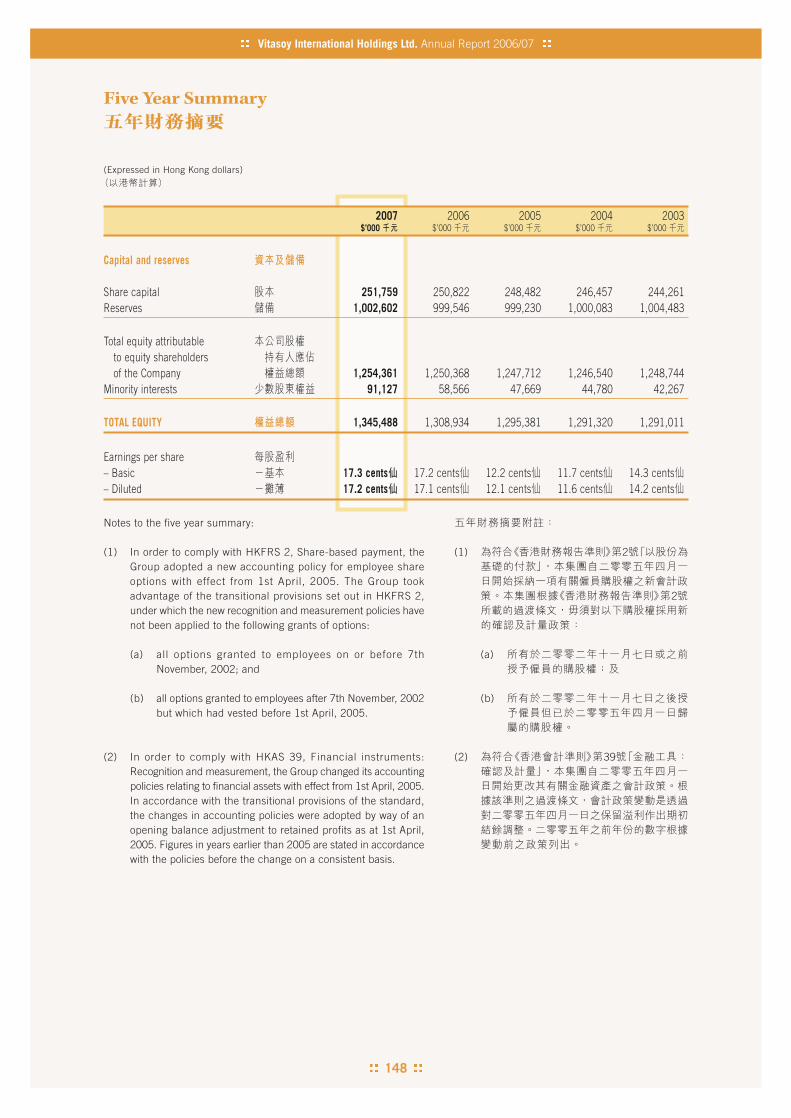
148
(Expressed in Hong Kong dollars)
Vitasoy International Holdings Ltd. Annual Report 2006/07
Five Year Summary
2007 2006 2005 2004 2003$’000 $’000 $’000 $’000 $’000
Capital and reserves
Share capital 251,759 250,822 248,482 246,457 244,261Reserves 1,002,602 999,546 999,230 1,000,083 1,004,483
Total equity attributableto equity shareholdersof the Company 1,254,361 1,250,368 1,247,712 1,246,540 1,248,744
Minority interests 91,127 58,566 47,669 44,780 42,267
TOTAL EQUITY 1,345,488 1,308,934 1,295,381 1,291,320 1,291,011
Earnings per share– Basic 17.3 cents 17.2 cents 12.2 cents 11.7 cents 14.3 cents– Diluted 17.2 cents 17.1 cents 12.1 cents 11.6 cents 14.2 cents
Notes to the five year summary:
(1) In order to comply with HKFRS 2, Share-based payment, theGroup adopted a new accounting policy for employee shareoptions with effect from 1st April, 2005. The Group tookadvantage of the transitional provisions set out in HKFRS 2,under which the new recognition and measurement policies havenot been applied to the following grants of options:
(a) all options granted to employees on or before 7thNovember, 2002; and
(b) all options granted to employees after 7th November, 2002but which had vested before 1st April, 2005.
(2) In order to comply with HKAS 39, Financial instruments:Recognition and measurement, the Group changed its accountingpolicies relating to financial assets with effect from 1st April, 2005.In accordance with the transitional provisions of the standard,the changes in accounting policies were adopted by way of anopening balance adjustment to retained profits as at 1st April,2005. Figures in years earlier than 2005 are stated in accordancewith the policies before the change on a consistent basis.
(1) 2
2
(a)
(b)
(2) 39

Des
ign
and
Pro
duct
ion:
i.Li
nk F
inan
cial
Prin
ting
Serv
ices
Lim
ited
ww
w.il
inkf
in.c
om
Vitasoy International Holdings LimitedNo.1, Kin Wong Street, Tuen Mun
New Territories, Hong Kong
維他奶國際集團有限公司香港新界屯門建旺街一號
Tel 電話 (852) 2466 0333
Fax 傳真 (852) 2456 3441
www.vitasoy.comwww.vitasoy.com.hkwww.vitaland.com.hkwww.hkgourmet.com.hkwww.vitasoy-chn.comwww.vitasoy-usa.comwww.vitasoy.com.au