Embed Size (px)
Citation preview
DISTRICT GROUNDWATER BROCHURE
NAMAKKAL DISTRICT, TAMIL NADU
By
A.Subburaj
Scientist-D
Government of India
Ministry of Water Resources
Central Ground Water Board South Eastern Coastal Region
Chennai
December 2008
For official use
Technical Report Series
1
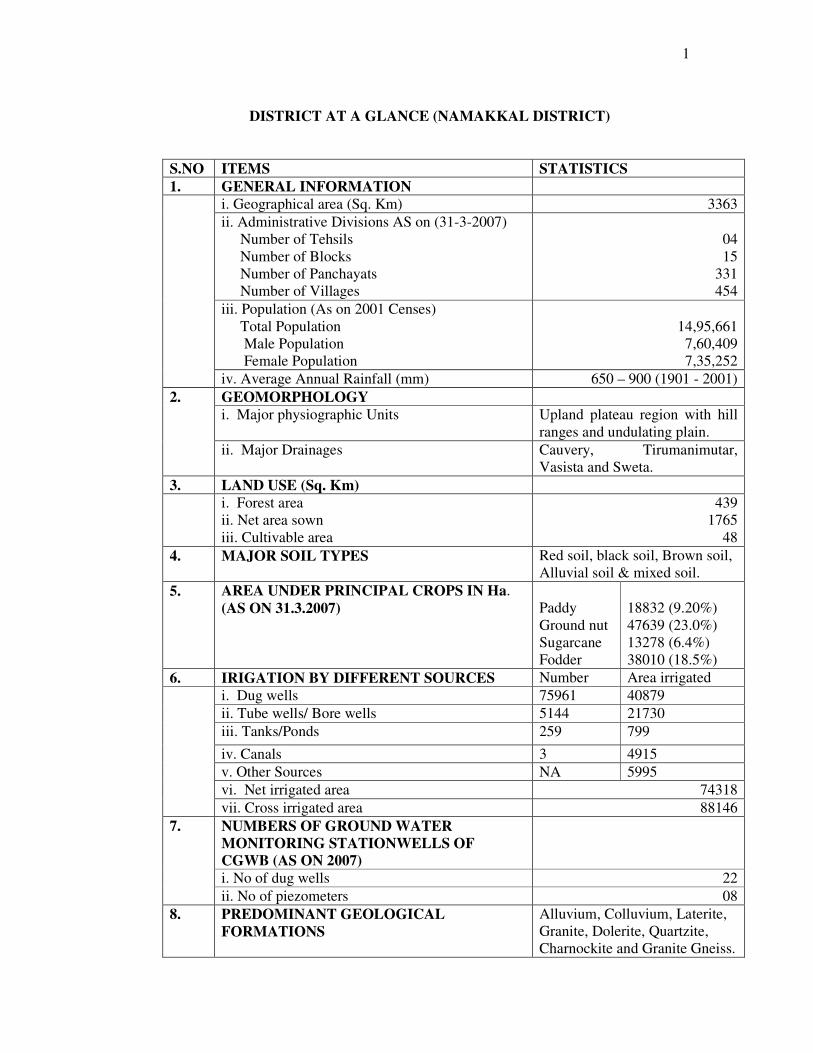
DISTRICT AT A GLANCE (NAMAKKAL DISTRICT)
S.NO ITEMS STATISTICS
1. GENERAL INFORMATION
i. Geographical area (Sq. Km) 3363
ii. Administrative Divisions AS on (31-3-2007)
Number of Tehsils
Number of Blocks
Number of Panchayats
Number of Villages
04
15
331
454
iii. Population (As on 2001 Censes)
Total Population
Male Population
Female Population
14,95,661
7,60,409
7,35,252
iv. Average Annual Rainfall (mm) 650 – 900 (1901 - 2001)
GEOMORPHOLOGY
i. Major physiographic Units Upland plateau region with hill
ranges and undulating plain.
2.
ii. Major Drainages Cauvery, Tirumanimutar,
Vasista and Sweta.
3. LAND USE (Sq. Km)
i. Forest area
ii. Net area sown
iii. Cultivable area
439
1765
48
4. MAJOR SOIL TYPES Red soil, black soil, Brown soil,
Alluvial soil & mixed soil.
5. AREA UNDER PRINCIPAL CROPS IN Ha.
(AS ON 31.3.2007)
Paddy
Ground nut
Sugarcane
Fodder
18832 (9.20%)
47639 (23.0%)
13278 (6.4%)
38010 (18.5%)
6. IRIGATION BY DIFFERENT SOURCES Number Area irrigated
i. Dug wells 75961 40879
ii. Tube wells/ Bore wells 5144 21730
iii. Tanks/Ponds 259 799
iv. Canals 3 4915
v. Other Sources NA 5995
vi. Net irrigated area 74318
vii. Cross irrigated area 88146
NUMBERS OF GROUND WATER
MONITORING STATIONWELLS OF
CGWB (AS ON 2007)
i. No of dug wells 22
7.
ii. No of piezometers 08
8. PREDOMINANT GEOLOGICAL
FORMATIONS
Alluvium, Colluvium, Laterite,
Granite, Dolerite, Quartzite,
Charnockite and Granite Gneiss.
2
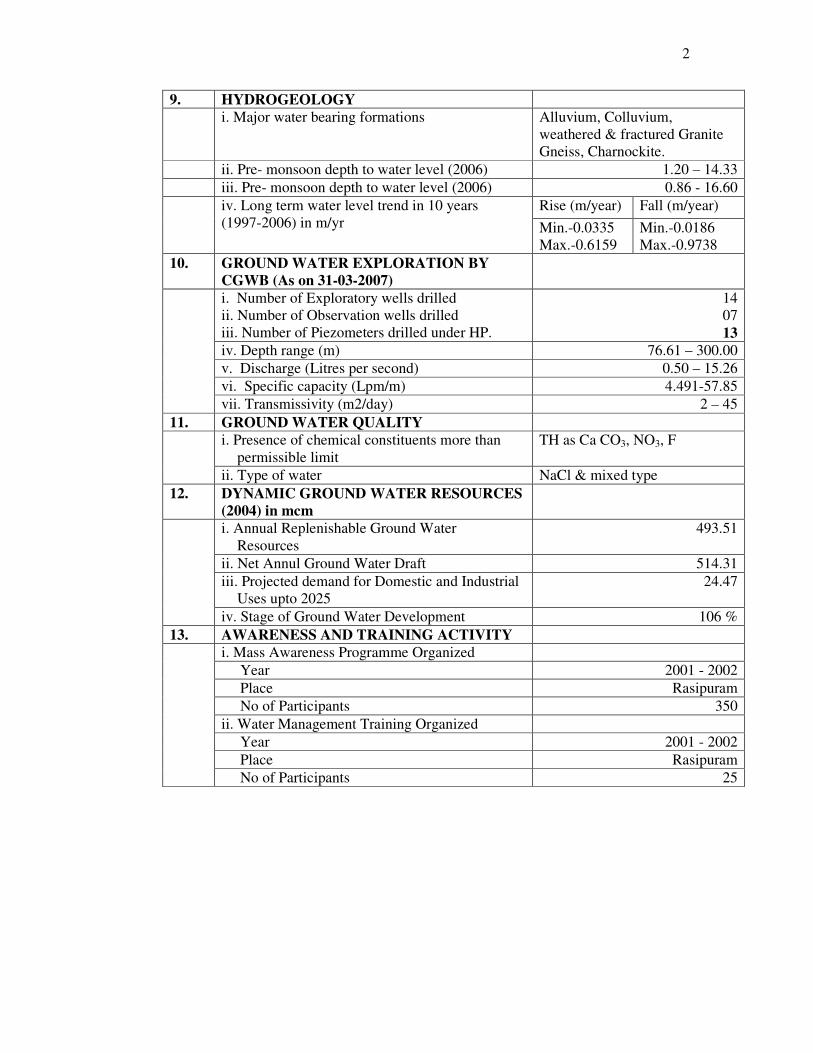
9. HYDROGEOLOGY
i. Major water bearing formations Alluvium, Colluvium,
weathered & fractured Granite
Gneiss, Charnockite.
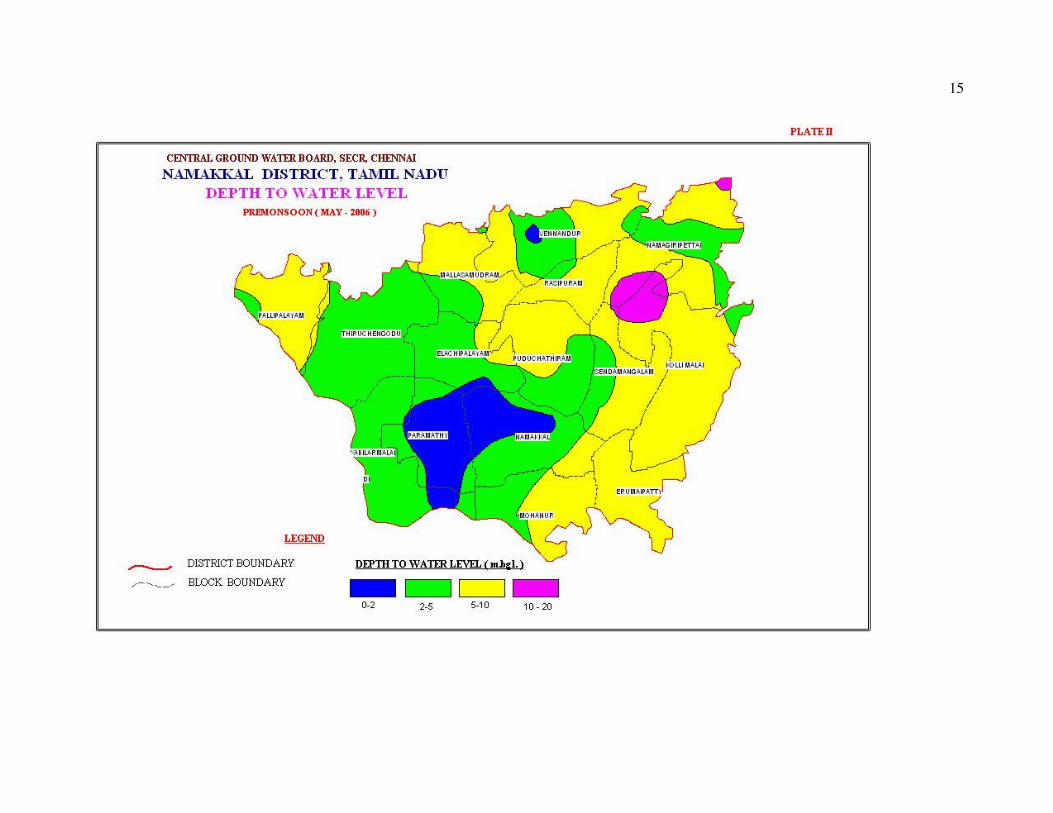
ii. Pre- monsoon depth to water level (2006) 1.20 – 14.33
iii. Pre- monsoon depth to water level (2006) 0.86 - 16.60
Rise (m/year) Fall (m/year) iv. Long term water level trend in 10 years
(1997-2006) in m/yr Min.-0.0335
Max.-0.6159
Min.-0.0186
Max.-0.9738
10. GROUND WATER EXPLORATION BY
CGWB (As on 31-03-2007)
i. Number of Exploratory wells drilled
ii. Number of Observation wells drilled
iii. Number of Piezometers drilled under HP.
14
07
13
iv. Depth range (m) 76.61 – 300.00
v. Discharge (Litres per second) 0.50 – 15.26
vi. Specific capacity (Lpm/m) 4.491-57.85
vii. Transmissivity (m2/day) 2 – 45
11. GROUND WATER QUALITY
i. Presence of chemical constituents more than
permissible limit
TH as Ca CO3, NO3, F
ii. Type of water NaCl & mixed type
12. DYNAMIC GROUND WATER RESOURCES
(2004) in mcm
i. Annual Replenishable Ground Water
Resources
493.51
ii. Net Annul Ground Water Draft 514.31
iii. Projected demand for Domestic and Industrial
Uses upto 2025
24.47
iv. Stage of Ground Water Development 106 %
13. AWARENESS AND TRAINING ACTIVITY
i. Mass Awareness Programme Organized
Year 2001 - 2002
Place Rasipuram
No of Participants 350
ii. Water Management Training Organized
Year 2001 - 2002
Place Rasipuram
No of Participants 25
3
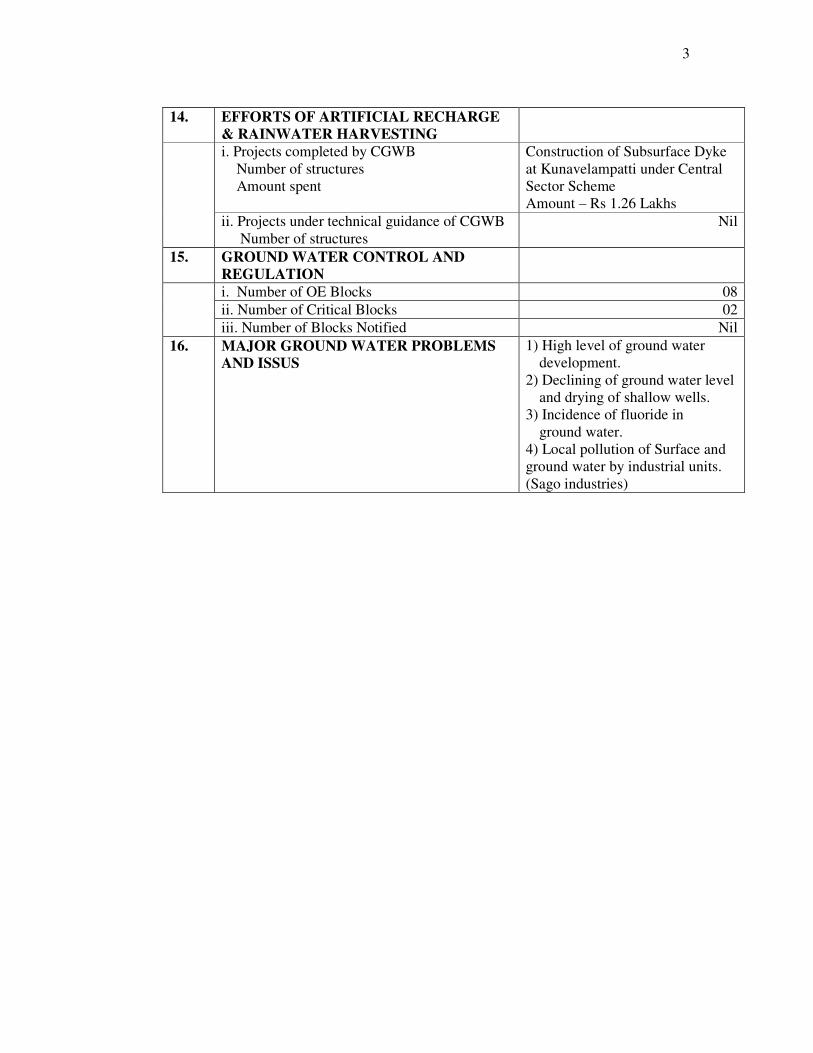
14. EFFORTS OF ARTIFICIAL RECHARGE
& RAINWATER HARVESTING
i. Projects completed by CGWB
Number of structures
Amount spent
Construction of Subsurface Dyke
at Kunavelampatti under Central
Sector Scheme
Amount – Rs 1.26 Lakhs
ii. Projects under technical guidance of CGWB
Number of structures
Nil
15. GROUND WATER CONTROL AND
REGULATION
i. Number of OE Blocks 08
ii. Number of Critical Blocks 02
iii. Number of Blocks Notified Nil
16. MAJOR GROUND WATER PROBLEMS
AND ISSUS
1) High level of ground water
development.
2) Declining of ground water level
and drying of shallow wells.
3) Incidence of fluoride in
ground water.
4) Local pollution of Surface and
ground water by industrial units.
(Sago industries)
4
1.0 INTRODUCTION
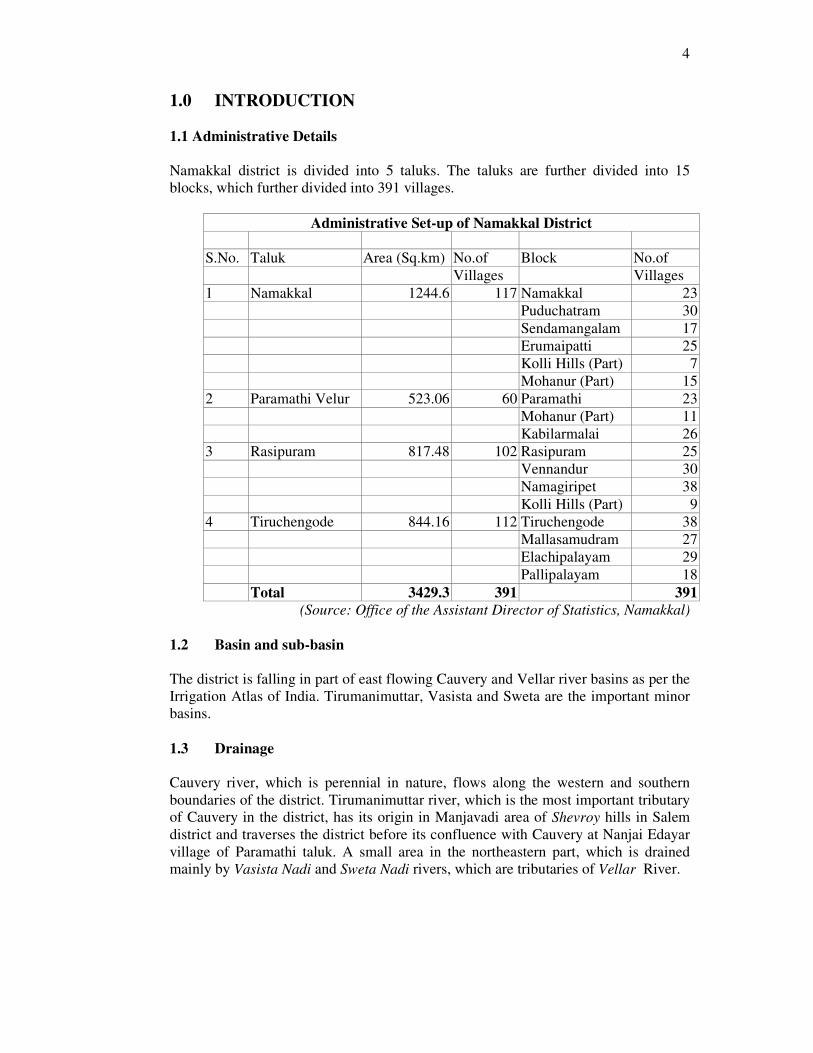
1.1 Administrative Details
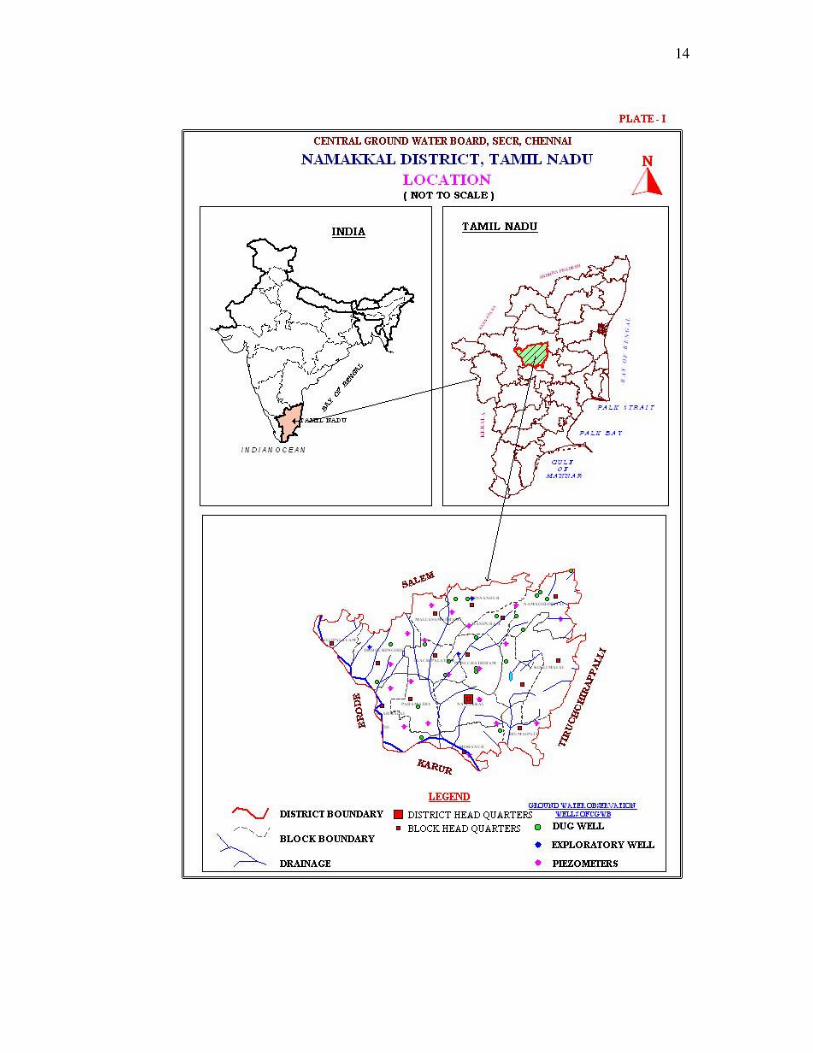
Namakkal district is divided into 5 taluks. The taluks are further divided into 15
blocks, which further divided into 391 villages.
Administrative Set-up of Namakkal District
S.No. Taluk Area (Sq.km) No.of Block No.of
Villages Villages
1 Namakkal 1244.6 117 Namakkal 23
Puduchatram 30
Sendamangalam 17
Erumaipatti 25
Kolli Hills (Part) 7
Mohanur (Part) 15
2 Paramathi Velur 523.06 60 Paramathi 23
Mohanur (Part) 11
Kabilarmalai 26
3 Rasipuram 817.48 102 Rasipuram 25
Vennandur 30
Namagiripet 38
Kolli Hills (Part) 9
4 Tiruchengode 844.16 112 Tiruchengode 38
Mallasamudram 27
Elachipalayam 29
Pallipalayam 18
Total 3429.3 391 391
(Source: Office of the Assistant Director of Statistics, Namakkal)
1.2 Basin and sub-basin
The district is falling in part of east flowing Cauvery and Vellar river basins as per the
Irrigation Atlas of India. Tirumanimuttar, Vasista and Sweta are the important minor
basins.
1.3 Drainage
Cauvery river, which is perennial in nature, flows along the western and southern
boundaries of the district. Tirumanimuttar river, which is the most important tributary
of Cauvery in the district, has its origin in Manjavadi area of Shevroy hills in Salem
district and traverses the district before its confluence with Cauvery at Nanjai Edayar
village of Paramathi taluk. A small area in the northeastern part, which is drained
mainly by Vasista Nadi and Sweta Nadi rivers, which are tributaries of Vellar River.
5
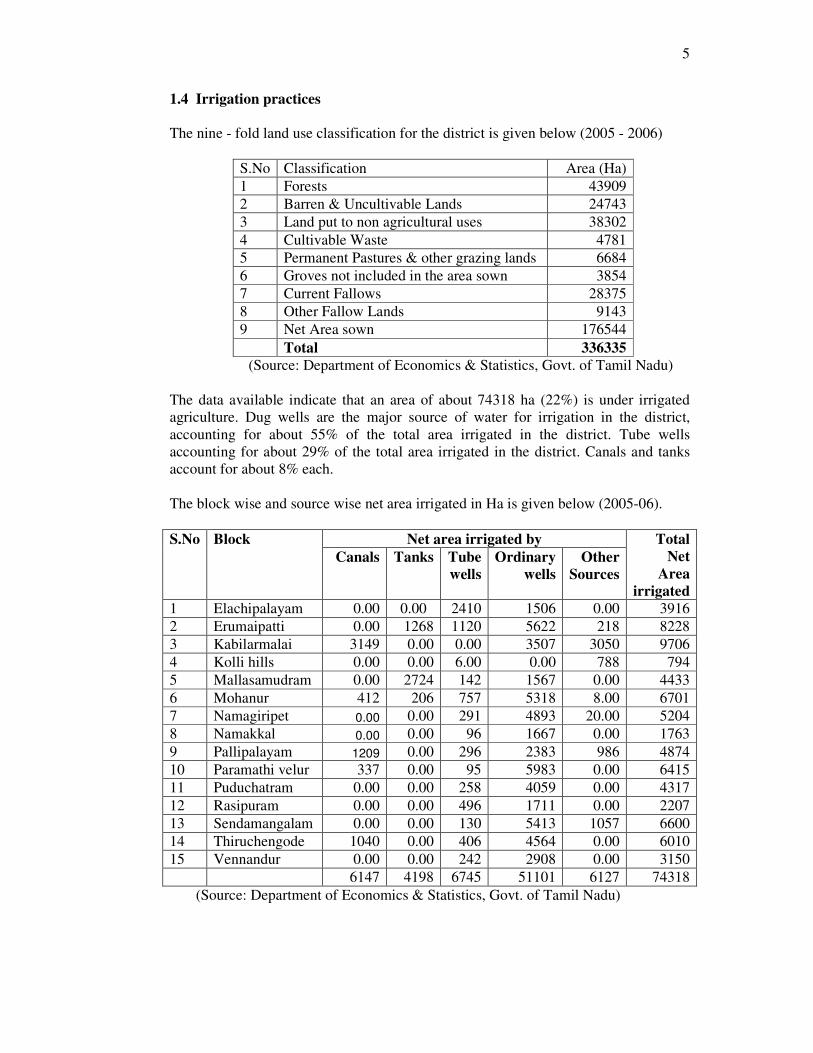
1.4 Irrigation practices
The nine - fold land use classification for the district is given below (2005 - 2006)
S.No Classification Area (Ha)
1 Forests 43909
2 Barren & Uncultivable Lands 24743
3 Land put to non agricultural uses 38302
4 Cultivable Waste 4781
5 Permanent Pastures & other grazing lands 6684
6 Groves not included in the area sown 3854
7 Current Fallows 28375
8 Other Fallow Lands 9143
9 Net Area sown 176544
Total 336335
(Source: Department of Economics & Statistics, Govt. of Tamil Nadu)
The data available indicate that an area of about 74318 ha (22%) is under irrigated
agriculture. Dug wells are the major source of water for irrigation in the district,
accounting for about 55% of the total area irrigated in the district. Tube wells
accounting for about 29% of the total area irrigated in the district. Canals and tanks
account for about 8% each.
The block wise and source wise net area irrigated in Ha is given below (2005-06).
Net area irrigated by S.No Block
Canals Tanks Tube
wells
Ordinary
wells
Other
Sources
Total
Net
Area
irrigated
1 Elachipalayam 0.00 0.00 2410 1506 0.00 3916
2 Erumaipatti 0.00 1268 1120 5622 218 8228
3 Kabilarmalai 3149 0.00 0.00 3507 3050 9706
4 Kolli hills 0.00 0.00 6.00 0.00 788 794
5 Mallasamudram 0.00 2724 142 1567 0.00 4433
6 Mohanur 412 206 757 5318 8.00 6701
7 Namagiripet 0.00 0.00 291 4893 20.00 5204
8 Namakkal 0.00 0.00 96 1667 0.00 1763
9 Pallipalayam 1209 0.00 296 2383 986 4874
10 Paramathi velur 337 0.00 95 5983 0.00 6415
11 Puduchatram 0.00 0.00 258 4059 0.00 4317
12 Rasipuram 0.00 0.00 496 1711 0.00 2207
13 Sendamangalam 0.00 0.00 130 5413 1057 6600
14 Thiruchengode 1040 0.00 406 4564 0.00 6010
15 Vennandur 0.00 0.00 242 2908 0.00 3150
6147 4198 6745 51101 6127 74318
(Source: Department of Economics & Statistics, Govt. of Tamil Nadu)
6
1.5 Studies/Activities carried out by CGWB
Central Ground Water Board completed systematic surveys in 1982-83 and District
Ground Water Management studies were taken up during 1990-92 and subsequently
in 2000-01. Geophysical investigations for assessing the geo-electric characteristics of
sub-surface litho-units have also been done by Central Ground Water Board for
selection and pin-pointing of sites for exploratory drilling.
Central Ground Water Board took up ground water exploration for delineation of
aquifers and for assessing their yield characteristics by drilling of exploratory wells
during 1985-86 and 1990-91. 17 exploratory wells and 9 observation wells in the
depth range of 76 to 300 m. bgl were drilled for this purpose in the district. In 2004-
05, 12 exploratory wells were constructed by Central Ground Water Board for
drought mitigation through out-sourcing.
In additions, Central Ground Water Board has also carried out a number of short –
term water supply investigations in the district for various government agencies.
CGWB is monitoring the groundwater regime for the changes in water level and
water quality through 22 dug wells and 8 piezometers. The monitoring of water levels
are carried out during May (Pre monsoon), August (Middle of south west monsoon),
November (post south west monsoon & initial stage of north east monsoon) &
January (Post North east monsoon) to study the impact of rainfall on groundwater
regime. Water samples are collected during May for determining the changes in
chemical quality of groundwater with time.
2.0 RAINFALLS AND CLIMATE
The district receives the rain under the influence of both southwest and northeast
monsoons. The northeast monsoon chiefly contributes to the rainfall in the district.
Most of the precipitation occurs in the form of cyclonic storms caused due to the
depressions in Bay of Bengal. The southwest monsoon rainfall is highly erratic and
summer rains are negligible.
Rainfall data from six stations over the period 1901-2000 were utilized and a perusal
of the analysis shows that the normal annual rainfall over the district varies from
about 640 mm to 880 mm. It is the minimum around Paramathi (640.50 mm) in the
southwestern part of the district. It gradually increases towards north, northeast and
east and attains a maximum around Rasipuram (880.5 mm) in the northern part.
The district enjoys a tropical climate. The weather is pleasant during the period from
November to January. Mornings in general are more humid than the afternoons, with
the humidity exceeding 78% on an average. In the period June to November the
afternoon humidity exceeds 66% on an average. In the rest of the year the afternoons
are drier, the summer afternoons being the driest.
The hot weather begins early in March, the highest temperature being felt in April and
May. Weather cools down progressively from about the middle of June and by
December, the mean daily maximum temperature drops to 30.2°C, while the mean
daily minimum drops to 19.2°C and 19.6°C in January in Salem and Mettur Dam
7
respectively. Though the maximum temperatures in February are about the same as in
July, the nights are much cooler in February.
Being an interior district, the diurnal range of temperature is large, particularly in the
dry and hot seasons. In February-March the mean diurnal range of temperature is as
high as 13.7°C while in October-November it is only about 9°C.
3.0 GEOMORPHYLOGY AND SOIL TYPES
3.1 Geomorphology
Namakkal district forms part of the upland plateau region of Tamil Nadu with many
hill ranges, hillocks and undulating terrain with a gentle slope towards east.
The prominent geomorphic units identified in the district through interpretation of
Satellite imagery are 1) Structural hills, 2) Bazada zone, 3) Valley fill, 4) Pediments,
5) Shallow Pediments and 6) Deep Pediments.
A number of hill ranges are located in the eastern and northeastern parts of the
district, whereas the southern, western and northern parts of the district are plain to
undulating, dotted with a few isolated hillocks. The important hill ranges in the
district are Kollimalai hills, Bodamalai hills, Naraikinaru hills and Pachamalai hills.
The highest peak in the district is the Kollimalai hill peak with an elevation of 1293
m. above MSL. Other important peaks are Kedda Malai (1284 m) and Melur hill in
the Bodamalai hill range.
3.2 Soils
The soils of Namakkal district can be broadly classified into 5 major soils types viz.,
Red Soil, Black Soil, Brown soil, Alluvial and Mixed Soil. Major part of the district
covered by Red Soil. Block soils are mostly seen in Namakkal taluk. Brown Soil
occupies only a small portion of Tiruchengode taluk and the Alluvial Soil is seen
along the river courses in Namakkal, Paramathi and Tiruchengode taluks. Mixed soil
is the second major soil type occurring all the taluks of the districts
4.0 GROUND WATER SCENARIO
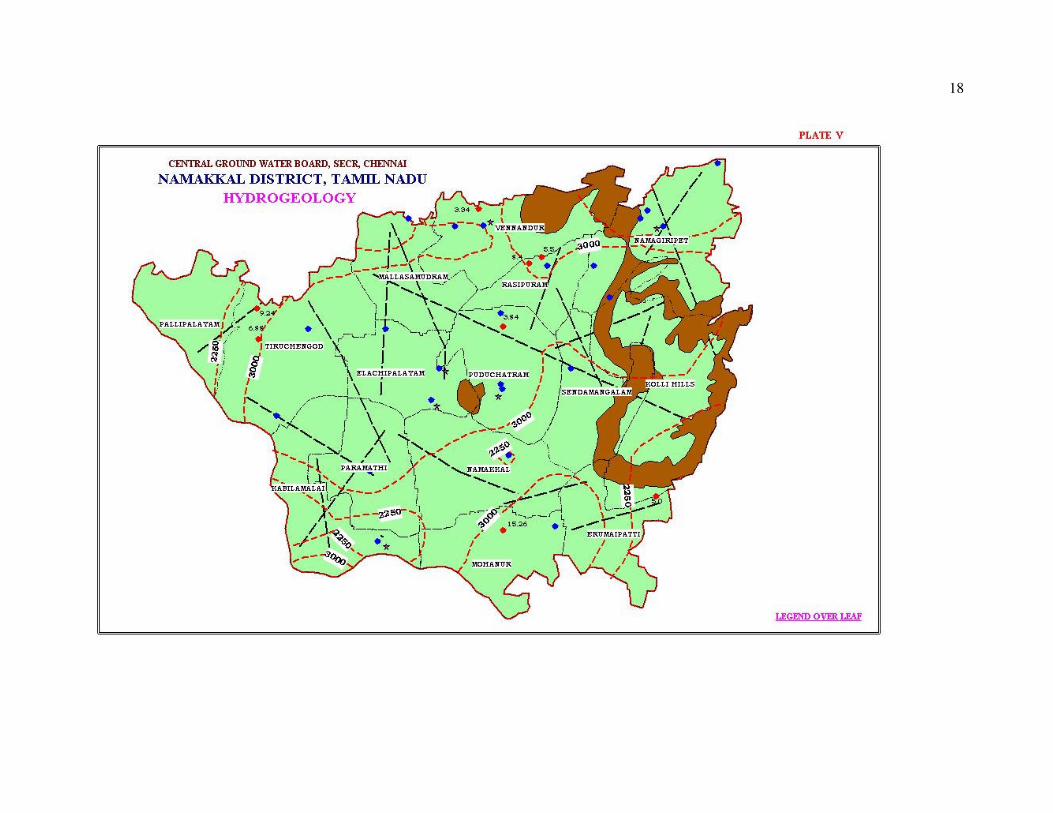
4.1 Hydrogeology Namakkal district is underlain entirely by Archaean Crystalline formations with
Recent alluvial deposits occurring along the river courses and Colluvium at the foot
hills. The important aquifer systems in the district are constituted by weathered &
fractured crystalline rocks and Colluvial deposits.
The porous formations in the district are represented by alluvium and colluvium. The
alluvial deposits are confined to the major river courses only. Ground water occurs
under phreatic conditions. The maximum saturated thickness of these aquifers is up to
5 m depending upon the topographic conditions. The area lying at the foot hill zones
which are seen in the northern parts of the district is underlain by the colluvial
material derived from the near by hill ranges comprising sands and gravels. The
maximum saturated thickness of these aquifers is up to 20 m depending upon the
topographic conditions. Ground water occurs under phreatic conditions.
8
The hard consolidated crystalline rocks of Archaean age represent weathered and
fractured formations of Granite Gneiss, Granite, Charnockite and other associated
rocks. Ground water occurs under phreatic conditions in the weathered mantle and
under semi-confined conditions in the fractured zones. The thickness of weathered
zone in the district ranges from <1m to 30m. It is within the depth of 20 m in major
part of the district while in the western and extreme north-north-eastern parts of the
district, they are more than 20 m. The depth of the dug wells ranged from 7 to 45m
bgl. The yield of the open wells range from <50 to 200 m3/day in weathered
crystalline rocks and up to 400 m3/day in Recent alluvial formations along major
drainage courses.
The Specific capacity of large diameter wells tested in crystalline rocks from 59 to
270 lpm/m of drawdown. The yield characteristics of wells vary considerably
depending on the topographic set-up, lithology and the degree of weathering
The yield of bore wells drilled down to a depth of 40 to 100 m, by various state
agencies mainly for domestic purposes ranged from 90 to 360 litres per hour (<1 lps).
The yield of successful bore wells drilled down to a depth of 300 m bgl during the
ground water exploration programme of Central Ground Water Board ranged from <1
to 15 lps. The aquifer and well parameters of the wells show wide variation.
The depth to water level in the district varied between 1.20 – 14.33 m bgl during pre-
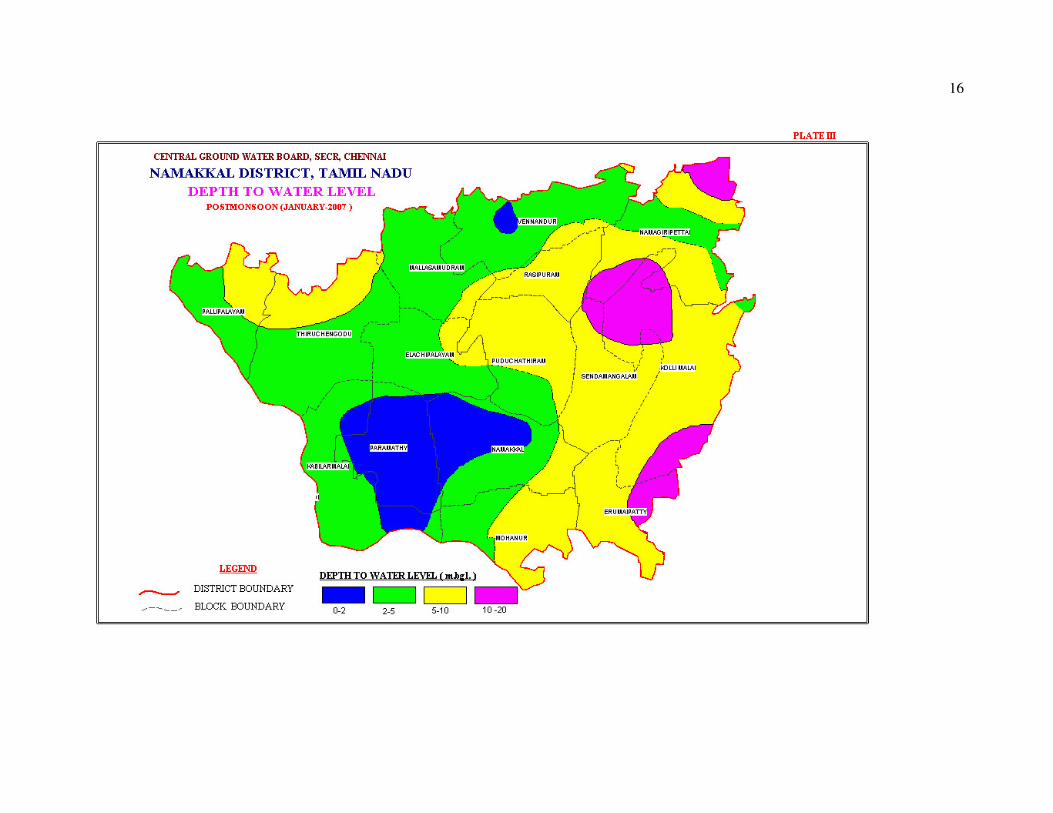
monsoon depth to water level (May 2006) and varied between 0.86 – 16.60 m bgl
during post monsoon depth to water level (Jan 2007). The seasonal fluctuation shows
a rise in water level, which ranges from 0.03 to 3.51 m bgl. The piezometric head
varied between 1.35 to 9.40 m bgl (May 2006) during pre-monsoon and G.L to 13.00
m bgl during post monsoon.
4.1.1 Long Term Fluctuation (1998-2007)
The long-term water level fluctuation for the period 1998-2007 indicates both rise and
fall in water level in different parts of the district. The rise is of the order of 0.0335 -
0.6159 m/year, while the fall in water level range between 0.0186 - 0.9738 m/year.
4.1.2 Aquifer Parameters
Aquifer Parameters Weathered
Residuum
Fractured Aquifer
Transmissivity (m2/day) <1 - 100 2 -106
Storativity - 9.6 x 10⁻⁵ - 4.3 x 10⁻²
Specific yield 0.015 -
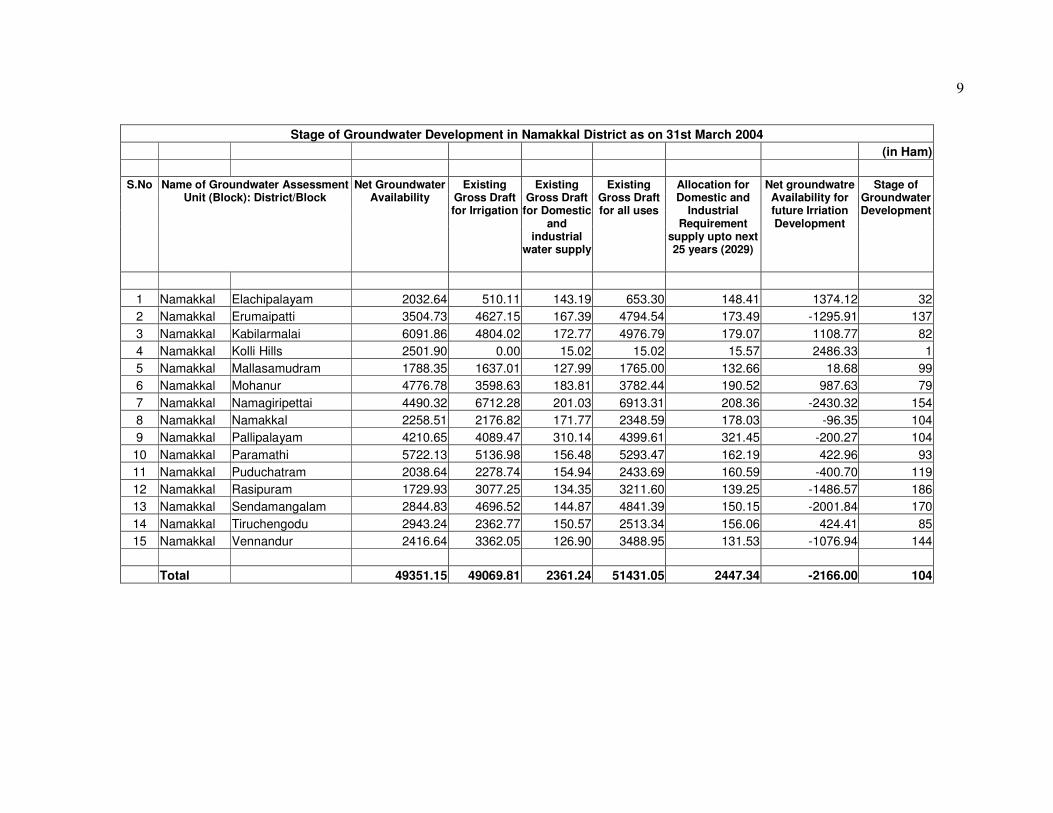
4.2 Ground Water Resources
The ground water resources have been computed jointly by Central Ground Water
Board and State Ground & Surface Water Resources and Development Centre (PWD,
WRO, Government of Tamil Nadu) as on 31st March 2004. The salient features of the
computations are furnished below. The computation of ground water resources
available in the district has been done using GEC 1997 methodology.
9
Stage of Groundwater Development in Namakkal District as on 31st March 2004
(in Ham)
S.No Name of Groundwater Assessment
Unit (Block): District/Block Net Groundwater
Availability Existing
Gross Draft for Irrigation
Existing Gross Draft
for Domestic and
industrial water supply
Existing Gross Draft for all uses
Allocation for Domestic and
Industrial Requirement
supply upto next 25 years (2029)
Net groundwatre Availability for future Irriation Development
Stage of Groundwater Development
1 Namakkal Elachipalayam 2032.64 510.11 143.19 653.30 148.41 1374.12 32
2 Namakkal Erumaipatti 3504.73 4627.15 167.39 4794.54 173.49 -1295.91 137
3 Namakkal Kabilarmalai 6091.86 4804.02 172.77 4976.79 179.07 1108.77 82
4 Namakkal Kolli Hills 2501.90 0.00 15.02 15.02 15.57 2486.33 1
5 Namakkal Mallasamudram 1788.35 1637.01 127.99 1765.00 132.66 18.68 99
6 Namakkal Mohanur 4776.78 3598.63 183.81 3782.44 190.52 987.63 79
7 Namakkal Namagiripettai 4490.32 6712.28 201.03 6913.31 208.36 -2430.32 154
8 Namakkal Namakkal 2258.51 2176.82 171.77 2348.59 178.03 -96.35 104
9 Namakkal Pallipalayam 4210.65 4089.47 310.14 4399.61 321.45 -200.27 104
10 Namakkal Paramathi 5722.13 5136.98 156.48 5293.47 162.19 422.96 93
11 Namakkal Puduchatram 2038.64 2278.74 154.94 2433.69 160.59 -400.70 119
12 Namakkal Rasipuram 1729.93 3077.25 134.35 3211.60 139.25 -1486.57 186
13 Namakkal Sendamangalam 2844.83 4696.52 144.87 4841.39 150.15 -2001.84 170
14 Namakkal Tiruchengodu 2943.24 2362.77 150.57 2513.34 156.06 424.41 85
15 Namakkal Vennandur 2416.64 3362.05 126.90 3488.95 131.53 -1076.94 144
Total 49351.15 49069.81 2361.24 51431.05 2447.34 -2166.00 104
10
4.3 Ground Water Quality
Ground water in phreatic aquifers in Namakkal district is in general colorless,
odorless and predominantly alkaline in nature. The specific electrical conductance of
ground water in phreatic zone (in Micro Seimens at 25o C) during May 2006 was in
the range of 1300 to 7080 in the district. It is between 2000 and 4000 µS/cm at 25°C
in the major part of the district.
It is observed that only in selected places of the district, the ground water is suitable
for drinking and domestic uses in respect of all the constituents. The total Hardness as
CaCO3 as well as nitrate is observed to be in excess of permissible limits in about 66
and 86 percent of samples analysed. Fluoride in excess of the drinking water limit of
1.5 mg/l is observed in 30 percent of the samples. In about 14 percent of the samples
sulphates was in excess of the drinking water limit of 400 mg/l. The incidence of
high total hardness and fluoride is attributed to the composition of lithounits
constituting the aquifers in the district, whereas the nitrate pollution is most likely due
to the use of fertilizers and other improper waste disposal. Excess of fluoride is
observed in places such as Venandur, Udaiyarpalayam, Talamabadi, V.G.Patti and
Mohanur.
With regard to irrigation suitability based on specific electrical conductance and
sodium Absorption Ratio (SAR), it is observed that ground water in the phreatic zone
may cause high to very high salinity hazard and medium to high alkali hazard when
used for irrigation. Proper soil management strategies are to be adopted in the major
part of the district while ground water for irrigation.
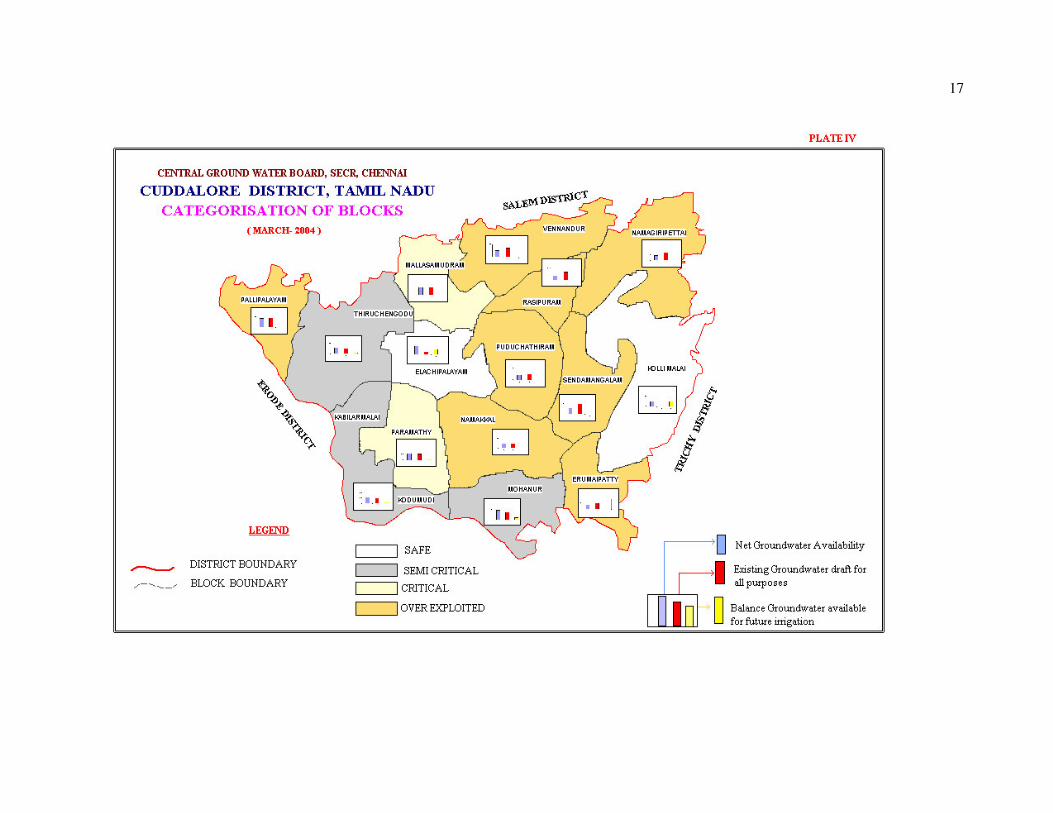
4.4 Status of Ground Water Development
The estimation of groundwater resources for the district has shown that 8 blocks are
over exploited and 2 blocks are under “critical” category.
Tamil Nadu Water Supply and Drainage (TWAD) Board is the Government agency
responsible for providing drinking water supplies to the urban and rural populace in
the district. The water requirements of the habitations are met with either through
surface water sources or through various Mini Water Supply Schemes or Integrated
water supply schemes utilising the available ground water resources. The status of
urban and rural water supply in the district as in March 2007 is furnished below
Total Number of Rural Habitants : 2875
Not Covered : 395 (0-9 LPCD)
Partly Covered : 1422 (10-39 LPCD)
Fully Covered : 1058 (>40 LPCD)
The habitants of 5 Municipalities of the district are provided with 70 - 90 LPCD water
and the habitants 19 Special Panchayats are provided with 20 – 70 LPCD water. Dug
wells have traditionally been the most common ground water abstraction structures
used for irrigation in the district, with yields ranging from <50 to 200 m3/day in
weathered crystalline rocks and up to 400 m3/day in Recent alluvial formations along
major drainage courses.
11
5.0 GROUNDWATER MANAGEMENT STRATEGY
5.1 Groundwater Development
In view of the comparatively high level of ground water development in the major
part of the district and the quality problems due to geoogenic and anthropogenic
factors, it is necessary to exercise caution while planning further development of
available ground water resources in the district.
The development of ground water for irrigation in the district is mainly through dug
wells tapping the weathered residuum. The yields of dug wells are improved at
favourable locations by construction of extension bores, which are 40 to 70m deep.
Bore wells have also become popular as the source for irrigation in the district in
recent years. Dug wells with extension bores wherever necessary is ideal for hard rock
areas whereas large diameter dug wells with radials is suitable for alluvial areas. The
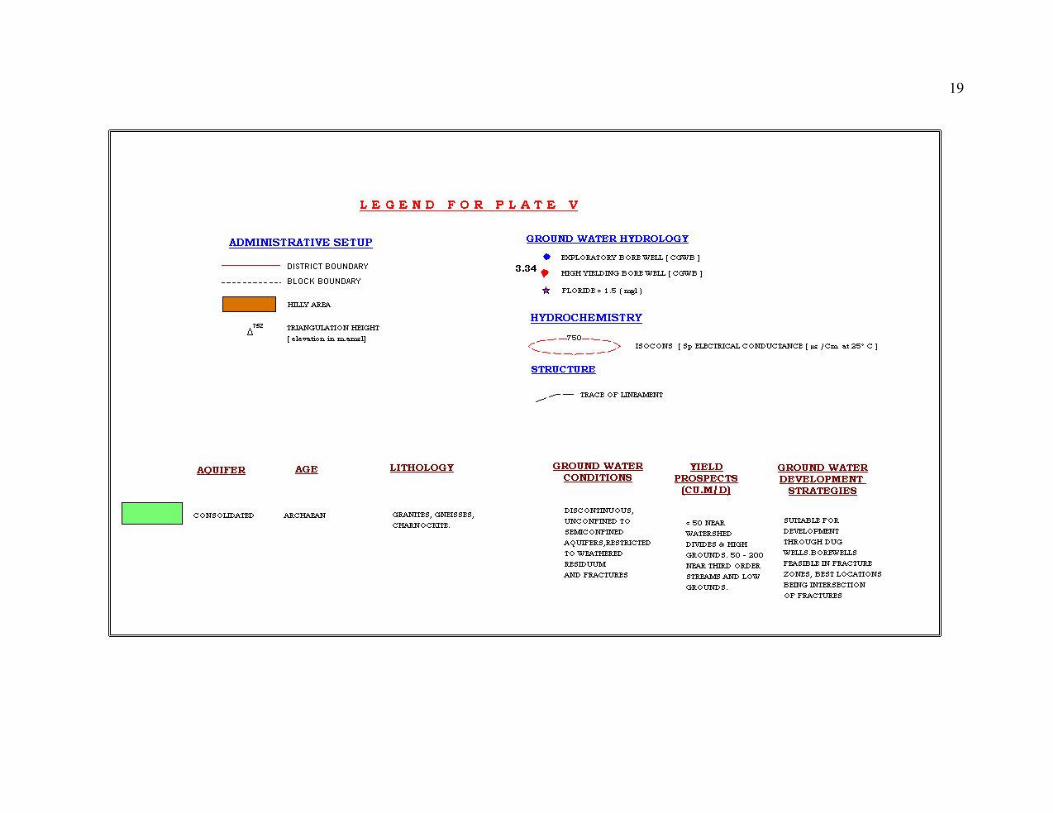
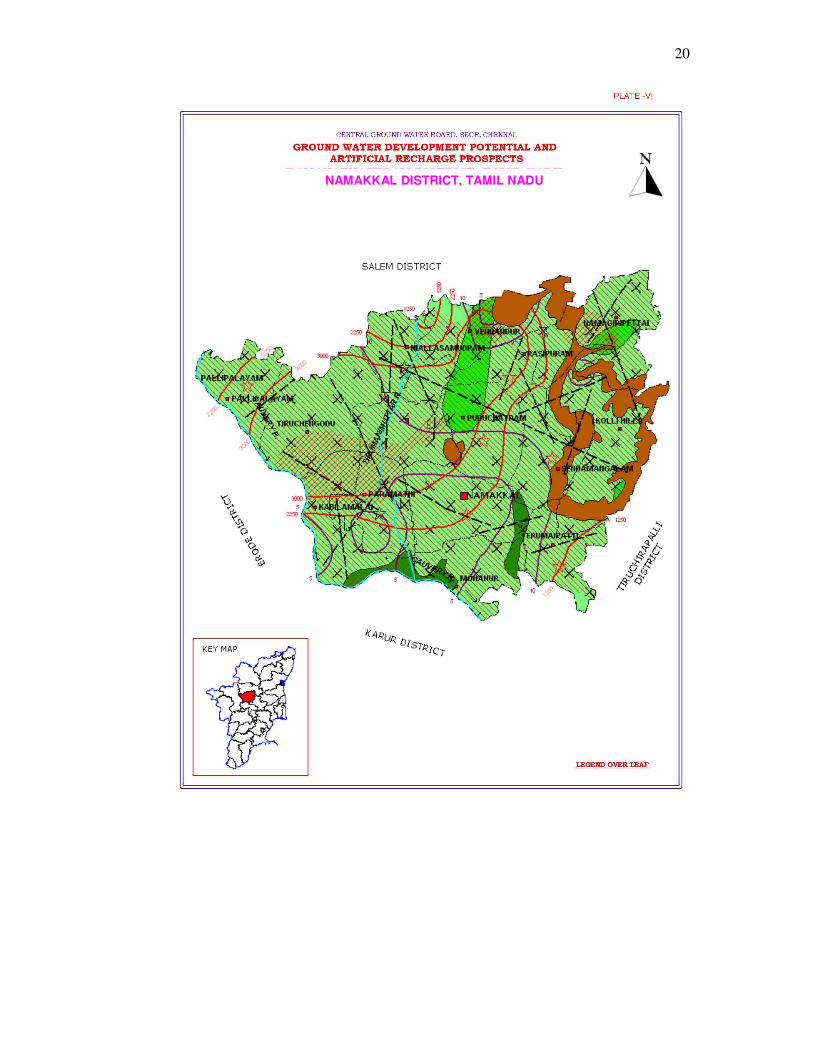
map showing the development prospects for the district is shown in Plate VI.
5.2 Water Conservation and Artificial Recharge
CGWB had prepared a master plan to augment groundwater potential by saturating
the shallow aquifer taking into consideration the available unsaturated space during
post monsoon and available uncommitted surplus run off. Subsequently, computations
have been made for Drought Prone Area Programme (DPAP) for over exploited and
critical blocks in the districts warranting immediate attention. Institute of Remote
Sensing, Anna University had prepared block wise maps demarcating potential zones
for artificial recharge for the State of Tamil Nadu. Subsequently, State Government
agencies have constructed artificial recharge structures with their own fund or with
fund from Central Government, dovetailing various government programmes.
Ministry of Water Resources, Government of India has initiated Dug Well Recharge
Scheme in the State. The scheme is being implemented by the Nodal Department
(SG&SWRDC, PWD, WRO, Government of Tamil Nadu) with the technical
guidance of CGWB. The subsidy of Rs4000/- for small and marginal farmers and
Rs2000/- for the other farmers is credited to the beneficiaries’ bank account through
NABARD. The scheme after implementation will prove to be beneficial to the
irrigation sector. The available uncommitted surplus run off has to be recomputed,
taking into consideration the quantum of recharge effected through existing irrigation
dug wells also. The existing structures and uncommitted surplus flow should be
considered for further planning of artificial recharge programme.
On the basis of experimental studies, it has been found that desilting of existing tanks
followed by percolation pond with recharge wells, recharge shafts are economical.
There is considerable scope for implementation of roof – top rainwater harvesting in
the district. Recharge pits / Shafts / trenches of suitable design are ideal structures for
rainwater harvesting in such areas. Central Ground Water Board is also providing
free technical guidance for implementation of rooftop rainwater harvesting schemes.
12
6.0 GROUNDWATER RELATED ISSUES & PROBLEMS
The ground water development in the district, in general, is high when compared to
many other districts in the state. 10 out of 15 blocks in the district have been
categorized as either ‘overexploited’ or ‘critical’. The trend analyses of historical
ground water level data also indicate a long-term fall in a major part of the district.
Based on the factors mentioned, it is inferred that a major part of the district could be
considered vulnerable to various environmental impacts of water level depletion such
as declining ground water levels, drying up of shallow wells and decrease in yield of
bore wells.
Incidence of fluoride in ground water in excess of permissible limits for drinking has
been reported from parts of the district, especially from the fracture zone. Tamil Nadu
Water Supply and Drainage (TWAD) Board have provided a number of villages in
the district with fluoride-free drinking water supplies. Excessive use of fertilisers and
pesticides in agriculture has also reportedly resulted in localised enrichment of nitrate
and other harmful chemicals in the ground water, especially in the phreatic zone.
Pollution of ground water due to Sago industry is also one of the issues in the district.
The effluents from which have caused local pollution of surface and ground water
resources.
7.0 MASS AWARENESS & TRAINING ACTIVITY
7.1 Mass Awareness Campaign (MAP) & Water Management Training
Programme (WMTP) by CGWB
One Mass Awareness Campaign on “Ground Water Management, Regulation &
Conservation” was organized at Rasipuram in Namakkal district.. The programme
was organized on 06.03.2003 and about 300 people participated in the programme.
The findings of exploration carried out by CGWB, the results of Geophysical
investigations for source finding and their limitations, Ground water resource
potential of Namakkal district, Techniques on Ground water resource management
and need for regulation and water conservation were explained to the gathering of 300
people at Rasipuram.
One Water Management Training Programme (WMTP) was organized on “Water
Management” at Rasipuram. 25 officers attended the training from various State
Government agencies, Representatives of Panchayat Administration, Farmers
Association, etc.
8.0 AREA NOTIFIED BY CGWA/SGWA
Central Ground Water Authority has not notified any area in the district. Government
of Tamil Nadu vide G.O.No. 53 has restricted groundwater development for irrigation
in the over exploited blocks of Tamil Nadu. The over exploited blocks in this district
are as follow.
13
1. Erumapetti 5. Puduchatram
2. Namagiripettai 6. Rasipuram
3. Namakkal 7. Sendamangalam
4. Pallipalayam 8. Vennandur
9.0 RECOMMENDATIONS
The development of ground water has already reached an alarming stage in many
blocks of this district and further development of ground water for creation of
additional irrigation potential has to be carried out with extreme caution.
The heterogeneity of crystalline formation and poor yield prospects make it difficult
for further development and scientific methods may adopted for siting of new wells.
On the basis of experiences in execution of Central Sector Scheme and Demonstrative
Projects on artificial recharge, the desilting of existing ponds/tanks will be the most
cost effective structures. The provision of recharge wells/shafts in percolation
ponds/check dams will enhance the efficiency of these structures.
Rainwater Harvesting has already been made mandatory by the Govt. of Tamil Nadu
and people have already made provision for roof top rainwater harvesting. However,
efforts may be made to apply corrections if required to make these structures
effective. Further, operation and maintenance of artificial recharge structures are
essential to make them efficient and priority may be given to this activity so as to
make these structures effective. A concerted effort involving various Government
agencies and NGOs can create the necessary awareness among the rural masses.
Action plan in this direction with participation of state and central agencies and
industrial establishments is recommended.
14
15
16
17
18
19
20
NAMAKKAL DISTRICT, TAMIL NADU
21
Published by : Regional Director, CGWB, SECR, E-1, Rajaji Bhavan, Besant Nagar, Chennai-90
�+914424912941/24914494 �/Fax : 91 4424914334 Web: www.cgwb.gov.in