Embed Size (px)
Citation preview
For Official Use COM/STD/DAF(2007)11 Organisation de Coopération et de Développement Economiques Organisation for Economic Co-operation and Development
___________________________________________________________________________________________
_____________ English - Or. English STATISTICS DIRECTORATE
DIRECTORATE FOR FINANCIAL AND ENTERPRISE AFFAIRS
VALUATION OF CERTAIN ASSETS AND LIABILITIES – THE SITUATION IN EUROPE
To be held on 2-3 October 2007
Tour Europe, Paris la Défense
Beginning at 9:30 a.m. on the first day
This document has been prepared by J. Verrinder, EUROSTAT and will be presented under item 1 of the draft
agenda
Document complet disponible sur OLIS dans son format d'origine
Complete document available on OLIS in its original format
CO
M/S
TD
/DA
F(2
007)1
1
For O
fficial U
se
En
glish
- Or. E
ng
lish
COM/STD/DAF(2007)11
2
VALUATION OF CERTAIN ASSETS AND LIABILITIES – THE SITUATION IN EUROPE
1. Introduction
During 2006 the OECD launched a questionnaire survey on the valuation of certain financial assets
and liabilities (Annex 1) and reported the results for selected countries to the 2006 Working Party on
financial accounts. Eurostat agreed to collect and synthesise the information for EU Member States which
are OECD members and for Norway. To reduce the response burden on countries, Eurostat used existing
metadata as far as possible and then asked countries to confirm their practices.
The OECD survey concentrated on two sectors (general government and households, plus possibly
non-profit institutions) and on three financial instruments (securities other than shares, shares and other
equity, insurance technical reserves).
In conducting the analysis, Eurostat has also looked at the reported and implied other economic flows
data in countries' annual financial accounts datasets (as published by Eurostat) for the year 2004 to cross-
check the valuation coherence between transactions and stocks1. This analysis has included household and
non-profit institution data together, since only this combination of sectors must be reported to Eurostat. It
has used non-consolidated data, since these data are most complete across countries. The data are shown in
millions of national currency, and the differences as % of opening balance sheet.
It is important to stress that in some cases there are different data sources for provisional and final
data. This document is based on the sources and methods used for final annual data as much as possible.
Finally one may note a general tendency amongst countries to record transactions by taking changes
in balance sheet data and applying a revaluation adjustment. This may lead to transactions adopting the
same recording conventions as balance sheet entries, depending on the type of revaluation adjustment
applied – "market prices" recording for transactions may mean that the method adopted approximates
market prices (rather than direct data sources). However the document distinguishes between stocks and
transactions because in some cases there are differences (for example, direct data on transactions is
available at transaction prices).
2. General Government – S13
2.1 Securities other than shares (liabilities) - F33
Overall in appears that 17 out of 20 European countries measure liabilities in securities other than
shares using market prices at the day of transaction or balance sheet, whilst a further 2 use market prices
for some securities. Belgium reports at nominal value.
1 For Luxembourg the most complete and up-to-date information for general government were taken from the
reported quarterly financial accounts of general government. Luxembourg does not currently report annual
financial accounts for sectors other than general government.
COM/STD/DAF(2007)11
3
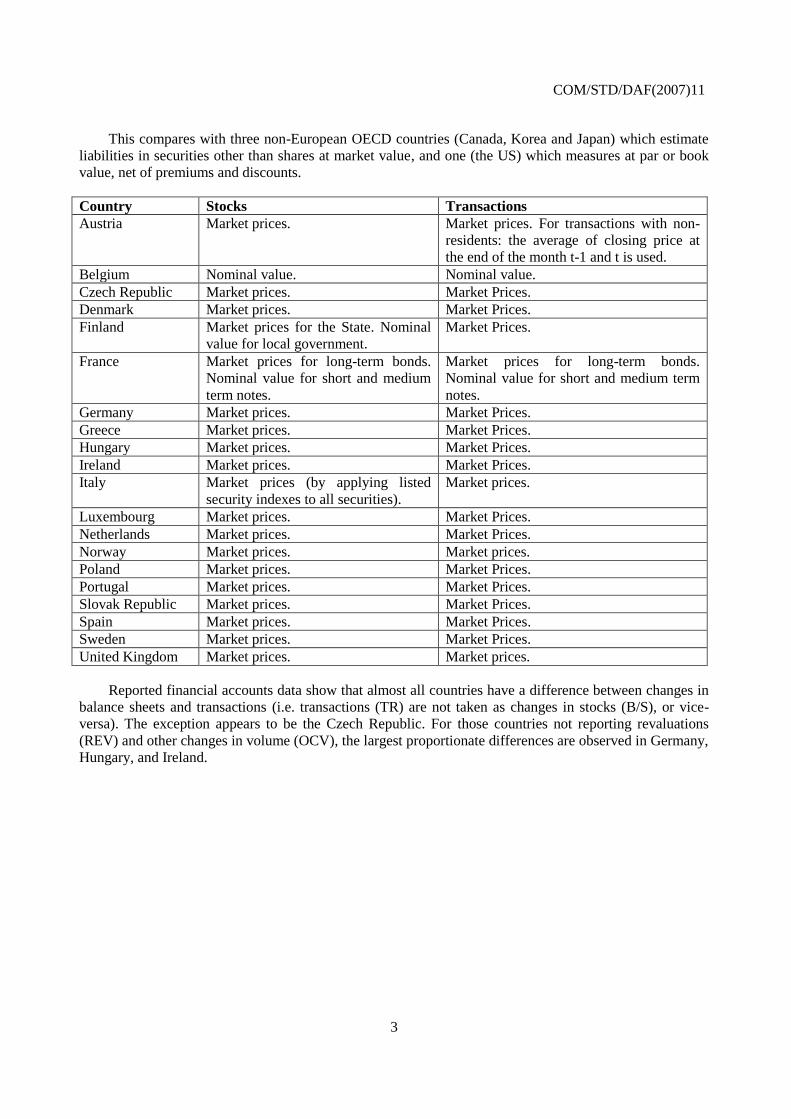
This compares with three non-European OECD countries (Canada, Korea and Japan) which estimate
liabilities in securities other than shares at market value, and one (the US) which measures at par or book
value, net of premiums and discounts.
Country Stocks Transactions
Austria Market prices. Market prices. For transactions with non-
residents: the average of closing price at
the end of the month t-1 and t is used.
Belgium Nominal value. Nominal value.
Czech Republic Market prices. Market Prices.
Denmark Market prices. Market Prices.
Finland Market prices for the State. Nominal
value for local government.
Market Prices.
France Market prices for long-term bonds.
Nominal value for short and medium
term notes.
Market prices for long-term bonds.
Nominal value for short and medium term
notes.
Germany Market prices. Market Prices.
Greece Market prices. Market Prices.
Hungary Market prices. Market Prices.
Ireland Market prices. Market Prices.
Italy Market prices (by applying listed
security indexes to all securities).
Market prices.
Luxembourg Market prices. Market Prices.
Netherlands Market prices. Market Prices.
Norway Market prices. Market prices.
Poland Market prices. Market Prices.
Portugal Market prices. Market Prices.
Slovak Republic Market prices. Market Prices.
Spain Market prices. Market Prices.
Sweden Market prices. Market Prices.
United Kingdom Market prices. Market prices.
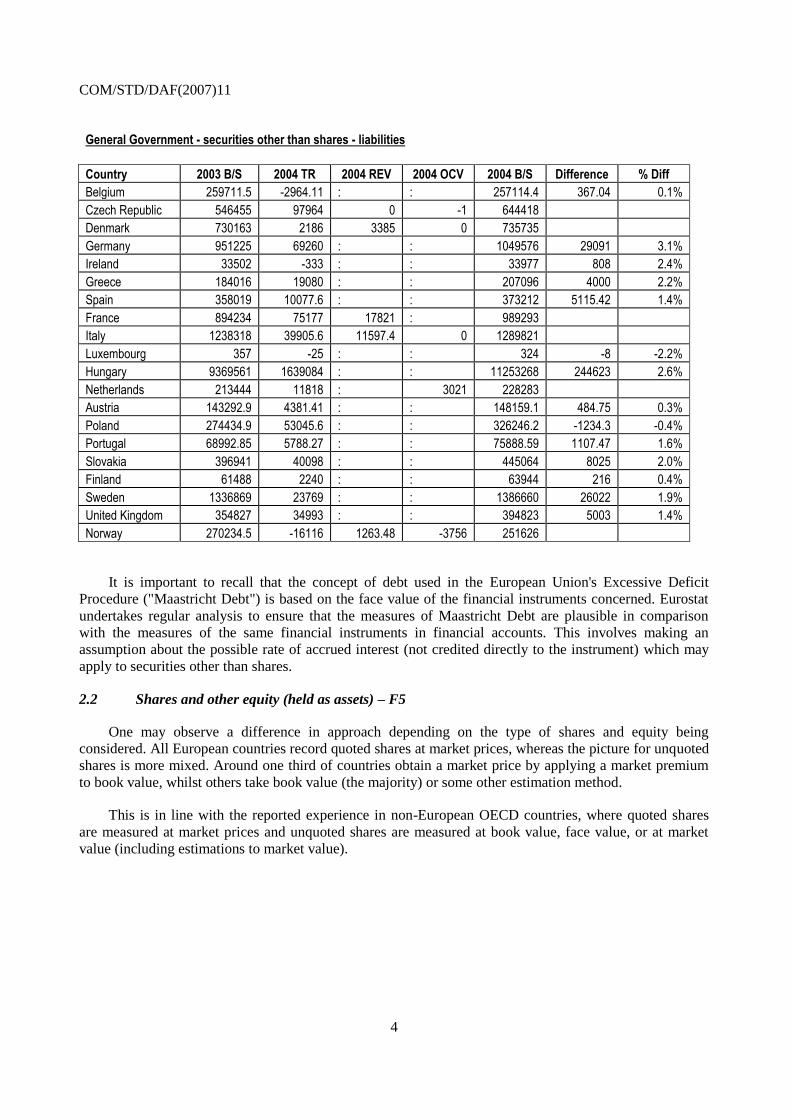
Reported financial accounts data show that almost all countries have a difference between changes in
balance sheets and transactions (i.e. transactions (TR) are not taken as changes in stocks (B/S), or vice-
versa). The exception appears to be the Czech Republic. For those countries not reporting revaluations
(REV) and other changes in volume (OCV), the largest proportionate differences are observed in Germany,
Hungary, and Ireland.
COM/STD/DAF(2007)11
4
General Government - securities other than shares - liabilities
Country 2003 B/S 2004 TR 2004 REV 2004 OCV 2004 B/S Difference % Diff
Belgium 259711.5 -2964.11 : : 257114.4 367.04 0.1%
Czech Republic 546455 97964 0 -1 644418
Denmark 730163 2186 3385 0 735735
Germany 951225 69260 : : 1049576 29091 3.1%
Ireland 33502 -333 : : 33977 808 2.4%
Greece 184016 19080 : : 207096 4000 2.2%
Spain 358019 10077.6 : : 373212 5115.42 1.4%
France 894234 75177 17821 : 989293
Italy 1238318 39905.6 11597.4 0 1289821
Luxembourg 357 -25 : : 324 -8 -2.2%
Hungary 9369561 1639084 : : 11253268 244623 2.6%
Netherlands 213444 11818 : 3021 228283
Austria 143292.9 4381.41 : : 148159.1 484.75 0.3%
Poland 274434.9 53045.6 : : 326246.2 -1234.3 -0.4%
Portugal 68992.85 5788.27 : : 75888.59 1107.47 1.6%
Slovakia 396941 40098 : : 445064 8025 2.0%
Finland 61488 2240 : : 63944 216 0.4%
Sweden 1336869 23769 : : 1386660 26022 1.9%
United Kingdom 354827 34993 : : 394823 5003 1.4%
Norway 270234.5 -16116 1263.48 -3756 251626
It is important to recall that the concept of debt used in the European Union's Excessive Deficit
Procedure ("Maastricht Debt") is based on the face value of the financial instruments concerned. Eurostat
undertakes regular analysis to ensure that the measures of Maastricht Debt are plausible in comparison
with the measures of the same financial instruments in financial accounts. This involves making an
assumption about the possible rate of accrued interest (not credited directly to the instrument) which may
apply to securities other than shares.
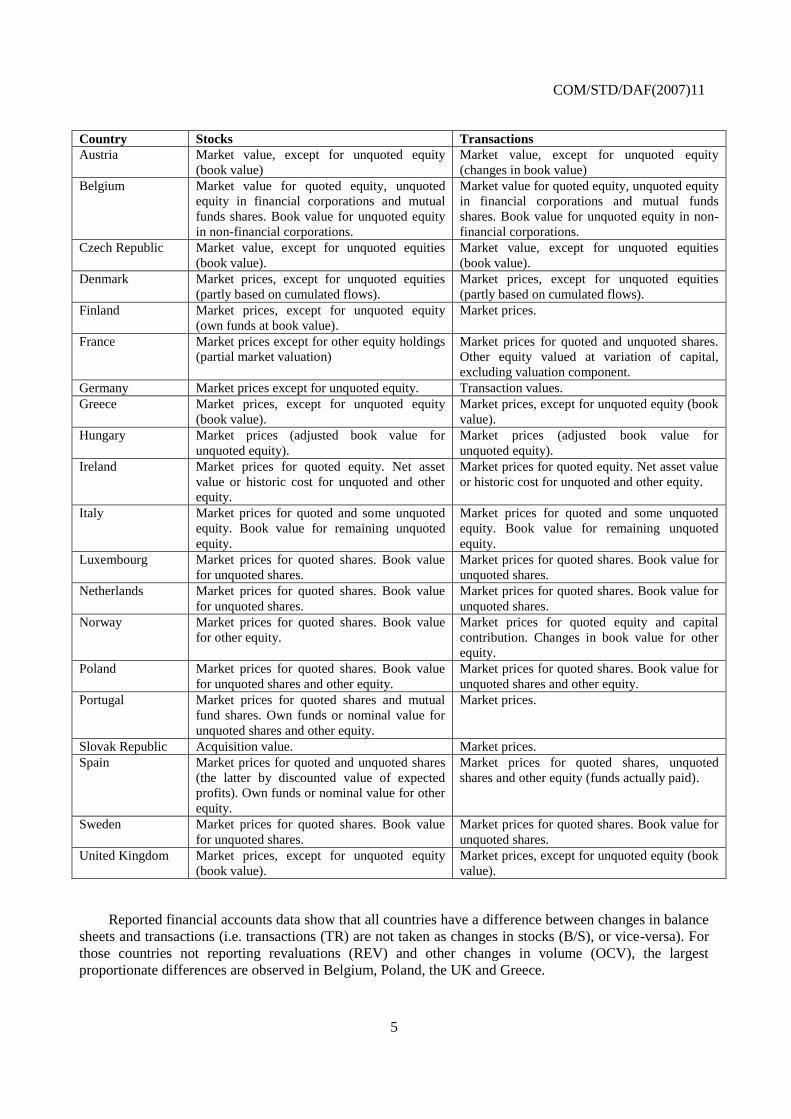
2.2 Shares and other equity (held as assets) – F5
One may observe a difference in approach depending on the type of shares and equity being
considered. All European countries record quoted shares at market prices, whereas the picture for unquoted
shares is more mixed. Around one third of countries obtain a market price by applying a market premium
to book value, whilst others take book value (the majority) or some other estimation method.
This is in line with the reported experience in non-European OECD countries, where quoted shares
are measured at market prices and unquoted shares are measured at book value, face value, or at market
value (including estimations to market value).
COM/STD/DAF(2007)11
5
Country Stocks Transactions
Austria Market value, except for unquoted equity
(book value)
Market value, except for unquoted equity
(changes in book value)
Belgium Market value for quoted equity, unquoted
equity in financial corporations and mutual
funds shares. Book value for unquoted equity
in non-financial corporations.
Market value for quoted equity, unquoted equity
in financial corporations and mutual funds
shares. Book value for unquoted equity in non-
financial corporations.
Czech Republic Market value, except for unquoted equities
(book value).
Market value, except for unquoted equities
(book value).
Denmark Market prices, except for unquoted equities
(partly based on cumulated flows).
Market prices, except for unquoted equities
(partly based on cumulated flows).
Finland Market prices, except for unquoted equity
(own funds at book value).
Market prices.
France Market prices except for other equity holdings
(partial market valuation)
Market prices for quoted and unquoted shares.
Other equity valued at variation of capital,
excluding valuation component.
Germany Market prices except for unquoted equity. Transaction values.
Greece Market prices, except for unquoted equity
(book value).
Market prices, except for unquoted equity (book
value).
Hungary Market prices (adjusted book value for
unquoted equity).
Market prices (adjusted book value for
unquoted equity).
Ireland Market prices for quoted equity. Net asset
value or historic cost for unquoted and other
equity.
Market prices for quoted equity. Net asset value
or historic cost for unquoted and other equity.
Italy Market prices for quoted and some unquoted
equity. Book value for remaining unquoted
equity.
Market prices for quoted and some unquoted
equity. Book value for remaining unquoted
equity.
Luxembourg Market prices for quoted shares. Book value
for unquoted shares.
Market prices for quoted shares. Book value for
unquoted shares.
Netherlands Market prices for quoted shares. Book value
for unquoted shares.
Market prices for quoted shares. Book value for
unquoted shares.
Norway Market prices for quoted shares. Book value
for other equity.
Market prices for quoted equity and capital
contribution. Changes in book value for other
equity.
Poland Market prices for quoted shares. Book value
for unquoted shares and other equity.
Market prices for quoted shares. Book value for
unquoted shares and other equity.
Portugal Market prices for quoted shares and mutual
fund shares. Own funds or nominal value for
unquoted shares and other equity.
Market prices.
Slovak Republic Acquisition value. Market prices.
Spain Market prices for quoted and unquoted shares
(the latter by discounted value of expected
profits). Own funds or nominal value for other
equity.
Market prices for quoted shares, unquoted
shares and other equity (funds actually paid).
Sweden Market prices for quoted shares. Book value
for unquoted shares.
Market prices for quoted shares. Book value for
unquoted shares.
United Kingdom Market prices, except for unquoted equity
(book value).
Market prices, except for unquoted equity (book
value).
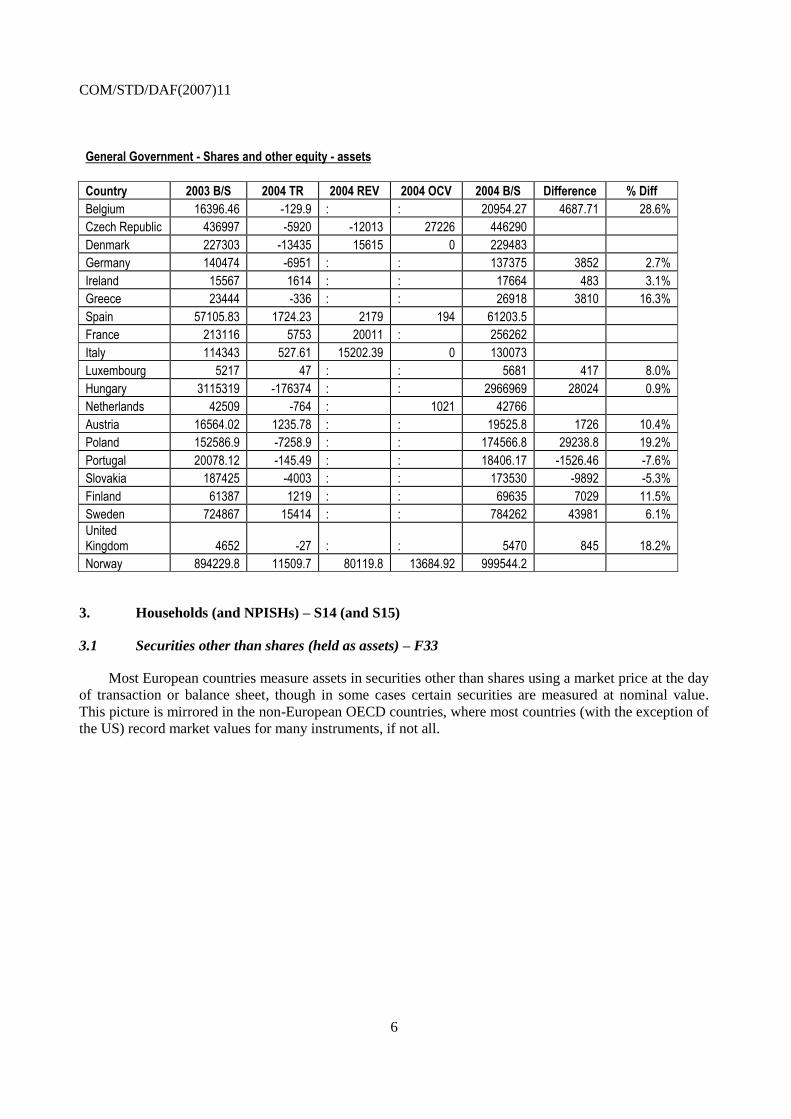
Reported financial accounts data show that all countries have a difference between changes in balance
sheets and transactions (i.e. transactions (TR) are not taken as changes in stocks (B/S), or vice-versa). For
those countries not reporting revaluations (REV) and other changes in volume (OCV), the largest
proportionate differences are observed in Belgium, Poland, the UK and Greece.
COM/STD/DAF(2007)11
6
General Government - Shares and other equity - assets
Country 2003 B/S 2004 TR 2004 REV 2004 OCV 2004 B/S Difference % Diff
Belgium 16396.46 -129.9 : : 20954.27 4687.71 28.6%
Czech Republic 436997 -5920 -12013 27226 446290
Denmark 227303 -13435 15615 0 229483
Germany 140474 -6951 : : 137375 3852 2.7%
Ireland 15567 1614 : : 17664 483 3.1%
Greece 23444 -336 : : 26918 3810 16.3%
Spain 57105.83 1724.23 2179 194 61203.5
France 213116 5753 20011 : 256262
Italy 114343 527.61 15202.39 0 130073
Luxembourg 5217 47 : : 5681 417 8.0%
Hungary 3115319 -176374 : : 2966969 28024 0.9%
Netherlands 42509 -764 : 1021 42766
Austria 16564.02 1235.78 : : 19525.8 1726 10.4%
Poland 152586.9 -7258.9 : : 174566.8 29238.8 19.2%
Portugal 20078.12 -145.49 : : 18406.17 -1526.46 -7.6%
Slovakia 187425 -4003 : : 173530 -9892 -5.3%
Finland 61387 1219 : : 69635 7029 11.5%
Sweden 724867 15414 : : 784262 43981 6.1%
United Kingdom 4652 -27 : : 5470 845 18.2%
Norway 894229.8 11509.7 80119.8 13684.92 999544.2
3. Households (and NPISHs) – S14 (and S15)
3.1 Securities other than shares (held as assets) – F33
Most European countries measure assets in securities other than shares using a market price at the day
of transaction or balance sheet, though in some cases certain securities are measured at nominal value.
This picture is mirrored in the non-European OECD countries, where most countries (with the exception of
the US) record market values for many instruments, if not all.

COM/STD/DAF(2007)11
7
Country Stocks Transactions
Austria Market prices. Market prices.
Belgium For AF33 issued by S13: nominal value.
For AF33 issued by other sectors: holding
by S14 is calculated as the balance of the
other holders; with as starting point:
market value for AF33 issued by S2 and
nominal value for AF33 issued by S11
and S12.
For F33 issued by S13: nominal value.
For F33 issued by other sectors: holding
by S14 is calculated as the balance of the
other holders; with as starting point:
market value for F33 issued by S2 and
nominal value for F33 issued by S11 and
S12.
Czech Republic Market prices. Market prices.
Denmark Market prices. Market prices.
Finland Market prices (residual). Market prices (residual).
France Market prices for long-term bonds.
Nominal value for short and medium term
notes.
Market prices, deducting revaluation
effects from changes in stocks.
Germany Market prices. Market prices.
Greece No information available. No information available.
Hungary Market prices. Market prices.
Ireland Market prices. Market prices.
Italy Market prices. Market prices.
Luxembourg Not compiled Not compiled
Netherlands No information available. No information available.
Norway Market prices. Market prices.
Poland Market prices. Market prices.
Portugal Market prices. Market prices.
Slovak Republic No information available. No information available.
Spain Obtained residually from securities
valued at market prices (total issued less
holdings of the rest of the sectors).The
allocation of such residual holdings
between households and non-financial
corporations is principally based on the
statement of securities deposited with
credit institutions.
Obtained from the difference in stocks
positions and deducting revaluations &
other change in volume adjustments.
Sweden No information available. No information available.
United Kingdom No information available. No information available.
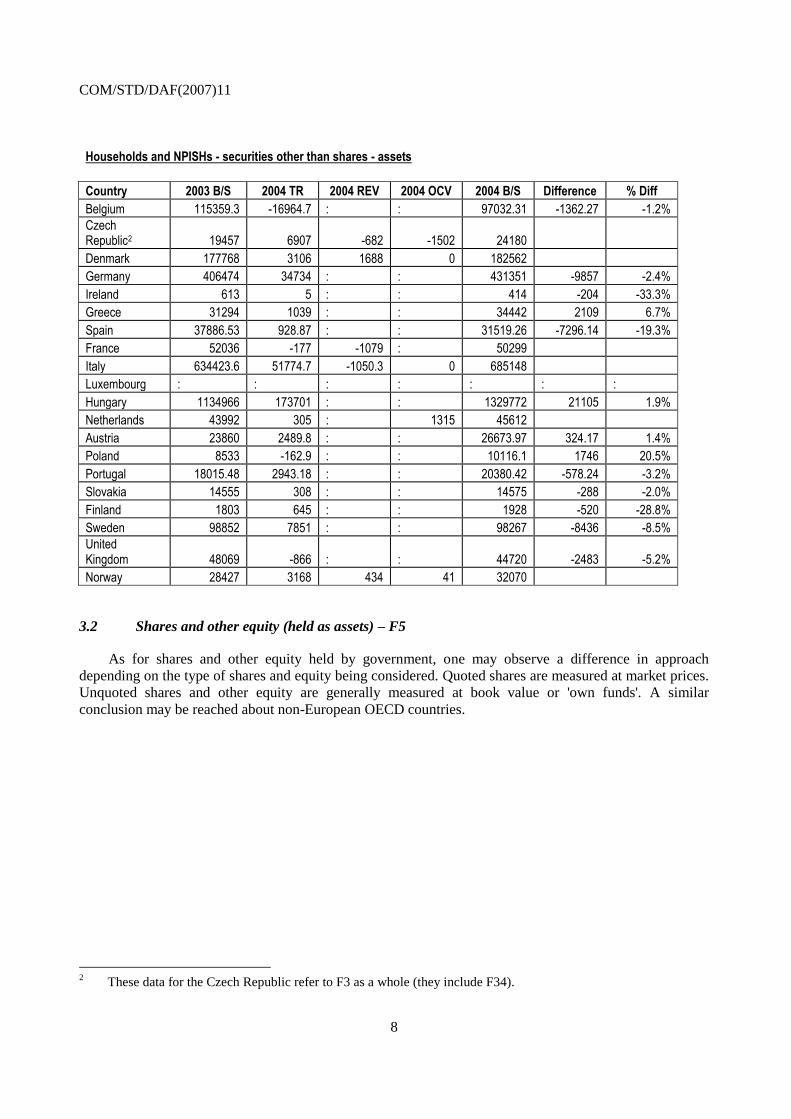
Reported financial accounts data show that all countries have a difference between changes in balance
sheets and transactions (i.e. transactions (TR) are not taken as changes in stocks (B/S), or vice-versa). For
those countries not reporting revaluations (REV) and other changes in volume (OCV), the largest
proportionate differences are observed in Ireland, Finland, Poland and Spain.
COM/STD/DAF(2007)11
8
Households and NPISHs - securities other than shares - assets
Country 2003 B/S 2004 TR 2004 REV 2004 OCV 2004 B/S Difference % Diff
Belgium 115359.3 -16964.7 : : 97032.31 -1362.27 -1.2%
Czech Republic2 19457 6907 -682 -1502 24180
Denmark 177768 3106 1688 0 182562
Germany 406474 34734 : : 431351 -9857 -2.4%
Ireland 613 5 : : 414 -204 -33.3%
Greece 31294 1039 : : 34442 2109 6.7%
Spain 37886.53 928.87 : : 31519.26 -7296.14 -19.3%
France 52036 -177 -1079 : 50299
Italy 634423.6 51774.7 -1050.3 0 685148
Luxembourg : : : : : : :
Hungary 1134966 173701 : : 1329772 21105 1.9%
Netherlands 43992 305 : 1315 45612
Austria 23860 2489.8 : : 26673.97 324.17 1.4%
Poland 8533 -162.9 : : 10116.1 1746 20.5%
Portugal 18015.48 2943.18 : : 20380.42 -578.24 -3.2%
Slovakia 14555 308 : : 14575 -288 -2.0%
Finland 1803 645 : : 1928 -520 -28.8%
Sweden 98852 7851 : : 98267 -8436 -8.5%
United Kingdom 48069 -866 : : 44720 -2483 -5.2%
Norway 28427 3168 434 41 32070
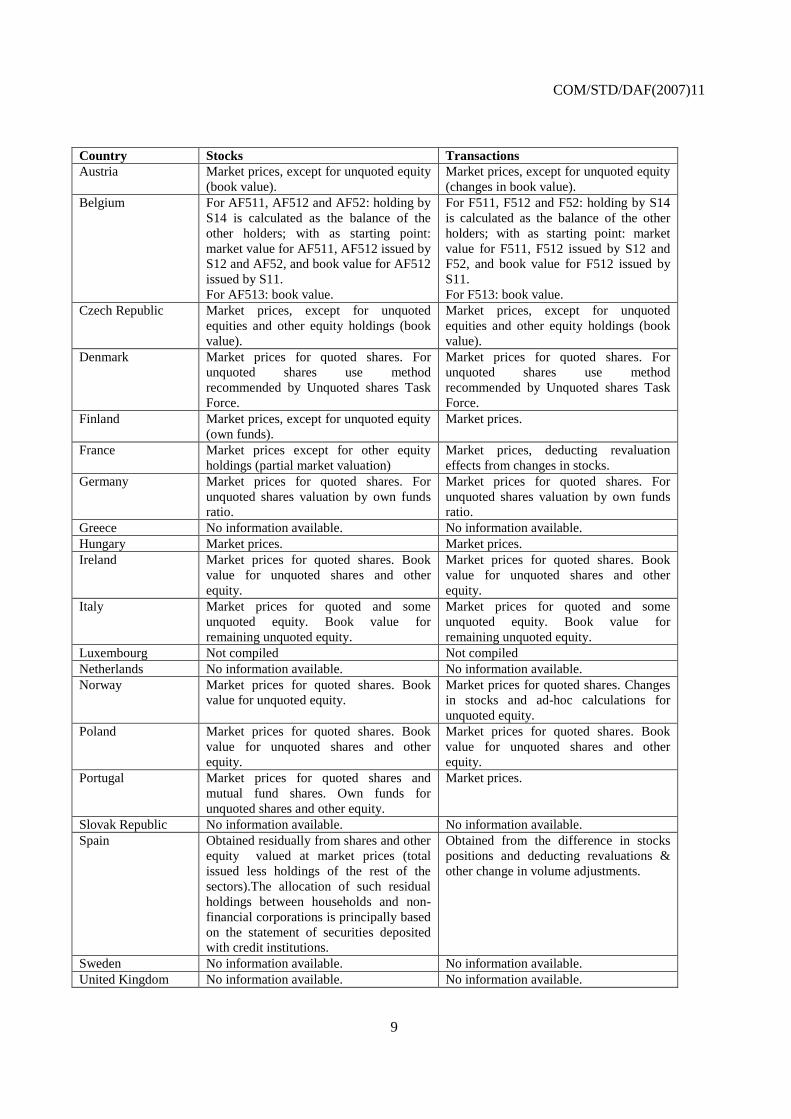
3.2 Shares and other equity (held as assets) – F5
As for shares and other equity held by government, one may observe a difference in approach
depending on the type of shares and equity being considered. Quoted shares are measured at market prices.
Unquoted shares and other equity are generally measured at book value or 'own funds'. A similar
conclusion may be reached about non-European OECD countries.
2 These data for the Czech Republic refer to F3 as a whole (they include F34).
COM/STD/DAF(2007)11
9
Country Stocks Transactions
Austria Market prices, except for unquoted equity
(book value).
Market prices, except for unquoted equity
(changes in book value).
Belgium For AF511, AF512 and AF52: holding by
S14 is calculated as the balance of the
other holders; with as starting point:
market value for AF511, AF512 issued by
S12 and AF52, and book value for AF512
issued by S11.
For AF513: book value.
For F511, F512 and F52: holding by S14
is calculated as the balance of the other
holders; with as starting point: market
value for F511, F512 issued by S12 and
F52, and book value for F512 issued by
S11.
For F513: book value.
Czech Republic Market prices, except for unquoted
equities and other equity holdings (book
value).
Market prices, except for unquoted
equities and other equity holdings (book
value).
Denmark Market prices for quoted shares. For
unquoted shares use method
recommended by Unquoted shares Task
Force.
Market prices for quoted shares. For
unquoted shares use method
recommended by Unquoted shares Task
Force.
Finland Market prices, except for unquoted equity
(own funds).
Market prices.
France Market prices except for other equity
holdings (partial market valuation)
Market prices, deducting revaluation
effects from changes in stocks.
Germany Market prices for quoted shares. For
unquoted shares valuation by own funds
ratio.
Market prices for quoted shares. For
unquoted shares valuation by own funds
ratio.
Greece No information available. No information available.
Hungary Market prices. Market prices.
Ireland Market prices for quoted shares. Book
value for unquoted shares and other
equity.
Market prices for quoted shares. Book
value for unquoted shares and other
equity.
Italy Market prices for quoted and some
unquoted equity. Book value for
remaining unquoted equity.
Market prices for quoted and some
unquoted equity. Book value for
remaining unquoted equity.
Luxembourg Not compiled Not compiled
Netherlands No information available. No information available.
Norway Market prices for quoted shares. Book
value for unquoted equity.
Market prices for quoted shares. Changes
in stocks and ad-hoc calculations for
unquoted equity.
Poland Market prices for quoted shares. Book
value for unquoted shares and other
equity.
Market prices for quoted shares. Book
value for unquoted shares and other
equity.
Portugal Market prices for quoted shares and
mutual fund shares. Own funds for
unquoted shares and other equity.
Market prices.
Slovak Republic No information available. No information available.
Spain Obtained residually from shares and other
equity valued at market prices (total
issued less holdings of the rest of the
sectors).The allocation of such residual
holdings between households and non-
financial corporations is principally based
on the statement of securities deposited
with credit institutions.
Obtained from the difference in stocks
positions and deducting revaluations &
other change in volume adjustments.
Sweden No information available. No information available.
United Kingdom No information available. No information available.
COM/STD/DAF(2007)11
10
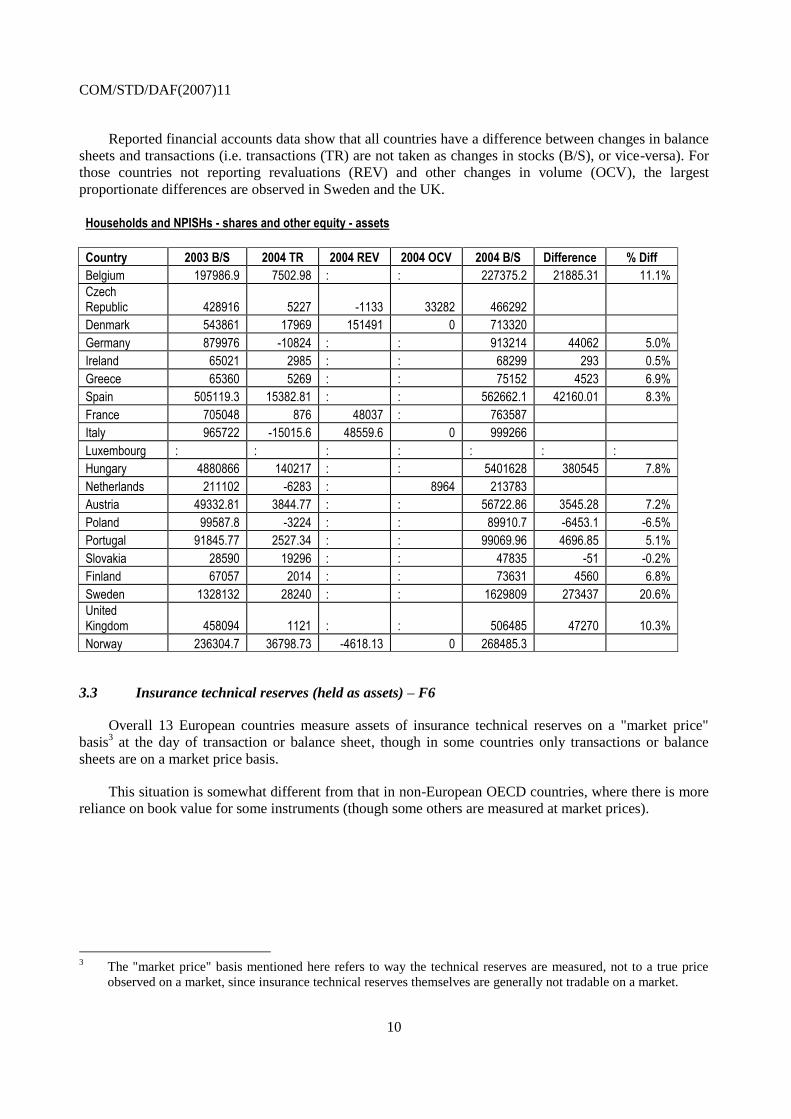
Reported financial accounts data show that all countries have a difference between changes in balance
sheets and transactions (i.e. transactions (TR) are not taken as changes in stocks (B/S), or vice-versa). For
those countries not reporting revaluations (REV) and other changes in volume (OCV), the largest
proportionate differences are observed in Sweden and the UK.
Households and NPISHs - shares and other equity - assets
Country 2003 B/S 2004 TR 2004 REV 2004 OCV 2004 B/S Difference % Diff
Belgium 197986.9 7502.98 : : 227375.2 21885.31 11.1%
Czech Republic 428916 5227 -1133 33282 466292
Denmark 543861 17969 151491 0 713320
Germany 879976 -10824 : : 913214 44062 5.0%
Ireland 65021 2985 : : 68299 293 0.5%
Greece 65360 5269 : : 75152 4523 6.9%
Spain 505119.3 15382.81 : : 562662.1 42160.01 8.3%
France 705048 876 48037 : 763587
Italy 965722 -15015.6 48559.6 0 999266
Luxembourg : : : : : : :
Hungary 4880866 140217 : : 5401628 380545 7.8%
Netherlands 211102 -6283 : 8964 213783
Austria 49332.81 3844.77 : : 56722.86 3545.28 7.2%
Poland 99587.8 -3224 : : 89910.7 -6453.1 -6.5%
Portugal 91845.77 2527.34 : : 99069.96 4696.85 5.1%
Slovakia 28590 19296 : : 47835 -51 -0.2%
Finland 67057 2014 : : 73631 4560 6.8%
Sweden 1328132 28240 : : 1629809 273437 20.6%
United Kingdom 458094 1121 : : 506485 47270 10.3%
Norway 236304.7 36798.73 -4618.13 0 268485.3
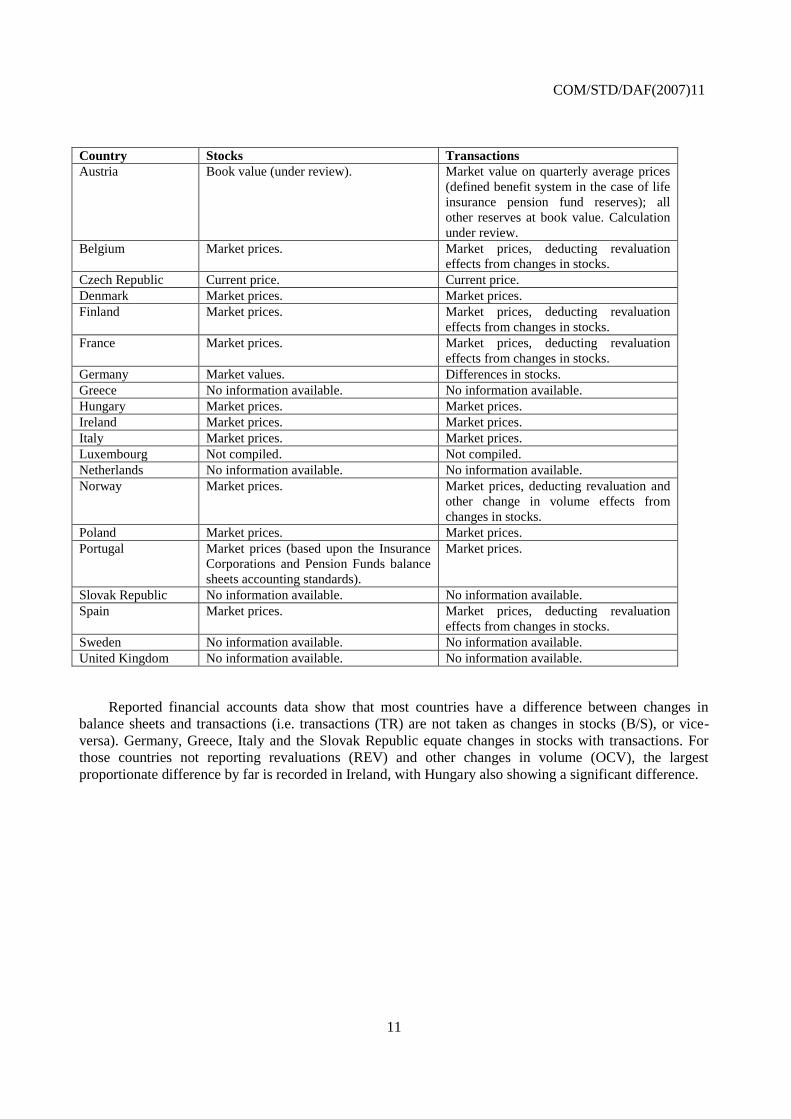
3.3 Insurance technical reserves (held as assets) – F6
Overall 13 European countries measure assets of insurance technical reserves on a "market price"
basis3 at the day of transaction or balance sheet, though in some countries only transactions or balance
sheets are on a market price basis.
This situation is somewhat different from that in non-European OECD countries, where there is more
reliance on book value for some instruments (though some others are measured at market prices).
3 The "market price" basis mentioned here refers to way the technical reserves are measured, not to a true price
observed on a market, since insurance technical reserves themselves are generally not tradable on a market.
COM/STD/DAF(2007)11
11
Country Stocks Transactions
Austria Book value (under review). Market value on quarterly average prices
(defined benefit system in the case of life
insurance pension fund reserves); all
other reserves at book value. Calculation
under review.
Belgium Market prices. Market prices, deducting revaluation
effects from changes in stocks.
Czech Republic Current price. Current price.
Denmark Market prices. Market prices.
Finland Market prices. Market prices, deducting revaluation
effects from changes in stocks.
France Market prices. Market prices, deducting revaluation
effects from changes in stocks.
Germany Market values. Differences in stocks.
Greece No information available. No information available.
Hungary Market prices. Market prices.
Ireland Market prices. Market prices.
Italy Market prices. Market prices.
Luxembourg Not compiled. Not compiled.
Netherlands No information available. No information available.
Norway Market prices. Market prices, deducting revaluation and
other change in volume effects from
changes in stocks.
Poland Market prices. Market prices.
Portugal Market prices (based upon the Insurance
Corporations and Pension Funds balance
sheets accounting standards).
Market prices.
Slovak Republic No information available. No information available.
Spain Market prices. Market prices, deducting revaluation
effects from changes in stocks.
Sweden No information available. No information available.
United Kingdom No information available. No information available.
Reported financial accounts data show that most countries have a difference between changes in
balance sheets and transactions (i.e. transactions (TR) are not taken as changes in stocks (B/S), or vice-
versa). Germany, Greece, Italy and the Slovak Republic equate changes in stocks with transactions. For
those countries not reporting revaluations (REV) and other changes in volume (OCV), the largest
proportionate difference by far is recorded in Ireland, with Hungary also showing a significant difference.
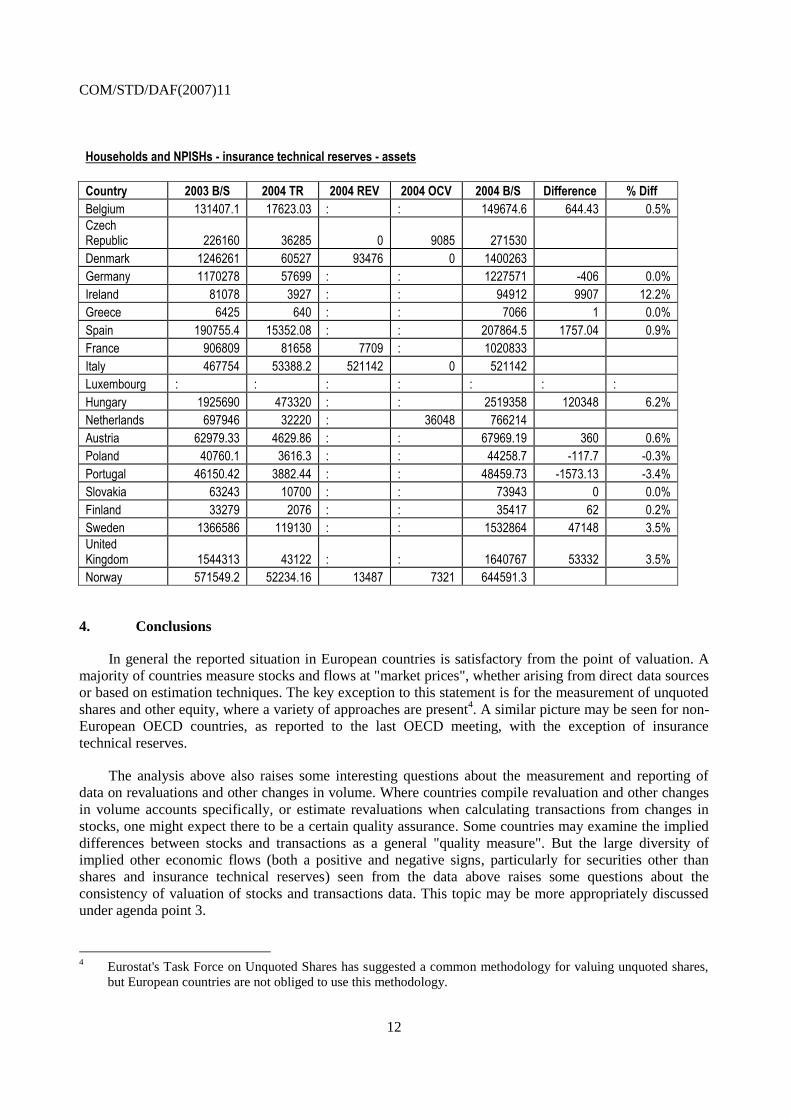
COM/STD/DAF(2007)11
12
Households and NPISHs - insurance technical reserves - assets
Country 2003 B/S 2004 TR 2004 REV 2004 OCV 2004 B/S Difference % Diff
Belgium 131407.1 17623.03 : : 149674.6 644.43 0.5%
Czech Republic 226160 36285 0 9085 271530
Denmark 1246261 60527 93476 0 1400263
Germany 1170278 57699 : : 1227571 -406 0.0%
Ireland 81078 3927 : : 94912 9907 12.2%
Greece 6425 640 : : 7066 1 0.0%
Spain 190755.4 15352.08 : : 207864.5 1757.04 0.9%
France 906809 81658 7709 : 1020833
Italy 467754 53388.2 521142 0 521142
Luxembourg : : : : : : :
Hungary 1925690 473320 : : 2519358 120348 6.2%
Netherlands 697946 32220 : 36048 766214
Austria 62979.33 4629.86 : : 67969.19 360 0.6%
Poland 40760.1 3616.3 : : 44258.7 -117.7 -0.3%
Portugal 46150.42 3882.44 : : 48459.73 -1573.13 -3.4%
Slovakia 63243 10700 : : 73943 0 0.0%
Finland 33279 2076 : : 35417 62 0.2%
Sweden 1366586 119130 : : 1532864 47148 3.5%
United Kingdom 1544313 43122 : : 1640767 53332 3.5%
Norway 571549.2 52234.16 13487 7321 644591.3
4. Conclusions
In general the reported situation in European countries is satisfactory from the point of valuation. A
majority of countries measure stocks and flows at "market prices", whether arising from direct data sources
or based on estimation techniques. The key exception to this statement is for the measurement of unquoted
shares and other equity, where a variety of approaches are present4. A similar picture may be seen for non-
European OECD countries, as reported to the last OECD meeting, with the exception of insurance
technical reserves.
The analysis above also raises some interesting questions about the measurement and reporting of
data on revaluations and other changes in volume. Where countries compile revaluation and other changes
in volume accounts specifically, or estimate revaluations when calculating transactions from changes in
stocks, one might expect there to be a certain quality assurance. Some countries may examine the implied
differences between stocks and transactions as a general "quality measure". But the large diversity of
implied other economic flows (both a positive and negative signs, particularly for securities other than
shares and insurance technical reserves) seen from the data above raises some questions about the
consistency of valuation of stocks and transactions data. This topic may be more appropriately discussed
under agenda point 3.
4 Eurostat's Task Force on Unquoted Shares has suggested a common methodology for valuing unquoted shares,
but European countries are not obliged to use this methodology.
COM/STD/DAF(2007)11
13
Annex 1 – OECD questionnaire on valuation of financial assets and liabilities
While the SNA recommends that all stocks of financial assets and liabilities are recorded at “market
price”, it appears that the extent to which this recommendation is applied by OECD countries in their
financial accounts is variable. It seems also that, sometimes, the estimate for flows (net acquisition of
financial assets or net incurrence of financial liabilities) may include a part which should be in principle
included in the revaluation account and not in the transaction account. This may happen when flows are
obtained by difference between two stocks valued at market prices without any correction made for
revaluation of held assets/liabilities.
In this context, it is important that we include in the “user metadata” of the OECD financial accounts
database5, a clear statement on the type of valuation used to estimate financial assets, liabilities and
corresponding transactions for your country. Most users suppose that the SNA is applied extensively and
therefore assume that financial stocks are at market prices and that flows do not include revaluations. They
should be notified if this not the case. However, we often lack this information and therefore we are in
need to ask you to help us by responding to this survey, which result will be up-loaded in our database and
made available to the public.
Because users focus on households6 and general government financial assets and liabilities, we have
limited this survey to these two sectors. Also because valuation issues matter essentially for the categories
F3 “Securities other than shares”, F5 “Shares and other equity”, and F6 “Insurance technical
reserves” the survey will be limited to these categories. This will simplify your response.
We would like you to quantitatively illustrate, using existing data, the amount of revaluation for each
of the entry referred to in this survey for a recent year. Please therefore complete the proposed quantitative
tables. We have pre-filled the data when we have the information. However these pre-filled data may be
obsolete by now.
In order to illustrate an appropriate response, please also find in annex the response of France. We
recommend that you read the answer of France who has kindly accepted to test this survey to understand
the degree of precision of the information that we would welcome.
Results will be presented at the WPFS meeting on October 10.
PLEASE RETURN TO MICHELE CHAVOIX MANNATO BEFORE SEPEMBER 22, 2006
5 Each one of you has direct access to the OECD.STAT database, through the OLIS network. An extract of the
database is also available on the OECD web:
http://www.oecd.org/document/59/0,2340,en_2825_495684_30202683_1_1_1_1,00.html
6 However, as the data often regroups NPISHs with Households, the grouping Households + NPISH can be used
in the response.
COM/STD/DAF(2007)11
14
Country: ……………..
Email of respondent:…………………..
SURVEY ON VALUATION METHODS FOR FINANCIAL ACCOUNTS
I. S13 General Government:
F5: Shares and other equity held by general government:
Stocks:
Can these assets held by government be qualified as at “market prices”? If yes does it
mean that quoted shares owned by government are valued at stock market prices? What about
government’s unquoted shares (in particular shares of government in unquoted public enterprises, for
example the share of government in the Central Bank)?
Answer:
Flows:
Does the corresponding flow (Net acquisition of F5) correctly reflect transactions at
market prices of the day of the transaction excluding any revaluation on held assets? If not, is it that this
flow is partly or totally obtained using the difference between two stocks valued at market prices?
Answer:
Illustration of changes in stocks and revaluations:
General Government Stock
End 2003
Stock
End 2004
Net acquisition
in 2004
Revaluation in
2004
F5 Assets: Shares and other
equity.
?
Of which Quoted shares ? ? ? ?
Of which Unquoted shares ? ? ? ?
Of which Mutual funds ? ? ? ?
Of which Other equity ? ? ? ?
F3: Securities other than shares issued by general government:
Stocks:
Can these liabilities of general government be qualified as at “market prices”? If yes what
is the exact meaning of “at market prices”? Are there sufficient secondary markets to obtain a good
estimate of the market price of all government bonds? If there is no such market, do you make your own
estimation of the value of government bonds using the net present value method based on market interest
rates? Do there remain bonds valued at nominal price?
Answer:
Flows:
Does the corresponding flow (Net incurrence of F3) correctly reflect transactions at
market prices of the day of the transaction excluding any revaluation on held assets? If not, is it that this
flow is partly or totally obtained using the difference between two stocks valued at market prices?
COM/STD/DAF(2007)11
15
Answer:
Illustration of changes in stocks and revaluations:
General Government Stock
End 2003
Stock
End 2004
Net incurrence
in 2004
Revaluation
in 2004
F3 Liabilities: securities other
than shares.
?
II. S14 (and S15): Assets of Households (and NPISHs7):
F3: Securities other than shares:
Stocks:
Can these assets of households be qualified as at “market prices”? If yes what is the exact
meaning of “at market prices”? Are there sufficient secondary markets to obtain a good estimate of the
market price of all these securities? If there is no such market do you make your own estimation of the
value of bonds using the net present value method based on market interest rates? Do there remain bonds
valued at nominal price?
Answer:
Flows:
Does the corresponding flow (Net acquisition of F3) correctly reflect transactions at
market prices of the day of the transaction excluding any revaluation on held assets? If not, is it that this
flow is partly or totally obtained using the difference between two stocks valued at market prices?
Answer:
Illustration of changes in stocks and revaluations:
Households and NPISHs Stock
End 2003
Stock
End 2004
Net acquisition
in 2004
Reevaluation
in 2004
F3 Assets: securities other than
shares.
?
F5: Shares and other equity held by households
Stocks:
Can these assets held by households be qualified as at “market prices”? If yes does it
mean that quoted shares owned by households are valued at stock market prices? What about unquoted
shares: can they be considered to be at “market prices”? If yes, can one assume that their value is
correlated to the price of quoted shares?
Answer:
Flows:
Does the corresponding flow (Net acquisition of F5) correctly reflect transactions at
market prices of the day of the transaction excluding any revaluation on held assets? If not, is it that this
flow is partly or totally obtained using the difference between two stocks valued at market prices?
7 Your response can cover Households alone, or Housholds + NPISHs, whatever the simpler for you.
COM/STD/DAF(2007)11
16
Answer:
Illustration of changes in stocks and revaluations:
Households and NPISHs Stock
End 2003
Stock
End 2004
Net acquisition
in 2004
Reevaluation
in 2004
F5 Assets: Shares and other
equity.
?
Of which Quoted shares ? ? ? ?
Of which Unquoted shares ? ? ? ?
Of which Mutual funds ? ? ? ?
Of which Other equity ? ? ? ?
F6: Insurance technical reserves
Stocks
Can these assets held by households be qualified as at “market prices”? In particular are
life-insurance reserves held by households at market prices?
Answer:
Flows:
Does the corresponding flow (Net acquisition of F6) correctly reflect transactions at
market prices of the day of the transaction excluding any revaluation on held assets? If not, is it that this
flow is partly or totally obtained using the difference between two stocks valued at market prices?
Answer:
Illustration of changes in stocks and revaluations:
Households and NPISHs Stock
End 2003
Stock
End 2004
Net acquisition
in 2004
Revaluation
in 2004
F6 Assets: Insurance technical
reserves.
?


![CARB Document: ......CERT STD SFTP @ 4000 miles SFTP @ * miles CO [g/mi] com osite CERT STD CO sc03 CERT 0.09 STD 0.14 CERT 1.7 STD 8.0 CERT 0.04 STD 0.20 CERT 2.4 STD 2.7 CERT STD](https://img.pdfslide.us/doc/110x75/601fc6dcad09a45b411bb1e3/carb-document-cert-std-sftp-4000-miles-sftp-miles-co-gmi-com-osite.jpg)

![CARB Document: ......CERT 1.2 STD 2.1 CERT 0.02 STD 0.04 co CERT 1.8 11. [gimi] STD 11.1 CO sc03 NMHC+NOx NMHC+NOx Imi SC03 NMHC+NOx [gimil com osite CO [gimil com osite CERT STD 1m](https://img.pdfslide.us/doc/110x75/600350b04fc3ed334f49eee4/carb-document-cert-12-std-21-cert-002-std-004-co-cert-18-11-gimi.jpg)