Embed Size (px)
Citation preview

FOR IMMEDIATE RELEASE
Hollysys Automation Technologies Reports Unaudited
Financial Results for the First Half Year and the Second Quarter Ended December 31, 2015
First Half Year of Fiscal Year 2016 Financial Highlights
Non-GAAP net income attributable to Hollysys was $64.1 million, an increase of 26.3% compared to the
comparable prior year period.
Total revenues were $277.9 million, an increase of 2.5% compared to the comparable prior year period.
Non-GAAP gross margin was at 39.6%, compared to 38.9% for the comparable prior year period.
Non-GAAP diluted EPS were at $1.06, an increase of 23.3% compared to the comparable prior year period.
Net cash provided by operating activities was $53.6 million for the current period.
DSO of 158 days, compared to 192 days for the comparable prior year period.
Inventory turnover days of 38 days, compared to 48 days from the comparable prior year period.
Second Quarter of Fiscal Year 2016 Financial Highlights
Non-GAAP net income attributable to Hollysys was $36.8 million, an increase of 56.0% compared to the
comparable prior year period.
Total revenues were $152.8 million, an increase of 17.3% compared to the comparable prior year period.
Non-GAAP gross margin was at 39.8%, compared to 38.3% for the comparable prior year period.
Non-GAAP diluted EPS were at $0.61, an increase of 52.5% compared to the comparable prior year period.
Net cash provided by operating activities was $46.7 million for the current quarter.
DSO of 138 days, compared to 206 days for the comparable prior year period.
Inventory turnover days of 34 days, compared to 52 days for the comparable prior year period.
Beijing, China – Feb 4, 2016 – Hollysys Automation Technologies, Ltd. (NASDAQ: HOLI) ("Hollysys" or the
"Company"), a leading provider of automation and control technologies and applications in China, today
announced its unaudited financial results for the fiscal year 2016 second quarter ended on December 31, 2015
(see attached tables). The management of Hollysys, stated:
“During this quarter, industrial automation business has being affected by weak external environment, with
particular impacts on process control sector that we have not seen the recovery sign from the market. However,
despite of challenging conditions, our strategy of developing after sales and services is proven successful which
continuously taking larger percentage of our revenue. Besides, giving the new construction projects in the near

Hollysys Automation Technologies, Ltd Page 2 February 4, 2016
future would be lack of sustainable, we have already focused on reconstruction or upgrading opportunities as
supplement through sign maintenance and service contracts to lock potential customers, helping them to improve
efficiency and saving the costs. Breaking down in industries, power is maintaining stable, we have taken several
numbers of high level generator units, and signed large contract such as Jiujiang Shenhua 2X1052MW power
units which are the highest level units in coal-fire power industry. While petro-chemical is still weak, the same as
metallurgy and building materials. Overall speaking, we have to say that external environment brings large impact
to our industrial automation business, but we will adjust ourselves through better internal management and
control such as to insist keeping gross margin for long-term health development within industrial automation to
better cope with this situation and try our best to gradually recover the business.
In high-speed railway, we signed a large contract to provide Automatic Train Protection (ATP) equipment and
system to China Railways Corporation. We are quite confident of the steady high-speed rail revenue and backlog
performance. As China is continuously investing a certain scale on supporting high-speed railway sector for the
next five years, we will still benefit from the policy of 13th five-year-plan. Furthermore, we are also working to
expand our rail new products & technologies such as track circuit which would make potential revenue
contribution in the near future.
For subway business, we have signed quite a few SCADA contracts in the recent quarters and seeking
opportunities to work with more local transportation bureaus. We will continue to deliver quality works and work
closely with subway authorities in the future to build up our SCADA and subway signaling businesses both in
China and abroad.
In the mechanical and electrical solution segment, seasonal lumpiness affected sector’s performance in the short
term. However, we are unshakable to penetrate Southeast Asia and Middle East markets and make progress on
delayed projects. We also actively communicate with local customers to discuss new project opportunities and
even seek business partners for further cooperation.
At last, for extending international business, we have recruited local engineers to support our overseas team.
With our proprietary technologies and products, industry expertise and customer resources, we will continue to
make exciting development and achievements in both industrial and rail transportation fields, and create value for
our shareholders.”
First Half Year and the Second Quarter Ended December 31, 2015 Unaudited Financial Results Summary
To facilitate a clear understanding of Hollysys’ operational results, a summary of unaudited non-GAAP financial
results is shown as below:
(In USD thousands except for number of shares and per share data)
Hollysys Automation Technologies, Ltd Page 3 February 4, 2016
Three months ended
Six months ended
Dec 31, 2015
Dec 31, 2014
% Change
Dec 31, 2015
Dec 31, 2014
% Change
Revenues $ 152,773 130,296 17.3% $ 277,864 270,960 2.5%
Integrated contract revenue $ 134,159 119,014 12.7% $ 245,172 247,505 (0.9)%
Products sales $ 15,393 10,304 49.4% $ 26,835 19,185 39.9%
Service rendered $ 3,221 978 229.3% $ 5,857 4,270 37.2%
Cost of revenues $ 91,964 80,450 14.3% $ 167,875 165,424 1.5%
Gross profit $ 60,809 49,846 22.0% $ 109,989 105,536 4.2%
Total operating expenses $ 19,151 27,762 (31.0)% $ 37,305 46,277 (19.4)%
Selling $ 7,096 7,203 (1.5)% $ 13,720 13,975 (1.8)%
General and administrative $ 10,836 15,466 (29.9)% $ 19,752 24,780 (20.3)%
Research and development $ 11,890 10,109 17.6% $ 19,600 18,893 3.7%
VAT refunds and government subsidies $ (10,671) (5,016) 112.7% $ (15,767) (11,371) 38.7%
Income from operations $ 41,658 22,084 88.6% $ 72,684 59,259 22.7%
Other income, net $ 1,391 713 95.1% $ 1,777 1,269 40.0%
Foreign exchange (losses) gains $ (850) 30 (2933.3)% $ (814) (668) 21.9% Share of net (losses) income of equity
investees $ (217) 24 (1004.2)% $ 77 (2,487) (103.1)%
Dividend income from cost investees $ - 248 (100.0)% $ - 248 (100.0)%
Interest income $ 1,102 857 28.6% $ 2,839 1,712 65.8%
Interest expenses $ (384) (336) 14.3% $ (753) (666) 13.1%
Income tax expenses (credit) $ 5,128 (282) (1918.4)% $ 9,783 7,133 37.2% Net income attributable to noncontrolling
interests $ 785 325 141.5% $ 1,940 800 142.5% Non-GAAP net income attributable to Hollysys
Automation Technologies Ltd. $ 36,787 23,577 56.0% $ 64,087 50,734 26.3%
Non-GAAP basic EPS $ 0.62 0.40 55.0% $ 1.08 0.87 24.1%
Non-GAAP diluted EPS $ 0.61 0.40 52.5% $ 1.06 0.86 23.3%
Share-based compensation expenses $ 1,243 466 166.7% $ 2,137 931 129.5%
Amortization of acquired intangible assets $ 230 1,535 (85.0)% $ 487 3,431 (85.8)% Fair value adjustments of acquisition-related
incentive share contingent consideration $ 2,366 2,389 (4.2)% $ (1,745) (117) 1391.5% Fair value adjustments of acquisition-related
cash contingent consideration $ - - - $ - 201 (100.0)%
Fair value adjustments of a bifurcated derivative $ - 81 (100.0)% $ - 81 (100.0)% GAAP Net income attributable to Hollysys
Automation Technologies Ltd. $ 32,948 19,106 72.4% $ 63,208 46,207 36.8%
GAAP basic EPS $ 0.56 0.33 69.7% $ 1.07 0.79 35.4%
GAAP diluted EPS $ 0.55 0.32 71.9% $ 1.05 0.78 34.6%
Basic weighted average common shares outstanding
59,071,520 58,271,021 1.4%
59,069,316 58,267,994 1.4%
Diluted weighted average common shares outstanding
60,619,909 59,157,335 2.5%
60,632,435 59,129,245 2.5%
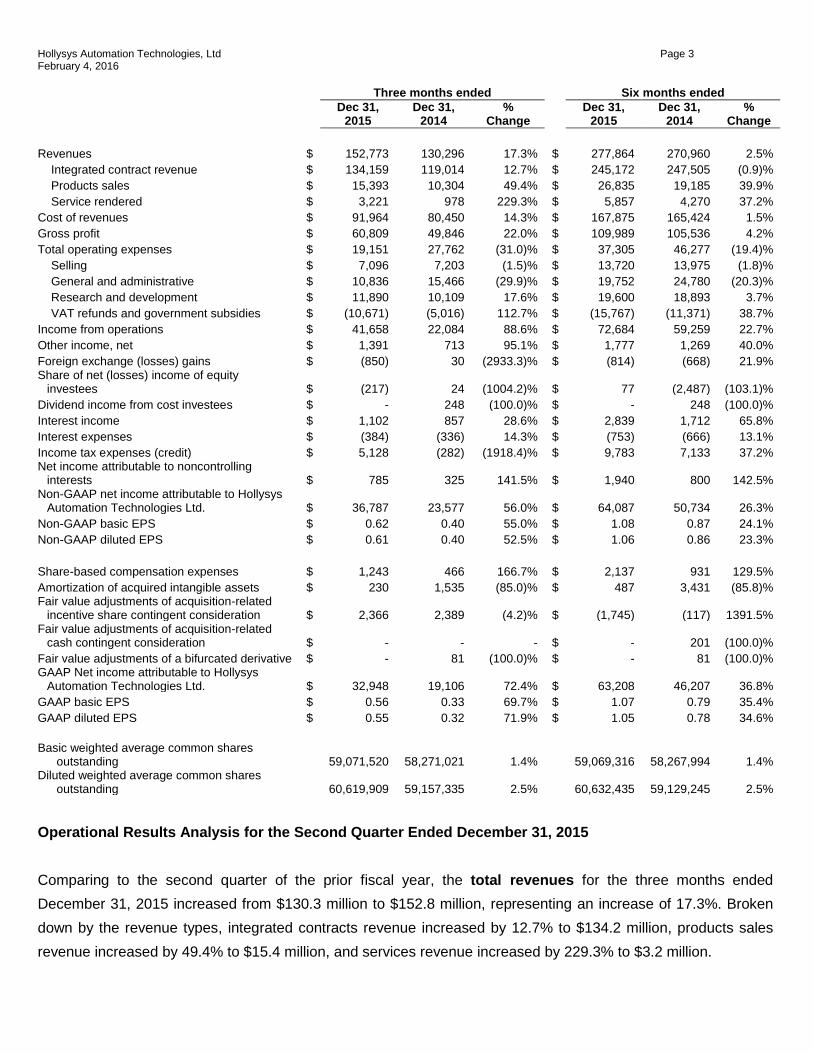
Operational Results Analysis for the Second Quarter Ended December 31, 2015
Comparing to the second quarter of the prior fiscal year, the total revenues for the three months ended
December 31, 2015 increased from $130.3 million to $152.8 million, representing an increase of 17.3%. Broken
down by the revenue types, integrated contracts revenue increased by 12.7% to $134.2 million, products sales
revenue increased by 49.4% to $15.4 million, and services revenue increased by 229.3% to $3.2 million.
Hollysys Automation Technologies, Ltd Page 4 February 4, 2016
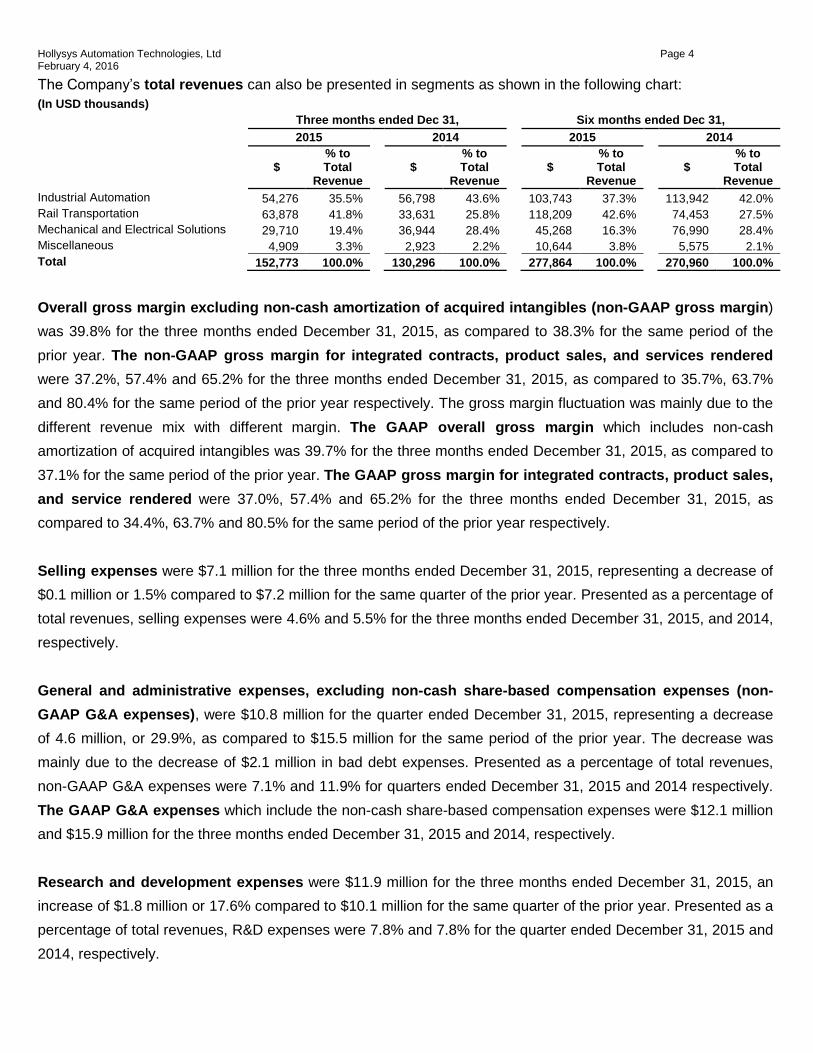
The Company’s total revenues can also be presented in segments as shown in the following chart:
(In USD thousands)
Three months ended Dec 31,
Six months ended Dec 31,
2015
2014
2015
2014
$
% to Total
Revenue
$ % to Total
Revenue
$ % to Total
Revenue
$ % to Total
Revenue
Industrial Automation
54,276 35.5%
56,798 43.6%
103,743 37.3%
113,942 42.0%
Rail Transportation
63,878 41.8%
33,631 25.8%
118,209 42.6%
74,453 27.5%
Mechanical and Electrical Solutions
29,710 19.4%
36,944 28.4%
45,268 16.3%
76,990 28.4%
Miscellaneous
4,909 3.3%
2,923 2.2%
10,644 3.8%
5,575 2.1%
Total
152,773 100.0%
130,296 100.0%
277,864 100.0%
270,960 100.0%
Overall gross margin excluding non-cash amortization of acquired intangibles (non-GAAP gross margin)
was 39.8% for the three months ended December 31, 2015, as compared to 38.3% for the same period of the
prior year. The non-GAAP gross margin for integrated contracts, product sales, and services rendered
were 37.2%, 57.4% and 65.2% for the three months ended December 31, 2015, as compared to 35.7%, 63.7%
and 80.4% for the same period of the prior year respectively. The gross margin fluctuation was mainly due to the
different revenue mix with different margin. The GAAP overall gross margin which includes non-cash
amortization of acquired intangibles was 39.7% for the three months ended December 31, 2015, as compared to
37.1% for the same period of the prior year. The GAAP gross margin for integrated contracts, product sales,
and service rendered were 37.0%, 57.4% and 65.2% for the three months ended December 31, 2015, as
compared to 34.4%, 63.7% and 80.5% for the same period of the prior year respectively.
Selling expenses were $7.1 million for the three months ended December 31, 2015, representing a decrease of
$0.1 million or 1.5% compared to $7.2 million for the same quarter of the prior year. Presented as a percentage of
total revenues, selling expenses were 4.6% and 5.5% for the three months ended December 31, 2015, and 2014,
respectively.
General and administrative expenses, excluding non-cash share-based compensation expenses (non-
GAAP G&A expenses), were $10.8 million for the quarter ended December 31, 2015, representing a decrease
of 4.6 million, or 29.9%, as compared to $15.5 million for the same period of the prior year. The decrease was
mainly due to the decrease of $2.1 million in bad debt expenses. Presented as a percentage of total revenues,
non-GAAP G&A expenses were 7.1% and 11.9% for quarters ended December 31, 2015 and 2014 respectively.
The GAAP G&A expenses which include the non-cash share-based compensation expenses were $12.1 million
and $15.9 million for the three months ended December 31, 2015 and 2014, respectively.
Research and development expenses were $11.9 million for the three months ended December 31, 2015, an
increase of $1.8 million or 17.6% compared to $10.1 million for the same quarter of the prior year. Presented as a
percentage of total revenues, R&D expenses were 7.8% and 7.8% for the quarter ended December 31, 2015 and
2014, respectively.
Hollysys Automation Technologies, Ltd Page 5 February 4, 2016
The VAT refunds and government subsidies were $10.7 million for three months ended December 31, 2015,
as compared to $5.0 million for the same period in the prior year, representing a $5.7 million or 112.7% increase
which primarily due to the increase of the VAT refunds of $6.1 million.
The income tax expenses and the effective tax rate were $5.1 million and 13.2% for the three months ended
December 31, 2015, as compared to a $(0.3) million and (1.5)% for comparable prior year period. When
excluding the impact of non-GAAP adjustments on the income before income taxes, the effective tax rate would
have been 12.0% for the current quarter and (1.2)% for the comparable prior year period. During the second
quarter ended December 31, 2014, Beijing Hollysys & Hangzhou Hollysys were certified as HNTE effective for
three years from January 1, 2014 to December 31, 2016, and are applied to the preferential EIT rate of 15%; and
Beijing Hollysys and Hangzhou Hollysys accordingly recalculated the tax expenses accrual for calendar year
2014, based on the newly applied EIT rate of 15%, instead of 25%. Excluding the impact of the accrual
adjustment, the effective tax rate for the three months ended December 31, 2014 was 15.2%.
The non-GAAP net income attributable to Hollysys, which excludes non-cash share-based compensation
expenses, amortization of acquired intangibles and acquisition-related consideration fair value adjustments was
$36.8 million or $0.61 per diluted share based on 60.6 million shares outstanding for the three months ended
December 31, 2015. This represents a 56.0% increase over the $23.6 million or $0.40 per share based on 59.2
million shares outstanding reported in the comparable prior year period. On a GAAP basis, net income
attributable to Hollysys was $32.9 million or $0.55 per diluted share representing an increase of 72.4% over the
$19.1 million or $0.32 per diluted share reported in the comparable prior year period.
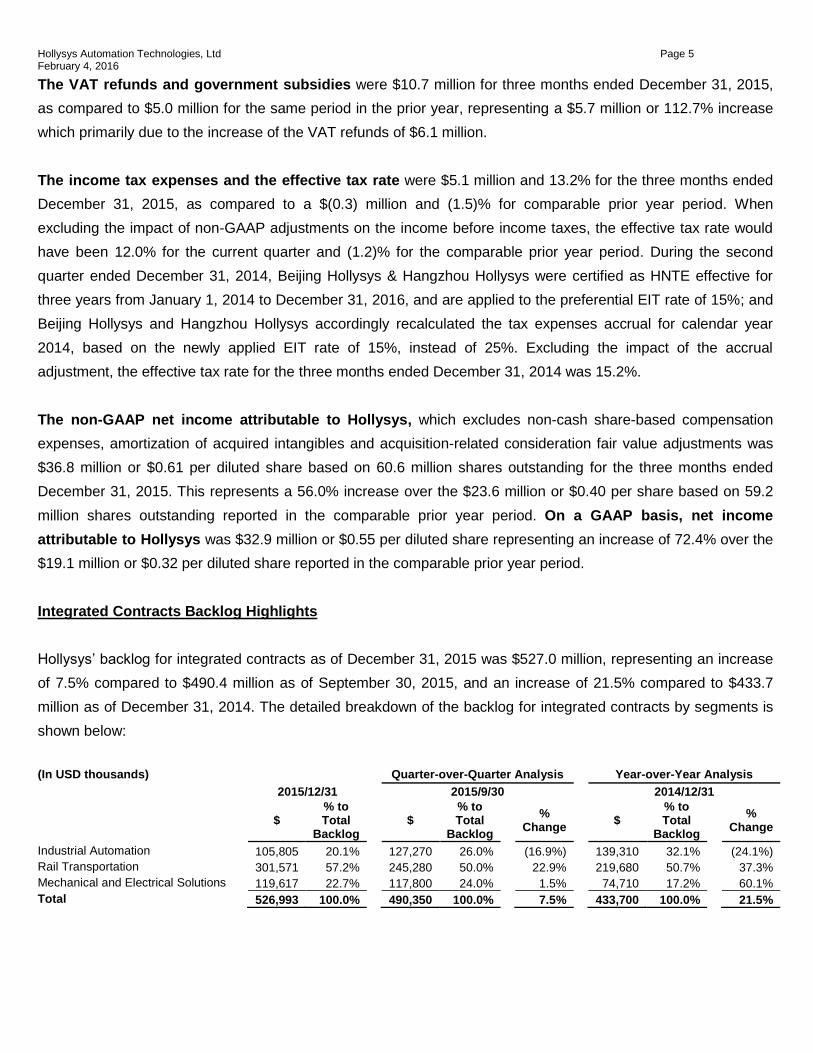
Integrated Contracts Backlog Highlights
Hollysys’ backlog for integrated contracts as of December 31, 2015 was $527.0 million, representing an increase
of 7.5% compared to $490.4 million as of September 30, 2015, and an increase of 21.5% compared to $433.7
million as of December 31, 2014. The detailed breakdown of the backlog for integrated contracts by segments is
shown below:
(In USD thousands)
Quarter-over-Quarter Analysis
Year-over-Year Analysis
2015/12/31
2015/9/30
2014/12/31
$
% to Total
Backlog
$ % to Total
Backlog
% Change
$ % to Total
Backlog
% Change
Industrial Automation
105,805 20.1%
127,270 26.0%
(16.9%)
139,310 32.1%
(24.1%)
Rail Transportation
301,571 57.2%
245,280 50.0%
22.9%
219,680 50.7%
37.3%
Mechanical and Electrical Solutions
119,617 22.7%
117,800 24.0%
1.5%
74,710 17.2%
60.1%
Total
526,993 100.0%
490,350 100.0%
7.5%
433,700 100.0%
21.5%
Hollysys Automation Technologies, Ltd Page 6 February 4, 2016
Cash Flow Highlights
For the three months ended December 31, 2015, the total net cash outflow was $1.8 million. The net cash
provided by operating activities was $46.7 million. The net cash used in investing activities was $45.5
million, mainly consisted of $47.2 million placed as time deposits with original maturities over three months in
banks. The net cash provided by financing activities was $0.4 million.
Balance Sheet Highlights
The total amount of cash and cash equivalents and time deposits with original maturities over three
months were $275.6 million, $234.9 million, and $215.8 million as of December 31, September 30, 2015 and
December 31, 2014, respectively. As of December 31, 2015, the company held $188.7 million in cash and cash
equivalents and $86.9 million in time deposits with original maturities over three months.
For the three months ended December 31, 2015, Days Sales Outstanding (“DSO”) was 138 days, as compared
to 206 days for the comparable prior year period and 179 days for the last quarter; and inventory turnover was 34
days, as compared to 52 days for the comparable prior year period and 42 days for the last quarter.
Outlook for FY 2016
The management concluded, “Given our strong backlog currently on-hand and sales pipeline envisioned so far,
we reiterate our guidance for fiscal year 2016 with revenue in the range of $565 million to $600 million and non-
GAAP net income in the range of $110 million to $120 million.”
Conference Call
The Company will host a conference call at 8:00 p.m. U.S. Eastern Time on February 3, 2016 / 9:00 a.m. Beijing
Time on February 4, 2016, to discuss the financial results for the fiscal year 2016 second quarter
ended December 31, 2015 and business outlook.
To participate, please call the following numbers ten minutes before the scheduled start of the call. The
conference call identification number is 2220095.
4001-200-539 (China) 0080 161 5189 (Taiwan) +1-855-298-3404 (United States) +1 631 5142 526 (US - New York) 0800 916 599 (France) 0800 1899 399 (Germany) 0800 837 001 (Switzerland)

Hollysys Automation Technologies, Ltd Page 7 February 4, 2016
1800 801 825 (Australia) 800-905-927 (Hong Kong) +852-5808-3202 (Hong Kong) 0800-015-9725 (United Kingdom) +44(0)20 3078 7622 (United Kingdom - London) 800-616-3222 (Singapore) +65 6823 2299 (Singapore/International)
In addition, a recording of the conference call will be accessible within 48 hours via Hollysys' website
at: http://ir.hollysys.com/ or http://hollysys.investorroom.com
About Hollysys Automation Technologies, Ltd. (NASDAQ: HOLI)
Hollysys Automation Technologies is a leading provider of automation and control technologies and applications
in China that enables its diversified industry and utility customers to improve operating safety, reliability, and
efficiency. Founded in 1993, Hollysys has approximately 3,600 employees with nationwide presence in over 60
cities in China, with subsidiaries and offices in Singapore, Malaysia, Dubai, India, and serves over 6,000
customers more than 20,000 projects in the industrial, railway, subway & nuclear industries in China, South-East
Asia, and the Middle East. Its proprietary technologies are applied in its industrial automation solution suite
including DCS (Distributed Control System), PLC (Programmable Logic Controller), RMIS (Real-time
Management Information System), HAMS (HolliAS Asset Management System), OTS (Operator Training System),
HolliAS BATCH (Batch Application Package), HolliAS APC Suite (Advanced Process Control Package), SIS
(Safety Instrumentation System), high-speed railway signaling system of TCC (Train Control Center), ATP
(Automatic Train Protection), Subway Supervisory and Control platform, SCADA (Surveillance Control and Data
Acquisition), nuclear power plant automation and control system and other products.
SAFE HARBOUR:
This release contains forward-looking statements within the meaning of the Private Securities Litigation Reform
Act of 1995. All statements, other than statements of historical fact included herein are "forward-looking
statements," including statements regarding: the ability of the Company to achieve its commercial objectives; the
business strategy, plans and objectives of the Company and its subsidiaries; and any other statements of non-
historical information. These forward-looking statements are often identified by the use of forward-looking
terminology such as "believes," "expects" or similar expressions, involve known and unknown risks and
uncertainties. Such forward-looking statements, based upon the current beliefs and expectations of Hollysys'
management, are subject to risks and uncertainties, which could cause actual results to differ from the forward
looking statements. Although the Company believes that the expectations reflected in these forward-looking
statements are reasonable, they do involve assumptions, risks and uncertainties, and these expectations may
prove to be incorrect. Investors should not place undue reliance on these forward-looking statements, which
speak only as of the date of this press release. The Company's actual results could differ materially from those
anticipated in these forward-looking statements as a result of a variety of factors, including those discussed in the
Company's reports that are filed with the Securities and Exchange Commission and available on its website
Hollysys Automation Technologies, Ltd Page 8 February 4, 2016
(http://www.sec.gov). All forward-looking statements attributable to the Company or persons acting on its behalf
are expressly qualified in their entirety by these factors. Other than as required under the securities laws, the
Company does not assume a duty to update these forward-looking statements.
For further information, please contact:
Hollysys Automation Technologies, Ltd.
www.hollysys.com
+86-10-5898-1386
Hollysys Automation Technologies, Ltd Page 9 February 4, 2016
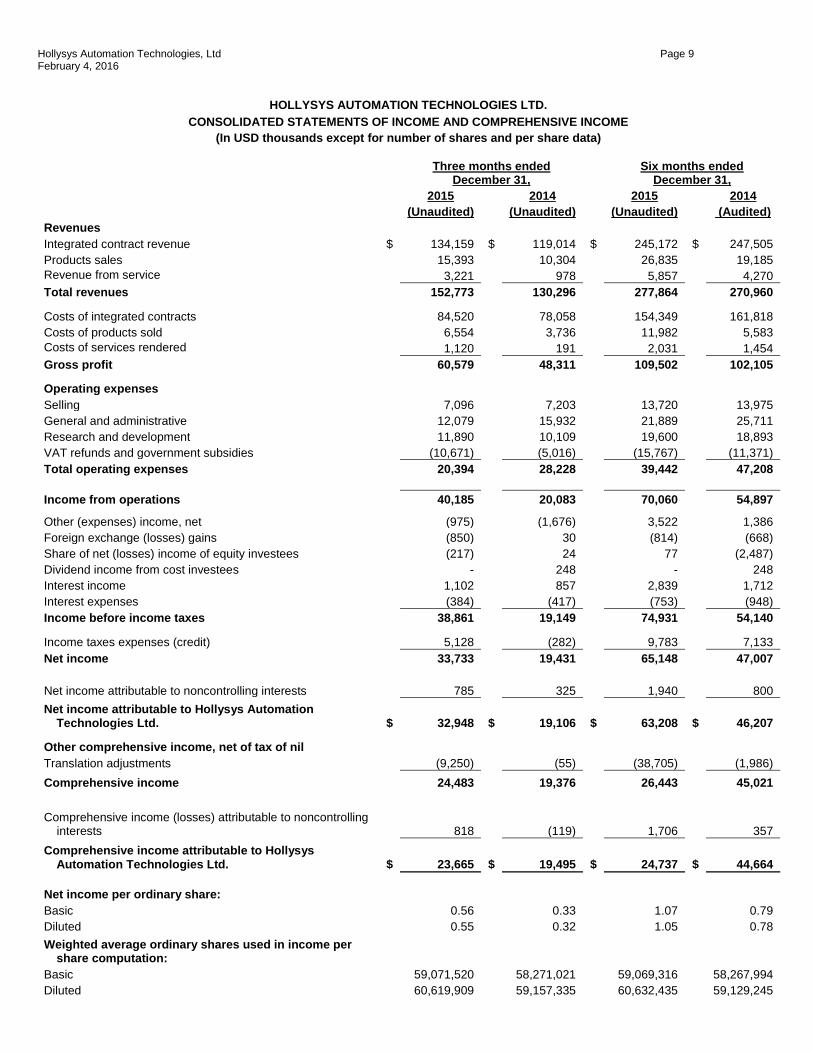
HOLLYSYS AUTOMATION TECHNOLOGIES LTD.
CONSOLIDATED STATEMENTS OF INCOME AND COMPREHENSIVE INCOME
(In USD thousands except for number of shares and per share data)
Three months ended December 31,
Six months ended December 31,
2015
2014
2015
2014
(Unaudited)
(Unaudited)
(Unaudited)
(Audited)
Revenues
Integrated contract revenue $ 134,159 $ 119,014 $ 245,172 $ 247,505
Products sales
15,393
10,304
26,835
19,185
Revenue from service
3,221
978
5,857
4,270
Total revenues
152,773
130,296
277,864
270,960
Costs of integrated contracts
84,520
78,058
154,349
161,818
Costs of products sold
6,554
3,736
11,982
5,583
Costs of services rendered
1,120
191
2,031
1,454
Gross profit
60,579
48,311
109,502
102,105
Operating expenses
Selling
7,096
7,203
13,720
13,975
General and administrative
12,079
15,932
21,889
25,711
Research and development
11,890
10,109
19,600
18,893
VAT refunds and government subsidies
(10,671)
(5,016)
(15,767)
(11,371)
Total operating expenses
20,394
28,228
39,442
47,208
Income from operations
40,185
20,083
70,060
54,897
Other (expenses) income, net
(975)
(1,676)
3,522
1,386
Foreign exchange (losses) gains
(850)
30
(814)
(668)
Share of net (losses) income of equity investees
(217)
24
77
(2,487)
Dividend income from cost investees
-
248
-
248
Interest income
1,102
857
2,839
1,712
Interest expenses
(384)
(417)
(753)
(948)
Income before income taxes
38,861
19,149
74,931
54,140
Income taxes expenses (credit)
5,128
(282)
9,783
7,133
Net income
33,733
19,431
65,148
47,007
Net income attributable to noncontrolling interests
785
325
1,940
800
Net income attributable to Hollysys Automation Technologies Ltd. $ 32,948 $ 19,106 $ 63,208 $ 46,207
Other comprehensive income, net of tax of nil
Translation adjustments
(9,250)
(55)
(38,705)
(1,986)
Comprehensive income
24,483
19,376
26,443
45,021
Comprehensive income (losses) attributable to noncontrolling interests
818
(119)
1,706
357
Comprehensive income attributable to Hollysys Automation Technologies Ltd. $ 23,665 $ 19,495 $ 24,737 $ 44,664
Net income per ordinary share:
Basic
0.56
0.33
1.07
0.79
Diluted
0.55
0.32
1.05
0.78
Weighted average ordinary shares used in income per share computation:
Basic
59,071,520
58,271,021
59,069,316
58,267,994
Diluted
60,619,909
59,157,335
60,632,435
59,129,245
Hollysys Automation Technologies, Ltd Page 10 February 4, 2016
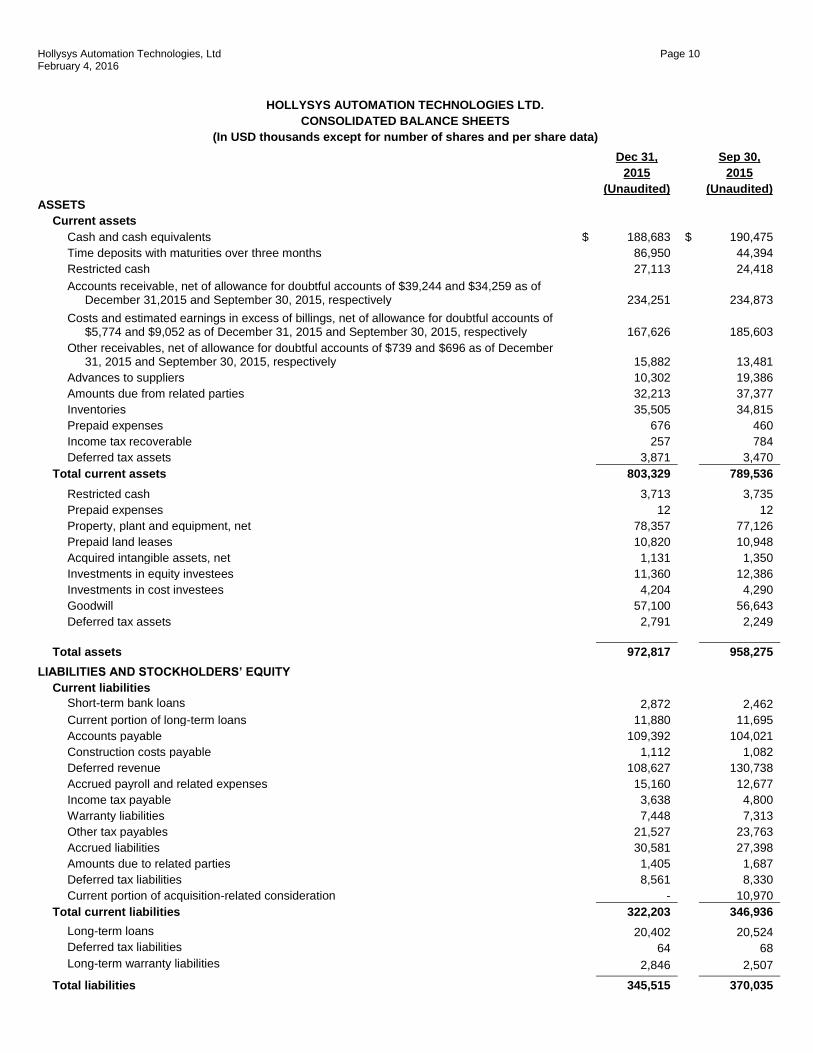
HOLLYSYS AUTOMATION TECHNOLOGIES LTD.
CONSOLIDATED BALANCE SHEETS
(In USD thousands except for number of shares and per share data)
Dec 31,
Sep 30,
2015
2015
(Unaudited)
(Unaudited)
ASSETS
Current assets
Cash and cash equivalents $ 188,683 $ 190,475
Time deposits with maturities over three months
86,950
44,394
Restricted cash
27,113
24,418
Accounts receivable, net of allowance for doubtful accounts of $39,244 and $34,259 as of December 31,2015 and September 30, 2015, respectively
234,251
234,873
Costs and estimated earnings in excess of billings, net of allowance for doubtful accounts of $5,774 and $9,052 as of December 31, 2015 and September 30, 2015, respectively
167,626
185,603
Other receivables, net of allowance for doubtful accounts of $739 and $696 as of December 31, 2015 and September 30, 2015, respectively
15,882
13,481
Advances to suppliers
10,302
19,386
Amounts due from related parties
32,213
37,377
Inventories
35,505
34,815
Prepaid expenses
676
460
Income tax recoverable
257
784
Deferred tax assets
3,871
3,470
Total current assets
803,329
789,536
Restricted cash
3,713
3,735
Prepaid expenses
12
12
Property, plant and equipment, net
78,357
77,126
Prepaid land leases
10,820
10,948
Acquired intangible assets, net
1,131
1,350
Investments in equity investees
11,360
12,386
Investments in cost investees
4,204
4,290
Goodwill
57,100
56,643
Deferred tax assets
2,791
2,249
Total assets
972,817
958,275
LIABILITIES AND STOCKHOLDERS’ EQUITY
Current liabilities
Short-term bank loans
2,872
2,462
Current portion of long-term loans
11,880
11,695
Accounts payable
109,392
104,021
Construction costs payable
1,112
1,082
Deferred revenue
108,627
130,738
Accrued payroll and related expenses
15,160
12,677
Income tax payable
3,638
4,800
Warranty liabilities
7,448
7,313
Other tax payables
21,527
23,763
Accrued liabilities
30,581
27,398
Amounts due to related parties
1,405
1,687
Deferred tax liabilities
8,561
8,330
Current portion of acquisition-related consideration
-
10,970
Total current liabilities
322,203
346,936
Long-term loans
20,402
20,524
Deferred tax liabilities
64
68
Long-term warranty liabilities
2,846
2,507
Total liabilities
345,515
370,035

Hollysys Automation Technologies, Ltd Page 11 February 4, 2016
Commitments and contingencies
-
-
Equity
Ordinary shares, par value $0.001 per share, 100,000,000 shares authorized; 58,998,599 and 58,358,521 shares issued and outstanding as of December 31, 2015 and September 30, 2015, respectively
59
58
Additional paid-in capital
208,241
193,663
Statutory reserves
30,299
30,248
Retained earnings
381,598
348,700
Accumulated other comprehensive income
-886
8,398
Total Hollysys Automation Technologies Ltd. stockholder’s equity
619,311
581,067
Noncontrolling interests
7,991
7,173
Total equity
627,302
588,240
Total liabilities and equity $ 972,817 $ 958,275

Hollysys Automation Technologies, Ltd Page 12 February 4, 2016
HOLLYSYS AUTOMATION TECHNOLOGIES LTD.
CONSOLIDATED STATEMENTS OF CASH FLOWS
(In USD thousands)
Three months ended
Dec 31, 2015
Six months ended
Dec 31, 2015
(Unaudited)
(Unaudited)
Cash flows from operating activities:
Net income $ 33,733 $ 65,148
Adjustments to reconcile net income to net cash provided by operating activities:
Depreciation of property, plant and equipment
1,366
3,283
Amortization of prepaid land leases
83
132
Amortization of intangible assets
231
489
Allowance for doubtful accounts
2,897
4,874
Losses on disposal of property, plant and equipment
(95)
305
Share of net losses (income) from equity investees
217
(77)
Share-based compensation expenses
1,243
2,137
Deferred income tax expenses
(743)
1,604
Acquisition-related consideration adjustments
2,366
(1,745)
Accretion of convertible notes discount
57
115
Changes in operating assets and liabilities:
Accounts receivable
(7,499)
(3,276)
Costs and estimated earnings in excess of billings
19,179
(9,330)
Inventories
(1,388)
(2,894)
Advances to suppliers
8,995
4,205
Other receivables
(2,667)
(4,353)
Deposits and other assets
(3,255)
(3,353)
Due from related parties
4,530
4,712
Accounts payable
5,766
10,135
Deferred revenue
(20,473)
(22,561)
Accruals and other payable
4,429
2,653
Due to related parties
156
198
Income tax payable
(558)
(1,500)
Other tax payables
(1,885) 2,660
Net cash provided by operating activities
46,685
53,561
Cash flows from investing activities:
Time deposits with original maturities over three months placed with banks
(47,210)
(60,860)
Purchases of property, plant and equipment
(1,335)
(3,271)
Proceeds from disposal of property, plant and equipment
-
1
Maturity of time deposits with original maturities over three months
3,055
20,254
Net cash used in investing activities
(45,490)
(43,876)
Cash flows from financing activities:
Proceeds from short-term bank loans
404
3,221
Repayments of short-term bank loans
-
(16,378)
Proceeds from long-term bank loans
1,929
2,296
Repayments of long-term bank loans
(1,975)
(4,194)
Net cash provided by (used in) financing activities
358
(15,055)
Effect of foreign exchange rate changes
(3,345)
(13,781)
Net decrease in cash and cash equivalents $ (1,792) $ (19,151)

Hollysys Automation Technologies, Ltd Page 13 February 4, 2016
Cash and cash equivalents, beginning of period $ 190,475 $ 207,834
Cash and cash equivalents, end of period
188,683
188,683

Hollysys Automation Technologies, Ltd Page 14 February 4, 2016
Non-GAAP Measures
In evaluating our results, the non-GAAP measures of “Non-GAAP general and administrative expenses”, “Non-
GAAP net income attributable to Hollysys Automation Technologies Ltd. stockholders”, “Non-GAAP basic
earnings per share”, and “Non-GAAP diluted earnings per share” serve as additional indicators of our operating
performance and not as a replacement for other measures in accordance with U.S. GAAP. We believe these non-
GAAP measures are useful to investors, as they exclude the non-cash share-based compensation expenses,
which is calculated based on the number of shares or options granted and the fair value as of the grant date,
amortization of acquired intangible assets, fair value adjustments of acquisition-related consideration, and fair
value adjustments of a bifurcated derivative. They will not result in any cash inflows or outflows. We believe that
using non-GAAP measures help our shareholders to have a better understanding of our operating results and
growth prospects. In addition, given the business nature of the Company, it has been a common practice for
investors to use such non-GAAP measures to evaluate the Company.
The following table provides a reconciliation of U.S. GAAP measures to the non-GAAP measures for the periods
indicated:
(In USD thousands except for number of shares and per share data)
Three months ended
Six months ended
Dec 31,
Dec 31,
2015
2014
2015
2014
(Unaudited)
(Unaudited)
(Unaudited)
(Unaudited)
Cost of integrated contracts $ 84,520 $ 78,058 $ 154,349 $ 161,818
Less: Amortization of acquired intangible assets
230
1,535
487
3,431
Non-GAAP cost of integrated contracts $ 84,290 $ 76,523 $ 153,862 $ 158,387
General and administrative expenses $ 12,079 $ 15,932 $ 21,889 $ 25,711
Less: Share-based compensation expenses
1,243
466
2,137
931
Non-GAAP general and administrative expenses $ 10,836 $ 15,466 $ 19,752 $ 24,780
Other (expenses) income, net $ (975) $ (1,676) $ 3,522 $ 1,386
Add: Fair value adjustments of acquisition-related incentive share contingent consideration
2,366
2,389
(1,745)
(117)
Non-GAAP other income, net $ 1,391 $ 713 $ 1,777 $ 1,269
Interest expenses $ (384) $ (417) $ (753) $ (948)
Add:
Fair value adjustments of acquisition-related cash contingent consideration
-
-
-
201
Fair value adjustments of a bifurcated derivative
-
81
-
81
Non-GAAP interest expenses $ (384) $ (336) $ (753) $ (666)
Net income attributable to Hollysys Automation Technologies Ltd. $ 32,948 $ 19,106 $ 63,208 $ 46,207
Add:
Share-based compensation expenses
1,243
466
2,137
931
Amortization of acquired intangible assets
230
1,535
487
3,431
Fair value adjustments of acquisition-related consideration
2,366
2,389
(1,745)
84
Fair value adjustments of a bifurcated derivative
-
81
-
81
Non-GAAP net income attributable to Hollysys Automation Technologies Ltd. $ 36,787 $ 23,577 $ 64,087 $ 50,734
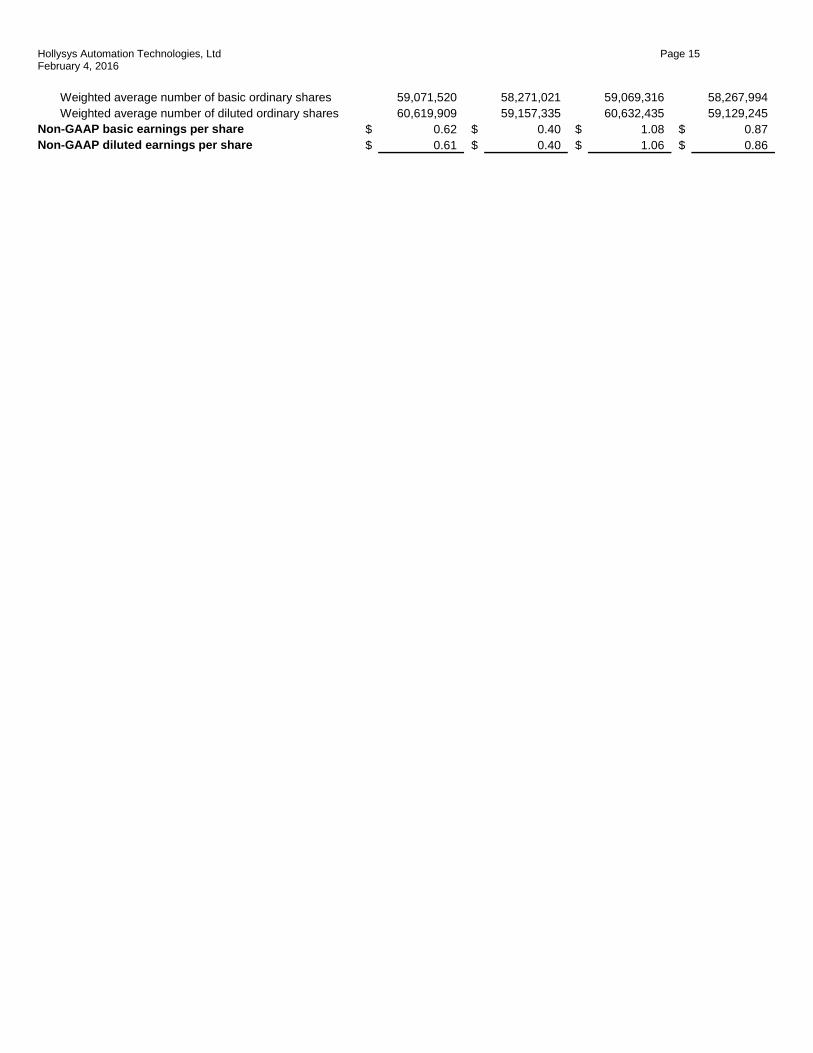
Hollysys Automation Technologies, Ltd Page 15 February 4, 2016
Weighted average number of basic ordinary shares
59,071,520
58,271,021
59,069,316
58,267,994
Weighted average number of diluted ordinary shares
60,619,909
59,157,335
60,632,435
59,129,245
Non-GAAP basic earnings per share $ 0.62 $ 0.40 $ 1.08 $ 0.87
Non-GAAP diluted earnings per share $ 0.61 $ 0.40 $ 1.06 $ 0.86


![sales international@hollysys.com or mail to HollySys Asia ......Please fill in and submit this form with email subject [HollySys Project Registration Form] via email to sales_international@hollysys.com](https://img.pdfslide.us/doc/110x75/609c84fa6427d1729c500620/sales-international-or-mail-to-hollysys-asia-please-fill-in-and-submit.jpg)