Embed Size (px)
Citation preview

Media Information
14 March 2018
FOR IMMEDIATE RELEASE
CATHAY PACIFIC AIRWAYS LIMITED
ANNOUNCES 2017 ANNUAL RESULTS
Results 1H2017 2H2017 FY2017 FY2016 Change
Revenue HK$ million 45,858 51,426 97,284 92,751 +4.9%
(Loss)/ profit attributable to the
shareholders of Cathay Pacific
HK$ million
(2,051)
792
(1,259)
(575)
-119.0%
(Loss)/earnings per share HK cents (52.1) 20.1 (32.0) (14.6) -119.2%
Dividend per share HK$ - 0.05 0.05 0.05 -
The Cathay Pacific Group reported an attributable profit of HK$792 million in the second half of 2017,
compared to an attributable loss of HK$2,051 million in the first half of 2017 and an attributable loss of HK$928
million in the second half of 2016. Cathay Pacific and Cathay Dragon reported an attributable loss of HK$1,538
million in the second half of 2017, compared to an attributable loss of HK$2,765 million in the first half of 2017
and an attributable loss of HK$2,580 million in the second half of 2016.
For 2017, the Cathay Pacific Group reported an attributable loss of HK$1,259 million for 2017. This compares
to a loss of HK$575 million in 2016. The loss per share was HK32.0 cents in 2017 compared to a loss per
share of HK14.6 cents in 2016.
Fundamental structural changes within the airline industry continued to create a challenging operating
environment for our airline businesses in 2017. In response, we took decisive action through our
transformation programme to make our businesses leaner and more agile and more effective competitors.
Our focus in 2017 was on building the right foundations, structure and strategy to improve revenue and to
better contain costs. Evidence of progress became apparent in the second half of the year. Airline losses in
the second half of 2017 were lower than those in each of the two preceding half years.
The factors which affected our performance were largely the same as in 2016. Overcapacity in passenger
markets led to intense competition with other airlines and continued pressure on yields on many of our key
routes. Fuel prices were higher, but fuel hedging losses reduced. As the year progressed we began to see
positive results from our transformation programme and our business also benefited from a strong cargo
business, a weaker US dollar, and improved premium class passenger demand.
The contribution from subsidiary and associated companies was satisfactory.
Passenger business
Passenger revenue in 2017 was HK$66,408 million, a decrease of 0.8% compared to 2016. Capacity
increased by 2.8%, reflecting the introduction of new routes and increased frequencies on other routes. The
load factor decreased by 0.1 percentage point, to 84.4%. Yield, which was under pressure for most of the year,
fell by 3.3% to HK52.3 cents, albeit improving by 3.1% in the second half of the year compared to the first half.

Cargo business
The Group’s cargo business benefited from robust demand in 2017, with cargo revenue increasing by 19.1%
to HK$23,903 million. The cargo capacity of Cathay Pacific and Cathay Dragon increased by 3.6%. The load
factor increased by 3.4 percentage points, to 67.8%. Tonnage carried increased by 10.9%. Yield rose by
11.3% to HK$1.77, benefiting from the resumption (from April) of the collection of fuel surcharges in Hong
Kong and from strong demand.
Cost
Total fuel costs for Cathay Pacific and Cathay Dragon (before the effect of fuel hedging) increased by
HK$5,147 million (or 27.0%) compared with 2016, due to a rise in the price of fuel and increased operations.
Fuel is still the Group’s most significant cost, accounting for 30.7% of our total operating costs in 2017
(compared to 29.6% in 2016). Fuel hedging losses were reduced. After taking hedging losses into account,
fuel costs increased by HK$3,159 million (or 11.3%) compared to 2016. We were able to limit the increase in
our cost per ATK (excluding fuel) to 0.9%, and hold our underlying cost per ATK (excluding fuel and before
exceptional items) flat, despite a challenging cost environment. This reflected our transformation programme’s
focus on productivity, efficiency and holding the growth in staff costs below ATK growth.
Congestion at Hong Kong International Airport and air traffic control constraints in the Greater China region
continued to impose costs on the Group. We are doing more to improve the reliability of our operations.
Exceptional items
Several one-off factors impacted results in 2017. In March, the European Commission imposed a fine of Euros
57.12 million (equivalent to approximately HK$498 million) on Cathay Pacific following its decision that a
number of international air cargo carriers, including Cathay Pacific, had agreed to cargo surcharge levels prior
to 2007 and that such agreements infringed European competition law. An application has been made to
annul the decision. In the same month, Air China completed an issue of A shares and, as a result, Cathay
Pacific’s shareholding was diluted. A gain of HK$244 million was recognised on the deemed partial disposal.
In April, Cathay Pacific disposed of its interest in TravelSky Technology Limited at a profit of HK$586 million.
In November, Air Hong Kong agreed to enter into sale and leaseback transactions with DHL International in
respect of eight Airbus A300-600F freighters and associated equipment. Five of these transactions were
completed in 2017. Three of them will be completed in 2018. Cathay Pacific entered into an agreement with
DHL International for Cathay Pacific to acquire from DHL International at the end of 2018 the 40%
shareholding in Air Hong Kong that it does not already own, with the result that Air Hong Kong will become a
wholly owned subsidiary of Cathay Pacific. Air Hong Kong will continue to operate an agreed freighter network
to destinations in Asia for DHL International under a new block space agreement between Air Hong Kong and
DHL International for an initial term of 15 years commencing on 1st January 2019.
In the first half of 2017, we commenced a three-year corporate transformation programme, which is intended
to address the fundamental competitive challenges we are facing in the current airline industry environment.
The programme has the goal of making our airlines more consumer focused and responsive, and in doing so
increasing our revenue and containing costs. In 2017, we built the right foundations, strategy and structure.
We reorganised our head office, and focused on containing costs and improving efficiencies. We appointed
new management and leadership teams. The associated redundancy costs (of HK$224 million) have been
recognised in 2017 staff expenses.
Network
We introduced a service to Tel Aviv in March and seasonal services to Barcelona in July and to Christchurch
in December. We increased frequencies to other destinations in response to demand. We stopped flying to
Riyadh in March 2017. We will introduce services to Brussels in March 2018, to Dublin in June 2018 and to

Washington D.C. in September 2018. We will start to fly to Barcelona all year round in April 2018. Seasonal
services will be introduced to Copenhagen between May and October 2018 and to Cape Town between
November 2018 and February 2019. Cathay Dragon introduced a service to Nanning in January 2018 and
will introduce a service to Jinan in March 2018.
Fleet
We took delivery of 12 Airbus A350-900 aircraft in 2017, bringing the total number of this aircraft type to 22 at
the end of the year. In September, we ordered 32 Airbus A321-200neo aircraft for Cathay Dragon, to be
delivered from 2020, and retired our final four Airbus A340-300 aircraft and two Boeing 747-400 BCF freighter
aircraft. We wet-leased two Boeing 747-8F freighter aircraft in order to allow us to increase cargo capacity.
Prospects
Cathay Pacific Chairman John Slosar said: “Our priorities for 2018 are our transformation programme,
changing the way that we work so as to better contain costs which will strengthen our passenger business
further. We are confident of a successful outcome from these efforts. We also look to benefit from a slowing
of the decline in passenger yields as global economic conditions improve. The outlook for our cargo business
is positive and we will take best advantage of opportunities in the growing global cargo market. Increased fuel
costs are increasing operating costs and adversely affecting results. Fuel hedging losses are declining.
“We are improving our competitive position by expanding our route network, increasing frequencies on our
most popular routes and buying more fuel-efficient aircraft. We have improved productivity and efficiency and
at the same time we are improving our already high customer service standards. We are proud of the quality,
dedication and professionalism of our people. They have my utmost respect and I would like to thank them
for their hard work and commitment during a period of uncertainty. Difficult but necessary decisions have been
made. We are acting decisively to make Cathay Pacific and Cathay Dragon better airlines and stronger
businesses. We believe we are on track to achieve strong and sustainable long-term performance.
“Our commitment to Hong Kong and its people remains unwavering, as has been the case over more than 70
years. We will continue to make strategic investments to develop and strengthen Hong Kong’s position as
Asia’s largest and most popular international aviation hub.”
Media Enquiries
+852 2747 5393
www.cathaypacific.com

Annual Results 2017 1
Hong Kong Exchanges and Clearing Limited and The Stock Exchange of Hong Kong Limited take no responsibility for the contents of this announcement, make no representation as to its accuracy or completeness and expressly disclaim any liability whatsoever for any loss howsoever arising from or in reliance upon the whole or any part of the contents of this announcement.
CATHAY PACIFIC AIRWAYS LIMITED (Incorporated in Hong Kong with limited liability)
(Stock Code: 293)
Announcement
2017 Annual Results
Financial and Operating Highlights
Group Financial Statistics
Results 2017 2016 Change
Revenue HK$ million 97,284 92,751 +4.9%
Loss attributable to the shareholders of Cathay Pacific HK$ million (1,259) (575) -119.0%
Loss per share HK cents (32.0) (14.6) -119.2%
Dividend per share HK$ 0.05 0.05 -
Loss margin % (1.3) (0.6) -0.7%pt
Financial position
Funds attributable to the shareholders of Cathay Pacific HK$ million 61,101 55,365 +10.4%
Net borrowings HK$ million 59,300 49,879 +18.9%
Shareholders' funds per share HK$ 15.5 14.1 +9.9%
Net debt/equity ratio Times 0.97 0.90 +0.07 times
Operating Statistics – Cathay Pacific and Cathay Dragon
2017 2016 Change
Available tonne kilometres (“ATK”) Million 31,439 30,462 +3.2%
Available seat kilometres (“ASK”) Million 150,138 146,086 +2.8%
Available cargo & mail tonne kilometres (“AFTK”) Million 17,163 16,572 +3.6%
Passenger revenue per ASK HK cents 44.2 45.8 -3.5%
Revenue passengers carried ‘000 34,820 34,323 +1.4%
Passenger load factor % 84.4 84.5 -0.1%pt
Passenger yield HK cents 52.3 54.1 -3.3%
Cargo and mail revenue per AFTK HK$ 1.20 1.03 +16.5%
Cargo and mail carried ‘000 tonnes 2,056 1,854 +10.9%
Cargo and mail load factor % 67.8 64.4 +3.4%pt
Cargo and mail yield HK$ 1.77 1.59 +11.3%
Cost per ATK (with fuel) HK$ 3.12 3.02 +3.3%
Cost per ATK (without fuel) HK$ 2.14 2.12 +0.9%
Underlying cost per ATK (without fuel and before
exceptional items)
HK$ 2.12 2.12 -
ATK per HK$’000 staff cost Unit 1,775 1,730 +2.6%
Aircraft utilisation Hours per day 12.3 12.2 +0.8%
On-time performance % 71.2 72.1 -0.9%pt
Average age of fleet Years 9.3 9.1 +2.2%
GHG emissions Million tonnes of CO2e 17.7 17.2 +2.9%
GHG emissions per ATK Grammes of CO2e 564 565 -0.2%
Lost time injury rate Number of injuries per 100 full-
time equivalent employees
3.53 3.12 +13.1%

2 Annual Results 2017
Capacity, Load Factor and Yield – Cathay Pacific and Cathay Dragon
Capacity
ASK/AFTK (million)* Load factor (%) Yield
2017 2016 Change 2017 2016 Change Change
Passenger services
India, Middle East and Sri Lanka 8,454 9,172 -7.8% 82.8 79.3 +3.5%pt -1.4%
Southwest Pacific and South Africa 20,502 19,702 +4.1% 84.8 87.8 -3.0%pt -3.2%
Southeast Asia 21,054 21,151 -0.5% 84.0 84.2 -0.2%pt -2.9%
Europe 28,957 25,958 +11.6% 87.5 86.6 +0.9%pt -2.7%
North Asia 30,764 30,802 -0.1% 81.0 79.5 +1.5%pt -2.8%
North America 40,407 39,301 +2.8% 85.0 86.8 -1.8%pt -5.0%
Overall 150,138 146,086 +2.8% 84.4 84.5 -0.1%pt -3.3%
Cargo services 17,163 16,572 +3.6% 67.8 64.4 +3.4%pt +11.3%
* Capacity is measured in available seat kilometres (“ASK”) for passenger services and available cargo and mail tonne
kilometres (“AFTK”) for cargo services.
Passenger Services
Home market - Hong Kong and Pearl River Delta
We sold premium class tickets on a promotional basis to non-corporate customers.
Our weekly “fanfares” promotions in Hong Kong demonstrate our commitment to offering good-value fares
in our home market. These promotions now include air and hotel packages.
Demand over the 2017 Chinese New Year holiday was strong, but yield was under pressure.
India, Middle East and Sri Lanka
Our routes to India performed reasonably. The number of passengers carried and yield increased slightly.
We stopped flying to Riyadh in March 2017.
Southwest Pacific and South Africa
The performance of our Southwest Pacific routes was below expectations. Demand on Southwest Pacific
routes was weak. Increased capacity from Mainland China, Hong Kong and Australian carriers put
pressure on yield and the number of transit passengers.
We introduced a seasonal passenger service to Christchurch in December 2017 (until February 2018).
We will introduce a three-times-weekly seasonal service to Cape Town between November 2018 and
February 2019.
From July 2017, our service to Adelaide increased to five flights per week from July in each year to March
the following year.
From October 2017 to March 2018, we replaced our four-times-weekly one-stop service to Brisbane via
Cairns with direct flights to both cities. The Brisbane frequency became 11 flights per week. The Cairns
frequency became three flights per week.
In March 2017, we increased capacity on our daily non-stop flight to Brisbane by using Airbus A350-900
aircraft.
In March 2017, we increased capacity on our route to Melbourne. Two out of the three daily Airbus A330-
300 services started to be operated by larger aircraft, one by Boeing 777-300ER aircraft and one by A350-
900 aircraft. During the 2017/8 winter period, the third of the daily flights to Melbourne was operated by
Airbus A350-900 aircraft instead of Airbus A330-300 aircraft.

Annual Results 2017 3
Southeast Asia
Yield on routes between Hong Kong and Mainland China and Southeast Asia was under pressure due to
increased competition, particularly from low-cost carriers.
The performance of our routes to Thailand was satisfactory.
From July 2017, we increased the frequency of our services to Hanoi (from 10 to 12 flights per week) and
to Ho Chi Minh City (from 18 to 19 flights per week).
Cathay Dragon now operates the four daily flights to Kuala Lumpur which were previously operated by
Cathay Pacific.
Europe
We introduced a passenger service of four flights per week to Tel Aviv in March. The service, which is
operated by Airbus A350-900 aircraft, has been very well received. We put on extra flights to meet
seasonal demand on this route from September to November 2017. Seasonal frequency increases will
continue in 2018, with a daily service operating during peak periods from October 2018.
We introduced a seasonal passenger service to Barcelona (July to October 2017). The service will become
all year round in April 2018.
We will introduce a four-times-weekly service to Brussels in March 2018, a four-times-weekly service to
Dublin in June 2018 and a seasonal service to Copenhagen between May to October 2018.
Demand on European routes grew, but from a low base, reflecting security concerns in the early part of
2016.
Demand for travel to and from Madrid grew.
The load factor on the route to London Gatwick, introduced in 2016, was high, but revenue was adversely
affected by the weakness of sterling.
In June 2017, we increased the frequency of our services to London Gatwick (from four flights per week
to daily) and Manchester (from four to five flights per week). The Manchester service is operated by Airbus
A350-900 aircraft. It became daily from December 2017.
From October 2017, the frequency of our service to Madrid was increased from four to five flights per week.
From December 2017, the frequency of our service to Paris was increased from 10 to 11 flights per week.
It will further increase to 12 flights per week on a seasonal basis in the summer of 2018.
North Asia
Traffic between Mainland China and Taiwan increased in the second half of 2017. This improved the
performance of our Mainland China and Taiwan routes.
Demand for travel to Northeast Asia was strong in the early part of 2017, but political tensions between
Mainland China and South Korea in the second and third quarters affected demand for travel to South
Korea.
In October 2017, we stopped flying between Taipei and Fukuoka and instead introduced a second daily
flight between Taipei and Tokyo Narita.
Cathay Dragon introduced a four-times-weekly service to Nanning in January 2018.
Cathay Dragon will introduce a four-times-weekly service to Jinan in March 2018.
Cathay Dragon’s service to Tokyo Haneda was suspended from October 2017, and reintroduced from
March 2018.
North America
Economy class demand for travel to the United States was weak. Premium class demand recovered.
Increased competition on routes to Canada put pressure on yield, especially during seasonally weak
periods. The impact was more severe on the Vancouver than on the Toronto route.
From March 2017, we increased the frequency of our services to Boston (from four flights per week to
daily) and to Vancouver (from 14 to 17 flights per week).

4 Annual Results 2017
To meet seasonal demand, we increased the frequency of our service to Toronto by four flights per week
from the end of June to the beginning of September 2017 (making this a twice-daily service).
We will introduce a four-times-weekly service to Washington D.C. in September 2018.
From October 2017, we increased the frequency of our service to San Francisco to three times daily (by
adding four flights per week) and reduced the frequency of our service to Los Angeles from four to three
times daily. To meet seasonal demand, we increased the number of flights to Los Angeles between
December 2017 and January 2018.
Cargo Services
Cargo demand was robust throughout 2017. Tonnage carried grew faster than capacity. Yield benefited
from the resumption (from April) of the collection of fuel surcharges in Hong Kong and from strong demand
for Mainland China exports.
In February 2017, Cathay Pacific’s joint business agreement with Lufthansa Cargo AG came into effect
on cargo routes from Hong Kong to Europe. It will come into effect on routes from Europe to Hong Kong
in the third quarter of 2018.
In June 2017, we wet-leased two Atlas Air Worldwide Boeing 747-8F freighter aircraft. This enabled us to
increase the frequencies of our cargo services to the Americas and to India.
Cargo exports from Mainland China were very strong in the second half of 2017, particularly on transpacific
routes.
Demand for shipments of perishable goods to Mainland China increased.
Demand for shipments to and from the Indian sub-continent was strong.
Demand for shipments within Asia was significantly stronger in 2017 than in 2016, particularly of fresh
produce, mail and e-commerce items.
Shipments to and from South America grew strongly, assisted by interline arrangements.
The performance of our European routes improved. Increased shipments of pharmaceutical products
benefited yield.
In March 2017, we increased the frequency of our Delhi cargo service from four to five flights per week.
In June 2017, we increased the frequency of our Chennai cargo service from four to six flights per week.
In September 2017, we increased the frequencies of our cargo services to Hanoi from six to seven flights
per week and to Portland Oregon from two to three flights per week. The Portland Oregon service was
introduced in November 2016.
In April 2017, we started to collect fuel surcharges again in Hong Kong.
In 2017, we retired two Boeing 747-BCF converted freighters.
CPSL’s air cargo terminal handled 2.1 million tonnes of cargo in 2017, an increase of 16.7%. The terminal
handles cargo for Cathay Pacific, Cathay Dragon, Air Hong Kong and 14 other airlines.
In October 2017, with CPSL and HAS, we received certification from the centre for excellence for
independent validators in pharmaceutical logistics.

Annual Results 2017 5
Chairman’s Letter
Overview
Fundamental structural changes within the airline industry continued to create a challenging operating
environment for our airline businesses in 2017. In response, we took decisive action through our
transformation programme to make our businesses leaner and more agile and more effective competitors.
Our focus in 2017 was on building the right foundations, structure and strategy to improve revenue and to
better contain costs. Evidence of progress became apparent in the second half of the year. Airline losses in
the second half of 2017 were lower than those in each of the two preceding half years.
The Cathay Pacific Group reported an attributable loss of HK$1,259 million for 2017. This compares to a loss
of HK$575 million in 2016. The loss per share was HK32.0 cents in 2017 compared to a loss per share of
HK14.6 cents in 2016. The Cathay Pacific Group reported an attributable profit of HK$792 million in the second
half of 2017, compared to an attributable loss of HK$2,051 million in the first half of 2017 and an attributable
loss of HK$928 million in the second half of 2016. Cathay Pacific and Cathay Dragon reported an attributable
loss of HK$1,538 million in the second half of 2017, compared to an attributable loss of HK$2,765 million in
the first half of 2017 and an attributable loss of HK$2,580 million in the second half of 2016.
Operating environment
The factors which affected our performance were largely the same as in 2016. Overcapacity in passenger
markets led to intense competition with other airlines and continued pressure on yields on many of our key
routes. Fuel prices were higher, but fuel hedging losses reduced. As the year progressed we began to see
positive results from our transformation programme and our business also benefited from a strong cargo
business, a weaker US dollar, and improved premium class passenger demand.
The contribution from subsidiary and associated companies was satisfactory.
Several one-off factors impacted results in 2017. In March, the European Commission imposed a fine of Euros
57.12 million (equivalent to approximately HK$498 million) on Cathay Pacific following its decision that a
number of international air cargo carriers, including Cathay Pacific, had agreed to cargo surcharge levels prior
to 2007 and that such agreements infringed European competition law. An application has been made to
annul the decision. In the same month, Air China completed an issue of A shares and, as a result, Cathay
Pacific’s shareholding was diluted. A gain of HK$244 million was recognised on the deemed partial disposal.
In April, Cathay Pacific disposed of its interest in TravelSky Technology Limited at a profit of HK$586 million.
In November, Air Hong Kong agreed to enter into sale and leaseback transactions with DHL International in
respect of eight Airbus A300-600F freighters and associated equipment. Five of these transactions were
completed in 2017. The other three will be completed in 2018. At the end of 2018, Cathay Pacific will acquire
from DHL International the 40% shareholding in Air Hong Kong that it does not already own, with the result
that Air Hong Kong will become a wholly owned subsidiary of the Company. At the same time, a new 15-year
block space agreement with DHL International will commence.
In the first half of 2017, we commenced a three-year corporate transformation programme, which is intended
to address the fundamental competitive challenges we are facing in the current airline industry environment.
The programme has the goal of making our airlines more consumer focused and responsive, and in doing so
increasing our revenue and containing costs. In 2017, we built the right foundations, strategy and structure.
We reorganised our head office, and focused on containing costs and improving efficiencies. We appointed
new management and leadership teams. The associated redundancy costs (of HK$224 million) have been
recognised in 2017 staff expenses.
6 Annual Results 2017
Business performance
Passenger revenue in 2017 was HK$66,408 million, a decrease of 0.8% compared to 2016. Capacity
increased by 2.8%, reflecting the introduction of new routes and increased frequencies on other routes. The
load factor decreased by 0.1 percentage point, to 84.4%. Yield, which was under pressure for most of the year,
fell by 3.3% to HK52.3 cents, albeit improving by 3.1% in the second half of the year compared to the first half.
The Group’s cargo business benefited from robust demand in 2017, with cargo revenue increasing by 19.1%
to HK$23,903 million. The cargo capacity of Cathay Pacific and Cathay Dragon increased by 3.6%. The load
factor increased by 3.4 percentage points, to 67.8%. Tonnage carried increased by 10.9%. Yield rose by
11.3% to HK$1.77, benefiting from the resumption (from April) of the collection of fuel surcharges in Hong
Kong and from strong demand.
Total fuel costs for Cathay Pacific and Cathay Dragon (before the effect of fuel hedging) increased by
HK$5,147 million (or 27.0%) compared with 2016, due to a rise in the price of fuel and increased operations.
Fuel is still the Group’s most significant cost, accounting for 30.7% of our total operating costs in 2017
(compared to 29.6% in 2016). Fuel hedging losses were reduced. After taking hedging losses into account,
fuel costs increased by HK$3,159 million (or 11.3%) compared to 2016. We were able to limit the increase in
our cost per ATK (excluding fuel) to 0.9%, and hold our underlying cost per ATK (excluding fuel and before
exceptional items) flat, despite a challenging cost environment. This reflected our transformation programme’s
focus on productivity, efficiency and holding the growth in staff costs below ATK growth.
We introduced a service to Tel Aviv in March and seasonal services to Barcelona in July and to Christchurch
in December. We increased frequencies to other destinations in response to demand. We stopped flying to
Riyadh in March 2017. We will introduce services to Brussels in March 2018, to Dublin in June 2018 and to
Washington D.C. in September 2018. We will start to fly to Barcelona all year round in April 2018. Seasonal
services will be introduced to Copenhagen between May and October 2018 and to Cape Town between
November 2018 and February 2019. Cathay Dragon introduced a service to Nanning in January 2018 and
will introduce a service to Jinan in March 2018.
We took delivery of 12 Airbus A350-900 aircraft in 2017, bringing the total number of this aircraft type to 22 at
the end of the year. In September, we ordered 32 Airbus A321-200neo aircraft for Cathay Dragon, to be
delivered from 2020, and retired our final four Airbus A340-300 aircraft and two Boeing 747-400 BCF freighter
aircraft. We wet-leased two Boeing 747-8F freighter aircraft in order to allow us to increase cargo capacity.
Congestion at Hong Kong International Airport and air traffic control constraints in the Greater China region
continued to impose costs on the Group. We are doing more to improve the reliability of our operations.
Prospects
Our priorities for 2018 are our transformation programme, changing the way that we work so as to better
contain costs which will strengthen our passenger business further. We are confident of a successful outcome
from these efforts. We also look to benefit from a slowing of the decline in passenger yields as global economic
conditions improve. The outlook for our cargo business is positive and we will take best advantage of
opportunities in the growing global cargo market. Increased fuel costs are increasing operating costs and
adversely affecting results. Fuel hedging losses are declining.

Annual Results 2017 7
We are improving our competitive position by expanding our route network, increasing frequencies on our
most popular routes and buying more fuel-efficient aircraft. We have improved productivity and efficiency and
at the same time we are improving our already high customer service standards. We are proud of the quality,
dedication and professionalism of our people. They have my utmost respect and I would like to thank them
for their hard work and commitment during a period of uncertainty. Difficult but necessary decisions have been
made. We are acting decisively to make Cathay Pacific and Cathay Dragon better airlines and stronger
businesses. We believe we are on track to achieve strong and sustainable long-term performance.
Our commitment to Hong Kong and its people remains unwavering, as has been the case over more than 70
years. We will continue to make strategic investments to develop and strengthen Hong Kong’s position as
Asia’s largest and most popular international aviation hub.
John Slosar
Chairman
Hong Kong, 14th March 2018

8 Annual Results 2017
Consolidated Statement of Profit or Loss and Other Comprehensive Income
for the year ended 31st December 2017
2017 2016
Note HK$M HK$M
Revenue
Passenger services 66,408 66,926
Cargo services 23,903 20,063
Catering, recoveries and other services 6,973 5,762
Total revenue 97,284 92,751
Expenses
Staff (19,962) (19,770)
Inflight service and passenger expenses (4,996) (4,734)
Landing, parking and route expenses (15,225) (14,985)
Fuel, including hedging losses (31,112) (27,953)
Aircraft maintenance (9,607) (8,856)
Aircraft depreciation and operating leases (11,845) (10,551)
Other depreciation, amortisation and operating leases (2,795) (2,457)
Commissions (681) (700)
Others (3,340) (3,270)
Operating expenses (99,563) (93,276)
Operating loss before non-recurring items (2,279) (525)
Gain on disposal of a long-term investment 586 -
Gain on deemed partial disposal of an associate 3 244 -
Operating loss 4 (1,449) (525)
Finance charges (2,223) (1,561)
Finance income 462 260
Net finance charges 5 (1,761) (1,301)
Share of profits of associates 2,630 2,049
(Loss)/profit before taxation (580) 223
Taxation 6 (308) (497)
Loss for the year (888) (274)
Non-controlling interests (371) (301)
Loss attributable to the shareholders of Cathay Pacific (1,259) (575)
Loss for the year (888) (274)
Other comprehensive income
Items that will not be reclassified to profit or loss:
Defined benefit plans 702 606
Items that may be reclassified subsequently to profit or loss:
Cash flow hedges 4,352 9,690
Revaluation of available-for-sale financial assets (403) 178
Share of other comprehensive income of associates 470 334
Exchange differences on translation of foreign operations 1,874 (1,536)
Other comprehensive income for the year, net of taxation 7 6,995 9,272
Total comprehensive income for the year 6,107 8,998
Total comprehensive income attributable to
Shareholders of Cathay Pacific 5,736 8,697
Non-controlling interests 371 301
6,107 8,998
Loss per share (basic and diluted) 8 (32.0)¢ (14.6)¢

Annual Results 2017 9
Consolidated Statement of Financial Position
at 31st December 2017
2017 2016
Note HK$M HK$M
ASSETS AND LIABILITIES
Non-current assets and liabilities
Property, plant and equipment 111,182 106,456
Intangible assets 11,221 10,934
Investments in associates 28,144 23,298
Other long-term receivables and investments 4,068 4,604
Deferred tax assets 928 737
155,543 146,029
Long-term liabilities (69,506) (58,906)
Other long-term payables (3,502) (7,517)
Deferred tax liabilities (12,820) (11,380)
(85,828) (77,803)
Net non-current assets 69,715 68,226
Current assets and liabilities
Stock 1,515 1,514
Trade, other receivables and other assets 10 11,361 9,557
Assets held for sale 11 865 31
Liquid funds 19,094 20,290
32,835 31,392
Current portion of long-term liabilities (8,888) (11,263)
Trade and other payables 12 (17,057) (19,104)
Unearned transportation revenue (13,961) (12,926)
Taxation (1,372) (707)
Dividend payable to non-controlling interests - (92)
(41,278) (44,092)
Net current liabilities (8,443) (12,700)
Total assets less current liabilities 147,100 133,329
Net assets 61,272 55,526
CAPITAL AND RESERVES
Share capital 13 17,106 17,106
Other reserves 43,995 38,259
Funds attributable to the shareholders of Cathay Pacific 61,101 55,365
Non-controlling interests 171 161
Total equity 61,272 55,526
10 Annual Results 2017
Notes:
1. Basis of accounting
The annual results set out in this announcement are extracted from the Group’s statutory financial
statements for the year ended 31st December 2017.
The financial statements have been prepared in accordance with all applicable Hong Kong Financial
Reporting Standards (“HKFRS”) (which include all applicable Hong Kong Accounting Standards (“HKAS”),
Hong Kong Financial Reporting Standards and Interpretations) issued by the Hong Kong Institute of
Certified Public Accountants (“HKICPA”), accounting principles generally accepted in Hong Kong and the
requirements of the Hong Kong Companies Ordinance. These financial statements also comply with the
applicable disclosure provisions of the Rules Governing the Listing of Securities (the “Listing Rules”) on
The Stock Exchange of Hong Kong Limited (the “Stock Exchange”).
The financial information relating to the years ended 31st December 2016 and 2017 that is included in
this document does not constitute the Company’s statutory annual consolidated financial statements for
those years but is derived from those financial statements.
The non-statutory accounts (within the meaning of section 436 of the Companies Ordinance (Cap. 622)
(the “Ordinance”)) in this document are not specified financial statements (within such meaning). The
specified financial statements for the year ended 31st December 2016 have been delivered to the
Registrar of Companies in Hong Kong in accordance with section 664 of the Ordinance. The specified
financial statements for the year ended 31st December 2017 have not been but will be delivered to the
Registrar of Companies in Hong Kong in accordance with section 664 of the Ordinance. Auditor’s reports
have been prepared on the specified financial statements for the years ended 31st December 2016 and
2017. Those reports were not qualified or otherwise modified, did not refer to any matters to which the
auditor drew attention by way of emphasis without qualifying the reports and did not contain statements
under section 406(2) or 407(2) or (3) of the Ordinance.
The HKICPA has issued a number of amendments to HKFRSs that are first effective for the current
accounting period of the Group and the Company. The adoption of the amendments has had no significant
impact on the results and financial position of the Group.
The Group has not applied any new amendment that is not yet effective for the current accounting period.
Annual Results 2017 11
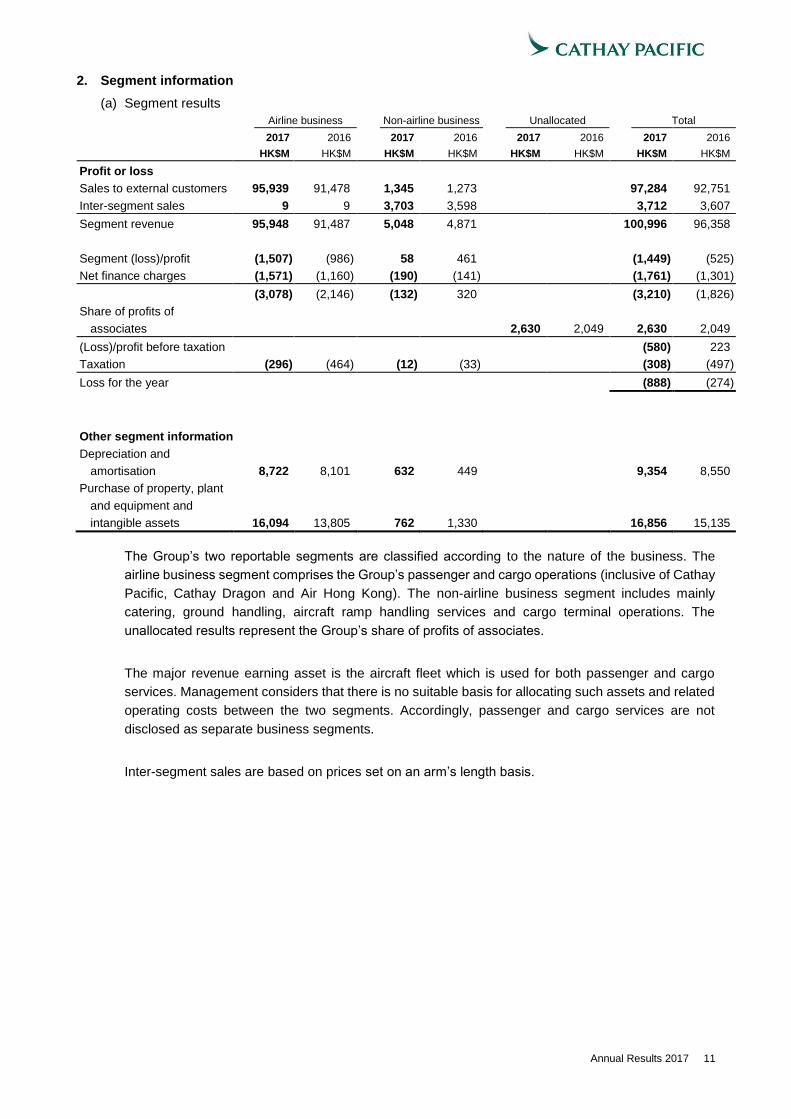
2. Segment information
(a) Segment results
Airline business Non-airline business Unallocated Total
2017 2016 2017 2016 2017 2016 2017 2016
HK$M HK$M HK$M HK$M HK$M HK$M HK$M HK$M
Profit or loss
Sales to external customers 95,939 91,478 1,345 1,273 97,284 92,751
Inter-segment sales 9 9 3,703 3,598 3,712 3,607
Segment revenue 95,948 91,487 5,048 4,871 100,996 96,358
Segment (loss)/profit (1,507) (986) 58 461 (1,449) (525)
Net finance charges (1,571) (1,160) (190) (141) (1,761) (1,301)
(3,078) (2,146) (132) 320 (3,210) (1,826)
Share of profits of
associates
2,630
2,049
2,630
2,049
(Loss)/profit before taxation (580) 223
Taxation (296) (464) (12) (33) (308) (497)
Loss for the year (888) (274)
Other segment information
Depreciation and
amortisation
8,722
8,101
632
449
9,354
8,550
Purchase of property, plant
and equipment and
intangible assets
16,094
13,805
762
1,330
16,856
15,135
The Group’s two reportable segments are classified according to the nature of the business. The
airline business segment comprises the Group’s passenger and cargo operations (inclusive of Cathay
Pacific, Cathay Dragon and Air Hong Kong). The non-airline business segment includes mainly
catering, ground handling, aircraft ramp handling services and cargo terminal operations. The
unallocated results represent the Group’s share of profits of associates.
The major revenue earning asset is the aircraft fleet which is used for both passenger and cargo
services. Management considers that there is no suitable basis for allocating such assets and related
operating costs between the two segments. Accordingly, passenger and cargo services are not
disclosed as separate business segments.
Inter-segment sales are based on prices set on an arm’s length basis.
12 Annual Results 2017
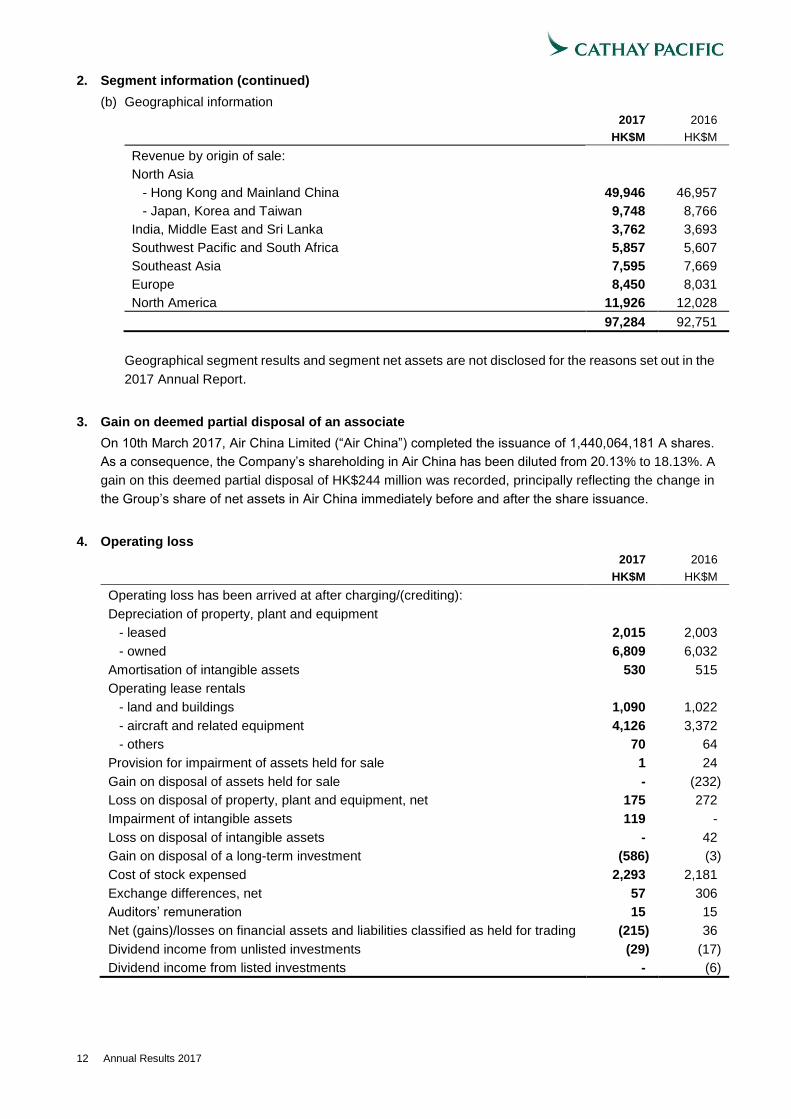
2. Segment information (continued)
(b) Geographical information
2017
HK$M
2016
HK$M
Revenue by origin of sale:
North Asia
- Hong Kong and Mainland China 49,946 46,957
- Japan, Korea and Taiwan 9,748 8,766
India, Middle East and Sri Lanka 3,762 3,693
Southwest Pacific and South Africa 5,857 5,607
Southeast Asia 7,595 7,669
Europe 8,450 8,031
North America 11,926 12,028
97,284 92,751
Geographical segment results and segment net assets are not disclosed for the reasons set out in the
2017 Annual Report.
3. Gain on deemed partial disposal of an associate
On 10th March 2017, Air China Limited (“Air China”) completed the issuance of 1,440,064,181 A shares.
As a consequence, the Company’s shareholding in Air China has been diluted from 20.13% to 18.13%. A
gain on this deemed partial disposal of HK$244 million was recorded, principally reflecting the change in
the Group’s share of net assets in Air China immediately before and after the share issuance.
4. Operating loss
2017 2016
HK$M HK$M
Operating loss has been arrived at after charging/(crediting):
Depreciation of property, plant and equipment
- leased 2,015 2,003
- owned 6,809 6,032
Amortisation of intangible assets 530 515
Operating lease rentals
- land and buildings 1,090 1,022
- aircraft and related equipment 4,126 3,372
- others 70 64
Provision for impairment of assets held for sale 1 24
Gain on disposal of assets held for sale - (232)
Loss on disposal of property, plant and equipment, net 175 272
Impairment of intangible assets 119 -
Loss on disposal of intangible assets - 42
Gain on disposal of a long-term investment (586) (3)
Cost of stock expensed 2,293 2,181
Exchange differences, net 57 306
Auditors’ remuneration 15 15
Net (gains)/losses on financial assets and liabilities classified as held for trading (215) 36
Dividend income from unlisted investments (29) (17)
Dividend income from listed investments - (6)

Annual Results 2017 13
5. Net finance charges
2017 2016
HK$M HK$M
Net interest charges comprise:
- obligations under finance leases stated at amortised cost 539 475
- interest income on related security deposits, notes and zero coupon bonds - (2)
539 473
- bank loans and overdrafts
- wholly repayable within five years 372 235
- not wholly repayable within five years 697 439
- other loans
- wholly repayable within five years 133 101
- not wholly repayable within five years - 16
- other long-term receivables (5) (19)
1,736 1,245
Income from liquid funds:
- funds with investment managers and other liquid investments at fair value
through profit or loss
(79)
(83)
- bank deposits and others (180) (155)
(259) (238)
Fair value change:
- loss/(gain) on obligations under finance leases designated as at fair value
through profit or loss
216
(18)
- loss on financial derivatives 68 312
284 294
1,761 1,301
Finance income and charges relating to defeasance arrangements have been netted off in the above
figures.
Included in the fair value change in respect of financial derivatives is net gain from derivatives that are
classified as held for trading of HK$200 million (2016: net losses of HK$36 million).
6. Taxation
2017
HK$M
2016
HK$M
Current tax expenses
- Hong Kong profits tax 419 165
- overseas tax 201 195
- under-provisions for prior years 114 272
Deferred tax credit
- origination and reversal of temporary differences (426) (135)
308 497
Hong Kong profits tax is calculated at 16.5% (2016: 16.5%) on the estimated assessable profits for the
year. Overseas tax is calculated at rates of tax applicable in countries in which the Group is assessable
for tax. Tax provisions are reviewed regularly to take into account changes in legislation, practice and the
status of negotiations (see note 28(d) to the financial statements in the 2017 Annual Report).
14 Annual Results 2017
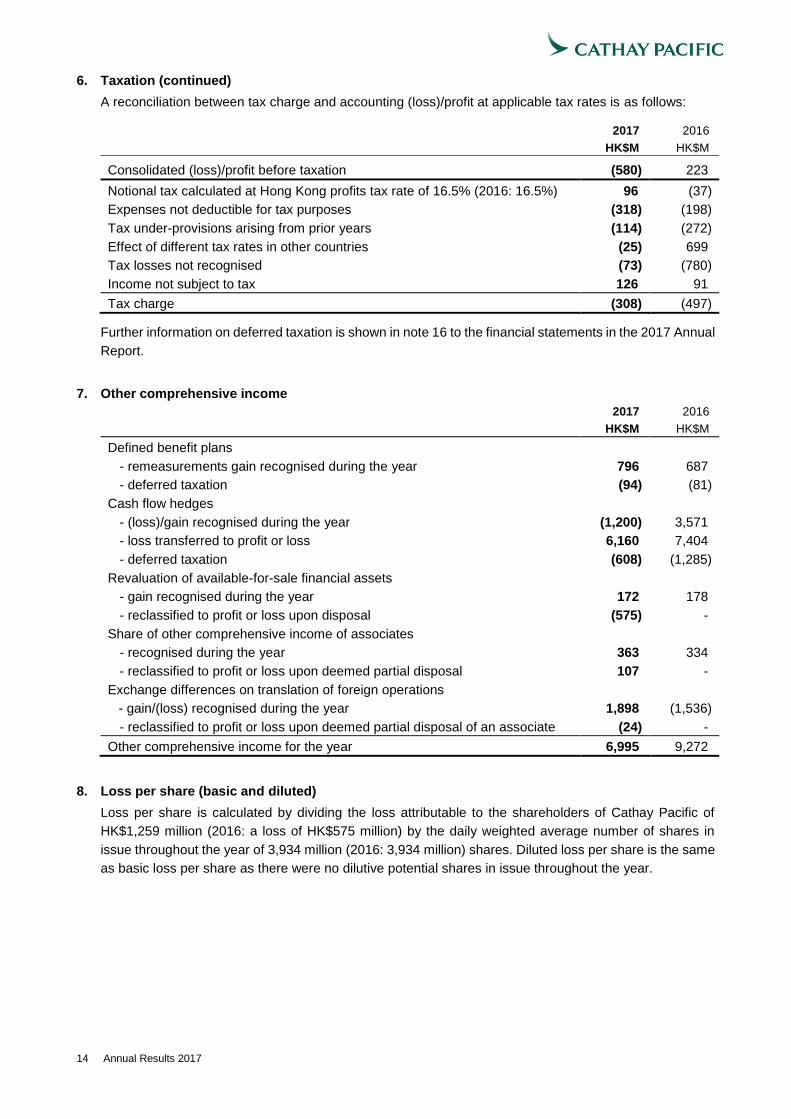
6. Taxation (continued)
A reconciliation between tax charge and accounting (loss)/profit at applicable tax rates is as follows:
2017
HK$M
2016
HK$M
Consolidated (loss)/profit before taxation (580) 223
Notional tax calculated at Hong Kong profits tax rate of 16.5% (2016: 16.5%) 96 (37)
Expenses not deductible for tax purposes (318) (198)
Tax under-provisions arising from prior years (114) (272)
Effect of different tax rates in other countries (25) 699
Tax losses not recognised (73) (780)
Income not subject to tax 126 91
Tax charge (308) (497)
Further information on deferred taxation is shown in note 16 to the financial statements in the 2017 Annual
Report.
7. Other comprehensive income
2017
HK$M
2016
HK$M
Defined benefit plans
- remeasurements gain recognised during the year 796 687
- deferred taxation (94) (81)
Cash flow hedges
- (loss)/gain recognised during the year (1,200) 3,571
- loss transferred to profit or loss 6,160 7,404
- deferred taxation (608) (1,285)
Revaluation of available-for-sale financial assets
- gain recognised during the year 172 178
- reclassified to profit or loss upon disposal (575) -
Share of other comprehensive income of associates
- recognised during the year 363 334
- reclassified to profit or loss upon deemed partial disposal 107 -
Exchange differences on translation of foreign operations
- gain/(loss) recognised during the year 1,898 (1,536)
- reclassified to profit or loss upon deemed partial disposal of an associate (24) -
Other comprehensive income for the year 6,995 9,272
8. Loss per share (basic and diluted)
Loss per share is calculated by dividing the loss attributable to the shareholders of Cathay Pacific of
HK$1,259 million (2016: a loss of HK$575 million) by the daily weighted average number of shares in
issue throughout the year of 3,934 million (2016: 3,934 million) shares. Diluted loss per share is the same
as basic loss per share as there were no dilutive potential shares in issue throughout the year.

Annual Results 2017 15
9. Dividends
2017
HK$M
2016
HK$M
No interim dividend paid for the period ended 30th June 2017
(2016: first interim dividend of HK$0.05 per share)
-
197
Interim dividend proposed on 14th March 2018 of HK$0.05 per share
(2016: nil)
197
-
197 197
The Directors have declared an interim dividend of HK$0.05 per share for the year ended 31st December
2017. The interim dividend will be in lieu of a final dividend. This represents a total distribution for the year
of HK$197 million. The interim dividend will be paid on 3rd May 2018 to shareholders registered at the
close of business on the record date, being Friday, 6th April 2018. Shares of the Company will be traded
ex-dividend as from Tuesday, 3rd April 2018.
The register of members will be closed on Friday, 6th April 2018, during which day no transfer of shares
will be effected. In order to qualify for entitlement to the interim dividend, all transfer forms accompanied
by the relevant share certificates must be lodged with the Company’s share registrars, Computershare
Hong Kong Investor Services Limited, 17th Floor, Hopewell Centre, 183 Queen’s Road East, Hong Kong,
for registration not later than 4:30 p.m. on Wednesday, 4th April 2018.
To facilitate the processing of proxy voting for the annual general meeting to be held on 9th May 2018, the
register of members will be closed from 4th May 2018 to 9th May 2018, both days inclusive, during which
period no transfer of shares will be effected. In order to be entitled to attend and vote at the annual general
meeting, all transfer forms accompanied by the relevant share certificates must be lodged with the
Company’s share registrars, Computershare Hong Kong Investor Services Limited, 17th Floor, Hopewell
Centre, 183 Queen’s Road East, Hong Kong, for registration not later than 4:30 p.m. on Thursday, 3rd
May 2018.
10. Trade, other receivables and other assets
2017 2016
HK$M HK$M
Trade debtors 6,131 5,595
Derivative financial assets – current portion 32 857
Other receivables and prepayments 5,139 3,042
Due from associates and other related companies 59 63
11,361 9,557
2017 2016
HK$M HK$M
Analysis of trade debtors (net of allowance for doubtful debts) by
invoice date:
Within one month 4,880 4,370
One to three months 573 705
More than three months 678 520
6,131 5,595
2017
HK$M
2016
HK$M
Analysis of trade debtors (net of allowance for doubtful debts) by age:
Current 5,643 5,074
Within three months overdue 303 395
More than three months overdue 185 126
6,131 5,595
16 Annual Results 2017
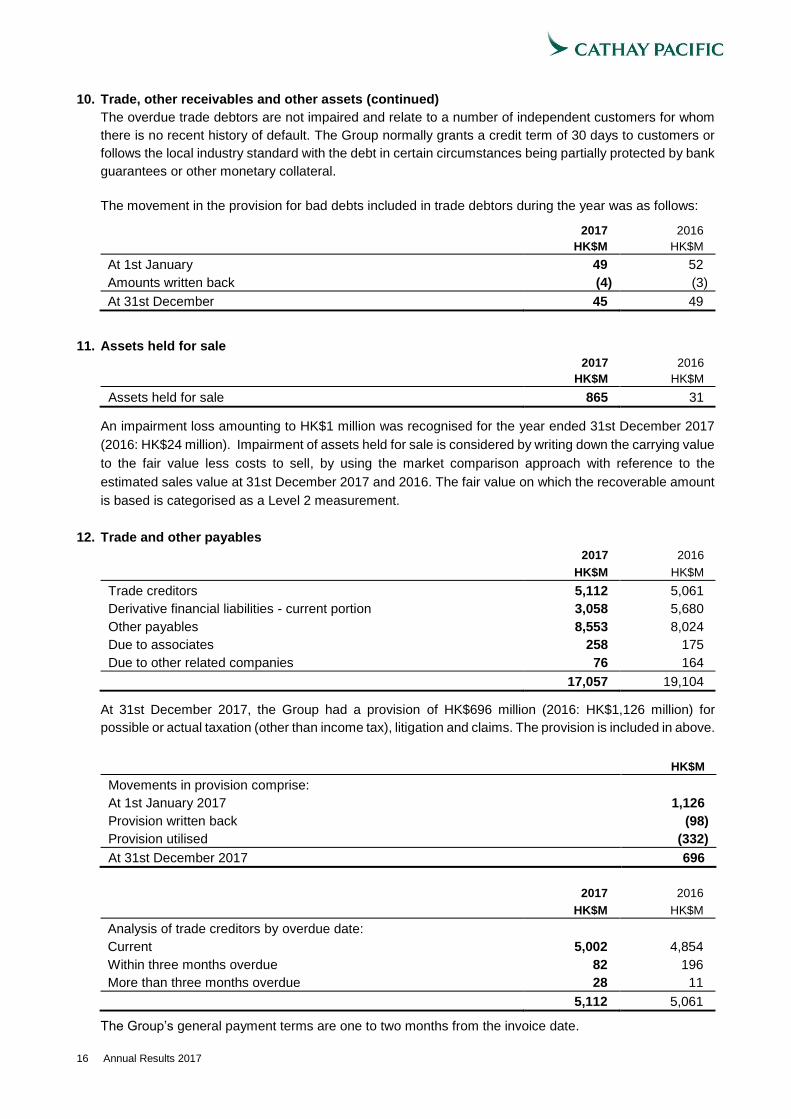
10. Trade, other receivables and other assets (continued)
The overdue trade debtors are not impaired and relate to a number of independent customers for whom
there is no recent history of default. The Group normally grants a credit term of 30 days to customers or
follows the local industry standard with the debt in certain circumstances being partially protected by bank
guarantees or other monetary collateral.
The movement in the provision for bad debts included in trade debtors during the year was as follows:
2017
HK$M
2016
HK$M
At 1st January 49 52
Amounts written back (4) (3)
At 31st December 45 49
11. Assets held for sale
2017 2016
HK$M HK$M
Assets held for sale 865 31
An impairment loss amounting to HK$1 million was recognised for the year ended 31st December 2017
(2016: HK$24 million). Impairment of assets held for sale is considered by writing down the carrying value
to the fair value less costs to sell, by using the market comparison approach with reference to the
estimated sales value at 31st December 2017 and 2016. The fair value on which the recoverable amount
is based is categorised as a Level 2 measurement.
12. Trade and other payables
2017 2016
HK$M HK$M
Trade creditors 5,112 5,061
Derivative financial liabilities - current portion 3,058 5,680
Other payables 8,553 8,024
Due to associates 258 175
Due to other related companies 76 164
17,057 19,104
At 31st December 2017, the Group had a provision of HK$696 million (2016: HK$1,126 million) for
possible or actual taxation (other than income tax), litigation and claims. The provision is included in above.
HK$M
Movements in provision comprise:
At 1st January 2017 1,126
Provision written back (98)
Provision utilised (332)
At 31st December 2017 696
2017
HK$M
2016
HK$M
Analysis of trade creditors by overdue date:
Current 5,002 4,854
Within three months overdue 82 196
More than three months overdue 28 11
5,112 5,061
The Group’s general payment terms are one to two months from the invoice date.

Annual Results 2017 17
13. Share capital
There was no purchase, sale or redemption by the Company, or any of its subsidiaries, of the Company’s
shares during the year and the Group has not adopted any share option scheme.
At 31st December 2017, 3,933,844,572 shares were in issue (31st December 2016: 3,933,844,572
shares). There has been no movement in share capital during the year.
14. Corporate governance
The Company is committed to maintaining a high standard of corporate governance. The Company
complied with all the code provisions set out in the Corporate Governance Code (the “CG Code”) contained
in Appendix 14 to the Rules Governing the Listing of Securities on The Stock Exchange of Hong Kong
Limited (the “Listing Rules”) throughout the year covered by the annual report with the following exceptions
which it believes do not benefit shareholders:
Sections A.5.1 to A.5.4 of the CG Code in respect of the establishment, terms of reference and resources
of a nomination committee. The Board has considered the merits of establishing a nomination committee
but has concluded that it is in the best interests of the Company and potential new appointees that the
Board collectively reviews and approves the appointment of any new Director as this allows a more
informed and balanced decision to be made by the Board as to suitability for the role.
The Company has adopted codes of conduct regarding securities transactions by Directors and by relevant
employees (as defined in the CG Code) on terms no less exacting than the required standard set out in the
Model Code for Securities Transactions by Directors of Listed Issuers (the “Model Code”) contained in
Appendix 10 to the Listing Rules.
On specific enquiries made, all Directors of the Company have confirmed that, in respect of the accounting
period covered by the annual report, they have complied with the required standard set out in the Model
Code and the Company’s code of conduct regarding Directors’ securities transactions.
Details of the Company’s corporate governance principles and processes will be available in the 2017
Annual Report.
The annual results have been reviewed by the Audit Committee of the Company.
15. Annual report
The 2017 Annual Report containing all the information required by the Listing Rules of the Stock Exchange
will be published on the Stock Exchange’s website and the Company’s website www.cathaypacific.com by
3rd April 2018. It will be available to shareholders by 3rd April 2018.

18 Annual Results 2017
Operating expenses Group Cathay Pacific and Cathay Dragon
2017 2016 2017 2016
HK$M HK$M Change HK$M HK$M Change
Staff 19,962 19,770 +1.0% 17,708 17,607 +0.6%
Inflight service and passenger expenses 4,996 4,734 +5.5% 4,996 4,734 +5.5%
Landing, parking and route expenses 15,225 14,985 +1.6% 14,830 14,704 +0.9%
Fuel, including hedging losses 31,112 27,953 +11.3% 30,619 27,551 +11.1%
Aircraft maintenance 9,607 8,856 +8.5% 9,221 8,453 +9.1%
Aircraft depreciation and operating leases 11,845 10,551 +12.3% 11,596 10,406 +11.4%
Other depreciation, amortisation and
operating leases
2,795
2,457
+13.8%
1,986
1,841
+7.9%
Commissions 681 700 -2.7% 681 700 -2.7%
Others 3,340 3,270 +2.1% 4,877 4,941 -1.3%
Operating expenses 99,563 93,276 +6.7% 96,514 90,937 +6.1%
Net finance charges 1,761 1,301 +35.4% 1,527 1,125 +35.7%
Total operating expenses 101,324 94,577 +7.1% 98,041 92,062 +6.5%
The cost per ATK (with fuel) of Cathay Pacific and Cathay Dragon increased from HK$3.02 to HK$3.12.
The combined cost per ATK (without fuel) of Cathay Pacific and Cathay Dragon increased from HK$2.12 to
HK$2.14.
The underlying cost per ATK (without fuel and before exceptional items) of Cathay Pacific and Cathay
Dragon remained stable at HK$2.12. Exceptional items affecting expenses in 2017 include the European
Commission airfreight fine of HK$498 million, redundancy costs of HK$224 million, and an impairment of
CO2 emissions credits of HK$119 million.
Cathay Pacific and Cathay Dragon operating results analysis 1st half
of 2017
2nd half
of 2017
Full year
of 2017
1st half
of 2016
2nd half
of 2016
Full year
of 2016
HK$M HK$M HK$M HK$M HK$M HK$M
Airlines’ loss before exceptional items (3,033) (1,156) (4,189) (618) (2,427) (3,045)
Exceptional items 108 (119) (11) - - -
Taxation 160 (263) (103) (165) (153) (318)
Airlines’ loss after taxation (2,765) (1,538) (4,303) (783) (2,580) (3,363)
Share of profits from subsidiaries and associates 714 2,330 3,044 1,136 1,652 2,788
(Loss)/profit attributable to the shareholders of
Cathay Pacific
(2,051)
792
(1,259)
353
(928)
(575)
Exceptional items include the European Commission airfreight fine, redundancy costs and an impairment of CO2
emissions credits, partly offset by gains on disposal of TravelSky Technology Limited and on the deemed partial
disposal of Air China shares.

Annual Results 2017 19
Cathay Pacific and Cathay Dragon operating results analysis (continued)
The changes in the airlines’ loss (including exceptional items) before tax can be analysed as follows:
HK$M
2016 airlines’ loss (including exceptional items)
before tax
(3,045)
Increase of revenue 3,994 - Passenger revenue decreased by 0.8% due to a
3.3% decrease in yield, partially offset by a 1.4%
increase in passengers carried.
- Cargo revenue increased by 20.7% due to a 11.3%
increase in yield, a 3.4% points increase in load
factor and a 10.9% increase in cargo and mail
tonnage carried.
(Increase)/decrease of costs:
- Fuel, including hedging losses (3,068) - Fuel costs increased due to a 23.0% increase in the
average into-plane fuel price and a 2.9% increase in
consumption. This was partially offset by a 24.6%
decrease in fuel hedging losses.
- Aircraft maintenance (768) - Increased mainly due to increases in operational
capacity and a provision for leased aircraft return
costs.
- Depreciation, amortisation and operating
leases
(1,335) - Increased mainly due to the acquisition of new
aircraft.
- Staff (101) - Increased mainly due to increase in pilot and cabin
crew staff costs, one-off redundancy costs partially
offset by a reduction in other staff costs due to head
office restructuring.
- Non-recurring items and all other operating
expenses, including inflight service, landing
and parking, commissions, net finance
charges and others
123 - Decreased mainly due to gain on disposal of
TravelSky Technology Limited, the gain on the
deemed partial disposal of Air China shares, savings
in other expenses, partly offset by the European
Commission airfreight fine and higher net finance
charges due to financing of new aircraft.
2017 airlines’ loss (including exceptional
items) before tax
(4,200)

20 Annual Results 2017
Fuel expenditure and hedging
A breakdown of the Group’s fuel cost is shown below:
2017 2016
HK$M HK$M
Gross fuel cost 24,735 19,497
Fuel hedging losses 6,377 8,456
Fuel cost 31,112 27,953
Fuel consumption in 2017 was 45.1 million barrels (2016: 43.9 million barrels), an increase of 2.7% against
an increase in capacity of 3.2%.
The Group’s fuel hedging exposure at 31st December
2017 is set out in the chart opposite.
The Group’s policy is to reduce exposure to fuel price
risk by hedging a percentage of its expected fuel
consumption. The Group uses fuel derivatives which
are economically equivalent to forward contracts to
achieve its desired hedging position. The chart opposite
indicates the estimated percentage of projected
consumption by year covered by hedging transactions
at various Brent strike prices.
The Group does not speculate on oil prices but uses
hedging to manage the risk of increases in oil prices and
therefore its fuel costs. Hedging is not risk free and the
strategy is to not be 100% hedged. The hedging position
in respect of 2018 and a portion of 2019 reflects certain
assumptions made at the time of hedging, which were invalidated by the steep fall in oil prices in 2015,
and produced the fuel hedging losses that have been recorded and disclosed. The Group benefits from
lower oil prices on the unhedged share of the fuel requirements but the size of this benefit is not as large
as the benefit to airlines which either do not hedge or hedged less than the Group.
Assets
Total assets at 31st December 2017 were HK$188,378 million.
During the year, additions to property, plant and equipment were HK$15,920 million, comprising
HK$14,910 million in respect of aircraft and related equipment, HK$573 million in respect of buildings and
HK$437 million in respect of other equipment.
Borrowings and capital
Borrowings increased by 11.7% to HK$78,394 million at the end of 2017 from HK$70,169 million at the
end of 2016.
Borrowings are mainly denominated in United States dollars, Hong Kong dollars, Japanese yen and Euros,
and are fully repayable by 2029, with 46.6% currently at fixed rates of interest after taking into account
derivative transactions.
Liquid funds, 70.2% of which are denominated in United States dollars, decreased by 5.9% to HK$19,094
million.
Net borrowings (after taking liquid funds into account) increased by 18.9% to HK$59,300 million.
Funds attributable to the shareholders of Cathay Pacific increased by 10.4% to HK$61,101 million. This
was due to the positive contribution for the year, mainly from operations (pre loss transfer from the cash
flow hedge reserve), subsidiaries and associates. Exchange gains on translation of foreign operations
were partly offset by cash flow hedges loss recognised during the year.
The net debt/equity ratio increased from 0.90 times to 0.97 times.
Fuel hedging exposure
Percentage of consumption
subject to hedging contracts
0%
5%
10%
15%
20%
25%
30%
35%
40%
45%
50%
$50 $60 $70 $80 $90 $100 $110 $120 $130 $140
2018 2019
Brent (US$/barrel)
Annual Results 2017 21
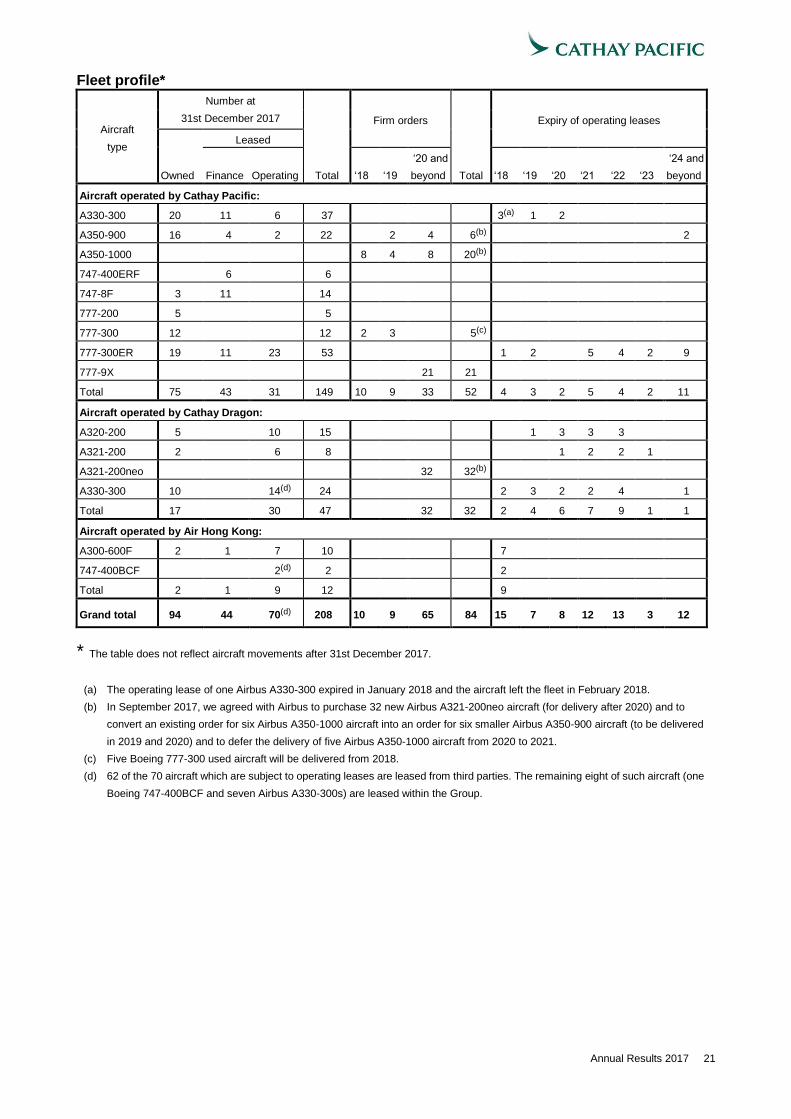
Fleet profile*
Aircraft
type
Number at
31st December 2017
Firm orders
Expiry of operating leases
Leased
Owned
Finance
Operating
Total
‘18
‘19
‘20 and
beyond
Total
‘18
‘19
‘20
‘21
‘22
‘23
‘24 and
beyond
Aircraft operated by Cathay Pacific:
A330-300 20 11 6 37 3(a) 1 2
A350-900 16 4 2 22 2 4 6(b) 2
A350-1000 8 4 8 20(b)
747-400ERF 6 6
747-8F 3 11 14
777-200 5 5
777-300 12 12 2 3 5(c)
777-300ER 19 11 23 53 1 2 5 4 2 9
777-9X 21 21
Total 75 43 31 149 10 9 33 52 4 3 2 5 4 2 11
Aircraft operated by Cathay Dragon:
A320-200 5 10 15 1 3 3 3
A321-200 2 6 8 1 2 2 1
A321-200neo 32 32(b)
A330-300 10 14(d) 24 2 3 2 2 4 1
Total 17 30 47 32 32 2 4 6 7 9 1 1
Aircraft operated by Air Hong Kong:
A300-600F 2 1 7 10 7
747-400BCF 2(d) 2 2
Total 2 1 9 12 9
Grand total 94 44 70(d) 208 10 9 65 84 15 7 8 12 13 3 12
* The table does not reflect aircraft movements after 31st December 2017.
(a) The operating lease of one Airbus A330-300 expired in January 2018 and the aircraft left the fleet in February 2018.
(b) In September 2017, we agreed with Airbus to purchase 32 new Airbus A321-200neo aircraft (for delivery after 2020) and to
convert an existing order for six Airbus A350-1000 aircraft into an order for six smaller Airbus A350-900 aircraft (to be delivered
in 2019 and 2020) and to defer the delivery of five Airbus A350-1000 aircraft from 2020 to 2021.
(c) Five Boeing 777-300 used aircraft will be delivered from 2018.
(d) 62 of the 70 aircraft which are subject to operating leases are leased from third parties. The remaining eight of such aircraft (one
Boeing 747-400BCF and seven Airbus A330-300s) are leased within the Group.

22 Annual Results 2017
Review of subsidiaries and associates
AHK Air Hong Kong Limited recorded an increase in profit for 2017 compared with 2016. Compared with
2016, capacity decreased by 2.0% to 762 million available tonne kilometres. The load factor increased by
1.6 percentage points to 66.9%. Revenue tonne kilometres increased by 0.4% to 510 million. In November,
Air Hong Kong agreed to enter into sale and leaseback transactions with DHL International in respect of
eight Airbus A300-600F freighters and associated equipment. Five of these transactions were completed
in 2017. Three of them will be completed in 2018. Cathay Pacific entered into an agreement with DHL
International for Cathay Pacific to acquire from DHL International at the end of 2018 the 40% shareholding
in Air Hong Kong that it does not already own, with the result that Air Hong Kong will become a wholly
owned subsidiary of Cathay Pacific. Air Hong Kong will continue to operate an agreed freighter network
to destinations in Asia for DHL International under a new block space agreement between Air Hong Kong
and DHL International for an initial term of 15 years commencing on 1st January 2019.
Asia Miles Limited achieved an increase in profit compared with 2016, due to an increase in business
volume. There was a 10% increase in redemptions by Asia Miles members on Cathay Pacific and Cathay
Dragon flights in 2017.
Cathay Pacific Catering Services (H.K.) Limited (“CPCS”) produced 30.3 million meals and handled
74,000 flights in 2017 (representing a daily average of 83,000 meals and 203 flights, an increase of 0.3%
and 1.5% respectively over 2016). Increased business volume resulted in higher revenue, but higher staff
costs and the additional depreciation associated with the expanded facility resulted in a decline in profit
after tax for CPCS in 2017. Outside Hong Kong, profits increased compare to the previous year.
Cathay Pacific Services Limited (“CPSL”) provided cargo handling services to 17 airlines in 2017. Three
additional airlines became customers in 2017. It handled 2.1 million tonnes of cargo in 2017, 47.8% of
which were transshipments. Export and import shipments accounted for 34.4% and 17.8% respectively of
the total. The financial results in 2017 improved compared with 2016. This was due to an increase in the
number of customers and effective management of operating costs.
The operational performance and financial results of Hong Kong Airport Services Limited improved in
2017.
Air China Limited (“Air China”), in which Cathay Pacific had a 18.13% interest at 31st December 2017, is
the national flag carrier and leading provider of passenger, cargo and other airline-related services in
Mainland China. In March 2017, Cathay Pacific’s shareholding in Air China was reduced from 20.13% as
a result of a new issue of A shares by Air China. The Group’s share of Air China’s results is based on its
financial statements drawn up three months in arrear. Consequently the 2017 results include Air China’s
results for the 12 months ended 30th September 2017, adjusted for any significant events or transactions
for the period from 1st October 2017 to 31st December 2017. For the 12 months ended 30th September
2017, Air China’s underlying results improved compared to the 12 months ended 30th September 2016.
Air China Cargo Co., Ltd. (“Air China Cargo”), in which Cathay Pacific owns an equity and an economic
interest, is the leading provider of air cargo services in Mainland China. Air China Cargo’s 2017 financial
results were significant better than in 2016. Higher operating costs (reflecting increased fuel prices) were
more than offset by significantly improved cargo yields and unrealised exchange gains on loans
denominated in United States dollars.
Corporate Responsibility
Our sustainable development report for 2017 will be published in July 2018. It is available at
www.cathaypacific.com/sdreport.
Cathay Pacific participates in an International Civil Aviation Organization task force which leads the aviation
industry’s work in developing proposals for a fair, equitable and effective global agreement on emissions.
Cathay Pacific engages with regulators and groups (the IATA Environment Committee, the Sustainable
Aviation Fuel Users Group, the Roundtable on Sustainable Biomaterials and the Association of Asia Pacific
Airlines) involved in shaping climate change and aviation policy. The aim is to increase awareness of
climate change and to develop appropriate solutions for the aviation industry.

Annual Results 2017 23
In compliance with the European Union’s Emissions Trading Scheme, our 2017 emissions data from intra-
EU flights were reported on by an external auditor in January 2018 and our emissions report was submitted
to the UK Environment Agency in February 2018.
In May 2017, Hong Kong SAR Financial Secretary Paul Chan Mo-po was the guest of honour on a
community flight organised by Cathay Pacific. The 90-minute flight on a Boeing 777-300 aircraft was a
special treat for 230 residents from less-advantaged families in Hong Kong. Most of the participants had
never flown before.
Cathay Pacific supports UNICEF through its “Change for Good” inflight fundraising programme. Our
passengers contributed HK$13.2 million in 2016 to help improve the lives of vulnerable children worldwide.
Since its introduction in 1991, more than HK$176 million has been raised through the programme.
Cathay Pacific and its subsidiaries employed more than 32,700 people worldwide at the end of 2017, with
around 25,600 of these people are employed in Hong Kong. We regularly review our human resources
and remuneration policies in the light of legislation, industry practice, market conditions and the
performance of individuals and the Group.
As at the date of this announcement, the Directors of Cathay Pacific are:
Executive Directors: John Slosar (Chairman), Rupert Hogg, Gregory Hughes, Paul Loo, Martin Murray;
Non-Executive Directors: Cai Jianjiang, Ivan Chu, Michelle Low, Song Zhiyong, Merlin Swire, Samuel Swire,
Xiao Feng, Zhao Xiaohang;
Independent Non-Executive Directors: John Harrison, Irene Lee, Andrew Tung and Peter Wong.
By Order of the Board
Cathay Pacific Airways Limited
John Slosar
Chairman
Hong Kong, 14th March 2018
Website: www.cathaypacific.com