Embed Size (px)
Citation preview
for Health & Human Services
Esri NewsSpring 2016
Maps Locate Brighter Future for Homeless
DeKalb County’s Community Development Department provides affordable housing resources to the more than 700,000 residents who call the region home. Funded primarily by the US Department of Housing and Urban Development (HUD), the department acts as the collaborative applicant for
the DeKalb County Continuum of Care and funds several programs to prevent homelessness and help those who are homeless find shelter and stability.
The ChallengeEvery other January, teams of hundreds of volunteers embark on an overnight mission to locate and count unsheltered homeless people living in DeKalb County, Georgia. Their goal: identify people in need and provide them with available
resources to get back on their feet. The homeless Point-in-Time (PIT) count is mandated every two years by HUD and is fulfilled locally throughout the country. In preparation for DeKalb County’s 2015 PIT count, the Community Development Department, in collaboration with Pathways Community Network Institute, planned to execute the census in the traditional fashion: equip boots-on-the-ground teams with paper surveys, pencils,
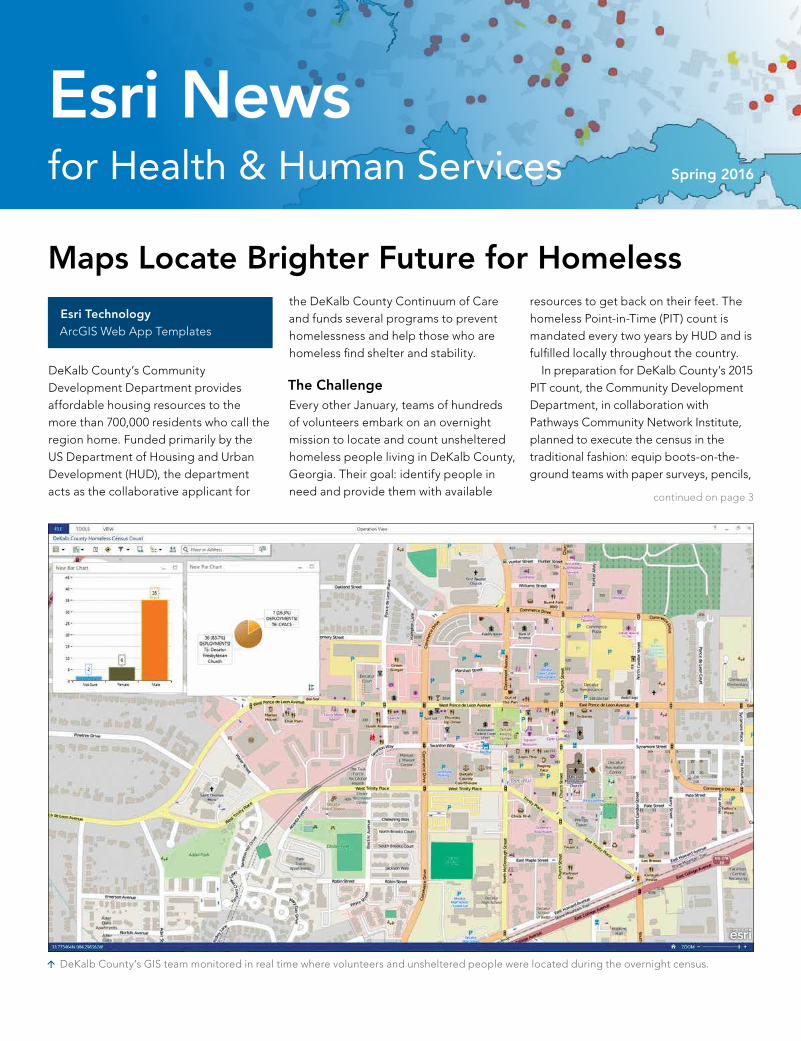
DeKalb County’s GIS team monitored in real time where volunteers and unsheltered people were located during the overnight census.
continued on page 3
Esri TechnologyArcGIS Web App Templates

Esri News for Health & Human Services Spring 2016
Spring 2016
Esri News for Health & Human Services is a publication of the Health and Human Services Solutions Group of Esri.To contact the Esri Desktop Order Center, call 1-800-447-9778 within the United States or 909-793-2853, extension 1-1235, outside the United States.
Visit the Esri website at esri.com.
View Esri News for Health & Human Services online at esri.com/health or scan the QR Code below with your smartphone.
Advertise with UsE-mail [email protected].
Submit ContentTo submit articles for publication in Esri News for Health & Human Services, contact Samantha Mac Donald at [email protected].
Manage Your SubscriptionTo subscribe, unsubscribe, or make changes to your Esri publications, please go to esri.com/updates.
Outside the United States, please contact your international distributor to subscribe, unsubscribe, or change your address. For a directory of distributors, visit esri.com/distributors.
Circulation ServicesFor back issues, missed issues, and other circulation services, email [email protected]; call 909-793-2853, extension 2778; or fax 909-798-0560.
QR code generated on http://qrcode.littleidiot.be2
Contents
Cover
1 Maps Locate Brighter Future for Homeless
Case Study
4 GIS Unearths the Root of Arsenic in Drinking Water
8 City Speeds Outreach, Curbs Homelessness with Mobile App
Technology Trends
10 Four Maps of American Health You Need to See
13 GIS Health Solution Ranks Top in National Data Challenge
Esri on the Road
14 Celebrating Industry Excellence and Innovation
15 Sponsor Spotlight
16 On the Road
The information contained in this work is the exclusive property of Esri or its licensors. This work is protected under United States copyright law and other international copyright treaties and conventions. No part of this work may be reproduced or transmitted in any form or by any means, electronic or mechanical, including photocopying and recording, or by any information storage or retrieval system, except as expressly permitted in writing by Esri. All requests should be sent to Attention: Contracts and Legal Services Manager, Esri, 380 New York Street, Redlands, CA 92373-8100 USA.
The information contained in this work is subject to change without notice.
@esri.com, 3D Analyst, ACORN, Address Coder, ADF, AML, ArcAtlas, ArcCAD, ArcCatalog, ArcCOGO, ArcData, ArcDoc, ArcEdit, ArcEditor, ArcEurope, ArcExplorer, ArcExpress, ArcGIS, arcgis.com, ArcGlobe, ArcGrid, ArcIMS, ARC/INFO, ArcInfo, ArcInfo Librarian, ArcLessons, ArcLocation, ArcLogistics, ArcMap, ArcNetwork, ArcNews, ArcObjects, ArcOpen, ArcPad, ArcPlot, ArcPress, ArcPy, ArcQuest, ArcReader, ArcScan, ArcScene, ArcSchool, ArcScripts, ArcSDE, ArcSdl, ArcSketch, ArcStorm, ArcSurvey, ArcTIN, ArcToolbox, ArcTools, ArcUSA, ArcUser, ArcView, ArcVoyager, ArcWatch, ArcWeb, ArcWorld, ArcXML, Atlas GIS, AtlasWare, Avenue, BAO, Business Analyst, Business Analyst Online, BusinessMAP, CityEngine, Community, Community Analyst, CommunityInfo, Community Maps, Database Integrator, DBI Kit, EDN, Esri, esri.com, Esri—Team GIS, Esri—The GIS Company, Esri—The GIS People, Esri—The GIS Software Leader, FormEdit, GeoCollector, GeoEnrichment, GeoEvent, Geographic Design System, Geography Matters, Geography Network, geographynetwork.com,Geoloqi, GeoPlanner, Geoportal, Geotrigger, GIS by Esri, gis.com, GISData Server, GIS Day, gisday.com, GIS for Everyone, Insights, JTX, MapIt, Maplex, MapObjects, MapStudio, ModelBuilder, MOLE, MPS—Atlas, PLTS, Rent-a-Tech, SDE, SML, Sourcebook•America, SpatiaLABS, Spatial Database Engine, Story Map Countdown, Story Map Journal, Story Map Playlist, Story Map Shortlist, Story Map Spyglass, Story Map Swipe, Story Map Tabbed, Story Map Tour, StreetMap, Tapestry, the ARC/INFO logo, the ArcGIS Explorer logo, the ArcGIS logo, the ArcPad logo, the Esri globe logo, the Esri Press logo, The Geographic Advantage, The Geographic Approach, the GIS Day logo, the MapIt logo, The World’s Leading Desktop GIS, Water Writes, and Your Personal Geographic Information System are trademarks, service marks, or registered marks of Esri in the United States, the European Community, or certain other jurisdictions. CityEngine is a registered trademark of Esri R&D Center Zurich AG and is distributed under license by Esri.
Other companies and products or services mentioned herein may be trademarks, service marks, or registered marks of their respective mark owners.
Copyright © 2016 Esri.All rights reserved. Printed in the United States of America.

Spring 2016 esri.com/health 3
and clipboards. Volunteers would collect hundreds of data points about home-less persons, and then workers would manually enter the information from the paper surveys into spreadsheets. The data would take three or more full days to enter, and once complete, the team would cross-check the spreadsheet with volunteers’ handwritten notes for errors.
The SolutionDeKalb County’s 2015 PIT count would signify: (1) the county’s first independent census and (2) the first time any agency in the country would implement geographic information system (GIS) technology into its workflow. Initially in search of volunteers, the team consulted with the county’s GIS department. What transpired was an idea to modernize the outdated paper survey by using the Esri® ArcGIS® platform and apply geography to discover new insights about homeless populations. The GIS team created a custom mobile application using GeoForm, an ArcGIS web application template. The mobile app digitized the original survey and introduced new information layers. Instead of handwriting demographic data and block-level location points of unsheltered people, volunteers entered the information via cell phones. They used
Maps Locate Brighter Future for Homeless continued from cover
the app to quickly enter demographic data in a custom form, upload photos and notes, and pinpoint the exact location of each surveyed person. Teams analyzed the information in real time with live web maps and determined where to dispatch additional volunteers to high-need areas.
The ResultsThe ArcGIS platform helped volunteers collect reliable information faster and map approximately 200 unsheltered homeless people down to the street level. The data was instantly available in spreadsheets and web maps, saving the county time and money by eliminating hours of manual data entry. Community Development con-firmed existing data on where unsheltered people live and located new people in need of housing assistance.
Goodbye paper survey, hello digital form. DeKalb County’s new survey tool delivered results in real time and added new functionalities to the traditional workflow, including the ability to upload photos.
“For the first time, we can drill down to the exact location of unsheltered individuals. By knowing where they are located, who they are, and how to find them, we can better serve our homeless populations and get them the help they need.” Melvia RichardsHousing Manager of DeKalb County’s Community Development Department
DeKalb County can now employ the ArcGIS platform to track population pat-terns and trends over time to plan where and when to allocate services. With plans to expand the department’s use of GIS, outreach workers are already utilizing the data to get people in need a home of their own.
Learn more about ArcGIS web app templates at esriurl.com/WebAppTemplates.
The GIS team gave volunteers hands-on training on how to use the PIT count survey on mobile devices. The digital survey was powered by GeoForm, an ArcGIS web application template.

Esri News for Health & Human Services Spring 20164
Eight glasses of water a day keeps the doctor away. Or so Sandy Davis thought. Davis—a resident of Cerro Gordo County in Iowa—learned in 2004 that her shaking hands and neurological issues were a result of having unknowingly consumed high levels of arsenic in the water from her private well. Even more disconcert-ing: she could have prevented long-term exposure to the known carcinogen by doing a simple test of her well water. And she wasn’t the only person whose health was at risk from drinking well water that was laced with arsenic above the public maximum contaminant level (MCL) of 10 parts per billion (ppb). In fact, 15 percent of the county’s residents (nearly 7,000 people) rely on unregulated private well water every day.
Protection without RegulationThe Cerro Gordo County Department of Public Health aims to guard residents like Davis from contaminants in private wells—a goal that is often difficult for public health agencies to achieve. After private wells are drilled, property owners are responsible for maintaining the safety of their own water supplies. Public agencies, such as the Cerro Gordo County Department of Public Health, don’t have the authority or resources to regularly check well water quality before
Esri Technology• ArcGIS for Desktop• ArcGIS 3D Analyst
GIS Unearths the Root of Arsenic in Drinking WaterMaps Help Cerro Gordo County Department of Public Health Protect Health of Well Owners
it is sent to household taps. Unfortunately, news of Davis’s condi-tion wasn’t the first time the department was alerted to arsenic in private wells. In 2003, the agency set out to raise aware-ness of arsenic in water after the Iowa Geological Survey and US Geological Survey discovered its presence in every major aquifer in the state. Environmental health scientists with the department responded by developing a mapping tool to educate the public about
arsenic in private wells. The team used Esri’s geographic information system (GIS) technology to merge private well water records and arsenic test results and then map every known well that tested above the MCL in the county. By doing so, a clear “arsenic zone” emerged on the map, indicating which properties were likely to have arsenic in private well water. Using data and insights derived from ArcGIS for Desktop, officials created a new ordinance in 2007 that dictated stricter well drilling and testing requirements. Three years later, with Davis’s story at the forefront and public health still at risk, department officials knew they had to take preventive action one step further. They turned once again to GIS for solutions—this time, to locate the underground source of the arsenic and develop a targeted plan to protect residents’ health.
GIS coordinator and environmental health specialist Sophia Walsh records field parameters for a well that is being tested for arsenic as water flows in the collection chamber.
“Without the GIS used to research arsenic in groundwater and target specific well owners, there would be hundreds of well users in our community still drinking arsenic-contaminated water.” Sophia WalshGIS Coordinator and Environmental Health Specialist with the Cerro Gordo County Department of Public Health

Spring 2016 esri.com/health 5
Case Study
Mapping a Better Path ForwardThe department collaborated with Dr. Doug Schnoebelen of the University of Iowa, Paul Van Dorpe and Chad Fields from the Iowa Department of Natural Resources, the Iowa State Hygienic Laboratory, and private well drilling operator Shawver Well Company. The team pursued and received a grant from the Centers for Disease Control and Prevention (CDC) to determine whether arsenic-contaminated wells were concen-trated in a specific area of the county.With grant funds secured, officials from the Department of Public Health and partners embarked on a three-year study. The team initially pulled geologic information about select wells including well depth, casing depth, location, and terminating aquifer.
Then, twice a year, the team collected data from approximately 70 wells. Each well was tested for pH, dissolved oxygen, redox potential, sulfide, total arsenic, arsenic speciation, and several other components that could affect arsenic levels. The team also analyzed rock chip samples from all newly drilled wells. Half of all the private wells that were tested had detectable levels of arsenic in the water, and a third contained unsafe levels of arsenic (above 10 ppb). The department mapped the data with ArcGIS for Desktop to show the geographic distribution of sample sites and arsenic levels at each of those sites. Surprisingly, there was no clear indication that the arsenic-contaminated wells were concentrated in a specific location. When a third dimension was added into the mix, using the ArcGIS 3D Analyst extension to
explore beneath the earth’s surface, the map revealed a completely different story.
Going below the SurfaceThe ArcScene application within ArcGIS 3D Analyst empowered the team—for the first time—to see and interact with geospatial data in 3D. By overlaying arsenic levels with well depth, casing information, and aquifer elevations, the researchers created an interactive 3D map that revealed a common thread. The source of the problem wasn’t based on well property location—it tied back to the aquifer through which the well was cased. With 3D Analyst, the team was able to explore the paths of each aquifer relative to the wells that had been drilled. Upon viewing the data in 3D, the team
continued on page 6
Water samples are collected from the tap and tested in a lab for arsenic.
An example of a private well is pictured. Unlike public water supplies, private wells are unregulated after drilling, and the owners are responsible for maintaining the safety of their own water supply.
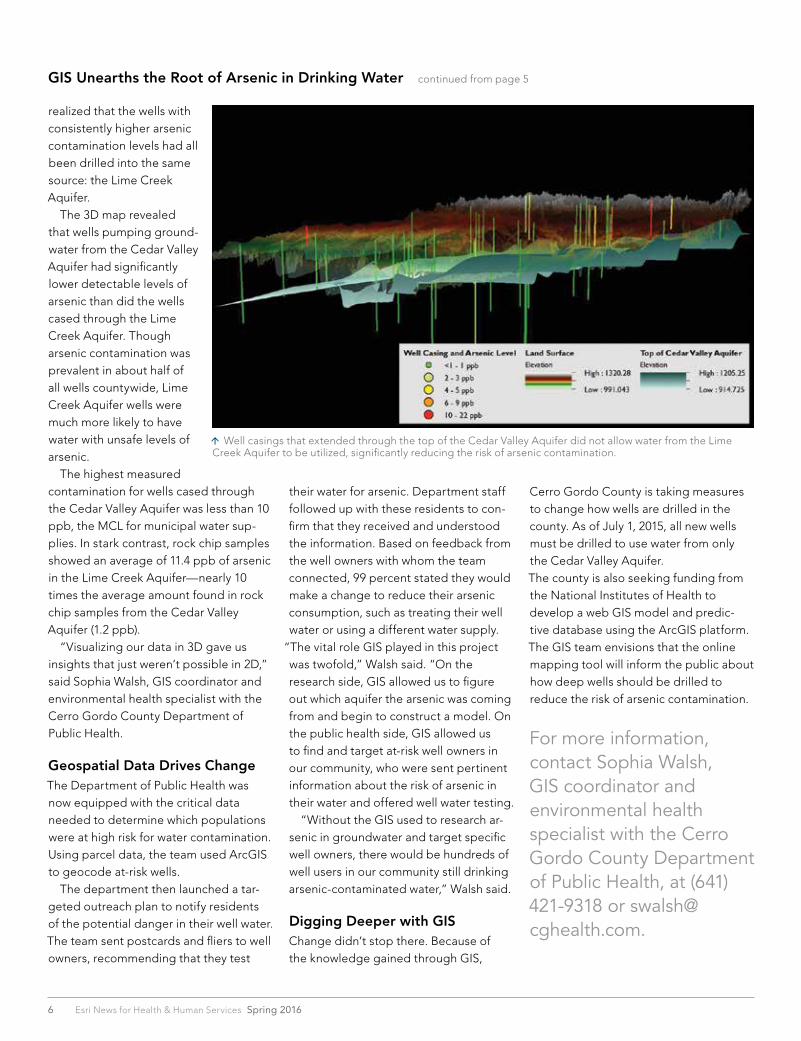
A well casing is like a large straw stuck in the ground and only allows water in at the casing’s end. Cerro Gordo County Department of Public Health used the ArcScene app in ArcGIS 3D Analyst to visualize each well casing’s depth in comparison to the elevation of groundwater sources. This method helped the team identify each casing’s water source—the Lime Creek Aquifer or the Cedar Valley Aquifer.
Esri News for Health & Human Services Spring 20166
realized that the wells with consistently higher arsenic contamination levels had all been drilled into the same source: the Lime Creek Aquifer. The 3D map revealed that wells pumping ground-water from the Cedar Valley Aquifer had significantly lower detectable levels of arsenic than did the wells cased through the Lime Creek Aquifer. Though arsenic contamination was prevalent in about half of all wells countywide, Lime Creek Aquifer wells were much more likely to have water with unsafe levels of arsenic. The highest measured contamination for wells cased through the Cedar Valley Aquifer was less than 10 ppb, the MCL for municipal water sup-plies. In stark contrast, rock chip samples showed an average of 11.4 ppb of arsenic in the Lime Creek Aquifer—nearly 10 times the average amount found in rock chip samples from the Cedar Valley Aquifer (1.2 ppb). “Visualizing our data in 3D gave us insights that just weren’t possible in 2D,” said Sophia Walsh, GIS coordinator and environmental health specialist with the Cerro Gordo County Department of Public Health.
Geospatial Data Drives ChangeThe Department of Public Health was now equipped with the critical data needed to determine which populations were at high risk for water contamination. Using parcel data, the team used ArcGIS to geocode at-risk wells. The department then launched a tar-geted outreach plan to notify residents of the potential danger in their well water. The team sent postcards and fliers to well owners, recommending that they test
GIS Unearths the Root of Arsenic in Drinking Water continued from page 5
their water for arsenic. Department staff followed up with these residents to con-firm that they received and understood the information. Based on feedback from the well owners with whom the team connected, 99 percent stated they would make a change to reduce their arsenic consumption, such as treating their well water or using a different water supply.
“The vital role GIS played in this project was twofold,” Walsh said. “On the research side, GIS allowed us to figure out which aquifer the arsenic was coming from and begin to construct a model. On the public health side, GIS allowed us to find and target at-risk well owners in our community, who were sent pertinent information about the risk of arsenic in their water and offered well water testing. “Without the GIS used to research ar-senic in groundwater and target specific well owners, there would be hundreds of well users in our community still drinking arsenic-contaminated water,” Walsh said.
Digging Deeper with GISChange didn’t stop there. Because of the knowledge gained through GIS,
Cerro Gordo County is taking measures to change how wells are drilled in the county. As of July 1, 2015, all new wells must be drilled to use water from only the Cedar Valley Aquifer. The county is also seeking funding from the National Institutes of Health to develop a web GIS model and predic-tive database using the ArcGIS platform. The GIS team envisions that the online mapping tool will inform the public about how deep wells should be drilled to reduce the risk of arsenic contamination.
For more information, contact Sophia Walsh, GIS coordinator and environmental health specialist with the Cerro Gordo County Department of Public Health, at (641) 421-9318 or [email protected].
Well casings that extended through the top of the Cedar Valley Aquifer did not allow water from the Lime Creek Aquifer to be utilized, significantly reducing the risk of arsenic contamination.
Spring 2016 esri.com/health 7
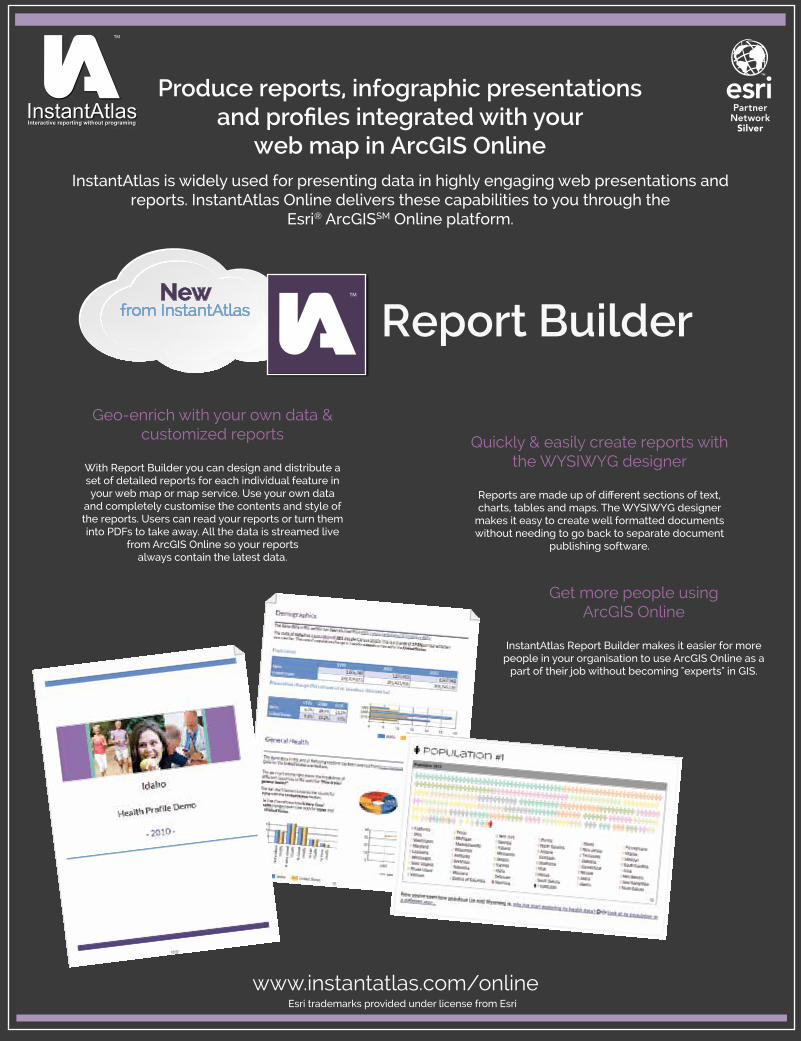
Newfrom InstantAtlas
Interactive reporting without programing
C
M
Y
CM
MY
CY
CMY
K
HealthyGIS Newsletter Advert December 2015.pdf 1 11/12/2015 09:20:20
Esri News for Health & Human Services Spring 20168
City Speeds Outreach, Curbs Homelessness with Mobile App
Esri TechnologyCollector for ArcGIS
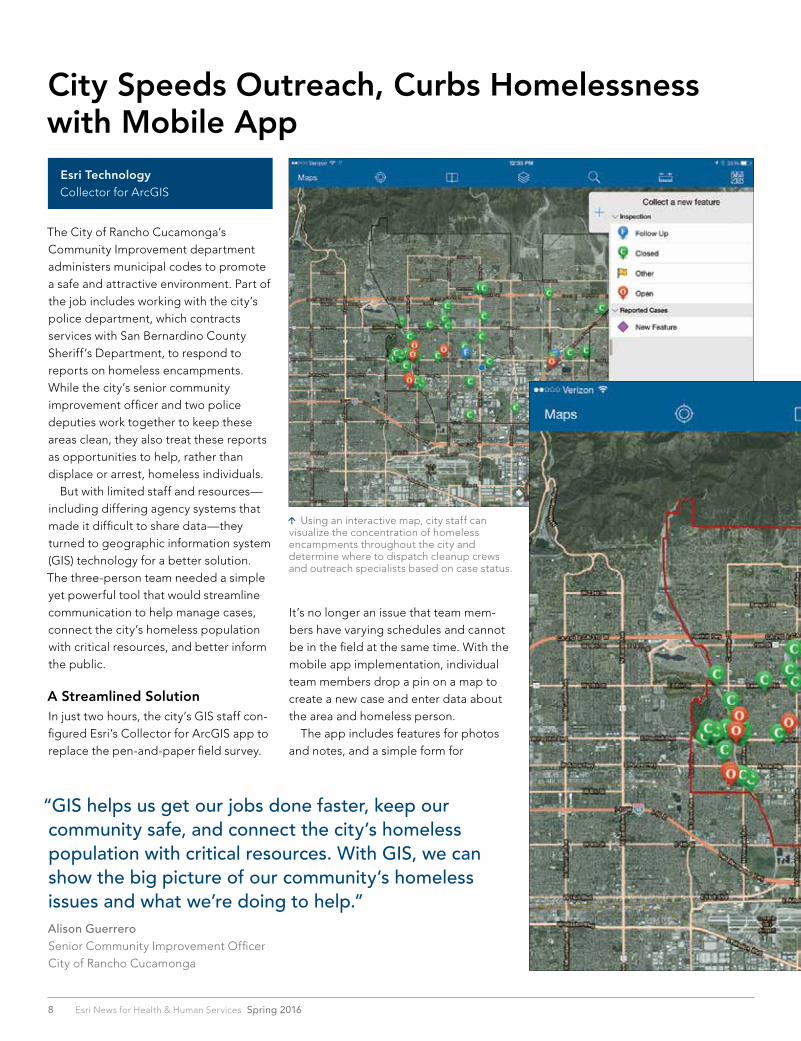
The City of Rancho Cucamonga’s Community Improvement department administers municipal codes to promote a safe and attractive environment. Part of the job includes working with the city’s police department, which contracts services with San Bernardino County Sheriff’s Department, to respond to reports on homeless encampments. While the city’s senior community improvement officer and two police deputies work together to keep these areas clean, they also treat these reports as opportunities to help, rather than displace or arrest, homeless individuals. But with limited staff and resources—including differing agency systems that made it difficult to share data—they turned to geographic information system (GIS) technology for a better solution. The three-person team needed a simple yet powerful tool that would streamline communication to help manage cases, connect the city’s homeless population with critical resources, and better inform the public.
A Streamlined Solution In just two hours, the city’s GIS staff con-figured Esri’s Collector for ArcGIS app to replace the pen-and-paper field survey.
“GIS helps us get our jobs done faster, keep our community safe, and connect the city’s homeless population with critical resources. With GIS, we can show the big picture of our community’s homeless issues and what we’re doing to help.” Alison GuerreroSenior Community Improvement OfficerCity of Rancho Cucamonga
Using an interactive map, city staff can visualize the concentration of homeless encampments throughout the city and determine where to dispatch cleanup crews and outreach specialists based on case status.
It’s no longer an issue that team mem-bers have varying schedules and cannot be in the field at the same time. With the mobile app implementation, individual team members drop a pin on a map to create a new case and enter data about the area and homeless person. The app includes features for photos and notes, and a simple form for
Spring 2016 esri.com/health 9
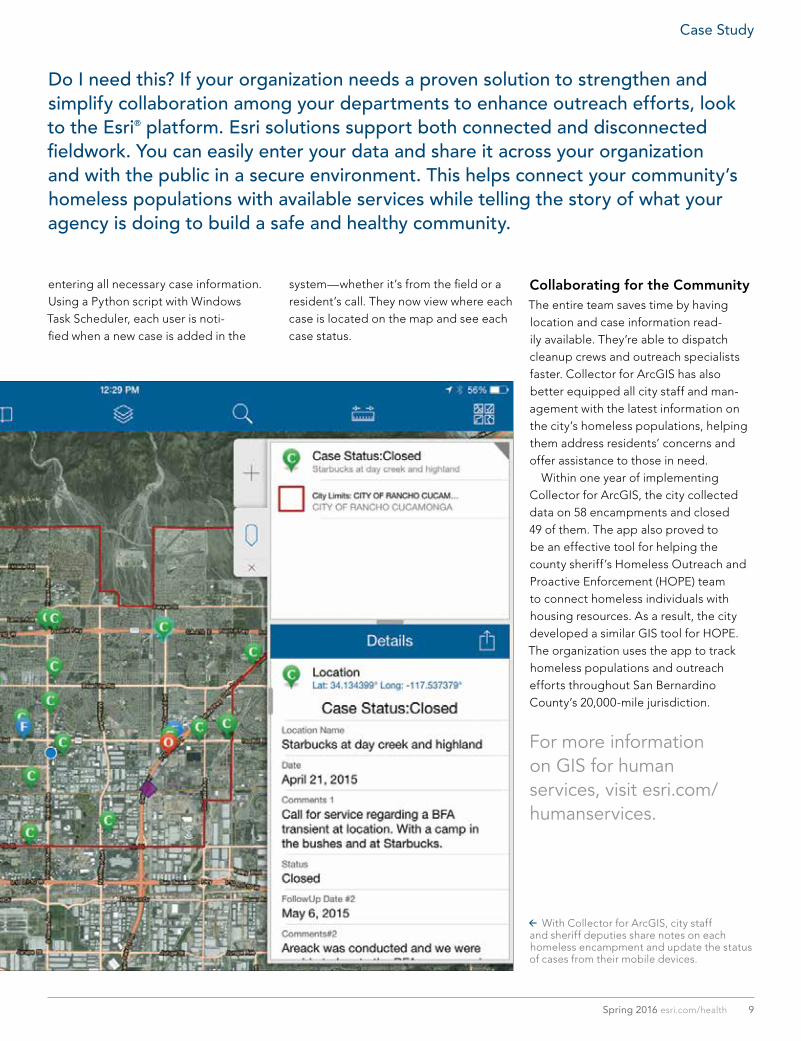
Do I need this? If your organization needs a proven solution to strengthen and simplify collaboration among your departments to enhance outreach efforts, look to the Esri® platform. Esri solutions support both connected and disconnected fieldwork. You can easily enter your data and share it across your organization and with the public in a secure environment. This helps connect your community’s homeless populations with available services while telling the story of what your agency is doing to build a safe and healthy community.
entering all necessary case information. Using a Python script with Windows Task Scheduler, each user is noti-fied when a new case is added in the
system—whether it’s from the field or a resident’s call. They now view where each case is located on the map and see each case status.
Collaborating for the CommunityThe entire team saves time by having location and case information read-ily available. They’re able to dispatch cleanup crews and outreach specialists faster. Collector for ArcGIS has also better equipped all city staff and man-agement with the latest information on the city’s homeless populations, helping them address residents’ concerns and offer assistance to those in need. Within one year of implementing Collector for ArcGIS, the city collected data on 58 encampments and closed 49 of them. The app also proved to be an effective tool for helping the county sheriff’s Homeless Outreach and Proactive Enforcement (HOPE) team to connect homeless individuals with housing resources. As a result, the city developed a similar GIS tool for HOPE. The organization uses the app to track homeless populations and outreach efforts throughout San Bernardino County’s 20,000-mile jurisdiction.
For more information on GIS for human services, visit esri.com/humanservices.
With Collector for ArcGIS, city staff and sheriff deputies share notes on each homeless encampment and update the status of cases from their mobile devices.
Case Study
Esri News for Health & Human Services Spring 201610
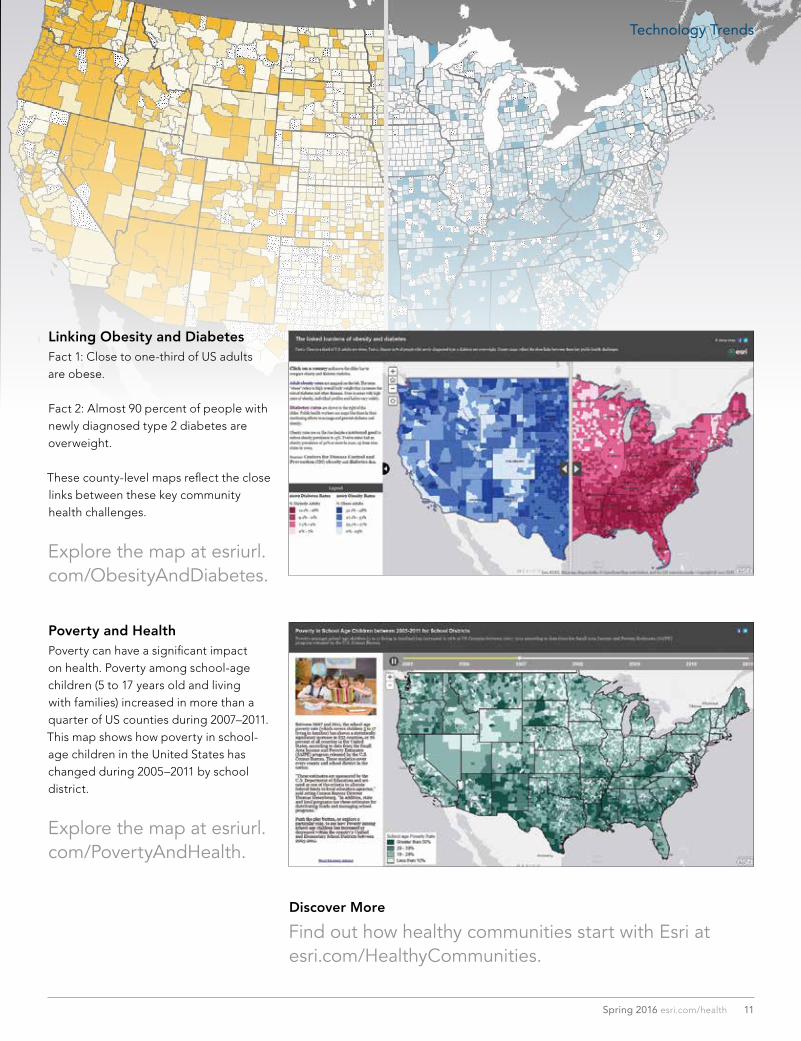
Eat your fruits and veggies. Drink plenty of water. Exercise 30 minutes a day. That’s the perfect recipe for good health, right? Well, not quite. The truth is, your health depends on much more. Thanks to advances in mapping technology, today’s health professionals know that where you live, work, learn, and play has an incredible impact on your well-being. Interactive maps paint the picture of community health, showing the spatial relationship between disparities, illness, and loca-tion—like visualizing how a neighborhood with no playgrounds influences childhood obesity. Maps offer rich insights that can help drive positive change in Americans’ lives. Check out these four maps to explore the health challenges that permeate the United States and how place plays a pivotal role.
Four Maps of American Health You Need to See
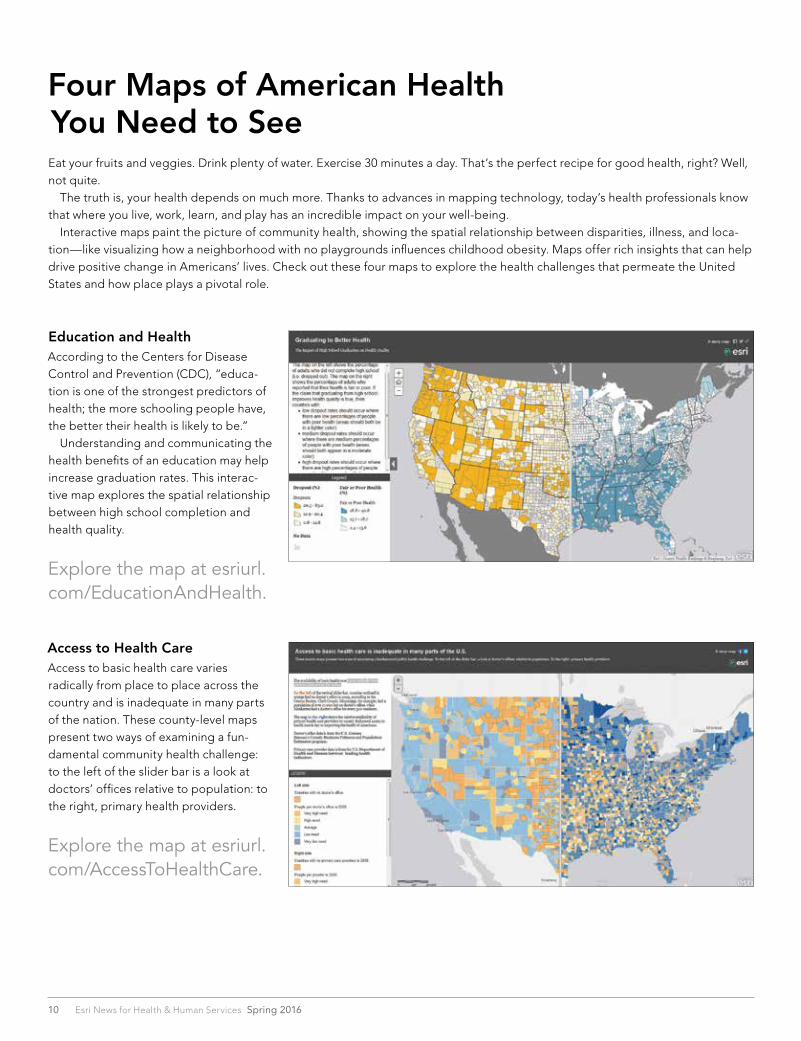
Education and Health According to the Centers for Disease Control and Prevention (CDC), “educa-tion is one of the strongest predictors of health; the more schooling people have, the better their health is likely to be.” Understanding and communicating the health benefits of an education may help increase graduation rates. This interac-tive map explores the spatial relationship between high school completion and health quality.
Explore the map at esriurl.com/EducationAndHealth.
Access to Health CareAccess to basic health care varies radically from place to place across the country and is inadequate in many parts of the nation. These county-level maps present two ways of examining a fun-damental community health challenge: to the left of the slider bar is a look at doctors’ offices relative to population: to the right, primary health providers.
Explore the map at esriurl.com/AccessToHealthCare.
Spring 2016 esri.com/health 11
Technology Trends
Linking Obesity and DiabetesFact 1: Close to one-third of US adults are obese.
Fact 2: Almost 90 percent of people with newly diagnosed type 2 diabetes are overweight.
These county-level maps reflect the close links between these key community health challenges.
Explore the map at esriurl.com/ObesityAndDiabetes.
Poverty and HealthPoverty can have a significant impact on health. Poverty among school-age children (5 to 17 years old and living with families) increased in more than a quarter of US counties during 2007–2011. This map shows how poverty in school-age children in the United States has changed during 2005–2011 by school district.
Explore the map at esriurl.com/PovertyAndHealth.
Discover More
Find out how healthy communities start with Esri at esri.com/HealthyCommunities.
Esri News for Health & Human Services Spring 201612
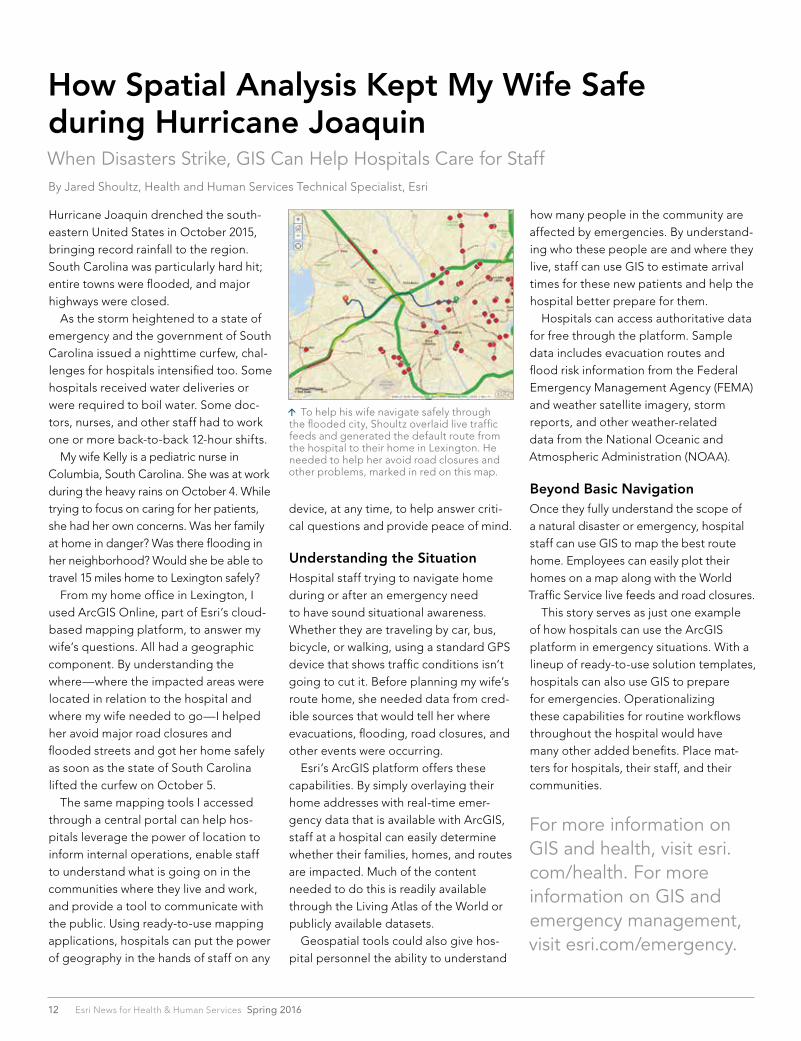
Hurricane Joaquin drenched the south-eastern United States in October 2015, bringing record rainfall to the region. South Carolina was particularly hard hit; entire towns were flooded, and major highways were closed. As the storm heightened to a state of emergency and the government of South Carolina issued a nighttime curfew, chal-lenges for hospitals intensified too. Some hospitals received water deliveries or were required to boil water. Some doc-tors, nurses, and other staff had to work one or more back-to-back 12-hour shifts. My wife Kelly is a pediatric nurse in Columbia, South Carolina. She was at work during the heavy rains on October 4. While trying to focus on caring for her patients, she had her own concerns. Was her family at home in danger? Was there flooding in her neighborhood? Would she be able to travel 15 miles home to Lexington safely? From my home office in Lexington, I used ArcGIS Online, part of Esri’s cloud-based mapping platform, to answer my wife’s questions. All had a geographic component. By understanding the where—where the impacted areas were located in relation to the hospital and where my wife needed to go—I helped her avoid major road closures and flooded streets and got her home safely as soon as the state of South Carolina lifted the curfew on October 5. The same mapping tools I accessed through a central portal can help hos-pitals leverage the power of location to inform internal operations, enable staff to understand what is going on in the communities where they live and work, and provide a tool to communicate with the public. Using ready-to-use mapping applications, hospitals can put the power of geography in the hands of staff on any
How Spatial Analysis Kept My Wife Safe during Hurricane JoaquinWhen Disasters Strike, GIS Can Help Hospitals Care for StaffBy Jared Shoultz, Health and Human Services Technical Specialist, Esri
device, at any time, to help answer criti-cal questions and provide peace of mind.
Understanding the SituationHospital staff trying to navigate home during or after an emergency need to have sound situational awareness. Whether they are traveling by car, bus, bicycle, or walking, using a standard GPS device that shows traffic conditions isn’t going to cut it. Before planning my wife’s route home, she needed data from cred-ible sources that would tell her where evacuations, flooding, road closures, and other events were occurring. Esri’s ArcGIS platform offers these capabilities. By simply overlaying their home addresses with real-time emer-gency data that is available with ArcGIS, staff at a hospital can easily determine whether their families, homes, and routes are impacted. Much of the content needed to do this is readily available through the Living Atlas of the World or publicly available datasets. Geospatial tools could also give hos-pital personnel the ability to understand
how many people in the community are affected by emergencies. By understand-ing who these people are and where they live, staff can use GIS to estimate arrival times for these new patients and help the hospital better prepare for them. Hospitals can access authoritative data for free through the platform. Sample data includes evacuation routes and flood risk information from the Federal Emergency Management Agency (FEMA) and weather satellite imagery, storm reports, and other weather-related data from the National Oceanic and Atmospheric Administration (NOAA).
Beyond Basic NavigationOnce they fully understand the scope of a natural disaster or emergency, hospital staff can use GIS to map the best route home. Employees can easily plot their homes on a map along with the World Traffic Service live feeds and road closures. This story serves as just one example of how hospitals can use the ArcGIS platform in emergency situations. With a lineup of ready-to-use solution templates, hospitals can also use GIS to prepare for emergencies. Operationalizing these capabilities for routine workflows throughout the hospital would have many other added benefits. Place mat-ters for hospitals, their staff, and their communities.
For more information on GIS and health, visit esri.com/health. For more information on GIS and emergency management, visit esri.com/emergency.
To help his wife navigate safely through the flooded city, Shoultz overlaid live traffic feeds and generated the default route from the hospital to their home in Lexington. He needed to help her avoid road closures and other problems, marked in red on this map.
Spring 2016 esri.com/health 13
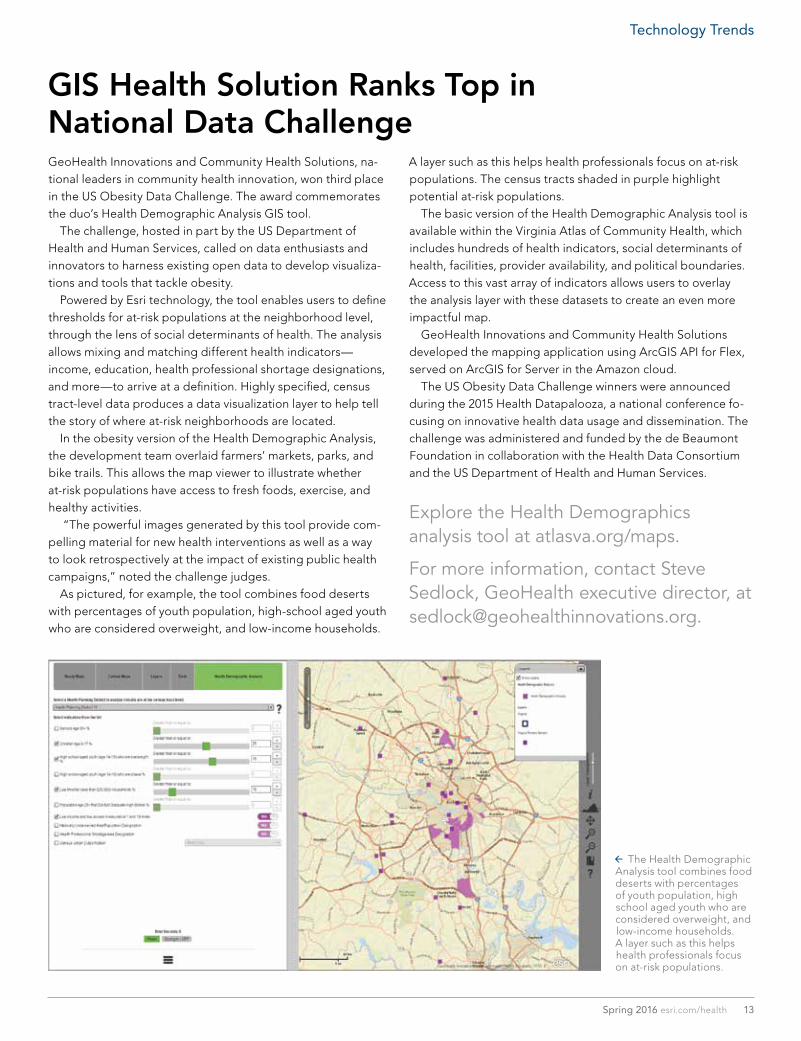
GeoHealth Innovations and Community Health Solutions, na-tional leaders in community health innovation, won third place in the US Obesity Data Challenge. The award commemorates the duo’s Health Demographic Analysis GIS tool. The challenge, hosted in part by the US Department of Health and Human Services, called on data enthusiasts and innovators to harness existing open data to develop visualiza-tions and tools that tackle obesity. Powered by Esri technology, the tool enables users to define thresholds for at-risk populations at the neighborhood level, through the lens of social determinants of health. The analysis allows mixing and matching different health indicators—income, education, health professional shortage designations, and more—to arrive at a definition. Highly specified, census tract-level data produces a data visualization layer to help tell the story of where at-risk neighborhoods are located. In the obesity version of the Health Demographic Analysis, the development team overlaid farmers’ markets, parks, and bike trails. This allows the map viewer to illustrate whether at-risk populations have access to fresh foods, exercise, and healthy activities. “The powerful images generated by this tool provide com-pelling material for new health interventions as well as a way to look retrospectively at the impact of existing public health campaigns,” noted the challenge judges. As pictured, for example, the tool combines food deserts with percentages of youth population, high-school aged youth who are considered overweight, and low-income households.
GIS Health Solution Ranks Top in National Data Challenge
A layer such as this helps health professionals focus on at-risk populations. The census tracts shaded in purple highlight potential at-risk populations. The basic version of the Health Demographic Analysis tool is available within the Virginia Atlas of Community Health, which includes hundreds of health indicators, social determinants of health, facilities, provider availability, and political boundaries. Access to this vast array of indicators allows users to overlay the analysis layer with these datasets to create an even more impactful map. GeoHealth Innovations and Community Health Solutions developed the mapping application using ArcGIS API for Flex, served on ArcGIS for Server in the Amazon cloud. The US Obesity Data Challenge winners were announced during the 2015 Health Datapalooza, a national conference fo-cusing on innovative health data usage and dissemination. The challenge was administered and funded by the de Beaumont Foundation in collaboration with the Health Data Consortium and the US Department of Health and Human Services.
Explore the Health Demographics analysis tool at atlasva.org/maps.
For more information, contact Steve Sedlock, GeoHealth executive director, at [email protected].
The Health Demographic Analysis tool combines food deserts with percentages of youth population, high school aged youth who are considered overweight, and low-income households. A layer such as this helps health professionals focus on at-risk populations.
Technology Trends
Esri News for Health & Human Services Spring 201614
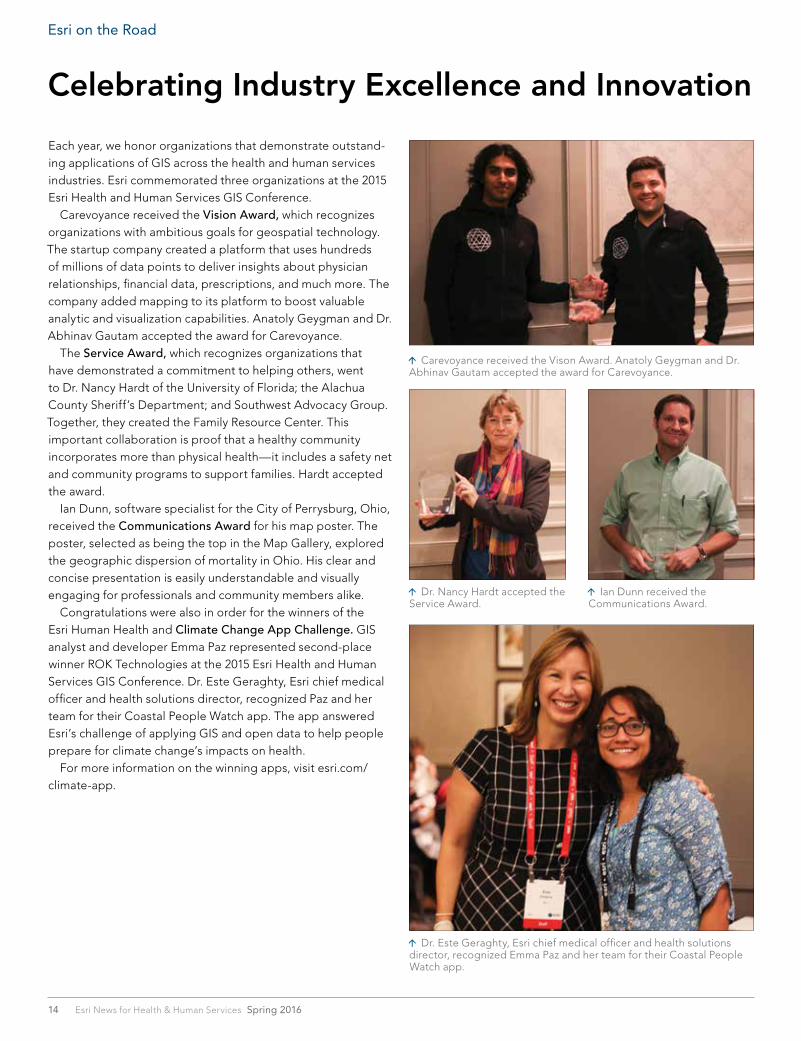
Each year, we honor organizations that demonstrate outstand-ing applications of GIS across the health and human services industries. Esri commemorated three organizations at the 2015 Esri Health and Human Services GIS Conference. Carevoyance received the Vision Award, which recognizes organizations with ambitious goals for geospatial technology. The startup company created a platform that uses hundreds of millions of data points to deliver insights about physician relationships, financial data, prescriptions, and much more. The company added mapping to its platform to boost valuable analytic and visualization capabilities. Anatoly Geygman and Dr. Abhinav Gautam accepted the award for Carevoyance. The Service Award, which recognizes organizations that have demonstrated a commitment to helping others, went to Dr. Nancy Hardt of the University of Florida; the Alachua County Sheriff’s Department; and Southwest Advocacy Group. Together, they created the Family Resource Center. This important collaboration is proof that a healthy community incorporates more than physical health—it includes a safety net and community programs to support families. Hardt accepted the award. Ian Dunn, software specialist for the City of Perrysburg, Ohio, received the Communications Award for his map poster. The poster, selected as being the top in the Map Gallery, explored the geographic dispersion of mortality in Ohio. His clear and concise presentation is easily understandable and visually engaging for professionals and community members alike. Congratulations were also in order for the winners of the Esri Human Health and Climate Change App Challenge. GIS analyst and developer Emma Paz represented second-place winner ROK Technologies at the 2015 Esri Health and Human Services GIS Conference. Dr. Este Geraghty, Esri chief medical officer and health solutions director, recognized Paz and her team for their Coastal People Watch app. The app answered Esri’s challenge of applying GIS and open data to help people prepare for climate change’s impacts on health. For more information on the winning apps, visit esri.com/climate-app.
Celebrating Industry Excellence and Innovation
Esri on the Road
Carevoyance received the Vison Award. Anatoly Geygman and Dr. Abhinav Gautam accepted the award for Carevoyance.
Dr. Nancy Hardt accepted the Service Award.
Dr. Este Geraghty, Esri chief medical officer and health solutions director, recognized Emma Paz and her team for their Coastal People Watch app.
Ian Dunn received the Communications Award.
Mark Your Calendar
Esri Federal GIS Conference
February 24–25, 2016Washington DCesri.com/fedGIS
HIMSS
February 29–March 4, 2016Las Vegas, Nevadahimssconference.org
State Healthcare IT Connect Summit
March 21–22, 2016Baltimore, Maryland healthcareitconnect.com
On the Road
15Spring 2016 esri.com/health
Special thanks to our sponsors for bringing together health and human services professionals at the Esri Health and Human Services GIS Conference, held September 14–16, 2015, in Atlanta, Georgia.
InstantAtlasTM
visual ize | communicate | ENGAGE
Sponsor Spotlight
Presorted Standard
US Postage Paid Esri
380 New York Street Redlands, California 92373-8100 usa
149363 INLD26.7M2/16sp
Copyright © 2016 Esri. All rights reserved.
Register at esri.com/fedgis2016
Esri Federal GIS ConferenceFebruary 24–25, 2016 | Washington, DC
Join GIS professionals, government leaders, elected offi cials,and tech experts at a conference where innovative ideas andgeospatial knowledge abound.
Explore ready-to-use GIS solutions and new approaches tosolving problems. Get real-world answers that make it possibleto achieve your agency’s goals in 2016.
INNOVATION THATINSPIRES CHANGE
G71263_FedGIS_EsriNews_Ad_dl_R3.indd 1 12/7/15 9:44 AM