Embed Size (px)
Citation preview

MARKET FORECASTFOR CONNECTED AND AUTONOMOUS VEHICLES
July 2017

The automotive sector is on the cusp of a revolution. The development of increasingly connected and autonomous vehicles (CAVs) brings the potential for truly transformative change in the way people and goods are transported, offering significant improvements in safety, efficiency, mobility, productivity and user experience.
This potential for transformative change creates huge opportunities for both new and existing players in the automotive sector, but for a successful transition from basic functions like cruise control, to fully autonomous driving, CAVs must overcome challenges to safety, cost, and customer perceptions. The CAV technologies that will enable this and their integration into user-centric systems is a fast-moving domain with significant industry focus.
The automotive sector is a key pillar of the UK economy, employing over 800,000 people, including 151,000 specifically in motor vehicle manufacturing1. The CAV revolution brings with it the chance to not only maintain the UK’s place in the global market, but to expand it, potentially unlocking a host of opportunities in terms of employment and wider economic benefits.
However, the size of the opportunity that results from this transition will depend on the extent of the changes to the automotive market overall, and the new technologies required specifically for CAVs will be a fundamental part of this change. As such, capturing the maximum opportunities for the UK will require an astute understanding of which UK capabilities could be effectively harnessed to provide the technologies which will be most valuable to the burgeoning CAV market.
In this context, the Centre for Connected and Autonomous Vehicles (CCAV) has commissioned this study to quantify the industrial opportunity to the UK that could result from CAV uptake, in terms of:
• the potential value of the domestic and global markets for CAVs and CAV technologies;
• the potential GVA for UK production of CAVs and CAV technologies;
• the potential for new UK jobs relating to the production of CAVs and CAV technologies.
This work is intended to provide a greater understanding of the specific opportunities for UK industry that the transition to CAVs could bring, to inform the development of a strong Industrial Strategy which will enable the UK automotive sector to consolidate and expand on past successes, as the global market shifts.
EXECUTIVE SUMMARY
1 ONS (2016) and SMMT (2016)
“Autonomous Vehicles” are expected to use information from on-board sensors and systems to understand their global position and local environment, enabling them to operate with little or no human input for some, or all, of their journey. “Connected Vehicles” are expected to have the ability to communicate with their surrounding environment (including infrastructure and other vehicles), and to provide information to the driver that informs decisions about the journey and even activities at the destination.
It is likely that autonomy and connectivity will complement and reinforce one another; the ability to receive and transmit data, for example, is already being utilised in vehicles to help achieve autonomous capabilities. It is likely that technology convergence will result in the production and uptake of vehicles that are both connected and autonomous. Such vehicles are the focus of this study, and are referred to as connected and autonomous vehicles (CAVs).
“CAV technologies” are defined as the on-vehicle technologies that provide CAVs with their autonomous and/or connected capabilities. This includes software (such as computer imaging and safety critical systems) as well as hardware (such as radar, LIDAR and GPS receivers).
WHAT IS THE OPPORTUNITY FOR UK CAV INDUSTRY?
UK AUTOMOTIVE INDUSTRY
EXPORT POTENTIAL 2035
151k DIRECT
JOBS
£71.6bn ANNUAL
TURNOVER
>800k AUTOMOTIVE
JOBS
1.2m EXPORTED
1.56m CARS BUILT
Understand & maximise domestic and global opportunity for the
UK CAV industry
2 3
Transport Systems Catapult - Market Forecast for Connected and Autonomous Vehicles Transport Systems Catapult - Market Forecast for Connected and Autonomous Vehicles

5
2 Specifically SAE autonomy level 3 and above. SAE has defined 6 levels of autonomy. Level 0 translates to complete control by the driver and levels 1-2 include existing “advanced
driver assist” features. For level 3 and above, the full dynamic driving task can be undertaken by the vehicle, including monitoring of the environment as well as lateral and
longitudinal control. Level 5 corresponds to complete autonomy, with no input required by the driver.3 (Office for National Statistics, 2016).
As shown in the diagram, this study specifically considers the markets relating to uptake of connected and autonomous cars, vans, heavy goods vehicles (HGVs) and buses, with high levels of autonomy2, and on-vehicle connectivity features that complement autonomy (i.e. vehicle to infrastructure/ vehicle to vehicle technology).
The focus of the economic analysis is on the gross contribution of manufacturing CAVs and enabling CAV technologies in the UK. The wider economic impacts of the use of CAV technologies and its potential creation of new business models are not estimated. Changes in use of vehicles, potential new services offered and productivity or welfare improvements from more efficient use of travelling time are not considered.
KEY RESULTS
• The market for CAVs in the UK (specifically, for road vehicles with CAV technologies) is estimated to be worth £28bn in 2035, capturing 3% of the £907bn global market.
• In the same year, the market for CAV technologies in the UK (as installed in vehicles sold in the UK) is estimated to be worth £2.7bn, capturing 4% of the £63 billion global market.
• It is estimated that UK jobs in the manufacture and assembly of CAVs would reach 27,400 in 2035. This compares to around 151,000 people who are currently employed in motor vehicle manufacturing3. These jobs would effectively replace the equivalent number of jobs in the manufacture of non-CAVs, so these figures should not be considered as net additional.
• However, jobs relating to the production of CAV technologies will be net additional. By 2035, there would be an estimated 6,000 direct UK jobs in the production of CAV technologies, with a further 3,900 indirect jobs created in the supply chain for these technologies.
Connected and Autonomous Vehicles
Automation: SAE: L3 • L4 • L5
CAV Technologies DevelopmentConnectivity: C-ITS - V2x • Software and Systems
Hardware AI, Navigation, Maps, Security Sensors, Camera, Lidar, Radar
OUT OF SCOPESAE: L1 • L2Business Models: Mobility as a Service, Robo Taxis etcInsurance, GPS, etc
Development
Manufacture
Import/Export
INDUSTRY CONSIDERED • In 2035, 70% of the UK jobs relating to CAV technology production are estimated to be in software-related industries, where UK capabilities are strong, the value of the technologies is high, and the labour intensity of production is high. The remaining 30% would be in the production of CAV hardware such as sensors.
• Over 90% of the jobs created in developing CAV software and over 80% of the jobs relating to the manufacture of CAV hardware are expected to be in professional, technical and skilled trade occupations.
• Annual GVA related to the production of CAVs is estimated to reach £6.9bn by 2035; GVA in firms that are producing CAV technologies is expected to reach £1.2bn. As with the job estimates outlined above, only the GVA for CAV technologies should be considered net additional.
Despite the significant surge in interest in this sector in recent years, CAVs and CAV technologies are yet to be fully developed, and an industry consensus around factors such as costs and consumer attitudes has yet to emerge. Therefore, the accuracy of the forecasts set out in this study are inevitably limited by uncertainties around adoption rates, costs and labour intensities for these technologies. It is important that the results are considered in the context of the assumptions made and the range of scenarios considered (all of which are explained in detail in the report).
2035 £2015
CAVS
CAV TECHNOLOGIES
GROSS VALUE ADDED
27-37k UK JOBS
6-10k UK JOBS
£7-9bn GLOBAL MARKET
£28-52bn UK MARKET
£907bn GLOBAL MARKET
£2.7-5.2bn UK MARKET
£63bn GLOBAL MARKET
£1.2-2.1bn UK MARKET
THE OPPORTUNITY FOR UK CAV INDUSTRY
Size of the market in 2035
-
4 5
Transport Systems Catapult - Market Forecast for Connected and Autonomous Vehicles Transport Systems Catapult - Market Forecast for Connected and Autonomous Vehicles

7
EXECUTIVE SUMMARY .......................................................................................................................................2
CONTENTS .................................................................................................................................................................7
RELEASE CONDITIONS .......................................................................................................................................10
AUTHORISATION PAGE .......................................................................................................................................11
AUTHORISATION .................................................................................................................................................. 11
RECORD OF CHANGES .........................................................................................................................................11
ACRONYMS ..............................................................................................................................................................12
1 . INTRODUCTION ...............................................................................................................................................13
1.1 BACKGROUND ..............................................................................................................................................13
1.2 OUTPUTS & DELIVERABLES ......................................................................................................................14
1.3 STRUCTURE OF THE REPORT ....................................................................................................................14
2. SCOPE....................................................................................................................................................................15
2.1 DEFINING CONNECTED AND AUTONOMOUS VEHICLES ........................................................................15
2.2 TECHNOLOGIES IN SCOPE ..........................................................................................................................16
2.2.1 Levels of Autonomy in Scope .........................................................................................................16
2.2.2 Connectivity and Autonomy Technologies in Scope .........................................................................18
CONTENTS
6
Transport Systems Catapult - Market Forecast for Connected and Autonomous Vehicles
7
Transport Systems Catapult - Market Forecast for Connected and Autonomous Vehicles
Connected and Autonomous Vehicles
Automation: SAE: L3 • L4 • L5
WHAT IS THE OPPORTUNITY FOR UK CAV INDUSTRY?
UK AUTOMOTIVE INDUSTRY
EXPORT POTENTIAL 2035
151k DIRECT
JOBS
£71.6bn ANNUAL
TURNOVER
>800k AUTOMOTIVE
JOBS
1.2m EXPORTED
1.56m CARS BUILT
Understand & maximise domestic and global opportunity for the
UK CAV industry
CAV Technologies DevelopmentConnectivity: C-ITS - V2x • Software and Systems
Hardware AI, Navigation, Maps, Security Sensors, Camera, Lidar, Radar
OUT OF SCOPESAE: L1 • L2Business Models: Mobility as a Service, Robo Taxis etcInsurance, GPS, etc
Development
Manufacture
Import/Export
INDUSTRY CONSIDERED
UK MARKET GLOBAL MARKET
2035 £2015
CAVS
CAV TECHNOLOGIES
GROSS VALUE ADDED
27-37k UK JOBS
6-10k UK JOBS
£7-9bn GLOBAL MARKET
£28-52bn UK MARKET
£907bn GLOBAL MARKET
£2.7-5.2bn UK MARKET
£63bn GLOBAL MARKET
£1.2-2.1bn UK MARKET
THE OPPORTUNITY FOR UK CAV INDUSTRY
Size of the market in 2035
-

3. SIZING THE CAV MARKET ............................................................................................................................20
3.1 SUMMARY OF FINDINGS ............................................................................................................................20
3.2 SUMMARY OF APPROACH .........................................................................................................................22
3.3 SCENARIOS FOR FUTURE CAV SALES ......................................................................................................23
3.3.1 Projected vehicle sales by region ..............................................................................................23
3.3.2 Global uptake scenarios .............................................................................................................24
3.3.3 Regional uptake assumptions and UK uptake scenarios ........................................................ 26
3.4 VALUE OF CAV COMPONENTS AND TECHNOLOGIES ............................................................................ 30
3.4.1 Cost of autonomy packages over time ..................................................................................... 30
3.4.2 Relative value of components for autonomy packages ..........................................................32
3.4.3 Key areas of uncertainty in cost projections ............................................................................37
3.5 PROJECTED MARKET SIZE FOR CAVS AND CAV TECHNOLOGIES ........................................................38
3.5.1 Size of the UK market .................................................................................................................38
3.5.2 Size of the global market ............................................................................................................40
4. ECONOMIC IMPACTS FOR THE UK ..........................................................................................................43
4.1 SUMMARY OF FINDINGS ............................................................................................................................43
4.2 SCOPE OF ECONOMIC IMPACT ANALYSIS ...............................................................................................46
4.3 OVERVIEW OF ECONOMIC METHOD .........................................................................................................48
4.4 IMPACTS ON TRADE ....................................................................................................................................49
4.4.1 Imports .........................................................................................................................................50
4.4.2 Exports .........................................................................................................................................52
4.5 IMPACT ON GROSS OUTPUT AND INVESTMENT .................................................................................... 54
4.5.1 Gross output ................................................................................................................................54
4.5.2 Investment ...................................................................................................................................55
Transport Systems Catapult - Market Forecast for Connected and Autonomous Vehicles
4.6 IMPACTS ON GVA ..........................................................................................................................................56
4.6.1 Direct effects ..............................................................................................................................56
4.6.2 Indirect effects ........................................................................................................................... 57
4.7 IMPACTS ON JOBS ........................................................................................................................................58
4.7.1 Direct effects ..............................................................................................................................58
4.7.2 Indirect effects ...........................................................................................................................59
4.8 SENSITIVITY TO KEY ASSUMPTIONS ........................................................................................................60
4.8.1 High UK capabilities sensitivity .................................................................................................61
4.8.2 Low software share sensitivity ..................................................................................................62
5. CONCLUSIONS ..................................................................................................................................................63
5.1 CAV MARKET VALUE .....................................................................................................................................63
5.2 UK ECONOMIC IMPACTS ..............................................................................................................................64
5.3 RECOMMENDATIONS FOR FURTHER RESEARCH......................................................................................65
6. APPENDICES ......................................................................................................................................................66
6.1 A – EXTRACT FROM SAE INTERNATIONAL STANDARD J3016 ...............................................................66
6.2 B – ASSUMPTIONS FOR RELATIVE COMPONENT VALUES......................................................................67
6.3 C – APPROACH TO ECONOMIC IMPACTS ANALYSIS.................................................................................72
TRADE ......................................................................................................................................................72
GROSS OUTPUT AND INVESTMENT ....................................................................................................73
GVA ...........................................................................................................................................................74
JOBS .........................................................................................................................................................74
LIMITATIONS OF APPROACH TO ECONOMIC ANALYSIS .................................................................. 75
6.4 D – MAPPING OF CAV TECHNOLOGIES TO UK SIC (2007) CODES ..........................................................76
6.5 E – COMPARISON OF DATA AND LITERATURE ON UK CAV CAPABILITIES ............................................78
7. BIBLIOGRAPHY ................................................................................................................................................87
8
Transport Systems Catapult - Market Forecast for Connected and Autonomous Vehicles
9

RELEASE CONDITIONS
THIS DOCUMENT AND THE INFORMATION IN IT ARE PROVIDED IN CONFIDENCE, FOR THE SOLE PURPOSE OF USE BY THE CENTRE FOR CONNECTED AND AUTONOMOUS VEHICLES AND OTHER GOVERNMENT AGENCIES, AND MAY NOT BE DISCLOSED TO ANY THIRD PARTY OR USED FOR ANY OTHER PURPOSE WITHOUT THE EXPRESS WRITTEN PERMISSION OF THE TRANSPORT SYSTEMS CATAPULT, NOT TO BE UNREASONABLY WITHHELD.
DISCLAIMER
This report has been produced by Element Energy and Cambridge Econometrics on behalf of the Transport Systems Catapult and the Centre for Connected and Autonomous Vehicles.
ACKNOWLEDGEMENTS
The authors would like to thank the organisations who took part in workshops or interviews and provided valuable input for this work: the Automotive Electronic Systems Innovation Network (AESIN), Bank of England, the Centre for Connected and Autonomous Vehicles (CCAV), Innovate UK, and the Office of National Statistics (ONS).
10
Transport Systems Catapult - Market Forecast for Connected and Autonomous Vehicles
11
Transport Systems Catapult - Market Forecast for Connected and Autonomous Vehicles
ACTION SIGNATURE BLOCK NAME AND POSITION
Written by: Sophie Lyons, Senior Consultant, Element Energy Sachin Babbar, Economist, Cambridge Econometrics (section 4)
Reviewed by: Celine Cluzel, Associate Director, Element EnergyAlex Stewart, Director, Element EnergyHector Pollitt, Director, Cambridge Econometrics (section 4)
Authorised by: Matthew Barton, Principal TechnologistTransport Systems Catapult
RELEASED TO VERSION REASON FOR CHANGE DATE
Transport Systems Catapult 0.1 First draft 20/03/2017
Transport Systems Catapult 0.2 Revised report addressing TSC and CCAV comments, plus addition of the executive summary
05/04/2017
Transport Systems Catapult 0.3 Revised report addressing TSC and CCAV comments 27/04/2017
Final Version 0.4 Incorporation of final CCAV comments 15/05/2017
AUTHORISATION
RECORD OF CHANGES:
AUTHORISATION PAGE

13
1. INTRODUCTION
1.1 BACKGROUND
Connected and Autonomous Vehicle technologies herald the dawn of one of the most exciting and transformative changes since the invention of the internal combustion engine over a hundred years ago. The very paradigm of mobility is set for a radical shake up, along with the industries that serve it. Automotive executives such as GM Chief Executive Mary Barra believe that the industry will change more in the next few years than it has in the past fifty. As it stands on the cusp of this revolution, the industry faces both the challenges of disruption, and the chance to seize tremendous opportunities.
The world stands to gain from CAV technology, through the quantum leaps it makes possible in safety, efficiency, mobility, productivity and user experience. The potential value for end-users and society is enormous, and generates a unique alignment of incentives between government and industry – providing fertile ground for collaboration.
As a major contributor to the UK’s economic growth and prosperity, it is vital that the automotive sector adapts to this change and continues to thrive. In 2014 the sector contributed £12bn to the economy, 8% of manufacturing output and 0.8% of total output. It employs 151,000 people directly4, and 800,000 jobs are dependent on it. The UK is the third largest automotive producer in Europe - in 2013, it produced 1.6 million vehicles and 2.5 million engines. By 2020, the Society of Motor Manufacturers and Traders forecast that this will rise to 2 million vehicles.
It was in this context that the Centre for Connected and Autonomous Vehicles commissioned Transport Systems Catapult (TSC), Element Energy and Cambridge Econometrics to quantify the industrial opportunity to the UK of CAV technologies. Understanding what CAV technologies could be worth, both in terms of the potential size and value of the domestic and global markets for CAVs and CAV technologies, is a key analytical priority for CCAV. Developing an understanding of the value of this technology and the global opportunity that the UK is competing for a share of is essential for CCAV, in order to build a business case for UK government support of the sector, including many of the investments CCAV is sponsoring into research, development, demonstration and deployment.
Early development and adoption of these technologies is likely to bring considerable economic benefits to the UK and position it as a market leader. Consequently, the UK would be well-placed to export these new transport solutions to the rest of the world, and exploit the considerable market for intelligent mobility: the smarter, greener and more efficient movement of goods and people.
4 (Office for National Statistics, 2016)
12
Transport Systems Catapult - Market Forecast for Connected and Autonomous Vehicles
ACRONYMS
ADAS Advanced Driver Assistance Systems
AESIN Automotive Electronic Systems Innovation Network
ASEAN Association of Southeast Asian Nations
CAV Connected and Autonomous Vehicle
CAV TechnologiesThe technologies required by vehicles that are in-scope for this study, which are additional requirements above vehicles that do not have CAV capabilities. This excludes equipment fitted to non-CAVs which could be used as part of driver assistance functionality (e.g. reversing cameras and parking distance control).
CCAV Centre for Connected and Autonomous Vehicles
DfT Department for Transport
ECU Engine Control Unit
GPS Global Positioning System
GVA Gross Value Added
HDV Heavy Duty Vehicle
HMI Human Machine Interface
L3/4/5 Level of vehicle automation as defined by SAE International Standard J3016
LIDAR Light detection and ranging
LDV Light Duty Vehicle
OEM Original Equipment Manufacturer
TSC Transport Systems Catapult
V2XTechnology that allows vehicles to communicate with other objects, including moving parts of the traffic system around them; V2X encompasses vehicle-to-vehicle and vehicle-to-infrastructure.
SAE Society of Automotive Engineers
SIC Standard Industrial Classification
SMMT Society of Motor Manufacturers and Traders
13
Transport Systems Catapult - Market Forecast for Connected and Autonomous Vehicles

1.2 OUTPUTS AND DELIVERABLES
The objective of the study is to quantify the CAV market in 2020, 2025, 2030 and 2035 under different uptake scenarios, in terms of its size and core economic impacts (trade, gross output and investment, GVA and jobs). Recognising the uncertainty in the projections, the assumptions are transparent, and sensitivities have been explored.
1.3 STRUCTURE OF THE REPORT
Chapter 2 defines the levels of vehicle autonomy relevant to this analysis, and sets out in detail the technologies within the scope of the study. Chapter 3 sets out the scenarios for CAV uptake on a global and regional level, defines the projected value of CAVs and CAV technologies, and on this basis, presents three main scenarios for the total global market value to 2035. Chapter 4 uses the market value scenarios to inform the assessment of the economic impacts to the UK. Chapter 5 summarises the key insights from the study.
2. SCOPE
2.1 DEFINING CONNECTED AND AUTONOMOUS VEHICLES
The vehicle segments included for the uptake scenarios are cars, vans, HGVs and buses, with levels of autonomy of Level 3 or above (levels of autonomy are defined in Section 2.2). In this study, the core economic impacts relate specifically to the sales of the CAV technologies, as opposed to quantifying the impacts to the wider change brought by CAVs, such as improved traffic flow, safety etc. Only the technologies directly related to the vehicles themselves are considered; the supporting infrastructure outside of the vehicles, which will enable different aspects of connectivity and autonomy (e.g. telecommunications infrastructure; sensing infrastructure integrated in the environment), are not included.
For the purpose of this study, CAVs refer to connected and autonomous vehicles, which are defined as follows5:
• Connected Vehicles (also known as Cooperative Intelligent Transport Systems (C-ITS)): Connected Vehicles refer to vehicles with increasing levels of connectivity which allows them to communicate with their surrounding environment (including the infrastructure and other vehicles). This could provide information to the driver about road, traffic, and weather conditions, and on routing options and enable a wide range of connectivity services.
• Autonomous Vehicles (AVs) (also known as automated, self-driving or driverless vehicles): Vehicles with increasing levels of automation will use information from on-board sensors and systems so they can understand their global position and local environment and enable them to operate with little or no human input for some, or all, of the journey.
The SMMT states that “Vehicles with some levels of automation do not necessarily need to be connected, and vice versa, although the two technologies can be complementary”6. It is likely that vehicles with autonomous capabilities will increasingly rely on connectivity (i.e. the ability to receive and transmit data) to achieve autonomy, and that technology convergence will result in vehicles that are both connected and autonomous (CAVs). As such, this study considers the market for vehicles that fall under this definition.
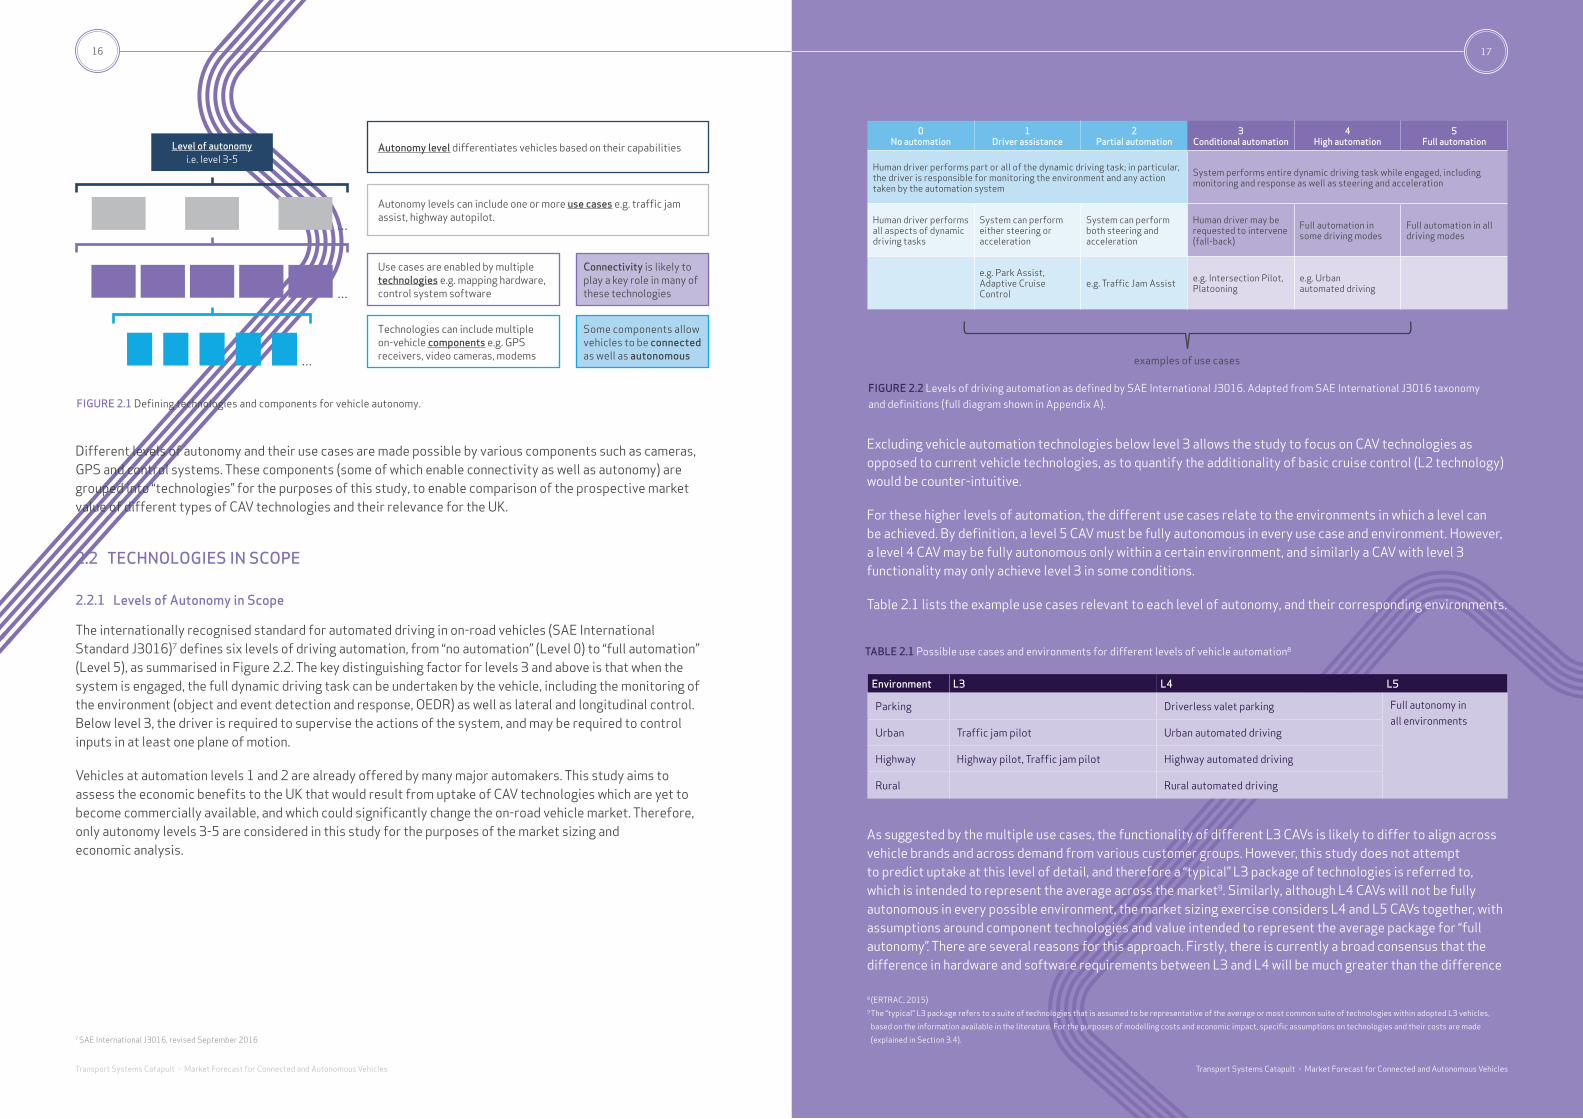
The terminology set out in Figure 2.1 is used to describe CAVs and related products. As shown in Figure 2.1, each level of autonomy defines different vehicle capabilities. Each level has an associated set of use cases, each of which defines an environment where these capabilities are applied.
5 (Transport Systems Catapult, 2016)6 SMMT, February 2017, Position Paper: Connected and Autonomous Vehicles
14
Transport Systems Catapult - Market Forecast for Connected and Autonomous Vehicles
15
Transport Systems Catapult - Market Forecast for Connected and Autonomous Vehicles
7 SAE International J3016, revised September 2016
Different levels of autonomy and their use cases are made possible by various components such as cameras, GPS and control systems. These components (some of which enable connectivity as well as autonomy) are grouped into “technologies” for the purposes of this study, to enable comparison of the prospective market value of different types of CAV technologies and their relevance for the UK.
2.2 TECHNOLOGIES IN SCOPE
2.2.1 Levels of Autonomy in Scope
The internationally recognised standard for automated driving in on-road vehicles (SAE International Standard J3016)7 defines six levels of driving automation, from “no automation” (Level 0) to “full automation” (Level 5), as summarised in Figure 2.2. The key distinguishing factor for levels 3 and above is that when the system is engaged, the full dynamic driving task can be undertaken by the vehicle, including the monitoring of the environment (object and event detection and response, OEDR) as well as lateral and longitudinal control. Below level 3, the driver is required to supervise the actions of the system, and may be required to control inputs in at least one plane of motion.
Vehicles at automation levels 1 and 2 are already offered by many major automakers. This study aims to assess the economic benefits to the UK that would result from uptake of CAV technologies which are yet to become commercially available, and which could significantly change the on-road vehicle market. Therefore, only autonomy levels 3-5 are considered in this study for the purposes of the market sizing and economic analysis.
FIGURE 2.1 Defining technologies and components for vehicle autonomy.
Excluding vehicle automation technologies below level 3 allows the study to focus on CAV technologies as opposed to current vehicle technologies, as to quantify the additionality of basic cruise control (L2 technology) would be counter-intuitive.
For these higher levels of automation, the different use cases relate to the environments in which a level can be achieved. By definition, a level 5 CAV must be fully autonomous in every use case and environment. However, a level 4 CAV may be fully autonomous only within a certain environment, and similarly a CAV with level 3 functionality may only achieve level 3 in some conditions.
Table 2.1 lists the example use cases relevant to each level of autonomy, and their corresponding environments.
As suggested by the multiple use cases, the functionality of different L3 CAVs is likely to differ to align across vehicle brands and across demand from various customer groups. However, this study does not attempt to predict uptake at this level of detail, and therefore a “typical” L3 package of technologies is referred to, which is intended to represent the average across the market9. Similarly, although L4 CAVs will not be fully autonomous in every possible environment, the market sizing exercise considers L4 and L5 CAVs together, with assumptions around component technologies and value intended to represent the average package for “full autonomy”. There are several reasons for this approach. Firstly, there is currently a broad consensus that the difference in hardware and software requirements between L3 and L4 will be much greater than the difference
8 (ERTRAC, 2015)9 The “typical” L3 package refers to a suite of technologies that is assumed to be representative of the average or most common suite of technologies within adopted L3 vehicles,
based on the information available in the literature. For the purposes of modelling costs and economic impact, specific assumptions on technologies and their costs are made
(explained in Section 3.4).
FIGURE 2.2 Levels of driving automation as defined by SAE International J3016. Adapted from SAE International J3016 taxonomy and definitions (full diagram shown in Appendix A).
16
Transport Systems Catapult - Market Forecast for Connected and Autonomous Vehicles
Level of autonomyi.e. level 3-5
Autonomy level differentiates vehicles based on their capabilities
Autonomy levels can include one or more use cases e.g. traffic jam assist, highway autopilot.
Use cases are enabled by multiple technologies e.g. mapping hardware, control system software
Technologies can include multiple on-vehicle components e.g. GPS receivers, video cameras, modems
Connectivity is likely to play a key role in many of these technologies
Some components allow vehicles to be connected as well as autonomous
…
…
…
0 No automation
1 Driver assistance
2 Partial automation
3 Conditional automation
4 High automation
5 Full automation
Human driver performs part or all of the dynamic driving task; in particular, the driver is responsible for monitoring the environment and any action taken by the automation system
System performs entire dynamic driving task while engaged, including monitoring and response as well as steering and acceleration
Human driver performs all aspects of dynamic driving tasks
System can perform either steering or acceleration
System can perform both steering and acceleration
Human driver may be requested to intervene (fall-back)
Full automation in some driving modes
Full automation in all driving modes
e.g. Park Assist, Adaptive Cruise Control
e.g. Traffic Jam Assist e.g. Intersection Pilot, Platooning
e.g. Urban automated driving
examples of use cases
17
Transport Systems Catapult - Market Forecast for Connected and Autonomous Vehicles
TABLE 2.1 Possible use cases and environments for different levels of vehicle automation8
Environment L3 L4 L5
Parking Driverless valet parking Full autonomy in all environments
Urban Traffic jam pilot Urban automated driving
Highway Highway pilot, Traffic jam pilot Highway automated driving
Rural Rural automated driving

2.2.2 Connectivity and Autonomy Technologies in Scope
METHOD BOX #1: CAV TECHNOLOGY SCOPING PROCESS
The process of defining the technologies required for CAV implementation involved an extensive review of the literature, including work by Transport Systems Catapult & the Centre for Connected & Autonomous Vehicles. Many of the literature sources involved interviews with vehicle manufacturers, tier 1 suppliers, and other companies seeking to enter the autonomous vehicle market.
19
Transport Systems Catapult - Market Forecast for Connected and Autonomous Vehicles
The technologies required for CAV implementation are set out in Figure 2.3. Only the technologies exclusive to the level of capability attributed to in-scope vehicles (L3+ automation and connectivity, as defined in section 2.2.1) are included in the scope of this study. Therefore, the “Vehicle design” group of technologies (relating to the baseline design and functionality of on-road vehicles, and not directly affected by autonomous capabilities) are not in scope. Technologies or areas that will support CAV implementation but that do not include on-vehicle components are also out of scope, for example parking sensors and reversing cameras. This means that the development of CAV standards is not included, and that only the on-vehicle aspects of the Localisation & Mapping, and Connectivity technologies are in scope.
Figure 2.4 gives some examples of components for the technologies in scope. To maximise the accuracy of the assessment of the potential economic impacts resulting from these markets, the major software and hardware components of these technologies are considered separately for the purposes of market sizing.
FIGURE 2.4 Hardware and software aspects of CAV technologies defined for this study.
Control systems and computing e.g. passive components, architecture
Control systems e.g. critical eventcontrol, decision algorithms
Sensor-supporting e.g. actuatorsSensing & local mapping e.g.cameras, LIDAR, radar, GPS
receivers
Mapping & path planning e.g.machine vision, digital image
processing
Connectivity e.g. embeddedmodems, DSRC module
Connectivity e.g. data processing,communication protocols
Assumed that this will notrequire dedicated hardware but
will run on existing hardware
Data security e.g. encryption,intrusion prevention
Human -Machine Interface relating to safety, e.g. internal sensors Human Machine Interface software
Technology categories On-vehicle hardware On-vehicle software
Connectivity
Control systems
Sensing
Localisation & mapping
Cyber security
Human factors
between L4 and L5: the transition to L4 marks the first move to full autonomy (albeit in specific use cases) and therefore the requirements for system redundancy are likely to be very high to ensure safety. The transition from a range of autonomous use cases at L4, to fully autonomous vehicles at L5 is expected to be enabled by learning from the extensive experiences of CAVs at L3 and L4, and therefore the additional requirements at L5 compared to the “average” L4 vehicle are not expected to be as large. Secondly, in terms of producing uptake scenarios for CAVs at different levels of autonomy, attitudes towards adoption of highly or fully autonomous vehicles (in which the driver is not required to provide input for a particular use case, including CAVs at L4 and L5) are expected to be similar to each other, but distinctly different from attitudes towards conditional driving automation, where the human driver is expected to provide input when requested (L3). Therefore, it makes sense to consider the rate of uptake of highly and fully autonomous vehicles together. Effectively removing the distinction between L4 and L5 also reflects the high level of uncertainty around the rate at which the transition from high autonomy to full autonomy will occur. Assumptions will be discussed in detail in Section 3.4.
Connected and Autonomous Vehicles
Automation: SAE: L3 • L4 • L5
CAV Technologies Development
Connectivity: C-ITS - V2x • Software and Systems Hardware AI, Navigation, Maps, Security
Sensors, Camera, Lidar, Radar
OUT OF SCOPESAE: L1 • L2Business Models: Mobility as a Service, Robo Taxis etcInsurance, GPS, etc
Development
Manufacture
Import/Export
INDUSTRY CONSIDERED
FIGURE 2.3 CAV technologies included in market sizing and economic analysis10
10 Figure adapted from work by Transport Systems Catapult
“Sensing” & “Localisation & Mapping” both include components that could be used to provide vehicles with information on their environment and immediate surroundings, informing the decisions made by CAV control systems. The relative requirements and corresponding value for each of these components in L3-L5 CAVs is an area of considerable uncertainty, as different approaches are already being taken by different vehicle manufacturers. The approach taken for the purposes of the market sizing and economic analysis will be explained in Section 3.4.
18
Transport Systems Catapult - Market Forecast for Connected and Autonomous Vehicles
19

3. SIZING THE CAV MARKET
3.1 SUMMARY OF FINDINGS
• Four scenarios were developed to estimate the possible size of the markets for CAVs and CAV technologies in the UK and globally. The central case is the main scenario used to explore the economic impacts of CAV uptake, with the central UK lead scenario providing an indication of the impact of a relatively advanced CAV market in the UK. The High case and Low case scenarios will be used to provide an indication of the possible extremes for the economic impacts. For each of these scenarios, the cost reductions for CAVs and CAV technologies are assumed to be linked to uptake.
- Central case: rapid technology development and moderate global CAV uptake, reaching 25% of total annual global vehicle sales in 2035. UK CAV uptake follows the predicted trend for Europe, which is assumed to be ahead of the global average with L3-L5 CAVs accounting for 31% of total annual sales in 2035 (due to several factors including a supportive regulatory framework for CAVs). For the UK, this equates to 1.1 million CAVs sold in 2035, including cars, vans, HGVs and buses.
- Central, UK lead: Total global market reflects the central case, but the UK is the leading global market in CAV penetration terms. L3-L5 CAVs accounting for 58% of total sales by 2035, equating to 2.1 million CAVs sold annually.
- High case: rapid technology development and high global uptake of CAVs (84% of total annual global vehicle sales in 2035). The UK is the leading global market in terms of CAV sales penetration, with L3-L5 CAVs accounting for 100% of total annual UK vehicle sales in 2035.
- Low case: remaining challenges for autonomy are not resolved quickly and many consumers remain suspicious or untrusting of the technology, leading to global uptake of CAVs reaching only 8% of annual global vehicle sales in 2035. UK CAV uptake lags behind, and reaches only 5% of total annual vehicle sales in 2035.
• UK CAV sales result in a projected domestic market size of £28bn in 2035 for the central scenario (as shown in Figure 3.2), with a market size of £2.7bn for CAV technologies. The “central, UK lead” uptake scenario results in a domestic market size of £52bn from CAV sales, and £5.2bn from CAV technologies.
• In the central scenario, in 2035 the global market size is estimated at £907bn from CAV sales (as shown in Figure 3.3), and £63bn in total for CAV technologies.
FIGURE 3.2 Projected market value from CAV sales in the UK. Values shown are based on the projected sales of L3-L5 cars, vans and HGVs in the specific years shown (i.e. not cumulative).
KEY ASSUMPTIONS
Overall UK vehicle sales are assumed to increase from current levels by approximately 1% each year.
Central case: L3-L5 CAV uptake in the UK and Europe reaches 31% of total sales by 2035.
Central - UK lead: UK CAV adoption is more rapid than in the rest of Europe due to highly supportive regulatory and testing environment. In the UK, L3-L5 CAV uptake reaches 58% of total sales by 2035.
60
50
40
30
20
10
0
Mar
ket v
alue
from
UK
CAV
sal
es (£
bn.,
2015
)
6
9
19
35
25
46
28
52
Central case Central - UK lead
FIGURE 3.3 Projected global market value from CAV and CAV technology sales. Values shown are based on the projected sales of L3-L5 cars, vans and HGVs in the specific years shown (i.e. not cumulative).
KEY ASSUMPTIONS
Overall vehicle sales are assumed to increase from current levels by approximately 2% each year.
Central case:
• L3 CAV uptake reaches a peak in 2030, at 18% of total global sales (falling to 15% of total global sales by 2035).
• L4/5 CAV uptake reaches 10% of total global sales by 2035.
1000
900
800
700
600
500
400
300
200
100
0
Mar
ket v
alue
from
glo
bal C
AV s
ales
(£bn
., 20
15)
2020 2025 2030 2035
51
311
674
907
CAV
CAV TECHNOLOGIES
For CAV sales: CAV market value is £907bn.
Based on CAV sales values, which include CAV technology prices plus a 50% OEM mark-up
CAV technology share of CAV sales market value (after mark-up): £95bn.
For CAV technology sales to automotive sector: market value is £63bn.
To scale
To scale
Value based on CAV technology sales values (before 50% OEM mark-up)
FIGURE 3.1 Projected market values for CAVs and CAV technologies in 2035.
2020 2025 2030 2035
300
250
200
150
100
50
0
6345
20
4
CAV market - central case
CAV technologies market - central case
20
Transport Systems Catapult - Market Forecast for Connected and Autonomous Vehicles
21
Transport Systems Catapult - Market Forecast for Connected and Autonomous Vehicles Transport Systems Catapult - Market Forecast for Connected and Autonomous Vehicles

3.2 SUMMARY OF APPROACH
The approach taken to estimate the total market size at global and regional scale is summarised in Figure 3.4.
As shown in Figure 3.4, projections of CAV sales at a global and regional level were combined with value projections (for both CAVs as a whole, and for their technologies) to produce estimates of the total future market value for CAVs, and for CAV technologies. These estimates are used in the economic analysis, as described in Chapter 4.
This chapter of the report sets out in detail the approach taken to estimating the size of the market by 2035, and shows how results could vary depending on the rate of CAV uptake and on the costs involved.
FIGURE 3.4 Summary of approach to finding global and regional market sizes.
CAV sales on 2025, 2030 & 2035
Value of CAVs and CAV technologies in 2025, 2030 & 2035
Global and regional market size in 2025, 2030 & 2035
Vehicle sales by region
CAV uptake scenarios
CAV sales
Cost reduction rate
CAV starting costs
CAV value projections
Technology value breakdown (share of cost to OEM)
Market value for L3 and L4/5 CAVs
Market value for CAV technologies
Sensing hardware market
Connectivity hardware market
Control systems software market
etc…
Economic analysis
23
11 Based on projections from: Navigant Research, 2015, Transportation Forecast: Light Duty Vehicles; I.H.S. Automotive, 2016, Global Production Summary (HGVs); Frost & Sullivan,
2016, Bus and coach sales forecasts. UK specific data based on SMMT projections (new car registrations, commercial vehicle forecasts and bus and coach registrations), 2016.
Note that Asia Pacific includes Japan, Belarus, Kazakhstan, China, India, Korea, Taiwan, Indonesia, Australia, New Zealand and Rest of ASEAN.
3.3 SCENARIOS FOR FUTURE CAV SALES
3.3.1 Projected vehicle sales by region
To estimate the market for CAVs and CAV technologies, assumptions are required around the future volume of vehicle sales, both globally and in the UK. Although it is possible that CAV adoption will have a highly disruptive impact on current vehicle ownership and sales rates, this study is based on the “business as usual” case for sales of the vehicle types in scope: all the CAV uptake scenarios assume that total car, van, HGV and bus sales (inclusive of CAV and non-CAV sales) increase over time.
Figure 3.5 shows the assumed future vehicle sales for light duty vehicles (LDVs, i.e. cars and vans), HGVs and buses, based on a range of sources11. For the UK, a 1% annual increase in sales is assumed (note that in recent years, LDV sales have fluctuated, but the long term trend suggests a continued increase). For the global market, the average annual increase is approximately 2%; however, regional sales projections account for the expected variation in growth rate between regions. By 2035, this translates to annual vehicle sales of 137 million globally, and 3.7 million in the UK. Cars and vans make up around 95% of total annual global sales.
• The uptake scenarios take account of the best available evidence from a range of previous studies, but there are inherent difficulties in predicting the future adoption of new, emerging technologies. The High and Low scenarios were produced with a view to representing the possible maximum and minimum levels of CAV adoption, and the corresponding market sizes. Results across all scenarios can be found in the Appendices.
• All CAV uptake scenarios assume that total car, van, HGV and bus sales increase over time. For the UK, a 1% annual increase in sales is assumed. For the global market, the average annual increase is approximately 2% (regional sales projections account for the expected variation in growth rate between regions).
FIGURE 3.5 Projections of annual global sales of LDVs, HGVs and buses11 - note different scale for each vehicle type.
150
125
100
75
50
25
0LD
V s
ales
(mill
ions
)
2015
UK
2020 2025 2030 2035
5
4
3
2
1
0
HG
V s
ales
(mill
ions
)
2015 2020 2025 2030 2035
2.5
2.0
1.5
1.0
0.5
0
Bus
sal
es (m
illio
ns)
2015 2020 2025 2030 2035
Europe (ex UK) N America Asia Pacific Rest of world
22
Transport Systems Catapult - Market Forecast for Connected and Autonomous Vehicles
23
Transport Systems Catapult - Market Forecast for Connected and Autonomous Vehicles

3.3.2 Global uptake scenarios
This study considers three main scenarios for global uptake of CAVs, which are summarised in Table 3.1. These scenarios are based on projections made by previous studies, and are intended to represent the boundaries of reasonable probability for global CAV adoption. The scenarios have been reviewed and agreed with TSC and CCAV.
16 OICA sales statistics 2005-2016 (OICA, 2017).
17 Usually, new technologies are deployed later in the commercial vehicle market compared to the LDV market (smaller sales volumes delay the return on investment). However, CAV
technologies could have rapid pay-back in commercial fleets and thus could be developed and adopted as fast as for light duty vehicles.
TABLE 3.1 Scenarios for uptake of CAVs in the LDV and HDV market.
Scenario Description and reference points CAV uptake (share of new vehicle sales)
Progressive Follows global uptake projections from Goldman Sachs, 201512 and high global uptake projections from McKinsey 201613
- Safe and reliable technical solutions fully developed and introduced by mass market leaders before 2025
- Significant cost reductions to hardware (following similar trends to smartphones) are achievable in the next 10 years
- Levels of scepticism can be reduced in a short time frame, supported by the regulatory environment and the rapid solution of remaining technological challenges.
2025 2030 2035
L3: 11%
L3: 29%
L3: 54%
L4/5: 0.4%
L4/5: 8%
L4/5: 30%
Central Follows global uptake projections set out in BCG, 201514
- Assumes that uptake is governed predominantly by consumer willingness to pay; possible effects of regulations (e.g. those mandating autonomy) are not accounted for
- Uptake is based on comparing projections of cost reductions (which are based on extensive industry consultation and cost trends for existing ADAS technology) with consumer willingness to pay (based on survey results)
2025 2030 2035
L3: 11%
L3: 18%
L3: 15%
L4/5: 0.3%
L4/5: 3%
L4/5: 10%
Obstructed Follows low global uptake projections from McKinsey 201615
- Technical and cost challenges for L5 are not addressed in the next 10 years
- Regulations (excluding those in the UK) do not enable sufficient use of CAVs in varied environments
- Negative publicity following incidents; consumers take longer to trust the technology
2025 2030 2035
L3: 0.2% L3: 3% L3: 5%
L4/5: 0%
L4/5: 0.2%
L4/5: 3%
FIGURE 3.6 Global uptake scenarios for L3-L5 CAVs (as a percentage of vehicle sales).
These uptake shares have been applied to projections of total vehicle sales, as shown in Figure 3.5 (in Section 3.3.1), in order to estimate total CAV sales in each year for the three scenarios. The resulting CAV sales projections for each scenario in 2025, 2030 and 2035 are shown by vehicle type in Table 3.2.
The previous studies that form the basis for these scenarios relate primarily to the market for connected and autonomous passenger cars. Cars represent the largest on-road vehicle market, with 70-80 million new cars sold annually (compared to around 25 million commercial vehicles sold annually)16. For the purposes of this study, in the absence of well-supported specific scenarios for other vehicle segments in the literature, uptake of CAVs within the van, HGV and bus markets is assumed to occur at the same rate as for cars17. As such, the uptake scenarios described in Table 3.1 are applied uniformly to each vehicle segment.
The uptake curves used for each of these scenarios are shown in Figure 3.6, which shows that the total global sales penetration of L3-5 CAVs in 2035 under the three scenarios are approximately 85%, 25% and 10% in the progressive, central and obstructed scenarios respectively. In the central and progressive scenarios, it is assumed that uptake of L4/5 CAVs begins to cannibalise uptake of L3 CAVs by around 2030-2035. This is most noticeable in the central scenario where uptake of L3 CAVs peaks in 2030; in the progressive scenario, uptake of L3 continues to grow in some regions (regional breakdown of the scenarios is discussed in Section 3.3.3).
100%
90%
80%
70%
60%
50%
40%
30%
20%
10%
0%
Glo
bal s
ales
pen
etra
tion
of C
AVs
2020 2025 2030 2035
Progressive
Central
Obstructed
L3L4/5
L3
L3
L4/5
L4/5
L3 share
Total L3-L5 CAV share
2017
12 (Archambault et al., 2015)
13 (McKinsey & Stanford University, 2016)
14 (Mosquet et al., 2015)
15 Based on projections from: (Research, 2015) - Transportation Forecast: Light Duty Vehicles; (Insight, 2011); (Frost & Sullivan, 2016). UK specific data based on SMMT projections
(new car registrations, commercial vehicle forecasts and bus and coach registrations), 2016. Note that Asia Pacific includes Japan, Belarus, Kazakhstan, China, India, Korea, Taiwan,
Indonesia, Australia, New Zealand and Rest of ASEAN.
24
Transport Systems Catapult The case for government involvement to incentivise data sharing in the UK Intelligent Mobility sectorTransport Systems Catapult - Market Forecast for Connected and Autonomous Vehicles
25
Transport Systems Catapult Exploring the Opportunity for Mobility as a Service in the UKTransport Systems Catapult - Market Forecast for Connected and Autonomous Vehicles

Transport Systems Catapult - Market Forecast for Connected and Autonomous Vehicles
18 Regional uptake projections for Europe, N America and Asia Pacific based on figures in Goldman Sachs, 2015, Monetizing the rise of autonomous vehicles. The projections provided
by Goldman Sachs inform the Progressive scenario. Relative uptake for rest of world has been estimated by Element Energy and is assumed to lag behind Asia Pacific. Note that
while Asia Pacific is a large and disparate region, both the overall vehicle sales projections and the uptake scenarios account for the average expected trends across the regions.
3.3.3 Regional uptake assumptions and UK uptake scenarios
All three global uptake scenarios can be broken down to show uptake in the UK, Europe, North America, Asia Pacific and the Rest of the World. This is needed to estimate the market size in each region and subsequently, the economic impacts to the UK resulting from export of UK-made CAV components to these regions.
The relative uptake between regions follows the trends suggested by Goldman Sachs, 201518, the study which informs the total global uptake figures behind the Progressive scenario. These trends are summarised in Figure 3.7. For the central and obstructed uptake scenarios, uptake projections for each region are proportionally scaled down (from those shown in Figure 3.7) to match the overall global projections for these scenarios.
26
FIGURE 3.7 Relative CAV sales penetration in different regions (shown for Progressive Scenario).
L3
100%
80%
60%
40%
20%
0%2020 2025 2030 2035
L4/5
100%
80%
60%
40%
20%
0%2020 2025 2030 2035
100%
80%
60%
40%
20%
0%2020 2025 2030 2035
100%
80%
60%
40%
20%
0%2020 2025 2030 2035
Europe
Asia Pacific
North America
Rest of the world
27
The relative uptake scenarios assume that Europe (including the UK) is the leading market for CAVs, with North America closely following, due to the early emergence of a testing and regulatory landscape for autonomous driving features (particularly in the UK) and the presence of multiple large automakers with premium vehicle offerings and links with suppliers of complex vehicle components (e.g. Bosch, Continental and Valeo).
As well as considering three overall scenarios for global CAV uptake, this study also considers various levels of uptake specifically within the UK, as the level of domestic demand for CAVs is likely to have a significant impact on the economic impacts for the UK. For each global scenario (with a certain assumed level of uptake for Europe as a whole), three scenarios can be defined for the CAV sales penetration in the UK, relative to the rest of Europe:
1. UK European average: UK uptake reflects the average for Europe as a region
2. UK lead: UK uptake is above the average for Europe as a region
3. UK lag: UK uptake is below the average for Europe as a region
The scenarios for UK CAV uptake relative to the rest of Europe can be combined with the global uptake scenarios to estimate the possible boundaries for CAV sales in the UK by 2035. Of the nine possible combinations of global and UK uptake scenarios, this study considers four main scenarios for CAV sales, as set out in Table 3.3.
The Central case will be the main scenario used to explore the economic impacts of CAV uptake, with the Central UK lead scenario providing an indication of the impact of a relatively advanced CAV market in the UK. The High case and Low case scenarios will be used to provide an indication of the possible extremes for the economic impacts. The impact of other variable factors, such as the UK’s capabilities in CAV technologies, will also be assessed as part of the economic analysis (see Chapter 4).
TABLE 3.3 Main CAV uptake scenarios used to inform economic analysis.
Scenario Global CAV uptake Relative UK CAV uptake
Central case Central UK European average
Central UK lead Central UK lead
High case Progressive UK lead
Low case Obstructed UK lag
TABLE 3.2 Projected global annual vehicle sales (thousands).
Scenario LDVs (cars and vans) HGVs Buses
2025 2030 2035 2025 2030 2035 2025 2030 2035
Total (including CAVs) 110,000 120,000 130,000 4,000 4,300 4,600 900 1,400 2,200
L3-L5 CAV sales
Progressive11,940 44,600 108,930 470 1,680 4,050 90 470 1,740
Central11,880 25,200 32,240 429 900 1,150 90 290 560
Obstructed220 3,840 10,400 8 140 370 2 40 180
27
Transport Systems Catapult - Market Forecast for Connected and Autonomous Vehicles

Figure 3.10 shows (on the left) the global CAV sales totals in 2035 resulting from each of the global scenarios, and (on the right) the UK CAV sales totals in 2035 for each of the scenarios outlined in Table 3.3. This shows that, across the scenarios, the domestic CAV market is assumed to be ahead of the global market in terms of the transition to higher levels of autonomy, with a much higher share of L4/5 CAV sales relative to L3 CAV sales. Annual L3-L5 CAV sales in the UK in 2035 are predicted to be 1.16 million in the central scenario, but could range from around 0.2 million (Low case), to 3.74 million (High case).
The projected annual UK sales in each of these scenarios are shown for each vehicle type in Table 3.4, with the overall projections of total UK vehicle sales shown for context.
FIGURE 3.10 Global and UK CAV sales scenarios in 2035.
140
120
100
80
60
40
20
0
4.0
3.5
3.0
2.5
2.0
1.5
1.0
0.5
0High Case
Global uptake scenarios UK uptake scenarios
Proj
ecte
d gl
obal
CAV
sal
es in
203
5 (m
illio
ns)
Proj
ecte
d U
K CA
V s
ales
in 2
035
(mill
ions
)
Central (UK Lead)
Central Case Low CaseProgressive Central Obstructed
L3 L4/5
TABLE 3.4 Projected annual vehicle sales in the UK (thousands).
Scenario LDVs (cars and vans) HGVs Buses
2025 2030 2035 2025 2030 2035 2025 2030 2035
Projected total vehicle sales (including CAVs)
3,320 3,490 3,670 55 58 61 10 10 11
L3-L5 CAV sales
High1,510 3,390 3,670 25 58 61 5 10 11
Central790 1,060 1,140 12 16 17 3 4 4
Central, UK lead1,440 1,910 2,130 22 29 31 5 7 7
Low7 72 170 0 1 2 0 0 1
FIGURE 3.9 High and low UK uptake scenarios for L3-L5 CAVs (as a percentage of UK vehicle sales).
UK
sale
s pe
netr
atio
n of
CAV
s
100%
90%
80%
70%
60%
50%
40%
30%
20%
10%
0% 2020 2025 2030 2035
High case
Low case
L3 share
Total L3-L5 CAV share
L3
L4/5
2017
FIGURE 3.8 Central UK uptake scenarios for L3-L5 CAVs (as a percentage of UK vehicle sales).
100%
90%
80%
70%
60%
50%
40%
30%
20%
10%
0%
UK
sale
s pe
netr
atio
n of
CAV
s
2020 2025 2030 2035
Central UK lead
Central case
L3 share
Total L3-L5 CAV share
L3
L3L4/5
L4/5
2017
The UK CAV uptake projections are shown for each of these four scenarios in Figure 3.8 and Figure 3.9.
28
Transport Systems Catapult - Market Forecast for Connected and Autonomous Vehicles
29
Transport Systems Catapult - Market Forecast for Connected and Autonomous Vehicles

Transport Systems Catapult - Market Forecast for Connected and Autonomous Vehicles
3.4 VALUE OF CAV COMPONENTS AND TECHNOLOGIES
METHOD BOX #2: VALUE OF CAVS AND CAV TECHNOLOGIES
Approach:
1) Estimate overall costs of autonomy on a per vehicle basis (i.e. cost of autonomy package). Project these costs over time in accordance with different uptake scenarios.
2) Identify components and the share of the overall package value that is allocated to each component and each CAV technology
3.4.1 Cost of autonomy packages over time
There is likely to be significant variation in the cost of autonomy packages, even at specific levels of autonomy. Therefore, in order to estimate the overall market size, this study aims to use projections of costs and uptake that represent the average or “typical” packages of technologies at L3 and L4/5. These are defined in terms of function and cost below, and in terms of the required components in Section 3.4.2. Further to this, the same autonomy package costs are assumed to apply to all vehicle types (implications are discussed in Section 3.4.3).
Costs at the point of introduction have been taken from Boston Consulting Group’s 2015 study: Revolution in the Driver’s Seat: The Road to Autonomous Vehicles, which also provides the basis for the central global uptake scenario. The study and the estimated costs are informed by a review of the technologies required, interviews with OEMs, suppliers and researchers, and a survey of 1,500 US consumers to identify willingness to pay for various autonomous driving features. While the survey is not necessarily representative of the global market, in the absence of wider-reaching surveys it is a valuable contributing factor to the introductory costs.
The introductory costs of the “typical” L3 package are assumed to correspond to those of one of a specific L3 feature discussed in the Boston Consulting Group (BCG) study, “Highway autopilot with lane changing”. This is likely to be one of the most commonly adopted L3 functions due to its high potential to improve comfort, convenience and safety for drivers. The total cost to the OEM at the point of introduction was estimated at $3,800 (£2,500 at 2015 conversion rates).
The costs of a typical or average L4/L5 package is assumed to correspond to those for the “Fully autonomous vehicle” package considered in the BCG study, which is estimated at $6,500 (£4,300 at 2015 conversion rates). This is intended to encompass the average autonomy package costs per vehicle for the range of autonomous use cases at L4, as well as for fully autonomous vehicles at L5.
31
Transport Systems Catapult - Market Forecast for Connected and Autonomous Vehicles
The autonomy package costs are assumed to apply to all vehicle types in scope. In order to estimate the total turnover from CAVs in each year, further assumptions are needed around the cost trajectories for the vehicles themselves, and also to account for the OEM mark-up on the technology. To translate OEM costs to consumer prices, this study assumes a 50% mark-up on the autonomy packages20. Base vehicle costs are assumed to follow trajectories for representative petrol/diesel vehicles within each category, increasing over time to account for continued improvements in efficiency and performance21. A mark-up of 30% is assumed for the vehicle (exclusive of autonomy package), based on analysis of the available literature22. Table 3.5 shows the resulting prices for vehicles at different levels of autonomy in the central uptake scenario. These prices are used in conjunction with the sales projections to estimate the total market size from CAV sales in each region, which then feeds into the analysis of the economic impacts for the UK.
The BCG study also makes assumptions regarding the relationship between cumulative uptake and cost reduction rates for autonomy packages, based on the observed economies of scale for partially autonomous features. This relationship is equivalent to a learning curve with a learning rate of 90-95%19. Using this approach, cost reductions over time were estimated for the three uptake scenarios considered in this study. Figure 3.11 shows the resulting cost trends at the package level.
FIGURE 3.11 Cost projections for autonomy packages under different uptake scenarios, assuming introductory costs of £2,500 for L3 (conditional autonomy) and £4,300 for L4/5 (full autonomy). Costs in 2015 GBP.
19 Learning curve effect: the cumulative average cost per unit decreases by a fixed percentage each time the cumulative production volume doubles. The percentage cost reduction is
(1 – x), where x is the “learning rate”.20 50% mark-up follows assumptions in (Mosquet et al., 2015).21 Element Energy vehicle cost modelling, as used for work for Transport Scotland and Scottish Enterprise in 2017. Quoted baseline costs based on C segment diesel cars, large rigid
diesel trucks and single deck diesel buses, respectively. 22 Roland Berger (2014) Global Automotive Supplier Study; KPMG (2013) Automotive Now, Trade in crisis; Holweg M & Pil F K (2004) The second century: reconnecting customer and
value chain through build-to-order: moving beyond mass and lean production in the auto industry; Argonne (1999) Evaluation of Electric Vehicle Production and Operating Costs.
5.0
4.5
4.0
3.5
3.0
2.5
2.0
1.5
1.0
0.5
0
Cos
t of a
uton
omy
pack
age
(£k,
201
5)
2015 2020 2025 2030 2035
L3 autonomy package cost projections
Cos
t of a
uton
omy
pack
age
(£k,
201
5)
2025 2030 2035
L4/5 autonomy package cost projections
Progressive Central Obstructed
5.0
4.5
4.0
3.5
3.0
2.5
2.0
1.5
1.0
0.5
0
30 31

Transport Systems Catapult - Market Forecast for Connected and Autonomous Vehicles
TABLE 3.5 Projections of “average” CAV prices for different vehicle types in the central scenario. Prices in 2015 GBP.
3.4.2 Relative value of components for autonomy packages
To estimate the market size and economic impacts relating to the various CAV technologies, the package costs shown in Figure 3.11 are split according to the relative values of the components needed to achieve each level of autonomy. Figure 3.12 shows the estimated breakdown according to a Goldman Sachs Global Investment Research study, based on over twenty interviews with suppliers and industry experts (Archambault et al., 2015). The study estimates the per vehicle value for each component, for each level of autonomy “at scale”. Figure 3.12 displays the estimated value of each component in terms of the percentage share of the total aggregated value. LIDAR is predicted to be by far the most expensive component, and radar and V2X (vehicle connectivity) account for the second and third largest share of the total value at both L3 and L4/5.
FIGURE 3.12 Estimated breakdown of autonomy package costs at the component level. Note that Autonomous Control Systems are assumed to be included within “Embedded controls”23 .
23 (Archambault et al., 2015). Values for ultrasonic and odometry sensors are estimated from the BCG study (Mosquet et al., 2015).
2020 2025 2030 2035
LDVs
Baseline, L0 19,000 18,800 18,800 18,900
L3 22,700 22,600 21,800 21,600
L4/5 - 25,300 25,200 24,100
HGVs
Baseline, L0 93,600 96,700 99,700 101,600
L3 97,400 100,400 102,700 104,300
L4/5 - 103,100 106,100 106,800
Buses
Baseline, L0 147,000 149,700 152,500 154,300
L3 150,700 153,500 155,500 157,000
L4/5 - 156,200 158,900 159,400
100%
90%
80%
70%
60%
50%
40%
30%
20%
10%
0
Shar
e of
pac
kage
val
ue
L3 L4/5
Data security softwareHMIOther electronics & architecturePassive componentsEmbedded modemV2XActuatorsEmbedded controlsUltrasonic sensorsOdemetry sensorsMapping LIDARRadarCameras 11%
14%
28%
7%
7%
12%
7%4%
4%
9%
10%
31%
8%
7%
10%
7%
8%
4%
33
Transport Systems Catapult - Market Forecast for Connected and Autonomous Vehicles
For the purposes of the economic impacts assessment, each component must be assigned to one or more Standard Industrial Classification (SIC) codes. SIC codes denote the type of economic activity that particular businesses relate to, and data on economic indicators such as labour intensity tends to be differentiated using SIC codes. Therefore, by relating each component to a SIC code, the estimated turnover associated with that component can be translated into various economic metrics (this will be discussed in Chapter 4).
Most of the components listed in Figure 3.12 can be clearly mapped to one SIC code (see Appendix B, Table 6.4 and Table 6.5, for the full list). However, some components cannot necessarily be classified under one SIC code, as they are likely to involve significant software aspects as well as the various on-vehicle hardware items, and the existing SIC codes and associated data do not account for this.
For example, the “Mapping” component (as shown in Figure 3.12) will provide the vehicle with geographic positioning data for path planning at a range of distances, and is likely to work alongside sensing suites. In addition to GPS receivers and other hardware, “mapping” is assumed to require on-vehicle software and data processing requirements (e.g. for “machine vision”). Therefore, part of the component value must be allocated to relevant software-related SIC codes, as well as relevant hardware-related SIC codes. This is also assumed to be the case for “embedded controls”, “V2X”, and “HMI” (human machine interface) components. However, the proportions for splitting of value for these components between hardware and software is a key area of uncertainty, as discussed in Section 3.4.3.
One reference point for estimating the per-vehicle value of CAV software is the estimated value of software in premium vehicles released today. According to Manfred Broy, a professor of informatics at Technical University, Munich, up to 6% of the cost of premium cars is accounted for by software development costs (Charette, 2009). Assuming a premium vehicle cost of around £50,000, this indicates that existing software value could be up to £3,000.
The requirements for conditional autonomy and full autonomy have different implications for each of the components identified in Figure 3.12. In some cases, greater complexity or simply a higher number of units will be required for full autonomy, leading to higher costs, but for other components there will be little change in requirements. Table 3.6 shows some examples of the absolute values allocated to particular components at different levels of autonomy, and summarises the rationale behind the differences.
TABLE 3.6 Examples of changes in CAV component value per vehicle between conditional autonomy (L3) and high-full autonomy (L4/5). (Archambault et al., 2015).
Components Value at L3 (at scale)
Value at L4/5 (at scale)
Rationale for difference in value
LIDAR $800 $900 Increase in redundancy requirements for full autonomy (and the resulting increase in complexity) outweighs the cost reductions from learning curve effects.
Cameras $300 $255 Additional camera requirements for L4/5 compared to L3 are minimal or non-existent, and therefore learning curve effects are visible by the time L4/5 reaches scale.
Embedded controls $200 $200 Greater software requirements for full autonomy and more complex sensors to be coordinated, but this is offset by learning achieved at L3.
32 33

This study assumes that total value for the software aspects of autonomy packages is in the same region as for the existing software in premium cars. This is also in line with the price that Tesla customers will reportedly pay to download “Full Self-driving Capability” software24 ($3,000). In the absence of specific data on technology cost reduction rates, this study also assumes that cost reductions are applicable to each technology at the same rate as the overall package, and therefore a given technology will account for a fixed percentage of the overall autonomy package cost.
The implications of this (when considering the estimated overall value for the autonomy packages, as set out in Section 3.4.1) are as follows:
• For L3 CAV autonomy packages (assumed to have lower software requirements), the overall share of value for software has been set to 35%, resulting in a total “introductory” software value of £870 (in 2015).
• For L4/5 CAV autonomy packages (assumed to have higher software requirements) the overall share of value for software has been set to 50%, resulting in a total “introductory” software value of £2,140 (in 2025).
• Figure 3.13 shows the resulting projections for the total per-vehicle cost of hardware and software through time, for the overall cost trajectories implied by the central scenario.
The implications of these assumptions on the value of individual components are summarised in Table 3.7 and Figure 3.14. Table 3.7 shows the assumed share of the total package value by component, at L3 and L4/5. Figure 3.14 shows the implied component costs at the point of introduction and in 2035.
The breakdown at L3 and L4/5 is informed by: a) the component costs quoted by the Goldman Sachs study (see Figure 3.12); b) assumptions around the overall split of hardware and software (see Figure 3.13 and discussion), and c) the estimated relative value of software and hardware for individual components. A full breakdown of these assumptions, and the details of the specific SIC codes allocated to each component, can be found in Appendix B).
FIGURE 3.13 Projections of hardware and software costs for L3 and L4/5 autonomy packages. Each component is assumed to account for a fixed percentage of the overall autonomy package cost.
24 See http://www.theverge.com/2016/10/20/13346512/tesla-self-driving-autonomous-enhanced-autopilot-cost
Cos
t of c
ompo
nent
s (2
015
GB
P)
2015 2020 2025 2030 2035
Costs of L3 components
Hardware Software
3000
2000
1000
0
Cos
t of c
ompo
nent
s (2
015
GB
P)
2025 2030 2035
Costs of L4/5 components
Hardware Software
TABLE 3.7 Assumed share of autonomy package value by component. At L3, 35% of the total value is assumed to be software, and at L4/5 this is assumed to rise to 50%. Assumptions are described in full in Appendix B.
Component Percentage of value at L3 Percentage of value at L4/5
LIDAR 25% 24%
Radar 12% 8%
Cameras 9% 7%
V2X hardware 3% 1%
V2X software 12% 14%
Embedded controls hardware 2% 1%
Embedded controls software 7% 9%
Mapping hardware 2% 1%
Mapping software 6% 9%
Data security software 5% 12%
HMI hardware 2% 2%
HMI software 6% 6%
Actuators 2% 2%
Other electronics & architecture 3% 3%
Odometry sensors 2% 1%
Ultrasonic sensors 0.3% 0.1%
Embedded modem 0.3% 0.3%
Passive components 0.5% 0.7%
Due to the uncertainty in the value ratio for software and hardware, the economic impacts associated with these assumptions are tested as a sensitivity to the central scenario, in Section 4.8. This sensitivity compares the economic impacts resulting from the values used in the main scenarios, to the impacts when a lower total value for software technologies is assumed.
3000
2000
1000
0
34
Transport Systems Catapult The case for government involvement to incentivise data sharing in the UK Intelligent Mobility sectorTransport Systems Catapult - Market Forecast for Connected and Autonomous Vehicles
35
Transport Systems Catapult Exploring the Opportunity for Mobility as a Service in the UKTransport Systems Catapult - Market Forecast for Connected and Autonomous Vehicles

Transport Systems Catapult - Market Forecast for Connected and Autonomous Vehicles
Figure 3.15 shows the resulting aggregated value for each of the CAV technologies (as defined in Section 2.2) in 2035. Sensing and mapping hardware, which includes LIDAR, radar and cameras (amongst others) accounts for the largest value from a single technology.
FIGURE 3.15 Projected costs of autonomy packages by technology in 2035.
FIGURE 3.14 Projected costs of autonomy packages by component in year of introduction and in 2035. At L3, 35% of the total value is assumed to be software, and at L4/5 this is assumed to rise to 50%.
4500
4000
3500
3000
2500
2000
1500
1000
500
0
Proj
ecte
d pa
ckag
e va
lue
by c
ompo
nent
(£, 2
015)
L3 in 2015
Passive componentsEmbedded modemUltrasonic sensorsOdometry sensorsOther electronics & architectureActuatorsHMI hardwareHMI softwareData security softwareMapping hardwareMapping softwareEmbedded controls hardwareEmbedded controls softwareV2X hardwareV2X software CamerasRadarLIDAR617
145121
Costs of autonomy packages by technology 2035
L3 in 2035 L4/5 in 2025 L4/5 in 2035
309
231
295
169
145
323
162121155
1015
394
493
338
288
592
394
263
643
250
312
214184
375
250
167
37
Transport Systems Catapult - Market Forecast for Connected and Autonomous Vehicles
25 Customers will pay around $3,000 for Tesla “Full Self-driving Capability” software to calibrate hardware and activate software. These costs are speculated to cover some hardware
costs as well. This is in addition to the $5,000 option payable for the Enhanced Autopilot system, which is required for anyone wishing to upgrade to “Full Self-driving Capability” at
a later date. See http://www.theverge.com/2016/10/20/13346512/tesla-self-driving-autonomous-enhanced-autopilot-cost.26 Aviation is not a perfect comparison point, but could provide a proxy; upgrade costs for autopilot systems are in the region of $5,000, and systems can cost in excess of $15,000. Much of
this could be software costs. See:https://buy.garmin.com/en-US/US/p/67886 and http://www.avweb.com/news/features/Retrofit-Autopilots-Youll-Pay-For-Precision-225693-1.html27 Up to 6% of the cost of premium cars is accounted for by software development costs (Charette, 2009).28 DfT Table TRA0204 – Road traffic (vehicle kilometres) by vehicle type and road class in Great Britain, annual 2015.
https://www.gov.uk/government/statistical-data-sets/tra02-traffic-by-road-class-and-region-kms
3.4.3 Key areas of uncertainty in cost projections
The projected values for autonomy packages and components presented in this chapter represent the aggregation of data from numerous previous studies of the CAV market, which in turn have involved extensive consultation with industry experts. The values have also been reviewed and approved by several UK experts in this field (including members of CCAV, TSC and AESIN). However, it is important to note several uncertainties in the assumptions made for the purposes of sizing the market, which have implications for the results of the economic analysis presented in Chapter 4.
• A high share of the value of CAV autonomy packages is assumed to be attributable to software and associated economic activities. There is currently a lack of transparent data on the value per vehicle for CAV software (in terms of how it is priced for OEMs and for vehicle users, as well as how much it costs to develop). The assumptions made reflect a range of available evidence, including: the price of software upgrades in Tesla vehicles (enabling certain autonomous capabilities)25; the cost of aviation autopilot systems26; and the software development costs associated with existing premium cars27. As will be shown in Section 4.4, the UK has historically had much higher expertise in software development and implementation, compared to hardware manufacturing, and this trend is likely to continue. As a result, the results of the economic analysis will be particularly sensitive to the assumptions around software share of CAV value. An additional scenario which assumes a lower overall share for software has therefore been considered to provide a sensitivity assessment (see Section 4.8). For the purposes of the study, we also assume that users will only pay for a one off at the start, rather than paying for safety improvement upgrades; it remains unknown whether this will reflect actual future payment models.
• Cost reductions applied at the package level are assumed to be applicable for different components. It is possible that different components reduce in cost at different rates, e.g. due to their parallel use in other industries, or due to different inherent learning rates in manufacture or production. Given the different UK capabilities for the technologies, such differences could have implications for the value of imports and exports, and therefore affect the economic impacts for the UK. In the absence of data for different cost reduction rates, the sensitivity test for the share of value in software and hardware (mentioned above) could provide some indication of the possible effects of differing cost ratios (between components or technologies) in a given year. However, future work could consider exploring different cost reduction rates for CAV technologies, and the implications for the UK.
• The cost of autonomy packages is assumed to be the same for cars, vans, trucks and buses. It is likely that the software and hardware requirements will differ between different vehicle types, according to their different use cases and business models. For example, commercial vehicles (i.e. vans and HGVs) are typically driven on motorways for a much higher proportion of their annual mileage, compared to passenger cars28. As a result, L3 and L4 autonomy packages for commercial vehicles may be particularly targeted towards motorway driving, and the relative simplicity of motorway driving may mean that sensor and software requirements for “average” autonomy packages for these vehicles could be lower than those for cars. However, there is currently little evidence available for direct comparison of these requirements between different vehicle types. Fortunately, the impact of differentiating the associated costs is likely to be low, due to the market dominance of car sales compared to other vehicle types (in 2035, of the 34 million projected CAVs global sales in the central case, 32 million are cars).
36
3000
2500
2000
1500
1000
500
0
Proj
ecte
d pa
ckag
e va
lue
by te
chno
logy
(GB
P 20
15)
L3 L4/5
HMI softwareMapping & path planning softwareControl systems softwareData security softwareConnectivity / V2X softwareSafety-related HMI hardwareSensor-supporting hardwareConnectivity hardwareControl systems and computing hardwareSensing & local mapping hardware
665
155
Costs of autonomy packages by technology 2035
1088
375
312
250
250
167
37

3.5 PROJECTED MARKET SIZE FOR CAVS AND CAV TECHNOLOGIES
Total market values for CAVs and CAV technologies were calculated as follows:
3.5.1 Size of the UK market
The size of the UK CAV market and the UK CAV technology market are shown in Figure 3.16 and Figure 3.17 respectively, for the central scenario and the central UK lead scenario. In the central scenario, the UK CAV market is worth £28 billion in 2035, and the UK CAV technology market is worth £2.7 billion in 2035. In the central UK lead scenario (where uptake in the UK is ahead of the rest of Europe), in 2035 the UK CAV market is worth £52 billion, and the UK CAV technology market is worth £5.2 billion. The high and low bounds for the size of these markets are shown in Table 3.8.
• By the time L3 CAVs are introduced, LIDAR costs are assumed to have dramatically reduced compared to current costs. LIDAR is still developing as a technology, and costs would need to reduce to fractions of most current industry estimates, by the time L3 CAVs are introduced, in order to reflect the LIDAR costs used in this study. These assumptions are mirrored in previous studies; the implied position is that although LIDAR is likely to be a requirement for high levels of autonomy, costs must be sufficiently reduced to enable the cost of autonomy to be palatable to customers. LIDAR costs are the largest single contribution to the autonomy package costs, for both L3 and L4/5. Based on historic expertise, the UK has relatively weak capabilities in this area of manufacture, and therefore a higher LIDAR cost could reduce the economic benefits of the CAV sectors for the UK, assuming that UK capabilities are not strengthened, relative to those of other regions. However, it should also be noted that there is still some debate amongst CAV developers as to whether LIDAR will definitely be required for all CAV use cases (e.g. it may not be essential for motorway driving). If cheaper alternatives to LIDAR are proven to be effective, this could have implications for overall costs and the rate of CAV uptake; however, the current consensus seems to be that LIDAR is likely to be required for the majority of use cases and vehicle types.
FIGURE 3.17 Projected market value from CAV technology sales, based on UK CAV demand. Values shown are based on the projected sales of L3-L5 cars, vans and HGVs in the specific years shown (i.e. not cumulative). Based on uptake scenarios set out in Section 3.3, p10.
KEY ASSUMPTIONS
Overall UK vehicle sales are assumed to increase from current levels by approximately 1% each year.
Central case: L3-L5 CAV uptake in the UK and Europe reaches 31% of total sales by 2035.
Central - UK lead: UK CAV adoption is more rapid than in the rest of Europe due to highly supportive regulatory and testing environment. In the UK, L3-L5 CAV uptake reaches 58% of total sales by 2035.
0.6
0.5
0.4
0.3
0.2
0.1
0
Mar
ket v
alue
from
UK
CAV
tech
nolo
gy s
ales
(£bn
., 20
15)
2020 2025 2030 2035
0.5
0.8
1.3
3.1
2.2
4.4
2.7
5.2
Central case Central - UK lead
FIGURE 3.16 Projected market value from CAV sales in the UK.
Values shown are based on the projected sales of L3-L5 cars, vans and HGVs in the specific years shown (i.e. not cumulative). Based on uptake scenarios set out in Section 3.3, p10.
KEY ASSUMPTIONS
Overall UK vehicle sales are assumed to increase from current levels by approximately 1% each year.
Central case: L3-L5 CAV uptake in the UK and Europe reaches 31% of total sales by 2035.
Central - UK lead: UK CAV adoption is more rapid than in the rest of Europe due to highly supportive regulatory and testing environment. In the UK, L3-L5 CAV uptake reaches 58% of total sales by 2035.
60
50
40
30
20
10
0
Mar
ket v
alue
from
UK
CAV
sal
es (£
bn.,
2015
)
2020 2025 2030 2035
6
9
19
35
25
46
28
52
Central case Central - UK lead
CAV market value = Sum across vehicle types: (CAV sales x CAV cost to consumer)
CAV technology market value = Sum across vehicle types: (CAV sales x technology cost to OEM)
38
Transport Systems Catapult - Market Forecast for Connected and Autonomous Vehicles
39
Transport Systems Catapult - Market Forecast for Connected and Autonomous Vehicles
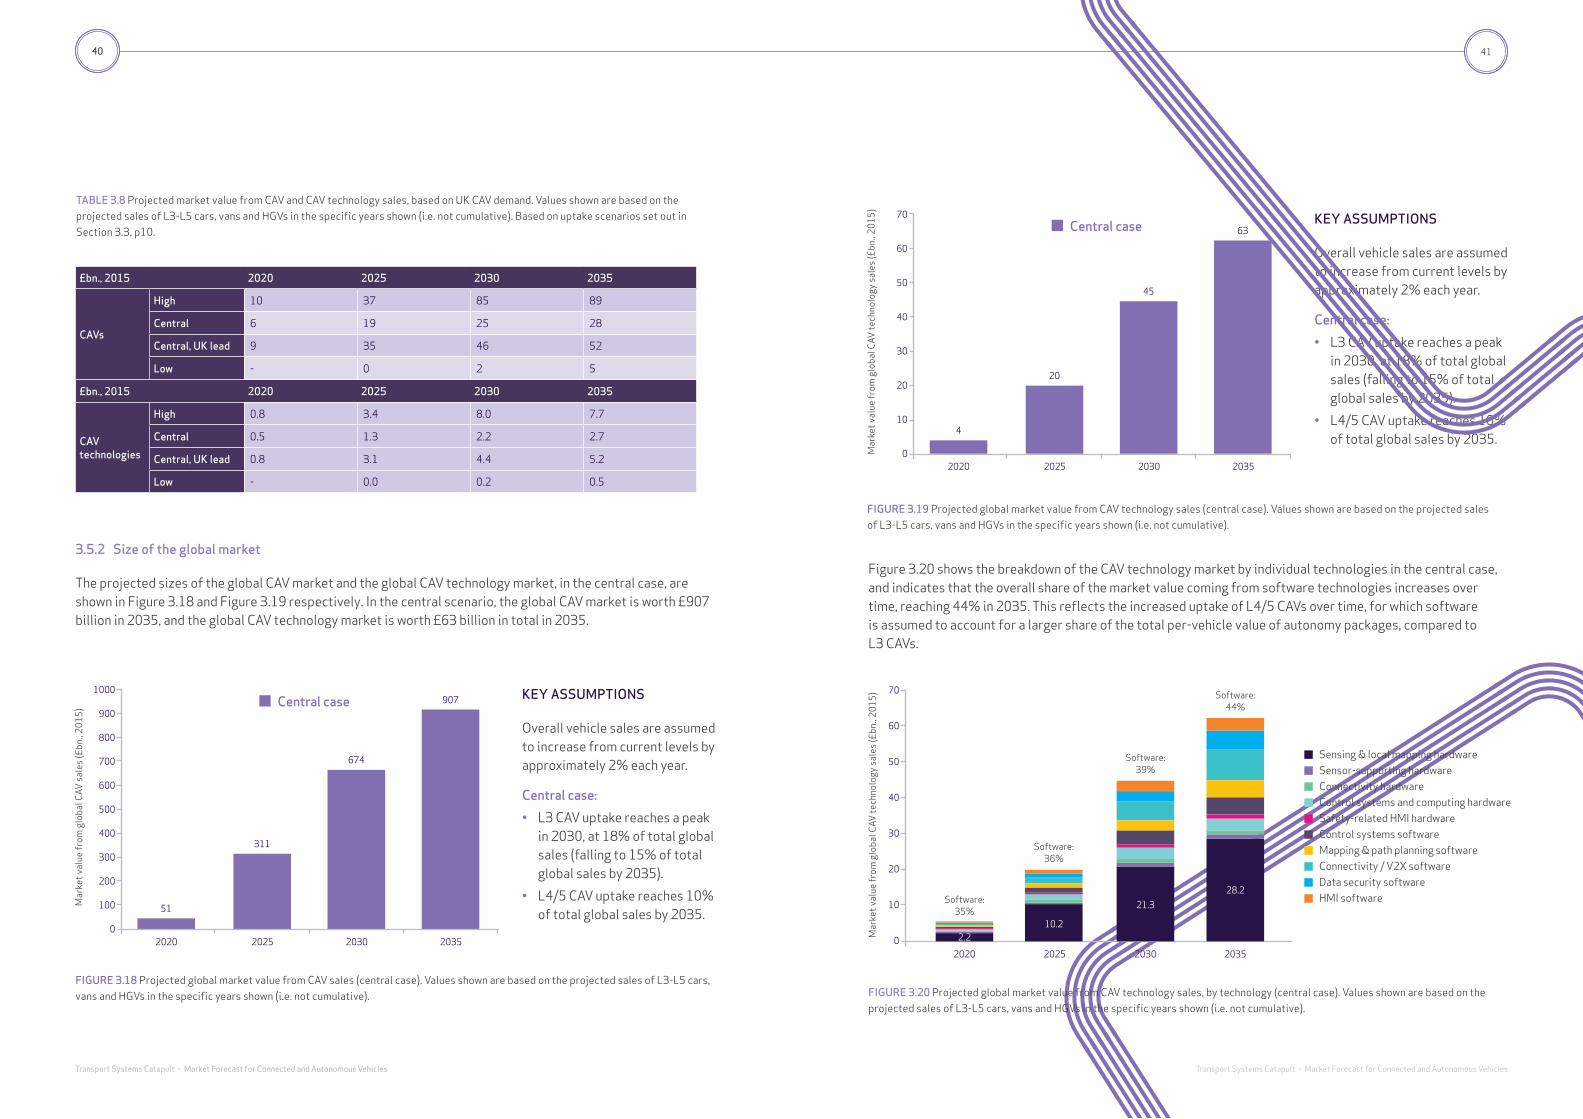
3.5.2 Size of the global market
The projected sizes of the global CAV market and the global CAV technology market, in the central case, are shown in Figure 3.18 and Figure 3.19 respectively. In the central scenario, the global CAV market is worth £907 billion in 2035, and the global CAV technology market is worth £63 billion in total in 2035.
FIGURE 3.18 Projected global market value from CAV sales (central case). Values shown are based on the projected sales of L3-L5 cars, vans and HGVs in the specific years shown (i.e. not cumulative).
40
Transport Systems Catapult - Market Forecast for Connected and Autonomous Vehicles
KEY ASSUMPTIONS
Overall vehicle sales are assumed to increase from current levels by approximately 2% each year.
Central case:
• L3 CAV uptake reaches a peak in 2030, at 18% of total global sales (falling to 15% of total global sales by 2035).
• L4/5 CAV uptake reaches 10% of total global sales by 2035.
1000
900
800
700
600
500
400
300
200
100
0
Mar
ket v
alue
from
glo
bal C
AV s
ales
(£bn
., 20
15)
2020 2025 2030 2035
51
311
674
907Central case
FIGURE 3.19 Projected global market value from CAV technology sales (central case). Values shown are based on the projected sales of L3-L5 cars, vans and HGVs in the specific years shown (i.e. not cumulative).
KEY ASSUMPTIONS
Overall vehicle sales are assumed to increase from current levels by approximately 2% each year.
Central case:
• L3 CAV uptake reaches a peak in 2030, at 18% of total global sales (falling to 15% of total global sales by 2035).
• L4/5 CAV uptake reaches 10% of total global sales by 2035.
70
60
50
40
30
20
10
0Mar
ket v
alue
from
glo
bal C
AV te
chno
logy
sal
es (£
bn.,
2015
)
2020 2025 2030 2035
4
20
45
63Central case
41
Transport Systems Catapult - Market Forecast for Connected and Autonomous Vehicles
Figure 3.20 shows the breakdown of the CAV technology market by individual technologies in the central case, and indicates that the overall share of the market value coming from software technologies increases over time, reaching 44% in 2035. This reflects the increased uptake of L4/5 CAVs over time, for which software is assumed to account for a larger share of the total per-vehicle value of autonomy packages, compared to L3 CAVs.
FIGURE 3.20 Projected global market value from CAV technology sales, by technology (central case). Values shown are based on the projected sales of L3-L5 cars, vans and HGVs in the specific years shown (i.e. not cumulative).
70
60
50
40
30
20
10
0
Mar
ket v
alue
from
glo
bal C
AV te
chno
logy
sal
es (£
bn.,
2015
)
2020
Sensing & local mapping hardwareSensor-supporting hardwareConnectivity hardwareControl systems and computing hardwareSafety-related HMI hardwareControl systems softwareMapping & path planning softwareConnectivity / V2X softwareData security softwareHMI software
2.2
2025 2030 2035
Software: 35%
10.2
Software: 36%
21.3
Software: 39%
28.2
Software: 44%
TABLE 3.8 Projected market value from CAV and CAV technology sales, based on UK CAV demand. Values shown are based on the projected sales of L3-L5 cars, vans and HGVs in the specific years shown (i.e. not cumulative). Based on uptake scenarios set out in Section 3.3, p10.
£bn., 2015 2020 2025 2030 2035
CAVs
High 10 37 85 89
Central 6 19 25 28
Central, UK lead 9 35 46 52
Low - 0 2 5
£bn., 2015 2020 2025 2030 2035
CAV technologies
High 0.8 3.4 8.0 7.7
Central 0.5 1.3 2.2 2.7
Central, UK lead 0.8 3.1 4.4 5.2
Low - 0.0 0.2 0.5
40
Transport Systems Catapult The case for government involvement to incentivise data sharing in the UK Intelligent Mobility sectorTransport Systems Catapult - Market Forecast for Connected and Autonomous Vehicles
41

Transport Systems Catapult - Market Forecast for Connected and Autonomous Vehicles
Putting these projections for the global CAV market in context, according to a 2016 McKinsey report, the traditional automotive market (i.e. car sales and aftermarket products and services) was worth USD 3,500 billion (around GBP £2,300 billion) in 2015, with a predicted value of USD 5,200 billion (around GBP £3,500 billion) by 2030 (McKinsey & Stanford University, 2016). As such, the scale of the predicted CAV market size is in keeping with McKinsey’s projections. A recent estimate by Intel indicated that “the driverless market” could be worth as much as USD 70bn (around £55bn at 2017 exchange rates) by 2030. This estimate is assumed to represent the market associated with CAV technologies (rather than the total CAV market, which inherently overlaps with the existing automotive market) in which case it is well aligned with the results presented in this report.
The projected market values, both at the global and regional level, inform the assessment of the economic impacts of CAV market for the UK economy. These impacts are presented and discussed in Chapter 4.
43
4. ECONOMIC IMPACTS FOR THE UK
4.1 SUMMARY OF FINDINGS
• The objective of the analysis presented in this chapter is to estimate the gross contribution of CAVs and CAV technologies to key economic indicators for the UK. The focus is on the gross contribution to GVA and jobs, but estimates of the contribution to gross output, trade and investment are also included. Whilst jobs relating to the manufacture of CAVs will displace jobs in the manufacture of conventional cars, jobs relating to the production of CAV technologies are net additional. All results are presented as annual figures, providing a snapshot in selected years.
• Estimates were carried out across the full range of scenarios. The central scenario assumes moderate CAV uptake and is the main scenario used to explore the economic impacts, with the central UK lead scenario providing an indication of the impact of a relatively advanced CAV market in the UK. The High scenario and Low scenario provide an indication of the possible extremes for the economic impacts. The High scenario with high UK capabilities is the most optimistic variant, where it is assumed that UK and global markets grow rapidly and that UK firms are highly competitive in the manufacture of CAVs and CAV technologies.
• In the central scenario, it is estimated that the gross direct contribution of CAV and CAV technologies to UK GVA would reach £6.9bn and £1.2bn, respectively, by 2035. In this scenario, it was estimated that jobs in the manufacture and assembly of CAVs would reach 6,400 people in 2020 and 27,400 by 2035. This compares to around 151,000 people who are currently employed in the UK automotive sector29. There would be 6,000 net additional direct jobs in the production of CAV technologies in the UK by 2035, with a further 3,900 indirect jobs created in the supply chain for these technologies.
• If the size of the UK market for CAVs grew at a faster rate than in the central scenario, then the UK could attract further inward investment, as firms would be incentivised to develop CAV technologies in the UK, close to the expected market. In the central UK lead scenario, the gross contribution of manufacturing CAVs and CAV-enabling technologies to UK GVA in 2035 is estimated to be £9.5bn and £2.1bn, respectively. Around 37,600 jobs could be created in the production and assembly of the CAVs, with 10,200 net additional jobs in the production of CAV enabling technologies and a further 6,500 indirect jobs created in the supply chain for CAV technologies.
Transport Systems Catapult - Market Forecast for Connected and Autonomous Vehicles
29 Office for National Statistics (2016), “JOBS03: Employee jobs by industry”. Available at:
https://www.ons.gov.uk/employmentandlabourmarket/peopleinwork/employmentandemployeetypes/datasets/employeejobsbyindustryjobs03
TABLE 3.9 Projected market value from CAV and CAV technology sales, based on global CAV demand. Values shown are based on the projected sales of L3-L5 cars, vans and HGVs in the specific years shown (i.e. not cumulative). Based on uptake scenarios set out in Section 3.3, p10.
£bn., 2015 2020 2025 2030 2035
CAVs
High 56 332 1,225 2,999
Central 51 311 674 907
Central, UK lead 54 327 695 931
Low - 6 104 297
£bn., 2015 2020 2025 2030 2035
CAV technologies
High 4.7 22.7 79.1 172.4
Central 4.3 20.3 44.6 63.2
Central, UK lead 4.6 22.0 46.9 65.7
Low - 0.6 8.5 25.9
The high and low bounds for the size of these markets are shown in Table 3.9, alongside the central and central UK lead scenarios. Note that the increase for the central UK lead scenario, compared to the central scenario, comes from the growth in the UK market (market growth in the other regions is assumed to be the same across these two scenarios).
42 43

• The results presented in this chapter are dependent on the assumptions underpinning the market forecasts (as described in Chapter 3). In addition, it is assumed that the trade intensity for CAVs and CAV technologies are the same as those observed in the historical data for similar technologies. This implies that the UK manufacturing sector maintains its current position in terms of relative global capabilities in the automotive sector and in component manufacturing.
• The UK’s strengths and competitiveness in software design and development puts UK firms in a strong position to capture a large share of the domestic (and global) market for high value-added CAV-related software. However, it is likely that much of the CAV-related hardware (in particular, sensing and mapping hardware) would be imported from abroad. Existing electronics and component manufacturing capabilities in other markets, and relatively high labour costs in the UK, mean that it would be very challenging for the UK to gain a significant share of the global market for manufacturing CAV hardware.
TABLE 4.1 Key economic results for each scenario, relating to the manufacture of CAVs.
TABLE 4.2 Key economic results for each scenario relating to the manufacture of CAV technologies.
Economic impacts for CAVs 2020 2025 2030 2035
Low scenario Direct GVA (£bn) - 0.0 0.6 1.8
Direct Jobs - 300 3,000 7,100
Central scenario Direct GVA (£bn) 0.9 3.4 5.6 6.9
Direct Jobs 6,400 19,900 26,800 27,400
Central UK lead scenario
Direct GVA (£bn) 1.2 5.1 7.8 9.5
Direct Jobs 8,600 29,800 37,400 37,600
High scenario Direct GVA (£bn) 1.3 5.4 14.1 22.3
Direct Jobs 9,200 31,200 67,900 88,800
High scenario with high UK capabilities
Direct GVA (£bn) 2.3 9.1 23.7 36.1
Direct Jobs 15,800 53,100 113,900 143,600
Economic impacts for CAV technologies 2020 2025 2030 2035
Low scenario Direct GVA (£bn) - 0.01 0.08 0.27
Direct Jobs - 100 600 1,500
Central scenario Direct GVA (£bn) 0.2 0.5 0.9 1.2
Direct Jobs 1,500 3,400 5,400 6,000
Central UK lead scenario
Direct GVA (£bn) 0.2 1.0 1.6 2.1
Direct Jobs 2,100 7,300 9,700 10,200
High scenario Direct GVA (£bn) 0.3 1.2 3.0 3.3
Direct Jobs 2,100 8,200 17,900 17,000
High scenario with high UK capabilities
Direct GVA (£bn) 0.4 1.6 4.0 4.3
Direct Jobs 3,500 12,500 26,400 25,000
• There is considerable uncertainty in the gross economic contribution of CAV and CAV technologies over the period to 2035, primarily due to uncertainty in growth in the market for CAVs in the UK. In the high scenario, where it is assumed that both the UK and global market grows rapidly (with UK CAV market growth of around 16% pa over the period 2020-2035), the contribution to GVA of activities relating to CAV and CAV technologies could be as much as £26bn, with around 106,000 jobs by 2035 (including production of both CAVs and CAV technologies). In a the more pessimistic, low scenario, where the UK and global market for CAVs remain small (<£10bn in the UK and <£460bn globally by 2035), the gross economic contribution of CAV and CAV technologies would be much lower, with an estimated £2.1bn gross contribution to GVA and around 8,600 direct jobs in the manufacture of CAVs and CAV technologies by 2035.
• The economic impact is also highly dependent on the UK’s capabilities in producing CAVs and CAV-enabling technologies. If the UK market grows quickly and if UK-based firms are well-supported (for example, with access to skilled labour), this could incentivise firms to locate production in the UK (close to expected markets and where business conditions are favourable). In this case, CAV-related gross output and jobs in the UK would grow at a faster rate and dependency on imports would be reduced. A high UK capabilities sensitivity was introduced to test how the economic results would be affected if it was assumed that the UK was more competitive in CAV-related industries than is implied by historical trade shares for similar technologies). In the most optimistic scenario and sensitivity combination for the UK, the high scenario with high UK capabilities, by 2035, as well as an expected 143,600 direct jobs in the automotive sector for CAV assembly and manufacture, there is estimated to be 25,000 net additional CAV technology jobs created in the UK.
• The robustness of the results to differences in assumptions about software requirements for CAV technologies were also tested. If the software value was 30% lower than the values used in the central scenario, this would result in a 15% reduction in the GVA and number of jobs in the UK, compared to the results for the central scenario.
44
Transport Systems Catapult The case for government involvement to incentivise data sharing in the UK Intelligent Mobility sectorTransport Systems Catapult - Market Forecast for Connected and Autonomous Vehicles
45
Transport Systems Catapult Exploring the Opportunity for Mobility as a Service in the UKTransport Systems Catapult - Market Forecast for Connected and Autonomous Vehicles

Transport Systems Catapult - Market Forecast for Connected and Autonomous Vehicles
30 KPMG (2015)
4.2 SCOPE OF ECONOMIC IMPACT ANALYSIS
The purpose of the economic analysis was to estimate the gross contribution of CAVs and CAV-related technologies to key economic indicators in the UK, including:
• Gross output (the total value of production of CAVs and CAV technologies in the UK)
• Gross Value Added (GVA, the net contribution of CAV-related industries to the UK economy)
• Direct and indirect employment (the total number of jobs in manufacturing CAVs, CAV technologies and associated supply chains)
• Trade (the value of imports and exports of CAVs and CAV technologies)
• Investment (the value of domestic and foreign investment in fixed capital assets to support the production of CAVs and CAV technologies)
The economic analysis is informed by the market forecasts that were presented in Chapter 3. The focus of the economic analysis is on the gross contribution of manufacturing CAVs and CAV-enabling technologies in the UK, i.e. displaced activities in vehicle manufacturing are not measured. The wider economic impacts of a transition to CAV technologies or potential new business models are not estimated. Changes in use of vehicles, potential new services offered and productivity or welfare improvements from more efficient use of travelling time are not accounted for. Furthermore, the estimates do not include the effect of the transition to CAVs in potentially reducing demand for other technologies and services, nor the impact on conventional taxi services or vehicle insurance. The results from our analysis differ to those presented in other studies such as KPMG (2015)30 because wider economic impacts, including the value of time savings, are not estimated for the purposes of this report, which focuses solely on the potential economic contribution of CAV-related manufacturing industries.
All results presented in this chapter show the annual contribution of CAV-related industries to the UK economy in selected ‘snapshot’ years: 2020, 2025, 2030 and 2035 (although this is cumulative, in that jobs created in each year are assumed to exist in later years as part of the total). In all scenarios, the size of CAV-related industries and their contribution to the economy increases over the period to 2035, reflecting expected growth in the market for CAVs.
Figure 4.1 below provides an overview of the key economic impacts that are within scope and beyond the scope of the economic analysis presented in this chapter.
47
Transport Systems Catapult - Market Forecast for Connected and Autonomous Vehicles
The economic assessment involved both qualitative and quantitative analysis. A literature and data review was undertaken to identify key characteristics of CAV technologies and services, to assess the UK’s likely competitiveness in this sector and to consider how increased demand for these products and services could develop UK-based supply chains. This information was used to estimate the impacts of each of the CAV scenarios on key economic indicators.
The predominantly data-driven approach involved mapping the production of CAV-enabling technologies to relevant economic activities, as represented in the UK Standard Industrial Classification (SIC) 2007 codes (SIC07). The technology mapping is described in Appendix D.
FIGURE 4.1 Scope of the economic analysis.
Within scopeContribution of CAV–related manufacturing and software industries to:
• Gross output• GVA• Employment• Trade• Investment
Outside of scope
Travel time reliability Productivity
improvements
Impact on traffic flows
Road network efficiency
Impacts of new business
models
Effects on consumer
welfare
Environmental impacts
Impacts on existing
industries eg. insurance,
road transport services
Impact on travel demand
Safety
Freight efficiency
Value of time estimates
46 47
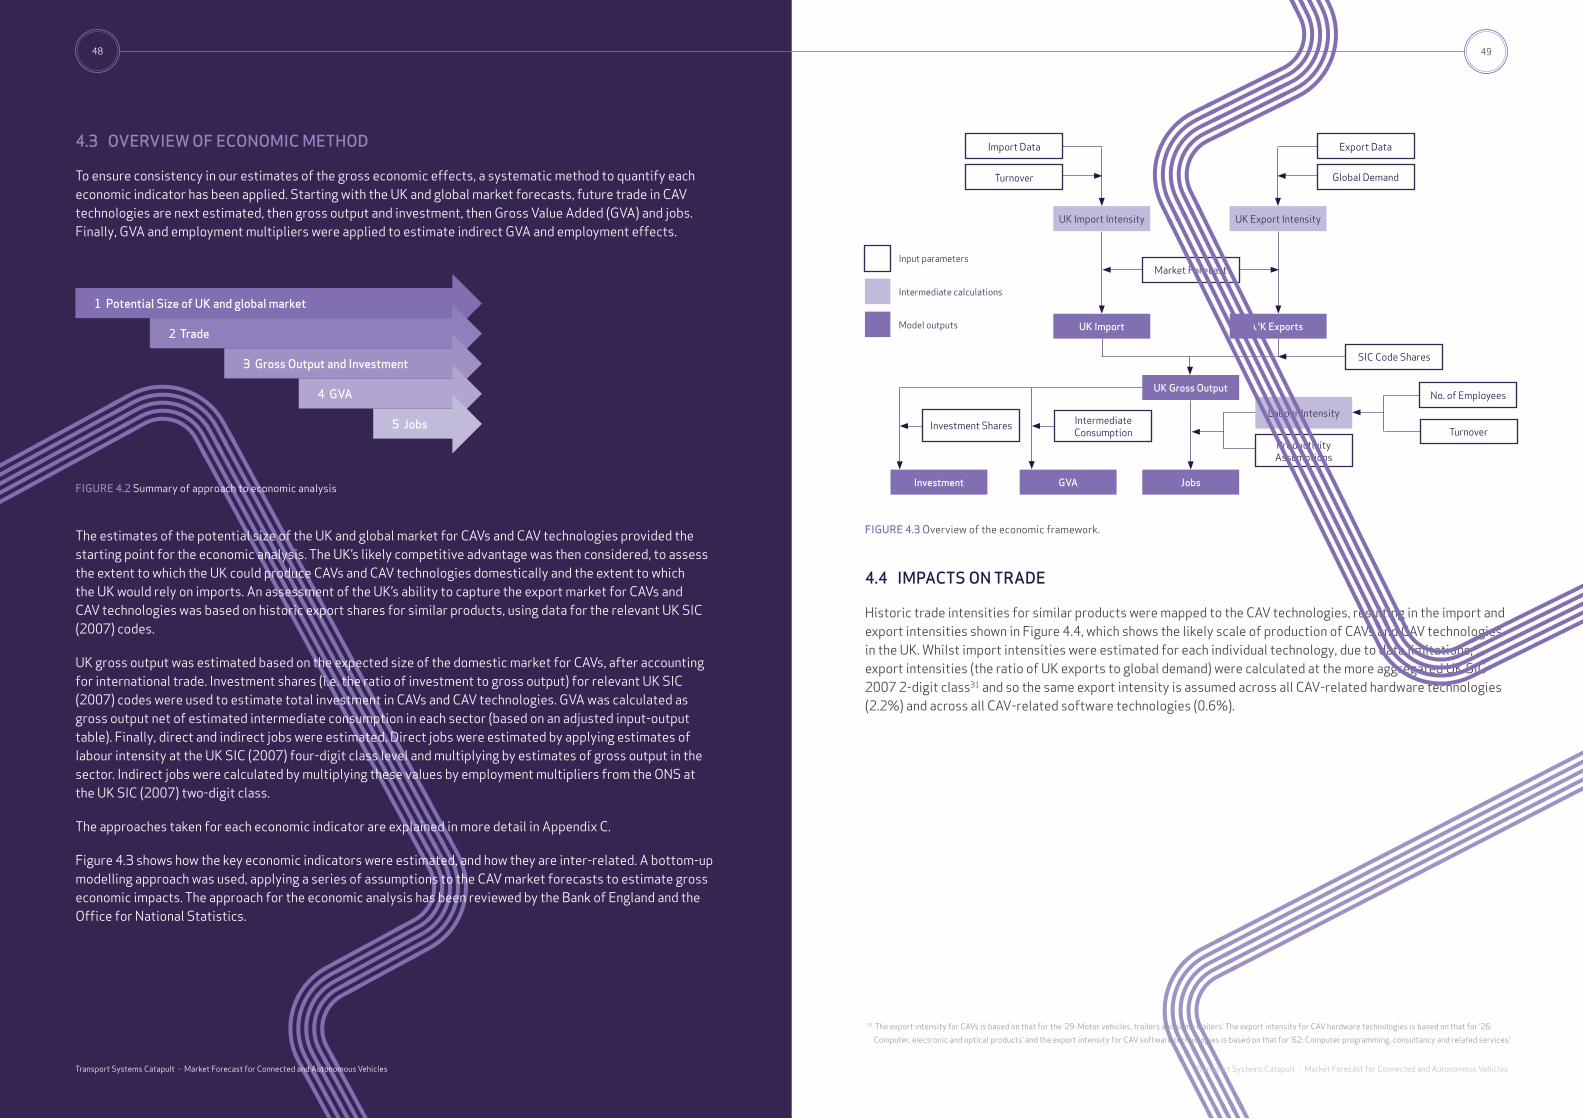
FIGURE 4.2 Summary of approach to economic analysis
4.3 OVERVIEW OF ECONOMIC METHOD
To ensure consistency in our estimates of the gross economic effects, a systematic method to quantify each economic indicator has been applied. Starting with the UK and global market forecasts, future trade in CAV technologies are next estimated, then gross output and investment, then Gross Value Added (GVA) and jobs. Finally, GVA and employment multipliers were applied to estimate indirect GVA and employment effects.
The estimates of the potential size of the UK and global market for CAVs and CAV technologies provided the starting point for the economic analysis. The UK’s likely competitive advantage was then considered, to assess the extent to which the UK could produce CAVs and CAV technologies domestically and the extent to which the UK would rely on imports. An assessment of the UK’s ability to capture the export market for CAVs and CAV technologies was based on historic export shares for similar products, using data for the relevant UK SIC (2007) codes.
UK gross output was estimated based on the expected size of the domestic market for CAVs, after accounting for international trade. Investment shares (i.e. the ratio of investment to gross output) for relevant UK SIC (2007) codes were used to estimate total investment in CAVs and CAV technologies. GVA was calculated as gross output net of estimated intermediate consumption in each sector (based on an adjusted input-output table). Finally, direct and indirect jobs were estimated. Direct jobs were estimated by applying estimates of labour intensity at the UK SIC (2007) four-digit class level and multiplying by estimates of gross output in the sector. Indirect jobs were calculated by multiplying these values by employment multipliers from the ONS at the UK SIC (2007) two-digit class.
The approaches taken for each economic indicator are explained in more detail in Appendix C.
Figure 4.3 shows how the key economic indicators were estimated, and how they are inter-related. A bottom-up modelling approach was used, applying a series of assumptions to the CAV market forecasts to estimate gross economic impacts. The approach for the economic analysis has been reviewed by the Bank of England and the Office for National Statistics.
1 Potential Size of UK and global market
2 Trade
3 Gross Output and Investment
4 GVA
5 Jobs
FIGURE 4.3 Overview of the economic framework.
4.4 IMPACTS ON TRADE
Historic trade intensities for similar products were mapped to the CAV technologies, resulting in the import and export intensities shown in Figure 4.4, which shows the likely scale of production of CAVs and CAV technologies in the UK. Whilst import intensities were estimated for each individual technology, due to data limitations, export intensities (the ratio of UK exports to global demand) were calculated at the more aggregated UK SIC 2007 2-digit class31 and so the same export intensity is assumed across all CAV-related hardware technologies (2.2%) and across all CAV-related software technologies (0.6%).
31 The export intensity for CAVs is based on that for the ’29: Motor vehicles, trailers and semi-trailers’. The export intensity for CAV hardware technologies is based on that for ’26:
Computer, electronic and optical products’ and the export intensity for CAV software technologies is based on that for ’62: Computer programming, consultancy and related services’.
UK Gross Output
JobsGVAInvestment
UK Import UK Exports
Market Forecast
Intermediate Consumption
Investment Shares Turnover
No. of Employees
SIC Code Shares
Export Data
Global DemandTurnover
Import Data
UK Export IntensityUK Import Intensity
Productivity Assumptions
Labour Intensity
Input parameters
Intermediate calculations
Model outputs
48
Transport Systems Catapult - Market Forecast for Connected and Autonomous Vehicles
49
Transport Systems Catapult - Market Forecast for Connected and Autonomous Vehicles

4.4.1 Imports
Focusing firstly on imports, the assumed UK capabilities for the manufacture of CAVs (i.e. the vehicle assembly) are reflective of current trends in the automotive sector32, with 44% of domestic demand met by imports. The CAV hardware technologies are also represented by relatively high import intensities (between 40% and 90%), as historical trade data for similar technologies suggest that other countries face lower manufacturing costs (i.e. are more competitive) than in the UK.
By contrast, the data suggests that the UK is likely to have higher relative capabilities in the development of CAV-related software, reflecting strong international competitiveness in the high value-added services and knowledge-based sectors. For software, lower import intensities of between 5% and 7% are assumed. As software development and production is a high value added activity, the fact that the UK is likely to have relative strengths in this area would create larger GDP gains for the UK (for each unit produced, there are relatively high margins and high labour costs, with little value flowing out of the economy in the form of raw material imports).
Figure 4.5 shows the projected impacts of CAV market growth scenarios on UK imports of the connected and autonomous vehicles themselves (in the chart on the left) and technologies that enable automation (in the chart on the right). In the central scenario, imports of CAVs are estimated to grow year-on-year in line with growth in the UK market for CAVs, with an estimated £17bn worth of CAVs imported in 2035. This compares to £42bn33 of imports of motor vehicles to the UK in 2016. In the central scenario imports of CAV technologies are expected to reach £1.4bn by 2035.
32 Eurostat Comext database, ONS International Trade in Services statistics and the OECD STAN database.33 ONS (2016) “UK Trade in goods by classification of product by activity times series dataset”
FIGURE 4.4 Import and export intensities for CAV and CAV technologies.
In the central UK lead scenario, more rapid growth in domestic demand for CAVs leads to stronger growth in imports of CAVs and CAV technologies. In this scenario imports of CAVs reach £32bn in 2035, and imports of CAV technologies reach £2.6bn in the same year.
Over the 2030-2035 period, there is a slowdown in the rate of growth in imports of CAV-related technologies in both the central and central UK lead scenarios, due to two key factors. Firstly, by 2030, there is a large reduction in CAV-related technology costs compared to current levels. Secondly, there is a difference in the types of technologies that are imported, as the market transitions from L3 to L4/L5 CAVs. By 2030, the market for CAV hardware technology has matured enough to meet the requirements of L3 autonomous vehicles. Once L3 has been achieved the focus switches to producing L4/L5 vehicles, which are assumed to have a relatively higher software value, compared to L3 vehicles (as discussed in Section 3.4.2). This results in a reduction to the sensing and mapping hardware market, and an increase in software market value. With sensing and local mapping hardware contributing to 78% of total imports, and strong domestic capabilities in CAV software, this is a key factor in explaining the slowdown in growth of imports of CAV technologies between 2030 and 2035.
FIGURE 4.5 UK imports of CAV and CAV technologies, by scenario.
As shown in Figure 4.6, across all years and in all scenarios, UK imports of CAV technologies are dominated by ‘Sensing & local mapping hardware’. The value of the market for this technology is relatively high (accounting for around 50% of the market for all CAV technologies) and it is assumed that the UK has relatively weak capabilities in this type of manufacturing, which explains its heavy dependence on imports.
KEY ASSUMPTIONS
Imports are calculated as a share of estimated UK sales of CAVs and CAV technologies. We assume 40% of CAVs will be imported, 40-80% of CAV hardware technologies will be imported and less than 10% of CAV software technologies will be imported (based on historical import shares for similar technologies).
Central case Central - UK lead
35
30
25
20
15
10
5
0
UK
Impo
rts
of C
AVs
(£bn
, 201
5)
2020
3.6
2025 2030 2035
5.4
11.3
21.1
15.4
28.3
17.1
32.0
3.0
2.5
2.0
1.5
1.0
0.5
0.0UK
Impo
rts
of C
AV te
chno
logi
es (£
bn, 2
015)
2020 2025 2030 2035
0.3
0.5
1.7
2.3
2.6
0.8
1.2
1.4
KEY ASSUMPTIONS
Import and export intensity assumptions for CAVs and CAV technologies are based on historical trade shares for similar existing products.
100%
90%
80%
70%
60%
50%
40%
30%
20%
10%
0
44%
Import Intensity(share of imports in total domestic supply)
Export Intensity(share of UK exports in global demand)
2.4%
40%36%
2.2% 2.2% 2.2% 2.2% 2.2% 0.6% 0.6% 0.6% 0.6% 0.6%
84%
52%
41%
5% 6% 6% 6% 5%
CAV Sensing & local mapping
hardware
Sensor-supporting hardware
Connectivity hardware
Control systems and
computing hardware
Safety- related HMI
hardware
Control systems software
Mapping & path
planning software
Connectivity / V2X software
Data security software
HMI software
100%
90%
80%
70%
60%
50%
40%
30%
20%
10%
0
Impo
rt In
tens
ity
(sha
re o
f im
port
s in
tota
l dom
esti
c su
pply
) Export Intensity (share of UK exports in global dem
and)
50
Transport Systems Catapult - Market Forecast for Connected and Autonomous Vehicles
51
Transport Systems Catapult - Market Forecast for Connected and Autonomous Vehicles

4.4.2 Exports
Export shares (the ratio of UK exports to global demand) for CAVs and CAV technologies were estimated at between 0% and 3% based on historical export shares for similar technologies, using SIC07 code mapping. Out of the four world regions, Europe accounts for the largest share of UK exports, as the UK’s closest neighbouring region. The outcome of negotiations on the future trade relationship with the EU will largely determine the extent to which the UK could expect to continue exporting such high shares of these technologies to the rest of Europe. At the time of publication, with limited information on the form of the future trade relationship between then UK and the EU and other global regions, we assume that the UK continues to capture the same share of the EU and global export markets for these types of technology.
The central and central UK lead scenarios both show the same increase in exports over the projection period (see Figure 4.7). This is because demand for CAVs in regions outside of the UK is assumed to be the same in both scenarios. By 2035, we estimate that exports of CAVs will reach £15bn and there will be a further £0.2bn of exports of CAV-related technologies from the UK.
FIGURE 4.6 UK imports by technology, central scenario.
1.6
1.4
1.2
1.0
0.8
0.6
0.4
0.2
0.0
Impo
rts
of e
ach
CAV
tech
nolo
gy (£
bn, 2
015)
2020
HMI software Data security softwareConnectivity / V2X softwareMapping & path planning softwareControl systems software Safety-related HMI hardwareControl systems and computing hardwareConnectivity hardwareSensor-supporting hardwareSensing & local mapping hardware
2025 2030 2035
Figure 4.8 shows that the growth of UK exports of CAV related technologies is supported by the growth in both hardware and software exports. By 2035, the proportion of CAV-enabling software increases to around 40% of total CAV technology exports. As previously stated, this increase in global demand for software relative to hardware can be explained by the gradual transition from L3 to L4/5 CAVs, which have greater software requirements.
A high UK capabilities sensitivity was introduced to test how the economic results would be affected if it was assumed that the UK was more competitive in CAV-related industries than that implied by historical trade shares for similar technologies. The results of this sensitivity analysis are presented and discussed in Section 4.8.
FIGURE 4.7: UK exports of CAVs and CAV technologies, by scenario.
KEY ASSUMPTIONS
Exports are calculated as a share of global demand for CAVs and CAV technologies. We assume that the UK captures a 2.4% share of global demand for CAVs, a 2.2% share of global demand for CAV hardware technologies and a 0.6% share of global demand for CAV software technologies.
Central Central - UK lead
16
14
12
10
8
6
4
2
0
UK
expo
rts
of C
AVs
(£bn
, 201
5)
2020
1.1
2025 2030 2035
5.5
10.7
14.60.3
0.25
0.2
0.15
0.1
0.0
UK
expo
rts
of C
AV te
chno
logi
es (£
bn, 2
015)
2020 2025 2030 2035
0.0
0.1
0.2
0.2
FIGURE 4.8: UK exports by technology, central scenario.
0.25
0.20
0.15
0.10
0.05
0.00
Expo
rts
of e
ach
CAV
tech
nolo
gy (£
bn, 2
015)
2020
HMI software Data security softwareConnectivity / V2X softwareMapping & path planning softwareControl systems software Safety-related HMI hardwareControl systems and computing hardwareConnectivity hardwareSensor-supporting hardwareSensing & local mapping hardware
2025 2030 2035
52
Transport Systems Catapult The case for government involvement to incentivise data sharing in the UK Intelligent Mobility sectorTransport Systems Catapult - Market Forecast for Connected and Autonomous Vehicles
53
Transport Systems Catapult Exploring the Opportunity for Mobility as a Service in the UKTransport Systems Catapult - Market Forecast for Connected and Autonomous Vehicles

Transport Systems Catapult - Market Forecast for Connected and Autonomous Vehicles
4.5 IMPACT ON GROSS OUTPUT AND INVESTMENT
4.5.1 Gross output
UK gross output for CAVs in 2035 is estimated to reach £26bn in the central scenario, with the value of producing CAV-related technologies in the UK contributing a further £1.8bn to gross output.
In the central UK lead scenario (where it is assumed that the UK market grows to around double the size of that in the central scenario by 2030) the economic opportunity for the UK is much greater. In this scenario, annual gross output in the manufacture of connected and autonomous vehicles is expected to reach £35bn by 2035, and the scale of production of CAV-related technologies in the UK is estimated to reach £3.1bn.
FIGURE 4.9 UK gross output in CAV and CAV technologies, by scenario.
Figure 4.10 shows that, in the central scenario, UK gross output for CAV-related software technologies is almost three times as large as gross output for hardware technologies, reflecting the UK’s relative strengths in developing software and low dependence on software imports. The largest contributor to UK gross output in CAV technologies in 2035 is from Connectivity / V2X software, with a 21% share.
KEY ASSUMPTIONS
Gross output is estimated based on the CAV market forecasts, after making an adjustment to take account of net trade effects.
Central case: Gross output in the CAV sector reaches £26bn by 2035 and gross output in CAV technologies reaches £1.8bn in the same year.
Central - UK lead: Gross output in the CAV sector reaches £35bn by 2035 and gross output in CAV technologies reaches £3.1bn in the same year.
Central Central - UK lead
40
35
30
25
20
15
10
5
0
Gro
ss o
utpu
t - C
AVs
(£bn
, 201
5)
2020
3.4
2025 2030 2035
4.6
12.7
19.020.6
28.9
25.5
35.1
3.5
3.0
2.5
2.0
1.5
1.0
0.5
0.0
Gro
ss o
utpu
t - C
AV te
chno
logi
es (£
bn, 2
015)
2020 2025 2030 2035
0.30.4
0.7
1.6
1.4
2.5
1.8
3.1
55
4.5.2 Investment
Facing less stringent regulations than in key competitor countries and with high expected growth in domestic CAV markets, the UK is in a strong position to attract inward investment in CAV industries. Testing of fully automated vehicles is possible in the UK. The permissive nature of the UK regulatory framework and planned investment in testing infrastructure could facilitate the development of complete automated driving systems and could attract inward investment. The attractiveness of the UK as a destination for the development of CAV technologies includes existing world-class testing facilities, such as MIRA, Europe’s largest transport sector R&D cluster worth around $450million34.
Annual investment by firms to support the manufacture of CAVs in the UK is estimated to reach £0.2bn in 2020 for the central scenario, increasing to £1.8bn by 2035. Investment to support the production of CAV technologies in the same scenario is expected to reach £0.1bn, annually, by 2035.
In the central UK lead scenario, annual investment by firms to support the manufacture of CAVs in the UK is expected to grow to £2.4bn by 2035, with a further £0.2bn estimated to be invested each year to support the production of CAV technologies in the UK.
Of all CAV-enabling technologies, investment for the development of connectivity / V2X software is forecast to be largest, reflecting that this technology is estimated to be the largest contributor to UK gross output.
Our estimates of investment are based on the ratio of spending on fixed capital assets to gross output in well-established industry sectors. In the emerging CAV-related industries, it is highly likely that there will be an early investment stimulus, as companies work to develop products in anticipation of strong growth in the future CAV market. The box below highlights recent trends in CAV-related investments and R&D projects in the UK. The selected case studies show that, over the short term, CAV-related investments could be even higher than estimated.
Transport Systems Catapult - Market Forecast for Connected and Autonomous Vehicles
34 MIRA (2016)
FIGURE 4.10: UK gross output by technology, central scenario.
2.0
1.8
1.6
1.4
1.2
1.0
0.8
0.6
0.4
0.2
0.0
Gro
ss o
utpu
t of C
AV te
chno
logi
es (£
bn, 2
015)
2020
HMI software Data security softwareConnectivity / V2X softwareMapping & path planning softwareControl systems software Safety-related HMI hardwareControl systems and computing hardwareConnectivity hardwareSensor-supporting hardwareSensing & local mapping hardware
2025 2030 2035
5554

35 Innovate UK (2016)36 Climate Works Foundation (2016)
RECENT TRENDS IN R&D AND INVESTMENT
The automotive sector is highly innovative and, in 2011, £1.5 billion was spent on automotive R&D by businesses, equivalent to around 14% of its value added. Of this investment, 84% was dedicated to experimental development activities (TSC, 2016). Below are three examples of R&D activities and investments that are already promoting the development of CAV technologies in the UK.
1. Intelligent Mobility Fund
In 2016, the UK government’s Intelligent Mobility Fund allocated £20 million of its £100 million fund to eight different projects in the UK, to develop the next generation of autonomous vehicles (Innovate UK, 2016)35. The funding will improve the UK’s capabilities in developing hardware and software technology directly. At least two of the projects were related to boosting UK capabilities in connectivity software, ‘talking car technology’ and vehicle to anything (V2X) software. The spending will also cover the advancement of sensors, control systems, connectivity and safety.
2. ‘Drive me London’
A UK-based project by Volvo called ‘Drive me London’ will test real families driving CAVs in London. Beginning in 2017, the project will include up to 100 CAV vehicles by 2018, making it the largest project of this type in the UK. (2016, Press release).
3. Jaguar Land Rover
Jaguar Land Rover (JLR) has plans to create a fleet of more than 100 research vehicles over the next four years, with testing already being carried out in 2016 over 41 miles of test route motorways around Coventry and Solihull. According to a presentation by Climate Works Foundation36, JLR plans to launch its first CAV ready for market by 2024. (2016, Press release).
4.6 IMPACTS ON GVA
4.6.1 Direct effects
The GVA results reflect the same broad trends as shown in the gross output estimates. The UK manufacturing sector is assumed to maintain its current position in terms of relative global capabilities in the automotive sector and in component manufacturing. In the central scenario, annual GVA related to the production of CAVs is estimated to reach £7bn by 2035 and GVA in firms that are producing CAV technologies is expected to reach £1.2bn.
In the central UK lead scenario, annual GVA related to the production of CAVs and CAV-enabling technologies is estimated to reach over £11bn in total, by 2035.
37 Indirect supply chain effects for manufacturing CAVs are not presented to avoid double-counting (as the firms manufacturing CAV-enabling technologies form part of the supply
chain for the CAV manufacturing sector).
4.6.2 Indirect effects
The indirect GVA effects show the total contribution to GVA in the supply chain for the CAV technologies. For example, manufacturing CAV hardware technologies will require raw material inputs, such as plastics and metals, produced by other firms in its supply chain. An increase in gross output in CAV technologies will therefore lead to an increase in demand, gross output and GVA in the industry sectors that are manufacturing the raw materials required to produce the CAV technologies. The impact of growth in market demand for CAV technologies on these supply chain industries are known as ‘indirect effects’.
The indirect effects of producing CAV technologies were estimated using GVA multipliers from the ONS (2010)37. The results show that an additional £0.5bn GVA each year is estimated to be created in the supply chain for CAV technologies, by 2035, in the central scenario.
FIGURE 4.12 Direct and indirect GVA related to the production of CAV technologies, central scenario.
1.8
1.6
1.4
1.2
1.0
0.8
0.6
0.4
0.2
0
Dir
ect a
nd in
dire
ct G
VA re
late
d to
the
prod
ucti
on o
f CAV
tech
nolo
gies
(£bn
, 201
5)
2020 2025 2030 2035
0.20.5
0.91.2
Direct GVA Indirect GVA
0.1
0.2
0.4
0.5
KEY ASSUMPTIONS
GVA is calculated as gross output net of intermediate consumption, based on the UK Supply and Use tables.
Central case: Gross output in the CAV sector reaches £6.9bn by 2035 and GVA in CAV technologies reaches £1.2bn in the same year.
Central - UK lead: Gross output in the CAV sector reaches £9.5bn by 2035 and gross output in CAV technologies reaches £2.1bn in the same year.
Central Central - UK lead
10
9
8
7
6
5
4
3
2
1
0
GVA
- CA
Vs (£
bn, 2
015)
2020
0.9
2025 2030 2035
1.2
3.4
5.15.6
7.8
6.9
9.5 2.5
2.0
1.5
1.0
0.5
0
GVA
- CA
V te
chno
logi
es (£
bn, 2
015)
2020
0.2
2025 2030 2035
0.5
1.0 0.9
1.6
1.2
2.1
0.2
Of the CAV technology groups, the UK has relatively strong capabilities in software development and design, and this is reflected in both the gross output and GVA estimates: UK gross output in software accounts for around 75% of total gross output and around 85% of total GVA in CAV-enabling technologies. Software and information services are high value-added sectors and, therefore, the estimated increases in GVA are relatively high, reflecting GVA to gross output ratios of 65%-95%.
FIGURE 4.11 GVA in CAV and CAV technologies
56
Transport Systems Catapult The case for government involvement to incentivise data sharing in the UK Intelligent Mobility sectorTransport Systems Catapult - Market Forecast for Connected and Autonomous Vehicles
57
Transport Systems Catapult Exploring the Opportunity for Mobility as a Service in the UKTransport Systems Catapult - Market Forecast for Connected and Autonomous Vehicles

4.7 IMPACTS ON JOBS
The jobs results reflect the trends in gross output and GVA. As firms increase production of CAVs and CAV technologies, their labour requirements will increase and new (direct) jobs will be created. In addition, an increase in output and demand for labour in the supply chains for these technologies will lead to an increase in indirect jobs.
4.7.1 Direct effects
As shown in Figure 4.13, in the central scenario, by 2035, an estimated 27,400 CAV manufacturing jobs are created, with up to 37,600 CAV manufacturing jobs in 2035 in the central UK lead scenario. However, many of the jobs relating to the manufacture and assembly of CAVs will, in practice, replace jobs in the traditional automotive manufacturing sector.
The results show that total direct jobs related to the manufacture of CAV technologies reach 6,000 in the central scenario by 2035, and over 10,200 in the central UK lead scenario in the same year. These jobs relating to the manufacture of CAV-enabling technologies can be considered as ‘net additional jobs’ (i.e. they do not displace existing jobs).
The jobs related to CAV technologies are mostly concentrated in the software industries (i.e. 70% in 2035), as shown in Figure 4.14, where UK capabilities are strong, gross output is high and the labour intensity of production is high (around 6-7 jobs per £1 million of production). The remaining jobs (30% in 2035) would be in the production of CAV hardware, such as sensors. Over 90% of the jobs created in developing CAV software and over 80% of the jobs relating to the manufacture of CAV hardware are expected to be in professional, technical and skilled trade occupations.
Central Central - UK lead
FIGURE 4.13 Direct jobs in CAV and CAV technology, by scenario.
KEY ASSUMPTIONS
Direct jobs are calculated as a function of gross output. We assume that, in 2015, the labour intensity of CAV production is around 2 jobs per £1 million output, the labour intensity of producing CAV hardware is 5-10 jobs per £1 million output and the labour intensity of producing CAV-related software is 5-8 jobs per £1 million output.
We apply an annual labour productivity improvement of 2-4% in all sectors over the period to 2035.
40
35
30
25
20
15
10
5
0
Dir
ect j
obs
- CAV
s (0
00s)
2020
6.4
2025 2030 2035
8.6
19.9
29.8
26.8
37.4
27.4
37.612
10
8
6
4
2
0
Dir
ect j
obs
- CAV
tech
nolo
gies
(000
s)
2020 2025 2030 2035
1.5
2.1
3.4
7.3
5.4
9.7
6
10.2
58
Transport Systems Catapult - Market Forecast for Connected and Autonomous Vehicles
FIGURE 4.14: Direct jobs by technology, central scenario.
4.7.2 Indirect effects
As with GVA, the number of indirect jobs in the supply chain for CAV technologies is estimated. The results show that, in the central scenario, in addition to the 6,000 direct CAV technology jobs created by 2035, an additional 3,900 jobs are created in the supply chains for these technologies.
FIGURE 4.15: Direct and indirect jobs related to the production of CAV technologies.
12
10
8
6
4
2
0
Dir
ect a
nd in
dire
ct jo
bs re
late
d to
the
prod
ucti
on o
f CA
V te
chno
logi
es (0
00s)
2020 2025 2030 2035
1.5
3.4
5.46.0
Direct jobs Indirect jobs
1.0
2.4
3.7
3.9
7
6
5
4
3
2
1
0
Dir
ect j
obs
– CA
V te
chno
logi
es (0
00s)
2020
HMI software Data security softwareConnectivity / V2X softwareMapping & path planning softwareControl systems software Safety-related HMI hardwareControl systems and computing hardwareConnectivity hardwareSensor-supporting hardwareSensing & local mapping hardware
2025 2030 2035
Transport Systems Catapult - Market Forecast for Connected and Autonomous Vehicles
59
Direct jobs relate to jobs created in the production and manufacture of CAV technologies, whilst indirect jobs relate to jobs created in the supply chain for these technologies.

TABLE 4.3 Economic results relating to the manufacture of CAVs in the central scenario and key sensitivities tested.
4.8 SENSITIVITY TO KEY ASSUMPTIONS
Sensitivity analysis was carried out to test the robustness of the results to changes in key assumptions on (i) UK capabilities and competitiveness in CAV technologies, and (ii) the value shares of software relative to hardware that is required by CAVs.
As shown in the summary tables below, if the UK is more competitive in producing CAVs and CAV technologies than it historically has been for similar technologies (i.e. under the high capabilities sensitivity), GVA and jobs estimates could be larger. If the software requirements for CAV technologies are lower (relative to hardware) than assumed in the central scenario (and the other scenarios presented so far), however, the benefits to the UK would be lower (due to relatively greater dependency on hardware imports, and lower demand for exported software).
TABLE 4.4 Economic results relating to the development and manufacture of CAV technologies in the central scenario and key sensitivities tested.
Economic impacts for CAV technologies 2020 2025 2030 2035
Central scenario Direct GVA (£bn) 0.9 3.4 5.6 6.9
Direct Jobs 6,400 19,900 26,800 27,400
Central – High UK capabilities
Direct GVA (£bn) 1.6 5.7 9.1 11.2
Direct Jobs 10,900 33,100 43,700 44,400
Central – Low software share
Direct GVA (£bn) 0.9 3.4 5.6 6.9
Direct Jobs 6,400 19,900 26,800 27,400
CAV technologies 2020 2025 2030 2035
Central scenario Direct GVA (£bn) 0.2 0.5 0.9 1.2
Direct Jobs 1,500 3,400 5,400 6,000
Central – High UK capabilities
Direct GVA (£bn) 0.2 0.7 1.2 1.5
Direct Jobs 2,400 5,700 8,400 8,900
Central – Low software share
Direct GVA (£bn) 0.1 0.4 0.7 0.9
Direct Jobs 1,300 3,000 4,700 5,100
4.8.1 High UK capabilities sensitivity
The high UK capabilities sensitivity tests the impact on the economic results if the UK were more competitive in the production of CAV technologies than the data for similar technologies suggests. In the high UK capabilities sensitivities, UK import shares were halved and UK exports shares were increased by 50% (relative to that assumed in the main scenarios). With a lower share of imports and the UK capturing a higher share of export markets, there is an improvement to the balance of trade and an increase in gross output, GVA and jobs.
Figure 4.16 shows the difference in GVA and jobs related to the manufacture of CAVs and CAV technologies in the central scenario, under the assumption of high UK capabilities compared to under the baseline assumptions. In 2035, GVA in the central scenario with high UK capabilities is £11.2bn (around £4bn greater than GVA in the same scenario under the baseline assumptions). Under this sensitivity, the number of direct jobs related to the manufacture of CAVs reaches 44,000 by 2035 (compared to 27,000 under the baseline assumptions).
A similar trend is seen for GVA in CAV technologies. In 2035, GVA related to the production of CAV technologies in the central scenario with high UK capabilities reaches £1.5bn (around £0.3bn greater than in the central scenario under the baseline assumptions). By 2035 the number of direct jobs in CAV technologies reaches around 9,000 under the central scenario with high UK capabilities, compared to around 6,000 jobs under the central scenario with baseline assumptions for UK capabilities.
FIGURE 4.16 Direct GVA and jobs related to the production of CAVs and CAV technologies in the central scenario and the central scenario with a high UK capabilities assumption
KEY ASSUMPTIONS
Central case: Import and export shares for CAVs and CAV technologies based on mapping to existing industries.
Central - Low software share: Export shares assumed to be 50% higher and import shares assumed to be 50% lower than in the central case with baseline assumptions.
Central - Baseline UK capabilities
Central - High UK capabilities
12.0
10.0
8.0
6.0
4.0
2.0
0.0
Dir
ect G
VA –
CAV
s (£
bn, 2
015)
2020
0.9
2025 2030 2035
1.6
3.4
5.7 5.6
9.1
6.9
11.2 1.8
1.6
1.4
1.2
1.0
0.8
0.6
0.4
0.2
0.0Dir
ect G
VA –
CAV
tech
nolo
gies
(£bn
, 201
5)
2020
0.2
2025 2030 2035
0.5
0.7
0.9
1.2 1.2
1.5
0.2
50
45
40
35
30
25
20
15
10
5
0
Dir
ect j
obs
– CA
Vs (0
00s)
2020
6.4
2025 2030 2035
10.9
19.9
33.1
26.8
43.7
27.4
44.410
9
8
7
6
5
4
3
2
1
0
Dir
ect j
obs
– CA
V te
chno
logi
es (0
00s)
2020
1.5
2025 2030 2035
3.4
5.7 5.4
8.4
6.0
8.9
2.4
61
Transport Systems Catapult - Market Forecast for Connected and Autonomous Vehicles
60
Transport Systems Catapult - Market Forecast for Connected and Autonomous Vehicles

4.8.2 Low software share sensitivity
The sensitivity of the economic results to changes in the assumptions on the share of software vs hardware in CAV technologies was also assessed. A ‘low software share’ variant of the central scenario was tested, where software was assumed to make up a 26%-34% share of the total value of CAV technologies (compared to a 35%-50% share in the baseline assumptions). The gross contribution of CAV technologies to gross output, GVA and jobs in the ‘low software share’ variant is around 15% to 20% lower than in the central scenario by 2035, reflecting the UK’s strong capabilities in developing software relative to the manufacturing of hardware. In the ‘low software share’ variant, the lower gross output estimates are compensated for by an increase in imports of hardware to meet demand in the domestic market. The low software share sensitivity was only applied to CAV technologies and there is no impact on the results in the CAV manufacturing sector. The results are shown in Figure 4.17.
FIGURE 4.17: Direct GVA and jobs related to the production of CAV technologies in the central scenario and the central scenario with a low software share assumption
KEY ASSUMPTIONS
Central case: The share of software relative to hardware for each CAV technology is 35-50%.
Central - Low software share: The share of software relative to hardware for each CAV technology is 26-34%.
Central - Baseline software share
Central - Low software share
1.4
1.2
1.0
0.8
0.6
0.4
0.2
0.0
Dir
ect G
VA –
CAV
tech
nolo
gies
(000
s)
2020
0.2
2025 2030 2035
0.1
0.50.4
0.9
0.7
1.2
0.9
7
6
5
4
3
2
1
0
Dir
ect j
obs
– CA
V te
chno
logi
es (0
00s)
2020
1.5
2025 2030 2035
3.43.0
5.4
4.7
6.0
5.1
1.3
Transport Systems Catapult - Market Forecast for Connected and Autonomous Vehicles
62
Transport Systems Catapult The case for government involvement to incentivise data sharing in the UK Intelligent Mobility sectorTransport Systems Catapult - Market Forecast for Connected and Autonomous Vehicles
5. CONCLUSIONS
5.1 CAV MARKET VALUE
• Projections of CAV uptake assume that total car, van, HGV and bus sales increase over time (both for the UK market and the global market), and that L3-L5 CAV sales account for an increasing share of this total. The main results for the market sizing reflect a central scenario for global L3-L5 CAV adoption, which is informed by estimated technology costs and consumer willingness to pay (based on previous studies).
• The central scenario indicates that in the UK, L3-L5 CAVs account for 31% of total annual sales by 2035, equating to vehicle sales of 1.1 million CAVs (including cars, vans, HGVs and buses). In the central UK lead scenario, UK CAV demand is ahead of the rest of Europe, with L3-L5 CAVs accounting for 58% of total sales by 2035, equating to 2.1 million vehicles.
• Global uptake in the central scenario indicates that the global annual sales of L3-L5 CAVs could account for 25% of total sales by 2035. CAV uptake in Europe and the UK is assumed to be ahead of uptake in other regions, due to several factors including a supportive regulatory framework for CAVs.
• UK CAV sales result in a projected domestic market size of £28bn in 2035 for the central scenario, with a market size of £2.7bn for CAV technologies. In the central UK lead scenario (where uptake in the UK is ahead of the rest of Europe), UK CAV sales in 2035 result in a market size of £52 billion, and the UK CAV technology market is worth £5.2 billion.
• In the central scenario, in 2035 the global market size is estimated at £946bn from CAV sales, and £78bn in total for CAV technologies. The higher and lower bounds for the global CAV sales market are £3,000bn and £26bn respectively, with the large range mainly reflecting the high level of uncertainty in the rate of uptake.
63
Transport Systems Catapult - Market Forecast for Connected and Autonomous Vehicles

5.2 UK ECONOMIC IMPACTS
In the central scenario, it is estimated that the gross direct contribution of CAV and CAV technologies to UK GVA would reach £6.9bn and £1.2bn, respectively, by 2035. In this scenario, the number of jobs in the manufacture and assembly of CAVs would reach 6,400 by 2020 and 27,400 by 2035. This compares to around 151,000 people who are currently employed in the UK automotive sector38. There would be 6,000 net additional direct jobs in the production of CAV technologies in the UK by 2035, with a further 3,900 indirect jobs created in the supply chains for these technologies.
• If the size of the UK market for CAVs grew at a faster rate than in the central scenario, then the UK could attract further inward investment, as firms would be incentivised to develop CAV technologies in the UK, close to the expected market. In the central UK lead scenario, the gross contribution of manufacturing CAVs and CAV-enabling technologies to UK GVA by 2035 is estimated to be £9.5bn and £2.1bn, respectively. Around 37,600 jobs could be created in the production and assembly of CAVs, with 10,200 net additional jobs in the production of CAV enabling technologies and a further 6,500 indirect jobs created in the supply chain for CAV technologies.
• The UK’s strengths and competitiveness in software design and development puts UK firms in a strong position to capture a large share of the domestic (and global) market for high value-added CAV-related software. However, it is likely that much of the CAV-related hardware (in particular, sensing and mapping hardware) would be imported from abroad.
38 ONS (2016),
5.3 RECOMMENDATIONS FOR FURTHER RESEARCH
Based on the findings of the report, there is a high potential for significant economic benefits to the UK, as a direct result of the development of the CAV market. Most of these potential benefits would result from CAV sales and production in the UK. However, the sale and production of CAV technologies would also contribute to various economic benefits, and therefore a more detailed understanding of certain aspects of these markets would be beneficial in fully understanding the potential, and to determine the best approach for government and industry to foster future economic benefits.
Outside of CAV production, software development and integration is likely to provide the most economic benefits to the UK. However, this area is relatively poorly understood in terms of the value chain within the automotive sector, and in terms of the associated economic impacts, partly due to a lack of specific data on these areas of economic activity. This lends a significant degree of uncertainty to the economic benefits cited in this report. As an example of this, the sensitivity test which shifted the software share of CAV component value from 35%-50% (L3-L4/5) down to 26%-34% to resulted in a 15% reduction in GVA and jobs dependent on CAV technologies (no effect on economic benefits resulting from CAV sales and production).
Future research into the following areas could help to create a clearer picture of the likely economic benefits of CAVs:
• Approach to software valuation in UK car companies and in CAV-related SMEs, including development costs, as well as pricing models for OEMs (i.e. one-off or regular updates) and consumers (per-vehicle or per-month), and understanding the possible cost reductions for software over time (accounting for possible updates required).
• Understanding the value chain for software (e.g. how is software developed in the UK made available to other markets, and what are the implications for the economic benefits resulting from these value transfers?).
This report only considered the markets associated with CAVs and their components. However, the UK has leading capabilities in both on-road testing, and virtual environment testing, which could be beneficial in terms of testing CAVs and CAV software respectively. Extensive testing will be essential for CAVs to gain the low failure rates needed for commercial deployment, and as such both these capabilities could have the potential to attract significant economic benefits as the CAV market grows, in addition to those already discussed in this report.
To inform public policy, further research into the wider economic impacts associated with the transition to CAVs would be constructive. To fully understand the net economic benefits of the transition to CAVs would involve taking account of the impact of new CAV business models, behavioral changes and productivity or welfare improvements from more efficient use of travelling time.
64
Transport Systems Catapult The case for government involvement to incentivise data sharing in the UK Intelligent Mobility sector
65
Transport Systems Catapult Exploring the Opportunity for Mobility as a Service in the UKTransport Systems Catapult - Market Forecast for Connected and Autonomous Vehicles

TABLE 6.1 SAE Summary of levels of driving automation. DDT = dynamic driving task; OEDR = object and event detection and response; ODD = operational domain design; ADS = automated driving system.39
39 SAE International, 2016. J3016TM. Surface vehicle recommended practice – Taxonomy and definitions for terms relating to driving automation systems for on-road motor vehicles.
6.2 B – ASSUMPTIONS FOR RELATIVE COMPONENT VALUES
As discussed in the report, a key area of uncertainty in this study is the relative value of hardware and software in autonomy packages for CAVs. Figure 6.1 summarises the process behind the values used in this study, and shows that various literature sources were used to support and refine the assumptions made.
FIGURE 6.1 Approach to finding values for hardware and software aspects of components.
The assumptions made at each stage are shown in Table 6.2, including: the initial estimates for how the value of some components is split between hardware and software aspects (based on discussions with AESIN and TSC); the revised estimates for this split following a sense-check of the absolute values; and the resulting final share of the total value by component (with the hardware and software aspects separated out).
As shown in Table 6.2, the initial assumptions result in an overall split of 74% hardware, 26% software for L3 autonomy packages, and 66% hardware, 34% software for L4/5 autonomy package. For the central scenario projections for cost over time, this translates to an introductory software value of approximately £640 for L3 in 2015 and £1,450 for L4/5 in 2025 (values in 2015 GBP). However, several proxies for software value identified in the literature indicated that the total per-vehicle value of software for CAVs could be significantly higher than this. These proxies are summarised in Table 6.3.
The SIC codes associated with each component are shown in Table 6.4 and Table 6.5.
Goldman Sachs (component values at scale)
Boston Consulting Group (Package values over time)
Proxies for software value (e.g. Tesla, existing
software in cars)
Test absolute values for hardware and software
Share of total value by component
Total package value
Initial estimates for software: hardware split
LEGEND
Literature inputs Assumptions based on literature
Estimated values (discussed with key stakeholders)
Revised assumptions for software: hardware split
FInal share of total value by
component
Level Name Narrative definition
DDT
DDT fallback ODDSustained lateral and
longitudinal vehicle motion control
OEDR
Driver performs part or all of the DDT
0 No Driving Automation
The performanace by the driver of the entire DDT, even when enhanced by
active safety systems.Driver Driver Driver n/a
1 Driver Assistance
The sustained and ODD-specific execution by a driving automation system
of either the lateral or the longitudinal vehicle motion control subtask of the DDT
(but not both simultaneously) with the exception that the driver performs the
remainder of the DDT.
Driver and System Driver Driver Limited
2 Partial Driving automation
The sustained and ODD-specific execution by a driving automation system of both
the lateral and longitudional vehicle motion control subtasks of the DT with
the expectation that the driver completes the OEDR subtask and supervises the
driving automation system.
System Driver Driver Limited
ADS (‘System’) performs the entire DDT (while engaged)
3Conditional
Driving Automation
The sustained and ODD-specific performance by an ADS of the entire
DDT with the expectation that the DDT fallback-ready user is receptive to ADS-issued requests to intervene, as well as to DDT performance-relevant system
failures in other vehicle systems, and will respond appropriately.
System System
Fallback-ready user (becomes the driver
during fallback)
Limited
4 High Driving Automation
The sustained and ODD-specific performance by an ADS of the entire DDT and DDT fallback without any expectation
that a user will respond to a request to intervene.
System System System Limited
5 Full Driving Automation
The sustained and unconditional (ie, not ODD-specific) performance by an ADS of the entire DDT and DDT fallback without any expectation that a user will respond
to a request to intervene.
System System System Unlimited
66
Transport Systems Catapult - Market Forecast for Connected and Autonomous Vehicles
6. APPENDICES
6.1 A – EXTRACT FROM SAE INTERNATIONAL STANDARD J3016
67
Transport Systems Catapult - Market Forecast for Connected and Autonomous Vehicles

TABLE 6.2 Assumed share of component values between hardware and software.
Component
Component % of package value (based on Goldman Sachs values)
Initial estimate of component value split between hardware and software (before skew towards software applied)
Component value split between hardware and software after skew towards software applied
% of total package value after skew towards software applied
L3 L4/5 L3 L4/5 L3 L4/5 L3 L4/5
MappingHardware
7% 8% 40% 20% 30% 11% 2% 1%
Software 60% 80% 70% 89% 6% 9%
Embedded controls
Hardware7% 7%
30% 10% 22% 5% 2% 1%
Software 70% 90% 78% 95% 7% 9%
V2X Hardware
12% 10%30% 10% 22% 5% 3% 1%
Software 70% 90% 78% 95% 12% 14%
HMIHardware
7% 7%40% 40% 30% 26% 2% 2%
Software 60% 60% 70% 74% 6% 6%
Cameras 11% 9%
Hardware only – after skew towards software applied, the component % of the total package value decreases
9% 7%
Radar 14% 10% 12% 8%
LIDAR 28% 31% 25% 24%
Odometry sensors 2% 1% 2% 1%
Ultrasonic sensors 0.4% 0.1% 0.3% 0.1%
Actuators 3% 3% 2% 2%
Embedded modem 0.4% 0.3% 0.3% 0.3%
Passive components 0.6% 0.9% 0.5% 0.7%
Other electronics and architecture 4% 4% 3% 3%
Data security software 4% 8%Software only – after skew towards software applied, the component % of the total package value increases
5% 12%
TOTAL PACKAGE
Hardware Overall result of splitting the component shares into hardware and software:
74% 66% Overall result of applying skew towards software:
65% 50%
Software 26% 34% 35% 50%
To ensure that the software value share of autonomy packages are better aligned with these proxies, the overall share of value for software was therefore “skewed” to 35% for L3, and 50% for L4/5 (resulting in introductory software values of approximately £870 for L3 in 2015 and £2,140 for L4/5 in 2025). There are two implications of this skew on the total value share of each component:
• The share of the package value increases for components which are assumed to be 100% software and decreases for components which are assumed to be 100% hardware;
• For components with hardware and software aspects, the software share will increase and the hardware share will decrease. The “skew” is applied to the initial estimates, so assumptions around which components have a higher or lower share of software are conserved.
Due to the uncertainty in the value ratio for software and hardware, the economic impacts associated with these assumptions are tested as a sensitivity to the central scenario, in Section 4.8. This compares the economic impacts resulting from the “skewed” values used in the main scenarios, to the impacts with the initial software value estimates (which imply a lower total value for software technologies, as shown in Table 6.2).
The SIC codes and descriptions of the relevant economic activities associated with each component are shown in Table 6.4 and Table 6.5, alongside the final assumed share of the total autonomy package value. Note that the value for the software technologies is assumed to be linked to activities in four different SIC codes. The distribution across these four SIC codes for each type of software has been estimated based on knowledge of the requirements for the different types of software. However, this is unlikely to have a great impact on the economic analysis, as some of the key stages in the analysis use data that is aggregated at a two-digit SIC code level (and as such, will result in similar economic impacts across all software-related SIC codes).
TABLE 6.3 Proxies for CAV software value.
40 See http://www.theverge.com/2016/10/20/13346512/tesla-self-driving-autonomous-enhanced-autopilot-cost.41 Much of this could be software costs. See:https://buy.garmin.com/en-US/US/p/67886 and
http://www.avweb.com/news/features/Retrofit-Autopilots-Youll-Pay-For-Precision-225693-1.html.42 (Charette, 2009).
Reference point Estimated value of software in GBP
Tesla Autopilot: Customers will pay around $3,000 for Tesla “Full Self-driving Capability” software to calibrate hardware and activate software. This is in addition to the $5,000 option payable for the Enhanced Autopilot system, which is required for anyone wishing to upgrade to “Full Self-driving Capability” at a later date.40
Approx. £2,000-£2,400 - for L4/5 CAV Assuming that the cost of software is covered by the “upgrade” payment
Aviation autopilot systems: Upgrade costs for autopilot systems are in the region of $5,000, and systems can cost in excess of $15,000.41
£4,000-£8,000 Assuming that software accounts for 50% of system costs
Existing software value for premium cars: Up to 6% of the cost of premium cars is accounted for by software development costs.42
£3,000 Assuming a premium car price of £50,000
68
Transport Systems Catapult The case for government involvement to incentivise data sharing in the UK Intelligent Mobility sectorTransport Systems Catapult - Market Forecast for Connected and Autonomous Vehicles
69
Transport Systems Catapult Exploring the Opportunity for Mobility as a Service in the UKTransport Systems Catapult - Market Forecast for Connected and Autonomous Vehicles

TABLE 6.4 Associated SIC codes and share of autonomy package values for hardware technologies.
Hardware Technologies
Components SIC code
SIC code activity description Total share of package value at L3
Total share of package value at L4/5
Sensing & local mapping hardware
Cameras 2640 Manufacture of consumer electronics
9.3% 6.7%
Radar 2651 Manufacture of instruments and appliances for measuring, testing and navigation
12.4% 7.9%
LIDAR 2670 Manufacture of optical instruments and photographic equipment
24.7% 23.8%
Mapping hardware
2651 Manufacture of instruments and appliances for measuring, testing and navigation
2.5% 1.2%
Odometry sensors
2651 Manufacture of instruments and appliances for measuring, testing and navigation
1.7% 0.5%
Ultrasonic sensors
2651 Manufacture of instruments and appliances for measuring, testing and navigation
0.3% 0.1%
Sensor-supporting hardware
Actuators 2612 Manufacture of loaded electronic boards
2.3% 2.3%
Control systems and computing hardware
Embedded controls hardware
2612 Manufacture of loaded electronic boards
1.9% 0.5%
Passive components
2611 Manufacture of electronic components
0.5% 0.7%
Other electronics & architecture
2611 Manufacture of electronic components
3.5% 3.2%
Connectivity hardware
V2X hardware 2630 Manufacture of communication equipment
3.2% 0.8%
Embedded modem
2630 Manufacture of communication equipment
0.3% 0.3%
Safety-related HMI hardware
HMI hardware 2651 Manufacture of instruments and appliances for measuring, testing and navigation
2.5% 2.1%
TOTAL 65% 50%
TABLE 6.5 Associated SIC codes and share of autonomy package values for software technologies.
Software Technologies SIC code
SIC code activity description Total share of package value at L3
Total share of package value at L4/5
Mapping & path planning software 6201 Computer programming activities 2.3% 3.7%
6202 Computer consultancy activities 0.6% 0.9%
6209 Other information technology and computed service activities
0.6% 0.9%
6311 Data processing, hosting and related activities
2.3% 3.7%
Control systems software 6201 Computer programming activities 4.7% 6.5%
6202 Computer consultancy activities 0.7% 0.9%
6209 Other information technology and computed service activities
0.7% 0.9%
6311 Data processing, hosting and related activities
0.7% 0.9%
Connectivity / V2X software 6201 Computer programming activities 3.5% 4.2%
6202 Computer consultancy activities 2.4% 2.8%
6209 Other information technology and computed service activities
1.2% 1.4%
6311 Data processing, hosting and related activities
4.7% 5.5%
HMI software 6201 Computer programming activities 3.5% 3.7%
6202 Computer consultancy activities 1.2% 1.2%
6209 Other information technology and computed service activities
0.6% 0.6%
6311 Data processing, hosting and related activities
0.6% 0.6%
Data security software 6201 Computer programming activities 1.9% 4.6%
6202 Computer consultancy activities 0.5% 1.2%
6209 Other information technology and computed service activities
0.5% 1.2%
6311 Data processing, hosting and related activities
1.9% 4.6%
Total 35% 50%
70
Transport Systems Catapult The case for government involvement to incentivise data sharing in the UK Intelligent Mobility sectorTransport Systems Catapult - Market Forecast for Connected and Autonomous Vehicles
71
Transport Systems Catapult Exploring the Opportunity for Mobility as a Service in the UKTransport Systems Catapult - Market Forecast for Connected and Autonomous Vehicles

43 Due to data limitations, export intensity for all CAV technologies and import intensity for CAV software technologies were calculated at the SIC07 two-digit class level. The import
intensity of CAV hardware technologies was calculated using SIC07 codes at the four-digit class level.
6.3 C – APPROACH TO THE ANALYSIS OF ECONOMIC IMPACTS
This section provides details of the methodology used to quantify each of the economic indicators in the report.
TRADE
Import intensity and export intensity for CAV and CAV technologies were estimated based on historical data from the Eurostat Comext database, ONS International Trade in Services statistics and the OECD STAN database. Where possible, the most detailed data was used at the UK SIC (2007) four-digit class level. Where this data was not available, more aggregated data was used at the UK SIC (2007) two-digit class level43.
It was assumed that historic import and export intensities hold over the 20-year projection period. For example, if the ratio of UK exports to total global demand in CAV software is 5% in 2015, we assume that, in 2035, the ratio of UK exports to total global demand in CAV technology is still 5%. These intensities were multiplied by the CAV market forecasts to derive total UK imports and exports.
1. Historical data for the relevant SIC (2007) codes was used to estimate import intensity for CAV technologies:
Import Intensity =UK Imports
UK Imports + Gross output - UK Exports
UK Imports = Import Intensity x UK Market Forecast
UK Export Share region =UK Exports region
Domestic Demand region
UK Exports region = UK Export Share region x Market Forecast region
2. Import intensity (the ratio of imports to domestic demand) was then multiplied by the CAV market forecasts to derive UK imports (by CAV technology);
UK export shares were calculated for four world regions: Europe, North America, Asia-Pacific and Rest of World.
1. Historical data for the relevant SIC (2007) codes was used to calculate export shares by global region, i.e. the ratio of UK exports to total domestic demand in each region:
2. UK exports to each region (by technology) were then calculated by multiplying the export shares by CAV market forecasts in each global region:
GROSS OUTPUT AND INVESTMENT
Projections for gross output in CAV and CAV technologies were based on the UK market forecasts, after making an adjustment to account for international trade effects (as quantified in Stage 1):
Expected future demand (and expected production) are key drivers of investment in the UK and, to estimate total CAV-related investment in each scenario, it is assumed that investment in each sector is wholly dependent on current gross output of CAV-related technologies. The ratio of investment to gross output was calculated using historical data for industries that are expected to develop CAV technologies44. Investment shares were calculated at the SIC (2007) two-digit class level, using data for Gross Fixed Capital Formation (GFCF) and domestic output from the ONS Supply and Use Tables (2014) (see Table 6.6 for investment shares). Investment shares were multiplied by gross output for each CAV technology to give an estimate of UK CAV-related industry investments in each year.
1. Historical data for relevant SIC (2007) codes was used to estimate investment shares:
2. Investment shares were then multiplied by gross output (by technology) to derive the level of investment in each scenario:
Gross Output = UK Market Forecast + UK Exports - UK Imports
Investment Share =Gross Fixed Capital Formation
Total Domestic Output
Investment = Investment Share x Gross Output
TABLE 6.6 Investment share by UK SIC (2007) code.
44 Industries we expect to develop CAV technologies are consistent with the UK SIC (2007) two-digit class level used elsewhere in the model. Investment data for the following
industries was collected from the Supply and Use Tables from ONS: Manufacturing of motor vehicles, trailers and semi-trailers (29) for CAVs, manufacturing of electronic and
optical instruments (26) for CAV hardware technology, and computer programming (62) for CAV software technology. Data for information services (63) was missing from the ONS
so computer programming consultancy and related activities and information services from OECD STAN database was used as a proxy for 63, which contributed to the investment
shares of CAV software technology.
UK SIC (2007) sector UK SIC (2007) code Investment share
Manufacture of computer, electronic and optical products
26 7%
Manufacture of motor vehicles, trailer and semi-trailers
29 7%
Computer programming consultancy and related activities
62 4%
Information service activities 63 9%
72
Transport Systems Catapult - Market Forecast for Connected and Autonomous Vehicles
73
Transport Systems Catapult - Market Forecast for Connected and Autonomous Vehicles

GVA
GVA was calculated for CAV and CAV technologies as:
GVA = Gross output - Industry Intermediate Consumption
Industry intermediate consumption was calculated using UK input-output tables, published by the ONS. The input-output coefficients were refined to reflect our estimates of labour costs associated with manufacturing each technology45. Industry intermediate consumption was then calculated by multiplying gross output by the adjusted input-output coefficients.
JOBS
To estimate the impact on jobs, labour intensities for each four-digit SIC code were calculated using 2015 data. Labour intensities were calculated at a sectoral level, as the ratio of employees to million pounds of turnover (see Table 6.7 for labour intensities). The labour intensities were then adjusted to take account of expected future productivity improvements, which were estimated by assuming a continuation of historical productivity trends. Future productivity growth was based on the average growth rate in labour productivity46 from ONS data. The productivity-adjusted labour intensity estimates were then multiplied by the gross output results to estimate the total number of jobs associated with production of CAV technologies in each scenario.
1. Historical data for the relevant SIC (2007) codes was used to estimate the labour intensity of manufacturing CAV technologies:
45 For the manufacturing of CAV hardware technologies, labour intensities (estimated at the SIC07 four-digit class level) ranged from 3 jobs per £million turnover to 10 jobs per
£million turnover. As input-output tables are only available at the SIC07 two-digit class level, adjustments were applied to the coefficients in the Input-Output tables to account
for higher labour intensities (and higher labour costs). We assume that higher labour intensity (and labour costs) would correspond to lower intermediate consumption, and that the
same profit shares are maintained within a particular industry sector.46 Average growth rate for CAV (29) was calculated using data from 1994-2014, for CAV software technologies (62 & 63) a period between 1990-2014 was used, and for CAV
hardware technologies a period between 1994-2015 was used.
Historical Labour Intensity =Historical Labour Intensity
Million Pounds’ Turnover
2. Direct and indirect jobs associated with manufacturing each CAV technology were then estimated:
Direct Jobs = Gross Output x Historical Labour Intensity x Productivity Improvement
Indirect Jobs = Direct Jobs x (Employment multiplier-1)
Indirect jobs were calculated using direct jobs and a type one employment multiplier (ONS). The employment multiplier represents the direct and indirect impact on the supply chain from an increase in employment in a specific sector. Data was selected based on the relevant two digit SIC codes for each technology.
FIGURE 6.7 Labour intensities for UK SIC (2007) code.
LIMITATIONS OF APPROACH TO ECONOMIC ANALYSIS
a) Using UK SIC (2007) codes for existing industries to estimate the economic characteristics of CAV technologies
In the emergent CAV industry, there is limited data available to estimate the likely contribution of this sector to UK GVA, gross output and jobs in the future. Mapping the manufacture of CAVs and CAV technologies to UK SIC (2007) codes was an essential step to estimate the economic characteristics of the industries that are likely to produce CAV technologies in the future. The likely contribution of CAV technologies to GVA, gross output and employment in the UK (for a given market size) was estimated using labour intensities and trade ratios from existing industry data.
Whilst this approach proved to be the best method for isolating the gross economic contribution of CAV and CAV technologies, it does have some some limitations. The drawbacks of this method meant that some CAV technologies may be under-represented in data. For example, the SIC07 code ‘2612: Manufacture of loaded electronic boards’ is used as a proxy for ‘CAV-related manufacture of sensor-supporting hardware’ but it could be the case that a large share of economic activities captured by this SIC07 code represent companies that are not currently involved in manufacturing CAV technologies (and do not plan to be in the future). Using sectoral economic data to estimate trade ratios and labour intensity is still likely to provide the best available estimates as, in many cases, the CAV technologies do map relatively well to existing products. In some cases, however, data at the SIC07 four-digit class level was not available and more aggregated data at the SIC07 two-digit class level had to be used instead. In these cases, it is likely that are results are less robust, as they would reflect average industry characteristics at a much broader level.
Data sourced for the UK capability assumptions was subject to a sense check from a review of the literature, which is described in detail in Appendix E. Tables showing the mapping of CAV-related activities to the UK SIC (2007) codes are available in Appendix D.
UK SIC (2007) sector UK SIC (2007) code Labour intensity (employees per £ million of turnover)
Manufacture of motor vehicles, trailers and semi-trailers
29 2.3
Manufacture of consumer electronics 2640 5.0
Manufacture of instruments and appliances for measuring, testing and navigation
2651 6.9
Manufacture of optical instruments and photographic equipment
2670 3.5
Manufacture of loaded electronic boards 2612 10.8
Manufacture of communication equipment 2630 10.8
Manufacture of electronic components 2611 6.8
Computer programming activities 6201 6.5
Computer consultancy activities 6202 7.9
Other information technology and computed service activities
6209 6.0
Data processing, hosting and related activities 6311 5.4
74
Transport Systems Catapult The case for government involvement to incentivise data sharing in the UK Intelligent Mobility sectorTransport Systems Catapult - Market Forecast for Connected and Autonomous Vehicles
75
Transport Systems Catapult Exploring the Opportunity for Mobility as a Service in the UKTransport Systems Catapult - Market Forecast for Connected and Autonomous Vehicles

Transport Systems Catapult - Market Forecast for Connected and Autonomous Vehicles
47 Henceforth referred to as SIC07.48 See: UK Standard Industrial Classification of economic activity (2007).
b) Using historical data to estimate the economic characteristics of industry sectors
Another criticism of the data-driven approach is that historical data used to assess the economic characteristics of industries is unlikely to be accurately reflect the economic characteristics of these industries in 10 or 20 years’ time.
The estimates presented in this report do not account for changes in trade intensity over time, as it is difficult to predict precisely how the UK’s competitive position is likely to change in the future, particularly as the focus of the analysis is on new, emerging technologies. As the trade intensities are a key uncertainty in our economic analysis, we test the impact of varying this assumption using sensitivity analysis (see Section 4.6 for more information).
The estimates of labour intensity are also based on the latest year of available data, but they are adjusted to account for expected future labour productivity improvements47.
6.4 D – MAPPING OF CAV TECHNOLOGIES TO UK SIC (2007) CODES
For the economic analysis, we used economic data classified by UK Standard Industry Classification (SIC) code (2007)48, to estimate the labour intensity and import and export shares of CAV technologies. The manufacture of each CAV technology was assigned to one or more SIC07 codes. The assignment was based on: keywords of CAV technologies found in the literature and information on primary activity of industries at the four-digit class level47. Where two or more SIC07 codes were relevant for one technology, a weighted average across the SIC07 codes was used to reflect the relevance of each industry for the manufacture of a specific CAV technology. Shares were applied to each of the SIC07 codes to reflect the proportion of different types of components included within a technology.
Table 6.8 shows the mapping of the production of each CAV technology to the relevant SIC code(s).
Technology UK SIC07 4 digit class definition SIC07 Class Heading Specific components included in each SIC07 code
Hardware
Sensing & local mapping hardware
2640 Manufacture of consumer electronics Cameras (video cameras)
2651Manufacture of instruments and appliances for measuring, testing and navigation
Radar, Odometry sensors, Ultrasonic sensors, Sensing & local mapping hardware (i.e. GPS receivers)
2670 Manufacture of optical instruments and photographic equipment LIDAR
Sensor-supporting hardware 2612 Manufacture of loaded electronic boards Actuators
Connectivity Hardwarehardwarehardware 2630 Manufacture of communication
equipment Embedded modem
Control systems and computing hardware
2611 Manufacture of electronic components Passive components, other electronics & architecture
2612 Manufacture of loaded electronic boards ECU hardware
77
Transport Systems Catapult - Market Forecast for Connected and Autonomous Vehicles
TABLE 6.8 Mapping of CAV technologies to UK SIC (2007) codes.
Technology UK SIC07 4 digit class definition SIC07 Class Heading Specific components included in each SIC07 code
Safety-related HMI hardware 2651
Manufacture of instruments and appliances for measuring, testing and navigation
External and internal sensors
Software
Control systems software
6201 Computer programming activities
Control systems software
6202 Computer consultancy activities
6209 Other information technology and computed service activities
6311 Data processing, hosting and related activities
Mapping & path planning software
6201 Computer programming activities
Connectivity / V2X software
6202 Computer consultancy activities
6209 Other information technology and computed service activities
6311 Data processing, hosting and related
Connectivity / V2X software
6201 Computer programming activities
Connectivity / V2X software
6202 Computer consultancy activities
6209 Other information technology and computed service activities
6311 Data processing, hosting and related activities
Data security software
6201 Computer programming activities
Data security software
6202 Computer consultancy activities
6209 Other information technology and computed service activities
6311 Data processing, hosting and related
HMI software
6201 Computer programming activities
HMI software
6202 Computer consultancy activities
6209 Other information technology and computed service activities
6311 Data processing, hosting and related
76 77

48 See: https://ts.catapult.org.uk/wp-content/uploads/2016/04/Traveller-Needs-Study.pdf49 See: http://tsctechstrategy.co.uk/wp-content/uploads/2016/04/Tech_Strategy_Brochure.pdf
49 Transport Systems Catapult (2015)50 Transport Systems Catapult (2016)
TABLE 6.9 Technology mapping between studies.
Traveller needs UK capability study Technology strategy for intelligent mobility Technology classification used in this study
- Autonomous vehicle CAV (29)
Connectivity networks - Connectivity hardware
Connectivity / Vehicle to Anything
(V2X) software
HMI & interaction design - Safety-related HMIhardware
HMI software
Localisation & mapping - Mapping & path planning software
Sensing and local mapping hardware
Data privacy and & security Security, resilience, safety and cyber security
Data security software
Real time control Data management and analysis Control systems and computing hardware
Control systems software
Data visualisation - HMI software
Sensing capabilities - Sensing & local mapping hardware
Sensor-supporting hardware
78
Transport Systems Catapult - Market Forecast for Connected and Autonomous Vehicles
6.5 E – COMPARISON OF DATA AND LITERATURE ON UK CAV CAPABILITIES
Two studies published by TSC were used to validate the assumptions on likely trade shares for CAV technologies:
• TSC (2015) ‘Traveller needs and UK capability study’49
• TSC (2016) ‘Technology Strategy for intelligent mobility’50
Both studies ranked technologies on a scale of 1-5, where a score of 1 indicates that the UK has weak capabilities and suggests the need to import a large share of that technology from abroad, and a score of 5 indicates that the UK has strong capabilities and would have a high propensity to supply to export markets. There was an issue of technology comparison between the TSC studies and the list of technologies in this project, as the categories defined were not the same. Notably, the list for this study made a clear distinction between hardware and software, enabling use of SIC code date, whereas the TSC studies combined these into complete technologies.
To compare between the data that was used to inform our modelling assumptions and the studies we compared our assumptions on UK capabilities (gross output as a proportion of UK supply) to the scores that each technology was assigned in the two studies. Our CAV technologies were mapped to the technologies from the TSC studies. If two technologies from our list mapped to one technology in another study, weighted averages based on the hardware/software split (mentioned above) were taken; see Table 6.9 which shows the mapping behind the assumptions of this study.
79
Transport Systems Catapult - Market Forecast for Connected and Autonomous Vehicles

There were two main issues when mapping technologies between studies. The first issue was broad definitions, in ‘Technology Strategy for Intelligent Mobility’, Data management and analysis has been assigned to Real time control, but it could also underpin the other technologies, as some sort of data management and analysis could be assumed paramount. The other issue was overlapping technologies, Sensing and local mapping hardware has been used twice, once in Localisation and mapping and again in Sensing capabilities. A few technologies have been excluded from the comparison due to a combination of the issues above.
There is a disparity between the literature and data for Sensing capabilities. The data indicates that the UK capabilities of building sensing hardware is strong, whereas the literature suggests it is limited. The literature acknowledges that the UK’s strength lies in being academically strong, particularly in vision-based sensors, but lacks the scalability of mass production required for the automotive and transport sectors. The extra funding from the Intelligent Mobility Fund, £2.2 million invested to help the advancement of sensing capabilities, may give justifications for the assumptions used in this study.
A wider gap in UK capabilities exists for HMI interaction and design. The literature suggests that the UK has a mature design industry that is keeping up with world leaders in app design and high technology solutions. The static and non-static information displays during the London 2012 Olympics are frequently cited by experts and success in app design such as Citymapper, Hailo and Kabbee further support UK capabilities in this area.
The gap highlights two issues with the assumptions made in this study. The first, a higher weight is attributed to hardware technologies than software technologies, therefore the manufacturing of consumer electronics (the SIC code that proxy’s Safety-related HMI hardware) is represented more than the software that underpins the ‘high tech solutions’ that the UK is capable of. The second is that the SIC codes used do not cover the value added from the design industry. This could be revised by altering the share to software, or increasing the UK capabilities to reflect the review of experts.
Figure 6.2 shows, for each technology, a comparison of the UK capabilities score from the literature review and the implied UK capabilities, based on data for similar technologies. The comparison shows that, for most technologies, findings from the literature broadly support the results from the data review (which is used as the basis for our trade assumptions). The error bars show the range of assumptions applied under the high UK capabilities sensitivity.
FIGURE 6.2 Comparison of assumptions on UK capabilities assumed for this study, with estimates from the existing literature.
120%
100%
80%
60%
40%
20%
0%
UK
capa
bilit
ies
(gro
ss o
utpu
t/su
pply
)
CAV Connectivity Networks
HMI &Interaction
Design
Localisation& Mapping
Data privacy& Security
Real-timeControl
Sensing Capabilities
Data Traveller needs and uk capability study Technology strategy for intelligent mobilityCE Assumptions
6
5
4
3
2
1
0
Ran
king
from
lite
ratu
re re
view
80
Transport Systems Catapult The case for government involvement to incentivise data sharing in the UK Intelligent Mobility sectorTransport Systems Catapult - Market Forecast for Connected and Autonomous Vehicles
81
Transport Systems Catapult Exploring the Opportunity for Mobility as a Service in the UKTransport Systems Catapult - Market Forecast for Connected and Autonomous Vehicles

6.6 F - SUMMARY OF RESULTS ACROSS SCENARIOS
TABLE 6.10 Summary tables for main scenarios.
CAV 2020 2025 2030 2035
Low
Gross Output (£bn) - 0.2 2.3 6.6
GVA (£bn) - 0.0 0.6 1.8
Jobs - 278 3,033 7,106
Imports (£bn) - 0.1 1.1 2.8
Exports (£bn) - 0.1 1.7 4.8
Investment (£bn) - 0.0 0.2 0.5
Central
Gross Output (£bn) 3.4 12.7 20.6 25.5
GVA (£bn) 0.9 3.4 5.6 6.9
Jobs 6,445 19,942 26,751 27,394
Imports (£bn) 3.6 11.3 15.4 17.1
Exports (£bn) 1.1 5.5 10.7 14.6
Investment (£bn) 0.2 0.9 1.4 1.8
Central UK Lead
Gross Output (£bn) 4.6 19.0 28.9 35.1
GVA (£bn) 1.2 5.1 7.8 9.5
Jobs 8,641 29,790 37,448 37,636
Imports (£bn) 5.4 21.1 28.3 32.0
Exports (£bn) 1.1 5.5 10.7 14.6
Investment (£bn) 0.3 1.3 2.0 2.4
High
Gross Output (£bn) 4.9 19.9 52.3 82.7
GVA (£bn) 1.3 5.4 14.1 22.3
Jobs 9,228 31,206 67,882 88,784
Imports (£bn) 5.9 22.4 51.7 54.2
Exports (£bn) 1.1 5.6 19.2 48.0
Investment (£bn) 0.3 1.4 3.6 5.7
CAV Technologies 2020 2025 2030 2035
Low
Gross Output (£bn) - 0.01 0.15 0.46
GVA (£bn) - 0.01 0.08 0.27
Jobs - 61 574 1,517
Imports (£bn) - 0.01 0.10 0.28
Exports (£bn) - 0.0 0.03 0.09
Investment (£bn) - 0.0 0.01 0.03
Central
Gross Output (£bn) 03 0.7 1.4 1.8
GVA (£bn) 0.2 0.5 0.9 1.2
Jobs 1,467 3,444 5,428 5,970
Imports (£bn) 0.3 0.8 1.2 1.4
Exports (£bn) 0.0 0.1 0.2 0.2
Investment (£bn) 0.0 0.0 0.1 0.1
Central UK Lead
Gross Output (£bn) 0.4 1.6 2.5 3.1
GVA (£bn) 0.2 1.0 1.6 2.1
Jobs 2,073 7,332 9,696 10,183
Imports (£bn) 0.5 1.7 2.3 2.6
Exports (£bn) 0.0 0.1 0.2 0.2
Investment (£bn) 0.0 0.1 0.1 0.2
High
Gross Output (£bn) 0.4 1.8 4.6 5.2
GVA (£bn) 0.3 1.2 3.0 3.3
Jobs 2,140 8,151 17,855 16,975
Imports (£bn) 0.5 1.9 4.1 3.8
Exports (£bn) 0.0 0.1 0.3 0.6
Investment (£bn) 0.0 0.1 0.3 0.3
82
Transport Systems Catapult The case for government involvement to incentivise data sharing in the UK Intelligent Mobility sectorTransport Systems Catapult - Market Forecast for Connected and Autonomous Vehicles
83
Transport Systems Catapult Exploring the Opportunity for Mobility as a Service in the UKTransport Systems Catapult - Market Forecast for Connected and Autonomous Vehicles

TABLE 6.11 Summary tables for sensitivities on central scenario.
CAV 2020 2025 2030 2035
Central
Gross Output (£bn) 3.4 12.7 20.6 25.5
GVA (£bn) 0.9 3.4 5.6 6.9
Jobs 6,445 19,942 26,751 27,394
Imports (£bn) 3.6 11.3 15.4 17.1
Exports (£bn) 1.1 5.5 10.7 14.6
Investment (£bn) 0.2 0.9 1.4 1.8
Central Market Size, High UK Capabilities
Gross Output (£bn) 5.8 21.1 33.7 41.3
GVA (£bn) 1.6 5.7 9.1 11.2
Jobs 10,902 33,095 43,732 44,385
Imports (£bn) 1.8 5.6 7.7 8.5
Exports (£bn) 1.6 8.2 16.1 21.9
Investment (£bn) 0.4 1.5 2.3 2.8
Central Market Size,
Low Software Share
Gross Output (£bn) 3.4 12.7 20.6 25.5
GVA (£bn) 0.9 3.4 5.6 6.9
Jobs 6,445 19,942 26,751 27,394
Imports (£bn) 3.6 11.3 15.4 17.1
Exports (£bn) 1.1 5.5 10.7 14.6
Investment (£bn) 0.2 0.9 1.4 1.8
CAV Technologies 2020 2025 2030 2035
Central
Gross Output (£bn) 0.3 0.7 1.4 1.8
GVA (£bn) 0.2 0.5 0.9 1.2
Jobs 1,467 3,444 5,428 5,970
Imports (£bn) 0.3 0.8 1.2 1.4
Exports (£bn) 0.0 0.1 0.2 0.2
Investment (£bn) 0.0 0.0 0.1 0.1
Central Market Size, High UK Capabilities
Gross Output (£bn) 0.5 1.3 2.2 2.7
GVA (£bn) 0.2 0.7 1.2 1.5
Jobs 2,430 5,666 8,410 8,904
Imports (£bn) 0.2 0.4 0.6 0.7
Exports (£bn) 0.0 0.1 0.3 0.3
Investment (£bn) 0.0 0.1 0.1 0.2
Central Market Size,
Low Software Share
Gross Output (£bn) 0.2 0.7 1.2 1.5
GVA (£bn) 0.1 0.4 0.7 0.9
Jobs 1,276 3,046 4,737 5,113
Imports (£bn) 0.4 0.9 1.4 1.7
Exports (£bn) 0.0 0.1 0.2 0.2
Investment (£bn) 0.0 0.0 0.1 0.1
84
Transport Systems Catapult - Market Forecast for Connected and Autonomous Vehicles
85
Transport Systems Catapult - Market Forecast for Connected and Autonomous Vehicles
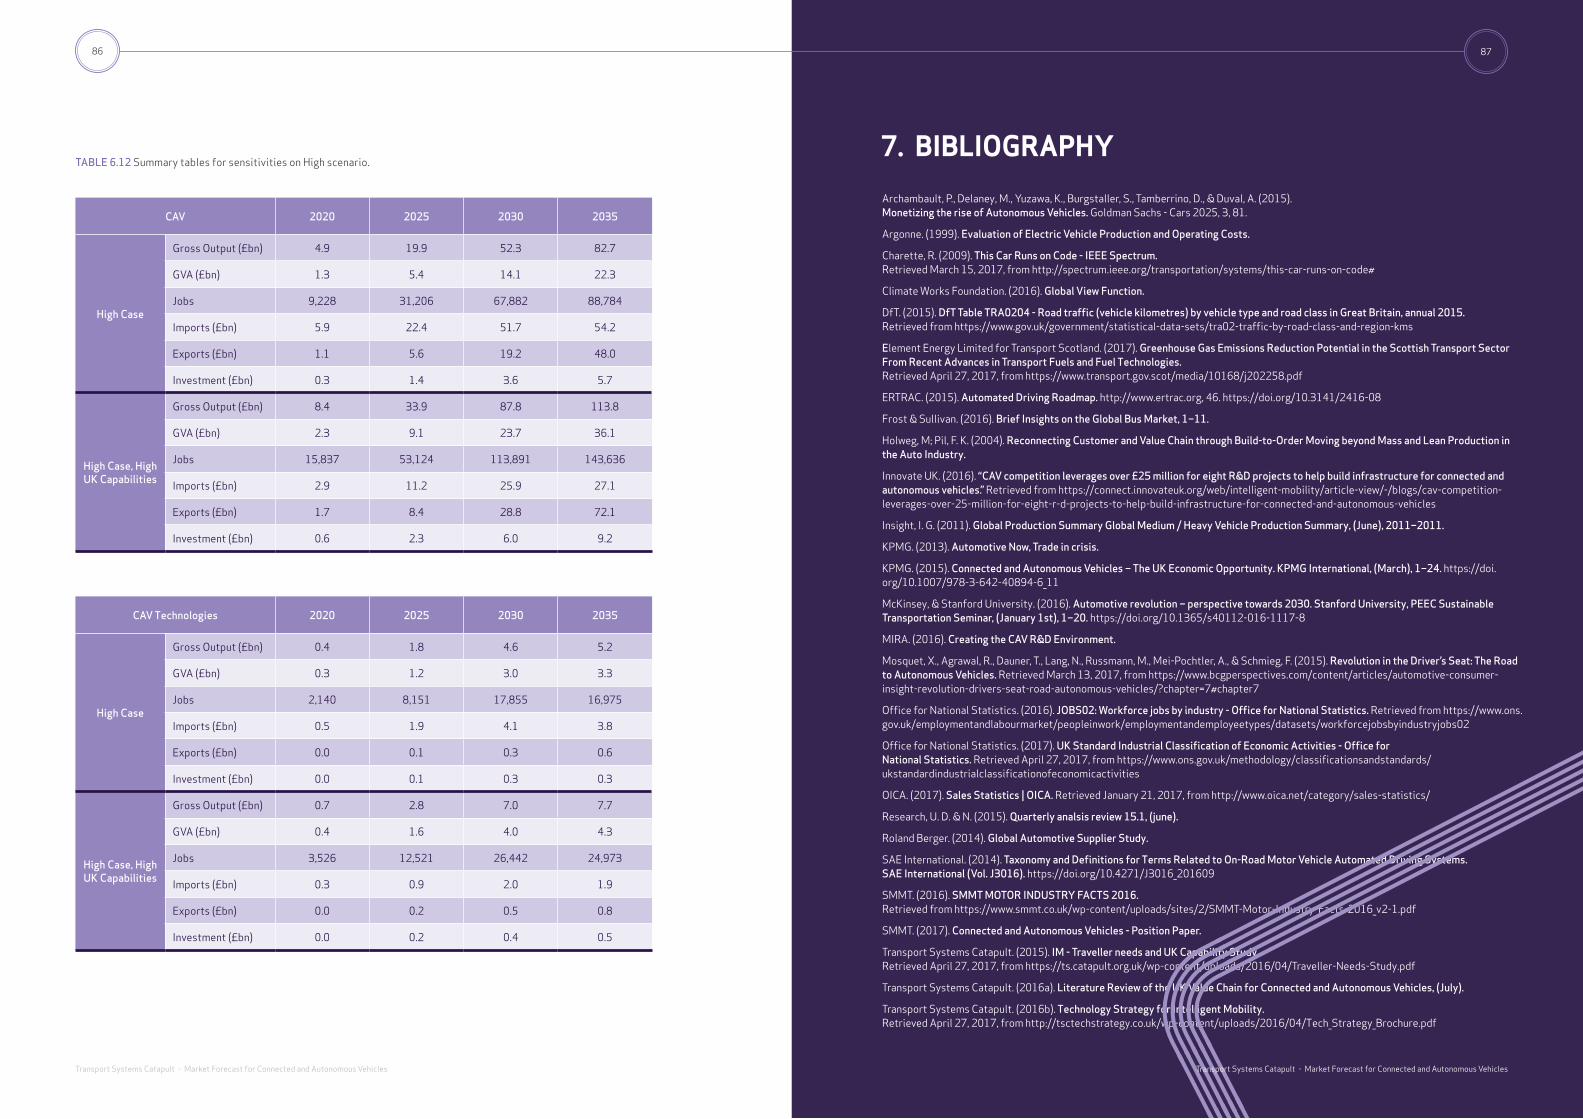
7. BIBLIOGRAPHY
Archambault, P., Delaney, M., Yuzawa, K., Burgstaller, S., Tamberrino, D., & Duval, A. (2015). Monetizing the rise of Autonomous Vehicles. Goldman Sachs - Cars 2025, 3, 81.
Argonne. (1999). Evaluation of Electric Vehicle Production and Operating Costs.
Charette, R. (2009). This Car Runs on Code - IEEE Spectrum. Retrieved March 15, 2017, from http://spectrum.ieee.org/transportation/systems/this-car-runs-on-code#
Climate Works Foundation. (2016). Global View Function.
DfT. (2015). DfT Table TRA0204 - Road traffic (vehicle kilometres) by vehicle type and road class in Great Britain, annual 2015. Retrieved from https://www.gov.uk/government/statistical-data-sets/tra02-traffic-by-road-class-and-region-kms
Element Energy Limited for Transport Scotland. (2017). Greenhouse Gas Emissions Reduction Potential in the Scottish Transport Sector From Recent Advances in Transport Fuels and Fuel Technologies. Retrieved April 27, 2017, from https://www.transport.gov.scot/media/10168/j202258.pdf
ERTRAC. (2015). Automated Driving Roadmap. http://www.ertrac.org, 46. https://doi.org/10.3141/2416-08
Frost & Sullivan. (2016). Brief Insights on the Global Bus Market, 1–11.
Holweg, M; Pil, F. K. (2004). Reconnecting Customer and Value Chain through Build-to-Order Moving beyond Mass and Lean Production in the Auto Industry.
Innovate UK. (2016). “CAV competition leverages over £25 million for eight R&D projects to help build infrastructure for connected and autonomous vehicles.” Retrieved from https://connect.innovateuk.org/web/intelligent-mobility/article-view/-/blogs/cav-competition-leverages-over-25-million-for-eight-r-d-projects-to-help-build-infrastructure-for-connected-and-autonomous-vehicles
Insight, I. G. (2011). Global Production Summary Global Medium / Heavy Vehicle Production Summary, (June), 2011–2011.
KPMG. (2013). Automotive Now, Trade in crisis.
KPMG. (2015). Connected and Autonomous Vehicles – The UK Economic Opportunity. KPMG International, (March), 1–24. https://doi.org/10.1007/978-3-642-40894-6_11
McKinsey, & Stanford University. (2016). Automotive revolution – perspective towards 2030. Stanford University, PEEC Sustainable Transportation Seminar, (January 1st), 1–20. https://doi.org/10.1365/s40112-016-1117-8
MIRA. (2016). Creating the CAV R&D Environment.
Mosquet, X., Agrawal, R., Dauner, T., Lang, N., Russmann, M., Mei-Pochtler, A., & Schmieg, F. (2015). Revolution in the Driver’s Seat: The Road to Autonomous Vehicles. Retrieved March 13, 2017, from https://www.bcgperspectives.com/content/articles/automotive-consumer-insight-revolution-drivers-seat-road-autonomous-vehicles/?chapter=7#chapter7
Office for National Statistics. (2016). JOBS02: Workforce jobs by industry - Office for National Statistics. Retrieved from https://www.ons.gov.uk/employmentandlabourmarket/peopleinwork/employmentandemployeetypes/datasets/workforcejobsbyindustryjobs02
Office for National Statistics. (2017). UK Standard Industrial Classification of Economic Activities - Office for National Statistics. Retrieved April 27, 2017, from https://www.ons.gov.uk/methodology/classificationsandstandards/ukstandardindustrialclassificationofeconomicactivities
OICA. (2017). Sales Statistics | OICA. Retrieved January 21, 2017, from http://www.oica.net/category/sales-statistics/
Research, U. D. & N. (2015). Quarterly analsis review 15.1, (june).
Roland Berger. (2014). Global Automotive Supplier Study.
SAE International. (2014). Taxonomy and Definitions for Terms Related to On-Road Motor Vehicle Automated Driving Systems. SAE International (Vol. J3016). https://doi.org/10.4271/J3016_201609
SMMT. (2016). SMMT MOTOR INDUSTRY FACTS 2016. Retrieved from https://www.smmt.co.uk/wp-content/uploads/sites/2/SMMT-Motor-Industry-Facts-2016_v2-1.pdf
SMMT. (2017). Connected and Autonomous Vehicles - Position Paper.
Transport Systems Catapult. (2015). IM - Traveller needs and UK Capability Study. Retrieved April 27, 2017, from https://ts.catapult.org.uk/wp-content/uploads/2016/04/Traveller-Needs-Study.pdf
Transport Systems Catapult. (2016a). Literature Review of the UK Value Chain for Connected and Autonomous Vehicles, (July).
Transport Systems Catapult. (2016b). Technology Strategy for Intelligent Mobility. Retrieved April 27, 2017, from http://tsctechstrategy.co.uk/wp-content/uploads/2016/04/Tech_Strategy_Brochure.pdf
TABLE 6.12 Summary tables for sensitivities on High scenario.
CAV 2020 2025 2030 2035
High Case
Gross Output (£bn) 4.9 19.9 52.3 82.7
GVA (£bn) 1.3 5.4 14.1 22.3
Jobs 9,228 31,206 67,882 88,784
Imports (£bn) 5.9 22.4 51.7 54.2
Exports (£bn) 1.1 5.6 19.2 48.0
Investment (£bn) 0.3 1.4 3.6 5.7
High Case, High UK Capabilities
Gross Output (£bn) 8.4 33.9 87.8 113.8
GVA (£bn) 2.3 9.1 23.7 36.1
Jobs 15,837 53,124 113,891 143,636
Imports (£bn) 2.9 11.2 25.9 27.1
Exports (£bn) 1.7 8.4 28.8 72.1
Investment (£bn) 0.6 2.3 6.0 9.2
CAV Technologies 2020 2025 2030 2035
High Case
Gross Output (£bn) 0.4 1.8 4.6 5.2
GVA (£bn) 0.3 1.2 3.0 3.3
Jobs 2,140 8,151 17,855 16,975
Imports (£bn) 0.5 1.9 4.1 3.8
Exports (£bn) 0.0 0.1 0.3 0.6
Investment (£bn) 0.0 0.1 0.3 0.3
High Case, High UK Capabilities
Gross Output (£bn) 0.7 2.8 7.0 7.7
GVA (£bn) 0.4 1.6 4.0 4.3
Jobs 3,526 12,521 26,442 24,973
Imports (£bn) 0.3 0.9 2.0 1.9
Exports (£bn) 0.0 0.2 0.5 0.8
Investment (£bn) 0.0 0.2 0.4 0.5
86
Transport Systems Catapult - Market Forecast for Connected and Autonomous Vehicles
87
Transport Systems Catapult - Market Forecast for Connected and Autonomous Vehicles

Transport Systems Catapult ,
The Pinnacle,
170 Midsummer Boulevard ,
Milton Keynes,
MK9 1BP,
UK
Tel: 01908 359 999
www.ts.catapult.org.uk
linkedin.com/company/transport-systems-catapult
Twitter: @TSCatapult
MARKET FORECASTFOR CONNECTED AND AUTONOMOUS VEHICLES
July 2017