Embed Size (px)
Citation preview
©2008 CIBT Comparing Aquatic Communities – Teacher Section Page 1
Cornell Institute for Biology Teachers
Copyright CIBT This work may be copied by the original recipient from CIBT to provide copies for users working under the direction of the original recipient. All other redistribution of this work without the written permission of the copyright holder is prohibited.
Lab issue/rev. date: 6/30/2008
Title: Comparing Aquatic Communities
Authors: A. Thomas Vawter, Department of Biology, Wells College Doug Pens, New Hartford High School Ronald Walker, Rush-Henrietta Senior High School
Appropriate Level: General Biology, Regents Biology, and A.P. Biology.
Living Environment Standards:
1-Inquiry, analysis, design: 1-Purpose of scientific inquiry: 1.1a; 3-Analysis of results: 3.1a; 4-Content: 1-Living things: 1.1b; 3-Change over time: 3.1g, 3.1i 5-Dynamic Equilibrium: 5.1a,b, 5.2j; 6-Ecology: 6.1a,c,d,e, 6.3c
Abstract: Teams of students measure physical and chemical characteristics of different sites in streams and/or ponds and collect benthic invertebrate organisms. They interpret patterns in the structure of the biological community at each site in light of the abiotic (physical and chemical) and biotic nature of the environment.
Time Required: Preparation Time: 1-2 hr. Field Trip Time: 2-3 hr at pond or stream. Classroom Time: 1-2 periods to analyze data and answer questions.
Special Needs: Most equipment is available from the CIBT Lending Library as the “Limnology Kit.”
©2008 CIBT Comparing Aquatic Communities – Teacher Section Page 2
Teacher Information
Background Information
Lakes, ponds, and streams are excellent subjects for ecological studies. Because the air-water and land-water interfaces constitute obvious boundaries between aquatic and terrestrial habitats, it is easy to imagine a lake, pond or stream as a self-contained ecosystem; and ecological studies can address any of a number of levels of biological organization within these aquatic habitats, from the individual organism, to the population, to the community, or to the ecosystem. Questions concerning the interrelationships among these levels can also lead to interesting field studies.
The term aquatic most often refers to inland waters -- lakes, ponds, rivers, streams, and sometimes bogs and other wetlands. Although the oceans also are “aquatic” in the sense that they contain water, they are usually described as marine. The study of marine waters is called oceanography, and the study of inland waters is called limnology. Limnological studies may concentrate on the abiotic, physical and chemical characteristics of the environment, or on the biotic characteristics. The linkage between abiotic and biotic components may be more direct and more easily observed in aquatic systems than in terrestrial ones, and this is one of the things that make them such good subjects for ecosystem study. Aquatic environments dominated by flowing water -- rivers and streams -- are termed lotic environments, and still waters -- lakes and ponds -- are referred to as lentic environments.
In this lab exercise, students sample both abiotic and biotic characteristics of two or more aquatic sites to try to understand the patterns of distribution and abundance of the organisms that occur there. The lab begins with a description of the various parameters they will measure and some reasons why they may be important. The biological focus in this lab is on benthic or bottom-dwelling invertebrates, mostly insects, although the instructor may wish to modify the study to have a different focus. Interpretation of the results of the various physical and chemical measurements may be assisted by reference to Mitchell and Stapp, A Field Manual for Water Quality Monitoring.
ABIOTIC CHARACTERISTICS (Physical)
• Water Movements. Rivers and streams flow downhill. The one-way movement of the water in these environments is their defining characteristic. By comparison the water in lakes or ponds in still, although there may be circulating currents stimulated by winds or temperature and/or density differences in the water. Some areas of streams may be deeper than others and the water there may move more slowly; such pools may have some of the characteristics of ponds or lakes.
©2008 CIBT Comparing Aquatic Communities – Teacher Section Page 3
The movement of water in a stream can be measured simply as the velocity of flow. A simple way to measure velocity is to time the movement of a floating object (an orange works well) over a measured distance in the stream. Have two people stand 5 or 10 meters apart in the direction of stream flow. The upstream person tosses the orange slightly more upstream and begins a stopwatch when the orange passes. When the orange reaches the downstream person, he or she shouts “stop” and retrieves the orange. The upstream person records the time, and the process is repeated. The velocity can be calculated in meters/second as the average for 5 trials.
The velocity of a stream varies from place to place depending on the shape and slope of the channel. The volume of flow or discharge rate is much less variable and changes only as water enters or leaves the stream. It can be calculated by multiplying the velocity by the average cross-sectional area of the stream. To calculate the average cross-sectional area, measure the width of the stream at 5 points near each other and take the average. At one of the points, measure the depth at five evenly spaced points across the stream, and take the average of these measurements.
Discharge Rate (m3/sec.) = (velocity) x (ave. depth) x (ave. width) x (friction coefficient). The friction coefficient is 0.8 for rubble or gravel bottom; 0.9 for mud, sand, or bedrock.
• Temperature. Water has a very high specific heat and high latent heat of vaporization. That means that a great deal of heat (i.e., energy) can be put into or taken out of water without changing its temperature very much. Aquatic environments are therefore less variable with regard to temperature than are terrestrial (i.e., land-based) ones and have a temperature buffering effect on nearby land areas. Water temperature can have profound direct effects on aquatic organisms. It also can affect them indirectly by changing the concentrations of dissolved gasses and by inducing water movements.
The water temperature of streams, especially swift ones, is not likely to change much with depth. The turbulence of the water and its constant exposure to the air keep the water well mixed and at more or less constant temperature. The temperature of still water, however, can vary considerably with depth. Remember, warm water is “light” and rises to the top; cold water is dense and sinks. In summer and early fall, lakes and ponds become stratified with warm water on top and cooler water on the bottom. Typically, the fall of temperature with depth is not constant, and there’s a zone of rapid temperature decline -- the thermocline -- some distance beneath the surface.
There is an exception to this type of temperature stratification, with warm water above cold water. One of the many unusual properties of water is that it is most dense at 4 C. That’s why ice floats and why water freezes from the top down. This also means that, in regions like ours, with cold winters, the coldest water in the winter, which may be in contact with ice and therefore be 0° C, lies
©2008 CIBT Comparing Aquatic Communities – Teacher Section Page 4
above warmer water. As this change in temperature and density proceeds through the fall and spring, the lake or pond goes through a state where the water is of the same temperature from top to bottom. When this occurs, wind breaks up the stratification and the lake or pond turns over.
Temperature can be read from an ordinary thermometer if the water is shallow enough. To measure temperature at depth, one may use an electronic thermometer with a long probe or may measure the temperature of water samples collected with a sampling bottle such as a Kemmerer or a Nansen bottle. Temperature must be taken in the shade; hold your hand between the sun and the bulb of the thermometer.
• Turbidity and Color. Particles in the water, either microscopic pieces of non-living matter like mud or silt, or microscopic living organisms can lower the transparency of the water and make it turbid. Water may also have a distinct color, either because of the nature of the particles contributing to turbidity or because of certain chemicals dissolved in it. One of the most important chemicals contributing a greenish color to natural waters is chlorophyll, which is present in the phytoplankton, i.e., the microscopic algae and cyanobacteria suspended in the water. (Small, suspended animals are zooplankton.)
Turbidity, or its opposite, transparency, is usually measured with a Secchi Disc, a 20 cm disc divided into 4 quarters, two of which are white and two of which are black, that is suspended from a calibrated line. To obtain a reading, lower the disc into the water in a shaded spot until the disc just disappears, and, using the calibrations on the line, note this depth. Lower the disc a little more and then slowly retrieve it. Note the depth at which it just becomes visible again. The average of these two depths is the Secchi disc reading.
ABIOTIC CHARACTERISTICS (Chemical)
• pH. This is a measure of the acidity of the water, i.e., the presence of hydrogen ions. Neutral water has a pH of 7.0; the pH of acidic water is lower than that; and the pH of alkaline water is higher than that. Because water in contact with air absorbs carbon dioxide, CO2, which then forms carbonic acid, H2CO3, natural precipitation has a pH of 5.6. Dissolved limestone or other buffering chemicals in the water can increase the pH above 7.0.
Photosynthesis removes CO2 from the water and increases the pH. Respiration adds CO2 to the water and decreases pH. This chemical “abiotic” factor is therefore tied directly to a biotic factor -- ecosystem primary productivity and the metabolism of organisms. Coal-burning industries release to the atmosphere large amounts of sulfur and nitrogen oxides, SOx and NOx, that combine with water vapor to form sulfuric and nitric acids, H2SO4 and HNO3. These become dissolved in rain or
©2008 CIBT Comparing Aquatic Communities – Teacher Section Page 5
snow, and this so-called acid precipitation can also cause surface waters to have low pH, especially in regions where the bedrock is granite or basalt and has little or no buffering capacity compared to some sedimentary rock, like limestone.
pH is determined either with an electronic meter or with a chemical test kit. Follow the directions with the instrument or kit.
• Dissolved Gasses. The two most important gasses dissolved in water are carbon dioxide and oxygen. Oxygen is much more abundant in air than is carbon dioxide (22% vs. <0.5%), but, since CO2 is much more soluble, the saturation concentrations in water are similar. Cold water holds more of a gas at saturation than does warm water.
In turbulent water, such as streams, the concentrations of these gasses are likely to be in equilibrium with the air through diffusion. In standing water, however, the metabolism of organisms is likely to be more important in determining the concentrations of these dissolved gasses. During the day, the phytoplankton and the plants and algae attached to the bottom photosynthesize and contribute more O2 to the water than they consume in respiration; the water near the surface may be saturated, or even supersaturated with dissolved O2. At night, photosynthesis stops and the process is reversed; CO2 accumulates in the water and O2 declines. If the lake or pond is stratified and surface water and deeper water do not mix, the surface waters may be saturated with O2 while the bottom water becomes anaerobic. These effects will be greatest in highly productive eutrophic water with lots of phytoplankton and may be unnoticeable in unproductive oligotrophic waters.
Remember, changes in dissolved CO2 will affect the pH too.
Concentrations of these gasses are measured with electronic meters or with chemical test kits. Results are often given in parts per million (ppm), which is equivalent to mg/l.
• Dissolved Solids. These are mostly “salts” of various kinds. Total Dissolved Solids (TDS) is a measure of overall “saltiness.” It can be measured by evaporating a given volume of water and weighing the residue, but it is most often measured as the electrical conductivity of the water.
Nitrogen and phosphorous may be present in a number of forms (NO3-, N02
-, NH4+, PO4
-3, HPO3-
2, etc.) dissolved in natural waters. Because they are often present in limiting amounts and are needed by living organisms in relatively large quantity, these two elements are likely to be the most important determinants of productivity of the ecosystem. Sulfate, SO4
-2, comes from polluted drainage and from acid precipitation as well as from the metabolism of certain microorganisms.
The concentrations of these and other dissolved chemicals can be determined using commercial
©2008 CIBT Comparing Aquatic Communities – Teacher Section Page 6
chemical test kits.
BIOTIC CHARACTERISTICS (Ecosystem Level)
• Primary Productivity. This is a measure of the rate at which the ecosystem converts solar energy into biochemical energy. Gross Primary Productivity is a measure of the overall rate of photosynthesis in the ecosystem, while Net Primary Productivity is what remains of the gross productivity after the respiration of the photosynthesizing autotrophs. It can be measured in a number of ways: as the rate at which inorganic carbon in converted to organic form, or the rate of biomass accumulation, or as the rate at which dissolved oxygen is produced or dissolved CO2 consumed.
One relative index that might allow comparison of two aquatic habitats is to compare dissolved oxygen concentration in the morning -- after a night of respiration with no photosynthesis -- and in the evening -- after a day of photosynthesis and respiration occurring simultaneously. More productive (eutrophic) systems should have greater swings in dissolved oxygen concentration.
The amount of phytoplankton or of attached algae or higher plants is also an indication of productivity. One standard way of measuring productivity is to extract the chlorophyll from the phytoplankton in a given volume of water. There is a high positive correlation between amount of chlorophyll and primary production. The turbidity (Secchi disc reading) or general “greenness” of the water can serve as an informal indicator.
BIOTIC CHARACTERISTICS (Community Level)
• Food Web Structure. With information on the diets of the organisms collected, one can construct a food chain or food web.
• Patterns of Dominance and Taxon Diversity. Some communities have few species; some have many. Two communities with the same number of species (i.e., richness) may differ in diversity because in one there is a greater effect of dominance, where one or a few species comprise most of the organisms present. Communities with high dominance, have low diversity.
In this lab exercise, keys are provided for the identification and enumeration of organisms. Because it is very difficult to identify many of these aquatic organisms to species, or even to genus, students will work only with higher taxa -- usually orders. Thus, the “taxon diversity” we work with in this lab may differ significantly from the actual “species diversity” of the community. Nonetheless, interesting patterns can be observed.
©2008 CIBT Comparing Aquatic Communities – Teacher Section Page 7
Students should sort their samples, keeping like specimens together, and they should estimate the number of each type of invertebrate they find. It is not necessary to attach a name to every type, only to keep track of the number of types encountered and their relative abundance.
BIOTIC CHARACTERISTICS (population and organism levels)
Students may observe and investigate any of a number of adaptations of the organisms to their environment: How do they breathe in the water? How do they remain in place in a flowing stream?
The CIBT Lab entitled “Investigations with Pond Invertebrates” has a number of suggestions for studies of the individual adaptations.
Planning Ahead
The CIBT Lending Library has kits for freshwater ecology. The instructor should spend some time reviewing the instructions that accompany the kits. In particular, it is important to read the instructions for the chemical test kits and to make sure all the reagents are present. If possible, the instructor should visit the field site in advance to determine what organisms are present. Some of the most important elements of the benthic fauna of streams and ponds are immature forms of flying insects -- mayflies (Ephmeroptera), stoneflies (Plecoptera), beetles (Coleoptera), true bugs (Hemiptera), and true flies (Diptera) -- that metamorphose in the summer and emerge from the water. They can best be studied in the spring, from March until June when they are largest. Immature forms of insects that undergo “incomplete” metamorphosis are typically called nymphs; those that undergo “complete” metamorphosis are called larvae (sing. = larva).
Expected Results / Sources of Error
Most of the abiotic (i.e., physical and chemical) parameters measured in this lab are related directly or indirectly to the productivity of the environment: High concentrations nitrogen or phosphorus contribute to eutrophication and the production of phytoplankton; this, in turn, makes the water less transparent, increases its temperature, and leads to diurnal shifts in dissolved oxygen and carbon dioxide concentrations as photosynthesis and respiration alternate in importance with changing light levels. The biology of streams is dominated by the movement of the water: Plankton is likely to be absent or greatly reduced compared to ponds and primary productivity is due mostly to attached plants and algae. Benthic animals are likely to possess adaptations for clinging to the bottom or otherwise remaining in place in the current, and dissolved gasses are likely to be influenced more by aeration of the water turbulence than by gas exchange of organisms.
©2008 CIBT Comparing Aquatic Communities – Teacher Section Page 8
Bibliography
Andrews, William A. 1972. A Guide to the Study of Freshwater Ecology. Prentice-Hall, Inc. 182 pp.
Fraissinet, P. and D. Wiley. 1991. Investigations with Pond Invertebrates. Cornell Institute for Biology Teachers Take-home Lab. Available on the CIBT-Net.
McCafferty, W. P. 1981. Aquatic Entomology. Science Books International, Boston. 444 pp.
Merritt, R. W., and K. W. Cummins. 1978. An Introduction to the Aquatic Insects of North America. Kendall/Hunt Publ. Co., Dubuque Iowa.
Mitchell, and Stapp. Field Manual for Water Quality Monitoring. Thompson-Shore Printers, Dexter, MI.
Morgan, Ann H. 1930. Field Book of Ponds and Streams. A Putnam Nature Field Book. 448 pp.
Needham, James G. and Paul R. Needham. 1962. A Guide to the Study of Fresh-water Biology. Holden-Day, Inc. 108 pp.
Lind, Owen T. 1974. Handbook of Common Methods in Limnology. The C.V. Mosby Company. 154 pp.
Reid, George K. 1967. Pond Life. Golden Press. 160 pp.
©2008 CIBT Comparing Aquatic Communities – Teacher Section Page 9
Comparing Aquatic Communities New York State Learning Standards
Standard 1: Inquiry Analysis and Design
Key Idea 1: The purpose of scientific inquiry is to develop explanations of natural phenomena in a continuing and creative process.
1.1- Elaborate on basic scientific and personal explanations of natural phenomena and develop extended visual models and mathematical formulations to represent one’s thinking.
Key Idea 3: The observations made while testing proposed explanations, when analyzed using conventional and invented methods, provide new insights into natural phenomena.
3.1- Use various methods of representing and organizing observations (i.e., diagrams, tables, charts, graphs, equations, matrices) and insightfully interpret the organized data.
Standard 4: Content
Key Idea 1: Living things are both similar and to and different from each other and from nonliving things. 1.1- Explain how diversity of populations within ecosystems relates to the stability of
ecosystems. Key Idea 3: Individual organisms and species change over time 3.1- Explain the mechanisms and patterns of evolution. Key Idea 5: Organisms maintain a dynamic equilibrium that sustains life.
5.1- Explain the basic biochemical processes in living organisms and their importance in maintaining dynamic equilibrium.
5.2- Explain disease as a failure of homeostasis Key Idea 6: Plants and animals depend on each other and their physical environment 6.1- Explain factors that limit growth of individuals and populations.
6.3- Explain how the living and nonliving environments change over time and respond to disturbances.
©2008 CIBT Comparing Aquatic Communities – Student Section Page 1
Background Information
This laboratory is intended to familiarize you with the aquatic ecosystems of ponds and/or streams and the diversity of life found in them. You will also measure some physical and chemical characteristics of the ecosystems and consider their possible roles in determining the distribution and abundance of organisms.
PART I: Measurement of Abiotic Characteristics
Supplies
• waders or hip boots (optional) • 30 m or 50 m tape measure
• meter stick • thermometer
• stopwatch • orange or other visible floating object
• Secchi disc on calibrated line • water sampling bottle on calibrated line
• pH meter • TDS meter
• various chemical test kits (D.O., CO2,
phosphate, nitrate, sulfate)
Procedure
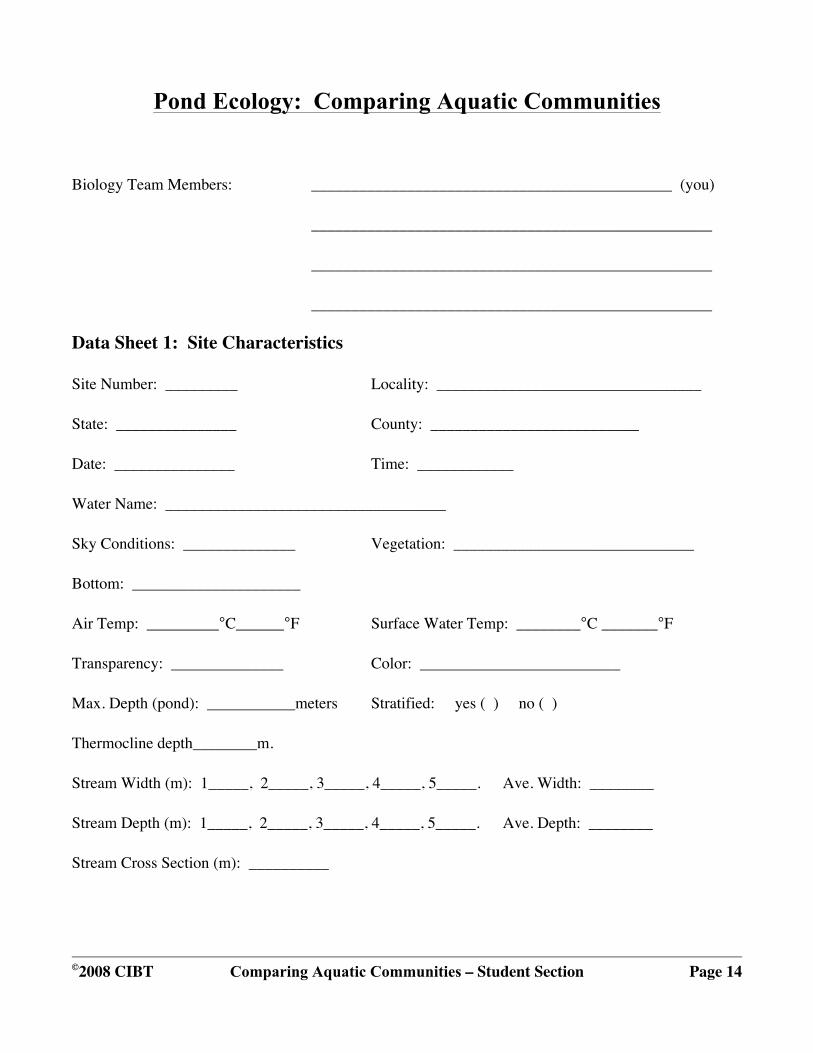
As completely as possible, record the site information requested in the top part of Data Sheet 1: Site Characteristics. Use the equipment provided to measure the following physical and chemical characteristics of your site.
Pond Ecology: Comparing Aquatic Communities
©2008 CIBT Comparing Aquatic Communities – Student Section Page 2
1. Dimensions
For a pond site, estimate the surface area. If the pond is roughly circular, measure or estimate the diameter and calculate a corresponding area. If the pond is roughly rectangular, estimate or measure the length and width and calculate the corresponding area. Using a calibrated line with a weight attached (the Secchi disc line may be suitable) to determine the depth at the deepest point. Record your results under Site Characteristics on Data Sheet 1.
For a stream site, use a tape measure to measure the width of the stream at 5 points within the area you wish to refer to as your “site.” Take an average of the 5 to determine average width. Record the measurements and the average in the appropriate place on Data Sheet 1. Along one of these 5 transects across the stream, use a meter stick to measure the depth at 5 equally spaced points. Average these 5 measurements and record the measurements and an average depth on Data Sheet 1. Multiply average width by average depth to determine average cross section. Record this on Data Sheet 1.
2. Temperature: Use a thermometer to record the temperature of the air and the surface water at your site. Remember that all temperatures must be measured “in the shade,” so, if your site is a sunny one, hold your hand over the thermometer bulb as you record temperatures. Air temperature must be measured with a dry thermometer bulb.
At stream sites you need to record only one water temperature. At pond sites, however, you must record temperatures from the surface to the bottom at 0.5 m intervals. You may be able to use a dock to reach deeper areas of the pond, or you may need a boat. If you have an electronic thermometer with a long probe, lower the probe 0.5 m into the pond, allow the temperature reading to equilibrate (i.e., become constant), and record the temperature in Data Sheet 2: Depth Profile. Lower the probe another 0.5 m, wait about 30 sec. for equilibration, and record another temperature.
If you do not have an electronic thermometer with a long probe, use a standard mercury thermometer to record the temperature of water retrieved from depth with the sampling bottle as you collect water for other tests. (See below.)
3. Transparency: At stream sites or shallow ponds, where the bottom can be viewed
©2008 CIBT Comparing Aquatic Communities – Student Section Page 3
from the surface, record the maximum depth visible. In deeper ponds, use a Secchi disc to determine transparency. On a line marked at least in 0.5 m units, lower the disc over the shady side of the boat or dock. When the disc just disappears, record the depth. Lower the disc slightly and then retrieve it slowly. When you can first see it reappear, record that depth. The Secchi disc reading of transparency is the average of these two readings. Record the transparency on Data Sheet 1 under site characteristics.
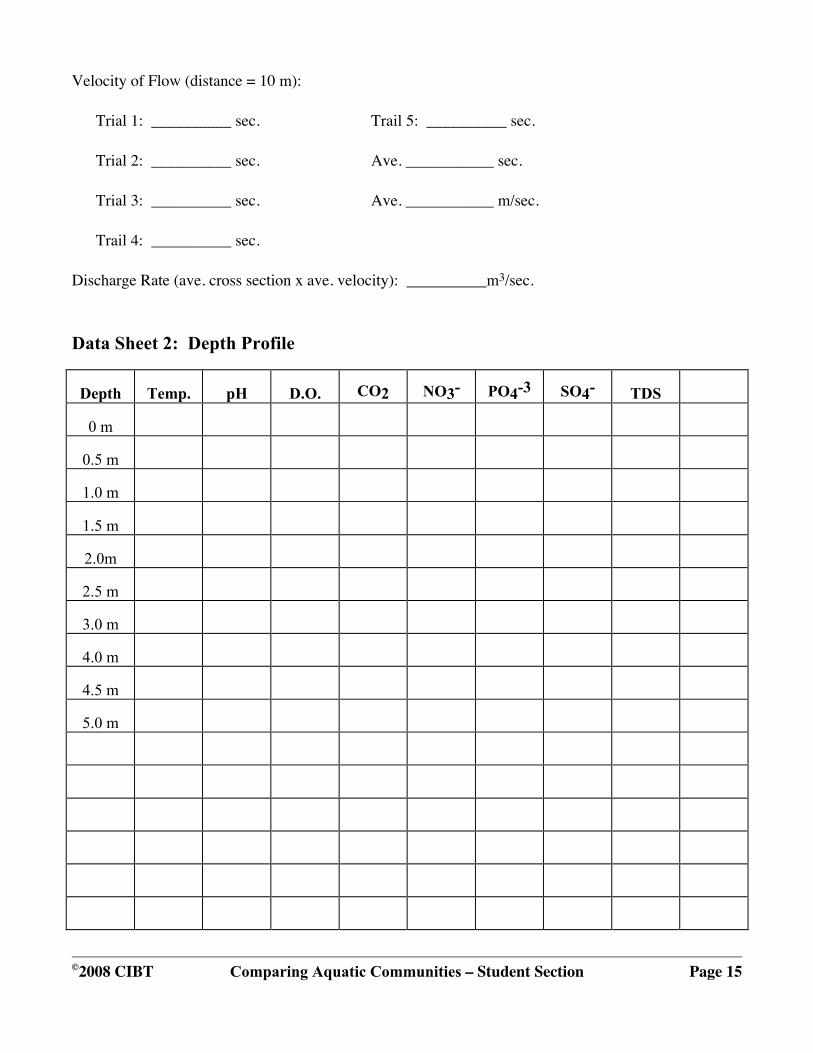
4. Stream Velocity and Discharge Rate (Streams Only): Have 2 team members wade into the stream, one a measured 10 m downstream of the other. The upstream member, holding a stopwatch, may then toss an orange or other easily visible, floating object slightly upstream, and, as the orange drifts by, that member says, “go,” and starts the stopwatch. When the orange passes the downstream member of the team, that member shouts, “stop,” and the upstream member stops the stopwatch. Record the time, in seconds, for each of 5 such trials on Data Sheet 1. Take an average of the 5 measurements, and record the average in the space provided. Finally, the average stream velocity, in m/sec., can be calculated by dividing the average time into 10 m.
The discharge rate, in m3/sec., can be calculated by multiplying the average stream velocity by the average cross section. Your instructor may ask you to modify this reading by multiplying your result by a friction coefficient that depends on the nature of the stream bottom.
Chemical Characteristics: These need to be measured only once at each stream site, because the water movements keep the chemicals mixed up through all depths. At pond sites, however, the water may be stratified (i.e., layered) by temperature, with warm, lighter water lying over colder, heavier water. Here you may be asked to construct a temperature and chemical depth profile on Data Sheet 2. You may only have time or supplies enough to measure some of these factors at two depths -- the surface and near the bottom. When taking samples near the bottom, take care not to include mud or other sediments in your water sample.
To sample below the surface, you will need to use a water sampling bottle on a calibrated line. There are a number of different types of sampling bottle (e.g., Kemmerer bottle, Nansen bottle), and your instructor will give you specific instructions on the use of your type. These samplers all have a mechanism that allows them to be lowered in open
©2008 CIBT Comparing Aquatic Communities – Student Section Page 4
position to a predetermined depth and then closed, usually by sending a weight, called a messenger, down the line to trip the closing mechanism.
5. pH: If it has not already been done, standardize the pH meter using a standard buffer in the pH 7.0 range. Follow instructions for the use of the meter to record the pH.
Alternatively, you may be asked to measure pH using a chemical test kit or pH recording tape.
6. Dissolved Oxygen (O2, D.O.): It is important that you avoid allowing air to bubble through water samples that will be used to measure dissolved gasses. After the sampling bottle is retrieved, insert the discharge tube to the bottom of the small bottle that will be used for D.O. determination. Open the valve on the sampler and allow water to flow into the glass bottle, counting at a constant rate as you do so. Note how long it takes to just fill the bottle and allow the water to overflow as you count to the same number two more times. Do not put the stopper in the test bottle, but follow directions for the D.O. chemical test kit, adding the first reagent before closing the bottle. At all steps, try to avoid getting air bubbles mixed in with the sample.
7. Carbon Dioxide (CO2): Follow the procedure for sampling for D.O. and try to keep out air bubbles. Follow instructions for the chemical test kit with which you are provided.
8. Total Dissolved Solids (TDS): Follow directions for the Pocket Tester to measure the TDS of a sample of surface water or water drawn from depth.
9. Nitrate (NO3), Phosphate (PO4-3), and Sulfate (SO3-): Follow directions for the individual chemical test kits to measure the concentrations of these ions in your sample(s).
Record the results of these measurements in Data Sheet 1: Site Characteristics (for streams) or in Data Sheet 2: Depth Profile (for ponds).
©2008 CIBT Comparing Aquatic Communities – Student Section Page 5
PART II: Collecting Invertebrates from a Pond or Stream
Supplies
Each group should have the following:
• 1 dip net (D-net) or kitchen strainer (6-10" diameter)
• 20 plastic containers with lids (e.g., margarine tubs)
• 1 white-bottomed pan or basin • cheesecloth
• 2 small (6") polyethylene pipettes • rubber bands
• 2 plastic spoons or soft forceps • waders of hip boots (optional)
Procedure
Work in groups of two or three, as your instructor directs.
1. Put about 2 to 4 cm of clear water in the pan and all the containers. (The water is put in the pan to allow any organisms to swim or crawl free of the debris and become more visible to you.)
2a. (For ponds.) From the shore, reach out with the net and pull it toward you through the water, gently scraping along the bottom and through any plants. Several sweeps with the net should be made before emptying it into the pan, and any large plant pieces should be rinsed in the pan and removed for ease in sorting. Avoid large globs of mud -- it is too difficult to sort through.
2b. (For streams.) Wade into the stream with your net and place the net on the bottom with the opening facing upstream. Estimate an area of stream bottom approximately square in front of the net and kick with your feet to disturb the bottom, allowing the current to carry dislodged organism into the net. Alternatively, you may use your hands to turn over rocks on the bottom and wipe them clean of attached organisms. Keep sampling for a standard period of time as directed by your instructor -- 30 sec. to 1 min.
If the stream is flowing very slowly or the bottom is vegetated or muddy, use the collecting technique for ponds in 2a above.
©2008 CIBT Comparing Aquatic Communities – Student Section Page 6
3. Sort out the invertebrates from the debris in the pan, placing them in plastic containers. USE CAUTION: SOME AQUATIC INSECTS MAY BITE, so use forceps when handling them. Use the forceps for the larger creatures and the pipette for the smallest. Keep only invertebrates greater than 1 mm in length.
4. Place each different kind of invertebrate you find into a different container. Don’t worry too much that two organisms look slightly different from one another, or that one is twice the size of another; go by general body shape.
For instance, swimming beetles can be lumped in one container, worms in another, insect larvae with cases of plant material in another, etc. But don’t crowd too many in one container. If you think there are too many, get an extra or a bigger container.
5. VERY IMPORTANT: Separate out all the invertebrates from the pan before going out again with the net. This way a true count of each type of invertebrate can be made later in the classroom. Try to avoid picking out the largest creatures first; go from one end of the pan to other systematically until it is empty. You may then take another sample with the net.
All vertebrates (fish, frogs, tadpoles, salamanders, amphibian egg masses, etc.) must be returned to the pond.
6. If you are not through sorting a sample when it is time to go back to the classroom, return the unsorted material to the water. Rinse the net and the pan in the pond and cap all your containers. Keep some green plant material from the pond, enough to put in each container.
7. Back in the classroom, be sure to take the lid off your containers for better aeration of the water. If you are concerned that a particular organism may escape from its container, cover the container with cheesecloth and a rubber band.
©2008 CIBT Comparing Aquatic Communities – Student Section Page 7
PART III: Identification, Enumeration, and Diversity
In this part, you will be using a dichotomous key to identify the invertebrates you’ve collected, and making a count of each type. You will then calculate various indices used to describe the ecological community.
A key is a tool used to identify an organism on the basis of things that you can observe. You will be using a short dichotomous key. This means that at each step in the key, there will be two choices. Each choice leads to a different identification. In a dichotomous key, each set of two choices is called a couplet.
Example: Look at the first couplet in the key to common pond invertebrates. Starting with couplet 1, if you decided your organism was more like 1A than 1B, you would go on to couplet 2. If you decided your organism better matched choice 2B than 2A, you would go on to couplet 3. If choice 3A matched your organism better than 3B, then you have a spider or a mite.
The organisms that interact with each other in an environment such as a pond are called its community. One way to characterize any community is by the diversity of organisms found within it. The diversity of a community depends on two things: community richness (the number of different types of organisms present) and community dominance (the number of individuals of each type of organism present).
Diverse communities have many different types of organisms and few individuals of each type (high richness and low dominance). Less diverse communities have only a few different types of organisms and many individuals of each type (low richness and high dominance).
Diversity seems to vary with the harshness of the environment. Pollution and other disturbances to communities (such as floods, fires, etc.) reduce the diversity of communities. Since fewer types of organisms are able to tolerate the conditions of a harsh or disturbed environment, the total number of types will be less and therefore the diversity will be low. However, at the same time, organisms that are tolerant of harsh conditions will have less competition for resources and their numbers will expand, thereby increasing the dominance of a few types of organisms in that environment.
©2008 CIBT Comparing Aquatic Communities – Student Section Page 8
Supplies
Each group should have the following:
• invertebrates collected in the field • dichotomous key
Procedure
1. Using the dichotomous key provided, key the organisms you have brought back from the pond as described above. Note that there are 3 keys provided. Hemiptera and Coleoptera are in separate keys. If you have specimens from these two groups, the general key will direct you to the appropriate key.
2. Do not key out every single individual invertebrate from each container you’ve brought back. If you are satisfied that all the organisms in a container will key out to the same thing, even if they look slightly different, call them all the same type of organism (with your teacher’s approval).
3. Remember, this is a key to common invertebrates. Every so often you may come across an organism that does not key out at all. In this situation, put it in the “other” category.
4. Record your final results in the ENUMERATION TABLE provided, including the type of organism and number collected.
Putting It Together
1. Fill out the attached enumeration table with your data.
2. After you and your partner have completed your list, pool your data with the class. You will use these pooled data in making dominance-diversity curves.
3. Dominance-Diversity Curve. As an example of how this method is used, consider the following community (Table 1) which has ten types of organisms occurring in the numbers of individuals shown:
©2008 CIBT Comparing Aquatic Communities – Student Section Page 9
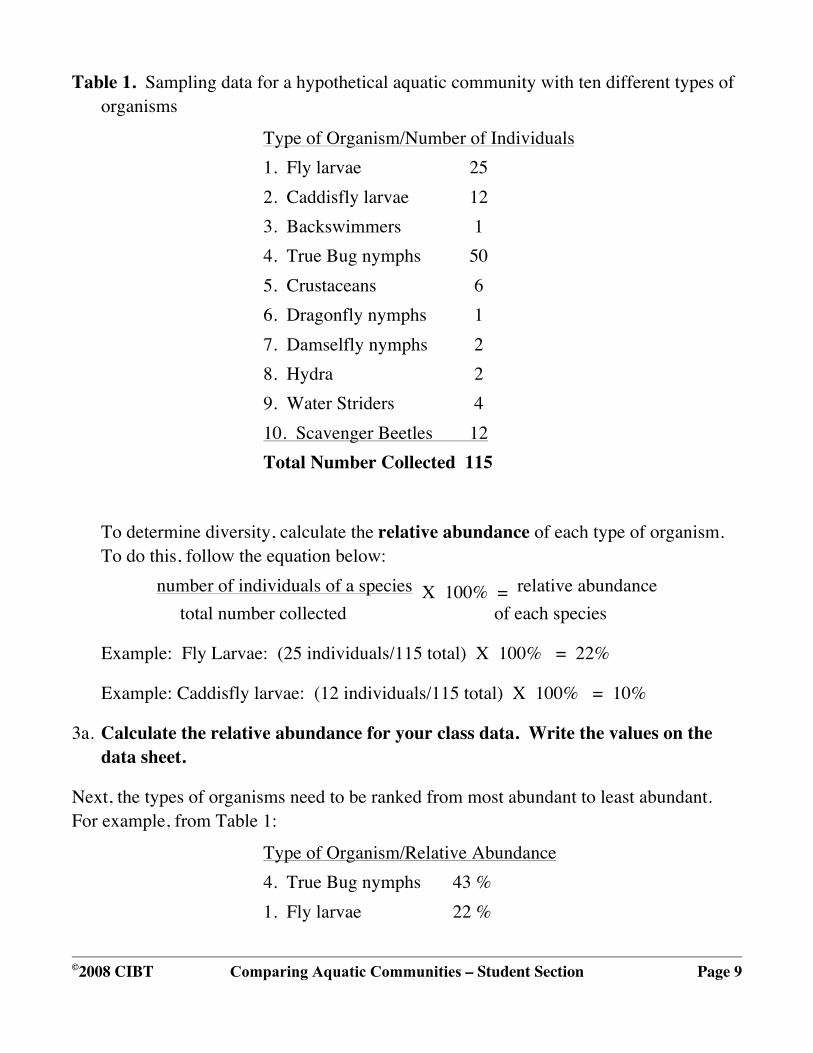
Table 1. Sampling data for a hypothetical aquatic community with ten different types of organisms
Type of Organism/Number of Individuals 1. Fly larvae 25 2. Caddisfly larvae 12 3. Backswimmers 1 4. True Bug nymphs 50 5. Crustaceans 6 6. Dragonfly nymphs 1 7. Damselfly nymphs 2 8. Hydra 2 9. Water Striders 4 10. Scavenger Beetles 12 Total Number Collected 115
To determine diversity, calculate the relative abundance of each type of organism. To do this, follow the equation below:
number of individuals of a species X 100% = relative abundance total number collected of each species
Example: Fly Larvae: (25 individuals/115 total) X 100% = 22%
Example: Caddisfly larvae: (12 individuals/115 total) X 100% = 10%
3a. Calculate the relative abundance for your class data. Write the values on the data sheet.
Next, the types of organisms need to be ranked from most abundant to least abundant. For example, from Table 1:
Type of Organism/Relative Abundance 4. True Bug nymphs 43 % 1. Fly larvae 22 %
©2008 CIBT Comparing Aquatic Communities – Student Section Page 10
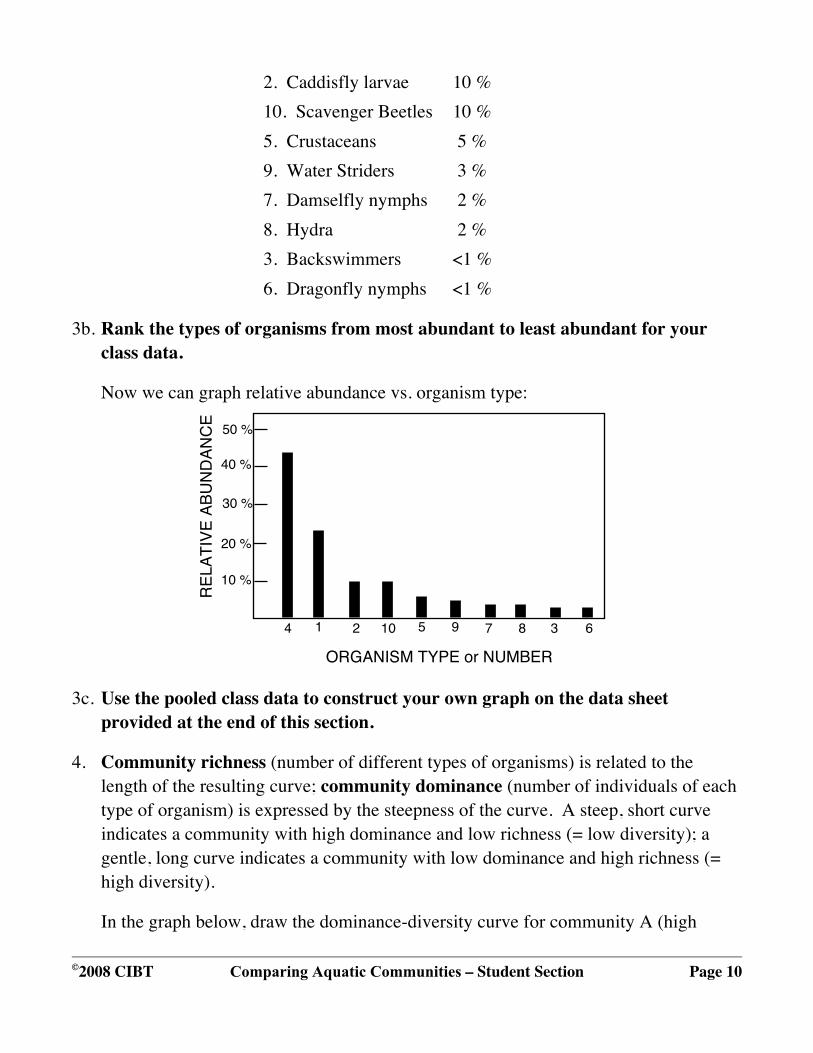
2. Caddisfly larvae 10 % 10. Scavenger Beetles 10 % 5. Crustaceans 5 % 9. Water Striders 3 % 7. Damselfly nymphs 2 % 8. Hydra 2 % 3. Backswimmers <1 % 6. Dragonfly nymphs <1 %
3b. Rank the types of organisms from most abundant to least abundant for your class data.
Now we can graph relative abundance vs. organism type:
ORGANISM TYPE or NUMBER
RELA
TIVE
ABU
NDAN
CE
10 %
20 %
30 %
40 %
50 %
4 1 2 10 5 9 7 8 3 6
3c. Use the pooled class data to construct your own graph on the data sheet provided at the end of this section.
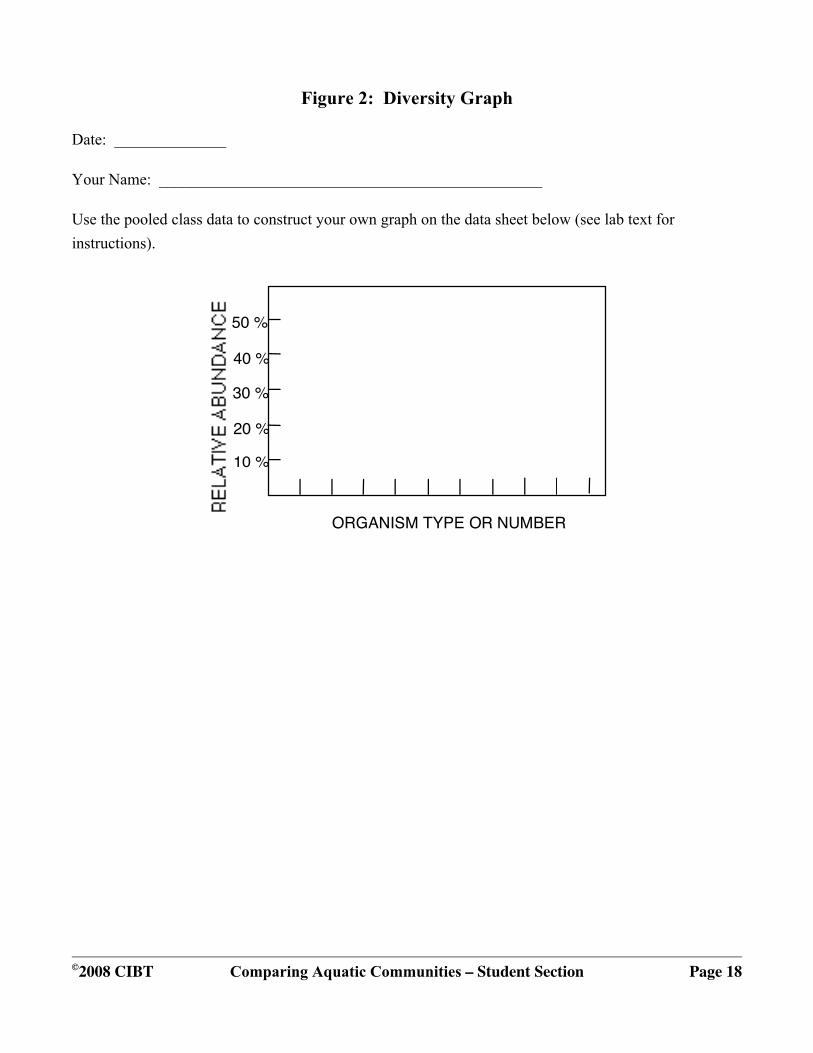
4. Community richness (number of different types of organisms) is related to the length of the resulting curve; community dominance (number of individuals of each type of organism) is expressed by the steepness of the curve. A steep, short curve indicates a community with high dominance and low richness (= low diversity); a gentle, long curve indicates a community with low dominance and high richness (= high diversity).
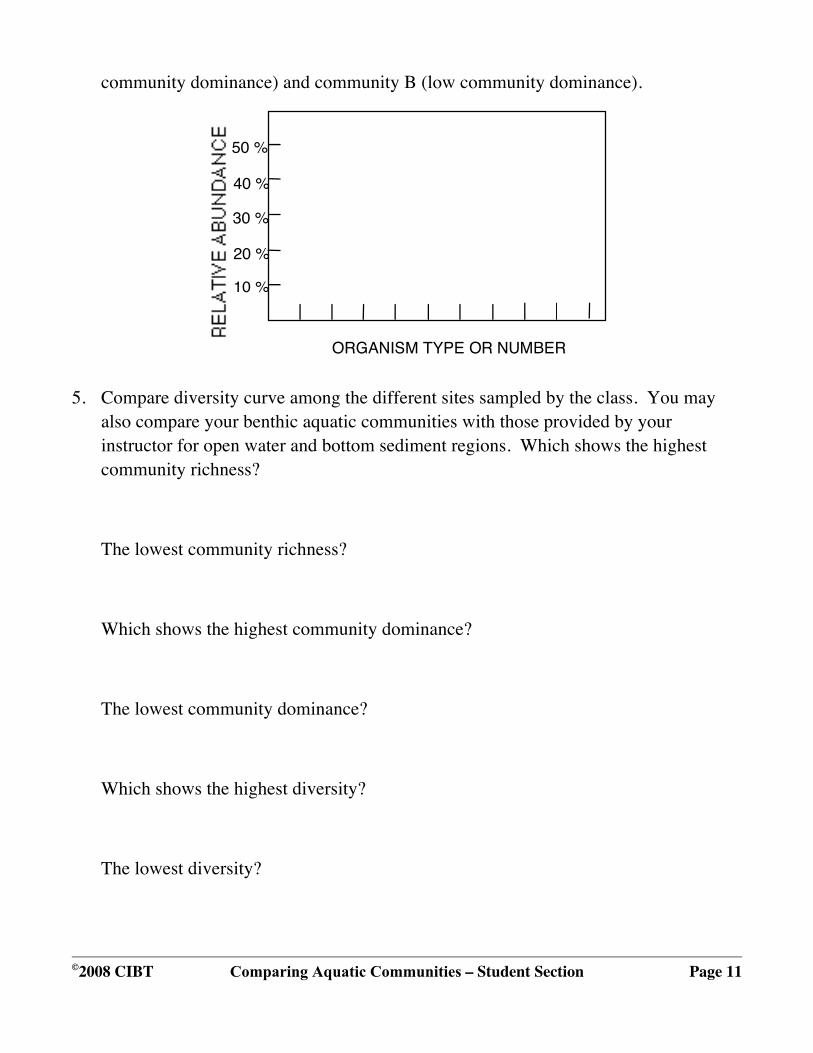
In the graph below, draw the dominance-diversity curve for community A (high
©2008 CIBT Comparing Aquatic Communities – Student Section Page 11
community dominance) and community B (low community dominance).
ORGANISM TYPE OR NUMBER
10 %
30 %
40 %
50 %
20 %
5. Compare diversity curve among the different sites sampled by the class. You may also compare your benthic aquatic communities with those provided by your instructor for open water and bottom sediment regions. Which shows the highest community richness?
The lowest community richness?
Which shows the highest community dominance?
The lowest community dominance?
Which shows the highest diversity?
The lowest diversity?
©2008 CIBT Comparing Aquatic Communities – Student Section Page 12
If you or others in the class studied a pond site, was the water stratified by temperature and density?
Was it stratified by chemical factors? Was the pH, dissolved oxygen, or carbon dioxide concentration different at depth than it was on the surface?
How might this affect the organisms?
If more than one site was studied, which was the most productive, i.e., which supported the most photosynthesis?

©2008 CIBT Comparing Aquatic Communities – Student Section Page 13
With reference to the physical and chemical factors you measured at the various sites, what environmental factors may explain the patterns of abundance or of diversity that you observed?
©2008 CIBT Comparing Aquatic Communities – Student Section Page 14
Pond Ecology: Comparing Aquatic Communities
Biology Team Members: _____________________________________________ (you)
__________________________________________________
__________________________________________________
__________________________________________________
Data Sheet 1: Site Characteristics
Site Number: _________ Locality: _________________________________
State: _______________ County: __________________________
Date: _______________ Time: ____________
Water Name: ___________________________________
Sky Conditions: ______________ Vegetation: ______________________________
Bottom: _____________________
Air Temp: _________°C______°F Surface Water Temp: ________°C _______°F
Transparency: ______________ Color: _________________________
Max. Depth (pond): ___________meters Stratified: yes ( ) no ( )
Thermocline depth________m.
Stream Width (m): 1_____, 2_____, 3_____, 4_____, 5_____. Ave. Width: ________
Stream Depth (m): 1_____, 2_____, 3_____, 4_____, 5_____. Ave. Depth: ________
Stream Cross Section (m): __________
©2008 CIBT Comparing Aquatic Communities – Student Section Page 15
Velocity of Flow (distance = 10 m):
Trial 1: __________ sec. Trail 5: __________ sec.
Trial 2: __________ sec. Ave. ___________ sec.
Trial 3: __________ sec. Ave. ___________ m/sec.
Trail 4: __________ sec.
Discharge Rate (ave. cross section x ave. velocity): __________m3/sec.
Data Sheet 2: Depth Profile
Depth Temp. pH D.O. CO2 NO3- PO4-3 SO4- TDS
0 m
0.5 m
1.0 m
1.5 m
2.0m
2.5 m
3.0 m
4.0 m
4.5 m
5.0 m

©2008 CIBT Comparing Aquatic Communities – Student Section Page 16
Data Sheet 3: Enumeration Table
Type of Organism Number You Collected Class Totals Relative Abundance
1
2
3
4
5
6
7
8
9
10
11
12
13
14
15
©2008 CIBT Comparing Aquatic Communities – Student Section Page 17
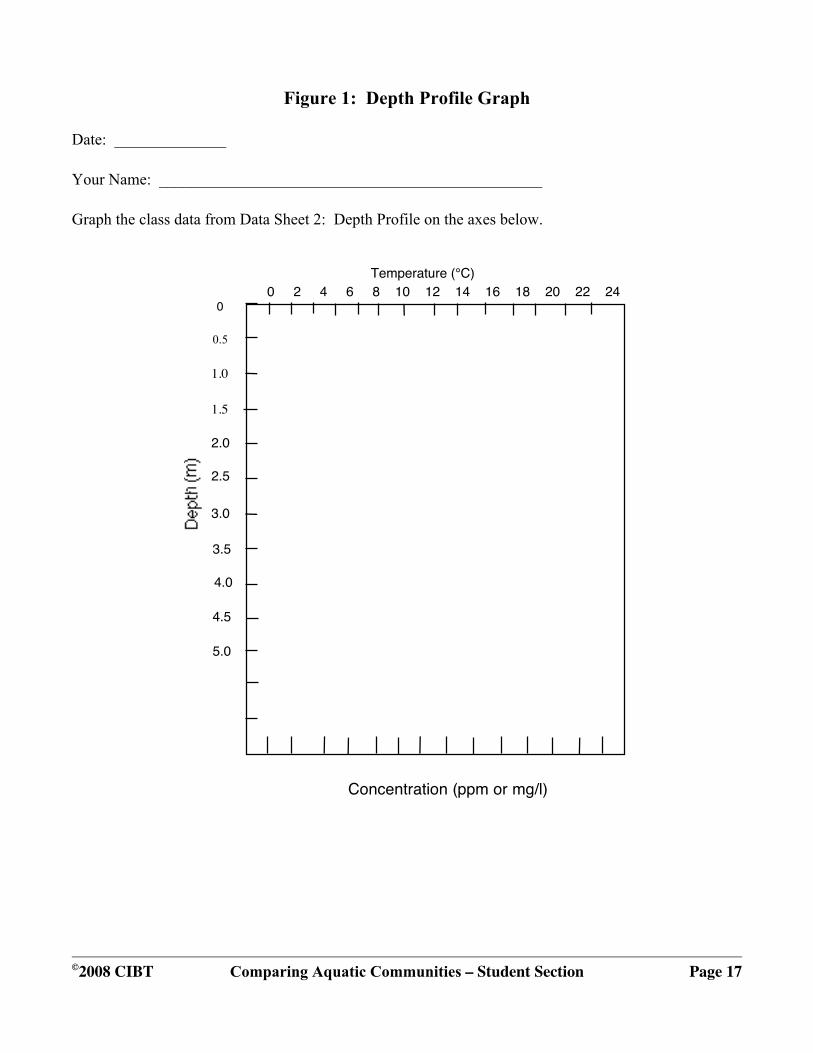
Figure 1: Depth Profile Graph
Date: ______________
Your Name: ________________________________________________
Graph the class data from Data Sheet 2: Depth Profile on the axes below.
2.5
2.0
1.0
Concentration (ppm or mg/l)
0
0.5
3.0
3.5
4.0
4.5
5.0
Temperature (°C)0 2 4 6 8 10 12 14 16 18 20 22 24 26 28
1.5
©2008 CIBT Comparing Aquatic Communities – Student Section Page 18
Figure 2: Diversity Graph
Date: ______________
Your Name: ________________________________________________
Use the pooled class data to construct your own graph on the data sheet below (see lab text for instructions).
ORGANISM TYPE OR NUMBER
10 %
30 %
40 %
50 %
20 %
©2008 CIBT Dichotomous Keys – Student Section Page 1
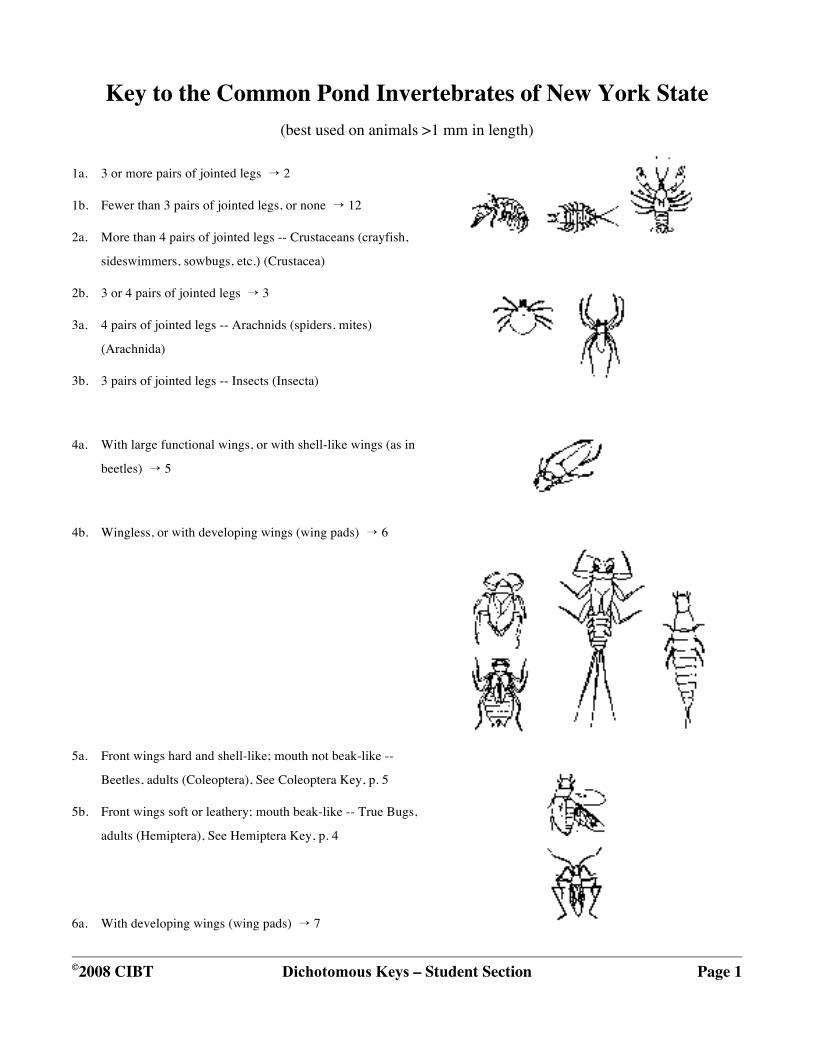
Key to the Common Pond Invertebrates of New York State (best used on animals >1 mm in length)
1a. 3 or more pairs of jointed legs → 2
1b. Fewer than 3 pairs of jointed legs, or none → 12
2a. More than 4 pairs of jointed legs -- Crustaceans (crayfish,
sideswimmers, sowbugs, etc.) (Crustacea)
2b. 3 or 4 pairs of jointed legs → 3
3a. 4 pairs of jointed legs -- Arachnids (spiders, mites)
(Arachnida)
3b. 3 pairs of jointed legs -- Insects (Insecta)
4a. With large functional wings, or with shell-like wings (as in
beetles) → 5
4b. Wingless, or with developing wings (wing pads) → 6
5a. Front wings hard and shell-like; mouth not beak-like --
Beetles, adults (Coleoptera), See Coleoptera Key, p. 5
5b. Front wings soft or leathery; mouth beak-like -- True Bugs,
adults (Hemiptera), See Hemiptera Key, p. 4
6a. With developing wings (wing pads) → 7
©2008 CIBT Dichotomous Keys – Student Section Page 2
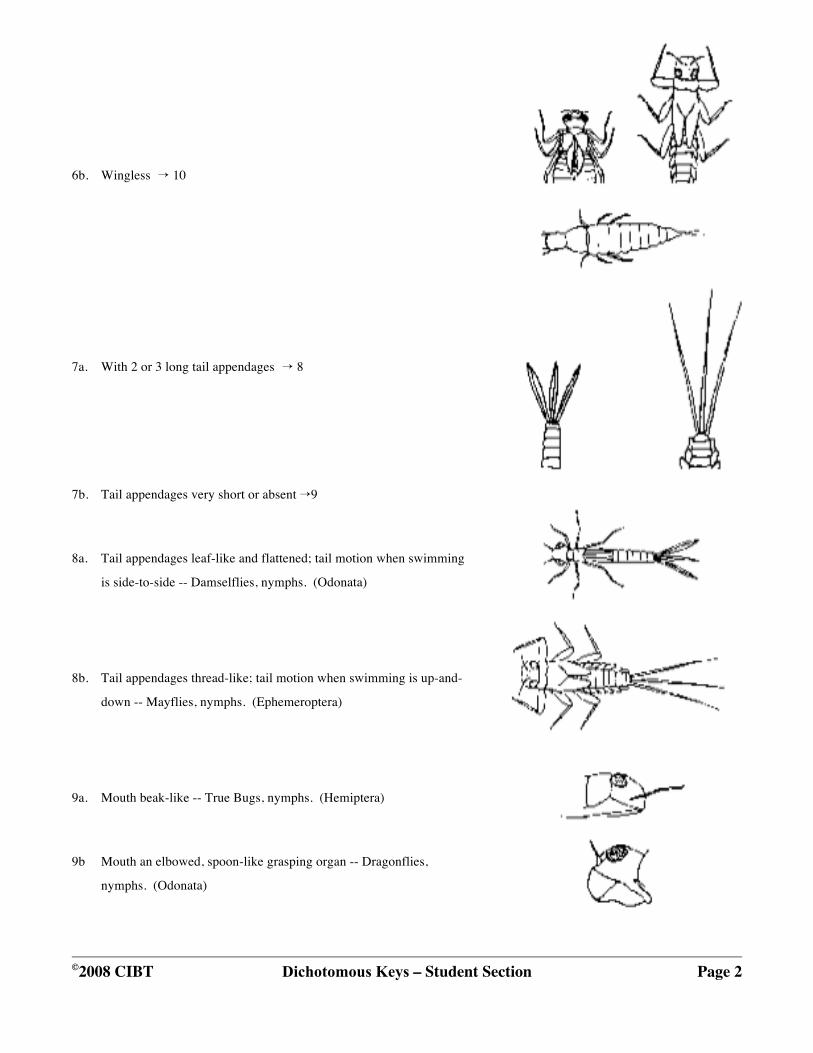
6b. Wingless → 10
7a. With 2 or 3 long tail appendages → 8
7b. Tail appendages very short or absent →9
8a. Tail appendages leaf-like and flattened; tail motion when swimming
is side-to-side -- Damselflies, nymphs. (Odonata)
8b. Tail appendages thread-like; tail motion when swimming is up-and-
down -- Mayflies, nymphs. (Ephemeroptera)
9a. Mouth beak-like -- True Bugs, nymphs. (Hemiptera)
9b Mouth an elbowed, spoon-like grasping organ -- Dragonflies,
nymphs. (Odonata)
©2008 CIBT Dichotomous Keys – Student Section Page 3
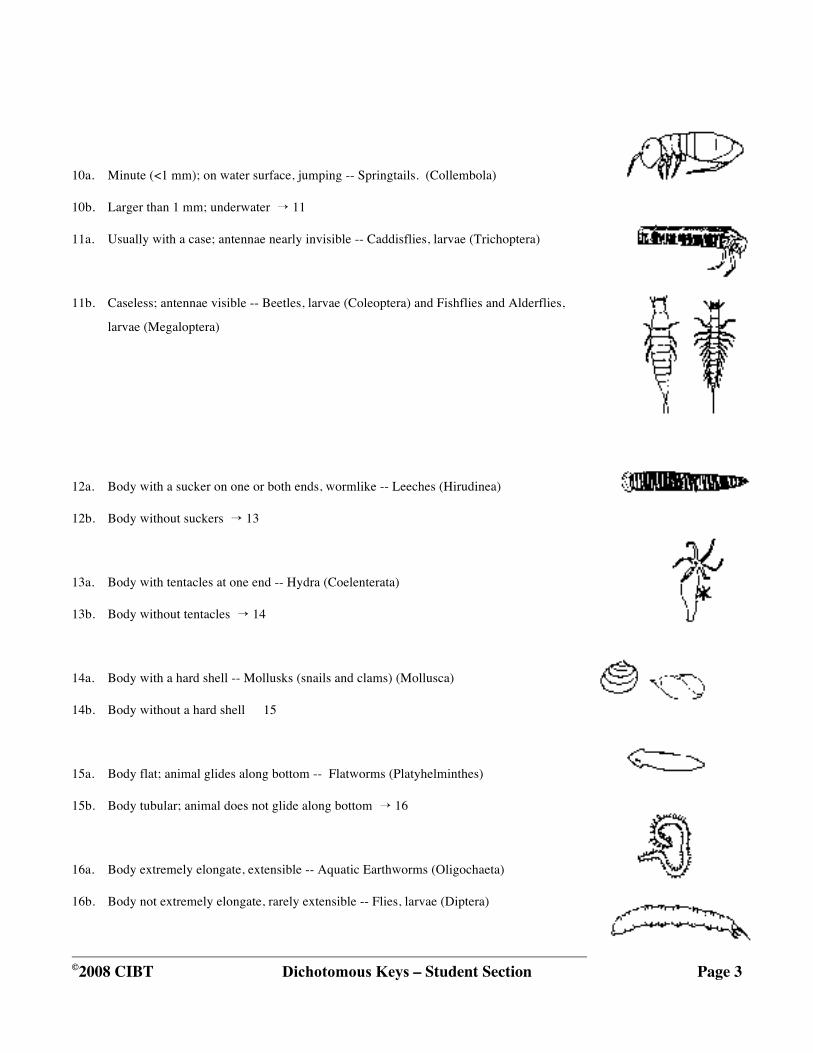
10a. Minute (<1 mm); on water surface, jumping -- Springtails. (Collembola)
10b. Larger than 1 mm; underwater → 11
11a. Usually with a case; antennae nearly invisible -- Caddisflies, larvae (Trichoptera)
11b. Caseless; antennae visible -- Beetles, larvae (Coleoptera) and Fishflies and Alderflies,
larvae (Megaloptera)
12a. Body with a sucker on one or both ends, wormlike -- Leeches (Hirudinea)
12b. Body without suckers → 13
13a. Body with tentacles at one end -- Hydra (Coelenterata)
13b. Body without tentacles → 14
14a. Body with a hard shell -- Mollusks (snails and clams) (Mollusca)
14b. Body without a hard shell 15
15a. Body flat; animal glides along bottom -- Flatworms (Platyhelminthes)
15b. Body tubular; animal does not glide along bottom → 16
16a. Body extremely elongate, extensible -- Aquatic Earthworms (Oligochaeta)
16b. Body not extremely elongate, rarely extensible -- Flies, larvae (Diptera)
©2008 CIBT Dichotomous Keys – Student Section Page 4
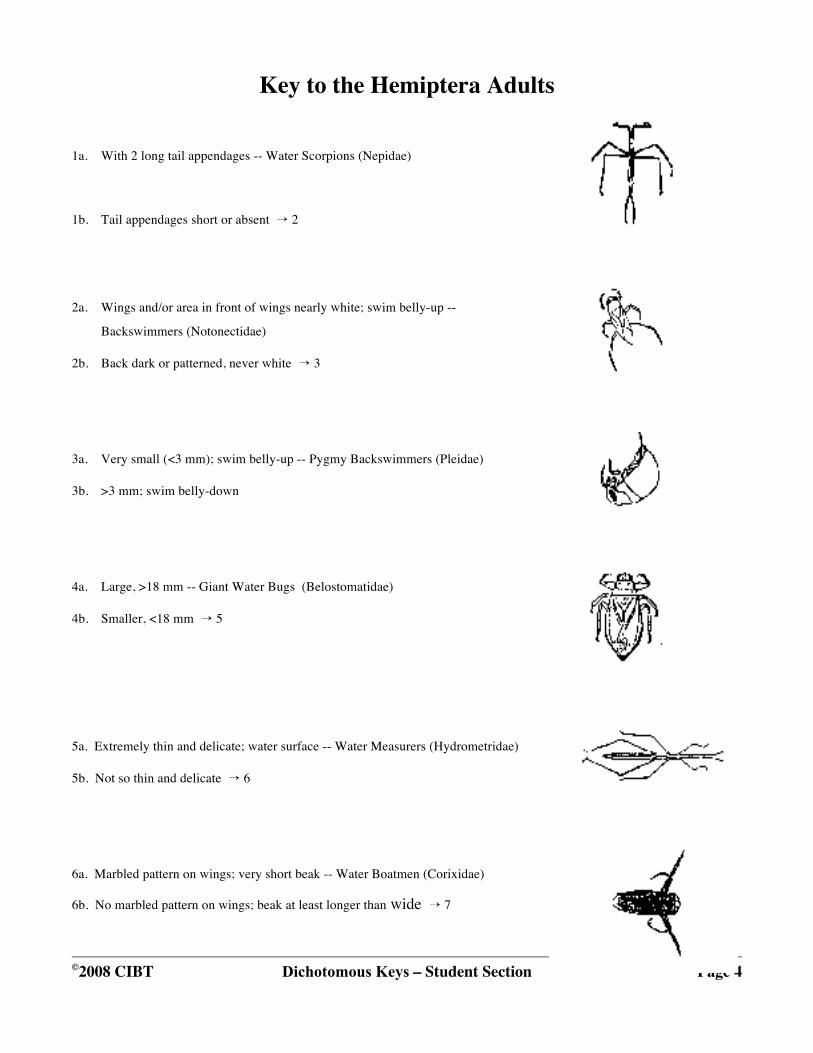
Key to the Hemiptera Adults
1a. With 2 long tail appendages -- Water Scorpions (Nepidae)
1b. Tail appendages short or absent → 2
2a. Wings and/or area in front of wings nearly white; swim belly-up --
Backswimmers (Notonectidae)
2b. Back dark or patterned, never white → 3
3a. Very small (<3 mm); swim belly-up -- Pygmy Backswimmers (Pleidae)
3b. >3 mm; swim belly-down
4a. Large, >18 mm -- Giant Water Bugs (Belostomatidae)
4b. Smaller, <18 mm → 5
5a. Extremely thin and delicate; water surface -- Water Measurers (Hydrometridae)
5b. Not so thin and delicate → 6
6a. Marbled pattern on wings; very short beak -- Water Boatmen (Corixidae)
6b. No marbled pattern on wings; beak at least longer than wide → 7
©2008 CIBT Dichotomous Keys – Student Section Page 5
7a. Front legs extremely thickened -- Creeping WaterBugs (Naucoridae)
7b. Front legs not thickened; water surface -- Water Striders (Gerridae, Veliidae, Mesoveliidae)

©2008 CIBT Dichotomous Keys – Student Section Page 6
Key to the Coleoptera Adults
1a. Two pairs of eyes; two hind pairs of legs short and extremely flattened; usually on water
surface -- Whirligig Beetles (Gyrinidae)
1b. One pair of eyes; hind pairs of legs long, not extremely flattened
2a. Head very small, not in a smooth outline with therest of the body; body usually with yellow
andblack pattern, 2.5 to 5 mm -- Crawling WaterBeetles (Haliplidae)
2b. Head larger, making a smooth outline with rest of body; pattern and size variable → 3
3a. Underside not silvery when in water (living beetles only); hind legs stroke backward
together -- Diving Beetles (Dytiscidae)
3b. Underside silvery when in water (living beetlesonly); hind legs stroke backward alternately
-- Water Scavenger Beetles (Hydrophilidae)