Embed Size (px)
DESCRIPTION
D3171
Citation preview
Test Method for Constituent Content of Composite Materials1
Walter G. McDonough, Donald L. Hunston and Joy P. Dunkers
National Institute of Standards and Technology 100 Bureau Drive, Stop 8543
Gaithersburg, MD 20899
Goals
To extend the burn off test protocol in ASTM D 3171-99 to the determination of
the fiber and void contents of carbon/glass hybrid composites. To support this extension by experimentally demonstrating that it is possible, with one test, to estimate fiber volume contents and void contents of typical glass/carbon/epoxy hybrid composites.
Introduction
Hybrid composites are increasingly being used in infrastructure, oil recovery, and aerospace applications. These hybrids use two different fibers to reinforce the resin thereby gaining some of the advantageous properties of both fibers. Typically glass and carbon are used since this combination provides high performance with low cost. A critical issue in such materials is the fiber mix ratio and the fiber and void content. At present, there is no simple way to determine these features although many techniques exist for measuring the components of single reinforcement composites. As a result, we propose an extension of the burn-off test in ASTM D 3171-99 to characterize carbon/glass hybrids. In support of this method, we offer data from tests on a series of samples made to have known compositions and data on a commercially prepared sample where fiber mix ration is known and void content was determined by using microscopy.
The current ASTM test method incorporates resin burn off as a way to determine the constituent content for composite materials. Test Method I-Procedure G is for reinforcements such as glass or ceramic that are not affected by high-temperature environments or reinforcements such as carbon where temperature is adequately controlled so that the reinforcement does not char. Briefly, Procedure G calls for putting the specimens into a preheated muffle furnace at 500 °C or lower depending on the composite system (a temperature at which specimens will not spontaneously ignite). The specimens are then to be heated to 565 °C ± 30 °C or other temperature compatible with the composite system that will burn off the matrix and leave the reinforcement. The maximum time for burn off should be 6 h. The matrix is considered combusted if no matrix/reinforcement block exists. Ash and reinforcement should be the only items visible. 1 See also: W. G. McDonough, J. P. Dunkers, K. M. Flynn, and D. L. Hunston, “A Test Method to Determine the Fiber and Void Contents of Carbon/Glass Hybrid Composites,” Journal of ASTM International 1(3), 1-15, March 2004.

Burnout tests are a common way to estimate the individual volume contents of the
components. Glass content, resin content and sizing content can be calculated and from this data, the void content can then be determined. For carbon/glass hybrid composites, we have found that by increasing the temperatures in stages, we can remove the resin and sizings at one temperature, and remove the carbon fibers at another, higher temperature, leaving only glass fibers. We have also been able to estimate the void contents for industrial composites.
The amendment that we are proposing shall call for heating the specimen in a furnace from room temperature to 600 °C and holding it at that temperature for 30 min-45 min (with timing to start when the furnace reaches 585 °C). This step will remove the resin and any organic sizing on the fibers. We also found that any char that was formed was removed. Subsequently, we shall raise the temperature to 900 °C and hold the specimen at that temperature until the carbon fibers are removed (usually around 30 min).
Proposed Procedure
This procedure was developed for epoxy matrices with carbon and glass reinforcements, but may be applicable to other systems as well with appropriate modification of times and temperatures.
Before beginning the measurements it is desirable to use thermal gravimetric analysis (TGA) to determine the optimal test conditions (times and temperatures) for the particular constituents being used, and the corrections factors discussed below if something other than the default values are needed. If the constituents are available, they can be tested individually to help provide this information. The times and temperatures cited below have been found to work well for a specific epoxy system and are useful starting points, but may not be optimum for all resin systems.
Before starting the tests, it is useful to thoroughly dry the specimens by placing them in a desiccator and monitoring the mass as a function of time until changes are no longer observed. The error introduced by moisture in the sample is not large but can become particularly important if void content is calculated since void content is also generally small. The dry mass of the sample is designated W0. The uncertainty in the mass determination should be 0.0001 g or better.
If void content and volume fractions of constituents are to be determined, it is necessary to measure or estimate the densities of the constituents (see ASTM Method D792 or D1505). Densities of cured resin, the glass fiber, and the carbon fiber are designated ρr , ρg , and ρc , respectively. In addition, the volume of the specimen to be tested, V0, must be determined. The uncertainty in the mass measurements should be 0.0001 g or better while the uncertainty in the determination of dimensions should be 0.005 mm or better.

Weigh each specimen and then place it in a desiccated crucible. Before insertion of the sample, the crucible should be cleaned by heating to 900 °C (or the highest use temperature that will be used in the burn off test) in a muffle furnace, cooled to room temperature in a desiccator, and weighed to determine its mass.
Place the crucible containing the sample into the oven and heat to 600 °C. When the temperature reaches 585 °C, usually in around 30 min, start recording the time at this first temperature plateau. After 30 min, there should only be reinforcement left in the crucible. It may be necessary to extend this time if any visible resin remains. Remove the crucible from the oven, keeping the oven at temperature, and place the crucible in a desiccator for cooling to room temperature. Weigh the specimen and crucible to the nearest 0.0001 g, and subtract the mass of the crucible to determine the mass of the sample after the first temperature exposure, WT1. (Note: The existing standard called for placing the crucible into a preheated muffle furnace at 500 °C or lower depending on the composite system. This may be necessary if the furnace being used has a very long heating up period that leads to degradation of the carbon fibers.)
Place the crucible into the oven that has remained at 600 °C and heat to 900 °C. When the temperature reaches 885 °C, start recording the time at this second temperature plateau. After 60 min, there should only be glass reinforcement left. If necessary, keep the crucible in the oven until all of the carbon reinforcement is removed. Remove the crucible from the oven, keeping the oven at temperature, place the crucible in a desiccator, and allow it to cool to room temperature. Weigh the specimen and crucible to the nearest 0.0001 g, and subtract the mass of the crucible to determine the mass of the sample after exposure to the second temperature, WT2.
The mass of the resin (Wr), glass fibers (WG), and carbon fibers (WC) can then be determined by solving the following 3 equations in 3 unknowns. o r CW W W WG= + + (0.1) (0.2) 1 1, 1, 1,T T r r T C C T GW f W f W f W= + + G
G
(0.3) 2 2, 2, 2,T T r r T C C T GW f W f W f W= + + The six correction factors, fi,j , account for the fact that the mass of each component left after a given temperature treatment may not be exactly 0 or 1. Because glass will not react at high temperatures, it is relatively easy to assure that 2, 2, 1 20 1T r T C T G T Gf f and f f= = = = In selecting the temperature and exposure time for step one, the goal is to conditions that come as close as possible to burning off all the resin while leaving all the carbon fiber unaffected so

1, 1,0 1T r T Cf and f= =
In the experiments used to develop this test method (see below), these default
values worked very well. If these conditions can not be achieved, it may be possible to calibrate the corrections factors to account for the deviation for ideality. To estimate fT1,C from calibration experiments, however, it is recommended that composite sample with known carbon fiber content be used, because experiments show that fibers in a composite are often more resistant to vaporization than they are when tested without resin.
The mass fractions for the resin, carbon fiber, and glass fiber are Wr / W0 , WC / W0 , and WG / W0 , respectively. The corresponding volume fractions are Wr / ρr V0 , WC / ρC V0 , and WG / ρG V0 . The volume fraction of voids is determined by subtracting the volume fraction of each component from 1. In calculating the void content, remember to make accurate measurements of the dimensions of the specimen, and to either determine the mass and volume amounts of the sizings used on the fibers either experimentally or using the manufacturer's data sheet.
Uncertainties in the determinations outlined above depend on the materials involved and how carefully the tests are performed. Consequently, it is not possible to give specific numbers. As general guidelines, however, it is useful to consider numbers of a particular system.
Supporting Documentation
To support the proposed test method, experiments were conducted on a model hybrid composite that is being considered for filament wound structures used in off-shore oil recovery on tension leg platforms.
Experiments: Materials and Equipment
The resin that was used was Epon Resin 862, manufactured from Bisphenol F and epichlorohydrin (Shell Chemical Co.). The curing agent used was Epi-Cure W, which is composed of mixed isomers of diethyltoluenediamine. The resin/curing agent ratio by mass was 100.0/26.4. The carbon fibers were Grafil 34-700 in 12K tows with no twists and the standard sizings (Grafil Inc., Sacramento, CA). The glass fibers were PPG-1062 with 247 yield, no twist, and the standard sizing (PPG Industries, Inc., Pittsburgh, PA). Furnace used was Ney M-525 series II furnace (Yucaipa, CA). Weights were measured on an Ohaus Analytical Plus AP 250D scale, (Florham Park, NJ). Dimensions were measured on a Fowler & NSK MaxCal digital caliper. Thermogravimetric analyses were done on a Perkin-Elmer TGA 7 machine (PerkinElmer Corporation, Norwalk, CT).
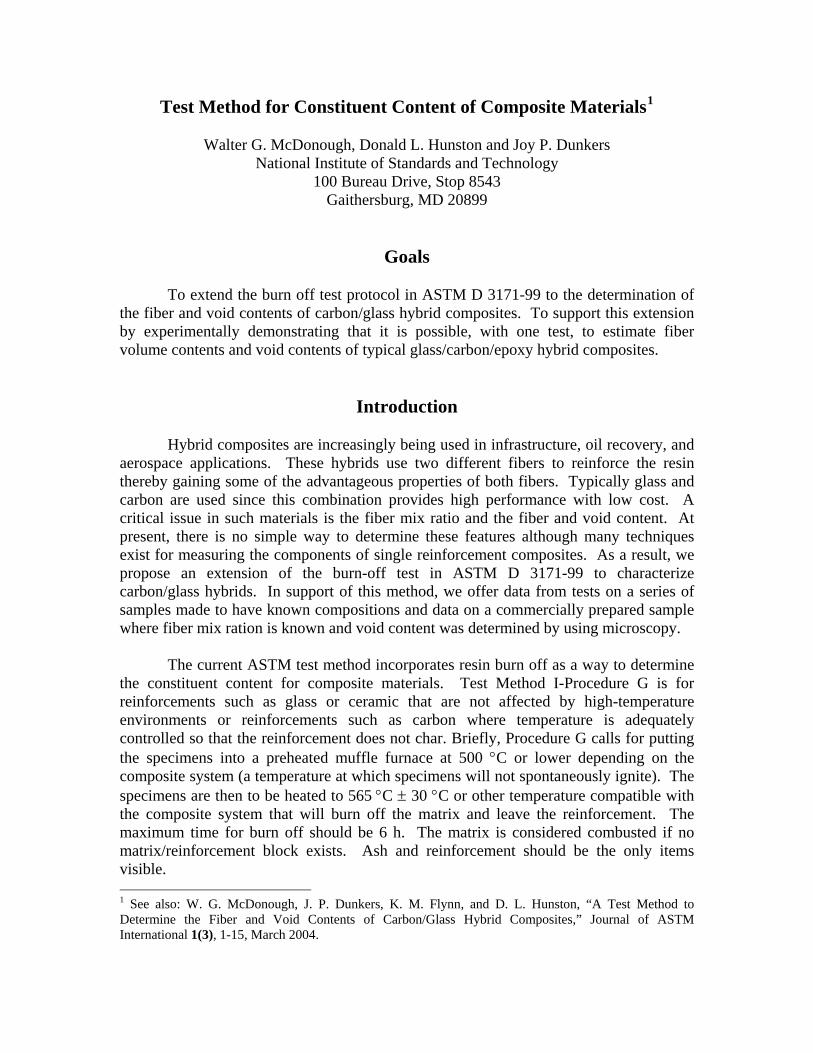
The first step in devising a burn off procedure for carbon/glass hybrid composites was to use thermo-gravimetric analysis (TGA) to establish potential testing routes. Figure 1 shows burn off results for the matrix used in study. The heating rate to 600 oC was 50 oC/min followed by a hold time at 600 oC of 60 min. We can see in the figure that

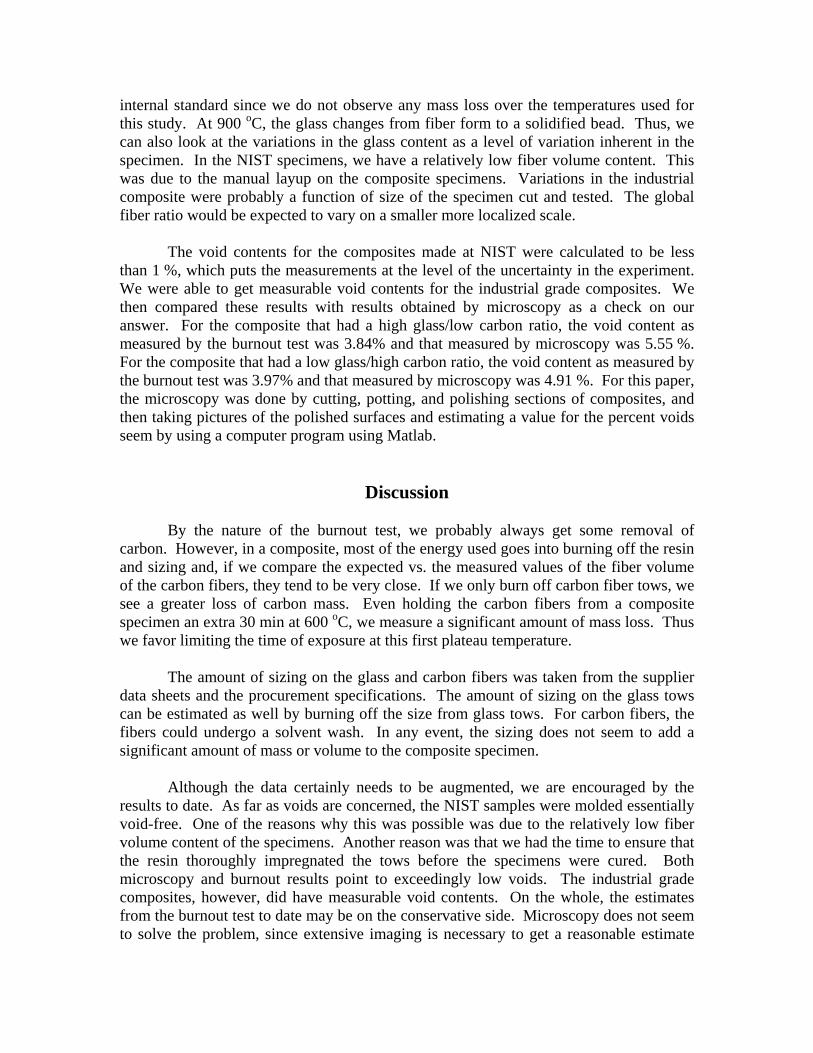
the resin is essentially gone after 25 min. Figure 2 shows the result from bringing the burn off temperature to only 500 oC. At this temperature, we clearly have a significant amount of material remaining after 60 min. Thus, for an initial estimate, we felt that 600 oC was a promising first plateau temperature. Figure 3 shows an isothermal curve for carbon fiber at 600 oC. Here we see a weight loss of around 4 % after 60 min. Figure 4 shows the burn off behavior of carbon fibers at 600 oC for 30 min followed by a jump to 900 oC and a hold for 50 min. We see the small mass loss at 600 oC followed by the complete mass loss at 900 oC. From this data, we concluded that the carbon should be able to survive the first plateau temperature of 600 oC, and that the carbon would be removed at a second plateau temperature of 900 oC. Note that the TGA runs were done on bare fibers. We can expect less fiber degradation when the fibers are encapsulated in resin. Another consideration was that we wanted to minimize the time at the first plateau the chance for degradation of the carbon fibers. Figure 5 shows the TGA response of glass fiber taken to 900 oC, cooled down and recycled to 900 oC. The 1 % mass loss can be attributed to sizing and moisture being burned off.
Based on the TGA results, we developed a two-step process to be able to determine the constituents of a hybrid composite. The first plateau temperature would be 600 oC. At this temperature, we would remove the resin and the sizing on the fibers. The second plateau temperature would be 900 oC, at which point the carbon would be removed. Subsequently, we could calculate the fiber, resin and void contents of the composite. First, we ran burn off tests on the base resin, the carbon fibers and the glass fibers to get a fuller understanding of the responses of the components used to make the composites. Next, we tested composites of known composition that served as a standard by which we could compared our results from the burn off test. To that end, we made model glass fiber composites, carbon fiber composites, and various carbon-glass hybrid composites of known composition. Once we had this information, we then expanded the test to industrial composites.
The model composites were made in specially built molds containing a cavity nominally 20.0 cm long by 0.8 cm wide by 0.6 cm deep. These composites were made by a hand lay-up process wherein we weighed out carbon tows, glass tows or a predetermined mixture of tows depending on the composite that we wished to make. Subsequently, we dipped individual tows into a cup of resin, previously mixed with curing agent and heated to 50 oC, and then we placed the impregnated tow into the cavity and repeated the process until the cavity was filled. We then put the cover on the mold, clamped the cover in place using C-clamps, and then placed the mold assembly into a programmable oven and cured the specimen following the cure schedule specified by the vendor. After processing, the specimens were weighed and measured. By knowing the amount of fibers put in the specimen, we could then calculate the volume content of the specimens. By having this information, we now had a known standard by which to measure the results from our proposed burn out test. After the specimens were molded, they were sectioned into smaller pieces and then stored in a desiccator until they were tested.

Burn-out tests were performed on several specimens. As stated previously, carbon tows, glass tows and matrix specimens were tested to get the base material response. Carbon composites and glass composites were then tested for their response. Hybrid specimens were tested with the following designations: 1:1 glass:carbon to designate those specimens that were made using a 1:1 ratio of glass fiber tows to carbon fiber tows; 3:1 designating a 3:1 ratio of glass to carbon fibers; and 1:3 to designate a 1:3 ratio of glass to carbon fibers. In the table, we show the expected results along with the calculated results. Since we also examined the effect of variations in the burn out temperatures, we have listed the burn out conditions for the individual test specimens.
The model composites, being laid up by hand, usually had a low fiber volume content. We also ran the burn off tests on industrially made hybrid composites. These composites had a much higher fiber volume content. The one difference in testing these materials was in the step where we needed to remove the carbon fibers. We noted that occasionally, we needed 60 minutes to remove the carbon fibers, but in the end, the carbon fibers were successfully removed.
Statement of Uncertainties
The uncertainty in the weight was 0.0001 g. The uncertainty in the dimensions was 0.005 mm. The uncertainty in the volume was 0.002 mm3. The type B uncertainty in the density was estimated to be 0.005 g/cc. The combined standard uncertainty for the void content for the NIST-made composites was 0.005 and the combined standard uncertainty for the void content in the industrial grade composites was 0.006. The uncertainty in the TGA measurements was 2 oC.
Results
The data in Table 1 and Figures 6 and 7 show the results from the tests on all of the materials, both composites and constituent materials. The processing conditions listed varied somewhat as we tried different plateau temperatures and times. The data for the hybrid resin confirmed what was found in the TGA study (Figure 1) in that the resin was burned off after 30 min. Sample 2 was kept in the oven 15 min longer, but we have no reason to assume that the resin as not burned off earlier. The carbon tows showed an even greater mass loss at 600 oC than that shown in Figure 3, and both sets of data indicate that we need to minimize the hold time at the first plateau temperature. At 900 oC, again we see agreement between the burn off data and the TGA data shown in Figure 4. The glass tows, both in Table 1 and in Figure 5, show a similar 1% mass loss that we attribute to sizing and moisture. The results from the burn off test for the constituents, combined with the results from the TGA study confirmed our choices of 600 oC as the first plateau temperature and 900 oC as the second plateau temperature.
As shown in Table 1, we found good agreement between the expected fiber volume contents and the measured contents. Although some of the variations were due to the uncertainties in the measurements, some of the variations were due to inherent differences in the microstructure among the specimens. The glass fibers tend to act as an
internal standard since we do not observe any mass loss over the temperatures used for this study. At 900 oC, the glass changes from fiber form to a solidified bead. Thus, we can also look at the variations in the glass content as a level of variation inherent in the specimen. In the NIST specimens, we have a relatively low fiber volume content. This was due to the manual layup on the composite specimens. Variations in the industrial composite were probably a function of size of the specimen cut and tested. The global fiber ratio would be expected to vary on a smaller more localized scale.
The void contents for the composites made at NIST were calculated to be less than 1 %, which puts the measurements at the level of the uncertainty in the experiment. We were able to get measurable void contents for the industrial grade composites. We then compared these results with results obtained by microscopy as a check on our answer. For the composite that had a high glass/low carbon ratio, the void content as measured by the burnout test was 3.84% and that measured by microscopy was 5.55 %. For the composite that had a low glass/high carbon ratio, the void content as measured by the burnout test was 3.97% and that measured by microscopy was 4.91 %. For this paper, the microscopy was done by cutting, potting, and polishing sections of composites, and then taking pictures of the polished surfaces and estimating a value for the percent voids seem by using a computer program using Matlab.
Discussion
By the nature of the burnout test, we probably always get some removal of carbon. However, in a composite, most of the energy used goes into burning off the resin and sizing and, if we compare the expected vs. the measured values of the fiber volume of the carbon fibers, they tend to be very close. If we only burn off carbon fiber tows, we see a greater loss of carbon mass. Even holding the carbon fibers from a composite specimen an extra 30 min at 600 oC, we measure a significant amount of mass loss. Thus we favor limiting the time of exposure at this first plateau temperature.
The amount of sizing on the glass and carbon fibers was taken from the supplier data sheets and the procurement specifications. The amount of sizing on the glass tows can be estimated as well by burning off the size from glass tows. For carbon fibers, the fibers could undergo a solvent wash. In any event, the sizing does not seem to add a significant amount of mass or volume to the composite specimen.
Although the data certainly needs to be augmented, we are encouraged by the results to date. As far as voids are concerned, the NIST samples were molded essentially void-free. One of the reasons why this was possible was due to the relatively low fiber volume content of the specimens. Another reason was that we had the time to ensure that the resin thoroughly impregnated the tows before the specimens were cured. Both microscopy and burnout results point to exceedingly low voids. The industrial grade composites, however, did have measurable void contents. On the whole, the estimates from the burnout test to date may be on the conservative side. Microscopy does not seem to solve the problem, since extensive imaging is necessary to get a reasonable estimate

and the standard deviation can vary depending on the number of pictures taken, what resolutions are used, what magnifications, etc.
We found that for the most part, the resin and sizing were removed at 600 oC after 30 min. Where we sometimes observed difficulties was in removing the carbon at 900 oC. Occasionally, we needed to extend the time at temperature to ensure that the carbon was removed. This removal was verified visually.
Conclusion
Based on the data presented in this report, we believe that we have an acceptable modification to D 3171 to allow the estimation of the constituents of glass/carbon/epoxy hybrid composites.
Figures
TGA of Resin
Time (min)0 10 20 30 40 50 60
Wei
ght (
%)
0
10
20
30
40
50
60
70
80
90
100
110
Tem
pera
ture
(o C)
100
200
300
400
500
600
Weight (%) Temperature
Figure 1: TGA plot of the mass loss of resin at 600 oC. Note that the resin was removed after 30 min.
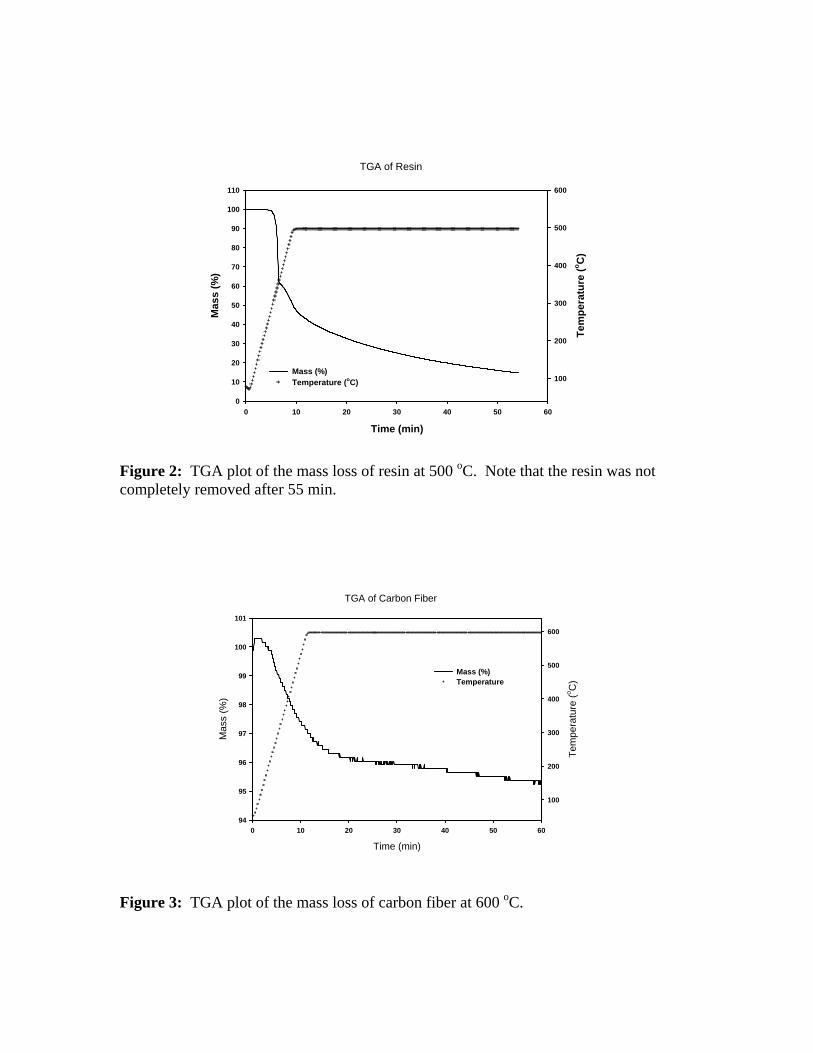
Figure 2: TGA plot of the mass loss of resin at 500 oC. Note that the resin was not completely removed after 55 min.
TGA of Resin
Time (min)0 10 20 30 40 50 60
Mas
s (%
)
0
10
20
30
40
50
60
70
80
90
100
110
Tem
pera
ture
(o C)
100
200
300
400
500
600
Mass (%) Temperature (oC)
TGA of Carbon Fiber
Time (min)
0 10 20 30 40 50 60
Mas
s (%
)
94
95
96
97
98
99
100
101
Tem
pera
ture
(o C)
100
200
300
400
500
600
Mass (%) Temperature
Figure 3: TGA plot of the mass loss of carbon fiber at 600 oC.

TGA of Carbon Fiber
Time (min)
0 10 20 30 40 50 60 70 80 90
Mas
s (%
)
0
10
20
30
40
50
60
70
80
90
100
110
Tem
pera
ture
(o C)
100
200
300
400
500
600
700
800
900
1000
Mass (%) Temperature (oC)
Figure 4: TGA plot of the mass loss of resin at 500 oC and at 900 oC. Note that the carbon was removed at 900 oC.
TGA of Glass Fiber
Time (min)
0 10 20 30 40 50 60
Mas
s (%
)
95
96
97
98
99
100
101Te
mpe
ratu
re (o C
)
100
200
300
400
500
600
700
800
900
1000
Mass (%) Temperature
Figure 5: TGA plot of the mass loss of glass fiber at 900 oC.

65%
70%
75%
80%
85%
90%
95%
100%
glasscomposite
tested
3:1glass/carboncompositeexpected
1:1glass/carboncomposite
tested
1:3glass/carboncompositeexpected
carboncomposite
tested
void volume fractioncarbon volume fractionglass volume fractionresin volume fraction
Figure 6: Bar chart of the expected and calculated components of the NIST made industrially made composites used in this study.
30%
40%
50%
60%
70%
80%
90%
100%
Industrial hybridcomposite #1 tested
Industrial hybridcomposite #1
expected
Industrial hybridcomposite #2 tested
Industrial hybridcomposite #2
expected
% voidscarbon:glassglass:carbon
Figure 7: This figure shows the relative ratios of carbon to glass in industrially made hybrid composites. The percent voids were included to show the differences in specimens measured by the burnout test (tested) with those measured from microphotographs.
Hybrid resinsample 1 complete mass loss at 600 C for 30 minsample 2 complete mass loss at 600 C for 45 min
Glass towssample 1 0.79 % mass loss at 600 C for 30 min, no change after 60 min at 900 Csample 2 1.0 % mass loss at 600 C for 45 min, no change after 60 min at 900 Csample 3 1.1 % mass loss at 600 C for 40 min, no change after 60 min at 900 C
average 0.96% mass loss
Carbon towssample 1 4.1 % mass loss at 600 C for 30 min, complete mass loss after 30 min at 900 Csample 2 9.6 % mass loss at 600 C for 45 min, complete mass loss after 30 min at 900 Csample 3 7.2 % mass loss at 600 C for 45 min, complete mass loss after 30 min at 900 C
average 7.0 % mass loss
NIST glass composite expected volume measured volumesample 1 29.6 29.8 30 min at 600 C, 30 min at 900 Csample 2 29.6 27.2 30 min at 600 C, 30 min at 900 Csample 3 29.6 29 30 min at 600 C, 30 min at 900 C
average 28.7
NIST carbon composite expected volumes measured volumessample 1 12.5 12.2 30 min at 600 C sample 2 12.5 12.6 30 min at 600 C
average 12.4
NIST hybrid 1:1 glass/carbon expected volumes measured volumessample 1 13.6/8.0 13.3/7.2 30 min at 600 C, 30 min at 900 Csample 2 13.6/8.0 14.0/8.0 30 min at 600 C, 30 min at 900 Csample 3 13.6/8.0 13.9/7.5 45 min at 600 C, 30 min at 900 Csample 4 13.6/8.0 13.9/8.1 30 min at 600 C, 90 min at 900 Csample 5 13.6/8.0 13.9/7.9 60 min at 515 C, 30 min at 800 C
average 13.8/7.7
NIST hybrid 3:1 glass/carbon expected volumes measured volumessample 1 24.1/5.2 24.6/5.4 40 min at 600 C, 30 min at 900 Csample 2 24.1/5.2 23.5/5.1 30 min at 600 C, 30 min at 900 Csample 3 24.1/5.2 23.9/5.2 45 min at 600 C, 30 min at 900 Csample 4 24.1/5.2 24.1/5.2
average 24.0/5.2
NIST hybrid 1:3 glass/carbon expected volumes measured volumessample 1 8.2/15.5 8.6/15.4 50 min at 600 C, 30 min at 900 Csample 2 8.2/15.5 8.0/14.7 30 min at 600 C, 30 min at 900 Csample 3 8.2/15.5 8.0/14.8 30 min at 600 C, 30 min at 900 Csample 4 8.2/15.5 8.0/15.2 30 min at 600 C, 60 min at 900 C
average 8.2/15.0
industrial composite expected ratios measured ratiosglass/carbon glass carbon
sample 1 37/63 40/60 50 min at 600 C, 60 min at 900 Csample 2 37/63 38/62 40 min at 600 C, 30 min at 900 Csample 3 37/63 38/62 30 min at 600 C, 60 min at 900 C
average 38.7/61.3
industrial composite expected ratios measured ratiosglass/carbon glass/carbon
sample 1 64/36 67/33 50 min at 600 C, 60 min at 900 Csample 2 64/36 66/34 40 min at 600 C, 30 min at 900 Csample 3 64/36 67/33 30 min at 600 C, 60 min at 900 C
Table 1: Results from the burn off tests
average 66.7/33.3


![Evolution of kink bands in a notched unidirectional carbon ...€¦ · was approximately 51%, measured by the matrix digestion method described in ASTM D3171 [16]. Specimens with](https://img.pdfslide.us/doc/110x75/60e82d2b2e2bb56e054a98de/evolution-of-kink-bands-in-a-notched-unidirectional-carbon-was-approximately.jpg)