Embed Size (px)
Citation preview
Total Suspended Solids (TSS)
The importance of particules count …and their size,
for an energy efficient cooling system
1
October 3rd, 2012 Doha
To Save Energy, water and chemicals on cooling systems
Multiple efforts deployed by the HVAC designers, except one which is often overlooked or misunderstood….
Water Quality
The Challenge
Most Designers feel that the water quality
should be left to the Chemical Companies…
They are right… except when it
comes to Suspended Solids: TSS
Why?
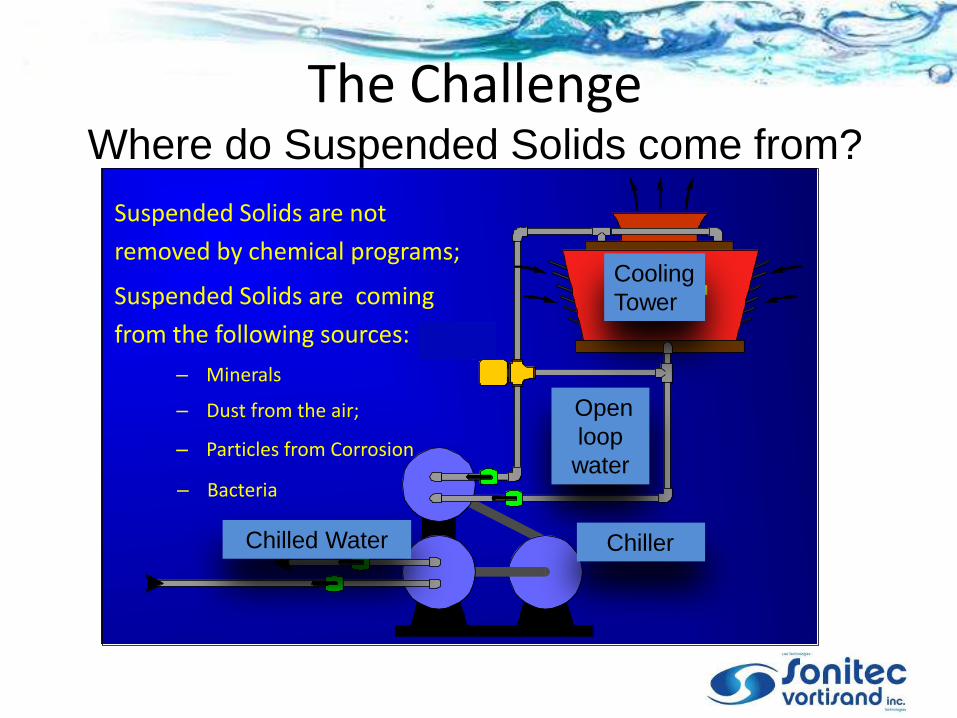
The Challenge Where do Suspended Solids come from?
RefroidisseurEau refroidie
Tour d’eau
Pompe
Suspended Solids are not
removed by chemical programs;
Suspended Solids are coming
from the following sources:
Cooling
Tower
Open
loop
water
Chiller Chilled Water
– Minerals
– Dust from the air;
– Particles from Corrosion
– Bacteria
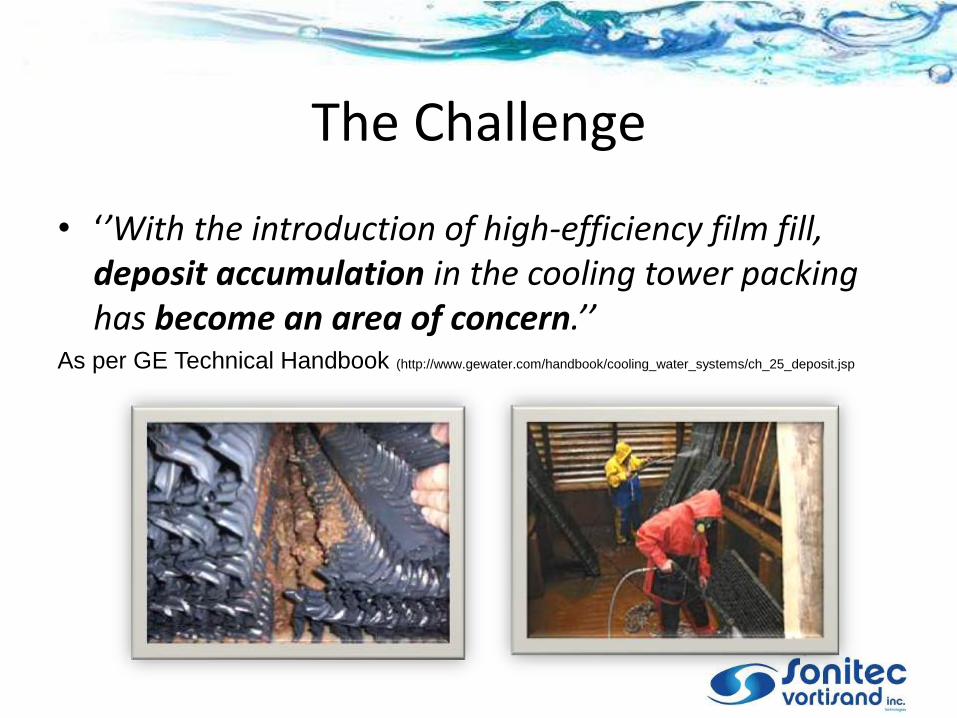
The Challenge
• ‘’With the introduction of high-efficiency film fill, deposit accumulation in the cooling tower packing has become an area of concern.’’
As per GE Technical Handbook (http://www.gewater.com/handbook/cooling_water_systems/ch_25_deposit.jsp

Dust entering the cooling systems (at 60 µg/m3) Cooling capacity (Tn) Air Flow (CFM) Weight of dust after 90
days
240 62 790 31 lbs (14 kg )
400 103 700 50 lbs (23 kg)
828 203 230 99 lbs (45 kg)
1300 302 580 147 lbs (67 kg)
The Challenge
http://www.epa.gov/airtrends/pm.html

Energy waste
Fouling (insulating layer inside pipes) by unfiltered mineral & organic particles and bacteria
• Reduces energy exchange • Reduces service life of system
Fouled
Clean
Water waste
Unfiltered Total Suspended and Air Solids limits Cycles of Concentration at cooling towers
• Increasing blow down water waste
• Increasing risk of cooling tower failure
• Increasing need for filter backwash
Poor filtration and biological loading limit the use of grey water for cooling
Health risks
Legionella feeds on unfiltered organic solids and bio particles
• Increased need of biocides, dispersants and maintenance
Suspended particles cause resource waste, health risks, and environmental impact
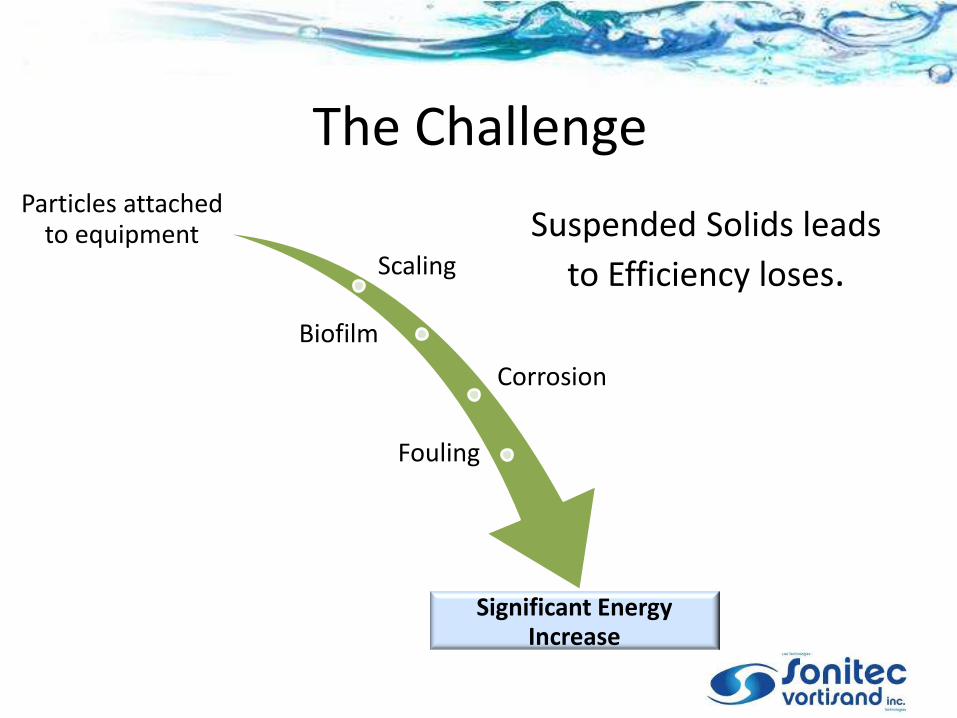
Suspended Solids leads
to Efficiency loses.
Particles attached to equipment
Scaling
Biofilm
Corrosion
Fouling
Significant Energy Increase
The Challenge
The Challenge
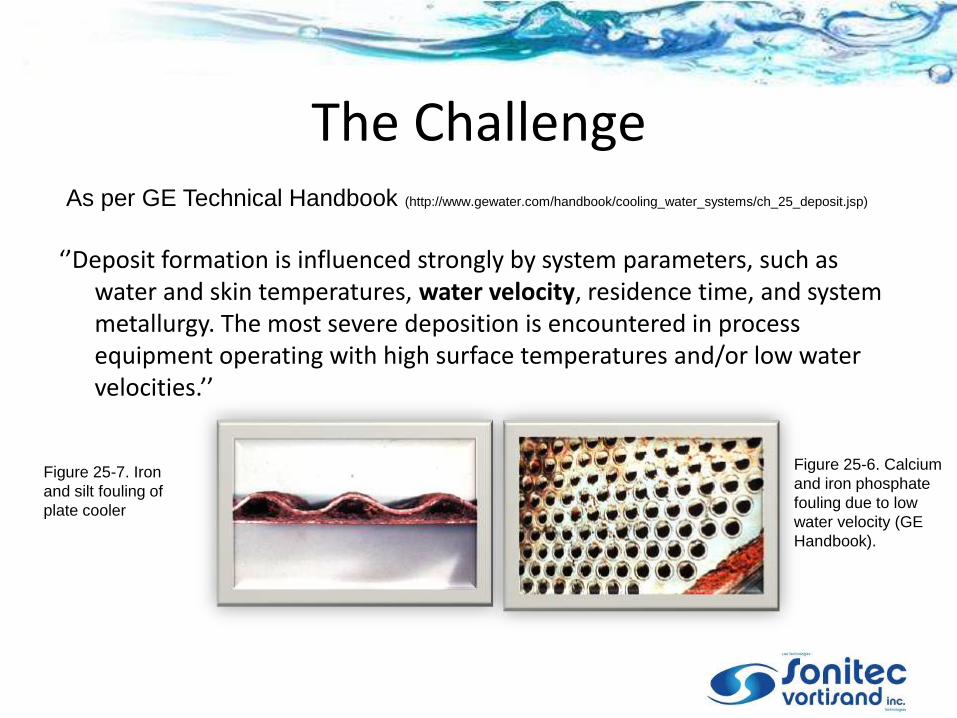
‘’Deposit formation is influenced strongly by system parameters, such as water and skin temperatures, water velocity, residence time, and system metallurgy. The most severe deposition is encountered in process equipment operating with high surface temperatures and/or low water velocities.’’
As per GE Technical Handbook (http://www.gewater.com/handbook/cooling_water_systems/ch_25_deposit.jsp)
Figure 25-6. Calcium
and iron phosphate
fouling due to low
water velocity (GE
Handbook).
Figure 25-7. Iron
and silt fouling of
plate cooler
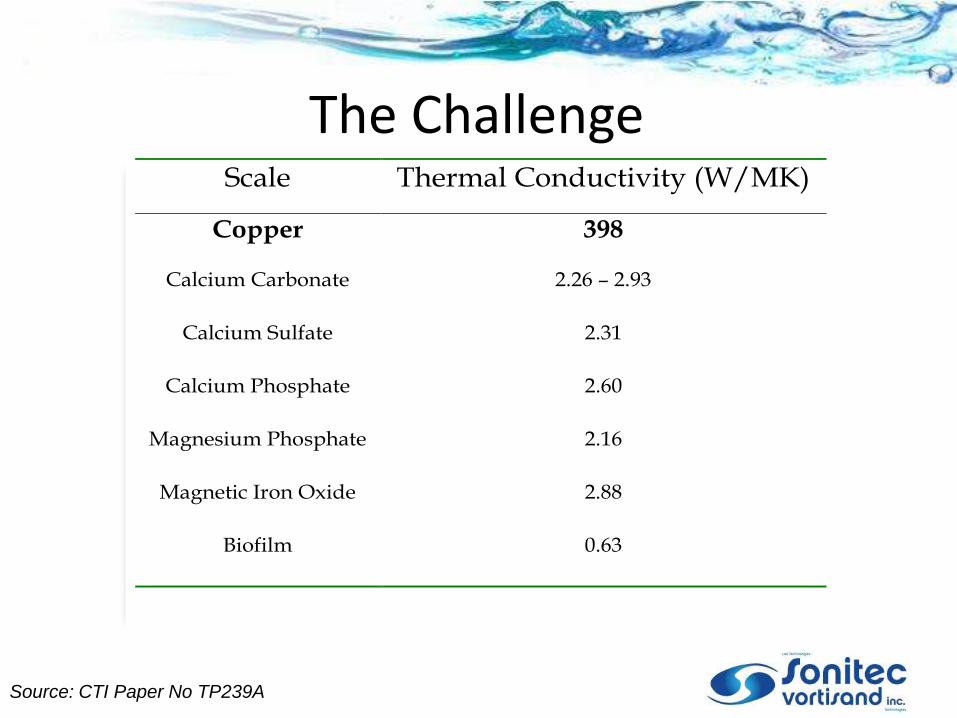
Thermal Conductivity Table
Source: CTI Paper No TP239A
The Challenge Scale Thermal Conductivity (W/MK)
Copper 398
Calcium Carbonate 2.26 – 2.93
Calcium Sulfate 2.31
Calcium Phosphate 2.60
Magnesium Phosphate 2.16
Magnetic Iron Oxide 2.88
Biofilm 0.63
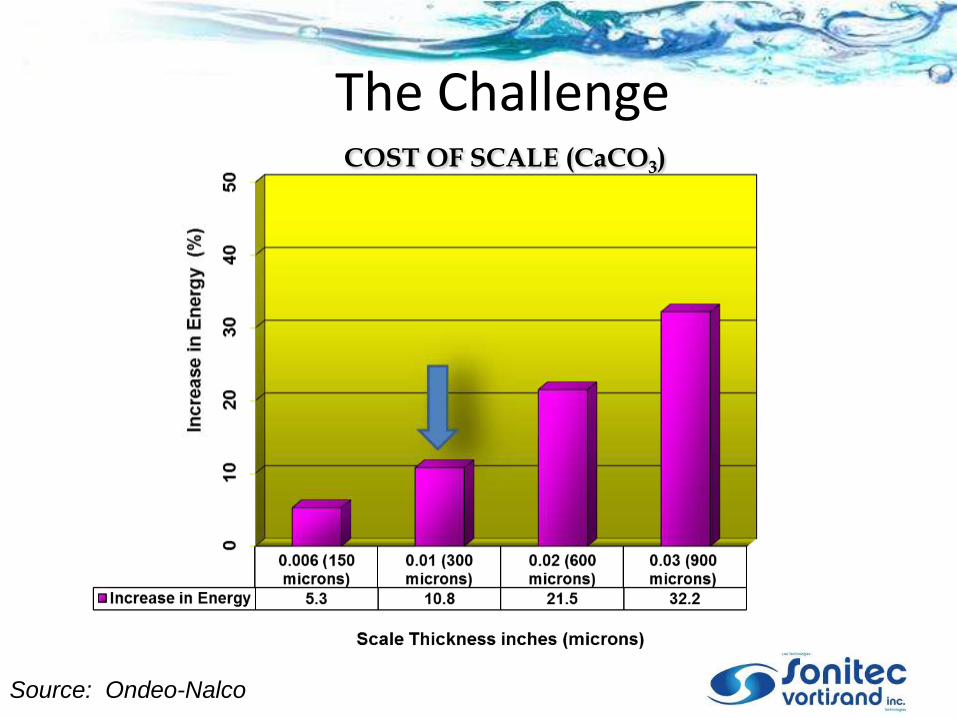
COST OF SCALE (CaCO3)
Source: Ondeo-Nalco
The Challenge
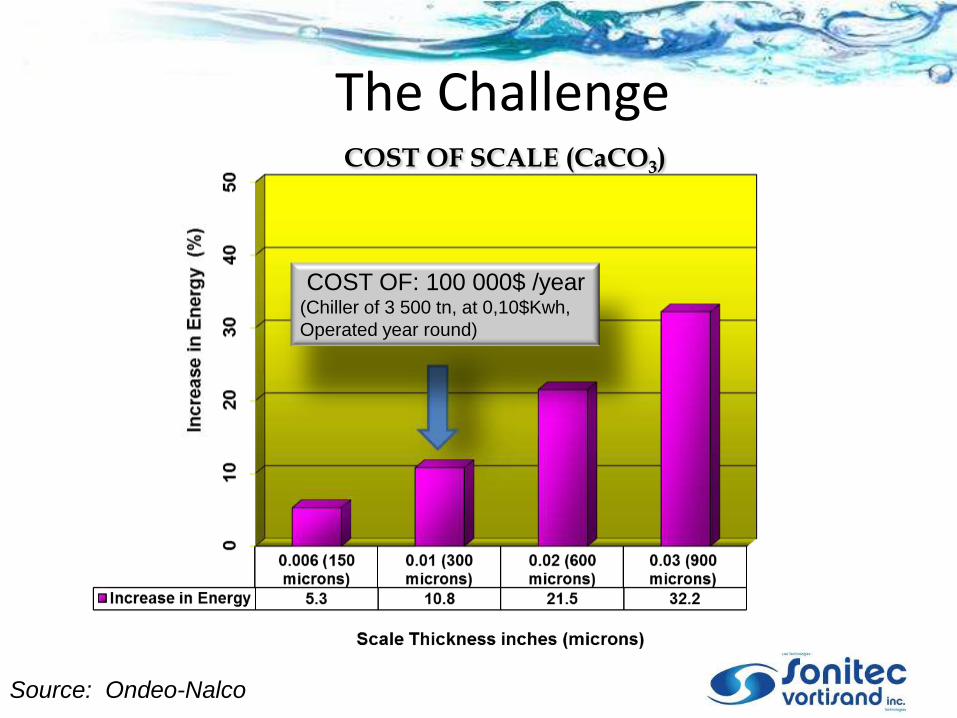
COST OF SCALE (CaCO3)
Source: Ondeo-Nalco
The Challenge
COST OF: 100 000$ /year (Chiller of 3 500 tn, at 0,10$Kwh,
Operated year round)
The Chalenge
A physical treatment is required
‘’Removal of particulate does matter
The amount of particulate entering a cooling system with the makeup water can be reduced by filtration and/or sedimentation processes. Particulate removal can also be accomplished by filtration of recirculating cooling water.
The level of fouling experienced is influenced by the effectiveness of the particular removal scheme employed, the water velocities in the process equipment, and the cycles of concentration in the cooling tower.’’
As per GE Technical Handbook)
http://www.gewater.com/handbook/cooling_water_systems/ch_25_deposit.jsp)
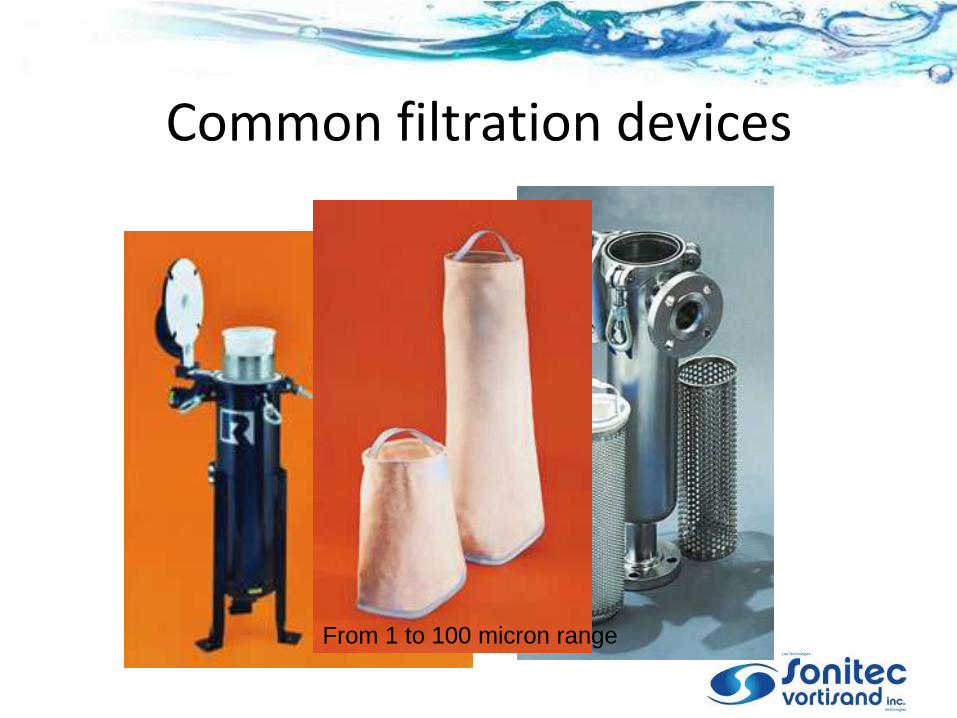
Common filtration devices
From 1 to 100 micron range
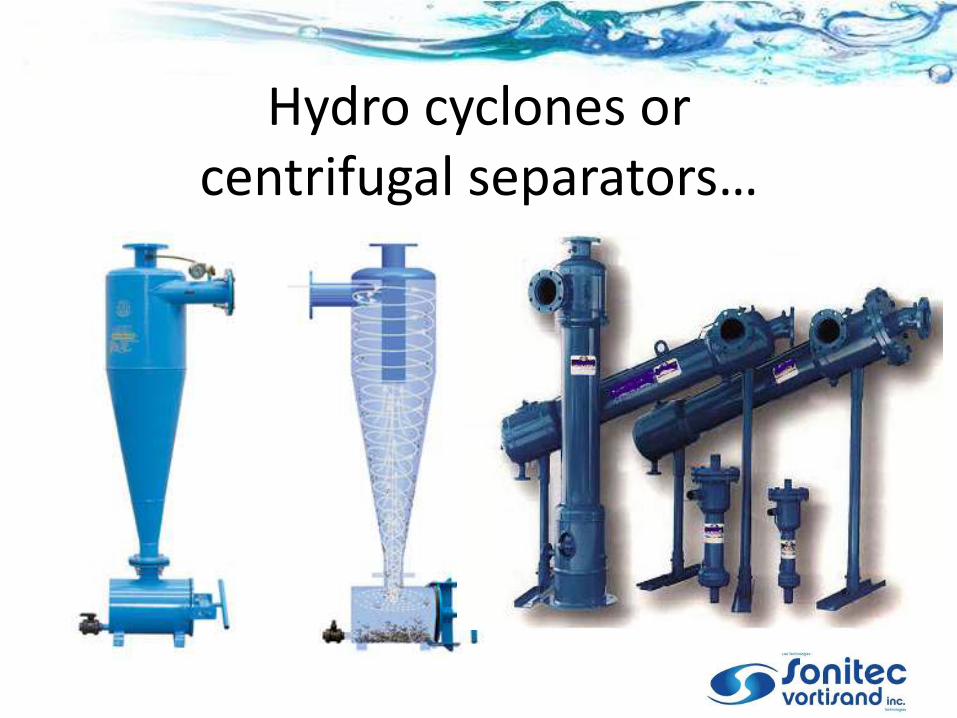
Hydro cyclones or centrifugal separators…

PPM Can be misleading
One 13mm marble = 256 Billion particles of 2 µ
Removing the marble means: 50% removal on a ppm basis
Inefficient on a particle count basis
16
PPM:A weight measurement

“Size does Count !”
• Based on our 20+ years experience, the particles larger than 5
micron make up for more than 90 % of the weight.
• Typically, 85-90% of the particles found in the recirculation water are smaller than 5 micron in size.
Therefore comparing technologies on a ppm basis will not give you the real picture …
look for a Particle Size Distribution Report
before choosing the technology
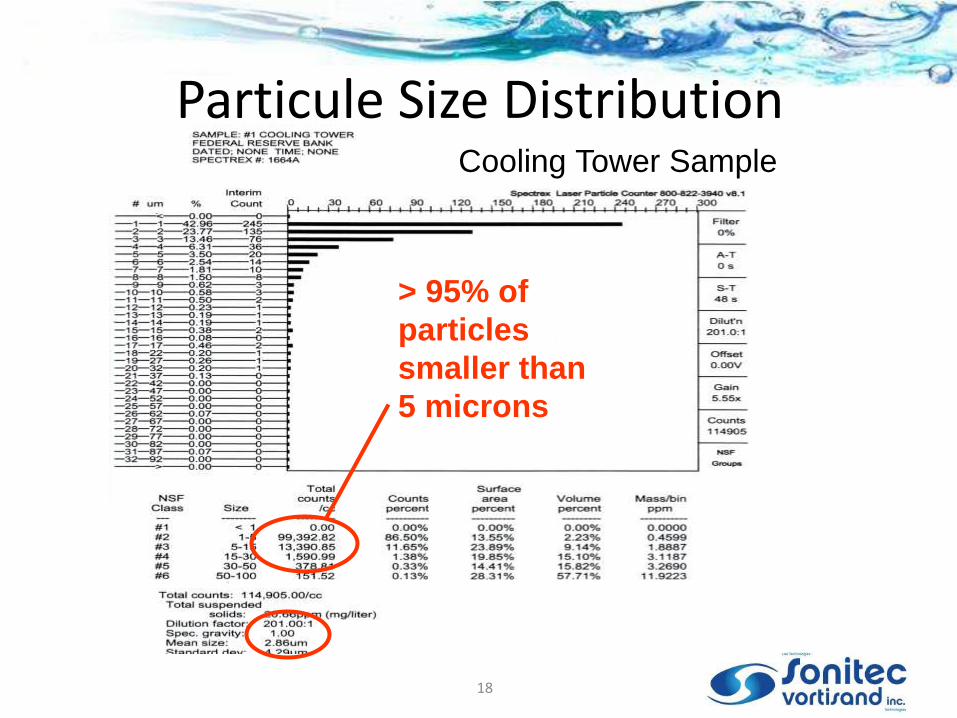
> 95% of
particles
smaller than
5 microns
Particule Size Distribution Cooling Tower Sample
18
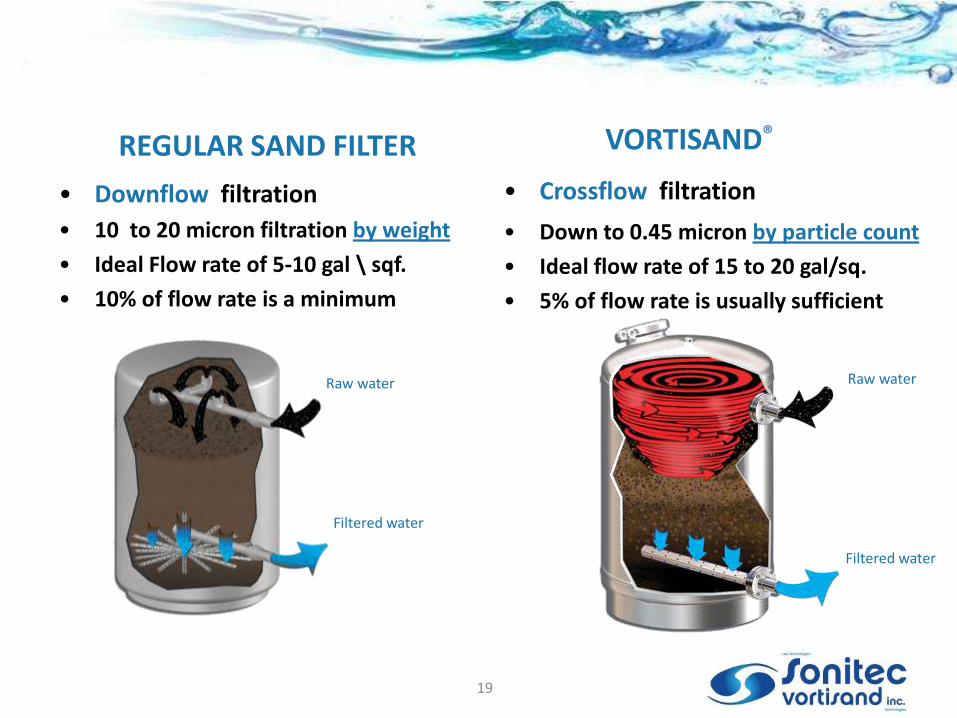
VORTISAND®
• Crossflow filtration
• Down to 0.45 micron by particle count
• Ideal flow rate of 15 to 20 gal/sq.
• 5% of flow rate is usually sufficient
Raw water
Filtered water
REGULAR SAND FILTER
• Downflow filtration
• 10 to 20 micron filtration by weight
• Ideal Flow rate of 5-10 gal \ sqf.
• 10% of flow rate is a minimum
Raw water
Filtered water
19

60”
7
2”
Regular Sand Filter
Backwash
Flow Rate 250 GPM @ 12 min.
3 000 Total Gallons
Backwash Piping
Supply / Discharge
4” dia. 19.6 ft2
30”
53
”
Cross Flow Filtration VORTISAND
Backwash Flow Rate 50 GPM @ 4-8 min.
300 Total Gallons
Backwash Piping Supply / Discharge
2” dia. VORTISAND ®
4.9 ft2
Benefits Of Vortisand:
Less foot print - easier to locate area for installation Less backwash rate – possible limited feed flow / pressure Less backwash volume – waste water to treat and discharge (90%) Lower installation cost – foot print and piping dia. requirements
BACKWASH WATER REQUIREMENTS Footprint \ Space savings
20
Process Flow Rate 100 gpm
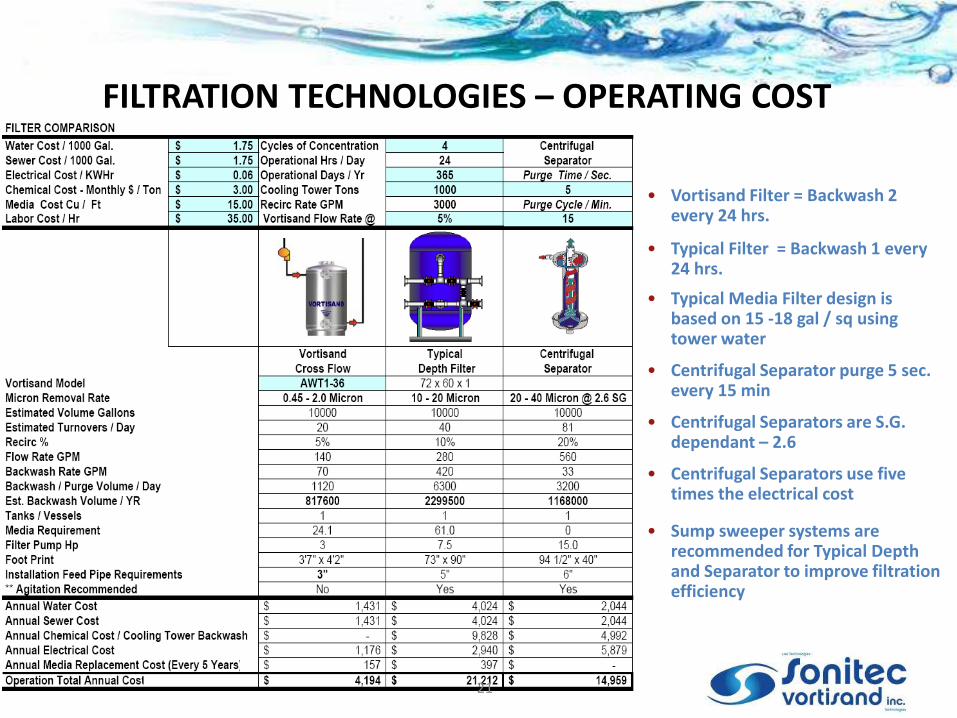
• Vortisand Filter = Backwash 2 every 24 hrs.
• Typical Filter = Backwash 1 every 24 hrs.
• Typical Media Filter design is based on 15 -18 gal / sq using tower water
• Centrifugal Separator purge 5 sec. every 15 min
• Centrifugal Separators are S.G. dependant – 2.6
• Centrifugal Separators use five times the electrical cost
• Sump sweeper systems are recommended for Typical Depth and Separator to improve filtration efficiency
FILTRATION TECHNOLOGIES – OPERATING COST
21
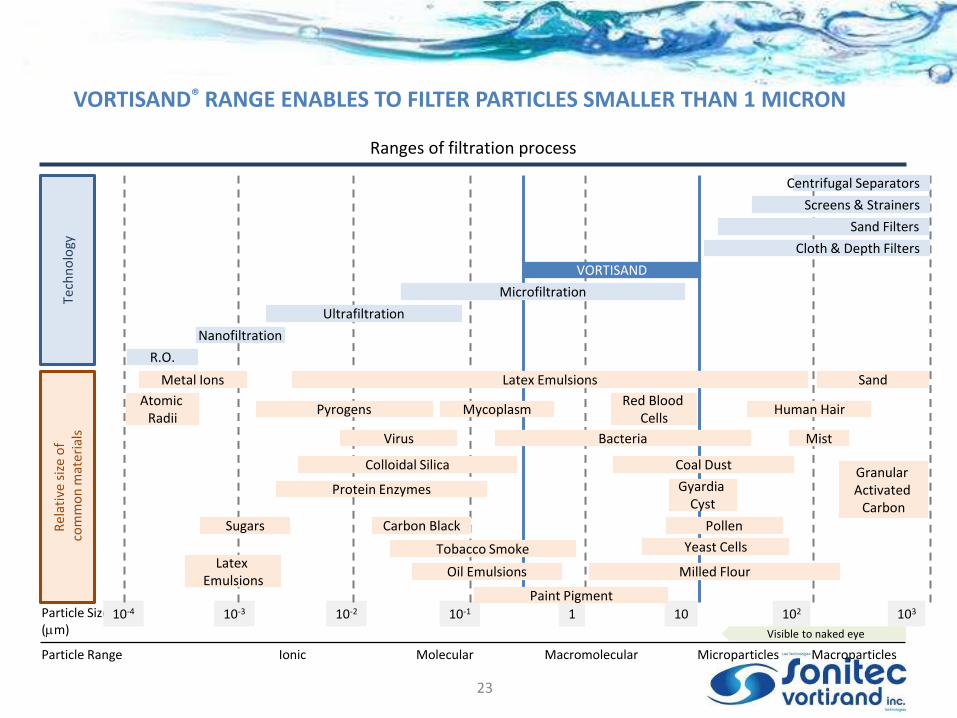
Ranges of filtration process
Particle Size (mm)
Macroparticles Microparticles Macromolecular Molecular Ionic Particle Range
10-4 10-3 10-2 10-1 1 10 102 103
Rel
ativ
e si
ze o
f c
om
mo
n m
ate
rial
s Te
chn
olo
gy
Latex Emulsions Sand
R.O.
Nanofiltration
Ultrafiltration
Atomic Radii
Microfiltration
Cloth & Depth Filters
Screens & Strainers
Centrifugal Separators
Sand Filters
Latex Emulsions
Virus
Oil Emulsions
Red Blood Cells
Mist
Sugars
Protein Enzymes
Pyrogens
Colloidal Silica
Carbon Black
Mycoplasm
Tobacco Smoke
Metal Ions
Paint Pigment
Bacteria
Coal Dust
Pollen
Yeast Cells
Milled Flour
Human Hair
Granular Activated
Carbon
VORTISAND
Gyardia Cyst
Visible to naked eye
VORTISAND® RANGE ENABLES TO FILTER PARTICLES SMALLER THAN 1 MICRON
23
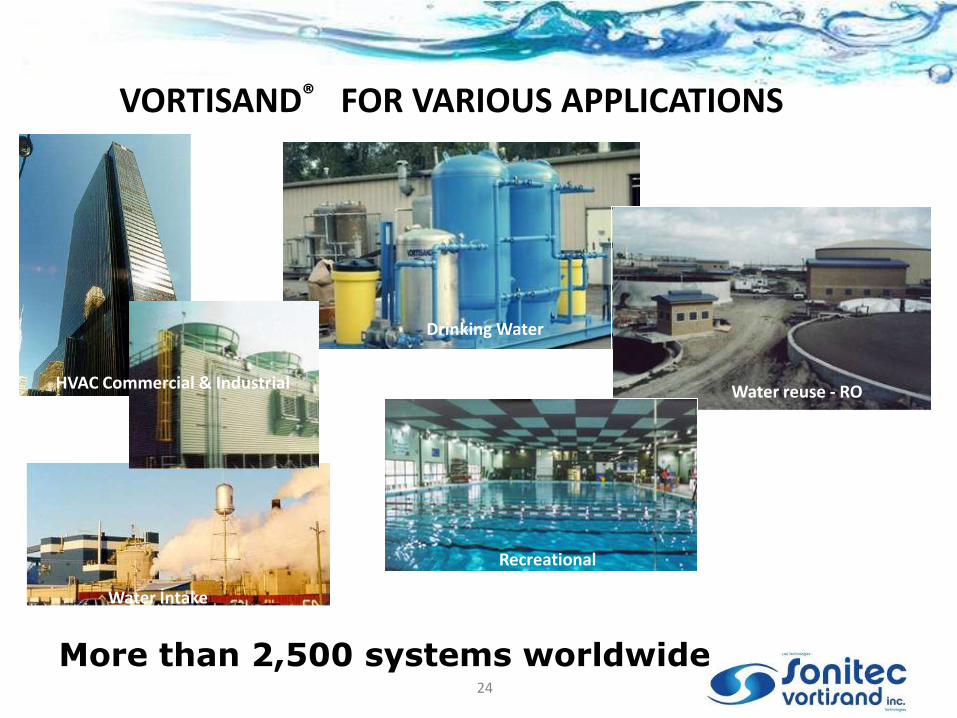
VORTISAND® FOR VARIOUS APPLICATIONS
Drinking Water
Water Intake
Water reuse - RO
Recreational
HVAC Commercial & Industrial
24
More than 2,500 systems worldwide

Clients Sample of the Vortisand® system
Datacenters
25
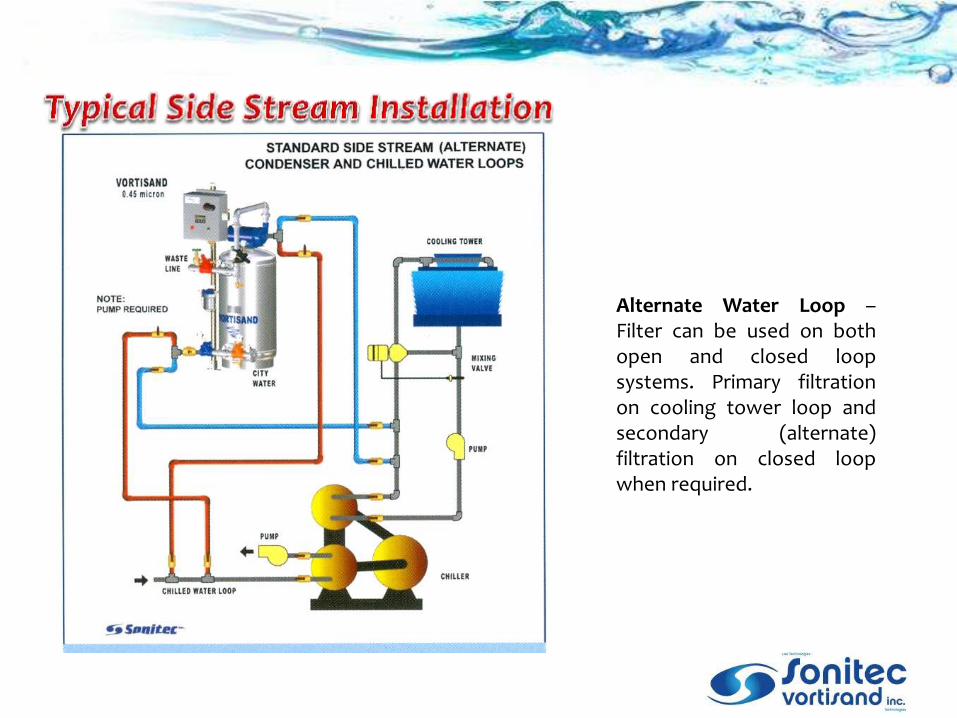
Alternate Water Loop – Filter can be used on both open and closed loop systems. Primary filtration on cooling tower loop and secondary (alternate) filtration on closed loop when required.
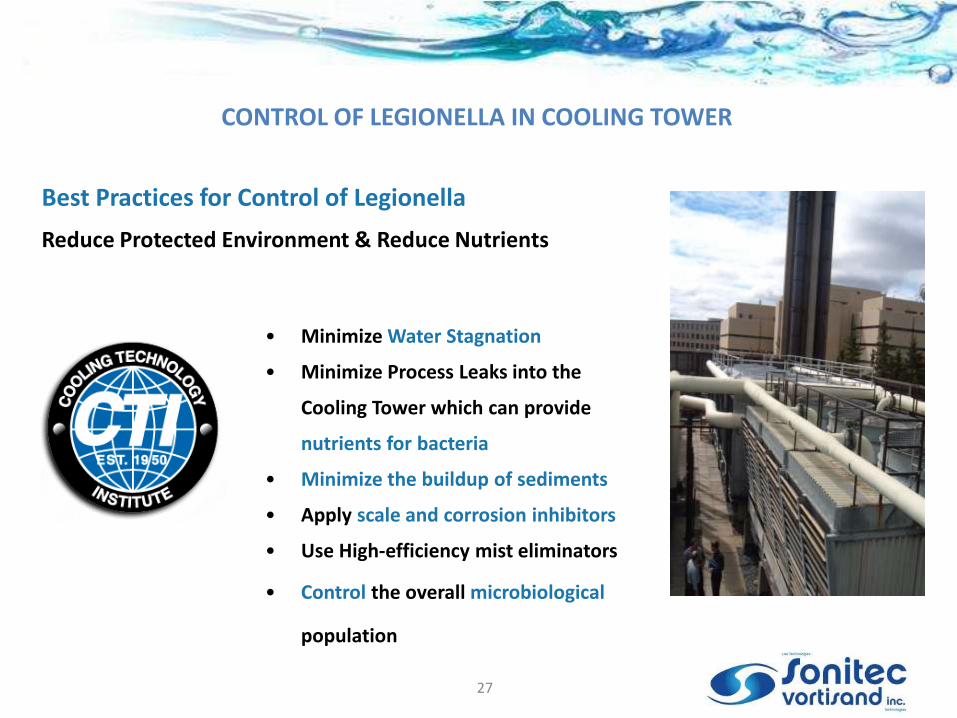
Best Practices for Control of Legionella
Reduce Protected Environment & Reduce Nutrients
• Minimize Water Stagnation
• Minimize Process Leaks into the
Cooling Tower which can provide
nutrients for bacteria
• Minimize the buildup of sediments
• Apply scale and corrosion inhibitors
• Use High-efficiency mist eliminators
• Control the overall microbiological
population
CONTROL OF LEGIONELLA IN COOLING TOWER
27
28
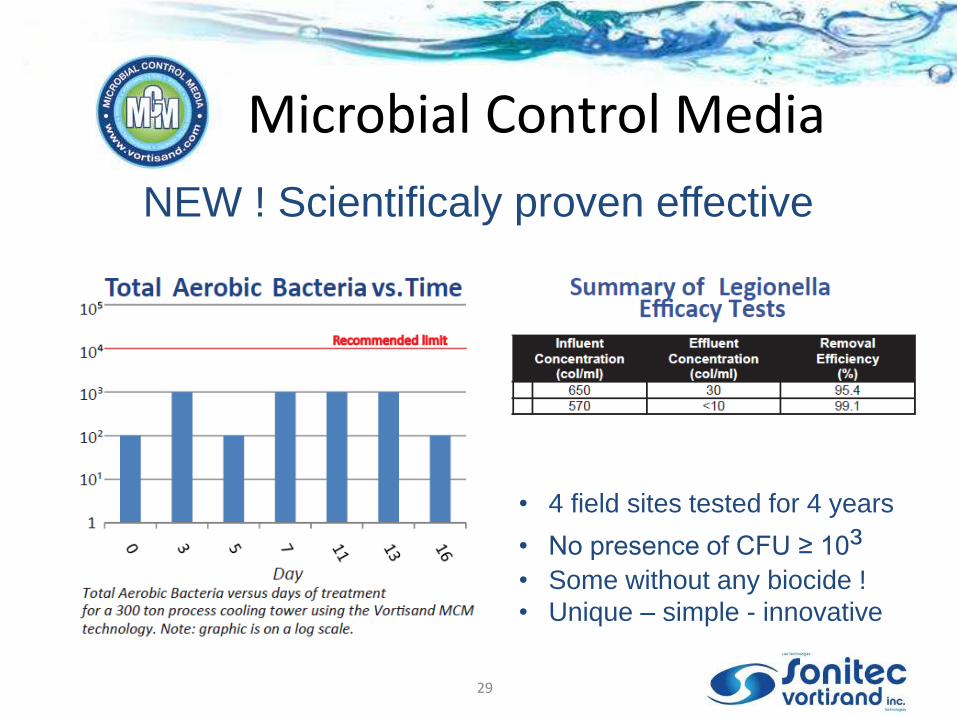
Microbial Control Media
NEW ! Scientificaly proven effective
29
• 4 field sites tested for 4 years
• No presence of CFU ≥ 10³ • Some without any biocide !
• Unique – simple - innovative
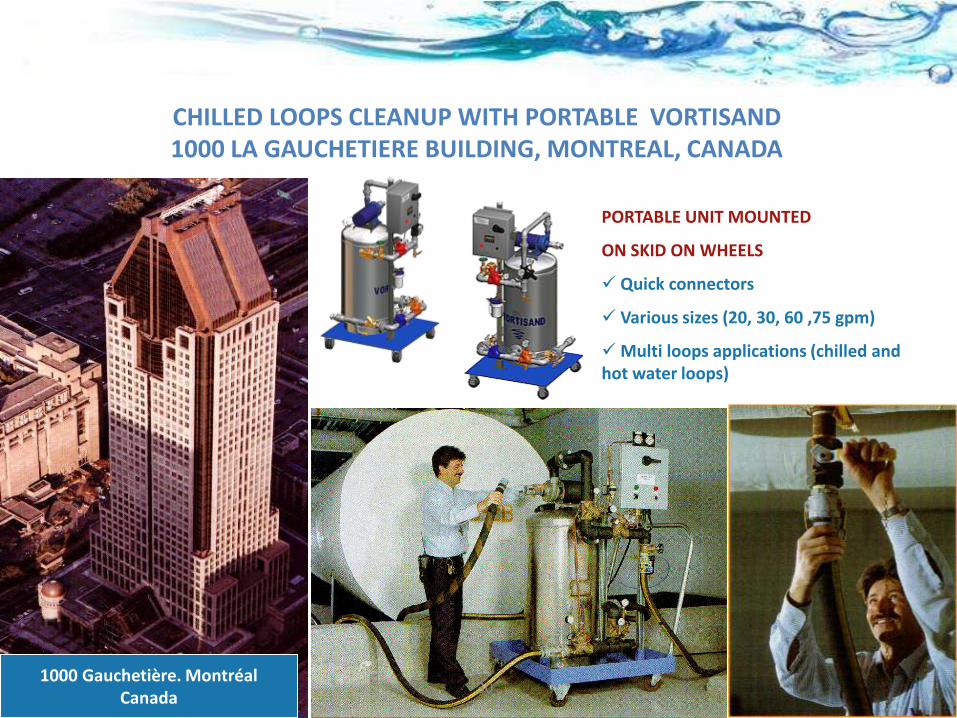
1000 Gauchetière. Montréal Canada
PORTABLE UNIT MOUNTED
ON SKID ON WHEELS
Quick connectors
Various sizes (20, 30, 60 ,75 gpm)
Multi loops applications (chilled and hot water loops)
CHILLED LOOPS CLEANUP WITH PORTABLE VORTISAND 1000 LA GAUCHETIERE BUILDING, MONTREAL, CANADA
30
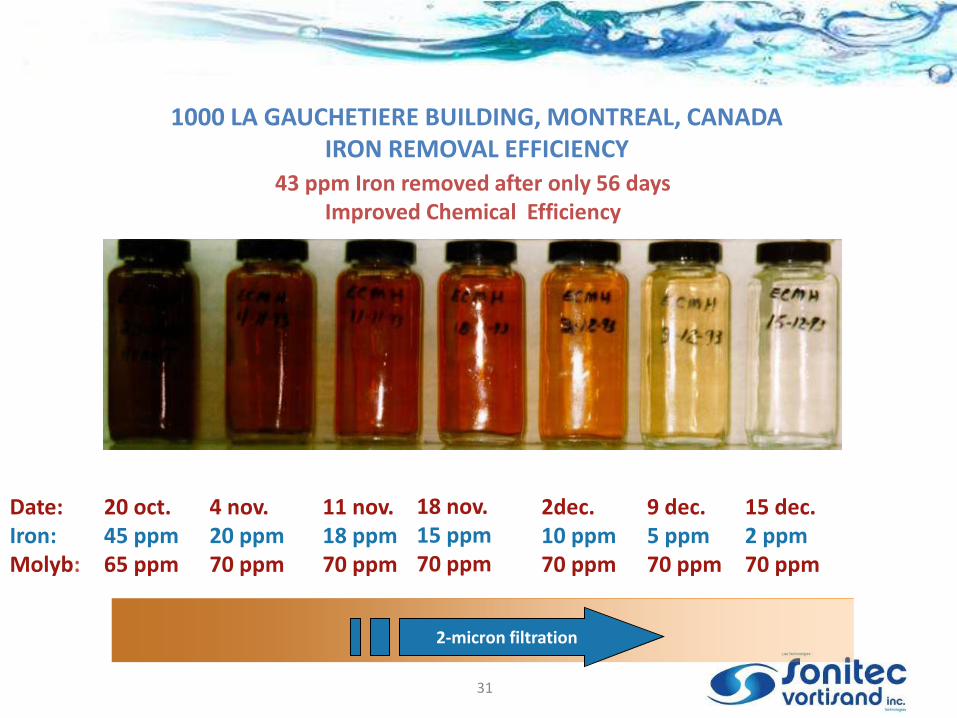
43 ppm Iron removed after only 56 days Improved Chemical Efficiency
Date: Iron: Molyb:
20 oct. 45 ppm 65 ppm
4 nov. 20 ppm 70 ppm
11 nov. 18 ppm 70 ppm
18 nov. 15 ppm 70 ppm
2dec. 10 ppm 70 ppm
9 dec. 5 ppm 70 ppm
15 dec. 2 ppm 70 ppm
2-micron filtration
1000 LA GAUCHETIERE BUILDING, MONTREAL, CANADA IRON REMOVAL EFFICIENCY
31
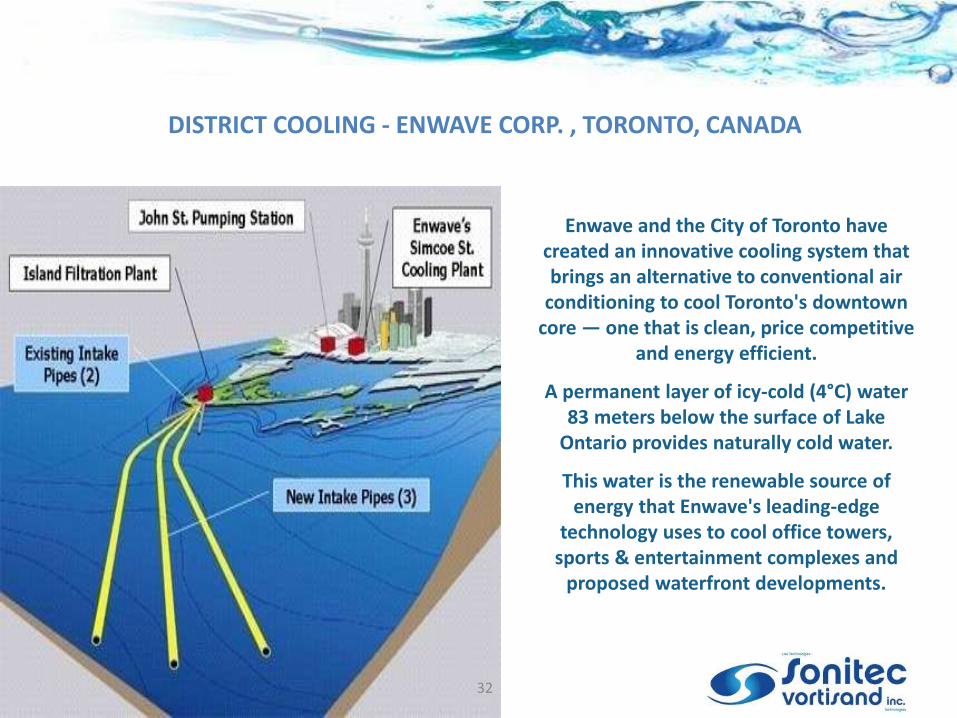
Enwave and the City of Toronto have created an innovative cooling system that brings an alternative to conventional air
conditioning to cool Toronto's downtown core — one that is clean, price competitive
and energy efficient.
A permanent layer of icy-cold (4°C) water 83 meters below the surface of Lake
Ontario provides naturally cold water.
This water is the renewable source of energy that Enwave's leading-edge
technology uses to cool office towers, sports & entertainment complexes and
proposed waterfront developments.
DISTRICT COOLING - ENWAVE CORP. , TORONTO, CANADA
32

0
50,000
100,000
150,000
200,000
250,000
300,000
350,000
400,000
Parti
cle
co
un
t (#
/ml)
<1 1-2 3-8 8-16
Particle Sizes (micron)
Start up
After 2 months
98
99
99
100%
DISTRICT COOLING - ENWAVE CORP. , TORONTO, CANADA
ENWAVE Chilled Water Loop Particle Count - Start up / After 2 months CHILLED
WATER LOOP
suspended particle
counts shows that
most suspended
solids are smaller
than
5 microns.
90% TSS Reduction after 4 weeks District Cooling Vortisand model AWT6-30-SI
Model AWT6-30-SI 33
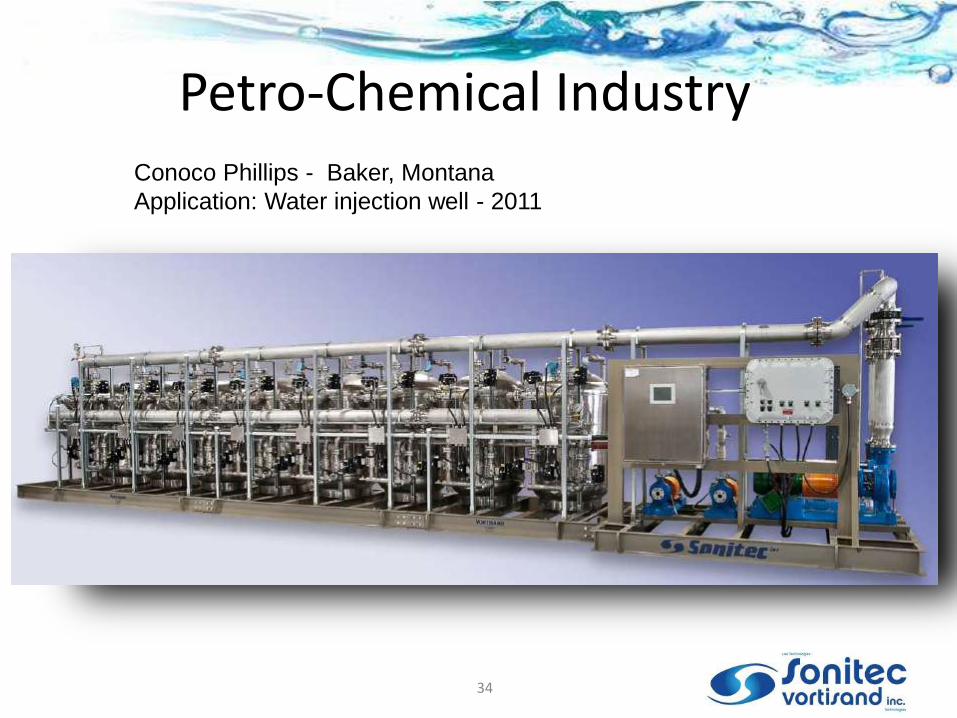
Petro-Chemical Industry Conoco Phillips - Baker, Montana
Application: Water injection well - 2011
34
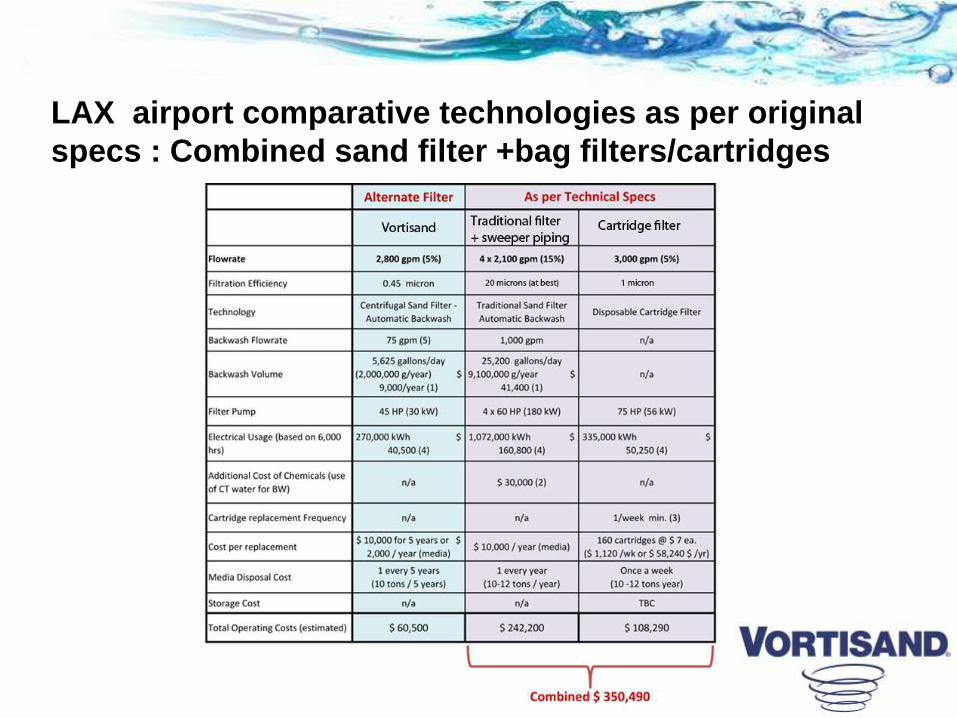
LAX airport comparative technologies as per original
specs : Combined sand filter +bag filters/cartridges
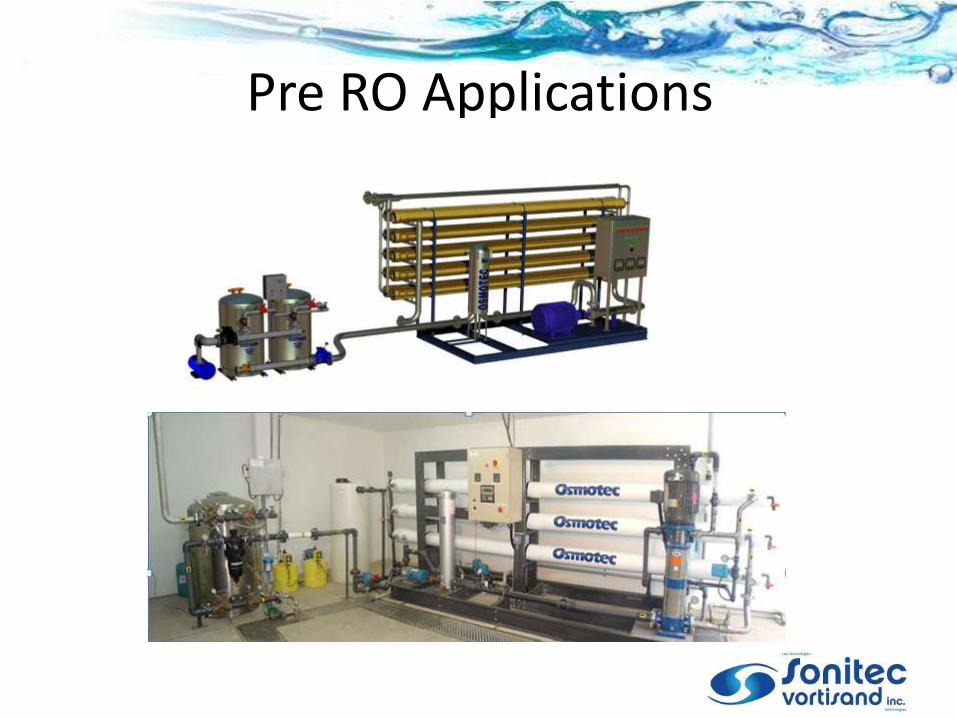
Pre RO Applications
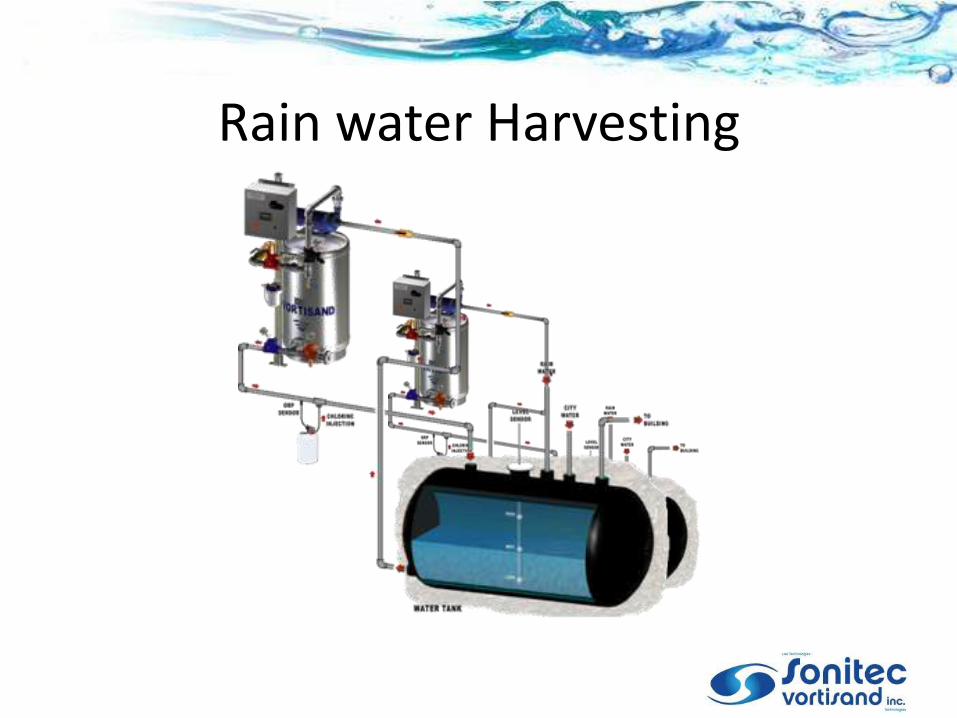
Rain water Harvesting
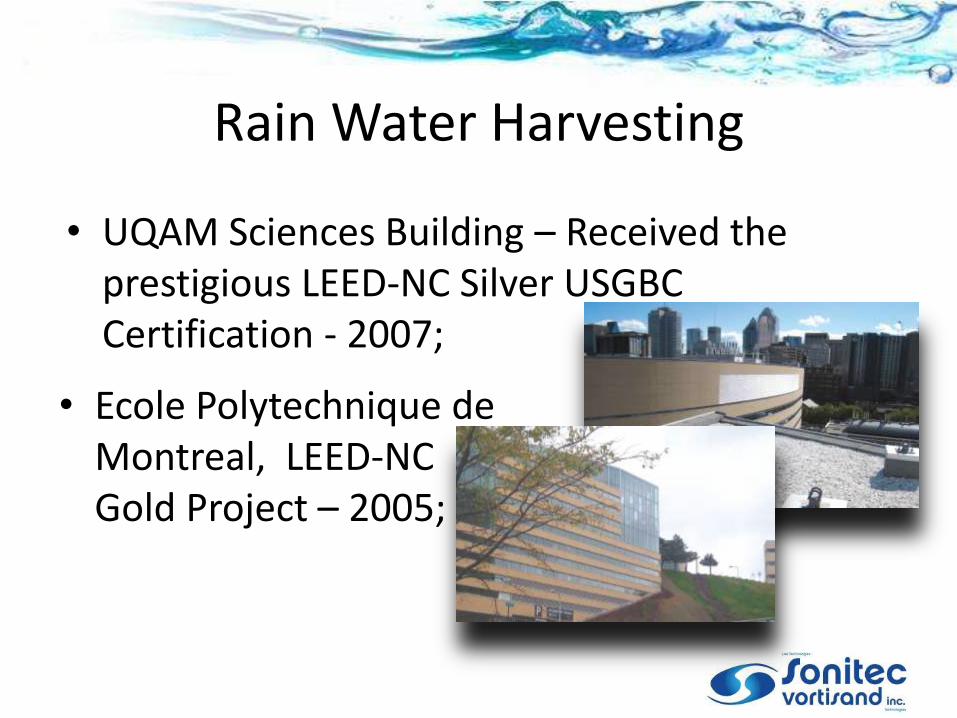
Rain Water Harvesting
• UQAM Sciences Building – Received the prestigious LEED-NC Silver USGBC Certification - 2007;
• Ecole Polytechnique de Montreal, LEED-NC Gold Project – 2005;
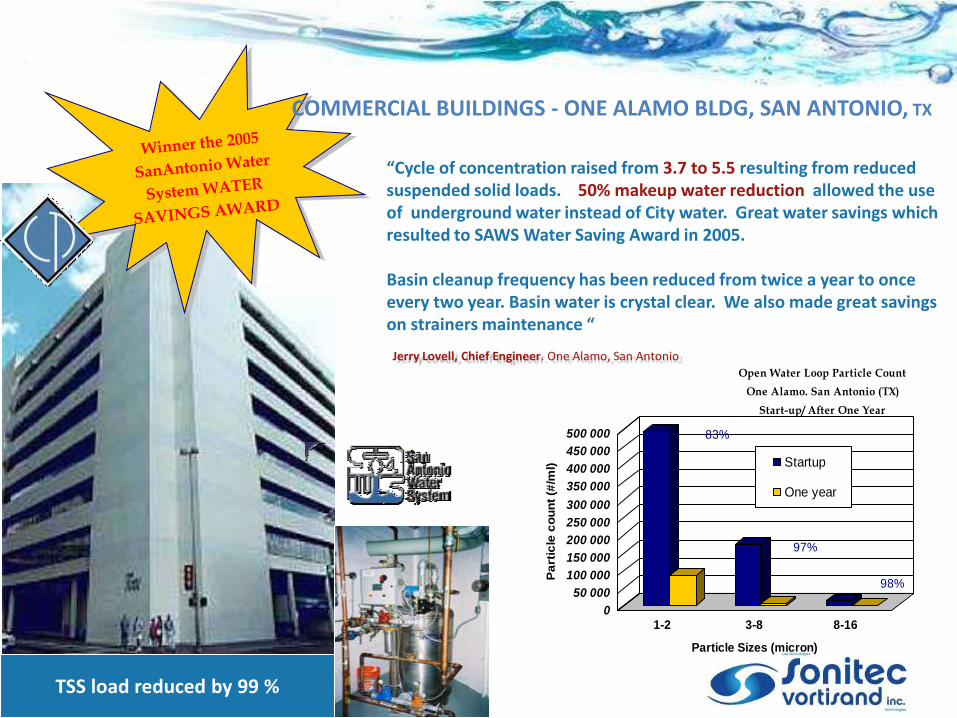
TSS load reduced by 99 %
“Cycle of concentration raised from 3.7 to 5.5 resulting from reduced suspended solid loads. 50% makeup water reduction allowed the use of underground water instead of City water. Great water savings which resulted to SAWS Water Saving Award in 2005. Basin cleanup frequency has been reduced from twice a year to once every two year. Basin water is crystal clear. We also made great savings on strainers maintenance “
Jerry Lovell, Chief Engineer. One Alamo, San Antonio
0
50 000
100 000
150 000
200 000
250 000
300 000
350 000
400 000
450 000
500 000
Pa
rtic
le c
ou
nt
(#/m
l)
1-2 3-8 8-16
Particle Sizes (micron)
Open Water Loop Particle Count
One Alamo. San Antonio (TX)
Start-up/ After One Year
Startup
One year
83%
97%
98%
COMMERCIAL BUILDINGS - ONE ALAMO BLDG, SAN ANTONIO, TX
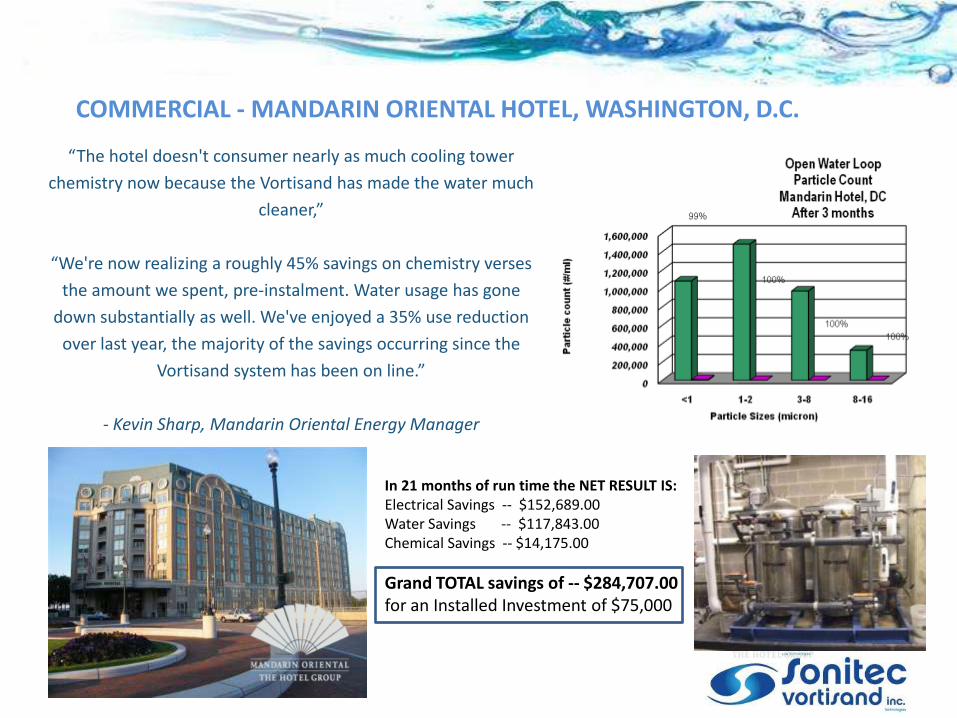
COMMERCIAL – MANDARIN ORIENTAL HOTEL, WASHINGTON, D.C.
In 21 months of run time the NET RESULT IS: Electrical Savings -- $152,689.00 Water Savings -- $117,843.00 Chemical Savings -- $14,175.00
Grand TOTAL savings of -- $284,707.00 for an Installed Investment of $75,000
COMMERCIAL - MANDARIN ORIENTAL HOTEL, WASHINGTON, D.C.
“The hotel doesn't consumer nearly as much cooling tower
chemistry now because the Vortisand has made the water much
cleaner,”
“We're now realizing a roughly 45% savings on chemistry verses
the amount we spent, pre-instalment. Water usage has gone
down substantially as well. We've enjoyed a 35% use reduction
over last year, the majority of the savings occurring since the
Vortisand system has been on line.”
- Kevin Sharp, Mandarin Oriental Energy Manager
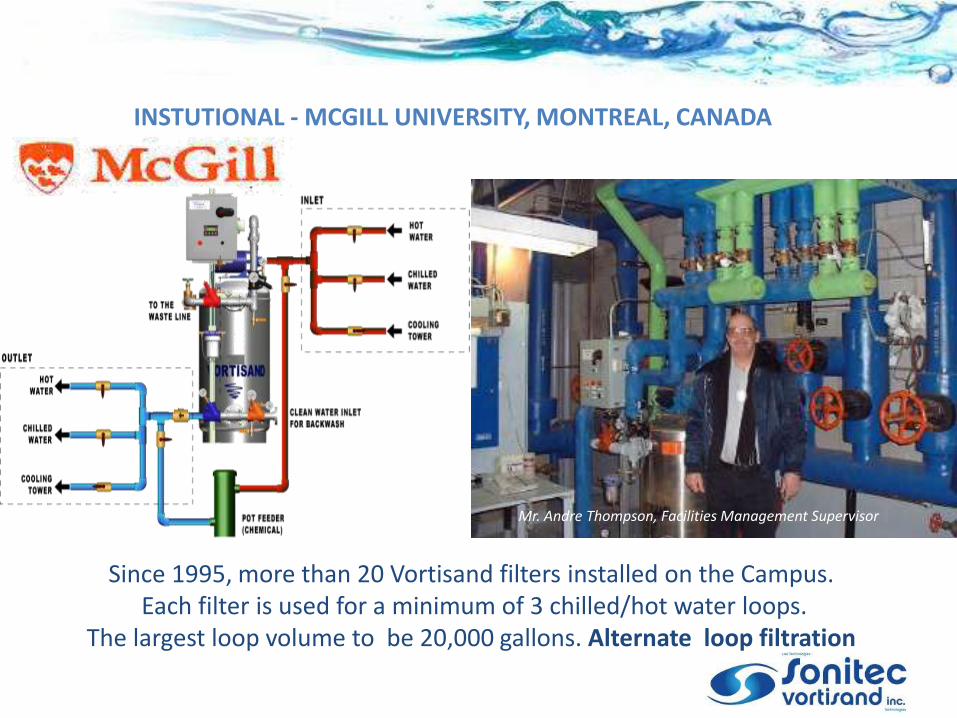
Since 1995, more than 20 Vortisand filters installed on the Campus. Each filter is used for a minimum of 3 chilled/hot water loops.
The largest loop volume to be 20,000 gallons. Alternate loop filtration
INSTUTIONAL - MCGILL UNIVERSITY, MONTREAL, CANADA
Mr. Andre Thompson, Facilities Management Supervisor
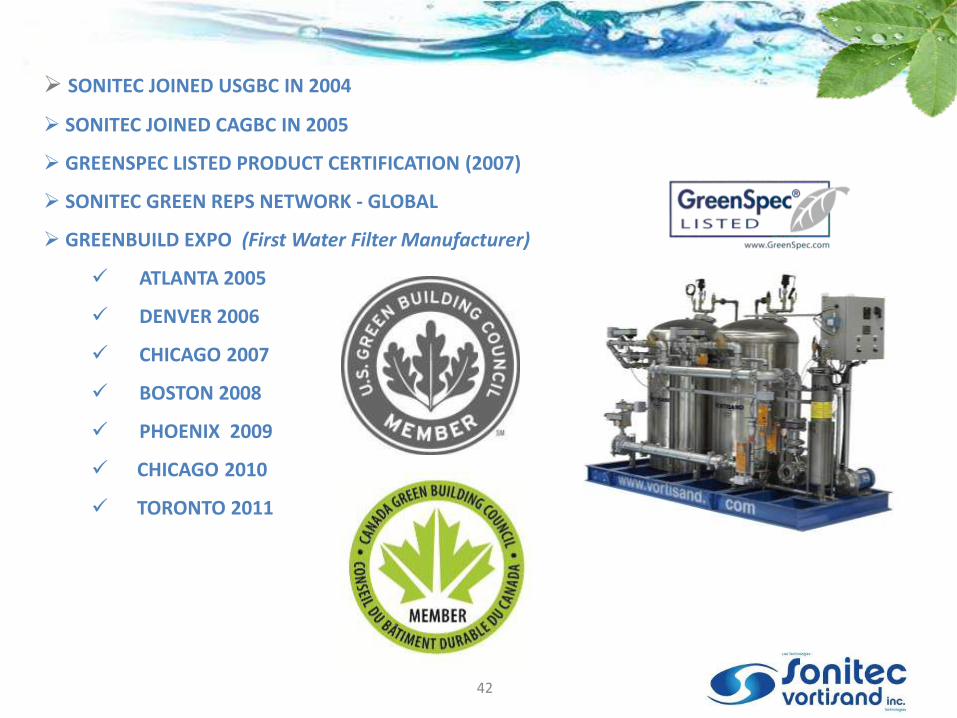
SONITEC JOINED USGBC IN 2004
SONITEC JOINED CAGBC IN 2005
GREENSPEC LISTED PRODUCT CERTIFICATION (2007)
SONITEC GREEN REPS NETWORK - GLOBAL
GREENBUILD EXPO (First Water Filter Manufacturer)
ATLANTA 2005
DENVER 2006
CHICAGO 2007
BOSTON 2008
PHOENIX 2009
CHICAGO 2010
TORONTO 2011
42


![附 属 書 Ⅰ 附 属 書 Ⅱ 附 属 書 Ⅲ - METI...Oryx dammah シロオリックス [Sahara Oryx; Scimitar-horned Oryx] Oryx leucoryx アラビアオリックス [Arabian Oryx;](https://img.pdfslide.us/doc/110x75/610ed737b544d54b153db177/e-a-e-a-e-a-meti-oryx-dammah-ffff.jpg)