Embed Size (px)
Citation preview
FOR AERONAUTICS
TECHNICAL NOTE 3106
AN EVALUATION OF THE SOAP-BUBBLE METHOD FOR
BURNING VELOCITY MEASUREMENTS USING
ETHYLENE-OXYGEN-NITROGEN AND
MZTHANE-OXYGEN-NITROGEN
MIXTURES
By Dorothy M. Simon and Edgar L. Wong
Lewis Flight Propulsion LaboratoryCleveland, Ohio
Washington
February 1954
. . .... .. .. —-<- - .. .... . ... . . ---------- -.— . . . .
TECHLIBRARYKAFB,NM
IUNIIIMIMIU011bL22L
.
G
NATIONAL ADVISORY COMMITTEE FOR AERONAUTICS
TECHNICAL NOTE 3106
AN EVALUATION OF TEE SOAl?-BUB13LEM121!130DFOR BU31UNG VELOCITY
MEASWEMENTS USING EIEYUNE-OXYGEN-NITROGEIVAND
METHANE-OXYGEN-NITROGENMDTURES
By Dorothy M. Stin and Edgar L. Wong
SUMMARY
A soap-bubble, constant-pressuremethod was used to m&asure laminarburning velocities of some hydrocarbon-nitrogen-oxygenmixtures. Anonaqueous bubble mixture was employed, and schlieren motion-ptcturephotographs of the total flsme sphere and the expanding bubble weretaken with a high-speed nmtion picture csmera. The burning velocitywas calculated by dividing the lhear rate of growth of the flsme spherersdius by the theoretical expansion ratio.
An upper limit of spatial velocity measurement was found for thesoap-bubble method. The limit was evidenced by the fact that the smoothflsme spheres broke up tito roughend surfacesj and the uniform rate oftravel was replaced by u acceleration. For ethylene-oxygen-nitrogenndxlmres, the flame front began to break up soon after ignition forspatial velocities of 25~ to 3500 centimeters per second. This behav-ior is believed to QWin the reported difference between a burningvelocity of methane and oxygen mixbures measured by the soap-bubblemethod and by the burner method. The bubble-method measurement wasnearly 100 percent higher than the Bunsen measurement.
Burning velocities for some ethylene-oxygen-nitrogenand methane-oxygen-mitrogen mixtures richer in o~gen than air are reported. Themethane velocities were lower than those measured by Singer and Heimelusing a burner method and closer to the burner measurements of Jahn.The relative effects of oxygen concentration on the burning velocity ofmethane and ethylene as measured both by the soap-bubblemethod and byburner methods are comparable.
INTRODUCTION
Laminar burning velocity has been considered’a fundament- propertyof couibustiblemixtures, and since it can be simplified as a one-~ensional steady-stateproblem, has been e~hasized by the theorists
. ———.-— .-. ..—. .=— ..— —— ____ _. ._. _ . . ________________
2 I?ACATN 3106P
(ref. 1). In order to compare theory with experiment, however, it hasbeen deWrable to show that burning velocity measurements sre independ- L,ent of the expmimental technique.
At the present time several methods are in use for the measurementof burning velocity: the flat-flame method, the constant-volume-bonibmethod, the constant-pressure-boti method (soap-bubble technique), thetube method, the Bunsen burner methods, and the slot-burner method. Ina recent review of the methods of measurement of burning velocity (ref.2), it was pointed out that the measured lsminar burning velocities forhydrocarbons in air are in better ~eement smong the various methods 3
mthan for hydrocarbons in oxygen. In fact, recently reported burningvelocities for ethylene-airmixtures at stoichiometric concentrationmeasured in various laboratories by different techniques - the soap-bubble technique (refs. 3 and 4), the slot burner (ref. 5), the constant-volume boti (ref. 6), a Bunsen burner method (schlkren) (ref. 7), and amodifiei-tube method (ref. 8) - agree quite well, as shown by the verynsx’rowrange of measured values from 62.3 to 64.0 centimeters per sec-ond. This caqmrison indicates that careful study and elimination of Ithe sources of error in the various methods me leading to the reliable m.measurement of burning velocities for hydrocarbon-air flames.
For faster-burning flames, the variation of measured b- veloc- ,.,
ities reported in the Hterature is much greater; for example, formethane-oxygen flsmesj a burner method (total cone height) gives 330centimeters per second (ref. 9, p. 465), another burner method (frustrum)gives 445 centimetersper second (ref. 9, p. 467), while the soap-bubblemethod measurement was 620 centimetersper second (ref. 10).
~ a ~relbdmry investigation conducted at the IWCA Lewis labora-tory, the anomalously high burning velocities of faster flames measured bythe soap-bubble method when conrpsredwith velocities measured by Bunsenburner methods were found to result from the fact that for faster flemes(spatial velocities above 2500 cm/see), the flame front becomes roughand the flame accelerates (ref. 11). It is obvious that these roughenedflames are no longer comparable with laminar burner flames.
The purpose of the present investigation was to reexamine the useof the soap-bubblemethod for fast-burning flames, to compare burningvelocities measured by this method with those of other methods reportedin the Uterature, and to determine the upper limit of the soap-bubblemethod.
The soap-bubblemethod of measuring burning velocity orfghally de-vised by Stevens (ref. 12), used by Fiock and Roeder (refs. 1.3to 15),W recmtly @roved by Pickering and Linnett (ref. 16) and Strehlow
.,
(ref. 3) is essentially a constant-pressure-bad method. A soap b~bleis blown with a combustiblemixture, the tiure is ignited at the center Iof the sphere by a spark, snd the flame travel is recorded photographi-cally. The linesr rate of travel of the flame divided by the expansion
NACA TN 3106 3
ratio of the hot gases is a measure of the fundamental burning velocityof the flame. (For a discussion of the theory of the method assumingzero flame front thiclmess, see the early work of Stevens in refs. 10and 12. The effect of flsme front thickness on burning velocity may beevaluated by means of the burning-velocity equation described inref. 17).
In the present investigation, an improved soap-bubblemethod (-ref.3), using a nonaqueous film to reduce the effect of moisture and an inertatmosphere to prevent the effect of afterburni,ng,was employed. Schli.e-ren motion-picture photographs of the total.flame ad bubble spheres wereused instead of the V-trace of the expanding flame used by previous in-vestigators. Bu.rnnn velocities for some methane-oxygen-nitrogen andethylene-oxygen-nitrogenmixtures at atmospheric pressure and room tem-perature
The
—are reported.
APPARATUS AND PROCEDURE
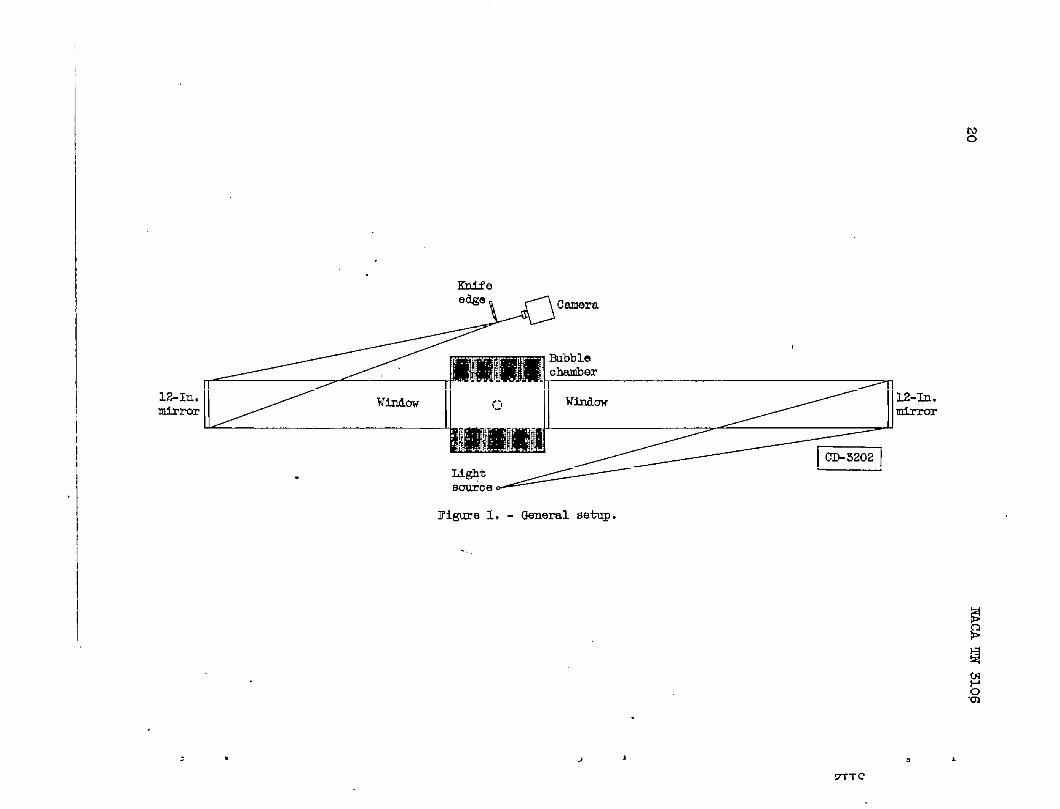
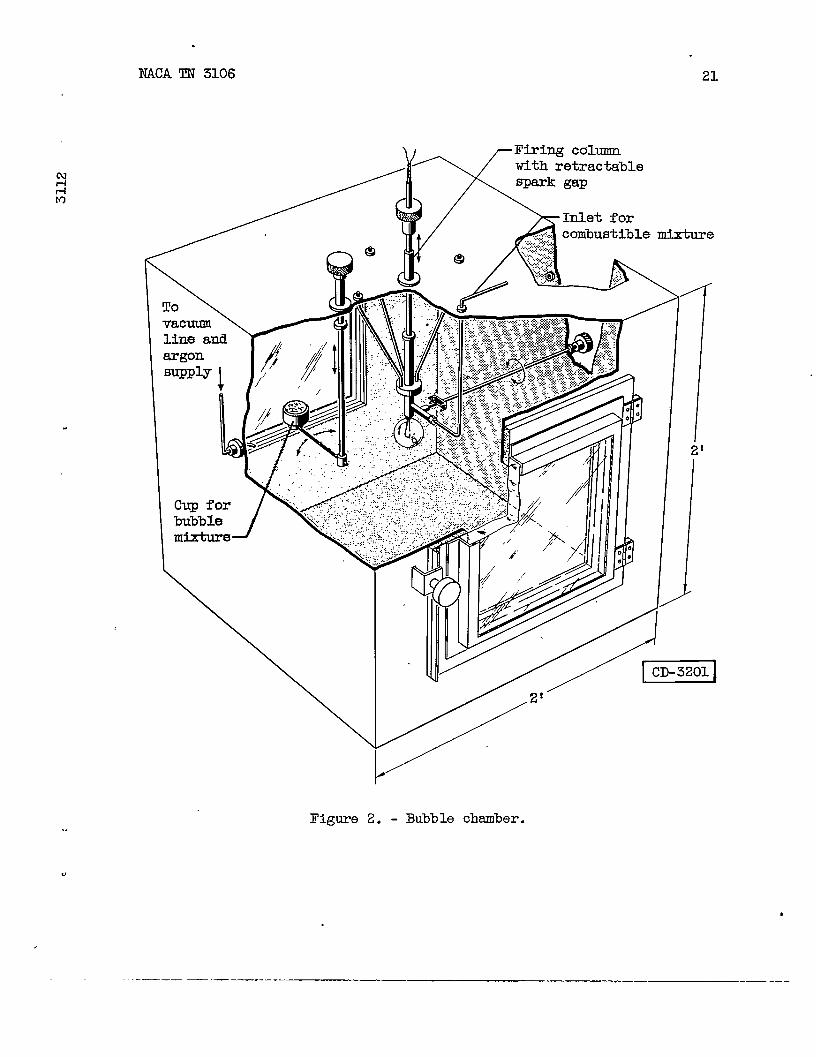
general arrangement of the setup, similar to that used in ref-erence 4, is shown in figure 1. The bubble chaniberis shown in detail,including the firing qolumn and the soap cup, in figure 2. An inert
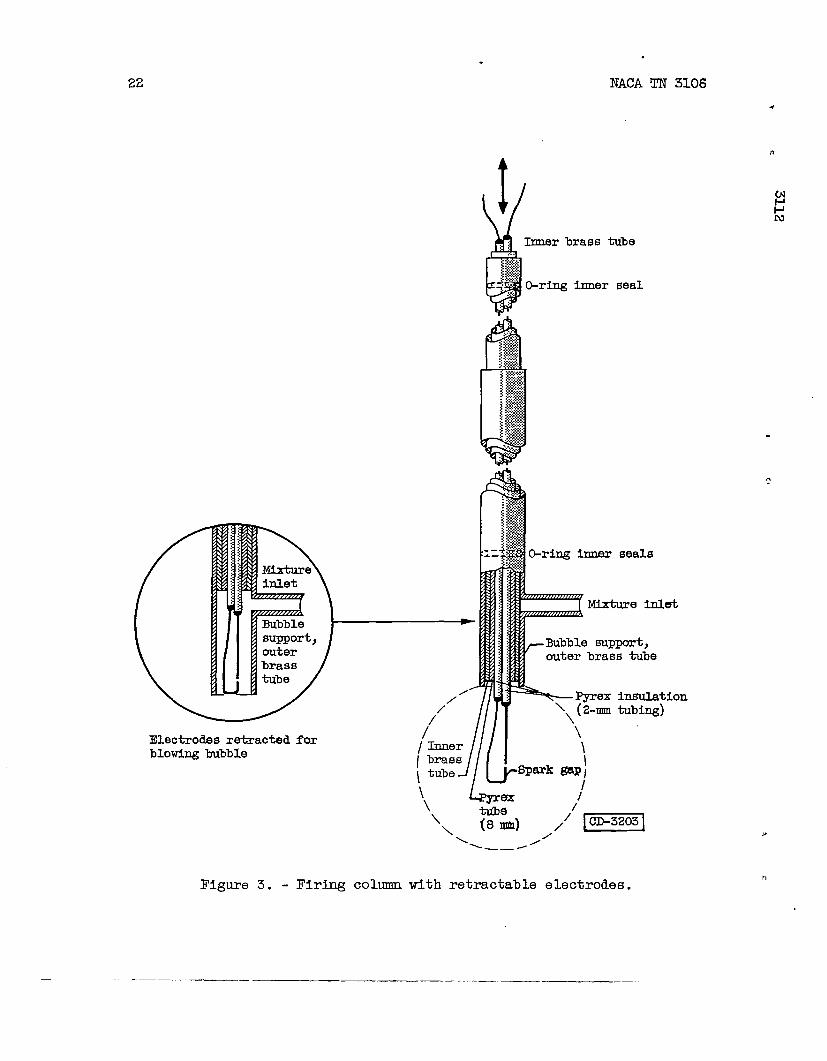
‘. chamber atmosphere (argon) was used in some of the runs to prevent after-burning. Details of the firing column and the retractable spark gap areshown in figure 3.
In this method a combustible mixture is introduced through themixture inlet tube (figs. 2 and 3) with the spark gap retracted intothe firing column. The space from the side arm to the tip of the brasstube supporting the bubble is swept out with mixture just before thelip of the outer brass tube is immersed in the soap solution containedin the cup. The bubble is blown to a predetermined diameter (6 cm wasused for most measurements, 10 cm for visual observation of flame chsr-acter); then the spark gap is lowered into the center of the bubble.The mixture is ignited by a spark, and schlieren photographs of theflame and the expanding bubble are recorded.
Ignition system. - The mixtures were ignited by a capacitance sparkfired by discharging a O.O1-microfarad condtiser charged to 5500 volts.The electrodes were enamel coated copper wires - 0.52 millimeter in -diameter (U.S. No. 24 gage wire).
The firing of the spark was synchronizedwith the operation of themotion-picture camera in such a manner that ignition would occur near the
. peak camera speed. In order to ensure that the spark energy used in fhisinvestigation had no effect on the spatial.velocity, the spark energy wasreduced by a factor of 100 by using a O.CQO1-microfarad condenser. For
t! an ethylene-o~gen-nitrogen mixture (102 percent stoichiometric,a .02/(02 + N2) = O.400), the spatial velocities measured using the reduced
spark energy agreed favorably with values obtained at the high= sparkenergy.
.—- -..—. .——. —. —— ... — .—.— ——- —— . —– ..-
4 lWCA TN 3106
.
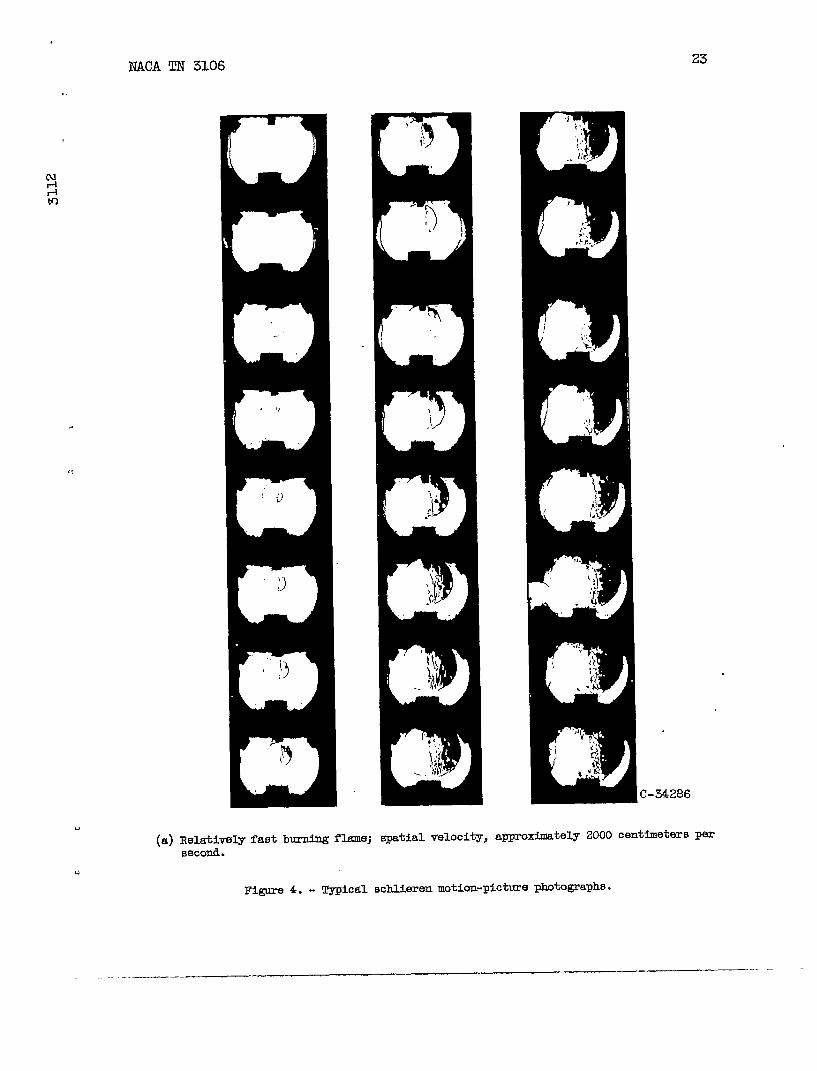
Schlieren system and photographic record. - Schlieren photographsof the process were taken using the Z-type, two-mirror schlieren systemshown in figure 1. The LQht source was sn air-cooled BH-6 mercury lamp “connected to a d-c power supply. The mirrors were 1.2inches in diameter.The knife edge was in a horizontal position for all the bwning velocitymeasurements, but was in a vertical position for some of the photographsused for observation of the flame surface. Magnification was determinedfrom an image of a known distance on the film. The camera was a 16milJ3.meterFastax camera with a booster giving a maximum camera speedof 7000 frames per second. The timing light was operated at 800 flashesp= second. Eastman Super XX or Linagraph Ortho film was used.
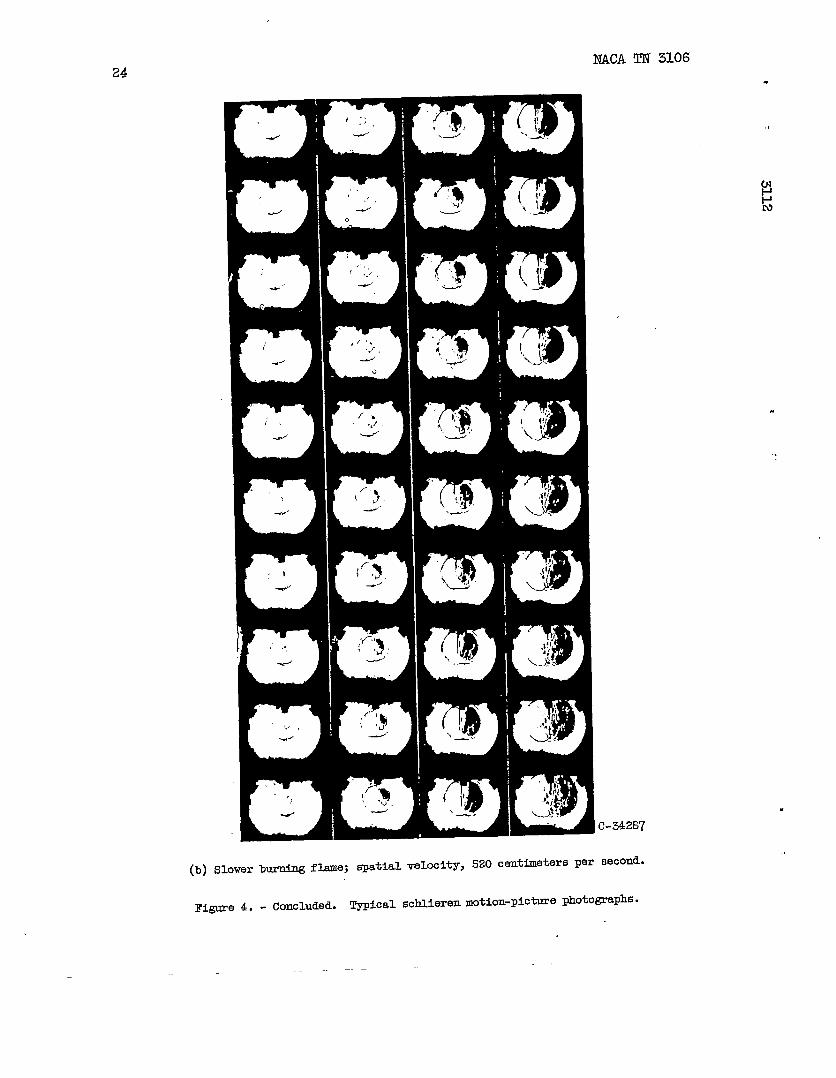
Two typical schlierenphotographic records are shown in figure 4(a)for a relatively fast burning ndxkure (spatial velocity St = 2000 cm/see; 102 percent stoichiometricethylene-oxygen-nitrogen;a = O.400) andin figure 4(b) for a slower burning mixture (St = 520 cm/see; newstoichiopetricethylene-air).
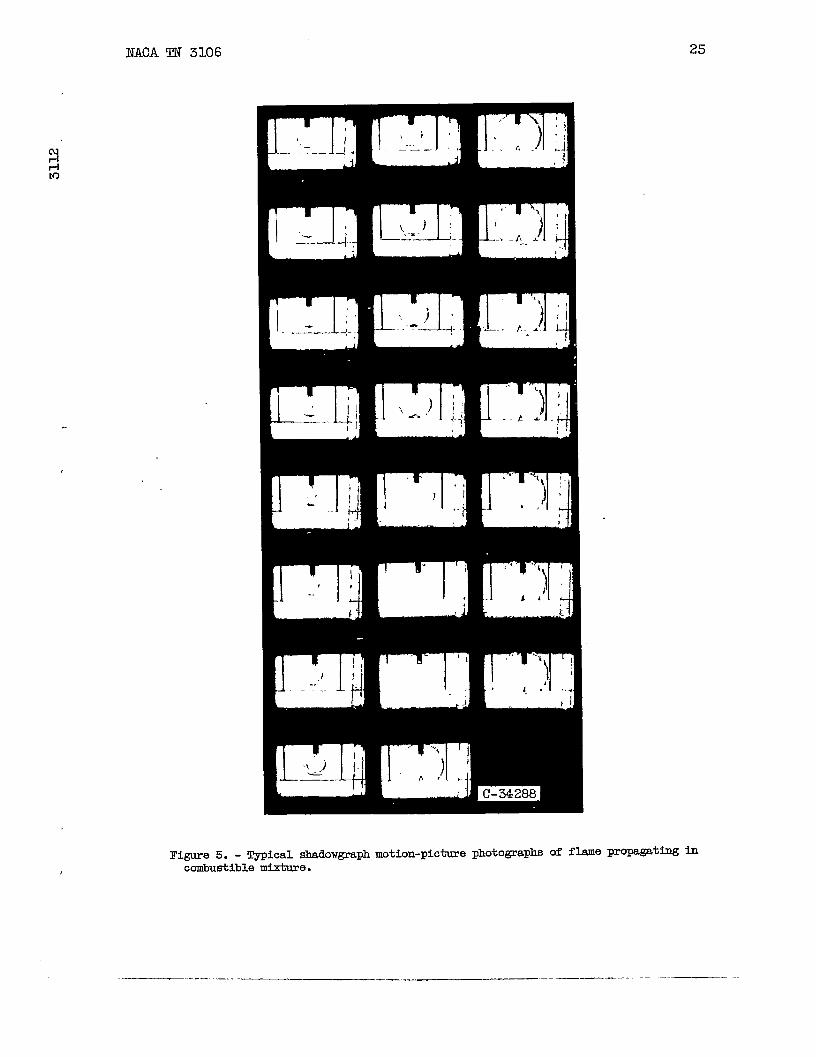
Some shadowgaph records were taken by removal of the knife edge.Figure 5 shows a typical run (St = 2000 en/see; 103 percent stoichio-metric ethylene-oxygen-nitrogen;a = O.400).
“
Bubble mixtures. - A nonaqueous bubble mixture developed im refer- .ence 18 was used. The mixture was 8 to 10 percent Alrosol cs (a syn-thetic nonaqueous detergent) in glycerine (c.p. grade). For some of thephotographs planned for visual study, an aqueous mixlmre (ref. 14) con-sisting of 1 part triethanolandne oleate, 32 parts distilled water, and8 parts glycerine was used as the bubble mixture. This ndxlmre givesclearer photographs and is more stable for l=ge b~bles.
Combustible mixtures. - Ethylene and methane were tanked gases. Themanufacturer’s yurity for ethylene was 99.5 percent and for methane,99.0 percent. Tsdsed mixtures of o~gen smd nitrogen, used to obtainoxygen concentrationshigher thsm in air, were labeled by the supplierto be accurate to @.1 mole percent. Air from the room was passed througha drying tube containing anhydrous calcium sulfate. Coribustiblendxtureswere made up by a psz’tial-pressuremethod and were forced into the bubbleby mercury displacement.
Analysis of Photographic Records
Burning velocity, as measured by the soap-bubblemethod, may becalculated from the fo130wing equation (refs. 3, 4, and 12):
(1) “
—.— — —.
lhlCATN 3106
where
v~ burning velocity
St spatial velocity
E expansion ratio,
5
ratio of volumes of burned gas to utiurned gas
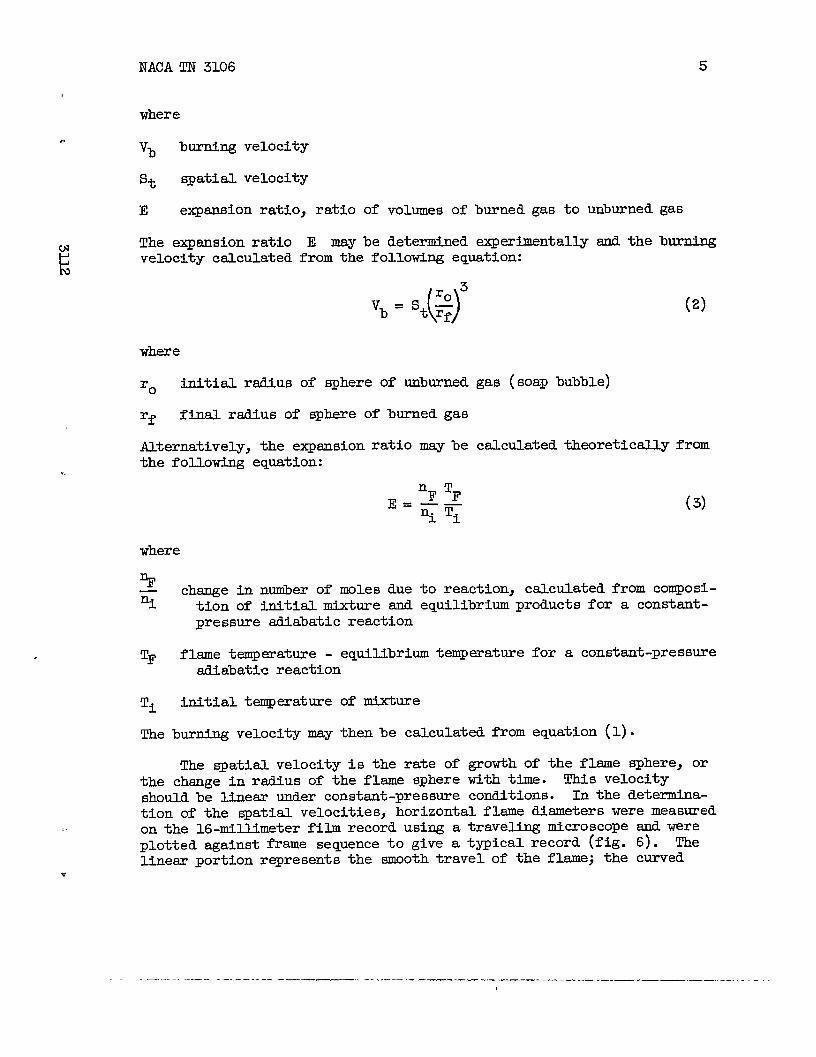
The expansion ratio E may be determined experimentally and the burningvelocity calculated from the following equation:
()3
ro‘b = ‘t q
where
‘o initial radius of sphere of @urned gas (soap bubble)
rf final.radius of sphere of burned gas
Alternatively, the expsnsionthe following equation:
ratio may be calculated theoretically
‘F ‘F.—‘=%Ti
(2)
from
(3)
where
%? change in number of moles due to reaction, calculated from composi-% tion of initial mixlmre and equilibrium products for a constant-
pressure adiabatic reaction
~ flame temperature - equilibrium temperature for a constant-pressureadiabatic reaction
Ti initial temperature of mixture
The burning velocity may then be calculated from equation (1).
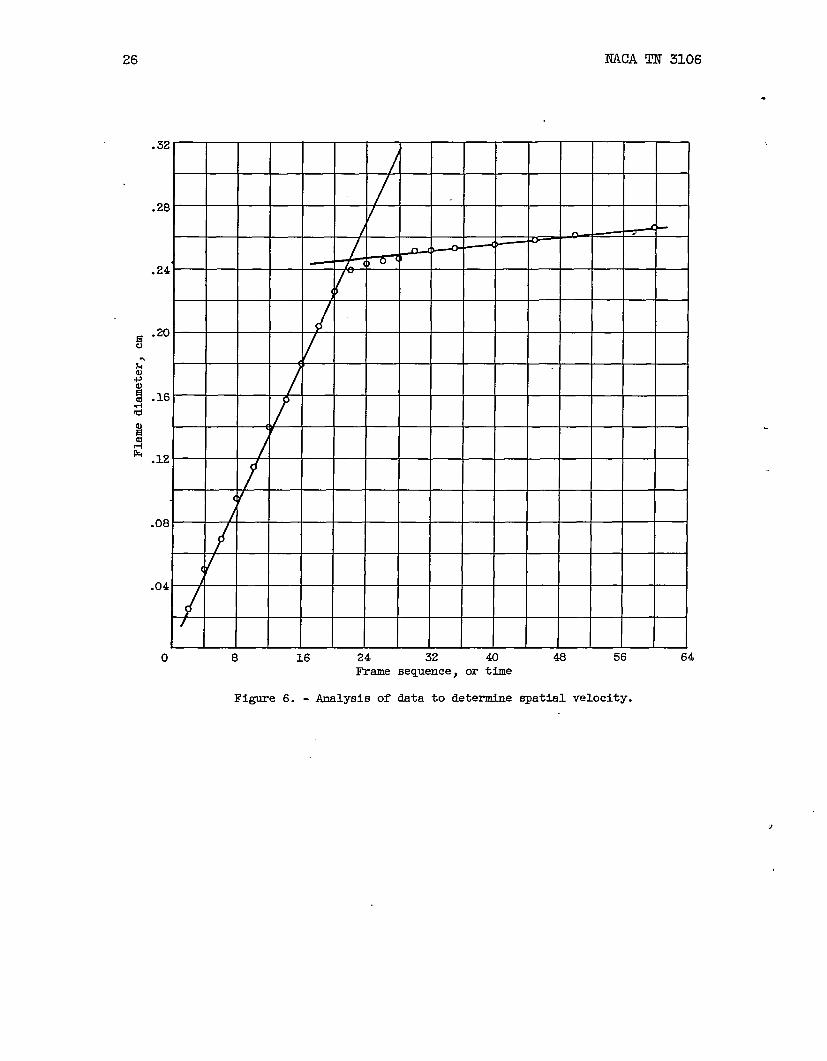
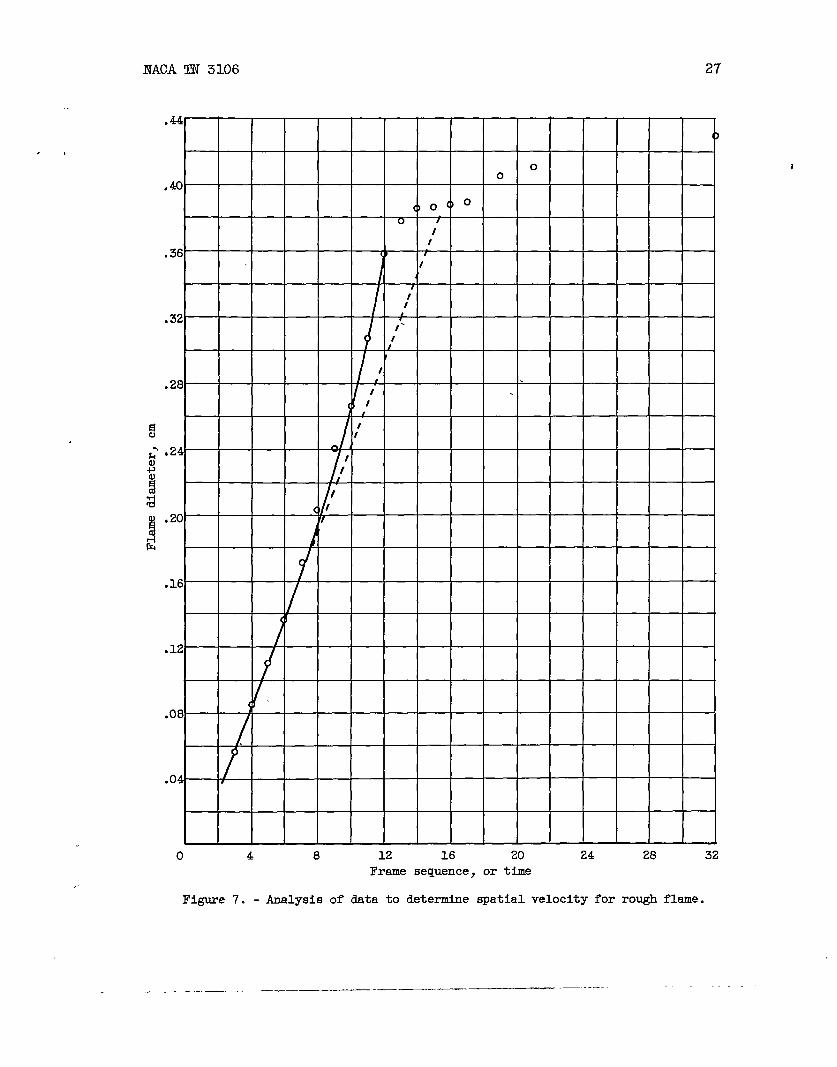
The spatial velocity is the rate of grtih of the flame sphere, orthe change id radius of the flame sphere with time. This velocityshould be l.inesrunder constant-pressure conditions. In the determina-tion of the spatial.velocities, horizontal flame diameters were measuredon the 16-mill.imeterfilm record using a traveling microscope and wereplotted against frame sequence to give a typical record (fig. 6). Thelinear portion represents the smooth travel of the flame; the curved
.— ---- ..—. .—.—- .. . . . . . . .._ . . ,,-. —.. —____ ._. _—______ .

6 NACA TN 3106, .
portion results when the flsme front nesrs the end of the combustiblembdmre and begins to slow down. The spatial velocity was determinedfrom the slope of the rapidly rising hear portion illustrated in fig-
.
ure 6, the magnification factor, and the cameraframes per second:
St = l~zmc
where
speed in number of
(4)
St spatial velocity, or change in flame sphere radius with time, cm/sec
P .slope of curve of flsme diameter as measured on 16-milkhneter filmplotted against film frame sequence (fig. 6), cm/frame
M magnification faCtOrj known distsnceon film
c csmera speed or number of frsmes pertiming device, frames/see
divided by distsnce measured
second determined by use of
The initial radius ofble radius, was determinedin the ftist few frames of
the sphere of udmrned tiure, initial bub-by me&urement of the bubble &meter shownthe photographic record (fig. 4).
RESULTS AND DISCUSSION
Evaluation of Soap-Bubble Method of Measurement
The major limitations of the soap-bubble method of measurement ofburning velocity, which have been previously pointed out in references 3and 9 (~. 471-474), are:
(1) Bubble materials contaminate the combustible&me.
(2) Scuuegases.may react with the bubble material..
(3) Diffusion of gases through the soap bubble may change thecowo sition of the mixture.
(4) Nonisotrcg?icwave propagation results in nonspherical flamepropagation for some mixtures.
— —.
NACA TN 3106 7
CN
E
...
,
.
(5) Convective rise of hot ccmtmstion gases complicates themeasurement of slow burning velocities.
(6) Flsme front has a finite thicbess.
(7) Afterburning causes difficul.tiesi.nfiti-r~us measwaents.
(8) High-frequency oscillations for fast flsmes have been observedby Stevens (ref. 19) and Strehlow and Stuart (ref. 3).
(9) Rough flames appear in some mixtures.
The first five limitations were minimized by the choice of thebubble material and the combustible mixbyes. Glycerine soap solutionreduces the contaminationby water vapor.
Representative combustible mixtures were tested for the effect ofdiffusion through the bubble by measurement of the spatial velocity ofmixtures fired at different delay times (time required to blow btibleand ignite mix%ure) from 10 to 45 seconds. After 25 seconds, the meas-ured spatial velocities for the mixtures were within the experimentalerror of the measurement. Longer time intervals gave greater devia-tions. Comparison of water and glycerine soap solutions showed that thediffusion effect for hydrocarbon-air mixtures is less for glycerinebubbles. A glycerine soap solution was used for all velocity measure-ments, and the bl.ibbleswere fired within a time delay of 15 seconds.
According to the work of reference 20, rich mixtures of methane-air snd both lean and rich mixtures of ethylene in air propagate iso-tropically in the sphericalbomb. In all cases isotropic propagationoccurred when the fuel and air were of equal molecular weights or whenthe deficient component of the mixture - either fuel or ~ - WELS the
COIIIpOIEIIt of higher molecular weight. These conditions w~e observedin the present work and no photographs showing nonisotropic propagationwere used for measurement.
Only burning velocities faster than 60 centimeters per second weremeaswed, and the convective effect tid not appesr to be important forthese velocities.
The effect of neglecting the finite thiclmess of the flame fronton the calculation of burning velocity may be evaluated by means of therelations developed in reference 17. It was concluded that for thesizes of flame spheres studied in the present investigation, the assump-tion of negligible flame thickness was justified.
—.—— _ —— -—. .— ——
8 NACA TN 3106
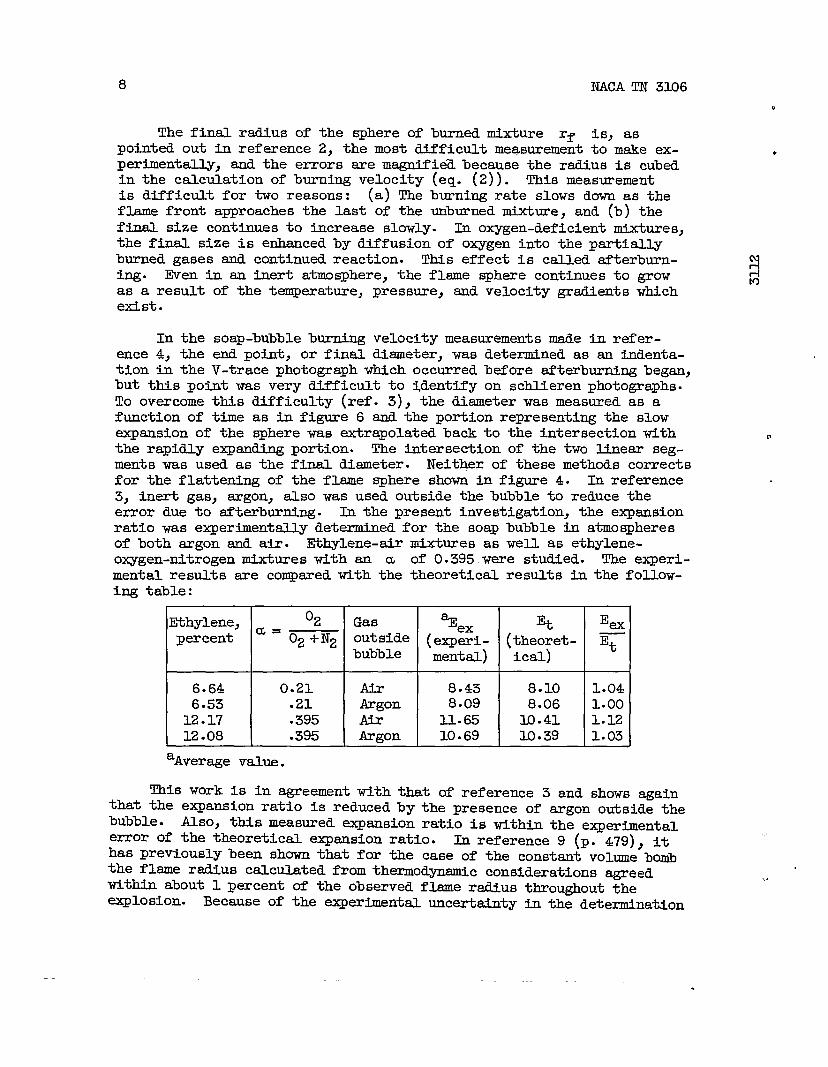
The final radius of the sphere of burned mixture rf is, aspointed out in ref~ence 2, the most d3fficult measurement to make ex-perimentally, and the errors are magnifi~ because the rsdius is cubedin the calculation of burning velocity (eq. (2)). This measurementis difficult for two reasons: (a) The burning rate slows down as theflame front approaches the last of the unburned mixture, and (b) thefinal size continues to increase slowly. ~ oxygen-deficientmixtures,the final size is enhanced by diffusion of oxygen into the partiallyburned gases and continued reaction. This effect is called atterburn-ing. Even in an inert atmosphere, the flame Sph=e continues to growas a result of the temperature, pressure, and velocity gradients whichexist.
In the soap-bubble burning velocity measurements made in refer-ence 4, the end point, or final diameter, was determined as an indenta-tion in the V-trace photograph which occurred before aft=burning began,but this point was very tMfficult to ~dentify on schlieren photographs.To overcome this clifficulty (ref. 3), the diameter was measured as afunction of time as in figure 6 and the portion representing the slowexpansion of the sphere was extrapolatedback to the intersection withthe rapidly expanding portion. The intersection of the two Wear seg-ments was used as the final diameter. Neit&r of these methds correctsfor the flattening of the flame sphere shown in figure 4. In reference3, inert gas, argon, also was used outside the bubble to reduce theerror due to afterburning. Ia the present investigation, the expansionratio was expertientally determined for the soap bubble in atmospheresof both argon and air. Ethylene-air mixtures as well as ethylene-oxygen-nitrogen mixtures with an a of 0.395.were studied. The experi-mental results sre compared with the theoretical results h the followi-ng table:
Ethylene, o~ Gas % Et %xpercent a = 02 +N2 outside (e~e$i- (theoret- F
bubble mental) ical)
6.64 0.21 8.43 8.10 1.046.53 .21 Argon 8.o9 8.06 1.0012.17 ● 395 U-65 1o.41 1.1212.08 .395 Argon 10.69 10.39 1.03
aAverage value.
This work is in agreement with that of reference 3 and shows againthat the expansion ratio is reduced by the presence of argon outside thebubble. Also, this measured expansion ratio is within the expertientalerror of the theoretical expansion ratio. ~ reference 9 (p. 479), ithas previously been shown that for the case of the constant volume bonhthe flame radius calculated from thermodynamic considerations agreedwithin about 1 percent of the observed flame radius throughout theexplosion. Because of the experimental uncertainty in the determination
!3m
,.,
$. ,
NACA TN 3106 9
of the expansion ratio and because expansion ratios measured under themost favorable conditions (afterburningreduced by use of argon outsidethe soap bubble) were within the experimental error of the theoreticalvalue, the theoretic&1 expansion ratio was used to calctiate the burningvelocity.
It was observed that fast-burning flames were disturbed by high-frequency oscillations when a bubble chsmber 12 by 12 by 12 inches wasuses. These oscillations were eliminate by using a larger chamber,24 by 24 by 24 inches.
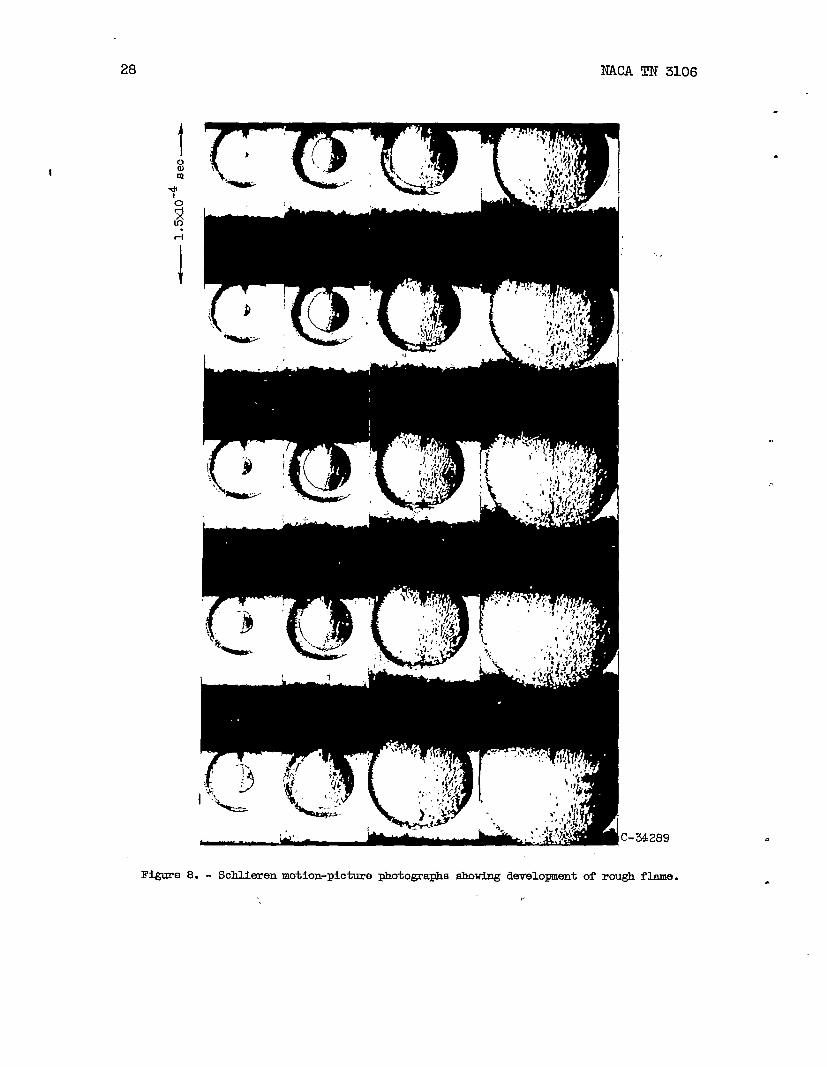
The final limitation cited, the occurrence of rough flames, wasfound to be very hportant. The first eviaence of the effect appearedin the curves of flame diameter plottea sgainst flame sequence for thefaster flames. Figure 7 shows one record in which the flame appears toaccelerate during the course of propagation. Examhation of the flsmephotographs for this conibustiblemixture in 6-centimeter glycerine bti-bles showed some evidence that the flame frent was breaking up into aWr=ed surface. Clearer photographs were taken by using a water soap
. bubble initially 10 centimeters in diameter. The photographs in figure8 show a flame chan@ng from a smooth to a rough flame front. ~ thiscase, cone-like protuberances 3 to 4 millimeters in lengbh appesr on the
. flsme surface after the diameter of the flame sphere is about half itsfinal dlsmeter. The first roughening of the surface occurs before thebubble breaks. It was estimated that for one flame the surface area ofthe rough flsme sphere is approximately 1.5 to 2 times that of a smoothsurface. This surface area was based on estimates of the average height,the average base diameter, ana the total nunhr of these cone-lik~ pro-tuberances on the flame surface. The final spatial velocity for this ‘flame was about 1.5 times the initial spatial velocity of the smoothflame frent.
It is probably the formation of the rough flame front which accountsfor the previously observes difference in burning velocity of methane-oxygen flames measured by the soap-btiblemethod as compared with theBunsen burner methcds (ref. l.1). This roughening would not have beenapparent to investigators using the V-trace technique.
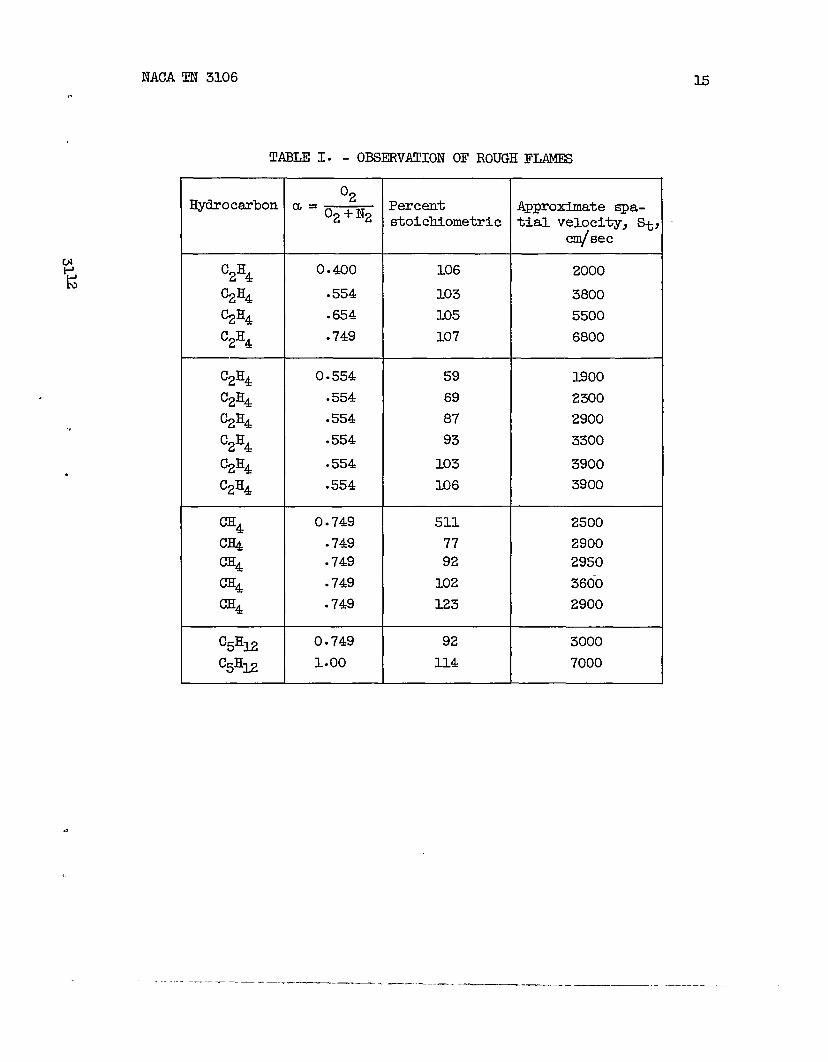
Some of the conditions undew which rough flsme spheres were ob.served are listed in table 1. Both lean and rich mixtures of ethylene,methane, and pentane with ado spheres of vsrious values of a gaverough flame surfaces. QuaMtatively, the flame front appeared to becomerough esrlier in the run for the faster flames. Two sets of data forethylene flames are recorded in table 1. In one set, both the concen-tration of oxygen in the atmosphere and the ethylene concentrationare.Changea to maintti the ssme stoichiometry;in the other, the oxygenconcentration is held constant and the ethylene concentrationis varied.
b With both kinds of changes, the burning velocity varies. The high
10 NACA TN 3106.
velocity limit for smooth flames appears to be new 2500 centimeterspersecond for both types of experiments. These experiments were carried 9out in a bubble 10 centimeters in diameter.
For flames in the spatial velocity range 2500 to 3500 centimetersper second, rough flsme surfaces appeared near the end of the run. Byusing only the first Mnear portion of the curve of diameter againstfrsme sequence to establish the spatial velocity, it is possible tomeasure the burning velocity for these faster flames. The reproduc-ibility of the measurement is, however, less (approd&d.y * Percent).For spatial velocities above 3500 centimeters per second, no satisfactorymeasurements could be made.
The rough flame surface was not improved by using argon outside thesoap bubble, by removal of the bubble chamber, or by reducing the igni-tion energy. The instability of the flame front may arise from theinteraction of flame generated pressure waves reflected from the bubble-gas interface and the advancing flsme front. George H. Markstein of theCornell Aeronautical Laboratory and J. O. Hirscbfelder of the Universityof Wisconsin have suggested that the roughenedflame front may be a type 3of Taylor inst~ility; such instabilities have been observed in liquidsurfaces accelerated in a direction normal to their planes (ref. 21).The appearance of this rough flame surface limits the range of burning r
velocities which may be measured by the soap-bubble method.
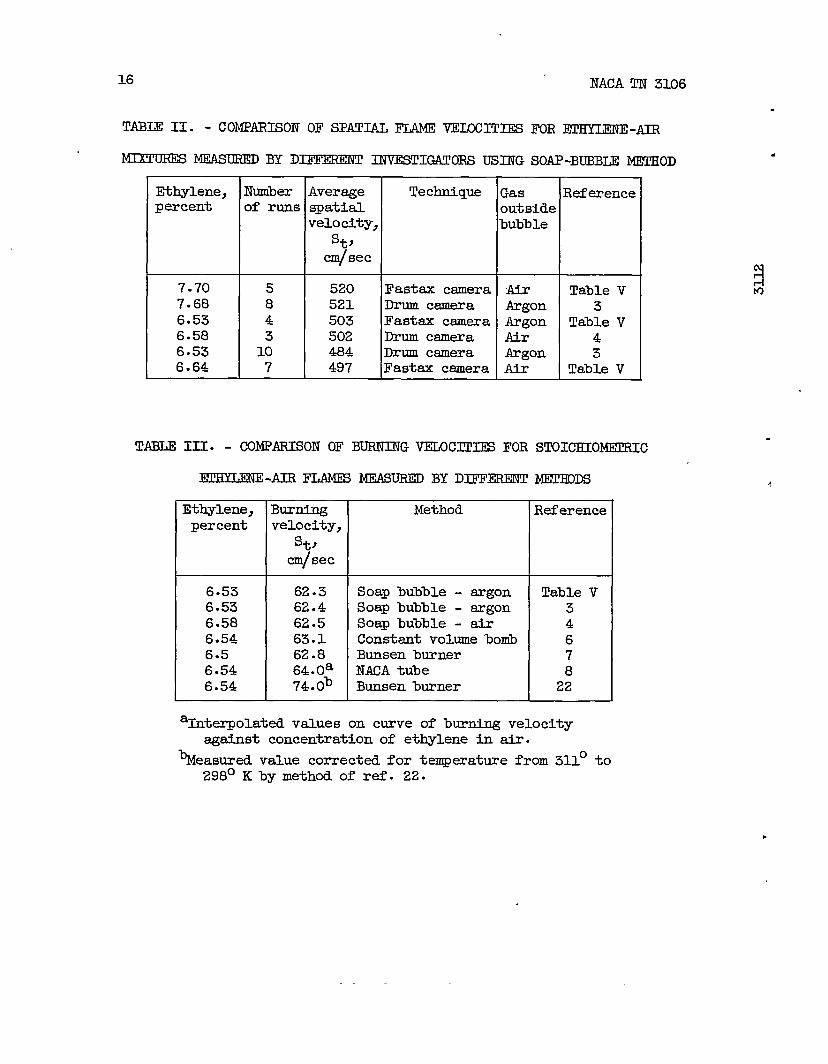
Consistent values of spatial velocity and burning velocity may beobtained by means of the present soap-bubbletechnique when the precau-tions discussed are observed. For exsmple, some spatial velocities forethylene and air measured by this method are compared with those reportedin the literature in table II. One mixture is fuel rich and the other isa near stoichiometricmixture. The reproducibility of the spatial veloc-ities measured by this method is about +3 percent. The reported measme-ments of spatial velocity agree quite well.
Burning velocities for stoichimetric mixtures of ethylene and airsre compared in table III. The ~eement smong burning velocities meas-ured by the soap-bubblemethml as used at various laboratories is verygood. Burning velocities measured by all the methods except the burnermethal of reference 22 give comparable values. The latter measurementwas made at 311° K and was reduced by an empirical equation to 298° K(ref. 22); thertiore the comparison is not directly between two measuredvalues. It is included in tdble III because b- velocitiesmeasuredby this method for ethylene-oxygen-nitrogenmixtures sre later compsredwith burning velocities obtdned by the soap-bubblemethod.
—
NACA
“
TN 3106
Burning Velocities of
Burning velocities for
U.
Hyhocsrbon-Oxygen-I?itrogenMixtures
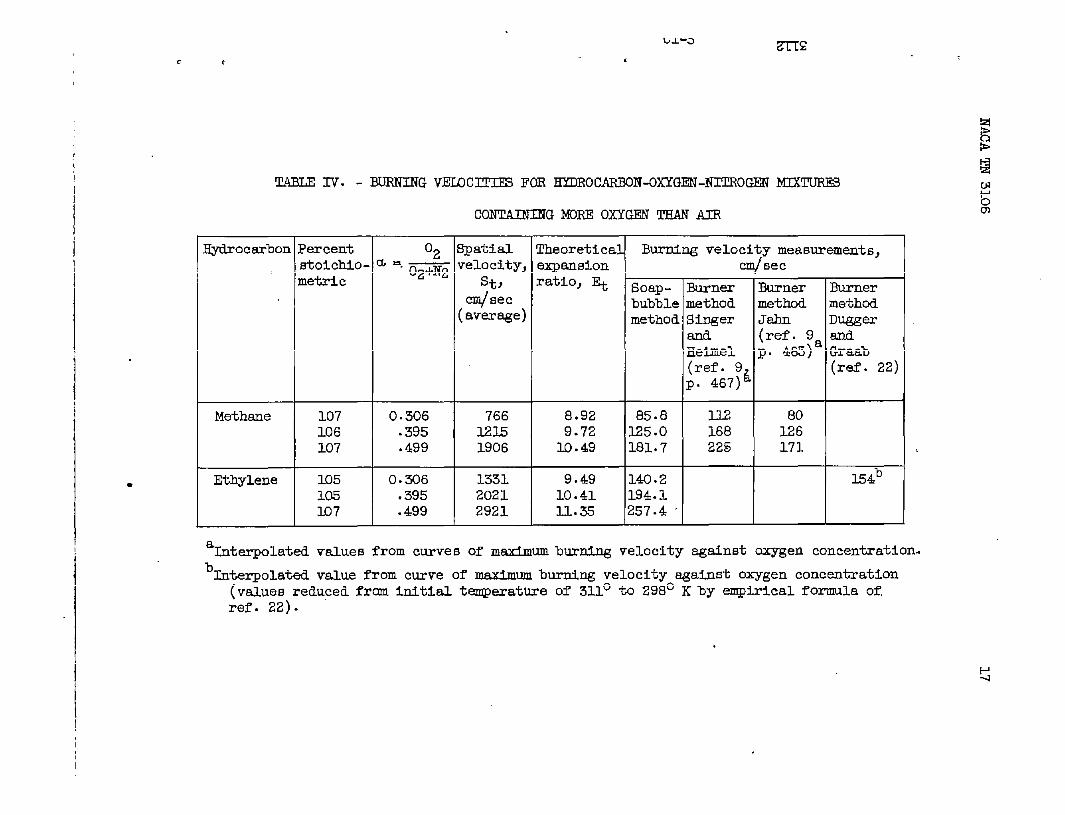
ethylene-oxygen-nitrogenand methane-oxygen-nitrogen m&tures, richer in oxygen than air, and values previously re-port~ in the lil%rature for the-same mixtures are 13.stedin table IV.The burning velocities measured by the soap-bubblemethod are averagevalues - the separate determinations are listed in table V. Hydroc=bonconcentrationswere chosen to be near the maximum burning velocity as
d measured by burner methods. In table IV these measured burning veloci-A ties are compsred tith values from the literature for the same mixtures.J0 The burning velocities for methsne-oxygen-nitrogenflames are lower than
the velocities measured in reference 9 (p. 467) using a cone-frustrummethod to calculate area of Bunsen flames. The velocities of the soap-bubble method are nesrer the measurements of reference 9 (p. 465), alsoa Bunsen burner method but with cone sreas calculated from the measuredcone height.
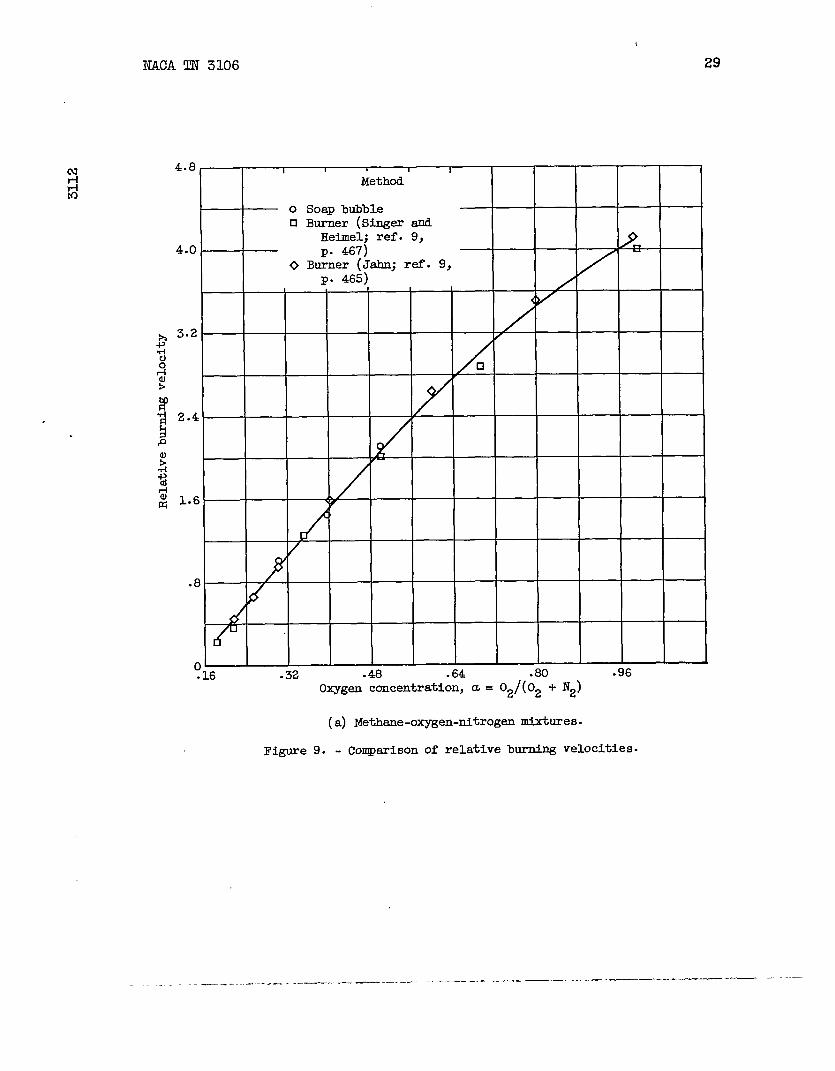
i The relative burdng velocities for the three sets of measurements
i are compared in figure 9(a). Burning velocities at a = 02/(02 + N2) =
0.306 and the methane concentrationfor maximum burning velocity weref-+ taken as the standard values for the @’o sets of data in the literature.> Ratios of the burning velocities at other values of a to the ~txd
values were then computed. For the soap-bubbleburning velocities, thestandard burning velocity was chosen as that at the same a, 0.306, andat the only concentration of methane studied, 107 percent of stoichio-metric. Values of these ratios are plotted against a in fifgme 9;inasmuch as the points calculated from aXl three sets of data Me on acommn curve, the relative effects of a on burning velociw measuredby the three methods agree-well.
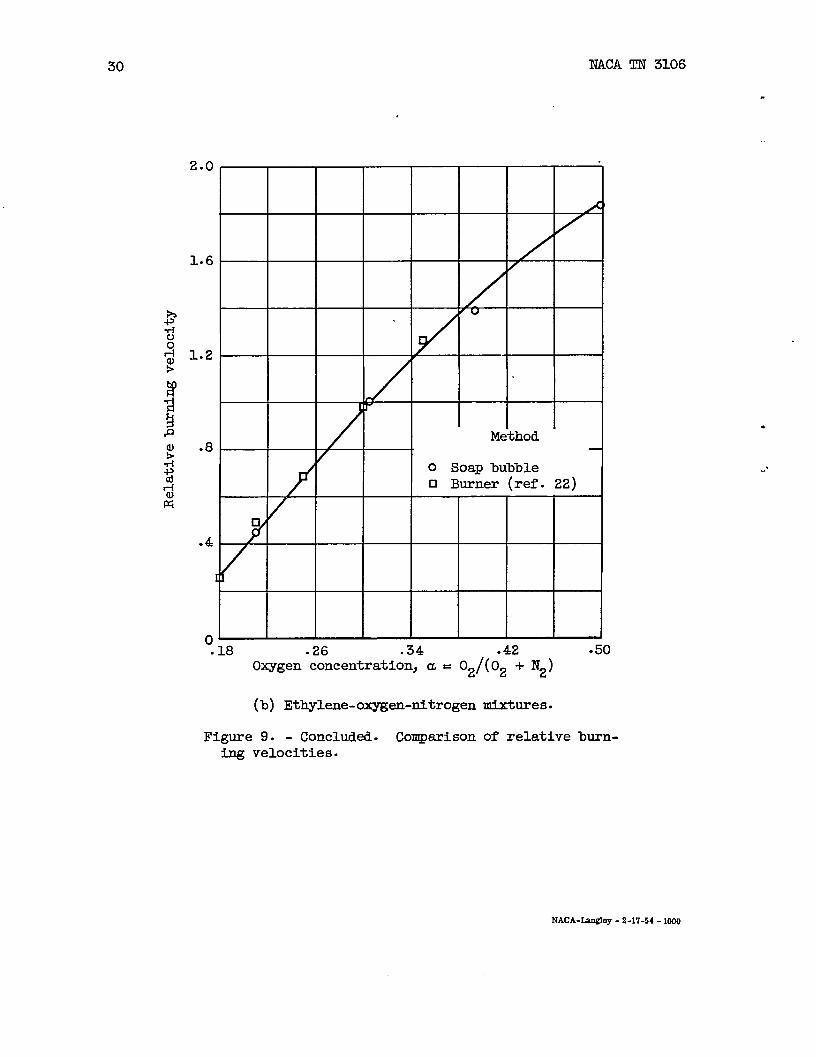
The one ethylene-oxygen-nitrogenb~~ velocity measured by thesoap-bubblemethod which can be compared directly is lower by 10 percentthan the Bunsen burner value measured in reference 22. A schkkrenimage, total-area method, was used for the burner measurement. Ratios ofburning velocity to standard burning velocity, calculated as describedpreviously, are plotted against a in figure 9(b). me relative effectsof a on burnnn velocity measured by the two methods are comparable.
lh reference 22, the ma&mum measured burning velocities for theregion of oxygen concentration “a from 0.18 to 0.35 are compared withthe relative effects of a on burning velocities predicted by the Semenov’and.by the T.anfordand Pease equations for burning velocity. The &ee-ment was quite good. Since the relative burmlng velocities agree forthe two experimental methods, the relative values predicted by the equa-tions would be equally good for soap-bubbleburning velocities in the..ssme’range.
.
I-2 I?ACATN 3106
SUMMARY OF RFSULTS
The resuits of this study of the soap-bubblemethml of lsminaburning velocity measurement for methane-oxygen-nitrogenand ethylene-oxygen-nitrogenmixtures may be iwmmarized as follows:
1. Measurements of burning velocity for stoichiometricethylene-airmixtures made by the soap-bubblemethod using a nonaqueous bubble mix-ture, schlierenmotion-picture photography, and the theoretical expansionratio me in good agreement with measurements by other investigatorsusing the soap-bubblemethcd, the slot-burnermethod, Bunsen burnermethods, tie constant-volume-botimethod, and a tube method.
2. The lack of s+yeement between burner-method and soap-bubble-method measurements of the burning velocity of methsne-oxygen flames asreported.in the literature is attributed to the high velocity limit ofthe soap-bubblemethod, which was evidenced in the present work byroughened flame fronts snd accelerating flames.
3. The high velocity I.imitfor the usefulness of the soap-bubblemethod was found for ethylene-oxygen-nitrogenmixtures to be in thespatial velocity range of 2500 to 3500 centimetersper second.
4. Burnbg velocities measured by the soap-bubblemethd for somemethane-oxygen-nitrogensnd ethylene-oxygen-nitrogenmixtmes richer thanair in oxygen me reported sad compared with burning velocities measuredby the burner method.
5. The df ect of oxygen enrichment on the relative burning velocityas measured by the soap-bubblemethc-dfor methane-oxygen-nitrogenandethylene-oxygen-nitrogenmixtures is comparablewith the effects meas-ured by Bunsen burner methods.
6. When srgon was used outside the bubble, the experimental ~an-sion ratio was found to be closer to the theoretics. expansion ratio.
Lewis Flight Propulsion LaboratoryNational Advisory Commitiee for Aeronatiics
Cleveland, Ohio, Noveuiber24, 1953
REFERENm
1. Evans, Marjorie W.: Current Theoretical Concepts of Steady-StateFlsme Propagation. Chem. Rev=j VO1= 51) no ● 3> 1952 j PP. 363-429●
.
NACATN 3106 I-3
2. Linnett, J. W.: Methods of Measuring Burning Velocities. FourthSymposium (Intonational) on Conibustion,The Williams &Wilkins Co.,1953, pp. 20-35.
3. Strehlow, R. A., and Stuart, Joseph G.: An Euproved Soap BubbleMethod of Measuring Flame Velocities. Rep. No. 835, BallisticRes.Labs., Aberdeen Proving Ground (Maryland), Oct. 1952. (Proj. No.TB3-OllOV of Res. andDev. Div., Oral.Corps.)
4. Linnett, J. W., Pickering, H. S., snd.wheatley, P. J.: Burning Veloc-ity Determinations. Part IV - The Soap Bulble Method of Determ~nBurning Velocities. ~ms. Fmadw SOC., VO1. 47, 3951, pp.974-980.
5. Sin&r, J. M.: Burning-VelocityMeasurements on Slot Burners; Com-parison with Cylindrical Burner Determinations. Fourth Symposium(International)on Combustion, The Williams & Wilkins Co., 1.953,pp. 352-358.
6. Mantonj John, von Elbe, Guenther, and Lewis, Berns@: Burning-Velocity Measurements in a Spherical Vessel with Central Ignition.Fourth Symposium (International)on Combustion, The Willisms &Wihs Co., 1953, pp. 358-363.
7. Conan, H. R., snd Linnett, J. W.: Burning Velocity Determinations.Paz-tv - The Use of Sch13eren Photo~aphy in Detemdning BurningVelocities by the Burner Method. Trans. Fmadw Sot., vol. 47,1951, pp. 981-988.
8. Gerstein, Melvin, Levine, Oscar, smd Wong, Edgar L.: Flsme Propaga-tion. II - The Determination of Fun.dsmentslBurning Velocities ofHydrocarbons by a Revised Tube Method. Jour. Am. Cliem.~OC. , VO1.
73, no. 1, Jan. X351, pp. 418-422.
9. Lewis, B., and von Elbe, G.: Conibustion,Flames and Explosions ofGases. Academic Press, Inc. (New York), 1951.
10. Stevens, F. W.: The Gaseous Reactidn - A Study of the Kinetics ofComposite Fuels. NACA Rep. 305, 1929.
1.1.Simon, Dorothy M., and Wong, Edgar L.: Burning Velocity Measurement.Jour. Chem. Phys. , VO1= 21, no. 5, May 1953, ~. 936-937.
12. Stevens, F. W.: A Const=t Pressure Bomb. NACA Rep. 176, 1923.
1.3.Fiock, Ernest F., and King, H. Kendall: The Effect of Water Vaporon Flame Velocity in Equivalent CO-02 Mixtures. NACA Rep. 531,1935.
-—.—_ ._ ._ ..__ _____ ___ —. ..- .. .. ______ —— -..-——— ____ . ___
14 NACA TN
14. Fiock, Ernest F., and Roeder, Csrl H.: The Soap-Bubble MethodStudying the Conibustionof MLxtures of CO and 02. NACA Rep.1935.
15. Fiockj ErnestHelium upon553, 1936.
16. Pickeriu, H.
—
F., and Roeder, Carl H.: Some lNfects ofE@osions of Carbon Monoxide and Oxygen.
s“> and Linnett, J. W. : Burning Velocityti.ons.--Pat Ii - The Use of Schlieren Photography ~Burning Velocities by the Soap Bubble Method. Trsms.vol. 47, 1951, pp. 989-992.
17. Mkkelsen, WilXsm R.: The Propagation of a Free Flsme
3106
of532,
Argon andNACA Rep.
Determina-DeterminingFaraday Sot.,
8m
Through aTurbul~t Gas Stream. M. S. Thesis, Case Inst. of Tech., 1953.
18. Kaufman, F., and Cook, H. J.: Non-Aqueous Soap Bubbles for FlsmeStuities. Tech. Note No. 575, BalUstic Res. Labs., AberdeenProving Ground (Msryland), Jsn. 1952. (Proj. TB3-0108J of Res.and Dev. Div., Oral.Corps.) “
19. Stevens, F. W.: The Gaseous Explosive Reaction - The Effect of Pres-sure on the Rate of Propagation of the Reaction Zone and upon theRate of Molecular Transformation. NACA Rep. 372, 1930.
20. Manton, John, von Elbe, Guenther, and Lewis, Bernard: CotiustionWaves in Explosive Gas Mixtures and the Development of CellulsrFlames. Jour. Chem. P@., vol. 20, no. 1, Jan. 1952, pp. 153-157.
21. Taylor, Geoffrey: The Inskibility of Liquid Surfaces When Acceler-ated in a Direction Perpendicular to Their Planes. Proc. Roy.
Sot= (Lotion), ser. A, vol. 201, 1950, pp. 192-196.
22. D~er, Gordon L., and Graab, Dorothy D.: Flame Velocities ofPropane- and Ethylene-Oxygen-NitiogenMixbures. IVACARM E52J24,1952.
.
.
NACA TN 3106,.
15
TAME 1. - 0E3ERVATION OF ROUGH F-
.,
.
.
Hydrocarbon
C2H4
%H4
%H4
C2H4
%$34
%J34
W34
C2H4
%$4
%H4
‘4CH4
%
%CH4
C5HU
C5HM
02a=02+N2
0.400
● 554
.654
.749
0.554
.554
.554
.554
● 554
.554
0.749
.749
.749
● 749
● 749
0.749
1.00
Percent
etoichiometric
106
103
lo5
107
59
69
87
93
103
1.06
Sll
7792
102
1.23
92
114
Approximate spa-tial velocity, ~,
cm/sec
2000
3800
5500
6800
1.9oo
23Q0
2900
3300
3900
3900
2500
2900
2950
3600
2900
3000
7000
..— —
16 NACA TN 3106
TABIE II. - COMPARISON OF SPATIAL FLAME VELOCITIES FOR ~-~
~ ~ BY D~ INVESTIGATORS USING SOAP-BUBBIX METHOD
Ethylene,percent
7.707.686.536.586.536.64
I?umberof runs
5843107
4verage3patialT&b City,
stY
cm/sec
520521503502484497
Technique
Fa8tax cameraDrum csmeraFastax csmeraDrum cameraDrum csmeraFastax camera
“wArgonArgon
Argon
Reference
Table V3
Table V43
Table V
TABLE III. - COMPARISON OF BURNING VXLOCTlI13!SFOR STOICHIOMEQUC
E!mmwmE-AIR FUMES MEAWRED BY DIFFERENT MBI!BDDS
rEthylene,percent
L6.536.536.586.546.56.546.54
Burningvelocity,
St)~sec
62.362.462.563.162.864.0a74 ● Ob
Soap bubble - argon Table VSoap bubble - argon 3Soap bubble - air 4Constant volume bomb 6Bunsen burner 7NACA lmibe 8Bunsen burner 22
aInterpolated values on curve of burning velocityagtist concentration of ethylene in air.
Elto
%easured value corrected for temperature from 311° to298° K by method of ref. 22.
.
!cABm Iv. - BURNING vELOC- FOR HYDROC!AR80N-OXYGEN-NTI!ROGEN MIXTUMS
CONTAINR?G MORE OXYGEN THAN AIR
Hydrocarbon Percent 02 8patid l?heoretlcal Burning velocity meamrement5,
— velocity, expanalon‘iOitiO- a ‘“ 02+IT2
cm/~ec
metric S*, ratio, E+
cm/secSoap- Eurner EUrner Burner
(average)bubble method method methmi
method Singer Jabn DLWXer
ad (ref. 9 and
HeiJnel p. 465)a Qraab
(ref. 9A (ref. 22)
p. 467)
Methaue lo7 0.306 766 8.92 85.8 m 00
106 .395 1215 9.72 125.o 168 126
107 .499 1906 1.O.49 181.7 225 171
Ethylene 3-05 0.306 I-331 9.49 140.2 E&b
105 .395 2021 10.41 194.1
lo7 .499 2921 11.35 257.4
‘%terpclatdvalues from curve6 of nm.xlmum burning velocity agdnst oxygen concentration.
bIuterpolat.d value from curve of maximum burd.ng velocity against oxygen concentration
(valuee reduced frum initial temperature of 311° to 298° K by empirical formula of.
ref. 22).
18 I?ACATN 3106
.
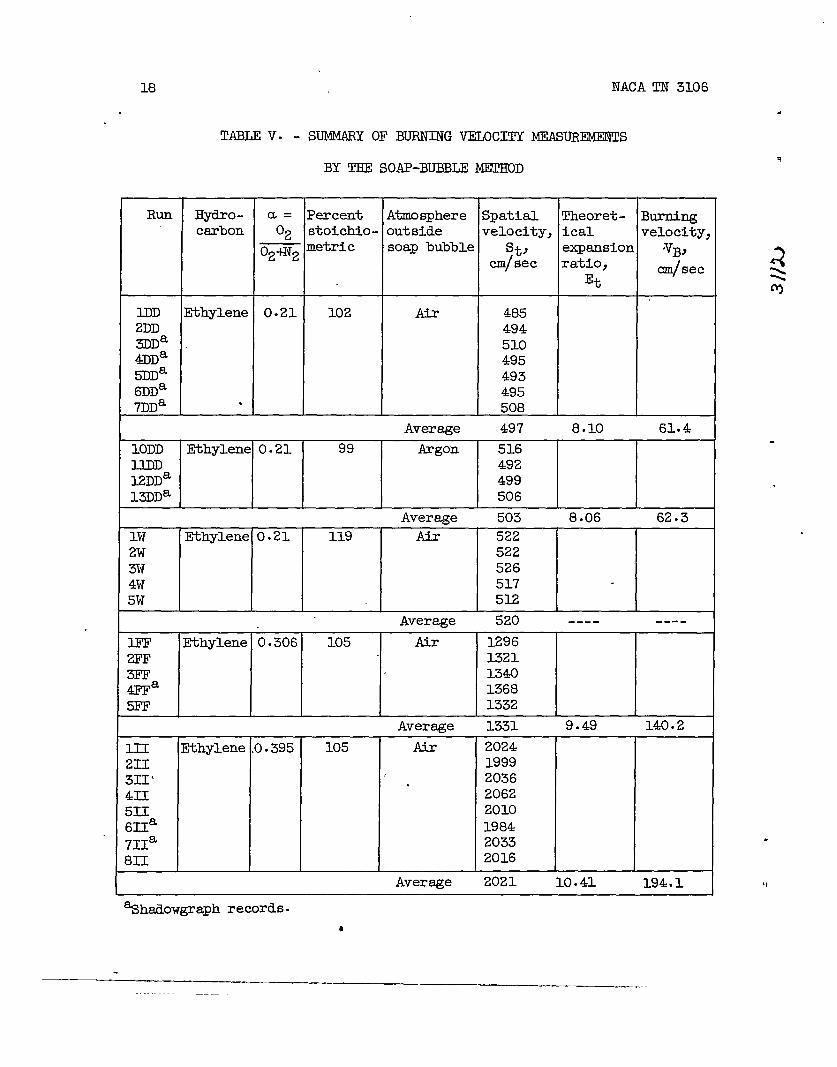
TABLE V. - SUMMARY OF BURNING vmocITY MEAs~s
BY THE SOAP-BUBBLE METHOD
Run Hydro- a= Percent Atmosphere Spatial Theoret- B_carbon o~ stoichio- outside velocity, ical velocity,
o#W~ metric soa~ bubble St> expansion “VB,cm~sec ratio,
%cm~sec
Ethylene 0.21 lo2 4852DD 4943DDa 5104JlDa 4955DDa 493~Da 495~Da ● 508
Average 497 8.10 61.4
10DD Ethylene 0.21 99 Argon 516492
12DDa 49913DDa 506
Average 503 8.06 62.3
lW Ethylene 0.21 119 5222W 5223W 5264W 5175W 512
Average 520 ---- ----
Ethylene .0.306 105 129613211340
ma 13681332
Average 1331 9.49 140.2
Ethylene ,0.395 105 2024~~ 1999311‘ 2036.III 2062511 2010
aHI 1984?IIa 2033
III 2016----
Average Zuzl 10.41 194.1
%hadowgraph records.o
>
46

t.
NACA TN 3106
TABLE V. - Concluded. SUMMARY OF BURNING VELOCITY
BY TBE SOAP-BUBBLE ME!I!KOD
19
Run Hydro- a= Percent Almosphme Spatial. Theoret- Burningcsrbon o~ Stoichio- outside velocity, ital. velocity:
— metrico#?~ . soap bubble St, expansion VB,
cm/Oec ratio, cm/secEt
12H Ethylene 0.395 104 Argon 2005
1311 2010
1411 1968
Aversge 1994 10.39 191.9
lJJ Ethylene 0.499 107 Air 27602JJ 31233JJ 28664JJ 2804
5JJ 30519J~ 2997
Average 2921 11.35 257.4
lGG Methane 0.306 107 7582GG 793
3GG 778758
5GG 743
Average 766 8.92 85.8
8HH Methane 0.395 106. 1215
9HK 1191
10BH 1204
mm 1221
IaII 1238
1311EF 1220
Average 1215 9’.72 U5.O
IJsK Methane 0.494 107 19691899
2s 1917
7KK o 1882
8KK 1922
9KK 1848
Average 1906 10 ● 49 181.7
%Wsdowgraph records.
—— -—--.—-
We
edge
(
lZ-Ino lam.
mi2v’or
eouroe
Fi~e 1. - Qeneral setup.
I
.
9TT C
.
NACA TN 3106 21
chamler.
—.
22
A
.
NACA TN 3106
4
f
P Mixture inlet
LBubblesupport,outerbrasstube
r
PyreximulationI, (2-IImItibing)
‘\ ~: I
\\ (8 mm) ,/” -I
\\ /——-
I?igure3. - Firing column with retractable electrodes.
n
.
h
— —— . ———
.
NI-1i-lN-)
.
r!
NACA TN 310623
C-%286
(a) RelatiwlYf’afib- ~j spatial wlocim, apprcdmately 2000 centimeterspersecond.
Figure4.- Typical.schlieren UIotion-pic-ephotogapm.
—.
24
(b)
FI
Slower burdng flame; spatial vehci_kY, 520 centiu@tiraper
.gure 4. - Concluded. Typical schlierenmtion-pictie photo
c-3.4267
second.
@=P~ “
.
,,
NACA TN 3106 25
.
,
Figure 5. - l’ypioalahadow~ph motion-picturephotographsof flame propa@@3 mcombustiblemixture.
—. —— —-
26 NACA TN 3106
.
.32
.28/
.24
~
.20
.16
.I.2
c
.08 /i
(
.04 /
/
o 8 16 24 32 40 48 56 64Fmme sequence, or time
Figure 6. - Analysis of data to determine apatlal velocity.
lJACATN 3106 27
,,
●
()
o0
.40
c) o< ~oo )
II
.36
.32
.28
8~’.24 n
j
cI
!!
,20
%
.16-
●12
.08 5“
.04- #
o 4 8 12 16 20 24 28 32
Framesequence,or time
Figure7. - Analysiaof datato determinespatialvelocityforroughflame.
—— .—. —. -——
28 NACA TN 3106
.
.
34:289
Figure 8. - Schlierenmotion-picturephotographsshowingdevelopmentof rough flame.
.
.
\
NACA TN 3106 29
4.8 I 1 1 IMethod
o Soap bubble❑ Burner (Singer ~
Heimel; ref.9,4.0 p. 467)
0 Burner(Jahn;ref.9,p. 463) /
.2
,.4
..6
.8
.16 .32 .46 .64 .60 .96
Oxygen concentration, a = 02/(02 + ~2)
(a)Methane-oxygen-nitrogenmixhres.
Figure 9. - Comparison of relative burulngvelocities.
. ---- -—. - --—-—-—- --— -—— -—-— -... -—-. .-. -.— —- ---—— —— --—— –——
30 NACA TN 3106
.
2
1
.0-
I
..6
,.2 r
r
.8Method
/O Soap bubble•1 Burner (ref. 22)
.4 ,
[
o J.18 .26 .34 .42 ● 50
Oxygen concentration,a= 02/(02 + N2)
(b) Ethylene-oxygen-nitrogenmixtures.
Figure 9. - Concluded. Comparison of relative burn-ing velocities.
NACA-I.JUJ@ey-2-17-54-1003