Embed Size (px)
Citation preview

For A&B Categories
Prepared by
Power & Energy Division
Engineering Staff College of India Autonomous Organ of The Institution of Engineers (India)
An ISO 9001 : 2008 Certified Institution Old Bombay Road, Gachi Bowli, Hyderabad – 500 032
i.exe
Course Book on
Regulatory

Foreword
ESCI is empanelled as a Resource Institute (RI) for preparation of course book for imparting training to power distribution utility personnel for capacity building under R-APDRP programme of Ministry of Power, Government of India.ESCI is thankful to Power Finance Corporation Limited for giving an opportunity to compile the course content for distribution personnel in Top, Middle and junior management levels
The total material is presented in seven sections.
The first section covers evolution of Regulation of distribution business in India and also global perspectives.
The second section covers natural monopolies, economic, legal and social regulations for electricity distribution. An introduction to regulatory economics is covered.
Third section deals with economic reforms, salient features of Electricity Act 2003, National Tariff policy and trading margins. Additional reading material is provided on emergent regulatory regime in India at annexure
Regulations related to Rate making approach (viz) Rate of Return, based regulation, Price cap regulation, Rate making approaches under National tariff policy are covered under section four. Additional reading material is provided related to these concepts at annexure.
In section five, issues related to Electricity Grid Code, Standards of Performance, Supply code, Terms and conditions of Supply regulations and licensees’ compliance to Distribution Licence conditions are covered.
In section six role of middle management in providing compliance to the directives, Regulatory Information Management System, Cost of Service parameters, guide lines for filling ARR formats, Tariff filing are covered. Implementation of ERP, Accounting Standards and disclosure of information in Annual Reports, XRBL for distribution business is covered.
Conclusions is presented in seventh section. Necessary additional reading material is provided at annexures in form of case studies to get better insight of the concepts.
It is earnestly hoped that this book will meet the desired objectives. ESCI welcomes suggestions of the users to improve the content of this book and for enhancing the utility of the book.

_____________________________________________________________________________ Engineering Staff College of India Page No.1.1
Section – 1 Learning Objectives:
a) Uses of electricity b) Basics of electricity distribution c) Need for regulation of electricity distribution d) Evolution of electricity distribution regulation in India e) Regulatory governance of electricity sector – global perspective f) Understanding the concept of national policy on electricity distribution
1.0 Introduction 1.0.1 Uses of Electricity We are so much dependent on electric light and other machines and devices which run only with the use of electricity to deliver goods and services essential for our day to day life that we can not think of living a life without electricity even for a day. The social fabric and social security has been dependent on the use of electricity. We may say that electricity has invaded our lives and has become vital in almost all aspects of society today. The list of uses will fill a book but here are a few headings: Transport Trains, buses, trams and cars all use electricity. Many use it as the motive power, meaning that electricity drives the wheels to make the vehicle move. Even gas and diesel powered vehicles use electricity to start the engines, control the engine and power the ancillary devices. Communication as well as providing power for computers, cell phones, fixed phones, electricity is used as the medium for the transmission of signals. Even high speed optical fibers rely on an electrical signal at each end of the line. Without electricity, communication would be reduced to letters, flag waving and lighting fires and shouting at each other. None of the electricity free methods are as flexible as any that we are used to using today. Manufacturing Industry relies on electricity to drive virtually every moving part in a factory. Saws, cutters, conveyor belts, furnaces, chillers - whatever the process, electricity is involved everywhere. Entertainment The MP3 player, the portable battery powered radio, memory stick are all accepted as part of our everyday lives. All rely on electricity to operate. Whether connected to a mains supply or battery, they all use electricity. The list is by no means complete. Take a look around you: if it moves, lights up or makes a noise, it probably uses electricity. Come to think of it, even animals and people use electricity for senses and muscle control, so perhaps the pet dog or cat should be included after all! Can you name all the ways you use electricity at home? We use electricity almost every minute from the time we get up in the morning until we go to bed at night.

_____________________________________________________________________________ Engineering Staff College of India Page No.1.2
Home Heating, lighting, television, radio, computer, telephones all rely on electricity. Even wireless lights such as solar powered lamps will convert sight to electricity. Take a look at all the things we depend on each day that need electricity: In the kitchen: Refrigerators, Dishwashers, Cell phone chargers. In the family room: Video games, Laptops, Lamps and light-bulbs. In the basement or utility room: Washer and dryer, Furnace and water heater. Outdoors: Outdoor lighting, Electric lawn mower, Pool heater. 1.0.2 Electricity Distribution Electricity Distribution and Retail Supply is the third stage of electricity supply chain starting with the Generation of Electricity in a commercial scale. The second stage is the transmission of the electricity i.e. evacuation of the Generated quantum of electricity from the generating stations to the destination of the use or load centres for Distribution and Retail supply to various categories of consumers. In the early days of electricity distribution, direct current (DC) generators were connected to loads at the same voltage. The generation, transmission and loads had to be of the same voltage because there was no way of changing DC voltage levels, other than inefficient motor-generator sets. Low DC voltages were used (on the order of 100 volts) since that was a practical voltage for incandescent lamps, which were the primary electrical load. Low voltage also required less insulation for safe distribution within buildings. The losses in a cable are proportional to the square of the current, the length of the cable, and the resistivity of the material, and are inversely proportional to cross-sectional area. Early transmission networks used copper cable, which is one of the best economically feasible conductors for this application. To reduce the current and copper required for a given quantity of power transmitted would require a higher transmission voltage, but no efficient method existed to change the voltage of DC power circuits. To keep losses to an economically practical level the Edison DC system needed thick cables and local generators. Early DC generating plants needed to be within about 1.5 miles (2.4 km) of the farthest customer to avoid excessively large and expensive conductors. The competition between the direct current (DC) of Thomas Edison and the alternating current (AC) of Nikola Tesla and George Westinghouse was known as the War of Currents. At the conclusion of their campaigning, AC became the dominant form of transmission of power. Power transformers, installed at power stations, could be used to raise the voltage from the generators, and transformers at local substations could reduce voltage to supply loads. Increasing the voltage reduced the current in the transmission and distribution lines and hence the size of conductors and distribution losses. This made it more economical to distribute power over long distances. Generators (such as hydroelectric sites) could be located far from the loads.
_____________________________________________________________________________ Engineering Staff College of India Page No.1.3
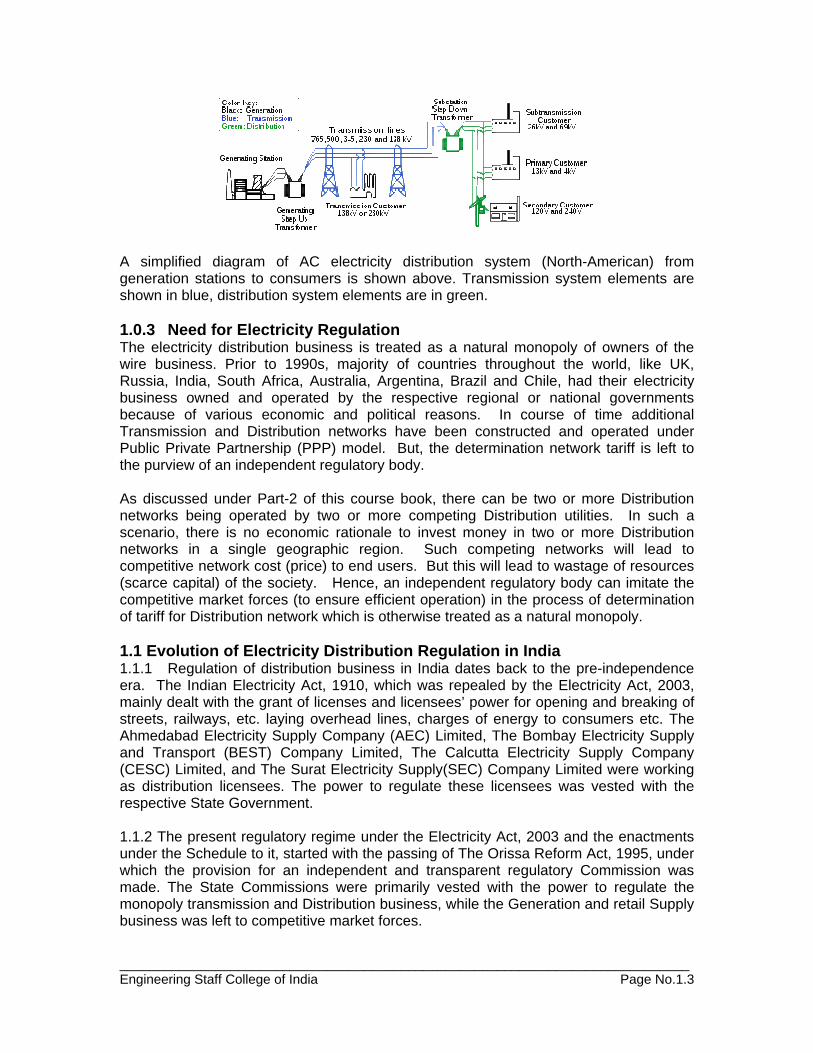
A simplified diagram of AC electricity distribution system (North-American) from generation stations to consumers is shown above. Transmission system elements are shown in blue, distribution system elements are in green. 1.0.3 Need for Electricity Regulation The electricity distribution business is treated as a natural monopoly of owners of the wire business. Prior to 1990s, majority of countries throughout the world, like UK, Russia, India, South Africa, Australia, Argentina, Brazil and Chile, had their electricity business owned and operated by the respective regional or national governments because of various economic and political reasons. In course of time additional Transmission and Distribution networks have been constructed and operated under Public Private Partnership (PPP) model. But, the determination network tariff is left to the purview of an independent regulatory body. As discussed under Part-2 of this course book, there can be two or more Distribution networks being operated by two or more competing Distribution utilities. In such a scenario, there is no economic rationale to invest money in two or more Distribution networks in a single geographic region. Such competing networks will lead to competitive network cost (price) to end users. But this will lead to wastage of resources (scarce capital) of the society. Hence, an independent regulatory body can imitate the competitive market forces (to ensure efficient operation) in the process of determination of tariff for Distribution network which is otherwise treated as a natural monopoly. 1.1 Evolution of Electricity Distribution Regulation in India 1.1.1 Regulation of distribution business in India dates back to the pre-independence era. The Indian Electricity Act, 1910, which was repealed by the Electricity Act, 2003, mainly dealt with the grant of licenses and licensees’ power for opening and breaking of streets, railways, etc. laying overhead lines, charges of energy to consumers etc. The Ahmedabad Electricity Supply Company (AEC) Limited, The Bombay Electricity Supply and Transport (BEST) Company Limited, The Calcutta Electricity Supply Company (CESC) Limited, and The Surat Electricity Supply(SEC) Company Limited were working as distribution licensees. The power to regulate these licensees was vested with the respective State Government.
1.1.2 The present regulatory regime under the Electricity Act, 2003 and the enactments under the Schedule to it, started with the passing of The Orissa Reform Act, 1995, under which the provision for an independent and transparent regulatory Commission was made. The State Commissions were primarily vested with the power to regulate the monopoly transmission and Distribution business, while the Generation and retail Supply business was left to competitive market forces.
_____________________________________________________________________________ Engineering Staff College of India Page No.1.4
1.2 Regulatory Governance of Electricity Sector – Global Perspective 1.2.1 The governance of the monopolistic utility sector was the matter of concern for Managers and Governments across the nations. While the International multilateral agencies wanted the commercial viability of the utilities and sealing the sector from political exploitation, Governments did not show much interest to give up the control over the sector. 1.2.2 World Energy Council (WEC), in its deliberations during the eighties and nineties, tried various reforms and restructuring models for the sector, to introduce efficiency and accountability in to the sector. It is in this context that the South Asian Nations of the WEC had a conference to decide the model of governance for their utilities. 1.2.3 Governments in South Asian countries, at the instance of World Bank, decided to adopt a model where network or wire business like Transmission and Distribution were put under regulatory governance, but Generation and Supply business were put to the competitive market forces. 1.3 National Electricity Policy and Regulation of Distribution Business It is recommended that all participants will go through the entire document of National Electricity Policy, as notified by the Ministry of Power, Government of India, Dated the 12th, February, 2005. The part of the Policy relevant to the distribution business is extracted from the said document, and reproduced in the following paragraphs: 1.3.1 Distribution is the most critical segment of the electricity business chain. The real challenge of reforms in the power sector lies in efficient management of the distribution sector. 1.3.2 The Act provides for a robust regulatory framework for distribution licensees to safeguard consumer interests. It also creates a competitive framework for the distribution business, offering options to consumers, through the concepts of open access and multiple licensees in the same area of supply. 1.3.3 For achieving efficiency gains proper restructuring of distribution utilities is essential. Adequate transition financing support would also be necessary for these utilities. Such support should be arranged linked to attainment of predetermined efficiency improvements and reduction in cash losses and putting in place appropriate governance structure for insulating the service providers from extraneous interference while at the same time ensuring transparency and accountability. For ensuring financial viability and sustainability, State Governments would need to restructure the liabilities of the State Electricity Boards to ensure that the successor companies are not burdened with past liabilities. The Central Government would also assist the States, which develop a clear roadmap for turnaround, in arranging transition financing from various sources which shall be linked to predetermined improvements and efficiency gains aimed at attaining financial viability and also putting in place appropriate governance structures. 1.3.4 Conducive business environment in terms of adequate returns and suitable transitional model with predetermined improvements in efficiency parameters in distribution business would be necessary for facilitating funding and attracting investments in distribution. Multi-Year Tariff (MYT) framework is an important structural incentive to minimize risks for utilities and consumers, promote efficiency and rapid
_____________________________________________________________________________ Engineering Staff College of India Page No.1.5
reduction of system losses. It would serve public interest through economic efficiency and improved service quality. It would also bring greater predictability to consumer tariffs by restricting tariff changes to known indicators such as power purchase prices and inflation indices. Private sector participation in distribution needs to be encouraged for achieving the requisite reduction in distribution losses and improving the quality of service to the consumers. 1.3.5 The Electricity Act 2003 enables competing generating companies and trading licensees, besides the area distribution licensees, to sell electricity to consumers when open access in distribution is introduced by the State Electricity Regulatory Commissions. As required by the Act, the SERCs shall notify regulations by June 2005 that would enable open access to distribution networks in terms of sub-section 2 of section 42 which stipulates that such open access would be allowed, not later than five years from 27th January 2004 to consumers who require a supply of electricity where the maximum power to be made available at any time exceeds one mega watt. Section 49 of the Act provides that such consumers who have been allowed open access under section 42 may enter into agreement with any person for supply of electricity on such terms and conditions, including tariff, as may be agreed upon by them. While making regulations for open access in distribution, the SERCs will also determine wheeling charges and cross-subsidy surcharge as required under section 42 of the Act. 1.3.6 A time-bound programme should be drawn up by the State Electricity Regulatory Commissions (SERC) for segregation of technical and commercial losses through energy audits. Energy accounting and declaration of its results in each defined unit, as determined by SERCs, should be mandatory not later than March 2007. An action plan for reduction of the losses with adequate investments and suitable improvements in governance should be drawn up. Standards for reliability and quality of supply as well as for loss levels shall also be specified, from time to time, so as to bring these in line with international practices by year 2012. 1.3.7 One of the key provisions of the Act on competition in distribution is the concept of multiple licensees in the same area of supply through their independent distribution systems. State Governments have full flexibility in carving out distribution zones while restructuring the Government utilities. For grant of second and subsequent distribution licence within the area of an incumbent distribution licensee, a revenue district, a Municipal Council for a smaller urban area or a Municipal Corporation for a larger urban area as defined in the Article 243(Q) of Constitution of India (74th Amendment) may be considered as the minimum area. The Government of India would notify within three months, the requirements for compliance by applicant for second and subsequent distribution licence as envisaged in Section 14 of the Act. With a view to provide benefits of competition to all section of consumers, the second and subsequent licensee for distribution in the same area shall have obligation to supply to all consumers in accordance with provisions of section 43 of the Electricity Act 2003. The SERCs are required to regulate the tariff including connection charges to be recovered by a distribution licensee under the provisions of the Act. This will ensure that second distribution licensee does not resort to cherry picking by demanding unreasonable connection charges from consumers.
_____________________________________________________________________________ Engineering Staff College of India Page No.1.6
1.3.8 The Act mandates supply of electricity through a correct meter within a stipulated period. The Authority should develop regulations as required under Section 55 of the Act within three months. 1.3.9 The Act requires all consumers to be metered within two years. The SERCs may obtain from the Distribution Licensees their metering plans, approve these, and monitor the same. The SERCs should encourage use of pre-paid meters. In the first instance, TOD meters for large consumers with a minimum load of one MVA are also to be encouraged. The SERCs should also put in place independent third-party meter testing arrangements. 1.3.10 Modern information technology systems may be implemented by the utilities on a priority basis, after considering cost and benefits, to facilitate creation of network information and customer data base which will help in management of load, improvement in quality, detection of theft and tampering, customer information and prompt and correct billing and collection . Special emphasis should be placed on consumer indexing and mapping in a time bound manner. Support is being provided for information technology based systems under the Accelerated Power Development and Reforms Programme (APDRP). 1.3.11 High Voltage Distribution System is an effective method for reduction of technical losses, prevention of theft, improved voltage profile and better consumer service. It should be promoted to reduce LT/HT ratio keeping in view the techno economic considerations. 1.3.12 SCADA and data management systems are useful for efficient working of Distribution Systems. A time bound programme for implementation of SCADA and data management system should be obtained from Distribution Licensees and approved by the SERCs keeping in view the techno economic considerations. Efforts should be made to install substation automation equipment in a phased manner. 1.3.13 The Act has provided for stringent measures against theft of electricity. The States and distribution utilities should ensure effective implementation of these provisions. The State Governments may set up Special Courts as envisaged in Section 153 of the Act. 1.3.14 In the light of above electricity policy, the present regulatory course book will provide the concepts of distribution sector regulations and framework for development of electricity market in India.
_____________________________________________________________________________ Engineering Staff College of India Page No.2.1
Section – 2 Learning Objectives:
a) Economic and social rationale for regulation b) Monopolistic competition c) Legal monopoly d) Understanding marginal cost development
2.0 Economic, Legal and Social Rationale for Electricity Distribution Regulation The Distribution of Electricity or the wire business being a natural monopoly has to be regulated for maximizing the efficiency of operation and economies of scale benefit to the society. The resources of the society can be properly utilized through a legally created regulated entity. Such entity has to be regulated only through an independent regulatory body. This system of regulatory governance of electricity distribution has Economic, Legal and Social Rationale (to be regulated than to be left to competitive market forces) which is being explained in the following paragraphs. Mathematical and other illustrative examples have been quoted from the body of economic literature wherever felt necessary. 2.0.1 The economists have been arguing in favor of regulating the natural monopolies in public utility services. They have established the economic rationale for such regulation in the literature of economics. 2.0.2 The legal and social rationale has also been established by Public Utility (regulatory authorities) Commissions, in almost all States throughout the United States of America, while pricing the various services, such as transmission, distribution, and wheeling of electricity, water, natural gas (including piped gas supply), telecommunications, and transportation services, etc. provided by such monopolist utilities. 2.0.3 The utilities industry is a good example of a natural monopoly. The costs of establishing a means to produce power and supply it, to each household or any other consumer, can be very large. This capital cost is a strong deterrent for possible competitors. Additionally, society can benefit from having natural monopolies because having multiple firms operating in such an industry is economically inefficient. 2.0.4 The regulation of distribution business, of which the main base consisted of threats from the introduction of a regulatory authority and potential competitors, was supported by mandatory information disclosures to identify possible excess profits by lines businesses and thus curbing the monopolistic behavior via self-regulation. Using the data in these information disclosures, it is found that price minus cost margins have increased rather than decreased significantly during the implementation of such regulation. Furthermore, this price minus cost margin can be attributed to the revaluation of fixed assets by network operators. 2.0.5 Throughout the economic literature, the need for regulation of natural monopolies is well documented and well understood. In accordance with the need for regulation, economists have put forward an extensive set of principles for regulating natural
_____________________________________________________________________________ Engineering Staff College of India Page No.2.2
monopoly suppliers. In practice, in many countries around the world, regulatory bodies have come up with different regulatory designs to overcome the problems brought about by the existence of natural monopolies. These regulatory designs can be classified under two main titles. On one side, there is heavy-handed regulation maintaining that the regulatory authority has a strong control over the natural monopoly and proceeds with stronger regulatory surveillance. 2.0.6 Being the traditional stream in economic literature, heavy-handed regulation explores the different ways through which regulatory authorities adopting a hands-on approach intervene in natural monopolies’ industrial operations. On the other side, there is light-handed regulation, which holds that actual regulation is conducted only if the natural monopoly is determined to have exerted its market power or triggered some kind of market failure. Besides, in order to prevent the natural monopoly from abusing its market power, different types of “threat” can be employed in light-handed regulation. Therefore, light-handed regulation is also seen as threat-based regulation. 2.0.7 There is, therefore, a sharp ideological difference between these two schools of thought. On the one hand, heavy-handed regulation implicitly assumes the natural monopoly will not act on socially efficient unless it has been regulated by a regulatory body adopting a hands-on approach. On the other hand, light-handed regulation assumes that through transparency and credible regulatory or other threats, a natural monopoly will behave competitively. 2.1 Economic and Social Rationale for Regulation of Natural Monopoly 2.1.1 The phenomena of natural monopolies and their regulation pose a dilemma that has perplexed and intrigued economists for many years. On the one hand, economic theory teaches that in the industries characterized by intensive economies of scale there should only be one single firm because of efficiency requirements. But on the other side, the uniqueness of the firm gives it power such that it could have an impact on social welfare. The dilemma is intensified by the suggestions of different natural monopoly definitions. 2.1.2 The concept of natural monopoly is generally perceived as a market in which competition is not possible. Alternatively, the term may also refer to the undesirability of competition rather than its possibility. It is crucial to make a distinction between employing natural monopoly in the positive form and employing it in the normative form. In the positive sense, it is predicted that there will only be one single firm in the industry. When employed normatively, a natural monopoly refers to an industry where the average cost of production in the industry is minimized only if there is a single producer. 2.1.3 According to Joskow (2007: 8) a firm producing a single homogeneous product is defined to be a natural monopoly when it is less costly to produce any level of output of this product by a single firm than with two or more firms. A crucial assumption for the validity of this definition is that this “cost dominance” relationship must hold over the full range of market demand for this product Q = D(P), where Q is the quantity produced and D is the demand at price p . 2.1.4 To illustrate this mathematically, consider a market for a homogenous product where each of k firms produces output qi and total output is given by
_____________________________________________________________________________ Engineering Staff College of India Page No.2.3
Each firm has an identical cost function C (qi). According to the technological or cost-based definition of natural monopoly, a natural monopoly will exist when:
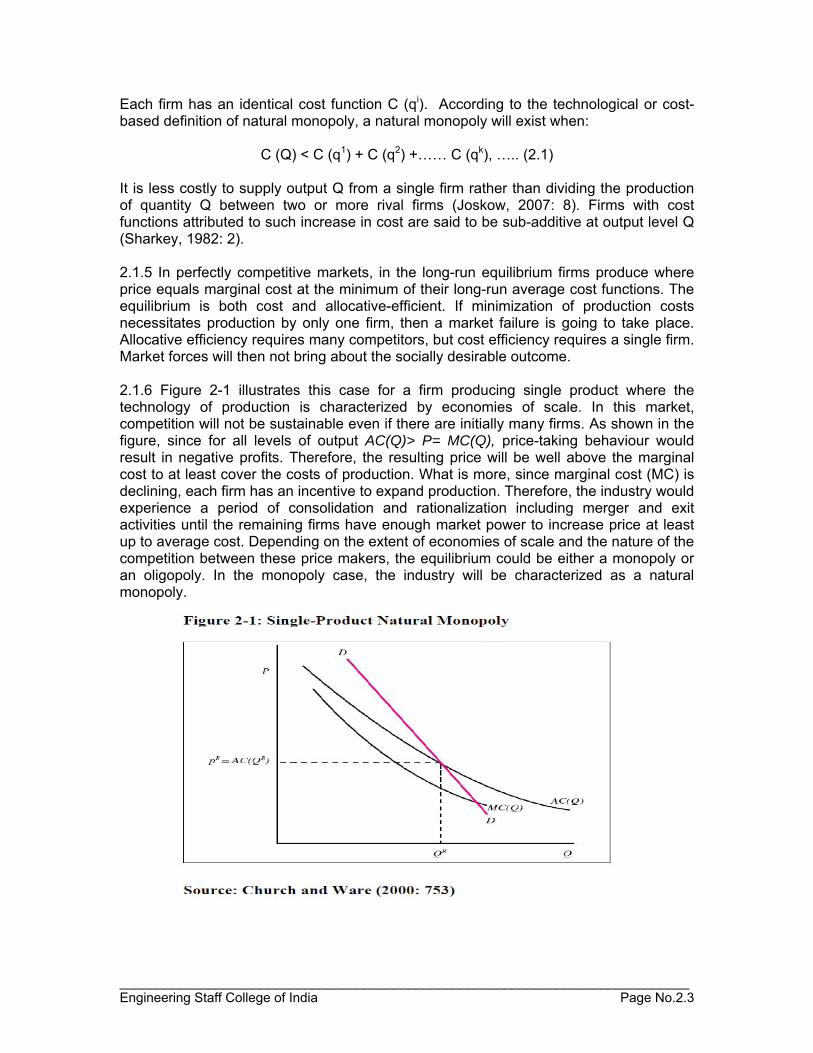
C (Q) < C (q1) + C (q2) +…… C (qk), ….. (2.1) It is less costly to supply output Q from a single firm rather than dividing the production of quantity Q between two or more rival firms (Joskow, 2007: 8). Firms with cost functions attributed to such increase in cost are said to be sub-additive at output level Q (Sharkey, 1982: 2). 2.1.5 In perfectly competitive markets, in the long-run equilibrium firms produce where price equals marginal cost at the minimum of their long-run average cost functions. The equilibrium is both cost and allocative-efficient. If minimization of production costs necessitates production by only one firm, then a market failure is going to take place. Allocative efficiency requires many competitors, but cost efficiency requires a single firm. Market forces will then not bring about the socially desirable outcome. 2.1.6 Figure 2-1 illustrates this case for a firm producing single product where the technology of production is characterized by economies of scale. In this market, competition will not be sustainable even if there are initially many firms. As shown in the figure, since for all levels of output AC(Q)> P= MC(Q), price-taking behaviour would result in negative profits. Therefore, the resulting price will be well above the marginal cost to at least cover the costs of production. What is more, since marginal cost (MC) is declining, each firm has an incentive to expand production. Therefore, the industry would experience a period of consolidation and rationalization including merger and exit activities until the remaining firms have enough market power to increase price at least up to average cost. Depending on the extent of economies of scale and the nature of the competition between these price makers, the equilibrium could be either a monopoly or an oligopoly. In the monopoly case, the industry will be characterized as a natural monopoly.
_____________________________________________________________________________ Engineering Staff College of India Page No.2.4
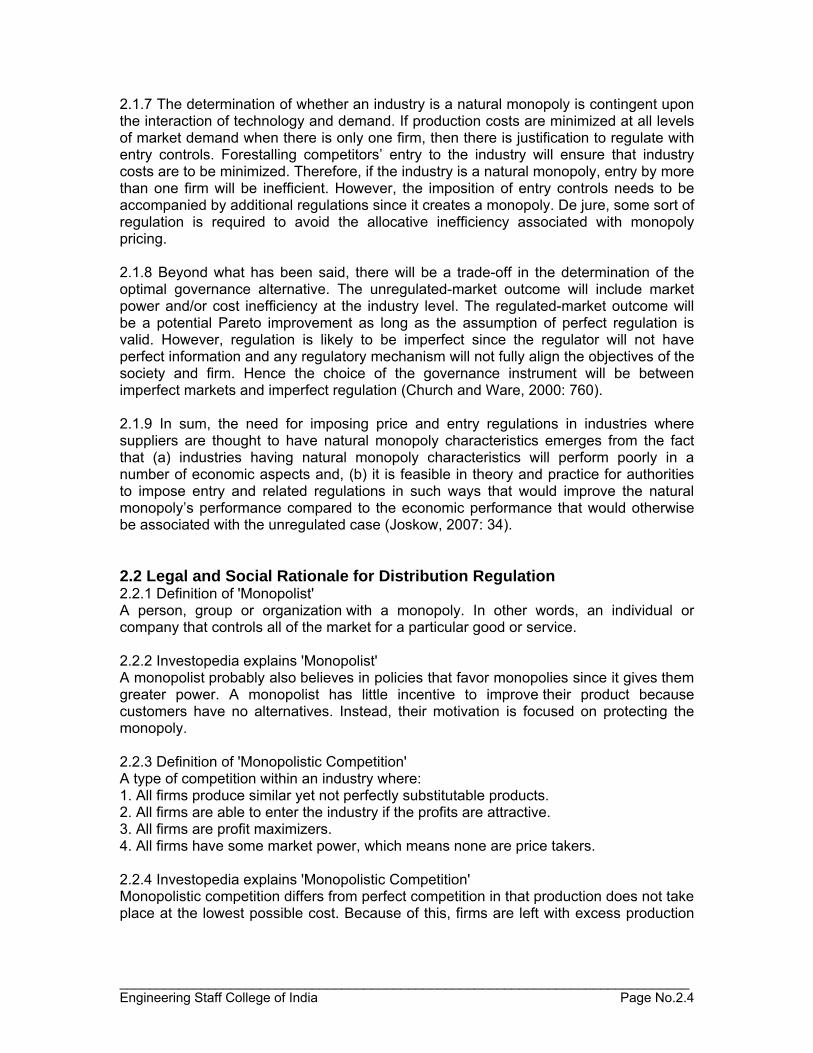
2.1.7 The determination of whether an industry is a natural monopoly is contingent upon the interaction of technology and demand. If production costs are minimized at all levels of market demand when there is only one firm, then there is justification to regulate with entry controls. Forestalling competitors’ entry to the industry will ensure that industry costs are to be minimized. Therefore, if the industry is a natural monopoly, entry by more than one firm will be inefficient. However, the imposition of entry controls needs to be accompanied by additional regulations since it creates a monopoly. De jure, some sort of regulation is required to avoid the allocative inefficiency associated with monopoly pricing. 2.1.8 Beyond what has been said, there will be a trade-off in the determination of the optimal governance alternative. The unregulated-market outcome will include market power and/or cost inefficiency at the industry level. The regulated-market outcome will be a potential Pareto improvement as long as the assumption of perfect regulation is valid. However, regulation is likely to be imperfect since the regulator will not have perfect information and any regulatory mechanism will not fully align the objectives of the society and firm. Hence the choice of the governance instrument will be between imperfect markets and imperfect regulation (Church and Ware, 2000: 760). 2.1.9 In sum, the need for imposing price and entry regulations in industries where suppliers are thought to have natural monopoly characteristics emerges from the fact that (a) industries having natural monopoly characteristics will perform poorly in a number of economic aspects and, (b) it is feasible in theory and practice for authorities to impose entry and related regulations in such ways that would improve the natural monopoly’s performance compared to the economic performance that would otherwise be associated with the unregulated case (Joskow, 2007: 34). 2.2 Legal and Social Rationale for Distribution Regulation 2.2.1 Definition of 'Monopolist' A person, group or organization with a monopoly. In other words, an individual or company that controls all of the market for a particular good or service. 2.2.2 Investopedia explains 'Monopolist' A monopolist probably also believes in policies that favor monopolies since it gives them greater power. A monopolist has little incentive to improve their product because customers have no alternatives. Instead, their motivation is focused on protecting the monopoly. 2.2.3 Definition of 'Monopolistic Competition' A type of competition within an industry where: 1. All firms produce similar yet not perfectly substitutable products. 2. All firms are able to enter the industry if the profits are attractive. 3. All firms are profit maximizers. 4. All firms have some market power, which means none are price takers. 2.2.4 Investopedia explains 'Monopolistic Competition' Monopolistic competition differs from perfect competition in that production does not take place at the lowest possible cost. Because of this, firms are left with excess production
_____________________________________________________________________________ Engineering Staff College of India Page No.2.5
capacity. This market concept was developed by Chamberlin (USA) and Robinson (Great Britain). 2.2.5 In the case of electricity distribution, if two licensees operate with separate distribution system, overhead lines or cables, with associated transformers and control gears, in the same area of supply, then the average cost per unit of power distributed shall be higher than the case where one distribution company operates and distributes the power with optimum efficiency. Hence, monopolistic competition leads to social dead weight loss of resources. 2.2.6 Definition of 'Legal Monopoly' A company that is operating as a monopoly under a government mandate. A legal monopoly offers a specific product or service at a regulated price and can either be independently run and government regulated, or government run and regulated. Also known as a "statutory monopoly". 2.2.7 Investopedia explains 'Legal Monopoly' A legal monopoly is set up in the beginning as a perceived best option for both government and its citizens. For example, AT&T operated as a legal monopoly until 1982 because it was deemed vital to have cheap and reliable service for everyone. Railroads and airlines have also been operated as legal monopolies at different periods in history. In most cases, capitalism has won out over legal monopolies as technology and the economy have become more advanced. 2.2.8 In most countries of the world, the electricity distribution was working as a government regulated utility till the recent reforms and restructuring of 1990s’ took place at the behest of World Bank. The legal rationale behind distribution regulation was directed towards disciplining the monopolistic network companies under strict enactments of laws, rules and regulations, under which the monopolist behavior of such network companies can be conditioned in such a way that the independent regulator imitates the behavior of market conditions and imposes such conditions so as to achieve results of pricing for consumers, similar to competitive markets without establishing any 'Monopolistic Competition'. 2.3 Introduction to Regulatory Economics and Marginal Cost Development 2.3.1 Regulatory Economics development in theory Two decades ago regulatory economics had just completed some major strides. In part, this had been as a result of a major investment made in economics by the Bell System. Notable in this was the founding in the spring of 1970 of The Bell Journal of Economics and Management Science, which became the Bell Journal of Economics in the spring of 1975 which begat the Rand Journal in the spring of 1984, immediately following the Divestiture. AT&T apparently saw no significant benefit in continuing its major effort in regulatory economics, which had ostensibly been a costly failure memorialized in the Divestiture. The divestiture of the Bell Journal to Rand and the gutting of its premier economics group at Bell Labs might be seen as two casualties in the failure of some outstanding economic brainpower and innovative research to carry the day for Bell. 2.3.2 In many ways the research of the 70s and 80s was inspired in a significant way by the resources ploughed into microeconomics by AT&T. Take the Bell Journal.3 Money appeared to be no object. As two young faculty in the 70s, when young faculty in
_____________________________________________________________________________ Engineering Staff College of India Page No.2.6
business schools were paid significantly less in real terms, we were impressed to receive what appeared to be princely sums for refereeing, not to mention the additional fees paid to us for our 1976 article on peak-load pricing. The Bell Journal had no difficulty attracting extremely talented editors and contributors including already distinguished scholars like William Baumol, Walter Oi, Richard Posner, George Stigler, William Vickrey, Oliver Williamson, and others. Perhaps even more important was that the Bell Journal attracted many young economists, such as Elizabeth Bailey, John Panzar, Robert Willig, and David Sibley, whose work in the 70s and 80s played a major role in the evolution of regulatory economics. Together the visibility of regulated industries and the quality of the researchers involved made regulatory economics the most important subspecialty of industrial organization.
2.3.3 Before the founding of the Bell Journal regulatory economics was extremely undeveloped. There was the seminal work of Averch and Johnson (1962),4 the marginal cost pricing debate for monopolies of the 40s and 50s, which itself became specialized into the peak-load pricing debate through the work of Boiteux (1949), Steiner (1957) and Williamson (1968). These contributions all provided the context for the research that the Bell Journal fostered in the 70s. Peak-load pricing in the early 80s was extremely well developed in theory. Ramsey pricing was given a new lease on life by Baumol and Bradford (1970), the Bell Labs economists, including Rohlfs (1979), and others including Sherman and George (1979), and continues as a source both theoretical and practical inspiration for analyzing and designing regulatory institutions. 2.3.4 All of these developments were outgrowths of already established theory. However, the theory of contestable markets, due primarily to Baumol, Panzar and Willig (1982) and some related development, which began in the 70s, did not have such roots. They were original in a way that the other developments were not. They also lacked the pedigree of the other developments and were for that reason less constrained. Perhaps for this reason the authors of contestability had very high hopes for the impact of their work.5 Despite its detractors, some of whom admit its importance, the work has become one of the landmarks in regulatory economics. Even a leading detractor states: “The major part of the analysis of it is an analysis of multiple products and joint costs, which is already gaining wide acceptance” (Shepherd 1984, p572). Indeed, their analysis of issues of costs, multiproduct pricing and cross subsidy has had and continues to have a major impact on the discipline. As a result of this work cross subsidy is well defined in terms of the burden test – a cross subsidy does not occur if the revenue from a product is between its incremental cost and its stand-alone costs. 2.3.5 Around the mid 80s a change took place in the theoretical regulatory economic and this was the incorporation of the principal-agent theory, mechanism design theory and information economics into regulatory economics. This began with the work of Baron and Myerson (1982). The work was an outgrowth of the work on principal-agent theory in the 1970s (e.g., Ross (1973) and Groves (1973), which, indeed, offered major insights into issue of corporate governance. The problem is, as we noted in Crew and Kleindorfer (1986) that its insights have little to offer when carried over into designing institutions or
3 Henceforth we will not distinguish between the two appellations but will use this term to refer to either The Bell Journal of Economics and Management Science or the Bell Journal of Economics. 4 We intentionally use the word seminal to describe A-J. Although many authors have sought to discredit this paper it is one of the most highly cited and influential papers in regulatory economics.
_____________________________________________________________________________ Engineering Staff College of India Page No.2.7
mechanisms that can be applied to regulatory problems, as they exist in practice. This is not the view of theorists in this area. Indeed, the work of Baron and Myerson spawned a new industry in regulatory economics, the culmination of which can be found in the treatise by Laffont and Tirole (1994). 2.3.6 Theorists employing this “new” approach were highly critical of the earlier work, which they perceived as having little value as it missed the critical problem of incentives. This can be noted in the work of Laffont and Tirole (1993). “In the policy arena discontent was expressed with the price, quality, and cost performance of regulated firms and government contractors…More powerful incentive schemes were proposed and implemented, deregulation was encouraged… [but] regulation theory largely ignored incentive issues.” (Laffont and Tirole 1993, xvi) Previous regulatory theory, they argued, “…did not meet the standards of newly developed principal-agent theory, whose aim is to highlight the information limitations that impair agency relationships. Furthermore the considerably simplified formal models that assumed away imperfect information were less realistic in that they implied policy recommendations that require information not available to regulators in practice.” While we accept that these criticisms certainly have some validity, we argue that the contributions that replaced them were at least as limited in their applicability and fell far short of the expectations created by their authors. Ironically, a principal reason for this is precisely the reason raised above by Laffont and Tirole in ushering in the new theory, namely, a heavy reliance by such schemes on information that is not available to regulators. 2.3.7. Indeed, the entire mechanism design literature, beginning with Baron and Myerson (1981) and strongly promoted by Laffont and Tirole, is based in one way or another on assumptions like common knowledge that endow the regulator with information that he cannot have without a contested discovery process that always leaves him in a state far short of the level of information assumed in these theories. Common knowledge is the Achilles heel of mechanism design theory.6 Why is it that extending the traditional principal-agent theory to regulatory economics is so problematical? When a principal and agent are involved in a private transaction, there is not a fundamental problem with the principal designing incentive systems for the agent based on an assumed “common knowledge” by the principal about the agent’s costs or preferences. In private transactions, the principal bears the costs of any error in his assumptions7 Contrast this with a regulator with responsibility for the price and quality of an essential good. If the regulator is wrong in his common knowledge assumptions about the agent (the regulated firm), it is consumers or the regulated firm that bear the consequences. The anticipation of these consequences will clearly give rise to strategic interactions, both in theory and practice that may have fundamental effects on what common knowledge assumptions are legitimate, and on the ultimate consequences of these for the outcomes of regulation.
5 They were rebuked by Shepherd (1984, p572) “a new theory of industrial organization” which “will transform the field…” (Baumol, Panzar and Willig, 1982, xiii). Shepherd failed to note that these were the words of Elizabeth Bailey in the Foreword
_____________________________________________________________________________ Engineering Staff College of India Page No.2.8
2.3.8 Theories that fail to address these strategic interactions leave a gaping hole in interpreting the results of any such theory. In particular, lifting the common knowledge assumption from a private principal agent framework to the regulatory context leads to major problems because it leaves open how this common knowledge distribution will be determined. Note that in the traditional principal-agent theory the contracting agent is free to take or leave the principal’s offer (which must therefore satisfy an individual rationality constraint), but under regulation this does not apply in the case of the firm which may have considerable sunk costs at risk and cannot simply pull up stakes if the firm does not find the regulator’s assumptions acceptable. 2.3.9 The promise of these mechanism-design-style theories was ostensibly considerable. They promised none other than the holy grail of X-efficiency, something previous regulation had manifestly failed to deliver. X-efficiency, however, was only achieved if two conditions - aside from the basic assumptions criticized above – were met. The first condition was that achievement of the promised X-efficiency required that the regulator concede some information rents to the firm.8 The second condition was what is referred to in mechanism design theory as commitment. This is the notion that the presence of information rents would not present a problem to the regulator and that, as a result, he was committed to his original agreement with the firm. In other words, the ex post appearance of excess profits would not cause the regulator to renege on his commitment to the original incentive scheme. Why this would not be a fatal flaw in the whole scheme was never considered. The new theory promised efficiency as long as the regulator is prepared to allow information rents. Theorists, however, never understood the impossibility of this in practice. No regulator can even admit that it allows the firm to retain information rents let alone commit to such a practice. For the regulator this is a congenital problem of far greater magnitude than has been recognized in economic theory.9,10 How do these rents differ so much from the old style monopoly rents that would make them acceptable to the regulator when it was monopoly rents that were the principal motivation of regulation in the first place? Thus, the promise of X-efficiency was hedged with conditions, which, we argue, make the theory of little significance for real world regulation, as subsequent events have shown.
6 By “common knowledge”, we are referring to the standard assumption of much of the mechanism design literature that the regulated firm actively reveals its type (e.g., its cost or other key parameters), knowing that the regulator will set regulatory parameters (e.g., the allowed rate of return in cost-of-service regulation or the X factor in price-cap regulation) based on the revealed type of the firm. The common knowledge assumption presumes that the regulator and the firm take as incontestable knowledge the probability distribution of possible revealed types, with regulatory design contingent on this common knowledge distribution. We include in our broad criticism of this assumption also weaker forms of this that allow the regulator to simply declare ex ante the distribution of revealed types, whether or not the regulated firm agrees to it. Any such declaration, unless agreed to by the regulated firm, can and would be contested, since different assumptions about this distribution naturally lead to different regulatory incentive systems under the standard Bayesian Incentive Bargaining approaches used in this literature. To put it plainly, the regulated firm definitely cares about what the regulator claims to be the actual distribution of potential types and would attempt to influence the accepted definition of this distribution if it were a central aspect of regulatory design. If such a distribution is a central feature of a design problem, a theory that simply takes it as a given, without modeling the process that would accompany its adversarial determination, is fundamentally flawed. 7 In particular, the models and applications in Laffont and Tirole (1993) that treat private procurement contracts remain significant contributions to the literature of contracting.
_____________________________________________________________________________ Engineering Staff College of India Page No.2.9
2.3.10 Of course, all theory makes simplifying assumptions, which depart from reality in one way or another. The key, at least for normative economic models, is that the assumptions made should not give rise to fundamental infeasibilities when implementing the results of the theory in practice. An apparent case in which this has not been true is the case of regulatory theory derived from the mechanism design literature. In effect, the theory proceeds by ignoring an immutable institutional constraint, namely that neither commitment nor its associated information rents are reasonable assumptions. Other than being a rich source of classroom exercises, this theory seems to have found no takers in practice. A consideration for the reasons underlying this failure may provide useful insights for the future innovations needed in development and application of regulatory theory. While we admire the elegance of the theory of mechanism design applied to regulation, we conclude that it may have led to some misleading policy implications and that overall its contribution is small. In its defense does provide insights into the role of information as a source of monopoly rents, which is a potentially valuable insight. 2.3.11 Another major development in economic theory over the last twenty years has been the progress made in auction and bidding theory and in experimental economics. Auctions and bidding have been applied extensively in regulatory applications as illustrated in the two special issues of JRE in May and July 2000 (see Salant 2000). Although economists now have a much better understanding of auctions and bidding, the applications have not been without their problems as the California electricity generation market illustrates. 2.3.12 However, unlike the mechanism design literature, the bidding, auctions and experimental economics literature offers considerable potential in regulatory economics. These innovations do not mean that franchise bidding along the lines of Demsetz (1968) is going to replace traditional regulation or that bidding will result in radical changes in regulation. They do, however, provided regulatory economists with some powerful tools, which may result in a number of promising applications. 2.3.13 Twenty years ago, concerns over access pricing were a practical issue in telecommunications. With the Divestiture these concerns increased significantly. However, theoretical contributions to address the problem of access pricing came later. 2.3.14 Access to an essential or bottleneck facility is the issue. The problem is compounded when the owner of the essential facility is also selling to final consumers in competition with the other firms. An example would be long distance telephone companies purchasing access from local phone companies to complete their calls. The local companies themselves might be also providing long distance service. This is the case, for example, with British Telecom, and a few jurisdictions for RBOCs. The efficient component pricing rule (ECPR) was one of the first attempts by economists to address
8 These rents arose from the information advantages of the firm relative to the regulator. 9 Loeb and Magat (1979), and Vogelsang and Finsinger (1979) implicitly rely on this same notion of commitment. 10 In Crew and Kleindorfer (2001) we recognize the importance of commitment and its effect on incentives and analyze the constraints on regulatory commitment.
_____________________________________________________________________________ Engineering Staff College of India Page No.2.10
the issue of efficient access pricing. Among the leading exponents of ECPR are Baumol and Sidak (1994).11 The idea of ECPR can be summarized as in Baumol and Sidak (1994, p178): Optimal input price = the input’s direct per-unit incremental cost + the opportunity cost to the input supplied of the sale of a unit of input.
2.3.15 The problem with ECPR arises from the second term on the right-hand side. If this could be determined on the basis of a readily observable price in a competitive market, then ECPR would be an efficient rule. However, it is precisely because of the bottleneck facility that such a competitive price cannot be determined. ECPR then comes down to allowing the bottleneck supplier the monopoly rents that he was earning when he was the only vertical integrated monopolist. As most monopolists are regulated, this presumably comes down to allowing him the regulated return that he would have obtained. The application of ECPR can be illustrated by means of the following simple illustrative example. 2.3.16 If there are two homogeneous products x1 and x2 each having two production stages: - MCij = Marginal Cost of product i in stage j We assume for simplicity that MC11 = MC21 = 8 and MC12 = MC22 =2 and stage 1 is the “access” input for each product. 2.3.17 Ramsey markups of 1.5 and 1.25 are applied to give prices of 15 and 12.5 for product 1 and 2 respectively. If the regulated monopolist has a monopoly in market 1 then ECPR would imply that entrants would be charged 10.5 for the access input. If he has cost lower than 2, he can undercut the monopolist in market 2 and take this market from the monopolist. 2.3.18 Most access pricing problems encountered in the real world are much more complicated than this. For example, products are differentiated and one of the products does not necessarily remain a robust monopoly. Thus, it may be possible to undercut the incumbent in the monopoly market thereby undermining the incumbent’s financial viability. In the area of access pricing it is apparent that significant progress has been made in understanding some of the complexities involved and in developing solutions to the problem. A particularly promising approach seems to be what Laffont and Tirole (1996) have referred to as “global price caps.”12 The idea is intriguingly simple aiming to avoid some of the complexities and information. Access is treated as a final good rather than as an intermediate good and is included in the computation of the price cap. 2.3.19 In addition, “Weights used in the computation of the price cap are exogenously determined and are proportional to the forecast quantities of the associated goods.” (Laffont and Tirole, 1996, p243). Laffont and Tirole explore the possibilities of forming a hybrid of ECPR and global price caps, which may offer benefits in terms of weight setting and protection against anti-competitive practices. Such a hybrid approach may provide a means of achieving a transition to the global price cap, which has considerable advantages summarized by Laffont and Tirole (1996, p254) as “A global price cap
11 The idea seems to have originated over twenty years ago in Willig (1979).
_____________________________________________________________________________ Engineering Staff College of India Page No.2.11
restricts increases in both access prices and final prices and induces the [regulated firm] to price discriminate very much the way an unregulated firm would do, except that the entire price structure is brought down by the cap.” 2.3.20 While significant progress in the theory of access pricing has been made, a considerable amount of further development is required particularly if it is going to contribute to the practical policy debate, which is the subject of the next section. Interest continues in access pricing as illustrated by Armstrong’s (forthcoming) tour de force on access pricing and interconnection. Many problems remain, some of which are addressed by Armstrong, including two way interconnection – an important problem for Internet service providers. Other issues include structural separation of access from the rest of the business and divestiture of access monopolies. Finally, access pricing is part of a much larger problem of the role and obligations of incumbent network industries under deregulation to which we will now turn briefly. 2.3.21 Microeconomic theory over the last twenty years has supported deregulation. However, it has done so in a piecemeal fashion. Consideration of the impact of entry on the obligations of incumbents has left much to be desired. Incumbents have as regulated monopolists faced universal service obligations (USO), default service provider obligations and have been the vehicle for the propagation of many subsidies. While the understanding of the nature of such obligations has been the subject of considerable study, for example, the USO in the postal sector as illustrated in Crew and Kleindorfer (1999,2001a, 2001b), the bigger picture of the impact and nature of deregulation is still undeveloped as will be illustrated in the next section. For example, a major problem exists in linking notions of access pricing to the problem of funding universal or default service obligations. 2.3.22 Addressing the default service obligation is arguably one of the most difficult problems faced in regulatory economics.13 A price cap for a distribution utility with a default service obligation creates a certain dissonance. Is the energy purchased treated as a simple pass through with this component of the bill varying with the purchases in the spot market? Or is the distribution utility required to line up long-term contracts to provide guaranteed prices? In either case the default service provider is on to a losing proposition. If it insists on only making purchases in the spot or short-term market and is allowed a straight pass through the value to consumers of the default service obligation is minimal since they are absorbing all the risks. If the distribution company sets up long term contracts to guarantee prices then if prices fall it loses customers and is stuck with high priced long term contracts, which will prove costly to it under a price cap. 2.3.23 Competition in such markets is very difficult to achieve when distortions like the default service obligation are included. The problem is not well understood and awaits a workable solution. Marginal Cost Development
12 The term is an excellent one. Crew and Kleindorfer (1994) proposed the same basic idea but unfortunately not the term. Laffont and Tirole (1994) first floated the idea. 13 We argue below that this is at the heart of the California electricity crisis. This is a current problem. A long-standing problem of arguably equal importance is the problem of auto insurance in New Jersey, which originated over twenty years ago and shows little sign of being resolved. See Worrall (2001).
_____________________________________________________________________________ Engineering Staff College of India Page No.2.12
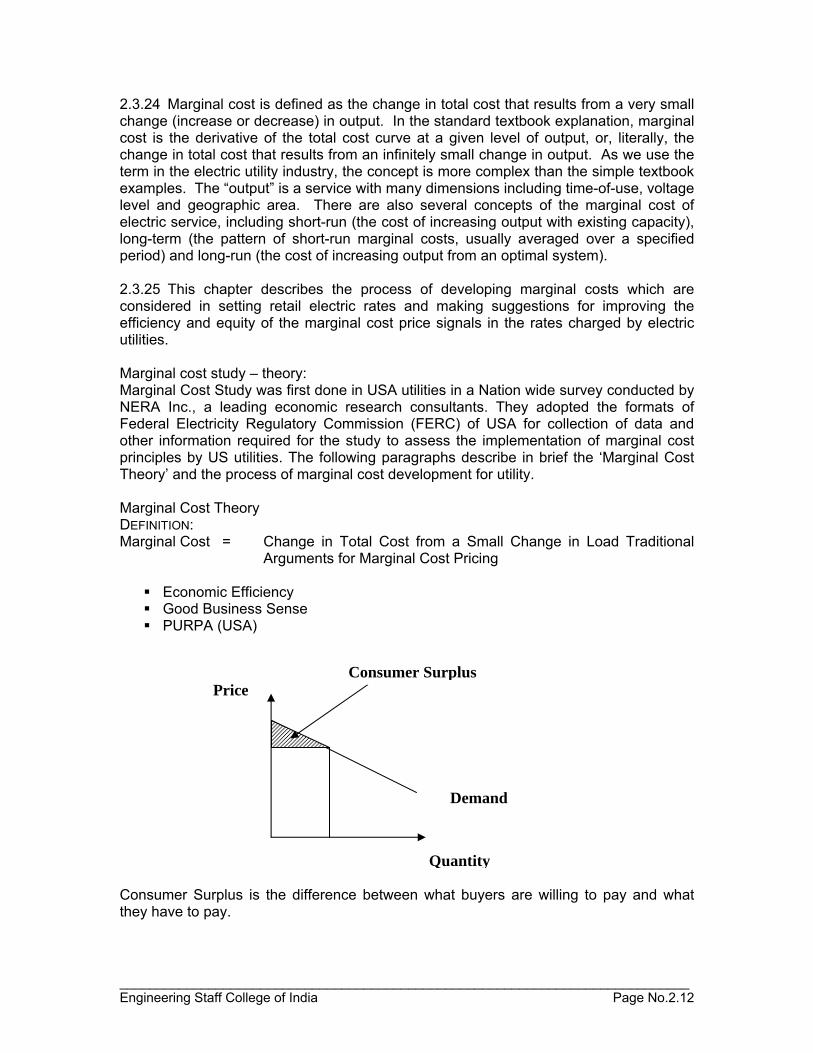
2.3.24 Marginal cost is defined as the change in total cost that results from a very small change (increase or decrease) in output. In the standard textbook explanation, marginal cost is the derivative of the total cost curve at a given level of output, or, literally, the change in total cost that results from an infinitely small change in output. As we use the term in the electric utility industry, the concept is more complex than the simple textbook examples. The “output” is a service with many dimensions including time-of-use, voltage level and geographic area. There are also several concepts of the marginal cost of electric service, including short-run (the cost of increasing output with existing capacity), long-term (the pattern of short-run marginal costs, usually averaged over a specified period) and long-run (the cost of increasing output from an optimal system). 2.3.25 This chapter describes the process of developing marginal costs which are considered in setting retail electric rates and making suggestions for improving the efficiency and equity of the marginal cost price signals in the rates charged by electric utilities. Marginal cost study – theory: Marginal Cost Study was first done in USA utilities in a Nation wide survey conducted by NERA Inc., a leading economic research consultants. They adopted the formats of Federal Electricity Regulatory Commission (FERC) of USA for collection of data and other information required for the study to assess the implementation of marginal cost principles by US utilities. The following paragraphs describe in brief the ‘Marginal Cost Theory’ and the process of marginal cost development for utility. Marginal Cost Theory DEFINITION: Marginal Cost = Change in Total Cost from a Small Change in Load Traditional
Arguments for Marginal Cost Pricing
Economic Efficiency Good Business Sense PURPA (USA)
Consumer Surplus is the difference between what buyers are willing to pay and what they have to pay.
Consumer Surplus
Demand
Quantity
Price
_____________________________________________________________________________ Engineering Staff College of India Page No.2.13
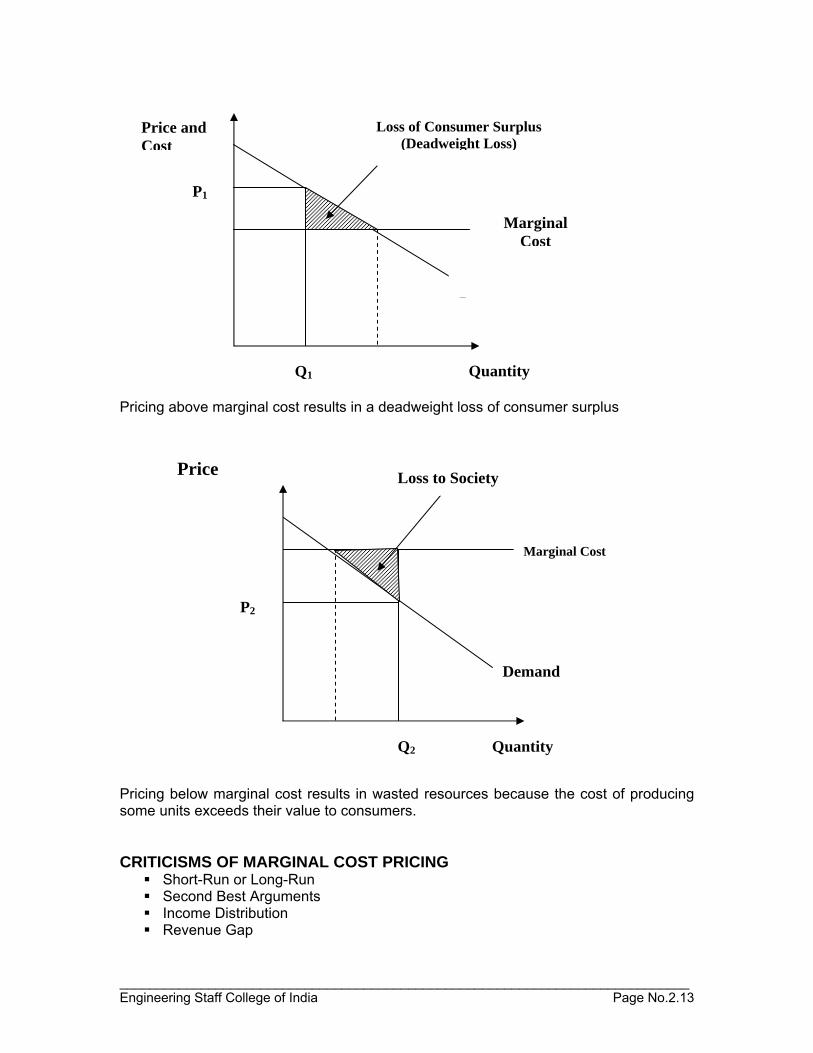
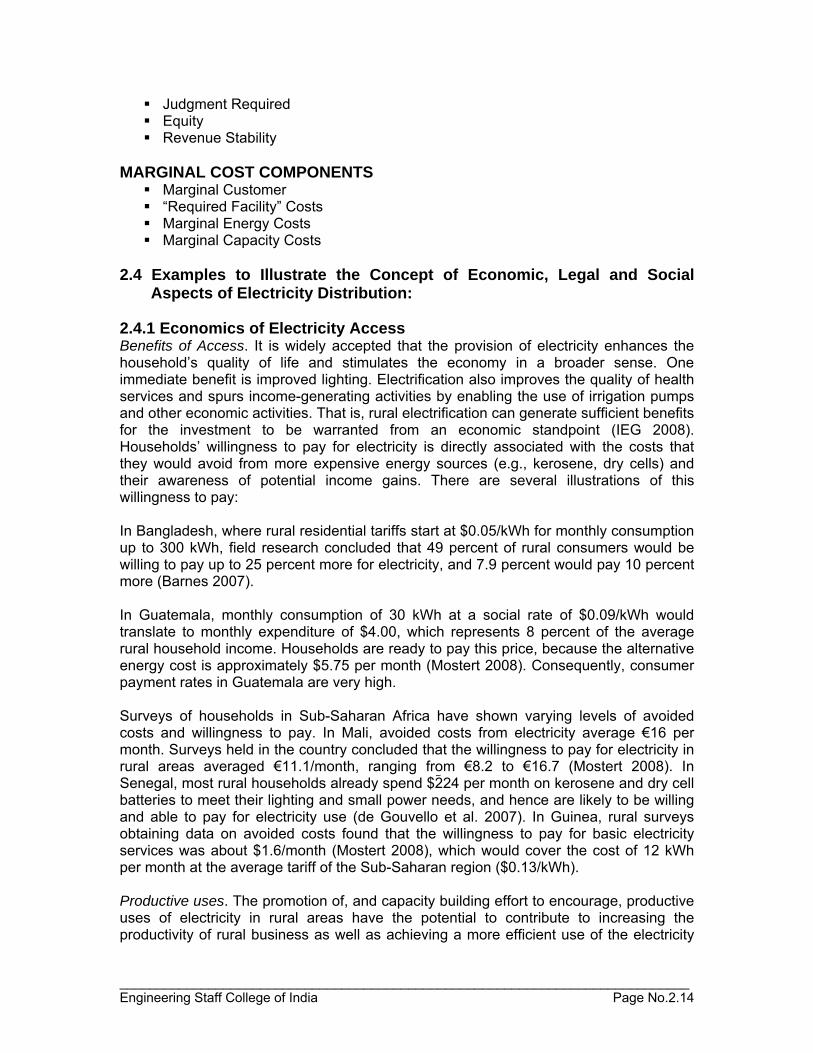
Pricing above marginal cost results in a deadweight loss of consumer surplus Pricing below marginal cost results in wasted resources because the cost of producing some units exceeds their value to consumers. CRITICISMS OF MARGINAL COST PRICING
Short-Run or Long-Run Second Best Arguments Income Distribution Revenue Gap
Loss of Consumer Surplus (Deadweight Loss)
Marginal Cost
D
Q1 Quantity
Price and Cost
P1
Loss to Society
Marginal Cost
Demand
Quantity Q2
P2
Price
_____________________________________________________________________________ Engineering Staff College of India Page No.2.14
Judgment Required Equity Revenue Stability
MARGINAL COST COMPONENTS
Marginal Customer “Required Facility” Costs Marginal Energy Costs Marginal Capacity Costs
2.4 Examples to Illustrate the Concept of Economic, Legal and Social Aspects of Electricity Distribution: 2.4.1 Economics of Electricity Access Benefits of Access. It is widely accepted that the provision of electricity enhances the household’s quality of life and stimulates the economy in a broader sense. One immediate benefit is improved lighting. Electrification also improves the quality of health services and spurs income-generating activities by enabling the use of irrigation pumps and other economic activities. That is, rural electrification can generate sufficient benefits for the investment to be warranted from an economic standpoint (IEG 2008). Households’ willingness to pay for electricity is directly associated with the costs that they would avoid from more expensive energy sources (e.g., kerosene, dry cells) and their awareness of potential income gains. There are several illustrations of this willingness to pay: In Bangladesh, where rural residential tariffs start at $0.05/kWh for monthly consumption up to 300 kWh, field research concluded that 49 percent of rural consumers would be willing to pay up to 25 percent more for electricity, and 7.9 percent would pay 10 percent more (Barnes 2007). In Guatemala, monthly consumption of 30 kWh at a social rate of $0.09/kWh would translate to monthly expenditure of $4.00, which represents 8 percent of the average rural household income. Households are ready to pay this price, because the alternative energy cost is approximately $5.75 per month (Mostert 2008). Consequently, consumer payment rates in Guatemala are very high. Surveys of households in Sub-Saharan Africa have shown varying levels of avoided costs and willingness to pay. In Mali, avoided costs from electricity average €16 per month. Surveys held in the country concluded that the willingness to pay for electricity in rural areas averaged €11.1/month, ranging from €8.2 to €16.7 (Mostert 2008). In Senegal, most rural households already spend $2 24 per month on kerosene and dry cell batteries to meet their lighting and small power needs, and hence are likely to be willing and able to pay for electricity use (de Gouvello et al. 2007). In Guinea, rural surveys obtaining data on avoided costs found that the willingness to pay for basic electricity services was about $1.6/month (Mostert 2008), which would cover the cost of 12 kWh per month at the average tariff of the Sub-Saharan region ($0.13/kWh). Productive uses. The promotion of, and capacity building effort to encourage, productive uses of electricity in rural areas have the potential to contribute to increasing the productivity of rural business as well as achieving a more efficient use of the electricity

_____________________________________________________________________________ Engineering Staff College of India Page No.2.15
supply infrastructure and improving the revenues of distribution companies, thereby enhancing the economics of electrification. There are, however, two important barriers to the productive use of electricity: the lack of technical knowledge and skills of potential users and the financial means to acquire relevant equipment (ESMAP 2008). In Bangladesh, the potential for productive uses by cooperatives is a key factor in increasing their revenues and meeting the requirements to qualify for electrification. Cooperatives are therefore encouraged to engage in productive uses and do so particularly in agriculture (e.g., rice mills, tube-wells). In Thailand, the Provincial Electricity Authority (PEA) was successful in promoting replacement of diesel motors with electric motors, mostly for rice mills, in villages with lower-than-expected consumption of electricity. To this end, the PEA facilitated financing for villages to purchase electric motors and other equipment. The importance of incorporating financing for productive uses into the rural electrification program was evident in Chile; absent such a financing mechanism, the economic impact of electrification was sometimes limited (Barnes 2007). Incorporating economic efficiency into the process. There are two ways of incorporating efficiency into the electrification effort: (1) establishing an effective planning process that identifies the country’s needs and electrification opportunities, taking into account the financial viability of investments and their economic impact on the region, and that establishes rational and transparent criteria for the selection and prioritization of projects; and (2) minimizing construction and operating costs. Transparent planning focused on cost-effectiveness. The cost of providing electricity to rural households is usually high, even among the best planned rural electrification programs. A transparent planning process with clear criteria designed to balance cost savings with equity considerations offers two advantages: (1) a cost-effective program and a set of rules for the selection of projects aimed at ensuring the economic and financial viability of electrification effort, and (2) protection from political interference. Failure to adopt such a process may render an electrification program unsustainable, require higher subsidies and, consequently, place undue pressure on public finances. Planning is a public role that should be led by a capable, and usually centralized, government entity. Common features of successful planning of rural electrification include (1) a clearly established system to prioritize the areas to receive electricity and the projects to be selected, (2) a long-term, multi-year vision that coordinates the extension of the grid and off-grid efforts and takes into account the manufacturing capacity of the country, and (3) a broad regional development approach that takes into account other conditions for sustainable rural development (access to education and health services, an adequate transport system, agricultural potential, access to markets). Some examples of useful experience in rural electrification planning and project selection are given below: o Thailand offers a good case of central planning for rural electrification. The PEA prepared a national plan that was sufficiently detailed to serve as a blueprint for the
_____________________________________________________________________________ Engineering Staff College of India Page No.2.16
government, the PEA, and officials responsible. The plan included guidelines and the criteria for the selection of villages to electrify, organizational requirements, etc. Since this plan was incorporated into Thailand’s Five-Year National Economic and Social Development Plan, it protected the PEA from political interference (mainly through objective selection that was formalized in this manner). While regions were selected on the basis of their level of underdevelopment and political instability, villages were selected based on economic criteria. Key factors in village selection were proximity to the grid and roads, the size of the village and the expected number of customers, potential for productive uses, the number of public infrastructure facilities, and the village’s willingness to contribute to construction costs (Barnes 2007). o One of the main characteristics of the success of the rural electrification program in Bangladesh is its centralized planning. From the outset, the REB established a clearly defined master planning process that prioritized system investment according to revenue generation. This model was used universally. The program benefited also from sustained and consistent technical assistance since its beginning and the long-term commitment of the government (Barnes 2007). o In Tunisia, the country’s regional planning processes and successive five-year plans incorporated rural electrification into broader integrated rural development objectives, producing synergistic effects. Indeed, growth in rural electrification and national socioeconomic indicators are strongly correlated. Rural electrification involved rigorous centralized planning with major regional and sub-regional inputs and initiatives. The selection criteria for rural development projects had multiple components, including income levels, unemployment, environmental quality, gender status, expected returns, and costs per job created (Barnes 2007). In practice, these criteria were complemented by incentives provided to the utility Société Tunisienne de l’Electricité et du Gaz (STEG, Tunisian Electricity and Gas Company) to select at an early stage those projects that generated more revenues (through a ceiling on the subsidy level). o The selection criteria for projects in Chile and Peru included minimization of unit costs and subsidies. This mechanism has helped reduce costs and draw contributions from local investors and communities, enabling the central government to reach an additional 30 percent of rural households using the same resources. o Good coordination between grid extension off-grid electrification is essential to avoid duplication or sub-optimal investments. Establishing criteria for comparative assessment should be part of the planning effort. Some countries have chosen practical rules of thumb to do so. For example, in Morocco, the Office National de l’Electricité (National Electricity Office) uses a cut-off cost of €2,500 per (medium- and low-voltage) household connection to choose off-grid in the place of grid extension. In Burkina Faso, the grid is extended to communities located within 50–60 kilometers from the nearest 33-kilovolt line. Ethiopia also uses a similar minimum distance criterion (Mostert 2008). Reducing costs. In many cases, careful attention to system design can enable construction costs to be reduced by up to 20–30 percent (ESMAP 2000), contributing significantly to the pace and scope of electrification programs. If electricity use is likely to be limited—for lights and small appliances, a pattern common in rural areas—there is no justification for applying the same standards as those for high-consumption urban areas. Many countries have been successful in reducing construction costs using technical
_____________________________________________________________________________ Engineering Staff College of India Page No.2.17
standards adapted to rural/low demand patterns, frequently adopting low-cost single-phase distribution systems (typically single-wire earth return, or SWER), centralized procurement processes, and/or incorporating incentives for cost reduction into open and transparent bidding. Three examples are given: o Guinea appears to be the champion of low costs. The country has adopted a radical policy that aims at maximizing the number of connections for a given amount of financial resources (Mostert 2007). Following this policy, they are achieving extremely low costs per connection in mini-grids based on diesel generation: €130 180, including all costs. While this practice implies a very short-term view that appears to be delaying the development of off-grid renewable options (which cost four to five times more per connection) and casts questions on the sustainability of the approach, it is interesting to see how far this cost-reduction strategy will go. The main aspects of the low-cost strategy of the Bureau d’Electrification Rurale Décentralisée (Office of Decentralized Rural Electrification) are (1) meeting basic needs by operating diesel grids only 4 hours a day, although longer hours of operation can be provided if there are customers using electricity for production; (2) always choosing the lowest-cost technical solution, e.g., not including meters or load limiters, cheap wooden poles even if they do not last long; (3) cost-shared training to all actors in the supply chain (consultants, construction companies, project developers); (4) monitoring prices of goods and services; (5) centralized equipment purchase; (6) keeping transaction costs low through built-in coordination of procedures; and (7) monitoring the quality of financed work and equipment. o In Thailand, the PEA followed a comprehensive strategy to reduce costs that included (1) system standardization, including technical, equipment, and other components; (2) standardization of all equipment and components used for construction of distribution systems, including a centralized procurement process and bulk purchases; (3) reliance on locally manufactured materials, which were often cheaper than imported materials; and (4) a strategy to promote electricity use that included credit lines to cover connections and wiring costs and a campaign for productive uses (Barnes 2007). o In Tunisia, STEG has fostered a cost-cutting culture that has been maintained through three decades with innovative technical options. The MALT (mise a la terre, grounding) system, a predecessor of SWER, permitted a cost reduction of 1824 percent. This was not without difficulties because, being a new technology, it faced resistance from engineers more familiar with traditional system designs. The utility monitored the process closely and solved problems as they were encountered. SWER was adopted after a few years, reducing costs even further (Barnes 2007). Another factor that helped reduce costs in Tunisia was the participation of local manufacturing industry that was supported by a specific business development program. 2.4.2 EFFECTS OF TARIFFS IN RURAL AREAS 2.4.2.1 Consumption of electricity in Rural Uganda The study was extended to rural locations with electricity so as to analyze the effects of electricity tariffs on rural areas, and the ability of rural consumers to pay. Although over 80% of the total population of Uganda resides in rural areas, only 2% of rural households have access to electricity. Nationally, less than 4.5% of the population of 24 million is connected to the power grid system.
_____________________________________________________________________________ Engineering Staff College of India Page No.2.18
2.4.2.2 Willingness to Pay Tariffs in Rural Areas In this study rural consumers were mainly those served by WENRECO, although the study covered also a big number of rural consumers in Masaka who constitute 60% of the total consumers in the district (UEDCL District Manager, Masaka). Regarding willingness to pay for electricity if tariffs increased by 15% percent, majority (70%) expressed willingness. It has to be noted, however, that this willingness was qualified in terms of having an improved service delivery. Thus, the high willingness to pay (the average maximum of all respondents) could emanate from two possible explanations. First, the costs rural consumers incur due to poor/unreliable electricity supply weigh more than the contribution (15% increment in electricity tariffs) the consumer would make to have electricity supply improved or installed. Second, in comparing the costs of acceptance to have improved electricity supply to the value of alternative energy sources, it is possible that the value (cost) of alternative sources of energy is more than the costs incurred for improved electricity supply10. This has two implications: first, electricity could be a big necessity for rural consumers especially commercial ones and second, rural consumers encounter difficulties to substitute certain services provided by electricity. 2.4.2.3 Affordability to Pay for Power in Rural Areas Despite the fact that many people in the rural areas are willing to pay for improved electricity supply; initial costs to have power installed affect the budgetary outlays of most domestic consumers. Cases were cited in Masaka and Mbarara where power lines had been extended to peri-urban areas and rural areas near town in the last two years, but people were failing to meet the initial costs of getting connected, and yet accordingly had made appeals to political leaders that they needed electricity. The policy implication here is that as the country embarks on the policy of rural electrification big subsidies will have to be provided to aid the potential rural consumers meet the initial costs of installation, without which this could hamper efforts of rural electrification. However, through the Rural Electrification Program (a ten year program funded by the World Bank) where subsidies are channeled towards the capital investment, it will attract more rural consumers getting connected (Commissioner, Energy). In the current situation, what is emerging out in this study is that increases in tariffs in rural areas are affecting small enterprise than the domestic consumer as one informant observed. These depend on the nature of the economic activity a rural household is involved in. For example, among others, grinding mill projects, welding activities, and recreation facilities. For small scale, mainly rural enterprises, government has to find a mechanism of supporting them; they have not reached break-even point to sustain the costs on their own from the market (Executive Director, UMA) For the domestic consumers, tariffs have no impact on their welfare and seem not to be much of their concern, (the effects are minimal on consumers welfare). The major issue, therefore, is not of high tariffs, but rather of improved electricity supply. A case of WENRECO below succinctly puts the picture in perspective.
_____________________________________________________________________________ Engineering Staff College of India Page No.2.19
2.5 CASE STUDIES: 2.5.1 Case Study of Rural Electrification: WENRECO On 1st April 2003, WENRECO took over UEDCL operations in Arua district. This was at a time when power supply operations were in a poor state as the generator sets were due for servicing and were frequently breaking down. Load shedding was rampant and large areas of Arua did not have electrical power. There are four synchronised generator sets of total capacity 1.23MW. However their output is less due to inefficiency. A new generator was being installed at the time of this study. The new generator has a capacity of 1.5MW. Currently power is switched on from 7.30p.m. to 10.30p.m. Previously power was switched on from 7p.m. to 11p.m. Duration of power supply has been reduced because of insufficient fuel. According to the Operations Manager, the network is not characterized by many faults, however power outages are attributed to storms during the rainy season. Power reliability could not be quantified using reliability indices, as was the case for the other districts selected due to insufficient power outage data. Load shedding is currently carried out once a week, which was reported to an improvement as it used to be more frequent in the past. On taking over the Arua operations, WENRECO mapped the area and located areas that require electricity. There are currently about 400 applicants wishing to be connected to the electricity grid. However new connections cannot be effected until the new generator set is up and running. The billing process in Arua has not been streamlined. When the company began operations, it instituted billing software that crushed within 3 months of operation. Currently another billing software is under test, which started in March 2004. There were numerous billing complaints when the previous software was in use. Major complaints were that bills were wrong and payments were not posted. Consumers in Arua like in other places often encounter difficulties to pay especially when the bills accumulate. At the time of this study, WENRECO had disconnected 10 – 20% of consumers that had failed to pay. Institutions such as the Prisons, UPDF and the Police were reported to be the biggest power defaulters, and yet it is difficult to disconnect them. The Police, for instance, at the time of this study had not paid its electricity bill since WENRECO took over operations in April 2003. WENRECO charges the same tariffs as UEDCL, but accordingly incurs heavy expenses on operations and maintenance. On average, domestic consumers pay between Ug. shs 1,900- 12,000 per month, which in total is inadequate to cover the operation and overhead costs. The Operations Manager estimated that they were spending about Ug. shs 45,000,000 on fuel per month, while the monthly collections were about Ug.shs 12,000,000. 4 Chapter 433 of the Laws of Zambia.
_____________________________________________________________________________ Engineering Staff College of India Page No.2.20
2.5.2 CASE STUDIES ON THE TARIFF REVIEW PROCESS-COST REFLECTIVE TARIFFS 2.5.2.1 Zambia As a country which has recently undergone a tariff review process, Zambia provides a timely example of the review process in practice, with both the challenges and the lessons which the process presents. Background The legal basis and process for the electricity tariff review was established by Section 8 of the Electricity Act.4 The Law states that if the utility requires a change in the electricity tariff, it must give notice to consumers of its intention to increase prices. If consumers do not formally object with a statutory comment period of 30 days from the day of notice by the utility, the utility may put its proposed increases into effect. Should the consumer submit an objection, the Energy Regulation Board (ERB) is required to intervene and review the proposed made by the utility. However, the ERB may also intervene without a consumer submission should the regulator deem such an intervention appropriate. Should ERB find that the increase request has not been substantiated, it has the legal power to deny the request or alter the terms proposed by the utility.
5 Zambia’s state-owned electric utility.
Process On March 2, 2009, ZESCO Limited (ZESCO)5 applied for an electricity tariff adjustment, citing the following adverse conditions impacting its operations:
• Rising local inflation; • Depreciation of the Kwacha (adverse due to a mismatch between Kwacha-
denominated revenues (50%) and foreign-currency costs of equipment and debt service;
• The need for new generating capacity driven by high rates recent and projected economic growth;
• Rising interest rates; and, • Increases in costs of generation, transmission and supply driven mainly by
increased prices of electrical equipment, spares, machinery, and imports of electricity.
The tariff increase application was filed with the ERB and a notice of the proposed increase was disseminated to the public by ZESCO in March 2009. ERB, in turn, published a Consultation Paper summarizing ZESCO’s application and publicizing guidelines for stakeholder comments and input submissions.
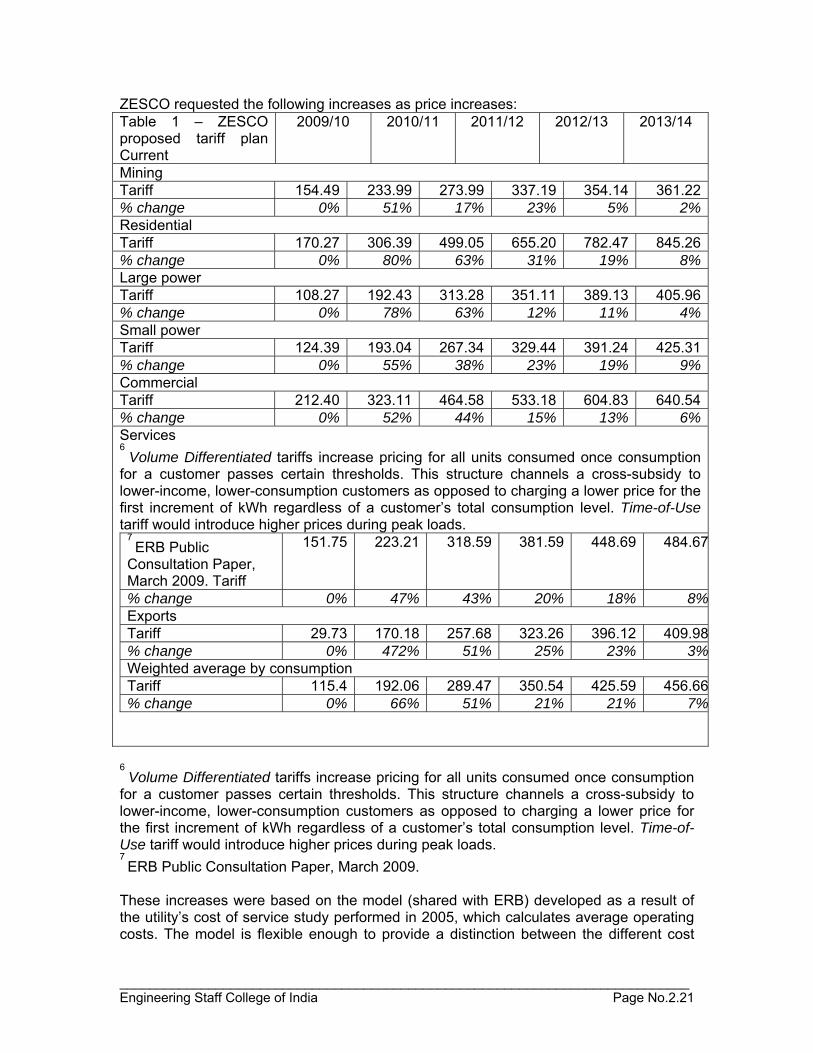
_____________________________________________________________________________ Engineering Staff College of India Page No.2.21
ZESCO requested the following increases as price increases: Table 1 – ZESCO proposed tariff plan Current
2009/10 2010/11 2011/12 2012/13 2013/14
Mining Tariff 154.49 233.99 273.99 337.19 354.14 361.22 % change 0% 51% 17% 23% 5% 2% Residential Tariff 170.27 306.39 499.05 655.20 782.47 845.26 % change 0% 80% 63% 31% 19% 8% Large power Tariff 108.27 192.43 313.28 351.11 389.13 405.96 % change 0% 78% 63% 12% 11% 4% Small power Tariff 124.39 193.04 267.34 329.44 391.24 425.31 % change 0% 55% 38% 23% 19% 9% Commercial Tariff 212.40 323.11 464.58 533.18 604.83 640.54 % change 0% 52% 44% 15% 13% 6% Services 6
Volume Differentiated tariffs increase pricing for all units consumed once consumption for a customer passes certain thresholds. This structure channels a cross-subsidy to lower-income, lower-consumption customers as opposed to charging a lower price for the first increment of kWh regardless of a customer’s total consumption level. Time-of-Use tariff would introduce higher prices during peak loads.
7 ERB Public
Consultation Paper, March 2009. Tariff
151.75 223.21 318.59 381.59 448.69 484.67
% change 0% 47% 43% 20% 18% 8%Exports Tariff 29.73 170.18 257.68 323.26 396.12 409.98% change 0% 472% 51% 25% 23% 3%Weighted average by consumption Tariff 115.4 192.06 289.47 350.54 425.59 456.66% change 0% 66% 51% 21% 21% 7%
6
Volume Differentiated tariffs increase pricing for all units consumed once consumption for a customer passes certain thresholds. This structure channels a cross-subsidy to lower-income, lower-consumption customers as opposed to charging a lower price for the first increment of kWh regardless of a customer’s total consumption level. Time-of-Use tariff would introduce higher prices during peak loads. 7 ERB Public Consultation Paper, March 2009.
These increases were based on the model (shared with ERB) developed as a result of the utility’s cost of service study performed in 2005, which calculates average operating costs. The model is flexible enough to provide a distinction between the different cost
_____________________________________________________________________________ Engineering Staff College of India Page No.2.22
components of the electricity value chain. Consequently, generation, transmission, and distribution tariffs can be calculated, with overhead allocated to customer groups based upon use of services. The formula used for allocation has been agreed with the ERB. The model does, however, have some limitations. It cannot distinguish costs by voltage, which renders it unable to provide full insight into the true cost of service for each class of consumer (and, consequently, into the degree of cross-subsidization). In addition to the tariff increase, ZESCO also proposed a change in the structure of the tariff. The proposal would convert the current Inverted Block Tariff into a Volume Differentiated Tariff for residential customers and a Time-of-Use tariff for all maximum demand (industrial) customers.6 While the Consultation Paper was directed at customers, all stakeholders were invited to comment within 30 days of its publication. Any comments could be submitted to the ERB Executive Director via post, facsimile or email. Stakeholders who submitted written comments were invited to Public Meetings held by the ERB, where such individuals/organizations had an opportunity to address the ERB either in person or through a legal representative. For the present tariff review, comments were received from 69 separate customers in Lusaka and the Copper Belt. In order to make public hearings accessible, ERB held these meetings in both Lusaka and Kitwe. Following public consultations ERB analyst staff performed independent analysis of the request, taking into account the main guiding principles established by the regulator based on the New Energy Policy7:
• Recovery of prudently incurred costs by the utility; • Used and useful utility assets (for the calculation of the asset base); • Assurances of financial sustainability of the utility; • Urgency of migrating to cost reflective tariffs (policy calls for cost-reflectivity by
2011); • Delivery of quality service; and • Social considerations for the indigent customers.
On July 20, 2009, ERB announced its decision on the tariff application. The regulator did not entertain ZESCO’s request for a five-year tariff increase path. Instead, following the existing three-year framework which had gone into effect in January 2008, ERB only considered the utility’s request through March 2011. The following increases were granted by the ERB: ERB approved tariff path
2009/10 2010/11 Requested by ZESCO 66% 51% Granted by ERB 35% 26% The ERB further denied ZESCO’s request to change the tariff structure. With regard to Volume-Differentiated pricing, ERB requested that ZESCO demonstrate that a metering regime capable of handling such a structure has been instituted. With regard to Time-of-Use pricing, ERB requested that it should be voluntary until such time when ZESCO has conducted a feasibility study on its implementation. Furthermore, ERB ordered that the
_____________________________________________________________________________ Engineering Staff College of India Page No.2.23
current preferential staff tariff be abolished by August 1, 2009, with all staff migrating to the ordinary residential tariffs. ERB further reiterated that any further rate increases (within the context of a new rate framework, to be developed after 2011) will be contingent upon ZESCO’s achievement of Key Performance Indicators. At present, the only recourse the utility in any disagreement with the regulator’s decision is an appeal to the ERB, which is unlikely to change the outcome of the regulatory decision. Context The ERB has criticized ZESCO for inefficiency, given its bloated cost structure. According to ZESCO, its costs are driven up by the fact that collections efforts are hampered by cultural factors (particularly feelings of entitlement to electricity services among customers dating back to the pre-1990’s socialist mindset), inability to disconnect customers for non-payment (due to political pressure), and lack of permanent housing in connected rural communities (which prevents effective metering). Furthermore, a large portion of ZESCO’s revenue base (50%) consists of mining customers, which are not subject to regulated tariffs due to previously signed PPAs. This reduces the customer base bearing price increases, necessitating cross-subsidization from other sectors to cover costs. In addition, it appears that the rate increases originally granted by the ERB were higher than those recently announced - there is strong suspicion that the regulator was influenced to reduce the increase due to political pressure. Since the ERB is appointed by the Minister of Energy, who also has the power to dissolve the ERB Executive Board, the regulator is not truly independent. As such, it is vulnerable to political pressure. The current tariffs are unlikely to achieve cost reflectivity by 2011 as envisaged by the New Energy Policy. 2.5.2.2 Namibia Namibia’s Electricity Supply Industry The dominant player in Namibia’s ESI industry is NamPower, the vertically-integrated state-owned utility, which currently holds a monopoly on generation and transmission (although negotiations are underway on several IPP tenders, and legislation allows for IPP participation). It is also partially involved in distribution, although as part of electricity industry restructuring, most distribution is conducted by Regional Electricity Distributors (REDs), which purchase electricity from NamPower. Table 2 – Namibia ESI Structure NamPower’s generation asset portfolio consists of:
• Ruacana (hydro, 240 MW) • Van Eck (coal, 120 MW) • Paratus (diesel, 20 MW)
Due to the age of the plants, the listed capacities above cannot be achieved (particularly at Van Eck) and NamPower imports more than 50% of its load from South Africa,
_____________________________________________________________________________ Engineering Staff College of India Page No.2.24
Mozambique and Zimbabwe. Both Ruacana and Paratus can be run as peaking plants. NamPower also owns and operates the transmission system. As indicated above, distribution will be performed by REDs, legal entities tasked with the supply and distribution of electricity in a dedicated region, combining the electricity distribution departments of the Local Authorities, Regional Councils and GENERATION –NAMPOWERTRANSMISSION -NAMPOWERDISTRIBUTION –REGIONAL REDSNOREDCENORERONGOCENTRALSOUTHERNGENERATION REDSNOREDCENORERONGOCENTRALSOUTHERNDISTRIBUTION REDSNOREDCENORERONGOCENTRALSOUTHERN 8 Electricity Act (2007), Section 3.1.
9 ECB presentation by Francois Robinson, August 25, 2009.
NamPower. REDs will be owned jointly by NamPower and the relevant municipal, regional, and local authorities. Background Namibia’s regulator, the Electricity Control Board (ECB) was established by the Electricity Act (2000). The Electricity Act was updated in 2007 and currently states that the responsibilities of the ECB include:
• To exercise control over and regulate the provision, use and consumption of
electricity in Namibia; • To oversee the efficient functioning and development of the electricity industry
and security of electricity provision; • To ensure the efficient provision of electricity; • To ensure a competitive environment in the electricity industry in Namibia with
such restrictions as may be necessary for the security of electricity provision and other public interest; and,
• To promote private sector investment in the electricity industry.8 As part of its mandate, the ECB has sole jurisdiction over the approval of electricity tariffs and the determination of tariff calculation methodology across all sectors of the industry, including generation, transmission and distribution. Government policy has set out principles which guide ECB’s approach to tariff regulation, including:
• Cost reflectivity; • Reflection of the long-run marginal cost of supply; • Creation of a level playing field for all ESI participants; and • Grounding in sound economic principles9.
Under the auspices of the ECB, a national tariff study was conducted in 2001, which recommended suitable methodologies for tariff calculations for each section of the ESI. Based on the tariff study, the ECB implemented recommended tariff calculation methodologies and developed a specific reporting tool for tariff increase applications, the Operating and Reporting Guideline (ORM). Concurrently with the implementation of new tariff methodology (2003), the ESI in Namibia was restructured, organizing the numerous municipal distribution utilities into larger regional REDs. The ECB assisted Local
_____________________________________________________________________________ Engineering Staff College of India Page No.2.25
Authorities (LA) and Regional Councils (RC) with ring fencing of their electricity operations and trained the relevant personnel in the use of the ORM. ECB also established a procedure for tariff increase applications, which can be considered once per year, coinciding with NamPower’s financial year end. On March 4, 2009, NamPower applied to the Electricity Control Board for the annual increase in its tariffs, requesting an overall average increase of 18%. The tariff increase request was motivated by several factors:
• Substantial increases in the costs of electricity imports as a result of the power
shortage in the region and unfavorable arrangements with Eskom; • Increases in costs of operating the Van Eck and Paratus power stations due to
higher prices of fuel; • Need for investment in generation and transmission in Namibia in light of growing
demand for electricity driven by economic growth and new mining projects; and • Need to keep NamPower’s debt service coverage ratio above 1.5x as part of the
agreement with a group of international lenders; NamPower’s credit rating is currently investment grade, and breach of debt covenants would affect the rating negatively.
Tariff Methodology As mentioned above, tariffs are calculated separately for the three sectors of the ESI. For the generation sector of the ESI value chain, tariffs are calculated using the import parity method, priced at the cost of firm power under the agreement between NamPower and Eskom. This methodology has been in place since 2003, and was instituted as a result of the fact that most of Namibia’s power at the time was being obtained from South Africa. As such, the price of Eskom firm power represented actual costs if NamPower was buying from Eskom or avoided cost if NamPower was running its own peaking plants. Recently, ECB has been pressing for a change in methodology for generation tariffs to the RORR (or cost plus) method. The regulator cites as reasons the lack of firm power from Eskom in the current energy environment (thus firm power no longer makes sense as a benchmark for import parity), significantly lower costs of own generation (particularly from hydro at Ruacana), and the appropriateness of the cost plus method for the goal of achieving cost reflectivity. Furthermore, in pressing for a change in methodology, the ECB is trying to avoid pegging the Namibian electricity prices to those of South Africa. Nam Power has been reluctant to institute the RORR method for generation, citing highly volatile nature of import costs in light of lack of firm power, foreign-currency denominated PPAs (and the resulting exposure to foreign exchange fluctuations), and volatility of fuel costs (coal in particular which must be shipped in from South Africa). NamPower’s unwillingness to move to the RORR methodology is one of the reasons cited by the ECB for not granting the utility a full requested 18% increase during the current year’s tariff review process. Transmission tariffs are calculated using cost plus methodology, where the revenue requirement is determined using:
_____________________________________________________________________________ Engineering Staff College of India Page No.2.26
• Generator/import costs; • Operations and Maintenance (O&M) costs; • Losses (up to a maximum allowed of 10%); • Administration costs; • Costs of the trader; • Depreciation of assets; • Asset base x rate of return (at calculated cost of capital); and • Less wheeling charges or any other income.
The regulatory asset base used for RORR calculations is determined using a replacement cost methodology, and the rate of return is equal to the transmission provider’s cost of capital on the transmission assets. Inputs for the determination of the cost of capital, such as the equity beta, market risk premium, expected inflation, and the appropriate risk-free rate are provided to the regulator by the National Planning Commission. Distribution tariffs are calculated using RORR methodology. Components of the revenue requirement under this method include:
• Energy purchase; • O&M costs; • Customer services costs; • Overhead costs; • Depreciation (calculated as straight – line replacement cost/expected life); • Asset base x rate of return (at calculated cost of capital); • Cost of working capital; • Bad debt expense (capped at lower of 1.25% or last year’s figure); and • Less income from other sources.
As with the transmission tariff, the value of the asset base is determined annually (provided the distributor applies annually for a tariff increase), using replacement cost methodology. Replacement cost calculations are generated by a database tool developed specifically for the ECB, the Namibian Electrical Network Assets database (NENA). The tool has been rolled out to all distributors following extensive training in its use conducted by the ECB. The distributors’ databases are interconnected with the main consolidation tool which resides on the ECB servers, and market replacement values in the database are automatically updated every two years. The cost of capital is calculated using the WACC method, and the ECB is currently updating its framework for the calculation of the cost of capital for both distributors and generators. During the restructuring of the ESI, numerous municipal and local electricity distributors were requested by the ECB to consolidate their respective assets under a RED umbrella, and delegate the provision of electricity supply services to these organizations. In order to fairly compensate these local authorities and to assure that following restructuring, they will be no worse off financially, ECB allowed the institution of a Local Authority surcharge to retail customers. The surcharge typically consists of:
_____________________________________________________________________________ Engineering Staff College of India Page No.2.27
• An asset charge levied in order to compensate the local authority for any outstanding loan obligations related to electricity assets;
• A transitional service charge levied to compensate the local authority for any electricity-related expenses which cannot be stopped immediately following the formation of a RED; long term service agreements will eventually eliminate this charge; and,
• LA surcharge, used to ensure that the local authority’s profit does not decline post-restructuring and RED formation; this figure was calculated in 2004/2005 as the REDs were formed, and was inflated to 2005/2006 levels but has since remained constant.
Across all sectors of ESI, ECB calculates over/under recovery on an annual basis which is trued up in the following year. Cost reflectivity assessments and projections are also done on an annual basis, and targeted to meet the Cabinet decision that wholesale (i.e. generation) tariffs should be cost reflective by 2011/2012. The Tariff Review Process Under normal economic conditions, NamPower and other ESI participants can apply for a tariff increase annually; under emergency conditions, any of the participants can apply for an interim review. The application process begins with a submission by NamPower of an application in the form of an ORM, detailing its costs and any increases. The submission would involve prior input from the ECB on any imminent IPPs projected to come onboard or any other additions to the ESI system which would affect NamPower’s costs over the coming year. This blended cost is used by NamPower to calculate its revenue requirement for the upcoming year for the sectors covered by cost plus methodology. Generation tariff adjustment requests, as mentioned above, are calculated using the import parity method. Once the ECB receives NamPower’s official request, the regulator makes a public announcement of the application and the percentage increase requested by the utility. In addition to filing of the requisite paperwork, NamPower will typically make its case through a detailed presentation to the regulator. The requests are typically submitted in March, with any approved increases becoming effective as of the beginning of a new NamPower financial year on July 1. During the interim, distributors can prepare their requests for tariff increases taking into account the new tariffs likely to be charged by the utility. This is also a period during which ECB will entertain any stakeholder comments with regard to the proposed increases and take these into consideration as it analyzes the utility’s request. Although the regulator is not legally required to consult stakeholders prior to approving a tariff application, the ECB has made consumer welfare a key priority, and does hold a consultation process as a consequence. Typically, the ECB will have a number of discussions with the Consumer Association (advocate group representing retail electricity customers), NamPower’s large customers (e.g. industrial and mining), REDs and any other interested parties. The discussion typically involves the ECB presenting its views on the tariff increase case to the consumer interest groups or any other stakeholders. The consultation period has no legally or procedurally set timeframe, but for practical purposes must be completed in time for the regulator to issue a decision by the start of the new fiscal year for NamPower. Following the consultation period described above, the regulator issues its final decision on the tariff review in a public statement, allowing the utility to implement its price
_____________________________________________________________________________ Engineering Staff College of India Page No.2.28
increase. This year’s decision by the ECB allowed a 15% rather than the requested 18% increase. Reasons cited by the ECB for a reduced increase included difficult economic conditions, continued use of the import parity methodology for generation assets by NamPower, and issues of reliability of supply from NamPower raised by large consumers. Political Climate The 2009 tariff review and subsequent implementation of the increase in electricity prices highlighted the fact that the regulatory process is relatively free from political meddling. This is especially true in 2009 given the upcoming Parliamentary and Presidential elections scheduled for November. The Board of the ECB is appointed by the Minister of Mines and Energy, for a four year term. The Board typically rules on issues within its jurisdiction based on the recommendations of the Technical Secretariat of the ECB. While for some of the decisions of the ECB, such as the granting of licenses to IPPs, the Ministry will have the final stamp of approval, tariff reviews and rulings fall fully within the jurisdiction of the regulator and according to ECB, they have never been pressured to implement a certain pricing regime by the Ministry or any other stakeholder. Subsidies Namibia has no specific “pro-poor” tariffs in its electricity pricing structure. However, each individual distributor can and in most cases, does, cross-subsidize underprivileged consumers by levying a slightly higher set of prices on the other consumer categories (e.g. industry and commercial). These cross-subsidies are not always transparent. The ECB has examined subsidy elimination in the long term, and has come up with a pricing scheme that would reduce such subsidies. The pricing involves a three-part tariff including a fixed monthly charge (to cover costs of the electricity infrastructure assets), a variable energy usage charge, and a capacity charge (for small customers) or a demand charge (for large customers). The regulator is working with distributors toward the implementation of this tariff structure. Other than the above change, no specific path toward a full elimination of cross-subsidization has been developed. IPPs and Cost Reflectivity Currently, any IPP wishing to build generation capacity in Namibia must apply for a license. The application, which includes financial solvency and capacity metrics, technical background and experience metrics, is typically examined by the Technical Secretariat which makes a recommendation to the Board on whether or not the license should be granted. Once the license is granted, the IPP will enter into PPA negotiations with NamPower. PPAs must be approved by the ECB, but once approved, NamPower can simply pass the added costs through to the consumer without a dedicated tariff review. Namibia is currently looking at instituting a feed-in tariff for renewable energy. In fact, a promoter of a potential IPP wind farm is currently in discussions with NamPower regarding a PPA. NamPower’s fear is that the proposed 40MW project would add too much variable capacity to the system, raise prices for consumers, and would force out other renewable options such as solar. ECB is in favor of the project, and if the PPA is agreed and approved, the higher costs of wind generation would be passed through by NamPower to the consumer. It is important to note that Namibia has a comprehensive IPP framework in place.
_____________________________________________________________________________ Engineering Staff College of India Page No. 3.1
Section – 3 Learning Objectives:
a) Economic reforms - Need for new legislations b) Electricity Act 2003 - Salient features c) National Tariff Policy for distribution regulation d) Multi-year Tariff frame work e) Tariff design
3.0 Role of Regulation under the New Legislation and Economic Environment 3.1 Economic reforms in India and need for the new legislation 3.1.1 Though economic liberalization in India can be traced back to the late 1970s, economic reforms began in earnest only in July 1991. A balance of payments crisis at the time opened the way for an International Monetary Fund (IMF) program that led to the adoption of a major reform package. Though the foreign-exchange reserve recovered quickly and ended effectively the temporary clout of the IMF and World Bank, reforms continued in a stop-go fashion. 3.1.2 India’s reforms have been piecemeal and incremental, giving the casual observer the impression that nothing has been happening. If one takes the totality of reforms over the last decade, however, the change is unmistakable. The analogy is with the hour hand of the clock, which looks completely static, and yet completes a full circle every 12 hours. 3.1.3 To get an idea of the accomplishments, begin with the industrial policy prevailing prior to the launching of the reforms. The heavy industry was a state monopoly. Other industries were either subject to strict industrial licensing or reserved for the small-scale sector. The tight control of the government on industry was aptly captured by a leading cartoonist in a 1980s comic strip showing the industry minister tell his staff, “We shouldn’t encourage big industry—that is our policy, I know. But I say we shouldn’t encourage small industries either. If we do, they are bound to become big.…” 3.1.4 The reforms of the last 20 years have gone a long way toward freeing up the domestic economy from state control. State monopoly has been abolished in virtually all sectors, which have been opened to the private sector. The License Raj is a thing of the past. The small-scale industry reservation still persists but even here progress has been made. Apparel, with its large export potential, was recently opened to all investors. 3.1.5 In the area of international trade, in 1991, import licensing was pervasive with goods divided into banned, restricted, limited permissible, and subject to open general licensing (OGL). The OGL category was the most liberal but it covered only 30 percent of imports. Moreover, certain conditions had still to be fulfilled before the permission to import was granted under the OGL system. Imports were also subject to excessively high tariffs. The top rate was 400 percent. As much as 60 percent of tariff lines were subject to rates ranging from 110 to 150 percent and only 4 percent of the tariff rates were below 60 percent. The exchange rate was highly over-valued. Strict exchange controls applied to not just capital account but also current account transactions. Foreign
_____________________________________________________________________________ Engineering Staff College of India Page No. 3.2
investment was subject to stringent restrictions. Companies were not permitted more than 40 percent foreign equity unless they were in the high-tech sector or were export-oriented. As a result, foreign investment amounted to a paltry $100-200 million annually. 3.1.6 Today, import licensing has been completely abolished. This includes textiles and clothing, which remain protected in developed countries through the multi-fiber arrangement. The highest tariff rate has come down to 45 percent (including the tariff surcharge and the so-called Special Additional Duty) with the average tariff rate declining to less than 25 percent. The foreign investment regime is as liberal as in other developing Asian countries. 3.1.7 Twenty years ago, telecommunications services were a state monopoly and constituted a major bottleneck on the conduct of business activity. When a Member of Parliament complained about poor telephone service in Delhi during the early 1980s, the then telecommunications minister went on to remind him that in a poor country like India, the telephone was a luxury. The minister then added that if the Member was unhappy with the service, he could return his phone since many customers had queued up for it for years! 3.1.8 Today, the private sector has become very active in the telecommunications sector, and telephones are provided on demand now. The provision of cellular mobile as well as fixed service is now open to the private sector including foreign investors. As a result, the telecommunications services in India are mushrooming. 3.1.9 Progress has also been made in many areas that were previously off limits to reforms. Insurance has been opened to private investors, both domestic and foreign. Diesel oil and gas prices have undergone some increases. At least symbolic reductions have also been made in fertilizer and food subsidies. The value added tax (VAT) has undergone substantial rationalization. 3.1.10 These reforms have paid handsomely. The economy has grown at more than 6 percent coupled with full macroeconomic stability. This compares with a growth rate of 3.5 percent during 1950-1980. The rate of inflation had been low and foreign exchange reserves were sufficient to finance imports for more than eight months. Rising incomes have helped bring down poverty. According to official figures, the proportion of poor in total population has declined from 40 percent in 1993-1994 to 26 percent in 2000. 3.1.11 But, perhaps, the greatest change in the last 20 years has been in the attitude toward reforms. Whereas the vocal supporters of reforms within India were rare during the 1980s, virtually every political party today recognizes the need for continued reforms. Differences on which reforms to undertake first and at what pace still exist, but few disagree that reforms must continue. Initial fears that changes in governments will bring the reform process to a halt or even reverse it have proven to be without foundation. 3.1.12 The electricity sector reforms and restructuring also started in the nineties. The Government of India took initiatives and notified policies for the private sector participation in the electricity sector. Many private corporate entities of Indian and foreign origin expressed interest for equity investment in generating stations, specially identified by different State Governments, under the policy guidelines of Ministry of Power, Government of India. In many cases, multinational electricity majors signed
_____________________________________________________________________________ Engineering Staff College of India Page No. 3.3
Memorandum of Understandings (MoUs) with State Governments and State Electricity Boards (SEBs) to set up Independent Power Projects (IPPs). 3.1.13 These companies found that the commercial viability of SEBs were poor. Hence, they doubted whether SEBs would be financially capable to pay for electricity delivered by the IPPs. They approached the World Bank to take up the issue with the Government of India. At the instance of the World Bank, a conference of all Chief Ministers was held at Jeypore in October, 1991. The delegates of MNCs and the officials from World Bank made presentations on the recent developments in the electricity sector of UK and Russia and the electricity market reforms already introduced there. 3.1.14 The then Prime Minister of India, Late P. V. Narasimha Rao and the then Finance Minister (present Prime Minister), Dr. Manmohan Singh addressed the conference and put emphasis on States to introduce comprehensive reforms programs in the electricity sector of respective states. Most of the Chief Ministers were using free or subsidized electricity supply to farmers and other consumers as the key issue for winning the elections. Hence, no State came forward at that time to introduce reforms in its power sector. 3.1.15 The then Chief Minister of Orissa, Late Mr. Biju Patnaik, at the request of the then Prime Minister, agreed to introduce such comprehensive reforms in the power sector of the State. The World Bank assisted the Orissa Power Sector Reform Project, where a consortium of four groups of International consultants in Finance and Strategic Management (KPMG, UK), Legal (McKenna & Co.,UK), Engineering (Monenco-AGRA, Canada) and Economics & Pricing (NERA Inc, USA) were selected. Nine Working Groups were formed to help in the practical issues and Indian experience of the sector. 3.1.16 The Orissa Electricity Reform Act was passed in the State assembly in 1995 and got the assent of the President of India. In pursuant to the provisions made in the Act, OSEB was functionally unbundled in to two Generating companies, one Transmission and Bulk Supply company, four Distribution companies. An independent and transparent regulatory authority, Orissa Electricity Regulatory Commission (OERC) was constituted and started functioning in 1996. 3.1.17 Other States like, Haryana, Andhra Pradesh, Uttar Pradesh, Karnataka, Rajasthan, Delhi, Madhya Pradesh and Gujarat enacted their respective State Reform Act, between 1998 and 2003, in line with the Orissa Reform Model. In the mean time Government of India enacted the Electricity Regulatory Commission Act, 1998 and then the Electricity Act, 2003, repealing the Indian Electricity Act, 1910, the Electricity Supply Act, 1948 and the Electricity Regulatory Commission Act, 1998. 3.1.18 The need for the new legislation, the Electricity Act, 2003, arose when the Government of India considered to address the following issues on policy framework and introduction of electricity markets in India, keeping in view the fact that electricity is a subject matter of concurrent list of the Constitution of India.
a) Uniformity of regulatory approach throughout the Country to facilitate private equity investors in the sector, to choose any State of their choice;
b) To make generation of electricity free from licensing and introduce competition to enhance the efficiency and economy in production of electricity and its availability to consumers at affordable prices;
_____________________________________________________________________________ Engineering Staff College of India Page No. 3.4
c) To introduce Open Access in the Transmission and Distribution of Electricity for facilitating trading in electricity and to create electricity market to provide choice to the electricity consumers;
d) To create a National Grid and National Load Dispatch Centre integrating all five regional grids to facilitate electricity traders and Power Exchanges at National level.
3.2 Salient Features of Electricity Act, 2003 3.2.1 Electricity Act, 2003 (the Act) was enacted by the Parliament to consolidate the laws relating to generation, transmission, distribution, trading and use of electricity and generally for taking measures conducive to development of electricity industry, promoting competition therein, protecting interest of consumers and supply of electricity to all areas, rationalisation of electricity tariff, ensuring transparent policies regarding subsidies, promotion of efficient and environmentally benign policies, constitution of Central Electricity Authority, Regulatory Commissions and establishment of Appellate Tribunal and for matters connected therewith or incidental thereto. 3.2.2 In pursuant to the section 3 of the Act, the Government of India framed and notified National Electricity Policy and National Electricity Policy on 12th, February, 2005. This provides the framework for integrated development of the power system in the Country and regulation of transmission and distribution business. Similarly, the Government of India notified National Tariff Policy on 6th, January, 2006 as per the requirements of the Act given below 3.2.3 Section 3. (1) of the Act : The Central Government shall, from time to time, prepare the national electricity policy and tariff policy, in consultation with the State Governments and the Authority for development of the power system based on optimal utilisation of resources such as coal, natural gas, nuclear substances or materials, hydro and renewable sources of energy.
(2) The Central Government shall publish National Electricity Policy and tariff policy from time to time.
(3) The Central Government may, from time to time, in consultation with the State Governments and the Authority, review or revise, the National Electricity Policy and tariff policy referred to in sub-section (1).
(4) The Authority shall prepare a National Electricity Plan in accordance with the National Electricity Policy and notify such plan once in five years:
3.2.4 Section 7 to 11 of the Act mandates that generation is free from License. These sections provide for setting up by generating company of generating stations and Hydro-electric generating station and for maintenance or operation of a captive generating plant and dedicated transmission lines and duties of generating companies and directions to generating companies. The following are the important aspects on generation:
a) Captive Generation is free from controls. Open access to Captive generating plants subject to availability of transmission facility. (Section 9)
b) Generation from Non-Conventional Sources / Co-generation to be promoted. Minimum percentage of purchase of power from renewable may be prescribed by Regulatory Commissions. (Sections 61 (h), 86 (1) (e))
_____________________________________________________________________________ Engineering Staff College of India Page No. 3.5
3.2.5 Section 82 to 89 of the Act provides for Independent and transparent Regulatory Mechanism and uniformity in regulatory approach to reduce regulatory risk for investors and large consumers of electricity:
• Constitution of SERC • Powers of tariff fixation, licensing, regulation or working of licensees,
performance standards etc. to SERC 3.2.6 Reorganization of SEBs was intended under Section 131 of the Act.
• TRANSCO as successor entity • Single buyer and Multi-buyer model • Separation of generation, transmission, distribution and retail supply
3.2.7 Central Govt. to notify a National Policy for rural areas permitting stand alone systems based on renewal and Non-Conventional energy sources in consultation with States. (Section 4) 3.2.8 Central Govt. to formulate a National Policy in consultation with the concerned State Govts. for bulk purchase of power and management of local distribution through Users’ Association, Cooperatives, Franchisees and Panchayat Institutions etc. (Section 5) 3.2.9 There would be Transmission Utility at the Centre and in the States to undertake planning & development of transmission system. (Sections 38 & 39). Load despatch to be in the hands of a govt company/organisation. Flexibility regarding keeping Transmission Utility and load despatch together or separating them is the matter of choice for the time being. Load Despatch function is critical for grid stability and neutrality vis a vis generators and distributors. Instructions of NLDC, / RLDC / SLDC shall be binding on both. (Sections 26, 27, 31, 38, 39). Transmission companies shall be licensed by the Appropriate Commission after giving due consideration to the views of the Transmission Utility. (Sections 15 (5) (b)). Load Dispatch Centre / Transmission Utility / Transmission Licensee shall not trade in power. Facilitating genuine competition between generators is the mandate. (Sections 27, 31, 38, 39,41) 3.2.10 Open access to the transmission lines to be provided to distribution licensees, generating companies. (Sections 38-40). This would generate competitive pressures and lead to gradual cost reduction. 3.2.11 Distribution shall be licensed by SERCs. Distribution licensee is free to take up generation & Generating co. is free to take up distribution licence. This would facilitate private sector participation without Government guarantee/ Escrow. (Sections 7, 12)
- Retail tariff to be determined by the Regulatory Commission. (Section62) - Metering made mandatory. (Section 55) - Provision for suspension/revocation of licence by Regulatory
Commission as it is an essential service which can not be allowed to collapse. (Sections 19, 24)
- Open access in distribution to be allowed by SERC in phases. (Section 42) - In addition to the wheeling charges provision for surcharge if open access is
allowed before elimination of cross subsidies, to take care of (a) Current level of cross subsidy (b) Licensee’s obligation to supply. (Section 42)
- This would give choice to customer.
_____________________________________________________________________________ Engineering Staff College of India Page No. 3.6
3.3 National Tariff Policy and Framework for Distribution Regulation
3.3.0 Policy on Distribution Supply of reliable and quality power of specified standards in an efficient manner and at reasonable rates is one of the main objectives of the National Electricity Policy. The State Commission should determine and notify the standards of performance of licensees with respect to quality, continuity and reliability of service for all consumers. It is desirable that the Forum of Regulators determines the basic framework on service standards. A suitable transition framework could be provided for the licensees to reach the desired levels of service as quickly as possible. Penalties may be imposed on licensees in accordance with section 57 of the Act for failure to meet the standards. Making the distribution segment of the industry efficient and solvent is the key to success of power sector reforms and provision of services of specified standards. Therefore, the Regulatory Commissions need to strike the right balance between the requirements of the commercial viability of distribution licensees and consumer interests. Loss making utilities need to be transformed into profitable ventures which can raise necessary resources from the capital markets to provide services of international standards to enable India to achieve its full growth potential. Efficiency in operations should be encouraged. Gains of efficient operations with reference to normative parameters should be appropriately shared between consumers and licensees. 3.3.1 Implementation of Multi-Year Tariff (MYT) framework
1) This would minimise risks for utilities and consumers, promote efficiency and appropriate reduction of system losses and attract investments and would also bring greater predictability to consumer tariffs on the whole by restricting tariff adjustments to known indicators on power purchase prices and inflation indices. The framework should be applied for both public and private utilities.
2) The State Commissions should introduce mechanisms for sharing of excess profits
and losses with the consumers as part of the overall MYT framework .In the first control period the incentives for the utilities may be asymmetric with the percentage of the excess profits being retained by the utility set at higher levels than the percentage of losses to be borne by the utility. This is necessary to accelerate performance improvement and reduction in losses and will be in the long term interest of consumers by way of lower tariffs.
3) As indicated in para 5.3 (h), the MYT framework implemented in the initial control
period should have adequate flexibility to accommodate changes in the baselines consequent to metering being completed.
4) Licensees may have the flexibility of charging lower tariffs than approved by the
State Commission if competitive conditions require so without having a claim on additional revenue requirement on this account in accordance with Section 62 of the Act.
5) At the beginning of the control period when the “actual” costs form the basis for
future projections, there may be a large uncovered gap between required tariffs and the tariffs that are presently applicable. The gap should be fully met through
_____________________________________________________________________________ Engineering Staff College of India Page No. 3.7
tariff charges and through alternative means that could inter-alia include financial restructuring and transition financing.
6) Incumbent licensees should have the option of filing for separate revenue
requirements and tariffs for an area where the State Commission has issued multiple distribution licenses, pursuant to the provisions of Section 14 of the Act read with para 5.4.7 of the National Electricity Policy.
7) Appropriate Commissions should initiate tariff determination and regulatory scrutiny
on a suo moto basis in case the licensee does not initiate filings in time. It is desirable that requisite tariff changes come into effect from the date of commencement of each financial year and any gap on account of delay in filing should be on account of licensee.
3.3.2 Framework for revenue requirements and costs 3.3.2.1 The following aspects would need to be considered in determining tariffs: (1) All power purchase costs need to be considered legitimate unless it is established
that the merit order principle has been violated or power has been purchased at unreasonable rates. The reduction of Aggregate Technical & Commercial (ATC) losses needs to be brought about but not by denying revenues required for power purchase for 24 hours supply and necessary and reasonable O&M and investment for system upgradation. Consumers, particularly those who are ready to pay a tariff which reflects efficient costs have the right to get uninterrupted 24 hours supply of quality power. Actual level of retail sales should be grossed up by normative level of T&D losses as indicated in MYT trajectory for allowing power purchase cost subject to justifiable power purchase mix variation (for example, more energy may be purchased from thermal generation in the event of poor rainfall) and fuel surcharge adjustment as per regulations of the SERC.
(2) ATC loss reduction should be incentivised by linking returns in a MYT framework to
an achievable trajectory. Greater transparency and nurturing of consumer groups would be efficacious. For government owned utilities improving governance to achieve ATC loss reduction is a more difficult and complex challenge for the SERCs. Prescription of a MYT dispensation with different levels of consumer tariffs in succeeding years linked to different ATC loss levels aimed at covering full costs could generate the requisite political will for effective action to reduce theft as the alternative would be stiffer tariff increases. Third party verification of energy audit results for different areas/localities could be used to impose area/locality specific surcharge for greater ATC loss levels and this in turn could generate local consensus for effective action for better governance. The SERCs may also encourage suitable local area based incentive and disincentive scheme for the staff of the utilities linked to reduction in losses.
The SERC shall undertake independent assessment of baseline data for various parameters for every distribution circle of the licensee.
The SERC shall also institute a system of independent scrutiny of financial and technical data submitted by the licensees.
_____________________________________________________________________________ Engineering Staff College of India Page No. 3.8
As the metering is completed upto appropriate level in the distribution network, it should be possible to segregate technical losses. Accordingly technical loss reduction under MYT framework should then be treated as distinct from commercial loss reductions which require a different approach. (3) Section 65 of the Act provides that no direction of the State Government regarding
grant of subsidy to consumers in the tariff determined by the State Commission shall be operative if the payment on account of subsidy as decided by the State Commission is not made to the utilities and the tariff fixed by the State Commission shall be applicable from the date of issue of orders by the Commission in this regard. The State Commissions should ensure compliance of this provision of law to ensure financial viability of the utilities. To ensure implementation of the provision of the law, the State Commission should determine the tariff initially, without considering the subsidy commitment by the State Government and subsidized tariff shall be arrived at thereafter considering the subsidy by the State Government for the respective categories of consumers.
(4) Working capital should be allowed duly recognizing the transition issues faced by the
utilities such as progressive improvement in recovery of bills. Bad debts should be recognized as per policies developed and subject to the approval of the State Commission.
(5) Pass through of past losses or profits should be allowed to the extent caused by
uncontrollable factors. During the transition period controllable factors should be to the account of utilities and consumers in proportions determined under the MYT framework.
(6) The contingency reserves should be drawn upon with prior approval of the State
Commission only in the event of contingency conditions specified through regulations by the State Commission. The existing practice of providing for development reserves and tariff and dividend control reserves should be discontinued.
3.3.2.2. The facility of a regulatory asset has been adopted by some Regulatory Commissions in the past to limit tariff impact in a particular year. This should be done only as exception, and subject to the following guidelines:
a. The circumstances should be clearly defined through regulations, and should only include natural causes or force majeure conditions. Under business as usual conditions, the opening balances of uncovered gap must be covered through transition financing arrangement or capital restructuring;
b. Carrying cost of Regulatory Asset should be allowed to the utilities; c. Recovery of Regulatory Asset should be time-bound and within a period not
exceeding three years at the most and preferably within control period; d. The use of the facility of Regulatory Asset should not be repetitive. e. In cases where regulatory asset is proposed to be adopted, it should be ensured
that the return on equity should not become unreasonably low in any year so that the capability of the licensee to borrow is not adversely affected.

_____________________________________________________________________________ Engineering Staff College of India Page No. 3.9
3.3.3 Tariff design: Linkage of tariffs to cost of service It has been widely recognised that rational and economic pricing of electricity can be one of the major tools for energy conservation and sustainable use of ground water resources. In terms of the Section 61 (g) of the Act, the Appropriate Commission shall be guided by the objective that the tariff progressively reflects the efficient and prudent cost of supply of electricity. The State Governments can give subsidy to the extent they consider appropriate as per the provisions of section 65 of the Act. Direct subsidy is a better way to support the poorer categories of consumers than the mechanism of cross-subsidizing the tariff across the board. Subsidies should be targeted effectively and in transparent manner. As a substitute of cross-subsidies, the State Government has the option of raising resources through mechanism of electricity duty and giving direct subsidies to only needy consumers. This is a better way of targeting subsidies effectively. Accordingly, the following principles would be adopted: 1. In accordance with the National Electricity Policy, consumers below poverty line who consume below a specified level, say 30 units per month, may receive a special support through cross subsidy. Tariffs for such designated group of consumers will be at least 50% of the average cost of supply. This provision will be re-examined after five years. 2. For achieving the objective that the tariff progressively reflects the cost of supply of electricity, the SERC would notify roadmap within six months with a target that latest by the end of year 2010-2011 tariffs are within ± 20 % of the average cost of supply. The road map would also have intermediate milestones, based on the approach of a gradual reduction in cross subsidy. For example if the average cost of service is Rs.3 per unit, at the end of year 2010-2011 the tariff for the cross subsidised categories excluding those referred to in para-1 above should not be lower than Rs.2.40 per unit and that for any of the cross-subsidising categories should not go beyond Rs.3.60 per unit. 3. While fixing tariff for agricultural use, the imperatives of the need of using ground water resources in a sustainable manner would also need to be kept in mind in addition to the average cost of supply. Tariff for agricultural use may be set at different levels for different parts of a state depending of the condition of the ground water table to prevent excessive depletion of ground water. Section 62 (3) of the Act provides that geographical position of any area could be one of the criteria for tariff differentiation. A higher level of subsidy could be considered to support poorer farmers of the region where adverse ground water table condition requires larger quantity of electricity for irrigation purposes subject to suitable restrictions to ensure maintenance of ground water levels and sustainable ground water usage. 4. Extent of subsidy for different categories of consumers can be decided by the State Government keeping in view various relevant aspects. But provision of free electricity is not desirable as it encourages wasteful consumption of electricity besides, in most cases, lowering of water table in turn creating avoidable problem of water shortage for irrigation and drinking water for later generations. It is also likely to lead to rapid rise in
_____________________________________________________________________________ Engineering Staff College of India Page No. 3.10
demand of electricity putting severe strain on the distribution network thus adversely affecting the quality of supply of power. Therefore, it is necessary that reasonable level of user charges is levied. The subsidized rates of electricity should be permitted only up to a pre-identified level of consumption beyond which tariffs reflecting efficient cost of service should be charged from consumers. If the State Government wants to reimburse even part of this cost of electricity to poor category of consumers the amount can be paid in cash or any other suitable way. Use of prepaid meters can also facilitate this transfer of subsidy to such consumers. 5. Metering of supply to agricultural / rural consumers can be achieved in a consumer friendly way and in effective manner by management of local distribution in rural areas through commercial arrangement with franchisees with involvement of panchayat institutions, user associations, cooperative societies etc. Use of self closing load limiters may be encouraged as a cost effective option for metering in cases of “limited use consumers” who are eligible for subsidized electricity. 3.3.4 Definition of tariff components and their applicability
1. Two-part tariffs featuring separate fixed and variable charges and Time differentiated tariff shall be introduced on priority for large consumers (say, consumers with demand exceeding 1 MW) within one year. This would also help in flattening the peak and implementing various energy conservation measures.
2. The National Electricity Policy states that existing PPAs with the generating
companies would need to be suitably assigned to the successor distribution companies. The State Governments may make such assignments taking care of different load profiles of the distribution companies so that retail tariffs are uniform in the State for different categories of consumers. Thereafter the retail tariffs would reflect the relative efficiency of distribution companies in procuring power at competitive costs, controlling theft and reducing other distribution losses.
3. The State Commission may provide incentives to encourage metering and billing
based on metered tariffs, particularly for consumer categories that are presently un-metered to a large extent. The metered tariffs and the incentives should be given wide publicity.
4. The SERCs may also suitably regulate connection charges to be recovered by the
distribution licensee to ensure that second distribution licensee does not resort to cherry picking by demanding unreasonable connection charges. The connection charges of the second licensee should not be more than those payable to the incumbent licensee.
3.3.5 Cross-subsidy surcharge and additional surcharge for open access 3.3.5.1 National Electricity Policy lays down that the amount of cross-subsidy surcharge and the additional surcharge to be levied from consumers who are permitted open access should not be so onerous that it eliminates competition which is intended to be fostered in generation and supply of power directly to the consumers through open access.
_____________________________________________________________________________ Engineering Staff College of India Page No. 3.11
A consumer who is permitted open access will have to make payment to the generator, the transmission licensee whose transmission systems are used, distribution utility for the wheeling charges and, in addition, the cross subsidy surcharge. The computation of cross subsidy surcharge, therefore, needs to be done in a manner that while it compensates the distribution licensee, it does not constrain introduction of competition through open access. A consumer would avail of open access only if the payment of all the charges leads to a benefit to him. While the interest of distribution licensee needs to be protected it would be essential that this provision of the Act, which requires the open access to be introduced in a time-bound manner, is used to bring about competition in the larger interest of consumers. Accordingly, when open access is allowed the surcharge for the purpose of sections 38,39,40 and sub-section 2 of section 42 would be computed as the difference between (i) the tariff applicable to the relevant category of consumers and (ii) the cost of the distribution licensee to supply electricity to the consumers of the applicable class. In case of a consumer opting for open access, the distribution licensee could be in a position to discontinue purchase of power at the margin in the merit order. Accordingly, the cost of supply to the consumer for this purpose may be computed as the aggregate of (a) the weighted average of power purchase costs (inclusive of fixed and variable charges) of top 5% power at the margin, excluding liquid fuel based generation, in the merit order approved by the SERC adjusted for average loss compensation of the relevant voltage level and (b) the distribution charges determined on the principles as laid down for intra-state transmission charges. Surcharge formula:
S = T – [ C (1+ L / 100) + D ] Where S is the surcharge T is the Tariff payable by the relevant category of consumers; C is the Weighted average cost of power purchase of top 5% at the margin excluding liquid fuel based generation and renewable power D is the Wheeling charge L is the system Losses for the applicable voltage level, expressed as a percentage
The cross-subsidy surcharge should be brought down progressively and, as far as possible, at a linear rate to a maximum of 20% of its opening level by the year 2010-11. 3.3.5.2 No surcharge would be required to be paid in terms of sub-section (2) of Section 42 of the Act on the electricity being sold by the generating companies with consent of the competent government under Section 43(A)(1)(c) of the Electricity Act, 1948 (now repealed) and on the electricity being supplied by the distribution licensee on the authorisation by the State Government under Section 27 of the Indian Electricity Act, 1910 (now repealed), till the current validity of such consent or authorisations. 3.3.5.3 The surcharge may be collected either by the distribution licensee, the transmission licensee, the STU or the CTU, depending on whose facilities are used by the consumer for availing electricity supplies. In all cases the amounts collected from a particular consumer should be given to the distribution licensee in whose area the
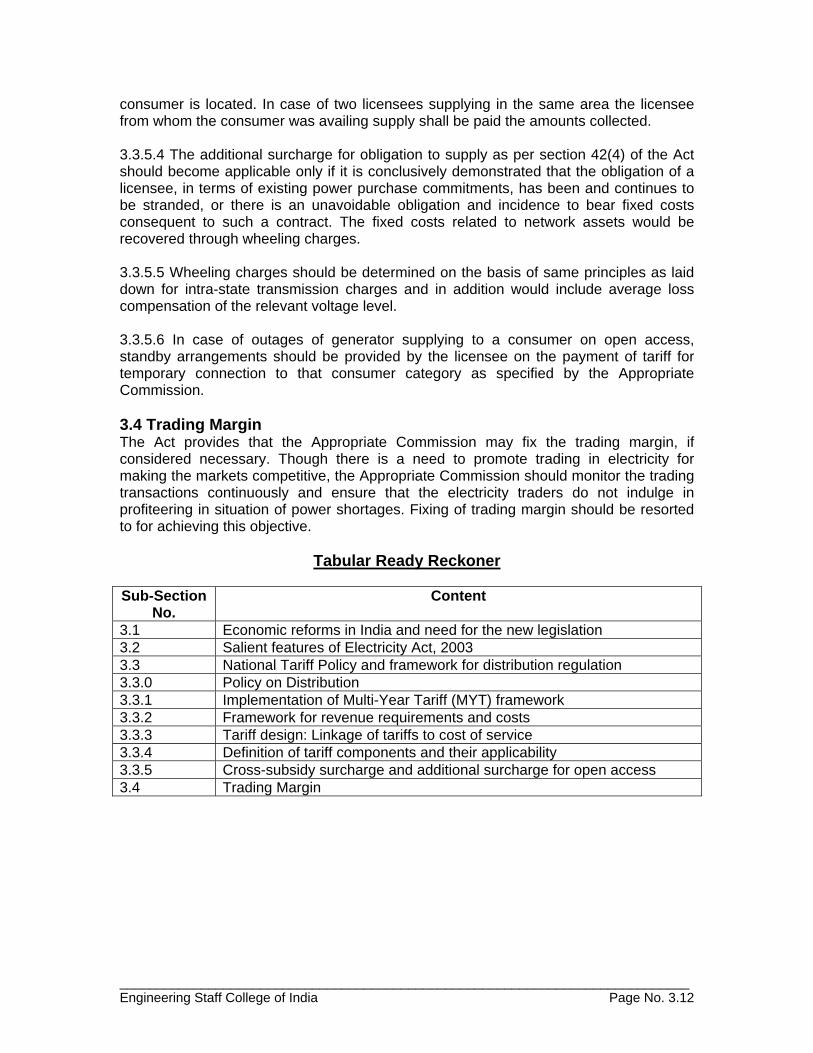
_____________________________________________________________________________ Engineering Staff College of India Page No. 3.12
consumer is located. In case of two licensees supplying in the same area the licensee from whom the consumer was availing supply shall be paid the amounts collected. 3.3.5.4 The additional surcharge for obligation to supply as per section 42(4) of the Act should become applicable only if it is conclusively demonstrated that the obligation of a licensee, in terms of existing power purchase commitments, has been and continues to be stranded, or there is an unavoidable obligation and incidence to bear fixed costs consequent to such a contract. The fixed costs related to network assets would be recovered through wheeling charges. 3.3.5.5 Wheeling charges should be determined on the basis of same principles as laid down for intra-state transmission charges and in addition would include average loss compensation of the relevant voltage level. 3.3.5.6 In case of outages of generator supplying to a consumer on open access, standby arrangements should be provided by the licensee on the payment of tariff for temporary connection to that consumer category as specified by the Appropriate Commission. 3.4 Trading Margin The Act provides that the Appropriate Commission may fix the trading margin, if considered necessary. Though there is a need to promote trading in electricity for making the markets competitive, the Appropriate Commission should monitor the trading transactions continuously and ensure that the electricity traders do not indulge in profiteering in situation of power shortages. Fixing of trading margin should be resorted to for achieving this objective.
Tabular Ready Reckoner Sub-Section
No. Content
3.1 Economic reforms in India and need for the new legislation 3.2 Salient features of Electricity Act, 2003 3.3 National Tariff Policy and framework for distribution regulation 3.3.0 Policy on Distribution 3.3.1 Implementation of Multi-Year Tariff (MYT) framework 3.3.2 Framework for revenue requirements and costs 3.3.3 Tariff design: Linkage of tariffs to cost of service 3.3.4 Definition of tariff components and their applicability 3.3.5 Cross-subsidy surcharge and additional surcharge for open access 3.4 Trading Margin
_____________________________________________________________________________ Engineering Staff College of India Page No.4.1
Section – 4 Learning Objectives:
a) Understanding Rate of Return (RoR) Regulation b) Performance based regulation (PBR) c) Price cap regulation (PCR) d) Tariff Policy - Rate making approach
4.0 Type of Regulation and Rate Making Approach 4.1 Rate of Return (RoR) Regulation 4.1.1 What Does Rate Of Return Regulation Mean? A form of price setting regulation where government determines the fair price which is allowed to be charged by a monopoly. Rate of return regulation is meant to protect customers from being charged higher prices due to the monopoly's power, while still allowing the monopoly to cover its costs and earn a fair return for its owners 4.1.2 Investopedia explains Rate of Return Regulation Customers benefit from prices that are reasonable, given the monopolists operating costs. Rate of return regulation is often criticized because it provides little incentive to reduce costs and increase efficiency. A monopolist who is regulated in this manner does not earn more if costs are reduced. Thus, customers may still be charged higher prices than they would be under free competition. 4.1.3 Wikipedia explains Rate-of-return Regulation Rate-of-return Regulation is a system for setting the prices charged by regulated monopolies. The central idea is that monopoly firms should be required to charge the price that would prevail in a competitive market, which is equal to efficient costs of production plus a market-determined rate of return on capital. Rate-of-return regulation has been criticized because it encourages cost-padding, and because, if the allowable rate is set too high, it encourages the adoption of an inefficiently high capital-labor ratio. This is called the Averch–Johnson effect. 4.1.4 Averch-Johnson Rate of Return Regulation The Averch-Johnson effect of overcapitalization under rate of return (ROR) regulation can be shown using a mathematical model. This presentation follows Takayama (1969). A monopoly's production function is Equation 1 Q = f(L,K), where Q is output, L is units of labor, and K is capital stock. Its profit is Equation 2
= p(Q)Q - wL - uK = R(L,K) - wL -uK, where p(Q) is the inverse demand curve, w is the wage rate, u is the user cost of capital, and R(L,K) is the revenue function R(L,K) = p(f(L,K))f(L,K). Suppose the board decides the fair rate of return is v, so that, using Equation 2,
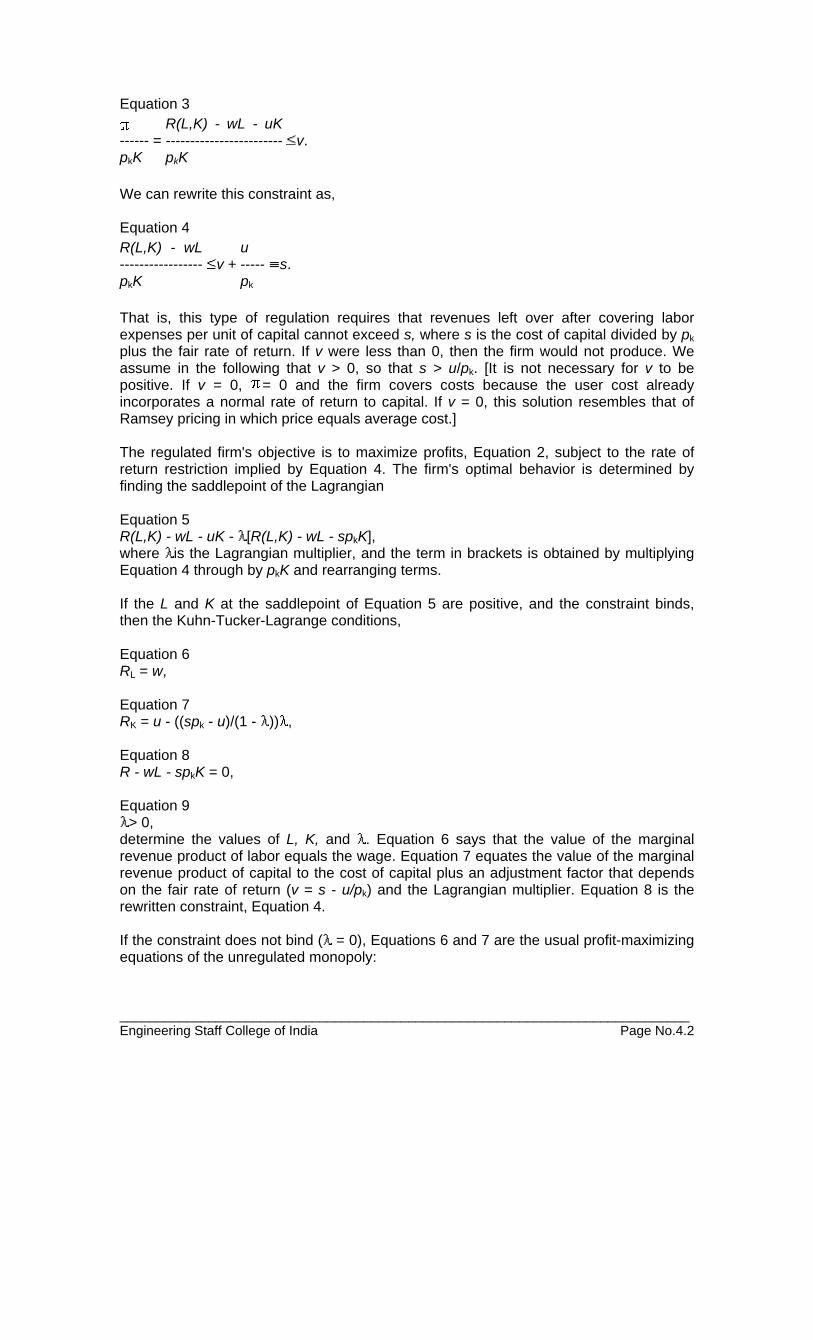
_____________________________________________________________________________ Engineering Staff College of India Page No.4.2
Equation 3
------ pkK
= R(L,K) - wL - uK ------------------------ pkK
v.
We can rewrite this constraint as, Equation 4 R(L,K) - wL ----------------- pkK
v + u ----- pk
s.
That is, this type of regulation requires that revenues left over after covering labor expenses per unit of capital cannot exceed s, where s is the cost of capital divided by pk plus the fair rate of return. If v were less than 0, then the firm would not produce. We assume in the following that v > 0, so that s > u/pk. [It is not necessary for v to be positive. If v = 0, = 0 and the firm covers costs because the user cost already incorporates a normal rate of return to capital. If v = 0, this solution resembles that of Ramsey pricing in which price equals average cost.] The regulated firm's objective is to maximize profits, Equation 2, subject to the rate of return restriction implied by Equation 4. The firm's optimal behavior is determined by finding the saddlepoint of the Lagrangian Equation 5 R(L,K) - wL - uK - [R(L,K) - wL - spkK], where is the Lagrangian multiplier, and the term in brackets is obtained by multiplying Equation 4 through by pkK and rearranging terms. If the L and K at the saddlepoint of Equation 5 are positive, and the constraint binds, then the Kuhn-Tucker-Lagrange conditions, Equation 6 RL = w, Equation 7 RK = u - ((spk - u)/(1 - )) , Equation 8 R - wL - spkK = 0, Equation 9
> 0, determine the values of L, K, and . Equation 6 says that the value of the marginal revenue product of labor equals the wage. Equation 7 equates the value of the marginal revenue product of capital to the cost of capital plus an adjustment factor that depends on the fair rate of return (v = s - u/pk) and the Lagrangian multiplier. Equation 8 is the rewritten constraint, Equation 4. If the constraint does not bind ( = 0), Equations 6 and 7 are the usual profit-maximizing equations of the unregulated monopoly:
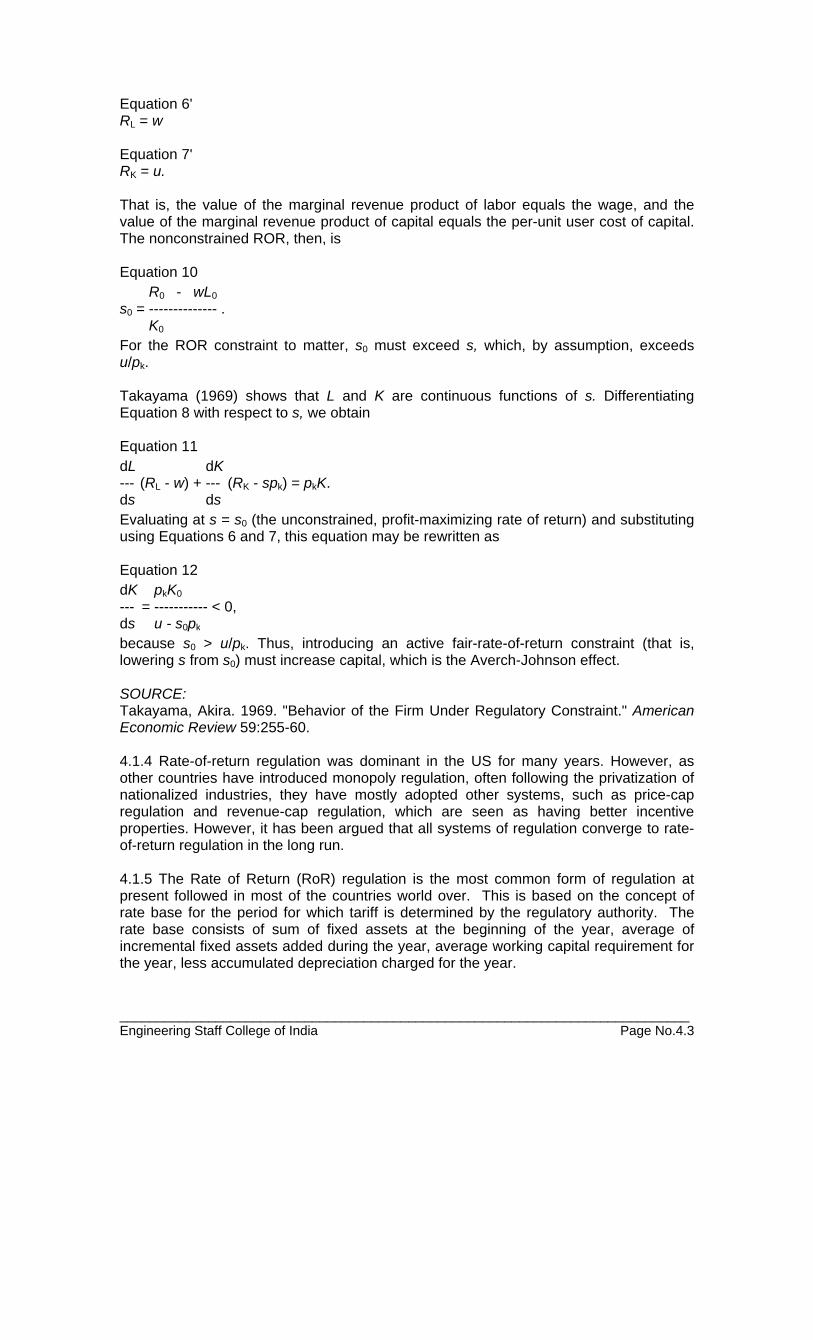
_____________________________________________________________________________ Engineering Staff College of India Page No.4.3
Equation 6' RL = w Equation 7' RK = u. That is, the value of the marginal revenue product of labor equals the wage, and the value of the marginal revenue product of capital equals the per-unit user cost of capital. The nonconstrained ROR, then, is Equation 10
s0 = R0 - wL0 -------------- K0
.
For the ROR constraint to matter, s0 must exceed s, which, by assumption, exceeds u/pk. Takayama (1969) shows that L and K are continuous functions of s. Differentiating Equation 8 with respect to s, we obtain Equation 11 dL --- ds
(RL - w) + dK --- ds
(RK - spk) = pkK.
Evaluating at s = s0 (the unconstrained, profit-maximizing rate of return) and substituting using Equations 6 and 7, this equation may be rewritten as Equation 12 dK --- ds
= pkK0 ----------- u - s0pk
< 0,
because s0 > u/pk. Thus, introducing an active fair-rate-of-return constraint (that is, lowering s from s0) must increase capital, which is the Averch-Johnson effect. SOURCE: Takayama, Akira. 1969. "Behavior of the Firm Under Regulatory Constraint." American Economic Review 59:255-60. 4.1.4 Rate-of-return regulation was dominant in the US for many years. However, as other countries have introduced monopoly regulation, often following the privatization of nationalized industries, they have mostly adopted other systems, such as price-cap regulation and revenue-cap regulation, which are seen as having better incentive properties. However, it has been argued that all systems of regulation converge to rate-of-return regulation in the long run. 4.1.5 The Rate of Return (RoR) regulation is the most common form of regulation at present followed in most of the countries world over. This is based on the concept of rate base for the period for which tariff is determined by the regulatory authority. The rate base consists of sum of fixed assets at the beginning of the year, average of incremental fixed assets added during the year, average working capital requirement for the year, less accumulated depreciation charged for the year.
_____________________________________________________________________________ Engineering Staff College of India Page No.4.4
4.2 Performance Based Regulation (PBR) 4.2.1 Performance-Based Regulation (PBR) has made substantial inroads in the electric utility industry in the US, with at least 28 electric utility companies in 16 states presently operating under some form of comprehensive PBR. Many states have replaced (or combined) targeted incentive plans in their electric utility industries with broad-based PBR plans similar to those that are the predominant form of regulation in the telecommunications industry. 4.2.2 Performance can be integrated into the mission and activities of regulatory agencies in four principal ways. Specifically, a regulatory system that is performance-based can be thought of as one in which performance is used as
1. the basis for the legal commands found in regulatory standards, 2. a criterion for allocating enforcement and compliance re-sources, 3. a trigger for the application of differentiated (or tiered) regulatory standards, and 4. a basis for evaluating regulatory programs and agencies.
4.2.3. The first of these conceptions – namely performance standards – is probably the most common in the literature on policy instrument choice, but the other notions of performance-based regulation also frequently arise in policy and academic discourse. In order to analyze effectively the potential and limitations of performance-based regulation, it is important to be clear about what one means by this approach to improving regulation. 4.2.4. A performance standard specifies the outcome required but leaves the concrete measures to achieve that outcome up to the discretion of the regulated entity. In contrast to a design standard or a technology-based standard that specifies exactly how to achieve compliance, a performance standard sets a general goal and lets each regulated entity decide how to meet it.
4.2.5 Several refinements to this general definition, identifying different ways that performance-based standards can be distinguished. The distinctions are based on
(1) the specificity of the regulation; (2) the under-lying basis for the threshold reflected in the performance standard; (3) the scope of the regulation’s ultimate objective and the location of the rule in the
causal chain of events leading to that ultimate objective; and (4) the type of problem the standard aims to solve.
4.2.6 With respect to the specificity of the regulations, performance standards can be either loosely or tightly specified. For example, a loosely specified performance standard could require that vegetation adjacent to railroad track be controlled so that it “does not become a fire hazard or obstruct visibility.” Such a regulation provides less guidance to the railroad (and gives more discretion to both the railroad and the regulator) than does a tightly specified regulation requiring that vegetation be con-trolled so that it “remains at least three feet away” from railroad track. Most loosely specified standards will call for regulators to make qualitative judgments, while many tightly specified standards will employ quantitative measures of performance.
4.2.7 Performance standards can also be distinguished according to how their levels of performance are determined. Quantitative standards that are based on predictions (e.g., computer simulations of nuclear power plants) from those that are based on actual measurements (e.g., smoke-stack emissions measured with a continuous monitoring
_____________________________________________________________________________ Engineering Staff College of India Page No.4.5
device). (a) Performance standards that are based on a determination of the appropriate level of risk and (b) Standards set according to the level of performance that is achievable or feasible using known technologies need to be clearly distinguished. 4.2.8 Performance-based standards also differ based on the distance between their performance targets and the ultimate objective that motivated the decision to develop a regulation. The term “trans performance standards” to refer to standards that focus on an ultimate societal objective, such as water quality, rather than more narrow objectives, such as effluent limits. Related to this point the amount of flexibility embodied in a given standard can only be understood in reference to the ultimate goal of the standard. A performance standard that simply codifies a broad societal objective (such as preventing injuries from airplane crashes) will undoubtedly allow firms substantial discretion. In contrast, a regulation that specifies a narrower or subsidiary goal (such as requiring that aircraft have sufficient engine power to reach cruising altitudes quickly) allows firms much less discretion in how they will meet the ultimate objective. 4.2.9 Finally, performance standards can be distinguished based on the types of problems they are designed to solve. Key characteristics of problems include the severity and likelihood (or frequency) of the problems, as well as the number of regulated entities and other affected individuals or groups. For example, standards that deal with high-consequence, low-probability events (e.g., a meltdown of a nuclear power plant or a pipeline explosion) are likely to differ in important ways from standards that deal with low-consequence high-probability events (e.g., food-borne illnesses or traffic infractions). In light of these various ways to distinguish among performance standards, the need to develop a more refined taxonomy of performance standards to avoid con-fusion and facilitate better decision making will be required. An important step for future research will be to develop a clearer conceptualization of the different types of performance. 4.3 Price Cap Regulation (PCR) 4.3.1 Price-cap regulation is a form of regulation designed in the 1980s by UK Treasury economist Stephen Littlechild, which has been applied to all of the privatized British network utilities. It is contrasted with rate-of-return regulation, in which utilities are permitted a set rate of return on capital, and with revenue-cap regulation where total revenue is the regulated variable. 4.3.2 Price cap regulation adjusts the operator’s prices according to the price cap index that reflects the overall rate of inflation in the economy, the ability of the operator to gain efficiencies relative to the average firm in the economy, and the inflation in the operator’s input prices relative to the average firm in the economy. Revenue cap regulation attempts to do the same thing, but for revenue rather than prices.[1] 4.3.3 Price cap regulation is sometimes called "CPI - X", (in the United Kingdom "RPI-X") after the basic formula employed to set price caps. This takes the rate of inflation, measured by the Consumer Price Index (UK Retail Prices Index, RPI) and subtracts expected efficiency savings X. In the water industry, the formula is "RPI - X + K", where K is based on capital investment requirements. The system is intended to provide incentives for efficiency savings, as any savings above the predicted rate X can be passed on to shareholders, at least until the price caps are next reviewed (usually every five years). A key part of the system is that the rate X is based not only a firm's past
_____________________________________________________________________________ Engineering Staff College of India Page No.4.6
performance, but on the performance of other firms in the industry: X is intended to be a proxy for a competitive market, in industries which are natural monopolies. 4.3.4 Now consider how a utility operator might be different from the average firm in the economy. First, assume that the operator is just like the average firm, except that the operator’s input prices change at a rate that is different from the rate of change for the average firm. If the operator’s input prices increase faster than (conversely, slower than) the rate of inflation, then the operator’s retail prices (revenue) will need to increase faster than (conversely, slower than) the rate of inflation for the operator to be able to have earnings that are at least as great as the operator’s cost of capital. Now assume that the operator is just like the average firm, except with respect to the operator’s ability to improve efficiency. If the operator increases its productivity faster than (conversely, slower than) the average firm, then the operator’s retail prices (revenue) will need to decrease (conversely, increase) relative to the rate of inflation. Combining these two possible differences between the operator and the average firm in the economy, the operator’s retail prices (revenue) should change at the rate of inflation, minus (conversely, plus) the extent to which its input prices inflate less than (conversely, greater than) the rate of inflation, and minus (conversely, plus) the extent to which the operator’s productivity is expected to improve at a rate that is greater than (conversely, less than) the average firm in the economy. The above analysis identifies two things. First, the inflation rate, I, used in the price cap index represents the general rate of inflation for the economy. Second, the X-factor is intended to capture the difference between the operator and the average firm in the economy with respect to inflation in input prices and changes in productivity. That is to say, the choice of inflation index and of the X-factor go hand in hand. Some regulators choose a general measure of inflation, such as a gross national product price index. In this case, the X-factor reflects the difference between the operator and the average firm in the economy with respect to the operator’s ability to improve its productivity and the effect of inflation on the operator’s input costs. Other regulators choose a retail (or producer) price index. In these cases, the X-factor represents the difference between the operator and the average retail (or wholesale) firm. Lastly, some regulators construct price indices of operator inputs. In these cases, the X-factor reflects productivity changes of the operator.[1] 4.3.5 In most industries in the UK, estimation of a firm's efficiency is carried out by comparing regional monopolies and using a total factor productivity method. Telecommunications, instead relies on international comparisons. 4.3.6 In practice, the distinction between price-cap and rate-of-return regulation may be lost, as regulators may end up making implicit decisions on the acceptable real rates of return on capital employed in order to arrive at price limit determinations. This has been the experience in the UK water sector, where the 1999 periodic review led Ofwat to determine a standard (real post-tax) cost of capital of 4.75%, with minor adjustments for smaller companies. This standard rate was then used to help calculate X. In addition, detailed aspects of the price elements incorporated into the price index may be more important to the actual operation of a price cap regulatory regime than either the X-factor or the inflation adjustment. How rate elements are incorporated and removed from price caps is particularly important in industries with rapidly changing service offerings. 4.3.7 Price-cap regulation is no longer a uniquely British form of regulation. Particularly in the telecommunications industry, many Asian countries are implementing some form of price cap on their newly-privatised operators. In addition, many US Local Exchange Carriers are now regulated by price-cap rather than rate-of-return regulation: in 2003, of
_____________________________________________________________________________ Engineering Staff College of India Page No.4.7
the 73 companies reporting to the ARMIS database, 22 were regulated according to an RPI-X price cap (and a further 35 were subject to other retail price controls). Annexure- F provides a good illustration on Price Cap and Revenue Cap regulation. 4.4 Rate making Approaches under National Tariff Policy 4.4.1 Introducing competition in different segments of the electricity industry is one of the key features of the Electricity Act, 2003. Competition will lead to significant benefits to consumers through reduction in capital costs and also efficiency of operations. It will also facilitate the price to be determined competitively. The Central Government has already issued detailed guidelines for tariff based bidding process for procurement of electricity by distribution licensees for medium or long-term period vide gazette notification dated 19th January, 2005. All future requirement of power should be procured competitively by distribution licensees except in cases of expansion of existing projects or where there is a State controlled/owned company as an identified developer and where regulators will need to resort to tariff determination based on norms provided that expansion of generating capacity by private developers for this purpose would be restricted to one time addition of not more than 50% of the existing capacity. Even for the Public Sector projects, tariff of all new generation and transmission projects should be decided on the basis of competitive bidding after a period of five years or when the Regulatory Commission is satisfied that the situation is ripe to introduce such competition. 4.4.2 The real benefits of competition would be available only with the emergence of appropriate market conditions. Shortages of power supply will need to be overcome. Multiple players will enhance the quality of service through competition. All efforts will need to be made to bring power industry to this situation as early as possible in the overall interests of consumers. Transmission and distribution, i.e. the wires business is internationally recognized as having the characteristics of a natural monopoly where there are inherent difficulties in going beyond regulated returns on the basis of scrutiny of costs. 4.4.3 Tariff policy lays down following framework for performance based cost of service regulation in respect of aspects common to generation, transmission as well as distribution. These shall not apply to competitively bid projects as referred to in para 6.1 and para 7.1 (6). Sector specific aspects are dealt with in subsequent sections. a) Return on Investment Balance needs to be maintained between the interests of consumers and the need for investments while laying down rate of return. Return should attract investments at par with, if not in preference to, other sectors so that the electricity sector is able to create adequate capacity. The rate of return should be such that it allows generation of reasonable surplus for growth of the sector. The Central Commission would notify, from time to time, the rate of return on equity for generation and transmission projects keeping in view the assessment of overall risk and the prevalent cost of capital which shall be followed by the SERCs also. The rate of return notified by CERC for transmission may be adopted by the State Electricity Regulatory Commissions (SERCs) for distribution with appropriate modification taking

_____________________________________________________________________________ Engineering Staff College of India Page No.4.8
into view the higher risks involved. For uniform approach in this matter, it would be desirable to arrive at a consensus through the Forum of Regulators. While allowing the total capital cost of the project, the Appropriate Commission would ensure that these are reasonable and to achieve this objective, requisite benchmarks on capital costs should be evolved by the Regulatory Commissions. Explanation: For the purposes of return on equity, any cash resources available to the company from its share premium account or from its internal resources that are used to fund the equity commitments of the project under consideration should be treated as equity subject to limitations contained in (b) below. The Central Commission may adopt the alternative approach of regulating through return on capital. The Central Commission may adopt either Return on Equity approach or Return on Capital approach whichever is considered better in the interest of the consumers. The State Commission may consider ‘distribution margin’ as basis for allowing returns in distribution business at an appropriate time. The Forum of Regulators should evolve a comprehensive approach on “distribution margin” within one year. The considerations while preparing such an approach would, inter-alia, include issues such as reduction in Aggregate Technical and Commercial losses, improving the standards of performance and reduction in cost of supply. b) Equity Norms For financing of future capital cost of projects, a Debt: Equity ratio of 70:30 should be adopted. Promoters would be free to have higher quantum of equity investments. The equity in excess of this norm should be treated as loans advanced at the weighted average rate of interest and for a weighted average tenor of the long term debt component of the project after ascertaining the reasonableness of the interest rates and taking into account the effect of debt restructuring done, if any. In case of equity below the normative level, the actual equity would be used for determination of Return on Equity in tariff computations. c) Depreciation The Central Commission may notify the rates of depreciation in respect of generation and transmission assets. The depreciation rates so notified would also be applicable for distribution with appropriate modification as may be evolved by the Forum of Regulators. The rates of depreciation so notified would be applicable for the purpose of tariffs as well as accounting. There should be no need for any advance against depreciation. Benefit of reduced tariff after the assets have been fully depreciated should remain available to the consumers. d) Cost of Debt Structuring of debt, including its tenure, with a view to reducing the tariff should be encouraged. Savings in costs on account of subsequent restructuring of debt should be suitably incentivised by the Regulatory Commissions keeping in view the interests of the consumers.
_____________________________________________________________________________ Engineering Staff College of India Page No.4.9
e) Cost of Management of Foreign Exchange Risk Foreign exchange variation risk shall not be a pass through. Appropriate costs of hedging and swapping to take care of foreign exchange variations should be allowed for debt obtained in foreign currencies. This provision would be relevant only for the projects where tariff has not been determined on the basis of competitive bids. f) Operating Norms Suitable performance norms of operations together with incentives and dis-incentives would need be evolved along with appropriate arrangement for sharing the gains of efficient operations with the consumers. Except for the cases referred to in para 5.3 (h)(2), the operating parameters in tariffs should be at “normative levels” only and not at “lower of normative and actuals”. This is essential to encourage better operating performance. The norms should be efficient, relatable to past performance, capable of achievement and progressively reflecting increased efficiencies and may also take into consideration the latest technological advancements, fuel, vintage of quipments, nature of operations, level of service to be provided to consumers etc. Continued and proven inefficiency must be controlled and penalized. The Central Commission would, in consultation with the Central Electricity Authority, notify operating norms from time to time for generation and transmission. The SERC would adopt these norms. In cases where operations have been much below the norms for many previous years, the SERCs may fix relaxed norms suitably and draw a transition path over the time for achieving the norms notified by the Central Commission. Operating norms for distribution networks would be notified by the concerned SERCs. For uniformity of approach in determining such norms for distribution, the Forum of Regulators should evolve the approach including the guidelines for treatment of state specific distinctive features. g) Renovation and Modernatisation Renovation and modernization (it shall not include periodic overhauls) for higher efficiency levels needs to be encouraged. A multi-year tariff (MYT) framework may be prescribed which should also cover capital investments necessary for renovation and modernization and an incentive framework to share the benefits of efficiency improvement between the utilities and the beneficiaries with reference to revised and specific performance norms to be fixed by the Appropriate Commission. Appropriate capital costs required for pre-determined efficiency gains and/or for sustenance of high level performance would need to be assessed by the Appropriate Commission. (h) Multi Year Tariff 1) Section 61 of the Act states that the Appropriate Commission, for determining the
terms and conditions for the determination of tariff, shall be guided inter-alia, by multi-year tariff principles. The MYT framework is to be adopted for any tariffs to be determined from April 1, 2006. The framework should feature a five-year control period. The initial control period may however be of 3 year duration for transmission and distribution if deemed necessary by the Regulatory Commission on account of data uncertainties and other practical considerations. In cases of lack of reliable data, the Appropriate Commission may state assumptions in MYT for first control period and a fresh control period may be started as and when more reliable data becomes available.
2) In cases where operations have been much below the norms for many previous years
the initial starting point in determining the revenue requirement and the improvement

_____________________________________________________________________________ Engineering Staff College of India Page No.4.10
trajectories should be recognized at “relaxed” levels and not the “desired” levels. Suitable benchmarking studies may be conducted to establish the “desired” performance standards. Separate studies may be required for each utility to assess the capital expenditure necessary to meet the minimum service standards.
3) Once the revenue requirements are established at the beginning of the control period,
the Regulatory Commission should focus on regulation of outputs and not the input cost elements. At the end of the control period, a comprehensive review of performance may be undertaken.
4) Uncontrollable costs should be recovered speedily to ensure that future consumers
are not burdened with past costs. Uncontrollable costs would include (but not limited to) fuel costs, costs on account of inflation, taxes and cess, variations in power purchase unit costs including on account of hydro-thermal mix in case of adverse natural events.
5) Clear guidelines and regulations on information disclosure may be developed by the
Regulatory Commissions. Section 62 (2) of the Act empowers the Appropriate Commission to require licensees to furnish separate details, as may be specified in respect of generation, transmission and distribution for determination of tariff.
(i) Benefits under CDM
Tariff fixation for all electricity projects (generation, transmission and distribution) that result in lower Green House Gas (GHG) emissions than the relevant base line should take into account the benefits obtained from the Clean Development Mechanism (CDM) into consideration, in a manner so as to provide adequate incentive to the project developers.
4.4.4 While it is recognized that the State Governments have the right to impose duties, taxes, cess on sale or consumption of electricity, these could potentially distort competition and optimal use of resources especially if such levies are used selectively and on a non- uniform basis. In some cases, the duties etc. on consumption of electricity is linked to sources of generation (like captive generation) and the level of duties levied is much higher as compared to that being levied on the same category of consumers who draw power from grid. Such a distinction is invidious and inappropriate. The sole purpose of freely allowing captive generation is to enable industries to access reliable, quality and cost effective power. Particularly, the provisions relating to captive power plants which can be set up by group of consumers has been brought in recognition of the fact that efficient expansion of small and medium industries across the country will lead to faster economic growth and creation of larger employment opportunities. For realizing the goal of making available electricity to consumers at reasonable and competitive prices, it is necessary that such duties are kept at reasonable level. 4.4.5 Though, as per the provisions of the Act, the outer limit to introduce open access in distribution is 27.1.2009, it would be desirable that, in whichever states the situation so permits, the Regulatory Commissions introduce such open access earlier than this deadline.
_____________________________________________________________________________Engineering Staff College of India Page No.5.1
Section – 5 Learning Objectives:
a) Understanding Indian Electricity Grid Code b) Distribution system planning - Operating standards, Overall performance
standards c) Customer service d) Load research and demand side management
5.0 Regulation of Quality of Electricity Supply and Services 5.1 Compliance with the Grid Code 5.1.0 The Indian Electricity Grid Code (IEGC) is a regulation made by the Central Commission in exercise of powers under clause (h) of sub section (1) of Section 79 read with clause (g) of sub-section (2) of Section 178 of the Act. The IEGC also lays down the rules, guidelines and standards to be followed by various persons and participants in the system to plan, develop, maintain and operate the power system, in the most secure, reliable, economic and efficient manner, while facilitating healthy competition in the generation and supply of electricity. This is meant for all Inter-State transactions and transactions made through Power Exchanges. Every State Commission has framed and notified a Grid Code in line with the IEGC for seamless operation of the State Grid with Regional and National Grid, i.e. State Grid has to be in synchronization with the Regional Grid for optimum stability and reliability in operation of the Power System in the State. In addition, the Distribution Licensee shall comply with the general and technical conditions of License as explained in paragraph 5.2 onwards. 5.1.1 The Distribution Licensee (or Licensee) shall comply with the provisions of the Grid Code in so far as applicable to it. It is imperative that every officer in Distribution Company should read and understand the provisions made in IEGC and follow the same for the quality and reliability of supply and services. 5.1.2 The State Commission (or Commission) may, on reasonable grounds and after consultation with any affected Generating Companies, the Transmission Licensee and Bulk Supply Licensee and Bulk Suppliers or Retail Suppliers, issue directions relieving the Licensee of its obligation under paragraph 5.1 in respect of such parts of the Grid Code and to such extent as may be specified by the Commission. 5.2 Distribution Code and Construction Practices 5.2.1 The Licensee shall, within six months of issue of this License, prepare and submit to the Commission a Distribution Code, after consultation with the other Bulk Suppliers or Retail Suppliers, the Transmission Licensee and Bulk Supply Licensee, the Generating Companies and such other Persons as the Commission may specify. The Distribution Code shall be accompanied by a plan for its implementation. Once the Commission approves the Distribution Code and the said implementation plan, the Licensee shall implement and comply with such Distribution Code; Provided that the Commission may, at the instance of the Licensee, issue directions relieving the Licensee of its obligations under the Distribution Code in respect of such parts of the Licensee's Distribution System and to such extent as may be specified by the Commission.

_____________________________________________________________________________Engineering Staff College of India Page No.5.2
5.2.2 The Distribution Code shall cover all material technical aspects relating to connections to, and the operation and use of the Distribution System including the operation of the electrical lines and electrical plant and apparatus connected to the Distribution System in so far as relevant to the operation and use of the Distribution System and shall include, but not be limited to: (a) The Distribution planning and connection code containing:
(i) Planning code specifying the plan for laying the Distribution lines and the service lines in the Area of Supply, the technical and design criteria and procedures to be applied by the Licensee in the planning and development of the Licensee's Distribution System; and
(ii) Connection conditions specifying the technical, design and operational criteria to be complied with by any Person connected or seeking connection with the Licensee's Distribution System; and
(b) the Distribution operating code specifying the conditions under which the Licensee
shall operate the Licensee's Distribution System and under which Persons shall operate their plant and/or Distribution System in relation to the Licensee's Distribution System, in so far as necessary to protect the security and quality of supply and safe operation of the Licensee's Distribution System under both normal and abnormal operating conditions.
5.2.3 The Distribution Code shall be designed so as to permit the development, maintenance and operation of an efficient, coordinated and economical Distribution System. 5.2.4 The Licensee shall till the Distribution Code comes into force, follow the Interim Distribution Code. 5.2.5 The Licensee shall from time to time, as appropriate, review the Distribution Code and its implementation in consultation with the Transmission Licensee and Bulk Supply Licensee, Generating Companies, Bulk Suppliers or Retail Suppliers and such other Persons as the Commission may order. The Licensee shall also undertake such review as and when directed to do by the Commission. Following any such review, the Licensee shall send to the Commission:
(a) a report on the outcome of such review; (b) any proposed revisions to the Distribution Code as the Licensee (having
regard to the outcome of such review) reasonably thinks fit for the achievement of the objectives of the Distribution Code and this Licence; and
(c) all written representations or objections received during such review. 5.2.6 All revisions to the Distribution Code shall require approval from the Commission. 5.2.7 The Licensee shall make available to any Person requesting for it, copies of the Distribution Code and practices thereto in force at the relevant time, at a price not exceeding the reasonable cost of duplicating it. 5.2.8 A compilation of the existing codes and practices relating to construction of the Licensee's Distribution System and its Distribution facilities shall be filed with the Commission by the Licensee within 60 days of the grant of Distribution License. The Licensee shall follow the existing codes and practices with such modification as the

_____________________________________________________________________________Engineering Staff College of India Page No.5.3
Commission may direct from time to time. The construction practices shall be reviewed and upgraded by the Licensee from time to time, as appropriate, based on relevant technological improvements and changes. 5.3: Distribution System Planning and Security Standards, Distribution System Operating Standards, Overall Performance Standards 5.3.1 The Licensee shall comply with the Existing Distribution System Planning and Security Standards and the Existing Distribution System Operating Standards filed by the Distribution Licensee with the Commission, with such modifications as the Commission may direct, until the Distribution System Planning and Security Standards and Distribution System Operating Standards proposed by the Licensee pursuant to paragraph 5.3.3 are approved by the Commission. 5.3.2 The Licensee shall plan and operate its Distribution System to ensure that, subject to the availability of adequate power of appropriate quality, the system is capable of providing Consumers with a safe, reliable and efficient Supply of electricity. In particular, the Licensee shall:
(a) plan and develop its Distribution System in accordance with the Distribution System Planning and Security Standards together with the Distribution Code as approved by the Commission; and
(b) operate the Licensee's Distribution System in accordance with the Distribution System Operating Standards together with the Distribution Code as approved by the Commission.
5.3.3 The Licensee shall, within six months after the Distribution License becomes effective, prepare in consultation with the Bulk Suppliers or Retail Suppliers, Generating Companies, Transmission Licensee and Bulk Supply Licensee and such other Person as the Commission may specify, and submit to the Commission for approval, the Licensee's proposal for Distribution System Planning and Security Standards and Distribution System Operating Standards. 5.3.4 Having regard to any written representation received by the Commission or upon its own motion, after giving the Licensee an opportunity to present its perspective on the same, for reasons recorded in writing, the Commission may require the Licensee to revise the Distribution System Planning and Security Standards and the Distribution System Operating Standards, and Licensee shall comply with the directions of the Commission. 5.3.5 The Licensee shall, within 3 months of the end of each financial year, submit to the Commission a report indicating the performance of the Licensee's Distribution System during the previous financial year. The Licensee shall, if required by the Commission, publish a summary of the report in a manner approved by the Commission. 5.3.6 The Licensee shall conduct its Licensed Business in the manner which it reasonably considers to be best calculated to achieve the Overall Performance Standards in connection with provision of Supply services and the promotion of the efficient use of electricity by Consumers, as may be prescribed by the Commission, pursuant to Section 34 of the APER Act or Section 57 of The Electricity Act, 2003.
_____________________________________________________________________________Engineering Staff College of India Page No.5.4
5.3.7 The Licensee shall supply annually, information to the Commission as to the means by which it proposes to achieve the Overall Performance Standards and other standards referred to in this paragraph 5.3. 5.3.8 The Licensees’ Standards of Performance, as prescribed and notified under Andhra Pradesh Electricity Regulatory Commission (APERC) Regulation No. 7 of 2004 is herein reproduced and attached as the Overall Performance Standards under APPENDIX - A. 5.4 Obligation to Connect Consumers and Public Lamps 5.4.1 Subject to the other provisions of the Distribution License, the Licensee shall have the following obligations: (a) The Licensee shall on the application of the owner or occupier of any premises within
the Area of Supply, give connection to the Licensee's Distribution System for the purposes of providing a Supply of electricity to those premises, including the laying of any required Distribution mains.
(b) Where the owner or occupier of any premises requires connection under the terms of this paragraph 5.4.1, the form of application to be made and the procedure for responding to that application shall be in accordance with the procedure specified by the Licensee and approved by the Commission.
(c) Nothing in this paragraph 5.4.1 shall require the Licensee to provide connection in the event of a Force Majeure or circumstances where the Commission by a general or special order considers that the giving of connection is otherwise either beyond the reasonable control of the Licensee or that the Licensee should be relieved of the obligations for reasons to be recorded by the Commission.
5.4.2 The Licensee shall, before commencing to lay down or place a service-line in any area in which a Distribution main has not already been laid down or placed, serve upon the local authority (if any) falling in the area as lies between the points of origin and termination of the service line to be laid down or placed, a notice stating that the Licensee intends to lay down or place a service line and confirming that if within 21 days from the date of the notice, the local authority require in accordance with paragraphs 5.3 and 5.5, that a Supply shall be given for any public lamps, the necessary Distribution main will be laid down or placed by the Licensee at the same time as the service line. In addition to the above, the Licensee shall also publish the notice of such proposed work in the local newspapers and also display notices at its offices in the relevant area for information of the public so as to enable any owner or occupier of the premises abutting so much of the area lies between the points of origin and termination of the service line to be laid down or placed and any one or more occupiers may apply to the Licensee for laying down the distribution main and connected works along with the service line. 5.4.3 Where, after Distribution mains have been laid down under the provisions of paragraph 5.4.1 and the supply of energy through those mains or any of them has commenced, a requisition is made by the State Government or by a local authority requiring the Licensee to supply for a period of not less than two years, energy for any public lamps within the Area of Supply, the Licensee shall supply, and save in so far as it is prevented from doing so by events of Force Majeure and technical viability/constraints, continue to supply energy for such lamps in such quantities as the State Government or the local authority, as the case may be, may require. The State
_____________________________________________________________________________Engineering Staff College of India Page No.5.5
Government or the relevant local authority, as the case may be, may require the Licensee: (a) to provide the mains and other equipment for public lamps; and (b) to use for that purpose supports, if any, previously erected or set up by it for supply of
energy. 5.4.4 The Licensee may levy any reasonable charge/s for carrying out works/release of supply pursuant to paragraphs 5.4.1 and 5.4.2, in accordance with any procedures that may be stipulated by the Licensee and approved by the Commission as well as the provisions of the Act and/or Regulations. 5.4.5 The Licensee shall enter into or make such arrangements for the use of the Distribution System including but not limited to electric lines, electrical plant or plants and associated equipment operated by the Licensee as provided in Clause (a) of sub-Section (4) of Section 15 of the APER Act, by any Person. On application made by any such Person, the Licensee shall offer to enter into an agreement with that Person for the use of the Distribution System: (a) based on tariff and Use of System charges to be paid by the user, which shall be in
accordance with tariffs and charges for Transmission, Distribution and Retail Supply of electricity as determined by the State Commission under Regulation 4 and 5 of 2005 and Section 62 of the Electricity Act, 2003 and as per details given in respective year’s Tariff Order;
(b) to accept into the Distribution System electricity provided by that Person; and (c) to deliver such electricity, adjusted for losses of electricity, to a designated exit point. 5.5: Obligation to Supply and Power Supply Planning Standards 5.5.1 The Licensee is duty bound to supply on request as per Section 43 of the Electricity Act, 2003. The Licensee shall also take all reasonable steps to ensure that all Consumers connected to the Licensee's Distribution System receive a safe, economical and reliable Supply of electricity as provided in the performance standards referred to in the License, the Consumer rights statement referred to in paragraph 5.6.3, and the complaint handling procedures referred to in paragraph 5.6.2, except where: (a) the Licensee discontinues Supply to certain Consumers under Section 56 of the
Electricity Act 2003(the Act) or in accordance with the Electricity Supply Code drawn up pursuant to Section 50 of the Act; or
(b) the Licensee is obliged to regulate the Supply to Consumers as may be directed by the State Commission under Section 23 of the Electricity Act, 2003.
5.5.2 The Licensee shall: (a) forecast annually the demand for power within the Area of Supply in each of the next
succeeding 10 years; (b) prepare and submit such forecasts to the Commission in accordance with the
guidelines issued by the Commission from time to time; and (c) co-operate with the Transmission and Bulk Supply Licensee in the preparation of
power demand forecasts for the state of Andhra Pradesh. 5.5.3 Subject to the foregoing paragraphs, the Licensee shall purchase electricity from Bulk Suppliers and others as consented to by the Commission in quantities which the Licensee considers sufficient to meet the expected demand of the Licensee's Consumers, or where appropriate, such lesser quantities as the Bulk Suppliers and

_____________________________________________________________________________Engineering Staff College of India Page No.5.6
others are able to provide on account of shortage of available sources of electricity generation, imports or supply. 5.5.4 The Licensee shall purchase electricity or the energy required by the Licensee for Distribution and Retail Supply in an economical manner and under a transparent power purchase or procurement process and in accordance with the Regulations, guidelines, directions made by the Commission from time to time. 5.6: Consumer Service 5.6.1 Code of Practice on Payment of Bills (a) The Licensee shall, within six months after this License has become effective,
prepare and submit to the Commission, for its approval, a code of practice concerning the payment of electricity bills by Consumers and including appropriate guidance for the assistance of such Consumers who may have difficulty in paying such bills, and procedures for disconnecting Consumers for non-payment. In granting the approval, the Commission may make such modifications, as it considers necessary.
(b) The Commission may, upon receiving a representation or otherwise, require the Licensee to review, the code of practice prepared in accordance with paragraph 5.6.1(a) and the manner in which it has been implemented with a view to determine whether any modification should be made to it or to the manner of its implementation.
(c) The Licensee shall, in consultation with such other Persons as the Commission may direct upon review submit any revision to the code of practice that it wishes to make, to the Commission for its approval, including any representation received by the Licensee and not accepted by it. The Commission may modify the code of practice concerning payment of bills as it considers necessary.
(d) The Licensee shall: (i) draw to the attention of Consumers, in such manner as the Commission may
direct, the existence of the code of practice and each substantive revision of it and how they may inspect or obtain a copy of the code of practice in its latest form;
(ii) make a copy of the code of practice, revised from time to time, available for
inspection by members of the public during normal working hours; and (iii) provide free of charge an updated copy of the code of practice revised from
time to time to each new Consumer and to any other Person who requests for it at a price not exceeding the reasonable cost of duplicating it.
(e) The Licensee shall comply with the existing practice and procedures with respect to the payment of electricity bills by Consumers filed by it with the Commission, with such modifications as the Commission may direct, until the code of practice on payment of bills by Consumers, as mentioned in this paragraph is adopted with the approval of the Commission.
5.6.2 Complaint Handling Procedure: (a) The Licensee shall within six months after this Licence has become effective and
with approval of the Commission, specify a procedure for handling complaints from Consumers of the Licensee. The Commission may hold consultations with the Commission Advisory Committee or a Person or body of Persons, who the

_____________________________________________________________________________Engineering Staff College of India Page No.5.7
Commission considers as representing the interest of the Consumers likely to be affected and make such modification of the procedure, as it believes necessary before granting such approval.
(b) The Commission may, upon receiving a representation, or otherwise, require the Licensee to review the complaint handling procedure prepared in accordance with paragraph 5.6.2(a) and the manner in which it has been implemented, with a view to determine whether any modification should be made to it or to the manner of its implementation.
(c) Any procedure established pursuant to this paragraph 5.6.2, including any revisions to it, shall specify the periods within which it is intended that different kinds of complaint should be processed and resolved.
(d) The Licensee shall submit any revision proposed to be made to the procedure established in accordance with paragraph 5.6.2(a) to the Commission for its approval.
(e) The Licensee shall: (i) draw to the attention of Consumers, in such manner as the Commission may
direct, the existence of the complaint handling procedure and each substantive revision of it and how the Consumers may inspect or obtain copies of such procedure in its latest form.
(ii) make a copy of its complaint handling procedure, revised from time to time,
available for inspection by members of the public at the relevant offices of the Licensee during normal working hours; and
(iii) provide free of charge a copy of the complaint handling procedure revised from
time to time to each new Consumer, and to any other Person who requests for it at a price not exceeding the reasonable cost of duplicating it.
5.6.3 Consumer Rights Statement (a) The Licensee shall, within six months after this License has come into force or such
other time as the Commission may allow, prepare and submit to the Commission for approval, a consumer rights statement, explaining to Consumers their rights as Consumers served by the Licensee. The Commission may, upon holding such consultation with the Commission Advisory Committee, and such other Persons or bodies of Persons who the Commission considers as representing the interests of Consumers likely to be affected by it, and may make such modification of the statement, as it considers necessary in public interest.
(b) The Commission may, upon receiving a representation or otherwise, require the Licensee to review the consumer rights statement prepared in accordance with paragraph 5.6.3(a) and the manner in which it has been implemented with a view to determining whether any modification should be made to it or to the manner of its implementation.
(c) The Licensee shall submit any revision to the consumer rights statement that it wishes to make to the Commission for its approval, including any representation received by the Licensee and not accepted by it. The Commission may modify the existing consumer rights statement, as it considers necessary.
(d) The Licensee shall: (i) draw to the attention of Consumers, in such manner as the Commission may
direct, the existence of its consumer rights statement and each substantive
_____________________________________________________________________________Engineering Staff College of India Page No.5.8
revision of it and how they may inspect or obtain a copy of such consumer rights statement in its latest form.
(ii) make a copy of its consumer rights statement, revised from time
to time, available for inspection by members of the public at its offices during normal working hours; and
(iii) provide a copy of the consumer rights statement, revised from time to time, to all
new Consumers to be served by it, and to any other Person who requests for it at a price not exceeding the reasonable cost of duplicating it.
5.6.4 The Standards of Performance may be set by the Commission, or may be proposed by the Licensee for the Commission's approval. The Commission may evaluate the Licensee's compliance with the Standards of Performance and adherence to the code of practice on payment of bills, complaint handling procedure and consumer rights statement set forth in accordance with this paragraph 5.6 and the Licensee shall provide to the Commission such information as it may require enabling it to do so. 5.6.5 Without prejudice to the other requirements under this License, the Commission may prescribe the types of grievances and complaints of the Consumers which shall be attended to by the Licensee within the time specified by the Commission and the Commission shall be entitled to prescribe an appropriate level of compensation, which the Licensee shall pay to the Consumers in the event of any default or failure on the part of the Licensee to attend timely to such grievance or complaint. The Commission may also require the Licensee to pay directly to Consumers concerned the compensation amount and file a statement thereof with the Commission. The Commission may make Regulations and pass orders to give effect to the above. 5.7 Load Research and Demand Side Management (DSM) Measures 5.7.1 Load research and load estimation in electricity is the most important activity for optimum planning, investment and operation of distribution system. Load research is taken as a model, where data collected from a class of consumers is fed for analysis to study the consumption behavior and other parameters required for system planning, pricing and demand side management. It is a simple form customer class load model, analysis of the origins of customers’ load distribution, a method for estimation of the confidence interval of customer loads and Distribution Load Estimation (DLE), which utilizes both the load models and measurements from distribution network. 5.7.2 These developments bring new knowledge and understanding of electricity customer loads, their statistical behavior and new simple methods of how the loads should be estimated in electric utility applications. The economic benefit is to decrease investment costs by reducing the planning margin when loads are more reliably estimated in electric utilities. Such load research techniques are widely used in European and American utilities. A load research technique is described and placed as ANNEXURE – B. In addition the study of Report on Sixteenth Power Survey of India will provide an incite into further illustrations on the subject.

__________________________________________________________________________ Engineering Staff College of India Page No.6.1
Section – 6 Learning Objectives:
a) The role of the middle management executives of utilities b) Earlier directives of SERC
i) Safety improvement - Day to day maintenance activities - O&M exigencies in rural areas
ii) Replacement of failed transformers iii) Functioning of consumer grievances Redressal Forum iv) Energy conservation v) Filing of information on maintenance vi) Furnishing of sales information in audited accounts
c) Fresh directives to Discoms for the year 2011-12 6.0 The Role of Middle Management Executives of the Utilities under Regulatory Framework 6.0 The role of middle management executives in organizations Wharton management professor Ethan Mollick has a message for knowledge-based companies: Pay closer attention to your middle managers. They may have a greater impact on company performance than almost any other part of the organization. In other words, says Mollick, "the often overlooked and sometimes-maligned middle managers matter. They are not interchangeable parts in an organization." His view upends the long-held belief that performance differences between firms are due mainly to organizational factors – such as business strategy, management systems and HR practices -- rather than to differences among employees. The importance of individual skills and characteristics can be especially significant when measuring firm performance in industries and fields that value innovation, like computer games, software, consulting, biotech and marketing, according to Mollick, who recently completed a paper on this topic titled, "People and Process: Suits and Innovators: Individuals and Firm Performance." It is in these knowledge-intensive industries where variation in the abilities of middle managers – the "suits" he refers to in his paper -- has a "particularly large impact on firm performance, much larger than that of individuals who are assigned innovative roles," he says. The influence these suits exert, he suggests, stems from their key role in project management, including such tasks as resource allocation and supervision of deadlines – responsibilities often perceived as the bureaucratic, more routine and less glamorous side of the business. Middle managers also can play a key role in fostering innovative and creative environments. In the short term at least, middle managers will feel secure in the knowledge that they are needed to drive through change - what happens afterwards is less certain, writes John Charlton. "Middle management is critical to the change process," says Jane Cranwell-Ward, programme director for managing change at Henley Business School. "They are the glue in the middle." She adds that those middle manager who have had project management experience, for instance in construction, are most likely to be proficient at driving through change.
__________________________________________________________________________ Engineering Staff College of India Page No.6.2
No surprise then that Cranwell-Ward recommends the following skills and knowledge as key for middle managers managing change:
• setting objectives • identifying responsibilities • identifying risk • identifying the effects of failure • knowing how to manage and control processes • setting milestones and meeting objectives on time • engaging staff
"Keeping people engaged is very important," she says. "They need to know what's expected of them." This involves regular and open communications about impending and continuing change programmes. Despite her view that public sector spending cuts are "too drastic and happening too quickly", Cranwell-Ward says there are some "very talented people in the public sector who will see things through". Middle managers have crucial role to play in the complex regulatory process of distribution business. They have to interface with the Top management in one hand and the lower management in the field as interface with the customers, on the other hand. All the implementation programmes like managing change or implementing the regulatory requirements rests with them. In the regulation of public utility like electricity distribution business, disclosure of vital information is the key to regulatory success. Middle management executives in the utility acquire all vital information relating to the electricity distribution business. 6.1 Compliance to Regulatory Requirements and Directives 6.1.1 The process of regulation of distribution business requires a lot of information to be disclosed by the distribution business in the formats prescribed by the State Electricity Regulatory Commission (SERC). Such information comprises of a mix of Technical, Commercial and Financial data to be compiled every month by the middle management executives of the distribution licensees. Such executives have the responsibility to read the terms and conditions laid down in the distribution license, operate the business in conformation to such conditions of the license and collect operational and other relevant data before compiling them in regulatory formats. 6.1.2 The Commission issues directives in the Tariff Orders for Distribution and Retail Supply business. Some of the directives require continuous compliance, i.e. action to be taken on the issues every year for a number of years till the Commission is satisfied that the licensee has either fully complied the directive or the directive is no more relevant in the present context. Middle management executives in the utility acquire all vital information relating to the electricity distribution business and comply with all such directives of the Commission to the satisfaction of the Commission. They furnish information related to the Standards of Performance and customer services in the formats prescribed by the Commission. Sometimes, the Commission takes up review meetings and the middle managers prepare and present all information related to the performance of the licensees including effective services to the consumers. 6.1.3 The middle management executives of licensees (DISCOMs) are expected to learn how to prepare the Status Report on implementation of directives issued by any
__________________________________________________________________________ Engineering Staff College of India Page No.6.3
SERC. As an example, the following paragraphs depict the actual report given by Andhra Pradesh Central Power Distribution Company Limited (APCPDCL), submitted to APERC, showing compliance of various directives issued by the Commission in the Tariff Orders passed during the year 2011-12 and in orders passed prior to that year. 6.1.4 Status on implementation of Directives 6.1.4.1 Earlier Directives (i). Safety improvement and day to day maintenance activities through attention to
O&M exigencies in Rural Areas The Licensees shall examine the feasibility of creating CBD teams in Rural Areas on similar lines to the existing scheme of CBDs in Metro/Town Areas. Discom: The committee of CGMs has opined that CBDs (as existing in Hyderabad city) are to be formed in Rural areas in concentrated/ Industrial areas, Municipalities and Corporations in phased manner. (ii) Replacement of failed Distribution Transformers (DTRs) a) The Licensees shall instruct their respective officials to lodge complaints with
the police in the event of theft of DTR. b) The complaint lodged by the farmers with the service team of the DISCOMS
should be enough for them to start the process of replacement of DTR and take action. The licensee shall take steps to restore the supply by arranging another DTR in place of stolen DTR.
c) The Licensees shall display the details of replacement of failed DTRs (rating,
place of failure and time taken for replacement) on daily basis at the Divisional, Sub- Divisional and Section offices.
Discom: a) Instructions were issued to all the Superintending Engineers/ Operation, SCADA
and Masterplan circles vide Memo.no.2496/09, dt: 28.03.2009, 164/09, dt: 27.04.2009 and 921/09, dt: 07.07.2011 with regard to registering the cases in the event of theft of materials and measures to curb the theft of DTRs.
b) As per the APERC regulation No.7 of 2004 (Licensee’s Standards of
Performance), APCPDCL is restoring power supply in case of all the failed Distribution Transformers (DTRs) [irrespective whether they are sick or failed or burnt or stolen; agricultural DTRs or non-agricultural DTRs] by replacement within 24 hours of receiving the complaint in Rural areas. APCPDCL is maintaining sufficient quantity of healthy rolling stock of DTRs at all its SPM centers to facilitate timely replacement of the failed DTRs.
c) The details of failures and replacement of DTRs is being displayed at all the
offices. (iii) Functioning of Consumer Grievances Redressal Forums (CGRFs) a) The Licensees shall take all the required publicity measures like invo lv ing the
local print and electronic media, extension programmes in schools, distribution
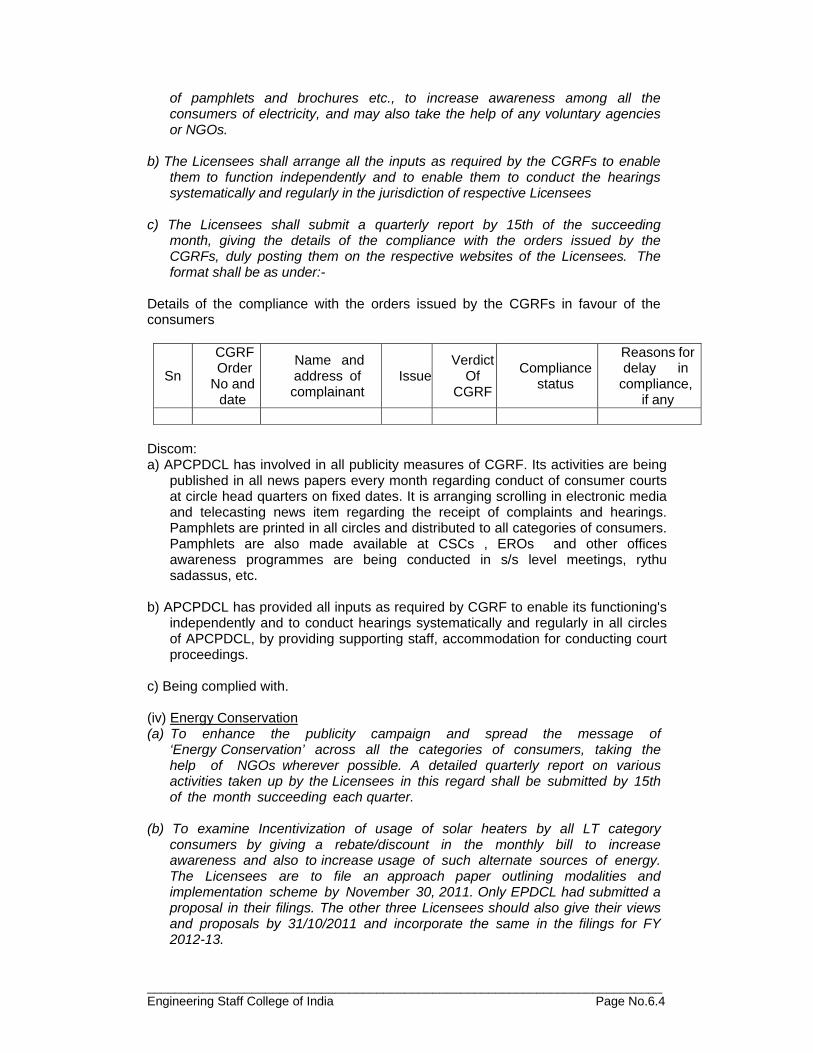
__________________________________________________________________________ Engineering Staff College of India Page No.6.4
of pamphlets and brochures etc., to increase awareness among all the consumers of electricity, and may also take the help of any voluntary agencies or NGOs.
b) The Licensees shall arrange all the inputs as required by the CGRFs to enable
them to function independently and to enable them to conduct the hearings systematically and regularly in the jurisdiction of respective Licensees
c) The Licensees shall submit a quarterly report by 15th of the succeeding
month, giving the details of the compliance with the orders issued by the CGRFs, duly posting them on the respective websites of the Licensees. The format shall be as under:-
Details of the compliance with the orders issued by the CGRFs in favour of the consumers
Sn
CGRF Order
No and date
Name and address of complainant
IssueVerdict
Of CGRF
Compliance status
Reasons fordelay in
compliance, if any
Discom: a) APCPDCL has involved in all publicity measures of CGRF. Its activities are being
published in all news papers every month regarding conduct of consumer courts at circle head quarters on fixed dates. It is arranging scrolling in electronic media and telecasting news item regarding the receipt of complaints and hearings. Pamphlets are printed in all circles and distributed to all categories of consumers. Pamphlets are also made available at CSCs , EROs and other offices awareness programmes are being conducted in s/s level meetings, rythu sadassus, etc.
b) APCPDCL has provided all inputs as required by CGRF to enable its functioning's
independently and to conduct hearings systematically and regularly in all circles of APCPDCL, by providing supporting staff, accommodation for conducting court proceedings.
c) Being complied with.
(iv) Energy Conservation (a) To enhance the publicity campaign and spread the message of
‘Energy Conservation’ across all the categories of consumers, taking the help of NGOs wherever possible. A detailed quarterly report on various activities taken up by the Licensees in this regard shall be submitted by 15th of the month succeeding each quarter.
(b) To examine Incentivization of usage of solar heaters by all LT category
consumers by giving a rebate/discount in the monthly bill to increase awareness and also to increase usage of such alternate sources of energy. The Licensees are to file an approach paper outlining modalities and implementation scheme by November 30, 2011. Only EPDCL had submitted a proposal in their filings. The other three Licensees should also give their views and proposals by 31/10/2011 and incorporate the same in the filings for FY 2012-13.
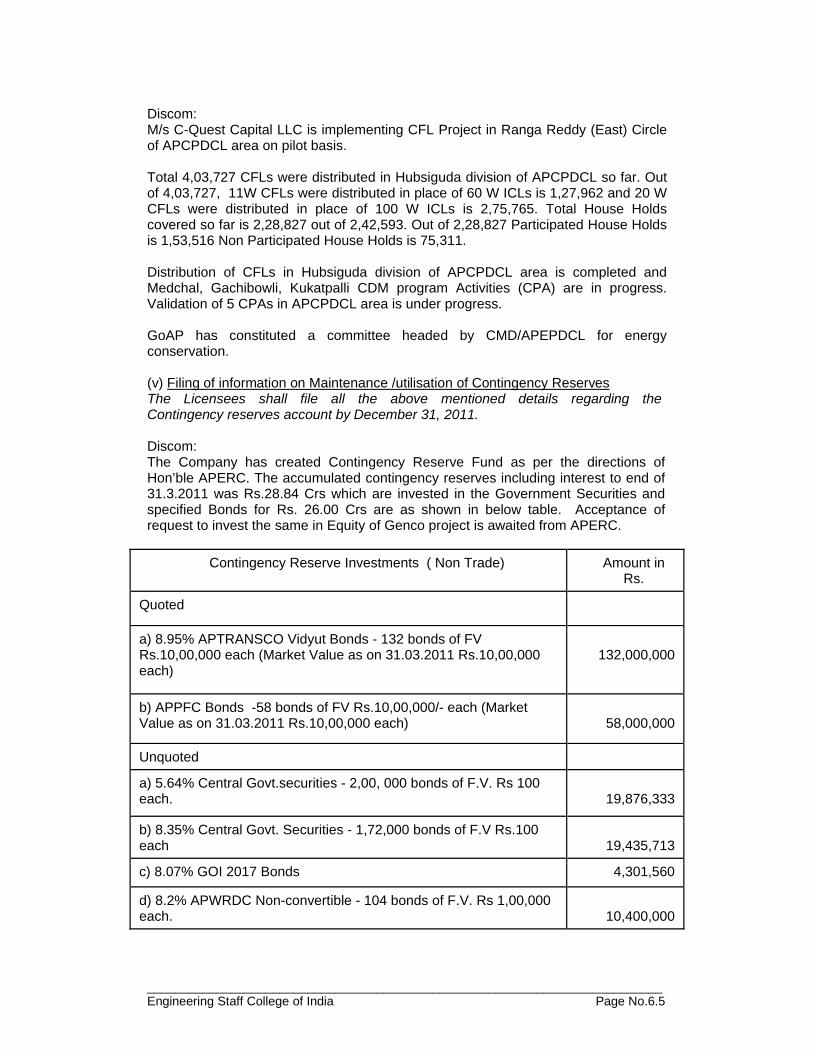
__________________________________________________________________________ Engineering Staff College of India Page No.6.5
Discom: M/s C-Quest Capital LLC is implementing CFL Project in Ranga Reddy (East) Circle of APCPDCL area on pilot basis. Total 4,03,727 CFLs were distributed in Hubsiguda division of APCPDCL so far. Out of 4,03,727, 11W CFLs were distributed in place of 60 W ICLs is 1,27,962 and 20 W CFLs were distributed in place of 100 W ICLs is 2,75,765. Total House Holds covered so far is 2,28,827 out of 2,42,593. Out of 2,28,827 Participated House Holds is 1,53,516 Non Participated House Holds is 75,311. Distribution of CFLs in Hubsiguda division of APCPDCL area is completed and Medchal, Gachibowli, Kukatpalli CDM program Activities (CPA) are in progress. Validation of 5 CPAs in APCPDCL area is under progress.
GoAP has constituted a committee headed by CMD/APEPDCL for energy conservation. (v) Filing of information on Maintenance /utilisation of Contingency Reserves The Licensees shall file all the above mentioned details regarding the Contingency reserves account by December 31, 2011. Discom: The Company has created Contingency Reserve Fund as per the directions of Hon’ble APERC. The accumulated contingency reserves including interest to end of 31.3.2011 was Rs.28.84 Crs which are invested in the Government Securities and specified Bonds for Rs. 26.00 Crs are as shown in below table. Acceptance of request to invest the same in Equity of Genco project is awaited from APERC.
Contingency Reserve Investments ( Non Trade) Amount in
Rs.
Quoted
a) 8.95% APTRANSCO Vidyut Bonds - 132 bonds of FV Rs.10,00,000 each (Market Value as on 31.03.2011 Rs.10,00,000 each)
132,000,000
b) APPFC Bonds -58 bonds of FV Rs.10,00,000/- each (Market Value as on 31.03.2011 Rs.10,00,000 each)
58,000,000
Unquoted
a) 5.64% Central Govt.securities - 2,00, 000 bonds of F.V. Rs 100 each.
19,876,333
b) 8.35% Central Govt. Securities - 1,72,000 bonds of F.V Rs.100 each
19,435,713
c) 8.07% GOI 2017 Bonds 4,301,560
d) 8.2% APWRDC Non-convertible - 104 bonds of F.V. Rs 1,00,000 each.
10,400,000
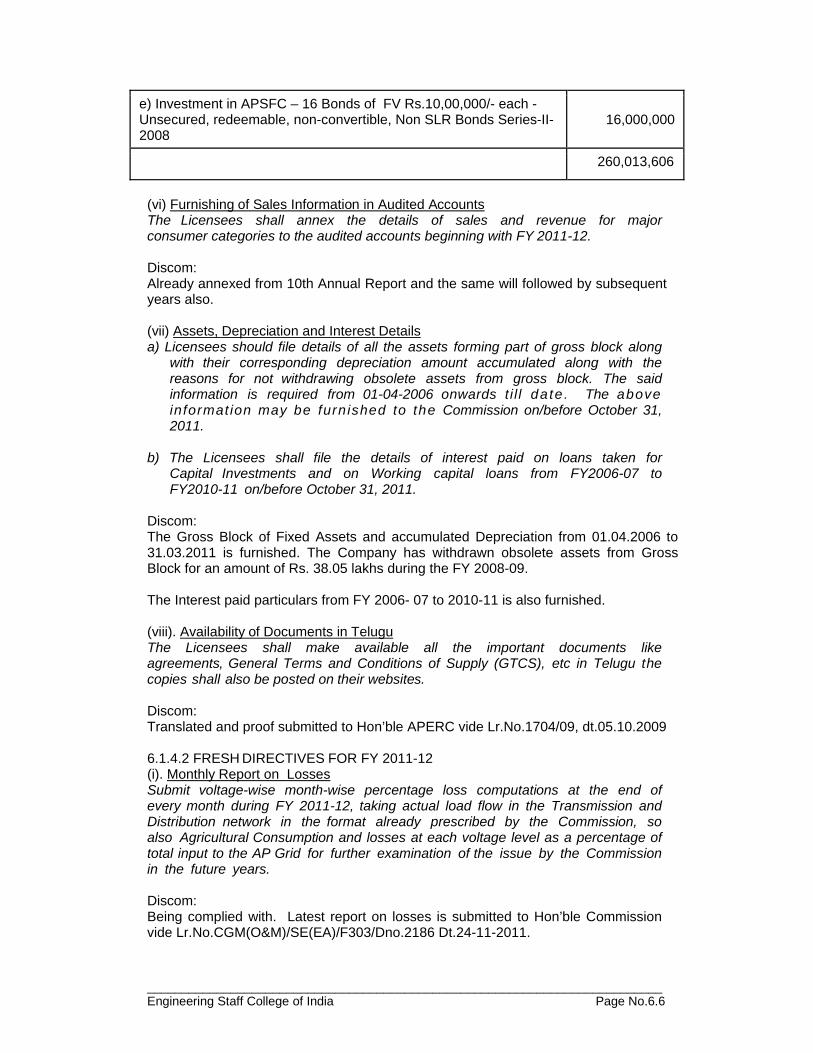
__________________________________________________________________________ Engineering Staff College of India Page No.6.6
e) Investment in APSFC – 16 Bonds of FV Rs.10,00,000/- each - Unsecured, redeemable, non-convertible, Non SLR Bonds Series-II-2008
16,000,000
260,013,606
(vi) Furnishing of Sales Information in Audited Accounts The Licensees shall annex the details of sales and revenue for major consumer categories to the audited accounts beginning with FY 2011-12. Discom: Already annexed from 10th Annual Report and the same will followed by subsequent years also. (vii) Assets, Depreciation and Interest Details a) Licensees should file details of all the assets forming part of gross block along
with their corresponding depreciation amount accumulated along with the reasons for not withdrawing obsolete assets from gross block. The said information is required from 01-04-2006 onwards t i l l da te . The above informat ion may be furn ished to the Commission on/before October 31, 2011.
b) The Licensees shall file the details of interest paid on loans taken for
Capital Investments and on Working capital loans from FY2006-07 to FY2010-11 on/before October 31, 2011.
Discom: The Gross Block of Fixed Assets and accumulated Depreciation from 01.04.2006 to 31.03.2011 is furnished. The Company has withdrawn obsolete assets from Gross Block for an amount of Rs. 38.05 lakhs during the FY 2008-09. The Interest paid particulars from FY 2006- 07 to 2010-11 is also furnished. (viii). Availability of Documents in Telugu The Licensees shall make available all the important documents like agreements, General Terms and Conditions of Supply (GTCS), etc in Telugu the copies shall also be posted on their websites. Discom: Translated and proof submitted to Hon’ble APERC vide Lr.No.1704/09, dt.05.10.2009 6.1.4.2 FRESH DIRECTIVES FOR FY 2011-12 (i). Monthly Report on Losses Submit voltage-wise month-wise percentage loss computations at the end of every month during FY 2011-12, taking actual load flow in the Transmission and Distribution network in the format already prescribed by the Commission, so also Agricultural Consumption and losses at each voltage level as a percentage of total input to the AP Grid for further examination of the issue by the Commission in the future years. Discom: Being complied with. Latest report on losses is submitted to Hon’ble Commission vide Lr.No.CGM(O&M)/SE(EA)/F303/Dno.2186 Dt.24-11-2011.

__________________________________________________________________________ Engineering Staff College of India Page No.6.7
(ii). Agricultural Consumption Estimate The Licensees shall immediately report the progress on implementation of new methodology and also make a presentation to the Commission on or before May 31, 2011. The progress report on implementation of new methodology shall be put on their respective Licensee websites and these reports should be periodically updated. Till the time the new methodology is implemented, the existing method of estimating consumption based on DTR meter readings shall be continued.
Discom: Implementation of new methodology has since been completed in Ananthapur Circle and the readings for the months of Aug and Sep’2011 are enclosed. Implementation in other circles is under progress. (iii). Supply to Industrial Units Located in RESCOS’ Supply Areas The Licensees shall discuss with RESCOs and come up with appropriate proposals before the Commission by 31st July , 2011.
Discom: No RESCO in APCPDCL area
(iv). Additional Power Purchase Volumes The DISCOMS shall not buy any power beyond the volumes approved in tariff orders and based on the consumption, they shall approach the commission for further approvals of quantity as well as rate of power to be purchased. Discom: Submitted to Hon’ble APERC for the months of Apr to July and August vide Lr.No:CGM(Comml)/CPDCL/D.No.2231/Dt.27.09.2011 and Lr. No: CMD/ D.No 2246/11 Dt.7.10.2011 respectively. Abstract of the excess power purchased is as follows:
Sl No Month Target(MU) Actual(MU) Variance (MU)
1 April 7202 7222 20 2 May 6828 7152 324 3 June 6323 6565 242 4 July 6545 6720 174 5 August 6867 7245 378
(v). Monthly Consumption and Daily Grid Reports The Commission directs the DISCOMS to submit monthly statements on station wise deviations of actual quantum purchased and Fixed & Variable Costs thereof compared to the respective values taken in the Tariff Order. Such reports must be submitted with in 30 days of completion of each month. They are also directed to submit to the Commission the soft copies of Daily Grid Reports for each month as the supporting information for such deviations.
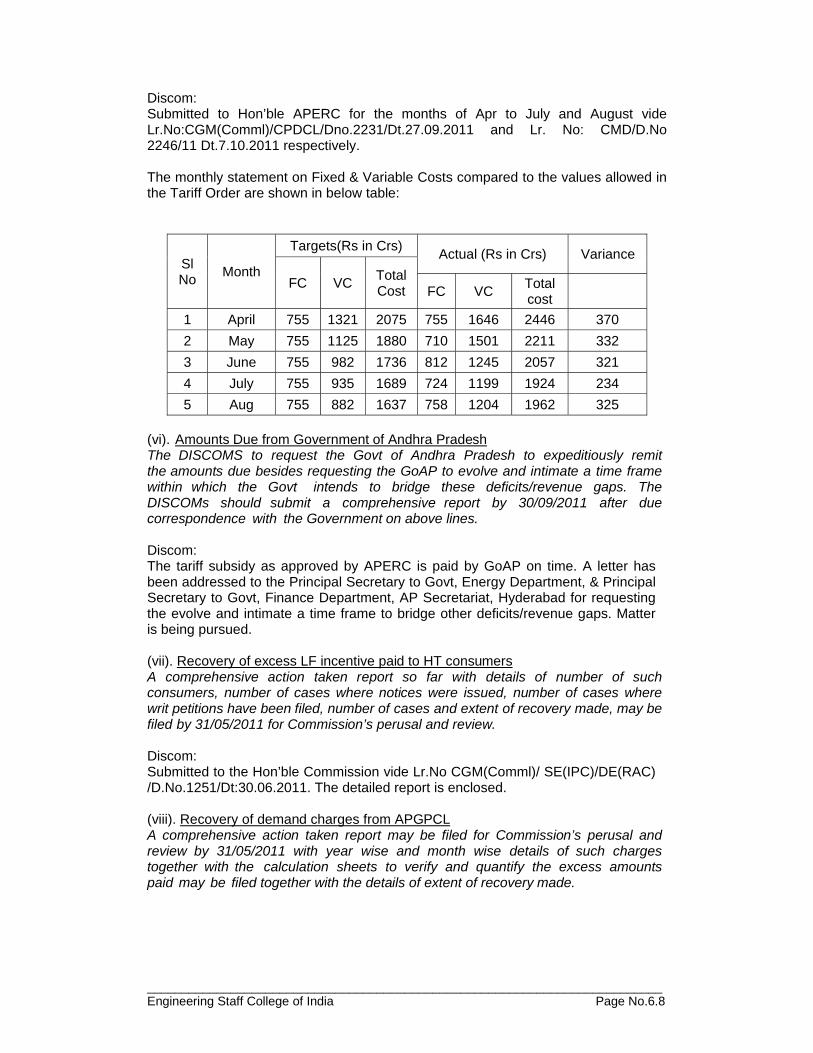
__________________________________________________________________________ Engineering Staff College of India Page No.6.8
Discom: Submitted to Hon’ble APERC for the months of Apr to July and August vide Lr.No:CGM(Comml)/CPDCL/Dno.2231/Dt.27.09.2011 and Lr. No: CMD/D.No 2246/11 Dt.7.10.2011 respectively. The monthly statement on Fixed & Variable Costs compared to the values allowed in the Tariff Order are shown in below table:
(vi). Amounts Due from Government of Andhra Pradesh The DISCOMS to request the Govt of Andhra Pradesh to expeditiously remit the amounts due besides requesting the GoAP to evolve and intimate a time frame within which the Govt intends to bridge these deficits/revenue gaps. The DISCOMs should submit a comprehensive report by 30/09/2011 after due correspondence with the Government on above lines.
Discom: The tariff subsidy as approved by APERC is paid by GoAP on time. A letter has been addressed to the Principal Secretary to Govt, Energy Department, & Principal Secretary to Govt, Finance Department, AP Secretariat, Hyderabad for requesting the evolve and intimate a time frame to bridge other deficits/revenue gaps. Matter is being pursued. (vii). Recovery of excess LF incentive paid to HT consumers A comprehensive action taken report so far with details of number of such consumers, number of cases where notices were issued, number of cases where writ petitions have been filed, number of cases and extent of recovery made, may be filed by 31/05/2011 for Commission’s perusal and review. Discom: Submitted to the Hon’ble Commission vide Lr.No CGM(Comml)/ SE(IPC)/DE(RAC) /D.No.1251/Dt:30.06.2011. The detailed report is enclosed.
(viii). Recovery of demand charges from APGPCL A comprehensive action taken report may be filed for Commission’s perusal and review by 31/05/2011 with year wise and month wise details of such charges together with the calculation sheets to verify and quantify the excess amounts paid may be filed together with the details of extent of recovery made.
Sl No Month
Targets(Rs in Crs) Actual (Rs in Crs) Variance
FC VC Total Cost FC VC Total
cost
1 April 755 1321 2075 755 1646 2446 370 2 May 755 1125 1880 710 1501 2211 332 3 June 755 982 1736 812 1245 2057 321 4 July 755 935 1689 724 1199 1924 234 5 Aug 755 882 1637 758 1204 1962 325
__________________________________________________________________________ Engineering Staff College of India Page No.6.9
Discom: Submitted to the Hon’ble Commission vide Lr.No CGM(Comml)/SE(IPC)/ DE(RAC)/ D.No. 1251/Dt:30.06.2011. The calculation Sheets are enclosed. Further the APGPCL has approached the Hon’ble High court and obtained stay order against recovery of demand charges
(ix). Levy of Delayed Payment Surcharge and Interest The Licensees shall not simultaneously levy both delayed payment surcharge & interest on payables. Discom: The licensee is levying Delayed payment surcharge only but not both.
(x). Street Lighting in APIIC Industrial Municipalities The Licensees shall examine the usage pattern, the extent of public roads and the financial impact and submit a report by 31/10/2011.
Discom: Submitted to the Hon’ble Commission vide Lr.No CGM(Comml)/SE(IPC)/DE(RAC) /D.No1679 / Dt:04.08.2011.
(xi). Ferro Alloy Units: R&C Measures and Deemed Energy Consumption The Licensees shall exclude the period of R&C measures (power cuts) in calculating the deemed energy consumption. Discom: The directive given by the Hon’ble Commission will be followed.
(xii). Pre Paid Meters for Government Departments The dues from Government departments are quite high and slower recovery would affect the cash flow and day to day management of affairs for the DISCOMS. This suggestion may be examined and discussed by DISCOMs with such consumers. A report on this subject shall be submitted by 31/07/2011. Discom: A letter is addressed to the Principal Secretary to Govt, Energy Department, AP Secretariat, Hyderabad for issuing instructions to all the Govt heads to provide pre-paid meters in place of existing meters. Meanwhile prepaid meters are being procured. (xiii). Consumer Bills on Internet To study if it is feasible to place the bills on internet for customers to verify and know. This should be encouraged as the DISCOMS should move towards facilitating on line payment. A feasibility report on placing of bills on the internet together with facility to pay on line for atleast HT and LT_III consumers may be sent to Commission by 30/06/2011 so that the scheme can be implemented from 1/8/2011.
Discom: All LT category of consumers data available on internet and payments also receiving on line through Bill Desk, Bill Junction gate way. HT consumers bills data is also available on APCPDCL website and facility to pay bills through SBH gate way is under progress.
__________________________________________________________________________ Engineering Staff College of India Page No.6.10
(xiv). Share of capacity in IPP expansion projects To examine in terms of the existing PPAs, the National tariff policy and the provisions of the E.Act 2003, the legal feasibility of acquiring a share of power in such expansion projects and file a detailed report to the Commission by 30/04/2011 in case of each of the IPPs that are setting up expansion projects.
Discom: Submitted to Hon’ble APERC vide Lr.No.CE/IPC/F.APERC/D.No.105/11, Dt: 31.05.2011. (xv). HVDS and Other Issues SPDCL is directed to contact the objector, Sri K Shankar Reddy, Chittoor to get the details, examine the matter and send a report by 31/06/2011. Discom: Pertains to APSPDCL (xvi). Power Supply to Rural Areas (a)To complete all the works pertaining to the pilot projects by 31.07.2011 and
submit a compliance report, along with the results observed by 15.08.2011. (b)To seriously examine the issue of rural power supply and come up with a
better solution than segregation of feeders, which, at the current pace is likely to take more than 20 years for completion. The DISCOMS should examine the feasibility of alternative mechanisms to obviate the need for separate agricultural feeders in the context of the request of the consumers not to restrict power supply to rural households to the 7 hrs time restriction of agriculture sector.
(c)The DISCOMS may examine the issues connected with power supply to rural
areas and come up with, both cost & time frame wise practicable solutions by 30-10-2011.
Discom: (a) It is programmed to separate the Agriculture loads on Pilot basis which are
proximity to towns covering 56 Nos. 11kV feeders were selected at a cost of Rs.1091.93 lakhs.. Out of 56 No’s feeders 39 No’s works are completed in full shape and balance works are delayed on account of right off way problems and standing crops .
(b) Arrangements have been made for providing 24 hrs supply to villages in rural
areas by providing single phase transformers under single phasing system. There is large variation in demand and supply of power. Due to deficit in demand, 24hrs supply to all villages is not materialized in all seasons.
Further it is to inform that APCPDCL is decided to carry out feasibility study of separation of villages from agricultural feeder by erecting separate lines for providing 24hrs supply to villages. CPDCL is providing 7hrs quality of supply to Agl Sector. Further HVDS is being implemented to improve the quality of supply. Farmers were given adequate awareness on adoption of DSM measure to minimize pump set failures.
1. The total No. mixed feeders i.e. feeding Agriculture and other loads are 3031 Nos.
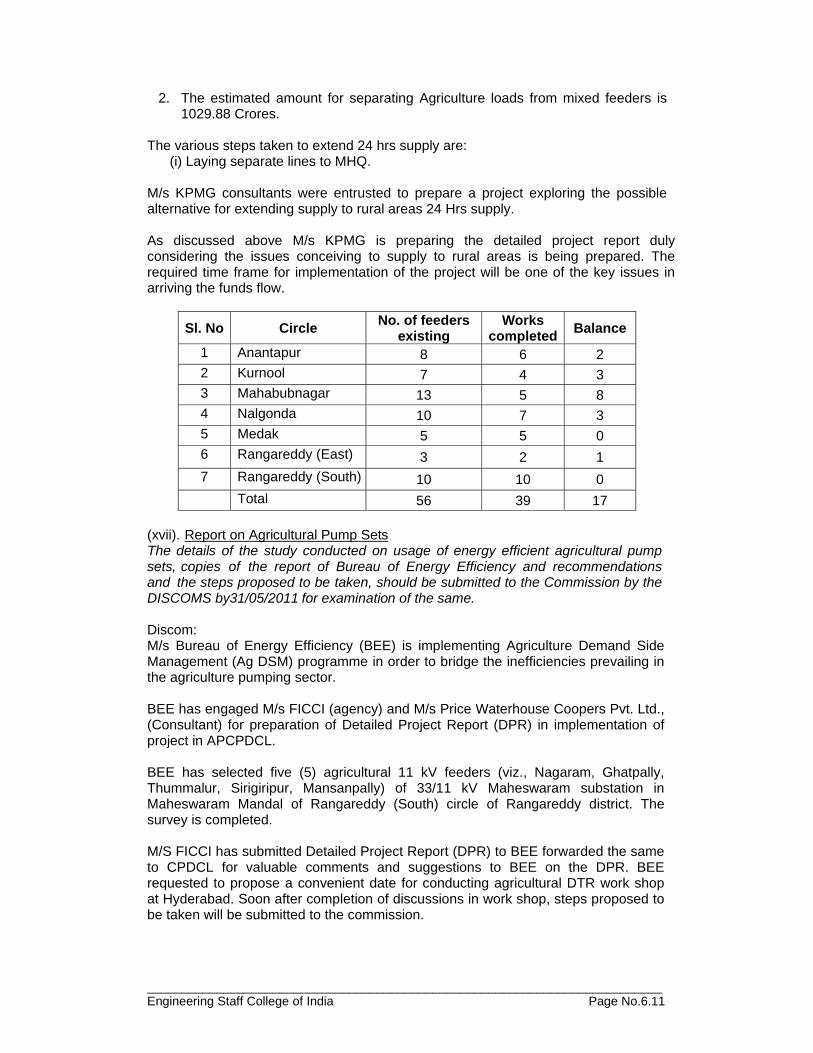
__________________________________________________________________________ Engineering Staff College of India Page No.6.11
2. The estimated amount for separating Agriculture loads from mixed feeders is 1029.88 Crores.
The various steps taken to extend 24 hrs supply are:
(i) Laying separate lines to MHQ. M/s KPMG consultants were entrusted to prepare a project exploring the possible alternative for extending supply to rural areas 24 Hrs supply. As discussed above M/s KPMG is preparing the detailed project report duly considering the issues conceiving to supply to rural areas is being prepared. The required time frame for implementation of the project will be one of the key issues in arriving the funds flow.
Sl. No Circle No. of feeders existing
Works completed Balance
1 Anantapur 8 6 2 2 Kurnool 7 4 3 3 Mahabubnagar 13 5 8 4 Nalgonda 10 7 3 5 Medak 5 5 0 6 Rangareddy (East) 3 2 1 7 Rangareddy (South) 10 10 0
Total 56 39 17 (xvii). Report on Agricultural Pump Sets The details of the study conducted on usage of energy efficient agricultural pump sets, copies of the report of Bureau of Energy Efficiency and recommendations and the steps proposed to be taken, should be submitted to the Commission by the DISCOMS by31/05/2011 for examination of the same. Discom: M/s Bureau of Energy Efficiency (BEE) is implementing Agriculture Demand Side Management (Ag DSM) programme in order to bridge the inefficiencies prevailing in the agriculture pumping sector. BEE has engaged M/s FICCI (agency) and M/s Price Waterhouse Coopers Pvt. Ltd., (Consultant) for preparation of Detailed Project Report (DPR) in implementation of project in APCPDCL. BEE has selected five (5) agricultural 11 kV feeders (viz., Nagaram, Ghatpally, Thummalur, Sirigiripur, Mansanpally) of 33/11 kV Maheswaram substation in Maheswaram Mandal of Rangareddy (South) circle of Rangareddy district. The survey is completed.
M/S FICCI has submitted Detailed Project Report (DPR) to BEE forwarded the same to CPDCL for valuable comments and suggestions to BEE on the DPR. BEE requested to propose a convenient date for conducting agricultural DTR work shop at Hyderabad. Soon after completion of discussions in work shop, steps proposed to be taken will be submitted to the commission.

__________________________________________________________________________ Engineering Staff College of India Page No.6.12
(xviii). Awareness Programme to Forum Members and Functioning of Call Centres The DISCOMs should take steps to build greater awareness in employees deputed to Forums to be balanced and unbiased in the discharge of their duties.
DISCOMS to take proper action and ensure proper functioning of the call centres in attending to the calls of the consumers to get their problems pertaining to power supply resolved without delays. Discom: A letter is submitted to the Hon’ble commission vide Lr.No: CGM (HRD) / GM (Adm) / DE – MPP / ADE – MPP / TRG / 92 / 2011, Dt: 01.10.2011. Accordingly an awareness program was conducted to the CGRF members along with the Chief General Managers and General Managers/ Superintending Engineers on 28.10.2011. (xix). Lok Adalats for Settlement of Compensation Claims The suggestion on functioning of Lok Adalats may be examined and the DISCOMs and the CGRF may obtain the rule/procedure followed in such Lok Adalat on settlement of compensation c la ims, exa mine and repo r t the i r observa t ions t o Co mmiss ion by 30/06/2011. Discom: A letter was addressed to Lok Adalat regarding the rules and procedures followed on settlement of compensation claims vide Lr.No.CGM(C)/SE (IPC)/DE (RAC)/ D.No.801 /11, Dt:01.06.2011. Reply is awaited. Being pursued (xx). AB Switches on HVDS Transformers The details of progress made on providing AB switches to the HVDS Transformers shall be submitted to the Commission. An interim report shall be submitted by 31/10/2011 and final report by 31/12/2011. Discom: HVDS Project is being implemented in three phases in CPDCL. In the Phases I&II were implemented in 3 districts i.e., Anantapur, Mahabubnagar and Nalgonda districts. Phase-III is being implemented in 6 districts i.e. Anantapur, Kurnool, Mahabubnagar, Nalgonda, Medak and Rangareddy.
The scheme provides erection of AB switches includes the relocation of old AB switches to be relocated and new AB switches to erected. The details of the AB switches provided in each district is as follows:
S.No. Name of the District No of AB Switches erected as on 30-11-2011
1. Anantapur 28 2. Kurnool 320 3. Mahabubnagar 673 4. Nalgonda 809 5. Medak 525 6. Rangareddy 640
Total 2995
__________________________________________________________________________ Engineering Staff College of India Page No.6.13
(xxi). DTR Location for Residential and Commercial Complexes To issue notices in all such cases, where the transformers are erected outside the premises, directing the concerned to shift the transformers within 3 months into their respective premises. The DISCOMs shall not henceforth extend power supply in all those cases where the transformers have been erected outside their premises. A consolidated quarterly compliance report on action taken may be sent to the Commission. Discom: Being complied with – Instructions are issued to all the Superintending Engineers/Operation in this regard vide Lr.No.CGM(Coml.)/SE(C)/DE(C)/ADE-I/D.No.1048/11, dt.18-06-2011 and further reminder was issued on the above vide Memo.No.CGM(C)/SE(C)DE(C)/ADE-I/D.No.2948/11, dt. 17.11.2011. The field officers are expressing difficulty in
a) Non -availability of space to shift the DTR into the premises b) Cost of shifting the DTR.
(xxii). Report on Subsidy Payment by Government of Andhra Pradesh The Licensees shall submit to the Commission by 15th of every month a status report on payment of subsidy amounts by the GoAP. Discom: Being complied with. 6.1.4.3 OTHER DIRECTIVES 2011-12 (i) Insurance premiums for the compensations to be paid, in the event of accidents,
shall be paid by the DISCOMs only: Commission’s views: (a) The Commission would examine the issue of insurance premium as and when the DISCOMS complete the study and come up with concrete proposals. The Final compliance report on this matter as per directive Number 14 at page 156 read with page 144 of tariff order 2010, may be submitted positively by 30/09/2011. Discom: The provisional proposals for public liability insurance has been obtained from M/s. United India Insurance Company Limited, and the premium quoted are primafacie appeared to be high, the same is being negotiated. (ii) Revision of SOP: (e)The Commission directs the DISCOMS to file an approach paper on revision of standards of performance keeping in view the changed circumstances since the standards were first laid down. Such an approach paper may be filed by 31/10/2011. Discom: A committee has been constituted for the said purpose. The Recommendations are awaited. Hence Hon’ble Commission is requested to extend the time up to 31st Jan’2012 to file the approach paper. (iii) Compensation in case of Electrical Accidents: Compensation is being paid as per existing norms. Proposals for suitable upward revision should be examined and submitted before the Commission by 30-09-2011. Appropriate methodology for identification of genuine cases should also be included in the proposals.

__________________________________________________________________________ Engineering Staff College of India Page No.6.14
Discom: A committee has been constituted for the said purpose. The Recommendations are awaited. Hence Hon’ble Commission is requested to extend the time up to 31st Jan’2012. (iv) Providing of neutral wire from Sub-Station: The Commission had given directions earlier in the matter. The directives should be complied with. This is a very serious matter and needs to be implemented on high priority. The DISCOMs are directed not to extend power supply by using 6.3 kV single phase distribution transformers without providing neutral wire from the sub station henceforth. In respect of all existing systems neutral wire shall be provided by 31-12-2011. Contravention of above direction will attract penal provisions under sec 142 of Electricity Act 2003. Discom: HVDS works are being taken up on agriculture feeder by replacing high capacity distribution transformers with small capacity distribution transformers. Single phase Distribution Transformers are being erected for electrification of hamlets situated at inaccessible areas. APCPDCL decided to extend supply by erecting single phase distribution transformers by providing local earthing with 2 nos. CI earth electrodes Earthings are made complying to earthing practices specified in IE rules 1956 the details are as follows: 2 Nos. electrodes of 2 mtrs long, 80mm Dia, CI pipes, 25 X 3 mm GI flat and no .8 GI wire. Separate earthings are provided for HV & LV side of distribution transformer. Interconnection is made with GI flat. Since the hamlets are spread over at distant places, running the neutral wire from 33/11KV Sub-station is very expensive. Further, earthing of neutral at intermediate locations, needs additional expenditure. Hence, it has been decided to provide local ground earthing by maintaining the earth resistance as per REC construction standards As directed by the Hon’ble Commission the licensee will take up laying of neutral wire from substation in a phased manner, where the village is within the radius of 2-3 kms duly selecting rocky areas first where the earth resistance is poor. Further, the villages which are far away from the substation, a master earth is to be provided at a safer place and neutral wire will be run to all single phase DTRs in the village. However, in compliance of APERC directive, CPDCL initiated refurbishment of earthing system of 1-Phase DTR to bring the earth resistance to acceptable levels. The district wise details are as follows:
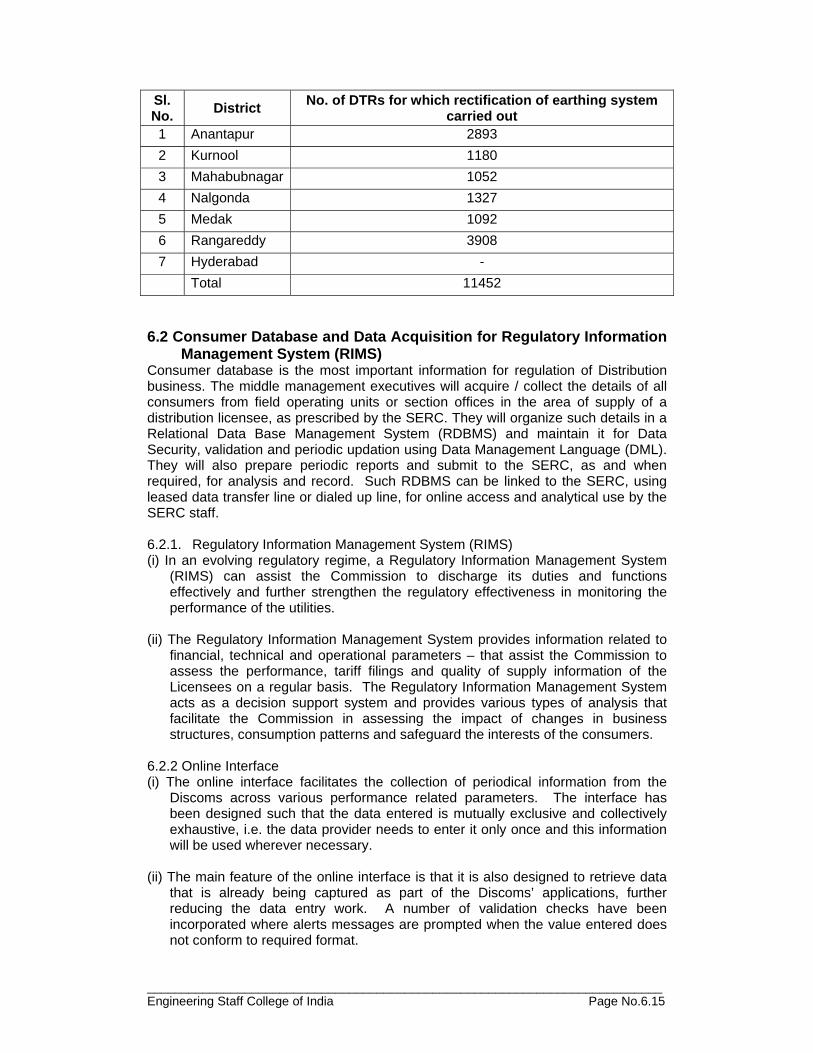
__________________________________________________________________________ Engineering Staff College of India Page No.6.15
Sl. No. District No. of DTRs for which rectification of earthing system
carried out 1 Anantapur 2893 2 Kurnool 1180 3 Mahabubnagar 1052 4 Nalgonda 1327 5 Medak 1092 6 Rangareddy 3908 7 Hyderabad -
Total 11452 6.2 Consumer Database and Data Acquisition for Regulatory Information
Management System (RIMS) Consumer database is the most important information for regulation of Distribution business. The middle management executives will acquire / collect the details of all consumers from field operating units or section offices in the area of supply of a distribution licensee, as prescribed by the SERC. They will organize such details in a Relational Data Base Management System (RDBMS) and maintain it for Data Security, validation and periodic updation using Data Management Language (DML). They will also prepare periodic reports and submit to the SERC, as and when required, for analysis and record. Such RDBMS can be linked to the SERC, using leased data transfer line or dialed up line, for online access and analytical use by the SERC staff. 6.2.1. Regulatory Information Management System (RIMS) (i) In an evolving regulatory regime, a Regulatory Information Management System
(RIMS) can assist the Commission to discharge its duties and functions effectively and further strengthen the regulatory effectiveness in monitoring the performance of the utilities.
(ii) The Regulatory Information Management System provides information related to
financial, technical and operational parameters – that assist the Commission to assess the performance, tariff filings and quality of supply information of the Licensees on a regular basis. The Regulatory Information Management System acts as a decision support system and provides various types of analysis that facilitate the Commission in assessing the impact of changes in business structures, consumption patterns and safeguard the interests of the consumers.
6.2.2 Online Interface (i) The online interface facilitates the collection of periodical information from the
Discoms across various performance related parameters. The interface has been designed such that the data entered is mutually exclusive and collectively exhaustive, i.e. the data provider needs to enter it only once and this information will be used wherever necessary.
(ii) The main feature of the online interface is that it is also designed to retrieve data
that is already being captured as part of the Discoms’ applications, further reducing the data entry work. A number of validation checks have been incorporated where alerts messages are prompted when the value entered does not conform to required format.
__________________________________________________________________________ Engineering Staff College of India Page No.6.16
(iii) The online interface developed for the Discoms has been designed in such a way
that relevant data may be entered at levels – Discom, Circle, Division, Subdivision and ERO. This provides the flexibility of entering the data pertaining to a unit at any location rather than compiling the data as hard copies and then entering the same at a single location which would be cumbersome and time consuming.
(iv) Once the data is entered through the online application, it is directly stored on to
the operational database, thus eliminating the need for any ETL OD application and the manual intervention that would be required thereof.
(v) Role of middle level managers in data acquisition (a) Managers / Supervisors
i. To check the data pertaining to their unit and those below their unit ii. Eg. Circle manager will be able to view data pertaining to his own circle,
division, subdivision, sections, etc. iii. In case of errors, he may direct the Data Entry operations to modify the
same.
(b) Discom Admin i. All access details of the managers for the entire Discom. ii. They can create additional usernames and passwords.
6.3 Sample Surveys for Cost of Service (CoS) Parameters and
Agricultural Consumption Estimation The middle level managers are engaged in sample surveys for feeders predominately supplying to a category of consumers, like predominantly Domestic or predominantly Commercial, to collect information on different category or class of consumers to know their pattern of usage and contribution of each class of consumers to the system peak, which is a key factor for causation of cost. The Cost of Service (CoS) model employed by APERC takes into use of all such parameters responsible for causation of cost. The managers of DISCOMs in the middle level are expected to get acquainted with all such parameters and their uses with the COS model. One such COS model used by APCPDCL is explained below for reference. 6.3.1 COST OF SERVICE MODEL FOR APCPDCL The cost of service calculations are based on the cost of service model developed for CPDCL. The model, as currently used, calculates the cost of serving all customers categories of APCPDCL. All financial input into the model is as per the ARR for the year 2012-13, including revenue, and expenditure data. The following section gives a brief overview of the Cost of Service model developed for APCPDCL
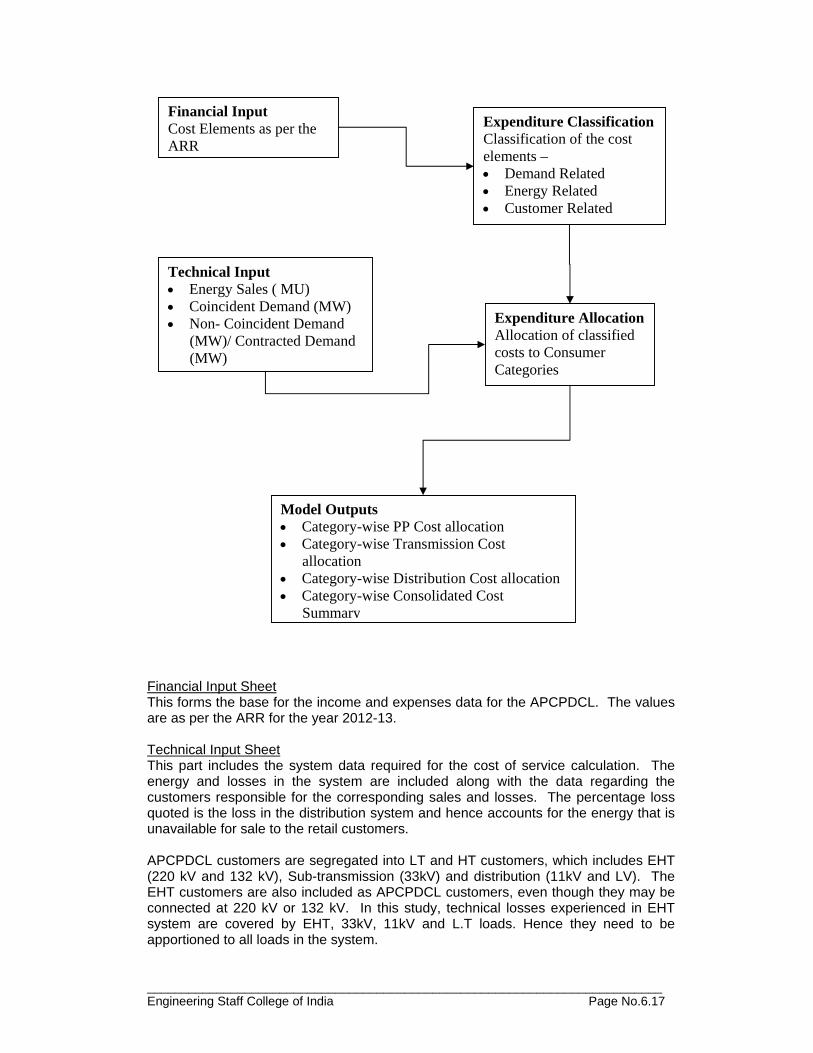
__________________________________________________________________________ Engineering Staff College of India Page No.6.17
Financial Input Sheet This forms the base for the income and expenses data for the APCPDCL. The values are as per the ARR for the year 2012-13. Technical Input Sheet This part includes the system data required for the cost of service calculation. The energy and losses in the system are included along with the data regarding the customers responsible for the corresponding sales and losses. The percentage loss quoted is the loss in the distribution system and hence accounts for the energy that is unavailable for sale to the retail customers. APCPDCL customers are segregated into LT and HT customers, which includes EHT (220 kV and 132 kV), Sub-transmission (33kV) and distribution (11kV and LV). The EHT customers are also included as APCPDCL customers, even though they may be connected at 220 kV or 132 kV. In this study, technical losses experienced in EHT system are covered by EHT, 33kV, 11kV and L.T loads. Hence they need to be apportioned to all loads in the system.
Financial Input Cost Elements as per the ARR
Technical Input • Energy Sales ( MU) • Coincident Demand (MW) • Non- Coincident Demand
(MW)/ Contracted Demand (MW)
Expenditure Classification Classification of the cost elements – • Demand Related • Energy Related • Customer Related
Expenditure Allocation Allocation of classified costs to Consumer Categories
Model Outputs • Category-wise PP Cost allocation • Category-wise Transmission Cost
allocation • Category-wise Distribution Cost allocation • Category-wise Consolidated Cost
Summary
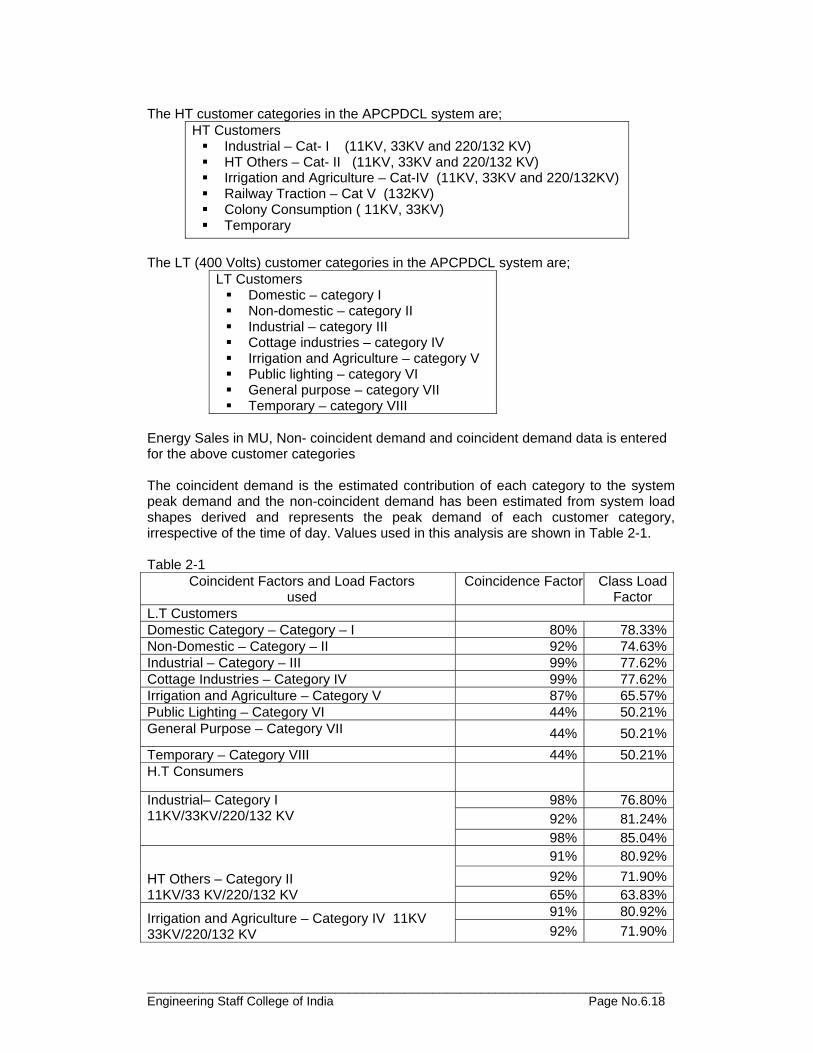
__________________________________________________________________________ Engineering Staff College of India Page No.6.18
The HT customer categories in the APCPDCL system are;
HT Customers Industrial – Cat- I (11KV, 33KV and 220/132 KV) HT Others – Cat- II (11KV, 33KV and 220/132 KV) Irrigation and Agriculture – Cat-IV (11KV, 33KV and 220/132KV) Railway Traction – Cat V (132KV) Colony Consumption ( 11KV, 33KV) Temporary
The LT (400 Volts) customer categories in the APCPDCL system are;
LT Customers Domestic – category I Non-domestic – category II Industrial – category III Cottage industries – category IV Irrigation and Agriculture – category V Public lighting – category VI General purpose – category VII Temporary – category VIII
Energy Sales in MU, Non- coincident demand and coincident demand data is entered for the above customer categories The coincident demand is the estimated contribution of each category to the system peak demand and the non-coincident demand has been estimated from system load shapes derived and represents the peak demand of each customer category, irrespective of the time of day. Values used in this analysis are shown in Table 2-1. Table 2-1
Coincident Factors and Load Factors used
Coincidence Factor Class Load Factor
L.T Customers Domestic Category – Category – I 80% 78.33%Non-Domestic – Category – II 92% 74.63%Industrial – Category – III 99% 77.62%Cottage Industries – Category IV 99% 77.62%Irrigation and Agriculture – Category V 87% 65.57%Public Lighting – Category VI 44% 50.21%General Purpose – Category VII 44% 50.21%Temporary – Category VIII 44% 50.21%H.T Consumers
Industrial– Category I 11KV/33KV/220/132 KV
98% 76.80%92% 81.24%98% 85.04%
HT Others – Category II 11KV/33 KV/220/132 KV
91% 80.92%92% 71.90%65% 63.83%
Irrigation and Agriculture – Category IV 11KV 33KV/220/132 KV
91% 80.92%92% 71.90%
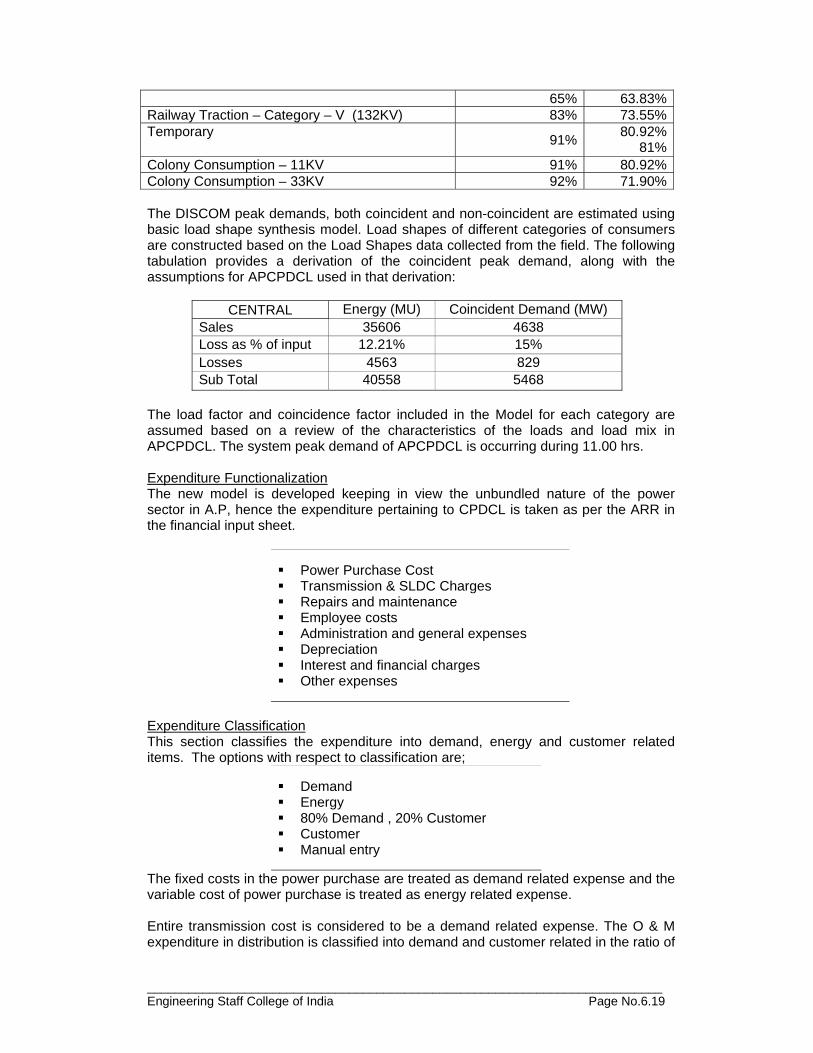
__________________________________________________________________________ Engineering Staff College of India Page No.6.19
65% 63.83%Railway Traction – Category – V (132KV) 83% 73.55%Temporary 91% 80.92%
81%Colony Consumption – 11KV 91% 80.92%Colony Consumption – 33KV 92% 71.90% The DISCOM peak demands, both coincident and non-coincident are estimated using basic load shape synthesis model. Load shapes of different categories of consumers are constructed based on the Load Shapes data collected from the field. The following tabulation provides a derivation of the coincident peak demand, along with the assumptions for APCPDCL used in that derivation:
CENTRAL Energy (MU) Coincident Demand (MW) Sales 35606 4638 Loss as % of input 12.21% 15% Losses 4563 829 Sub Total 40558 5468
The load factor and coincidence factor included in the Model for each category are assumed based on a review of the characteristics of the loads and load mix in APCPDCL. The system peak demand of APCPDCL is occurring during 11.00 hrs. Expenditure Functionalization The new model is developed keeping in view the unbundled nature of the power sector in A.P, hence the expenditure pertaining to CPDCL is taken as per the ARR in the financial input sheet.
Power Purchase Cost Transmission & SLDC Charges Repairs and maintenance Employee costs Administration and general expenses Depreciation Interest and financial charges Other expenses
Expenditure Classification This section classifies the expenditure into demand, energy and customer related items. The options with respect to classification are;
Demand Energy 80% Demand , 20% Customer Customer Manual entry
The fixed costs in the power purchase are treated as demand related expense and the variable cost of power purchase is treated as energy related expense. Entire transmission cost is considered to be a demand related expense. The O & M expenditure in distribution is classified into demand and customer related in the ratio of
__________________________________________________________________________ Engineering Staff College of India Page No.6.20
80:20. The same has been arrived at based on subjective judgment, as it is felt that some portion of the assets and employee expenses are used for catering to the needs of the customer such as customer service/call centers. The other cost elements in distribution viz ROCE, depreciation and other costs have been fully considered under demand related costs. Expenditure Allocation The expenditures, which have been classified into, demand, energy and consumer related are apportioned to the individual customer categories. Power Purchase Cost Allocation: Demand related costs of Power Purchase are primarily driven by the system peak. Hence they are allocated to customer categories based on the Coincident Demand. Energy costs in Power Purchase are allocated based on the loss-adjusted category energy consumption. Transmission Cost Allocation: The transmission costs (including PGCIL and ULDC) are considered as demand related cost and the same is allocated to LT categories based on Non-coincident demand and contracted demand (CMD) for HT categories Distribution Cost Allocation: a) Operation and Maintenance Expenditure The demand related portion of O & M expenses are allocated to LT consumer categories based on non -coincident demand and contracted demand (CMD) for the HT consumer categories. The customer related costs are allocated to customer categories based on the number of customers in each category. b) ROCE Return on capital employed is driven by assets and it is fully considered as demand related expense. ROCE is allocated to LT consumer categories based on non -coincident demand and contracted capacity for the HT consumer categories. c) Depreciation Depreciation expense is driven by the level of fixed assets in the utility and is entirely considered under demand related expenses. Depreciation is allocated to LT consumer categories based on non -coincident demand and contracted capacity for the HT consumer categories. d) Interest on Consumer Security Deposit This is allocated to consumer categories based on the energy consumption grossed up for losses. Summaries of the results of the model are the outputs and these are discussed in the next section and a comparison of revenues and costs by customers is made in this part of the computation. Results The following tabulation summarizes the results of the process: APCPDCL needs to handle 40,558 MU, which consist of sale of 35,606 MU to its
customers and losses of 4952 MU.
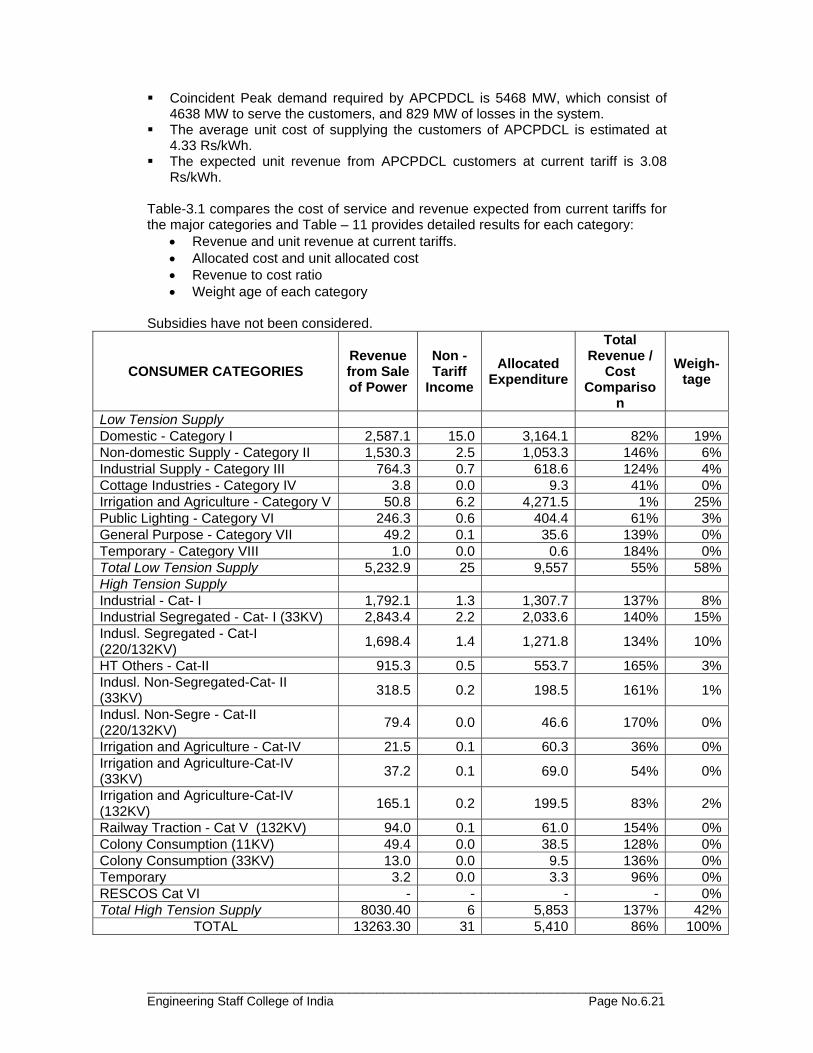
__________________________________________________________________________ Engineering Staff College of India Page No.6.21
Coincident Peak demand required by APCPDCL is 5468 MW, which consist of 4638 MW to serve the customers, and 829 MW of losses in the system.
The average unit cost of supplying the customers of APCPDCL is estimated at 4.33 Rs/kWh.
The expected unit revenue from APCPDCL customers at current tariff is 3.08 Rs/kWh.
Table-3.1 compares the cost of service and revenue expected from current tariffs for the major categories and Table – 11 provides detailed results for each category:
• Revenue and unit revenue at current tariffs. • Allocated cost and unit allocated cost • Revenue to cost ratio • Weight age of each category
Subsidies have not been considered.
CONSUMER CATEGORIES Revenue from Sale of Power
Non - Tariff
Income Allocated
Expenditure
Total Revenue /
Cost Compariso
n
Weigh-tage
Low Tension Supply Domestic - Category I 2,587.1 15.0 3,164.1 82% 19%Non-domestic Supply - Category II 1,530.3 2.5 1,053.3 146% 6%Industrial Supply - Category III 764.3 0.7 618.6 124% 4%Cottage Industries - Category IV 3.8 0.0 9.3 41% 0%Irrigation and Agriculture - Category V 50.8 6.2 4,271.5 1% 25%Public Lighting - Category VI 246.3 0.6 404.4 61% 3%General Purpose - Category VII 49.2 0.1 35.6 139% 0%Temporary - Category VIII 1.0 0.0 0.6 184% 0%Total Low Tension Supply 5,232.9 25 9,557 55% 58%High Tension Supply Industrial - Cat- I 1,792.1 1.3 1,307.7 137% 8%Industrial Segregated - Cat- I (33KV) 2,843.4 2.2 2,033.6 140% 15%Indusl. Segregated - Cat-I (220/132KV) 1,698.4 1.4 1,271.8 134% 10%
HT Others - Cat-II 915.3 0.5 553.7 165% 3%Indusl. Non-Segregated-Cat- II (33KV) 318.5 0.2 198.5 161% 1%
Indusl. Non-Segre - Cat-II (220/132KV) 79.4 0.0 46.6 170% 0%
Irrigation and Agriculture - Cat-IV 21.5 0.1 60.3 36% 0%Irrigation and Agriculture-Cat-IV (33KV) 37.2 0.1 69.0 54% 0%
Irrigation and Agriculture-Cat-IV (132KV) 165.1 0.2 199.5 83% 2%
Railway Traction - Cat V (132KV) 94.0 0.1 61.0 154% 0%Colony Consumption (11KV) 49.4 0.0 38.5 128% 0%Colony Consumption (33KV) 13.0 0.0 9.5 136% 0%Temporary 3.2 0.0 3.3 96% 0%RESCOS Cat VI - - - - 0%Total High Tension Supply 8030.40 6 5,853 137% 42%
TOTAL 13263.30 31 5,410 86% 100%
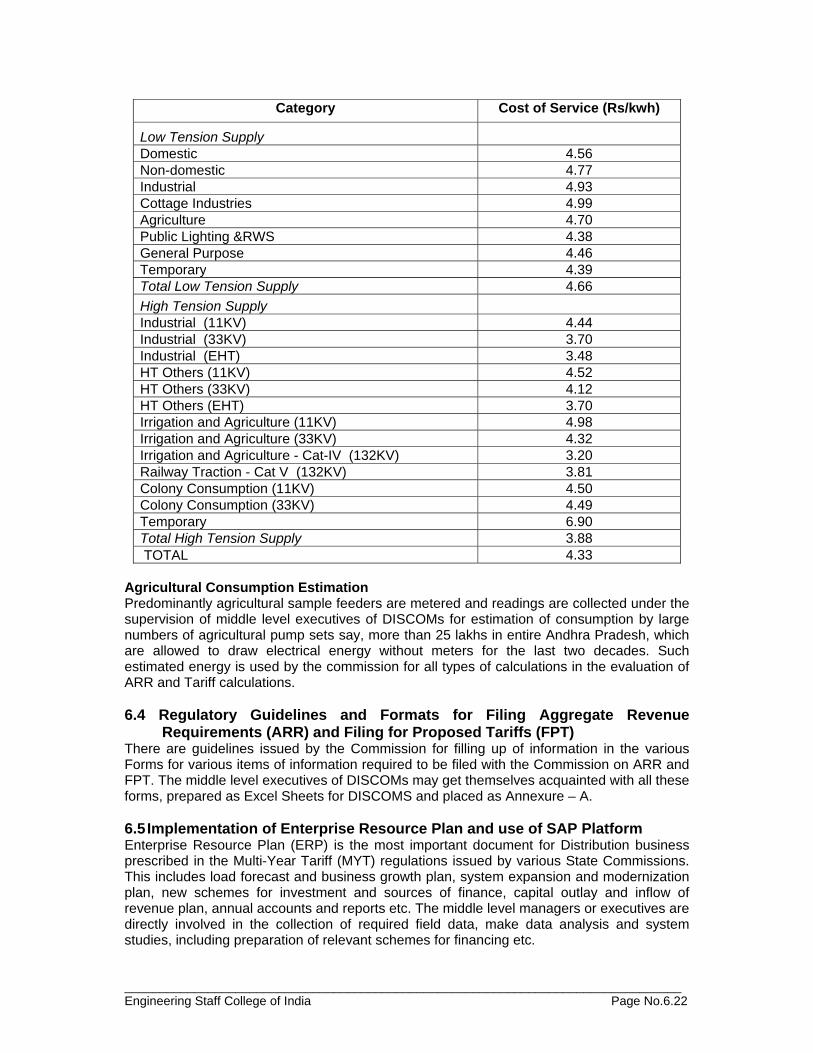
________________________________________________________________________________ Engineering Staff College of India Page No.6.22
Agricultural Consumption Estimation Predominantly agricultural sample feeders are metered and readings are collected under the supervision of middle level executives of DISCOMs for estimation of consumption by large numbers of agricultural pump sets say, more than 25 lakhs in entire Andhra Pradesh, which are allowed to draw electrical energy without meters for the last two decades. Such estimated energy is used by the commission for all types of calculations in the evaluation of ARR and Tariff calculations. 6.4 Regulatory Guidelines and Formats for Filing Aggregate Revenue Requirements (ARR) and Filing for Proposed Tariffs (FPT) There are guidelines issued by the Commission for filling up of information in the various Forms for various items of information required to be filed with the Commission on ARR and FPT. The middle level executives of DISCOMs may get themselves acquainted with all these forms, prepared as Excel Sheets for DISCOMS and placed as Annexure – A. 6.5 Implementation of Enterprise Resource Plan and use of SAP Platform Enterprise Resource Plan (ERP) is the most important document for Distribution business prescribed in the Multi-Year Tariff (MYT) regulations issued by various State Commissions. This includes load forecast and business growth plan, system expansion and modernization plan, new schemes for investment and sources of finance, capital outlay and inflow of revenue plan, annual accounts and reports etc. The middle level managers or executives are directly involved in the collection of required field data, make data analysis and system studies, including preparation of relevant schemes for financing etc.
Category Cost of Service (Rs/kwh)
Low Tension Supply Domestic 4.56 Non-domestic 4.77 Industrial 4.93 Cottage Industries 4.99 Agriculture 4.70 Public Lighting &RWS 4.38 General Purpose 4.46 Temporary 4.39 Total Low Tension Supply 4.66 High Tension Supply Industrial (11KV) 4.44 Industrial (33KV) 3.70 Industrial (EHT) 3.48 HT Others (11KV) 4.52 HT Others (33KV) 4.12 HT Others (EHT) 3.70 Irrigation and Agriculture (11KV) 4.98 Irrigation and Agriculture (33KV) 4.32 Irrigation and Agriculture - Cat-IV (132KV) 3.20 Railway Traction - Cat V (132KV) 3.81 Colony Consumption (11KV) 4.50 Colony Consumption (33KV) 4.49 Temporary 6.90 Total High Tension Supply 3.88 TOTAL 4.33
________________________________________________________________________________ Engineering Staff College of India Page No.6.23
Most of the distribution licensees are implementing such ERP using SAP platform with the financial assistance from Ministry of Power, Government of India under the Restructured-Accelerated Power Development and Reforms Programme (R-APDRP). 6.5.1 R-APDRP Ministry of Power, Government of India, has launched the Restructured Accelerated Power Development and Reforms Programme (R-APDRP) in July 2008 with focus on establishment of base line data, fixation of accountability, reduction of AT&C losses upto 15% level through strengthening & up-gradation of Sub Transmission and Distribution network and adoption of Information Technology during XI Plan. Projects under the scheme shall be taken up in two parts. Part-A shall include the projects for establishment of baseline data and IT applications for energy accounting/auditing & IT based consumer service centres. Part-B shall include regular distribution strengthening projects and will cover system improvement, strengthening and augmentation etc. PFC has been designated as the nodal agency to operationalise the programme and shall act as a single window service under R-APDRP. As nodal agency PFC shall receive a fee as well as the reimbursement of expenditure in implementation of the programme as per the norms to be decided by the RAPDRP Steering Committee. 6.6 Accounting Standards and Disclosure of information in Annual Reports Most of the State Commissions have prescribed Accounting Standards for electricity distribution business in addition to the requirements of the Companies Act, 1956. These standards are directed to ensure disclosure of relevant information on the part of Distribution and Retail Supply licensees in their Annual Reports. The middle level managers in the Finance and Accounting branch of licensees should acquaint them with the following IASB Framework and International Accounting Standards in addition to the Accounting Standards prescribed by the State Commissions specifically for electricity distribution business. 6.6.1 The IASB Framework The IASB Framework was approved by the IASC Board in April 1989 for publication in July 1989, and adopted by the IASB in April 2001. This Framework sets out the concepts that underlie the preparation and presentation of financial statements for external users. The Framework deals with:
(a) the objective of financial statements; (b) the qualitative characteristics that determine the usefulness of information in financial
statements; (c) the definition, recognition and measurement of the elements from which financial
statements are constructed; and (d) concepts of capital and capital maintenance.
The objective of financial statements is to provide information about the financial position, performance and changes in financial position of an entity that is useful to a wide range of users in making economic decisions. Financial statements prepared for this purpose meet the common needs of most users. However, financial statements do not provide all the information that users may need to make economic decisions since they largely portray the financial effects of past events and do not necessarily provide non-financial information. In order to meet their objectives, financial statements are prepared on the accrual basis of accounting. The financial statements are normally prepared on the assumption that an entity is a going concern and will continue in operation for the foreseeable future.

________________________________________________________________________________ Engineering Staff College of India Page No.6.24
Qualitative characteristics are the attributes that make the information provided in financial statements useful to users. The four principal qualitative characteristics are understandability, relevance, reliability and comparability. In practice a balancing, or trade-off, between qualitative characteristics is often necessary. The elements directly related to the measurement of financial position are assets, liabilities and equity. These are defined as follows:
(a) An asset is a resource controlled by the entity as a result of past events and from which future economic benefits are expected to flow to the entity.
(b) A liability is a present obligation of the entity arising from past events, the settlement of which is expected to result in an outflow from the entity of resources embodying economic benefits.
(c) Equity is the residual interest in the assets of the entity after deducting all its liabilities.
The elements of income and expenses are defined as follows:
(a) Income is increases in economic benefits during the accounting period in the form of inflows or enhancements of assets or decreases of liabilities that result in increases in equity, other than those relating to contributions from equity participants.
(b) Expenses are decreases in economic benefits during the accounting period in the form of outflows or depletions of assets or incurrence of liabilities that result in decreases in equity, other than those relating to distributions to equity participants.
An item that meets the definition of an element should be recognised if:
(a) it is probable that any future economic benefit associated with the item will flow to or from the entity; and
(b) the item has a cost or value that can be measured with reliability. Measurement is the process of determining the monetary amounts at which the elements of the financial statements are to be recognised and carried in the balance sheet and income statement. This involves the selection of the particular basis of measurement. The concept of capital maintenance is concerned with how an entity defines the capital that it seeks to maintain. It provides the linkage between the concepts of capital and the concepts of profit because it provides the point of reference by which profit is measured; it is a prerequisite for distinguishing between an entity’s return on capital and its return of capital; only inflows of assets in excess of amounts needed to maintain capital may be regarded as profit and therefore as a return on capital. Hence, profit is the residual amount that remains after expenses (including capital maintenance adjustments, where appropriate) have been deducted from income. If expenses exceed income the residual amount is a loss. The Board of IASC recognises that in a limited number of cases there may be a conflict between the Framework and an International Accounting Standard. In those cases where there is a conflict, the requirements of the International Accounting Standard prevail over those of the Framework. As, however, the Board of IASC will be guided by the Framework in the development of future Standards and in its review of existing Standards, the number of cases of conflict between the Framework and International Accounting Standards will diminish through time 6.6.2 International Financial Reporting Standards - Summaries Following table shows the references / links for the summaries of the International Financial Reporting Standards as further recommended readings for interested middle level managers.
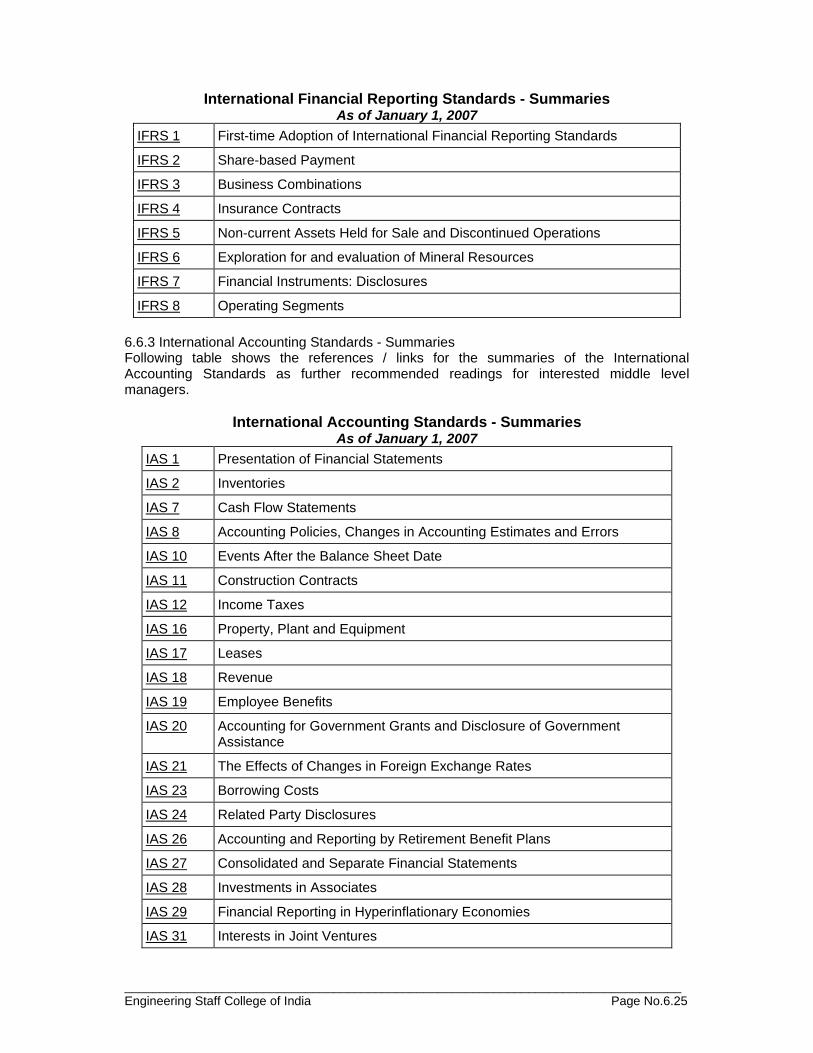
________________________________________________________________________________ Engineering Staff College of India Page No.6.25
International Financial Reporting Standards - Summaries As of January 1, 2007
IFRS 1 First-time Adoption of International Financial Reporting Standards
IFRS 2 Share-based Payment
IFRS 3 Business Combinations
IFRS 4 Insurance Contracts
IFRS 5 Non-current Assets Held for Sale and Discontinued Operations
IFRS 6 Exploration for and evaluation of Mineral Resources
IFRS 7 Financial Instruments: Disclosures
IFRS 8 Operating Segments 6.6.3 International Accounting Standards - Summaries Following table shows the references / links for the summaries of the International Accounting Standards as further recommended readings for interested middle level managers.
International Accounting Standards - Summaries
As of January 1, 2007 IAS 1 Presentation of Financial Statements
IAS 2 Inventories
IAS 7 Cash Flow Statements
IAS 8 Accounting Policies, Changes in Accounting Estimates and Errors
IAS 10 Events After the Balance Sheet Date
IAS 11 Construction Contracts
IAS 12 Income Taxes
IAS 16 Property, Plant and Equipment
IAS 17 Leases
IAS 18 Revenue
IAS 19 Employee Benefits
IAS 20 Accounting for Government Grants and Disclosure of Government Assistance
IAS 21 The Effects of Changes in Foreign Exchange Rates
IAS 23 Borrowing Costs
IAS 24 Related Party Disclosures
IAS 26 Accounting and Reporting by Retirement Benefit Plans
IAS 27 Consolidated and Separate Financial Statements
IAS 28 Investments in Associates
IAS 29 Financial Reporting in Hyperinflationary Economies
IAS 31 Interests in Joint Ventures

________________________________________________________________________________ Engineering Staff College of India Page No.6.26
IAS 32 Financial Instruments: Presentation
IAS 33 Earnings per Share
IAS 34 Interim Financial Reporting
IAS 36 Impairment of Assets
IAS 37 Provisions, Contingent Liabilities and Contingent Assets
IAS 38 Intangible Assets
IAS 39 Financial Instruments: Recognition and Measurement
IAS 40 Investment Property
IAS 41 Agriculture 6.7 Extensible Business Reporting Language (XBRL) - Taxonomy for Electricity
Distribution Business Transparency in Business and Financial Reporting is the objective behind introduction of XBRL in International arena. In the recent times, XBRL has emerged as a popular, effective alternative for effective reporting and analysis and being recognized as a global standard for exchanging business information. XBRL (Extensible Business Reporting Language) is a freely available, market-driven, open, and global standard for exchanging business information. XBRL allows information modeling and the expression of semantic meaning commonly required in business reporting. XBRL is XML-based. It uses the XML syntax and related XML technologies such as XML Schema, XLink, XPath, and Namespaces to articulate this semantic meaning. One use of XBRL is to define and exchange financial information, such as a financial statement. The XBRL Specification is developed and published by XBRL International, Inc. XBRL is a standards-based way to communicate and exchange business information between business systems. These communications are defined by metadata set out in XBRL taxonomies, which capture the definition of individual reporting concepts as well as the relationships between concepts and other semantic meaning. Information being communicated or exchanged is provided within an XBRL instance. Early users of XBRL included regulators such as the U.S. Federal Deposit Insurance Corporation[1] and the Committee of European Banking Supervisors (CEBS).[2] Common functions in many countries that make use of XBRL include regulators of stock exchanges and securities, banking regulators, business registrars, revenue reporting and tax-filing agencies, and national statistical agencies. A wiki repository of XBRL projects is available to be freely explored and updated.[3] An XBRL Adoption Survey is available as well. According to the FT "the Securities and Exchange Commission (SEC) in the US, the UK’s HM Revenue & Customs (HMRC), and Companies House in Singapore have begun to require companies to use it, and other regulators are following suit.".[4] The SEC's deployment was launched in 2010 in phases, with the largest filers going first: by 2013, the large foreign companies which use International Financial Reporting Standards (IFRS) will also be submitting their financial returns to the SEC using XBRL. The UK's HMRC is using iXBRL, a simplified variant which cannot be customised (or "extended") in the same way as XBRL, but requires a much smaller volume of XBRL coding (or "tagging") by those submitting their accounts in electronic format.
________________________________________________________________________________ Engineering Staff College of India Page No.6.27
Specification The current (2008) version of XBRL is 2.1, with errata corrections. The normative version of all the XML Schemas is provided in the specification documents, not in separate files. A conformance suite is available to test processors of XBRL documents. XBRL Specification It defines the rules and fundamentals of the language; it is designed to communicate information to IT professionals who develop applications and tools intended to be XBRL-compatible, and to a lesser extent it assists taxonomy developers. To find out more and obtain the latest version of the XBRL Specification 2.1 visit the XBRL International website (http://www.xbrl.org). Financial Reporting Taxonomy Architecture (FRTA) Financial Reporting Taxonomy Architecture (FRTA); it is a document published by the XBRL International Consortium that recommends architectural rules and establishes conventions that assist in the comprehension, usage and performance of different financial reporting taxonomies; it is mainly intended for application by public taxonomy developers (authorities). Financial Reporting Instance Standards (FRIS) Financial Reporting Instance Standards (FRIS); it is a document published by the XBRL International Consortium that recommends the rules and conventions for creating an instance document XBRL Document Structure In typical usage, XBRL consists of an XBRL instance', containing primarily the business facts being reported, and a collection of taxonomies (called a Discoverable Taxonomy Set (DTS)), which define metadata about these facts, such as what the facts mean and how they relate to one another. XBRL uses XML Schema, XLink, and XPointer standards. XBRL Instance The XBRL instance begins with the <xbrl> root element. There may be more than one XBRL instance embedded in a larger XML document. The XBRL instance itself holds the following information:
• Business Facts – facts can be divided into two categories o Items are facts holding a single value. They are represented by a single XML
element with the value as its content. o Tuples are facts holding multiple values. They are represented by a single
XML element containing nested Items or Tuples. In the design of XBRL, all Item facts must be assigned a context.
• Contexts define the entity (e.g. company or individual) to which the fact applies, the period of time the fact is relevant, and an optional scenario. Date and time information appearing in the period element must conform to ISO 8601. Scenarios provide further contextual information about the facts, such as whether the business values reported are actual, projected, or budgeted.
• Units define the units used by numeric or fractional facts within the document, such as USD, shares. XBRL allows more complex units to be defined if necessary. Facts of a monetary nature must use a unit from the ISO 4217 namespace.
• Footnotes use XLink to associate one or more facts with some content. • References to XBRL taxonomies, typically through schema references. It is also
possible to link directly to a linkbase. This is an example of a fictitious Dutch company's International Financial Reporting Standards (IFRS) statement instance file: 6.7.1 Scope and Level of Tagging
________________________________________________________________________________ Engineering Staff College of India Page No.6.28
In India, the Ministry of Corporate Affairs has already notified for disclosure and filing of information using XBRL formats including the Scope and Level of Tagging. Scope XBRL documents filed by the companies should include the following information reported by the companies as per the existing provisions of law - 1. Information disclosed in the following sections of the Annual Report (Refer Table 1):
a. Balance Sheet b. Profit and Loss Statement c. Cash Flow Statement d. Schedules related to Balance Sheet and Profit and Loss Statement e. Notes to Accounts f. Statement pursuant to Section 212 of the Companies Act, 1956 relating to
subsidiary companies 2. Disclosures Specific to MCA Requirements (Refer Table 2) Levels of tagging This section specifies the depth in which the above information should be captured in the instance document. Information described above can be captured at the following two levels:
a. Block Text tagging – Capturing group of information as one single fact, using one single tag from the taxonomy
b. Detailed tagging – Capturing the granular fact (numeric or textual) Below mentioned is an example, which explains the levels of tagging in detail. The complete related party disclosure (Note 18 – given below) can be captured by the company in the instance document using a string tag. This type of tagging is called ‘block text tagging’. The company may also want to capture individual figure values in the below mentioned disclosure. For eg. ‘134.93’ is a figure value associated with purchase of goods from holding company. This type of tagging is called ‘detailed tagging’. Table 1 and 2 given under ‘Minimum tagging requirement’ explains the levels of tagging that the companies are required to follow for various information elements. 6.7.2 Instance Document and all about eFiling Quick Links An XBRL instance document is a business report in an electronic format created according to the rules of XBRL. It contains facts that are defined by the elements in the taxonomy it refers to, together with their values and an explanation of the context in which they are placed. XBRL Instances contain the reported data with their values and “contexts”. Instance document must be linked to at least one taxonomy, which defines the contexts, labels or references. Tag The elements as defined in taxonomy are also referred as XBRL tags or only tags. E.g. Sources Of Funds, Interest Charges etc. Mark-up languages such as XBRL and XML use tags to describe data, for example 1000 – the word Asset together with the brackets < and > is called a tag; there are opening tags: <…> and closing tags: . Fact The values included in the instance document, which correspond to the concepts included in the taxonomy, are called as facts. These facts can either be numeric (monetary, shares or other numeric information) or non-numeric (string, date or text block). E.g.

________________________________________________________________________________ Engineering Staff College of India Page No.6.29
Concept Fact
Intangible Assets 100000
Name of subsidiary Sample company ltd.
Date of board meeting 2011-04-30
Earnings per share 2.33Context The reporting period, information about reporting entity and other information which is required to uniquely identify any fact value is considered as context. It documents the entity, the period and the scenario that collectively give the appropriate context for understanding the values of items. Context ids have to be created based on the rules specified in the filing manual. Scheme The criteria used for recognizing the entity, which is unique and accepted to the authority to which the instance is to be submitted. Companies filing to MCA have to follow the scheme as mentioned in the filing manual. Decimals attribute This attribute is to be defined for numeric items in the instance document. It specifies the number of decimal places to which the value of the fact represented may be considered accurate, possibly as a result of rounding or truncations; it shall be an integer or possess the value INF meaning that the number expressed is the exact value of the fact. Unit element An element that appears in instance documents and specifies the units in which numeric items (that refer to its required ID attribute using a unit Ref attribute) have been measured; it may define simple units using a measure element and complex units providing divide element and its sub-elements (unit Numerator and unit Denominator); there are several constraints imposed on this element, its children and their content; for example monetary concepts shall refer to ISO 4217 currency codes. Footnote Appears in instance documents and provides additional information about facts; for example, several facts may be linked to the sentence Including the effect of merger with Sample Company; to express these connections XBRL utilises a footnote Link extended link element; footnote Links act as a kind of linkbase and enclose locators to the instance documents’ facts; footnotes use footnote Arcs with an arcrole value set to connect facts to additional information. All About eFiling Quick Links
• XBRL International • Institute of Chartered Accountants of INDIA (ICAI) • Institute of Company Secretaries of INDIA (ICSI) • Institute of Cost and Works Accountants of INDIA (ICWAI)
Important Downloads
• XBRL Validation Tool • List of Enhancements to MCA XBRL Validation Tool • Filing Manual Version • Download updated business rules dated 23rd November 2011 • XBRL eForms • Steps for eFiling of XBRL documents
________________________________________________________________________________ Engineering Staff College of India Page No.6.30
• Revised taxonomy • Details of changes in Taxonomy • List of Enhancements to MCA XBRL Validation Tool
6.7.3 MCA Taxonomy and Tagging The taxonomy developed by the MCA. The taxonomy is based on Schedule VI requirements, Accounting Standards issued by ICAI, MCA specific requirements and other regulatory requirements. . The current version of taxonomy is for Commercial and Industrial companies. The details of MCA taxonomy and the entry-point are explained in the taxonomy section of the filing manual. Line items The concepts as reported by the company in its reports are also referred as line items. Tagging It is the process of assigning tags (referred as elements in taxonomy) from the taxonomy to the company specific reporting concepts. Along with XBRL tags, other information like reporting period, currency, scale etc. also needs to be specified for all the reported concepts which are to be included in the taxonomy. Tagging required appropriate selection of elements from the taxonomy based on its attributes, documentation and relationships with other elements. Text Block Tagging This indicates capturing a group of information as one single fact, using one single tag from the taxonomy. Presently, information given in Notes to Accounts which appear in many paragraphs will be tagged completely under the data type Text Block. Detailed tagging This implies capturing the granular information or the specific information as reported by the companies. The filing manual lists down all the information requirements which have to be tagged and captured in detail in the instance documents. This information should be captured by entities, if it is applicable to them and prepared by them as part of annual report or annual returns as submitted to MCA Minimum tagging requirement The scope of information that is at least to be captured in XBRL format in the instance document. The information prescribed as minimum tagging requirement in this filing manual, should be captured by entities, if it is applicable to them and prepared by them as part of annual report or annual returns as submitted to MCA Mandatory tags The tags as included in the MCA taxonomy, for which values have to be necessarily included in the instance document. If there is no corresponding value for the tag, then “0” should be entered. Calculation inconsistency error The taxonomy has predefined mathematical rules between accounting concepts, which is stored in calculation linkbase. The values which are included in instance documents are checked for correctness based on the rules defined in calculation relationship. If the values for totals and sub-totals do not match as per calculation linkbase, the XBRL software will highlight the same as calculation inconsistency
________________________________________________________________________________ Engineering Staff College of India Page No.6.31
6.7.4 Glossary Taxonomy Taxonomy in general means a catalogue or set of rules for classification; in XBRL, taxonomy can be referred as an electronic dictionary of the reporting concepts containing computer-readable definitions of business reporting terms as well relationships between them and links connecting them to resources. A typical taxonomy consists of a schema (or schemas) and linkbases; Schema XBRL Schemas together with linkbases define XBRL taxonomy. The purpose of XBRL schemas is to define financial and accounting concepts in system understandable manner. Each concept is given a unique name and its characteristics are defined. Schema also binds together the different parts of taxonomy. DTS Discoverable taxonomy set (DTS) is a collection of taxonomy schema documents and linkbases. The DTS includes all taxonomy schemas and linkbases that can be discovered by following links or references in the taxonomy schemas and linkbases included in the DTS. Entry point A DTS contains many schema and linkbase documents A schema which imports the base (or as required) schema and necessary linkbases, is called entry-point. Entry-point schema is usually used to browse or view the taxonomy. Namespace An XML namespace is a collection of names, defined as a uniform resource identifier (URI) and gives information regarding the ownership and or location of the taxonomy. The namespace for taxonomy usually contains the authority defining the taxonomy, date of taxonomy, in the form of web URL. The namespace specification however does not require nor suggest that the namespace URI be used to retrieve information; it is simply treated by an XML parser as a string. Prefix When declaring namespaces, a short name to identify the namespace is also defined and this is called as prefix. The schema components are associated with prefix belonging to that namespace. Prefixes precede names of elements, attributes and some of their predefined values provide an indication of where to find definitions of these properties. Elements An element is a business or a financial concept which is defined in the taxonomy according to XBRL specifications. Each element has a type, is identified by name and may have a set of attribute specifications as per the XBRL standards. Abstract attribute An abstract attribute appears on item definitions in schemas and the possible values are true and false; true indicates that the item shall not appear in instance documents, while false indicates that the concepts will hold value. Abstract elements (elements with abstract as true) are defined to bind concepts in a hierarchical manner in the taxonomy. Data type attribute This attribute indicates the data expected for concepts. Most common data types are monetary, shares, string etc. In addition, taxonomy developers may create their own data types to represent the information in a more efficient manner. Brief explanation of data types used in MCA taxonomy monetaryItem Type
________________________________________________________________________________ Engineering Staff College of India Page No.6.32
• This data type is used for all the financial concepts which denote an amount represented in a currency; an instance document when uses an element with monetaryItem data type, the user need to define the unit reference ( currency unit) in which the content is measured. Eg. Accumulated depreciation, Total income etc.
• sharesItem Type This data type is used for financial concepts which are measured in shares. Eg. Number of shares authorized shares etc.
• stringItem Type This data type is used for concepts which contain textual information. Eg. Name of subsidiary, Accounting Policy changes etc.
• PerShareItem Type This data type is used for concepts which are measured in per share. The unit reference in instance document needs the mentioning of currency as numerator and share as denominator. So the final value of measurement may come out as USD per share or Rupee per share. E.g. Earnings per share.
• percentItem Type This data type is used for concepts that are denoted as percentage. Eg. Percentage of shares held by government
• PureItem Type This data type is used for financial concepts that are denoted as ratio or proportions. Eg. Proportion Of Voting Power In Subsidiary
• decimalItem Type This data type is used for concepts which are generally represent any kind of number other than mentioned above Eg. Number of debentures
• Text blockItem Type This data type is used for concept which would describe a block of information. Usually for capturing a paragraph or notes which contain both textual and numerical information, this data type is used. Eg. Disclosure of Contingent Liabilities
• DateItem Type This data type is used for concepts which represent date. E.g. Date of Board meeting
• MCA specific data types 6.7.5 Taxonomy for Electricity Distribution Business The Institute of Chartered Accounts of India (ICAI), The premier auditing and accounting standards setting body in India, recognizing the importance of XBRL in business reporting requirements, in the year 2007 had taken a lead on the implementation of XBRL, by constituting a group comprising of regulators viz. SEBI/RBI/IRDA/MCA for undertaking the development and promotion of XBRL in India. The institute has now engaged some selected and experienced consultants to develop the XBRL Taxonomy for electricity industry including the electricity distribution business. Once it is developed and tested, the licensees can file all information with the State Electricity Regulatory Commissions in XBRL format.
Engineering Staff College of India Page No.7.1
Section – 7 7.0 Conclusion The following is the view expressed by the Ministry of Power (MoP) while developing and designing the Distribution Reform Upgrades and Management (DRUM) project with the purpose “to demonstrate best commercial and technological practices that improve the quality and reliability of ‘last mile’ power distribution in selected urban and rural distribution circles in the country”, with the financial assistance from USAID. “Reform of power distribution is today widely viewed as fundamental to improving commercial performance and financial viability of the power sector in India. In recent years, a number of states have worked to improve the commercial performance of their state utilities, unbundling state entities, creating more independent regulatory systems, and putting in place measures to control losses and theft. However, progress has been difficult, and slower than many originally hoped. Recognizing the urgent need to address the issue of reducing losses and improving the quality of power delivery, the Ministry of Power (MoP) has focused on implementing distribution reforms and has introduced several measures to further the process. The initiatives include the enactment of the Electricity Act 2003 which provides for a framework for more competitive, transparent and commercially driven power sector. The Act recognizes the need for a strategy that distinguishes urban power distribution from rural electricity supply. It also facilitates establishment of participatory models for rural distribution including electric cooperatives, rural gram panchayats (local government), distribution franchisees, etc. The other program focused on implementing distribution is the Accelerated Power Development Reform Program (APDRP) to finance the modernization of sub-transmission & distribution networks including a system of local management and energy accounting through widespread metering in every state utility’s distribution circles. Further details on legal, regulatory and policy framework can be obtained from the Ministry of Power website (www.powermin.nic.in).” The reason for slow progress of Reforms and to improve the commercial performance of the state utilities may be attributed to dearth of trained man power and expertise in the regulatory knowledge and practice. The success of independent regulatory systems requires trained man power both in the middle level of managers in the distribution utility and at the level of officers of regulatory commissions. The regulatory concepts and practices for electricity distribution business have been evolved with the knowledge and expertise in Economics, Electrical Engineering, Finance, Law and Commercial practices in the industry. In most cases, capacity building at the Commission level is also important because of the complexity involved in the regulation of distribution business. This regulatory course book is designed to provide a wealth of knowledge and practical exposure to the participants of the programme. Thorough discussion is required to elucidate the pedagogy of interdisciplinary nature and skills required for comprehension of the material presented in this book. Hope, the participants will take interest in grasping the concepts and practices presented in the course book and attain the level of expertise required for effective regulation of the distribution business in India.
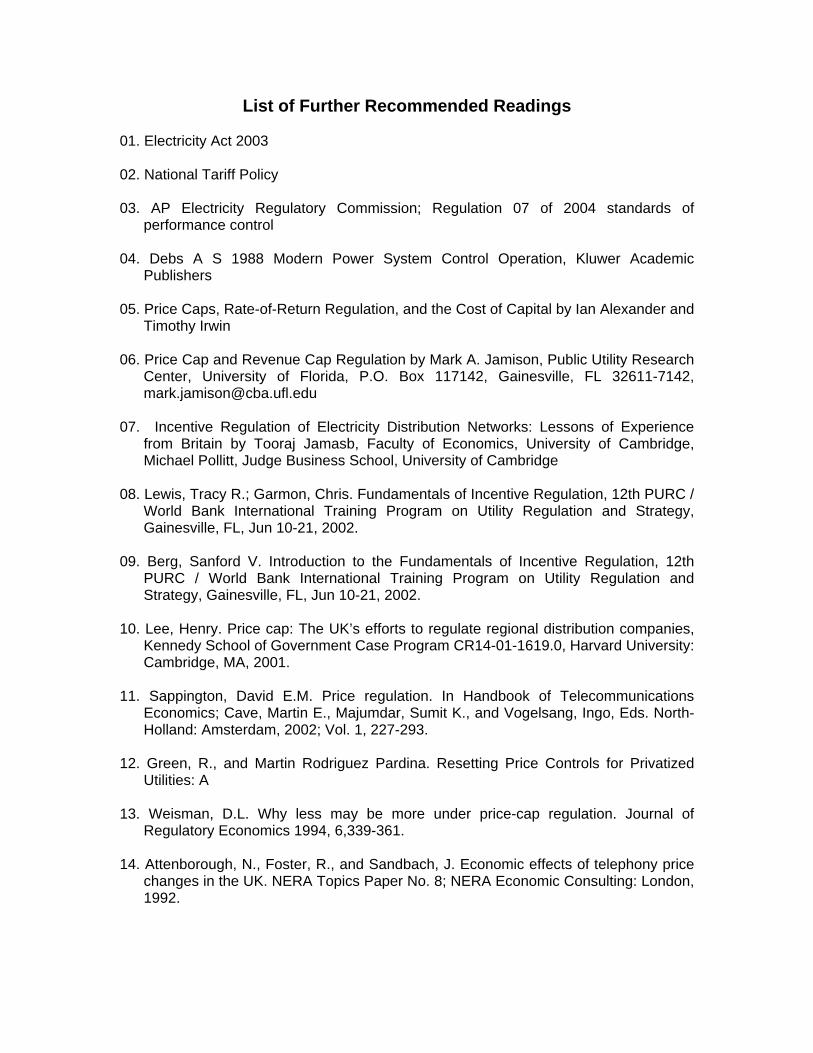
List of Further Recommended Readings 01. Electricity Act 2003 02. National Tariff Policy 03. AP Electricity Regulatory Commission; Regulation 07 of 2004 standards of
performance control 04. Debs A S 1988 Modern Power System Control Operation, Kluwer Academic
Publishers 05. Price Caps, Rate-of-Return Regulation, and the Cost of Capital by Ian Alexander and
Timothy Irwin 06. Price Cap and Revenue Cap Regulation by Mark A. Jamison, Public Utility Research
Center, University of Florida, P.O. Box 117142, Gainesville, FL 32611-7142, [email protected]
07. Incentive Regulation of Electricity Distribution Networks: Lessons of Experience
from Britain by Tooraj Jamasb, Faculty of Economics, University of Cambridge, Michael Pollitt, Judge Business School, University of Cambridge
08. Lewis, Tracy R.; Garmon, Chris. Fundamentals of Incentive Regulation, 12th PURC /
World Bank International Training Program on Utility Regulation and Strategy, Gainesville, FL, Jun 10-21, 2002.
09. Berg, Sanford V. Introduction to the Fundamentals of Incentive Regulation, 12th
PURC / World Bank International Training Program on Utility Regulation and Strategy, Gainesville, FL, Jun 10-21, 2002.
10. Lee, Henry. Price cap: The UK’s efforts to regulate regional distribution companies,
Kennedy School of Government Case Program CR14-01-1619.0, Harvard University: Cambridge, MA, 2001.
11. Sappington, David E.M. Price regulation. In Handbook of Telecommunications
Economics; Cave, Martin E., Majumdar, Sumit K., and Vogelsang, Ingo, Eds. North-Holland: Amsterdam, 2002; Vol. 1, 227-293.
12. Green, R., and Martin Rodriguez Pardina. Resetting Price Controls for Privatized
Utilities: A 13. Weisman, D.L. Why less may be more under price-cap regulation. Journal of
Regulatory Economics 1994, 6,339-361. 14. Attenborough, N., Foster, R., and Sandbach, J. Economic effects of telephony price
changes in the UK. NERA Topics Paper No. 8; NERA Economic Consulting: London, 1992.
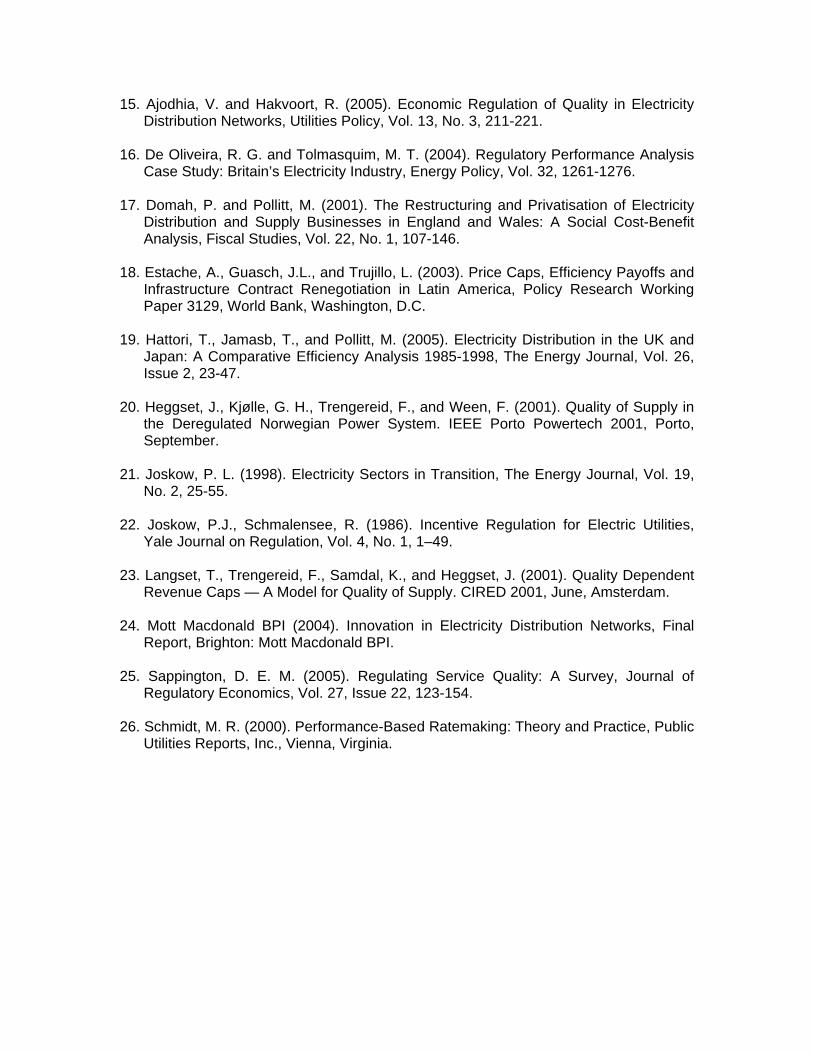
15. Ajodhia, V. and Hakvoort, R. (2005). Economic Regulation of Quality in Electricity Distribution Networks, Utilities Policy, Vol. 13, No. 3, 211-221.
16. De Oliveira, R. G. and Tolmasquim, M. T. (2004). Regulatory Performance Analysis
Case Study: Britain’s Electricity Industry, Energy Policy, Vol. 32, 1261-1276. 17. Domah, P. and Pollitt, M. (2001). The Restructuring and Privatisation of Electricity
Distribution and Supply Businesses in England and Wales: A Social Cost-Benefit Analysis, Fiscal Studies, Vol. 22, No. 1, 107-146.
18. Estache, A., Guasch, J.L., and Trujillo, L. (2003). Price Caps, Efficiency Payoffs and
Infrastructure Contract Renegotiation in Latin America, Policy Research Working Paper 3129, World Bank, Washington, D.C.
19. Hattori, T., Jamasb, T., and Pollitt, M. (2005). Electricity Distribution in the UK and
Japan: A Comparative Efficiency Analysis 1985-1998, The Energy Journal, Vol. 26, Issue 2, 23-47.
20. Heggset, J., Kjølle, G. H., Trengereid, F., and Ween, F. (2001). Quality of Supply in
the Deregulated Norwegian Power System. IEEE Porto Powertech 2001, Porto, September.
21. Joskow, P. L. (1998). Electricity Sectors in Transition, The Energy Journal, Vol. 19,
No. 2, 25-55. 22. Joskow, P.J., Schmalensee, R. (1986). Incentive Regulation for Electric Utilities,
Yale Journal on Regulation, Vol. 4, No. 1, 1–49. 23. Langset, T., Trengereid, F., Samdal, K., and Heggset, J. (2001). Quality Dependent
Revenue Caps — A Model for Quality of Supply. CIRED 2001, June, Amsterdam. 24. Mott Macdonald BPI (2004). Innovation in Electricity Distribution Networks, Final
Report, Brighton: Mott Macdonald BPI. 25. Sappington, D. E. M. (2005). Regulating Service Quality: A Survey, Journal of
Regulatory Economics, Vol. 27, Issue 22, 123-154. 26. Schmidt, M. R. (2000). Performance-Based Ratemaking: Theory and Practice, Public
Utilities Reports, Inc., Vienna, Virginia.
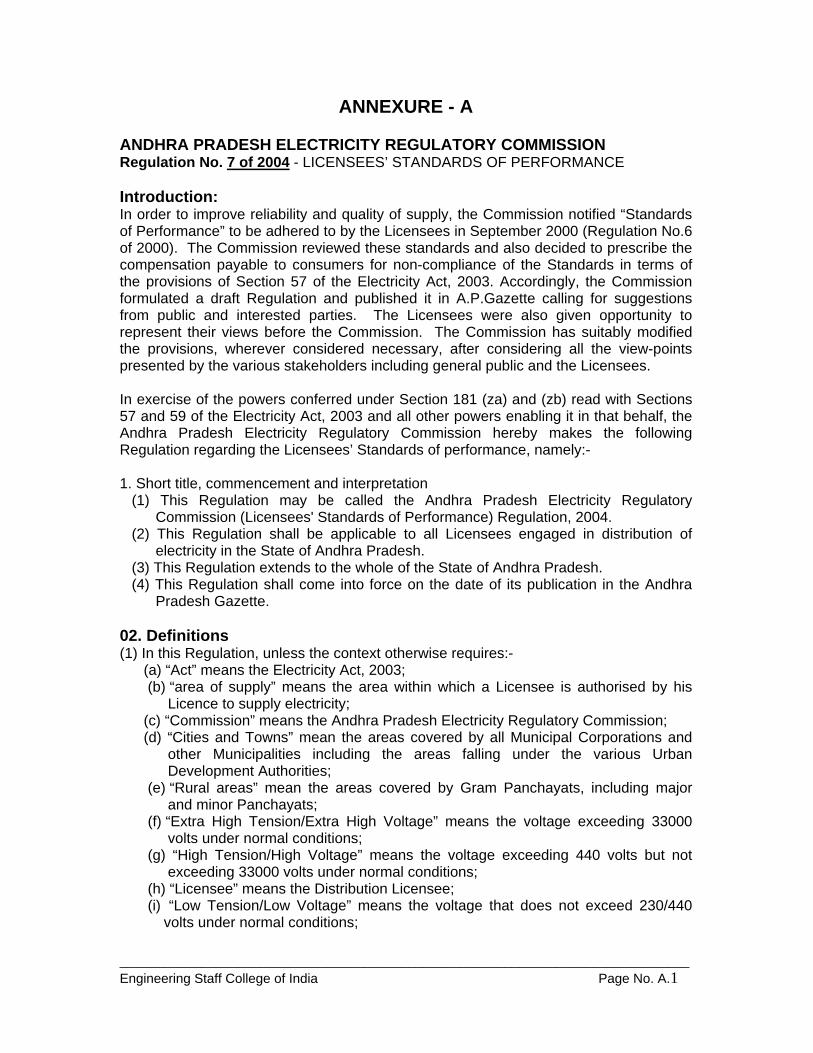
_____________________________________________________________________________Engineering Staff College of India Page No. A.1
ANNEXURE - A ANDHRA PRADESH ELECTRICITY REGULATORY COMMISSION Regulation No. 7 of 2004 - LICENSEES’ STANDARDS OF PERFORMANCE Introduction: In order to improve reliability and quality of supply, the Commission notified “Standards of Performance” to be adhered to by the Licensees in September 2000 (Regulation No.6 of 2000). The Commission reviewed these standards and also decided to prescribe the compensation payable to consumers for non-compliance of the Standards in terms of the provisions of Section 57 of the Electricity Act, 2003. Accordingly, the Commission formulated a draft Regulation and published it in A.P.Gazette calling for suggestions from public and interested parties. The Licensees were also given opportunity to represent their views before the Commission. The Commission has suitably modified the provisions, wherever considered necessary, after considering all the view-points presented by the various stakeholders including general public and the Licensees. In exercise of the powers conferred under Section 181 (za) and (zb) read with Sections 57 and 59 of the Electricity Act, 2003 and all other powers enabling it in that behalf, the Andhra Pradesh Electricity Regulatory Commission hereby makes the following Regulation regarding the Licensees’ Standards of performance, namely:- 1. Short title, commencement and interpretation
(1) This Regulation may be called the Andhra Pradesh Electricity Regulatory Commission (Licensees' Standards of Performance) Regulation, 2004.
(2) This Regulation shall be applicable to all Licensees engaged in distribution of electricity in the State of Andhra Pradesh.
(3) This Regulation extends to the whole of the State of Andhra Pradesh. (4) This Regulation shall come into force on the date of its publication in the Andhra
Pradesh Gazette.
02. Definitions (1) In this Regulation, unless the context otherwise requires:-
(a) “Act” means the Electricity Act, 2003; (b) “area of supply” means the area within which a Licensee is authorised by his
Licence to supply electricity; (c) “Commission” means the Andhra Pradesh Electricity Regulatory Commission; (d) “Cities and Towns” mean the areas covered by all Municipal Corporations and
other Municipalities including the areas falling under the various Urban Development Authorities;
(e) “Rural areas” mean the areas covered by Gram Panchayats, including major and minor Panchayats;
(f) “Extra High Tension/Extra High Voltage” means the voltage exceeding 33000 volts under normal conditions;
(g) “High Tension/High Voltage” means the voltage exceeding 440 volts but not exceeding 33000 volts under normal conditions;
(h) “Licensee” means the Distribution Licensee; (i) “Low Tension/Low Voltage” means the voltage that does not exceed 230/440
volts under normal conditions;

_____________________________________________________________________________Engineering Staff College of India Page No. A.2
(2) Words and expressions used and not defined in this Regulation shall bear the same meaning as in the Act or in absence of any definition in the Act, the meaning as commonly understood in the electricity supply industry.
03. Guaranteed and Overall Standards of Performance (1) The Standards specified in the Schedule - I shall be the Guaranteed Standards of Performance, being the minimum standards of service that a Licensee shall achieve, and the Standards specified in the Schedule-III shall be the Overall Standards of Performance which the Licensee shall seek to achieve in the discharge of his obligations as a Licensee. (2) The Commission may from time to time add, alter, vary, modify or amend the contents of the Schedule - I, Schedule - II and Schedule-III. 04. Compensation (1) The Licensee shall be liable to pay to the affected consumers compensation specified in Schedule – II for Licensee’s failure to meet the Guaranteed Standards of Performance specified in Schedule – I. The compensation shall be paid by the Licensee in the manner specified in Schedule II : Provided that in case of events affecting more than one consumer, the provisions for payment of compensation specified in Schedule-II shall be applicable after the expiry of one year from the date of publication of this Regulation when the data on consumer indexing is expected to be available. Provided further that the liability for payment of compensation shall be applicable to towns and cities three months after the date on which this Regulation is notified in the Andhra Pradesh Gazette. For rural areas, the effective date for liability for payment of compensation shall be one year after the date of publication of the Regulation in Official Gazette. (2) The Licensee concerned shall pay the compensation referred to under sub-clause (1) above by way of adjustment in the current or future electricity bill(s) as laid out in Schedule-II. 05. Information on Standards of Performance (1) For Guaranteed Standards, each Licensee shall furnish to the Commission, in a
report for every month and in a consolidated annual report, the following information: (a) The levels of performance achieved by the Licensee with reference to the
standards specified in Schedule – I to this Regulation; (b) The number of cases in which compensation was paid under clause 4 above,
and the aggregate amount of the compensation payable and paid by the Licensee, and
(c) The measures taken by the Licensee to improve performance in the areas covered by Guaranteed Standards and Licensee’s assessment of the targets to be imposed for the ensuing year.
(2) For Overall Standards, each Licensee shall furnish to the Commission, in a report for
every quarter and in a consolidated annual report, the following information:
_____________________________________________________________________________Engineering Staff College of India Page No. A.3
(a) The level of performance achieved with reference to the standards specified in Schedule – I to this Regulation; and,
(b) The measures taken by the Licensee to improve performance in the areas covered by Overall Standards and Licensee’s assessment of the targets to be imposed for the ensuing year.
(3) The Commission shall, at such intervals as it may deem fit and not inconsistent with
the provisions of the Act, arrange for the publication of the information furnished by Licensees under this Regulation.
06. Exemption (1) The standards of performance specified in this Regulation shall remain suspended
during Force Majeure conditions such as war, mutiny, civil commotion, riot, flood, cyclone, lightning, earthquake or other force and strike, lockout, fire affecting the Licensee’s installations and activities.
(2) Non-compliance of a standard contained in this Regulation shall not be treated as a
violation, and the Distribution Licensee shall not be required to pay any compensation to affected consumer(s), if such violation is caused due to grid failure, a fault on the Transmission Licensee’s network or on account of instructions given by SLDC, over which the Distribution Licensee has no reasonable control.
(3) The Commission may by a general or special order after hearing the Licensee and
the affected consumer(s) / consumer groups, absolve the Licensee from the liability to compensate the consumers for any default in the performance of any standard if the Commission is satisfied that such default is for reasons other than those attributable to the Licensee and further that the Licensee has otherwise made efforts to fulfill his obligations.
07. Issue of Orders and Practice Directions (1) Subject to the provisions of the Electricity Act, 2003 and this Regulation, the
Commission may, from time to time, issue orders and practice directions in regard to the implementation of the Regulation and procedure to be followed and various matters, which the Commission has been empowered by this Regulation to specify or direct.
(2) In particular, the Commission may authorize the Commission staff or any
independent agency to conduct periodical checks, monitor the compliance of the Standards by the Licensees and report to the Commission.
08. Power to Remove Difficulties: If any difficulty arises in giving effect to any of
the provisions of this Regulation, the Commission may, by general or special order, do or undertake or direct the Licensees to do or undertake things, which in the opinion of the Commission are necessary or expedient for the purpose of removing the difficulties.
09. Power to Amend (1) The Commission may at any time, vary, alter, modify, or amend any provisions of the
Regulation.

_____________________________________________________________________________Engineering Staff College of India Page No. A.4
(2) In particular the Commission may review these standards after a period of three years or at any other time, if considered necessary. This Regulation shall however continue to be in force till it is modified based on such review.
10. Repeal and Savings (1) The Andhra Pradesh Electricity Regulatory Commission (Standards of Performance)
Regulation, 2000, shall stand repealed from the date of publication of this Regulation.
(2) Notwithstanding such repeal, anything done or any action taken or purported to have
been done or taken including any order direction or notice made or issued under the repealed Regulation shall remain valid.
(3) Nothing in this Regulation shall affect the rights and privileges of the consumers under any other law including the Consumer Protection Act, 1986.
(BY ORDER OF THE COMMISSION)
SURYA PRAKASA RAO Secretary

_____________________________________________________________________________Engineering Staff College of India Page No. A.5
SCHEDULE – I GUARANTEED STANDARDS OF PERFORMANCE
I. Restoration of Power Supply 1.1 Normal Fuse-off: The Licensee shall restore power supply in the case of normal fuse-off calls (replacing Horn Gap (HG) fuses or Low Tension (LT) fuses at the distribution transformer or at the consumer premises) within 4 working hours of receiving the complaint in towns and cities and within 12 working hours of receiving the complaint in rural areas. Individual fuse-off calls at consumer premises, wherever the fault is of such nature that it requires shutting down the power supply affecting other consumers also, shall not however be attended to between 6PM and 8AM except in case of essential services covered under the Essential Services Maintenance Act (ESMA). 1.2 Overhead Line/Cable Breakdowns: In case of overhead line/cable breakdowns, the Licensee shall ensure restoration of power supply within 6 hours of occurrence of breakdown in towns and cities and within 24 hours of occurrence of breakdown in rural areas. 1.3 Underground Cable Breakdowns: In case of breakdown of underground cable, the Licensee shall ensure restoration of power supply within 12 hours of occurrence of breakdown in towns and cities and within 48 hours of occurrence of breakdown in rural areas. 1.4 Distribution Transformer failure: The Licensee shall restore supply in the case of distribution transformer failures by replacement of transformer within 24 hours of receiving the complaint in towns and cities and within 48 hours of receiving the complaint in rural areas. 1.5 Period of scheduled outages: Interruption in power supply due to scheduled outages, other than the load-shedding, shall be notified by the Licensee at least 24 hours in advance and shall not exceed 12 hours in a day. In each such event, the Licensee shall ensure that the supply is restored by not later than 6:00 PM. II. Quality of Power Supply 2.1 Voltage fluctuations (i) The Licensee shall maintain the voltages at the point of commencement of supply to
a consumer within the limits stipulated hereunder, with reference to declared voltage:
(a) In the case of Low Voltage, +6% and -6%; (b) In the case of High Voltage, +6% and -9%; and, (c) In the case of Extra High Voltage, +10% and -12.5%.
(ii) On receipt of a voltage fluctuation complaint, the Licensee shall verify if the voltage fluctuation is exceeding the limits specified in sub-paragraph (i) above and if confirmed, the Licensee shall
(a) Ensure that the voltages are brought within the said limits, within 10 days of original complaint if no expansion/enhancement of network is involved;
(b) Resolve the complaint within 120 days, if up-gradation of distribution system is required:

_____________________________________________________________________________Engineering Staff College of India Page No. A.6
Provided that where a substation is required to be erected to resolve such complaints, the Licensee shall, within one month of the receipt of such complaint, submit to the Commission a proposal for erection of the substation, together with the time required to complete erection and commissioning of such substation and get the same approved by the Commission : Provided further that where such substation is covered in the Licensee’s investment plan approved by the Commission, the Licensee shall complete the erection and commissioning of the such substation within the time period specified in such investment plan: Provided further that no compensation on account of voltage fluctuations shall be payable to industrial and agricultural consumers who do not provide capacitors to the prescribed extent. 2.2 Harmonics (i) The Licensee shall maintain the limits of harmonics as per the stages prescribed
hereunder: Stage-1: The cumulative Total Voltage Harmonic Distortion (THDv) at the Point of
Commencement of Supply for each consumer connected at 132KV and above shall be limited to 3% (as per Grid Code of Andhra Pradesh).
Stage-2: The cumulative Total Voltage Harmonic Distortion (THDv) at the Point of
Commencement of Supply for each consumer connected at 33KV shall be limited to 8% (as per Grid Code of Andhra Pradesh).
Stage-3: The cumulative Total Voltage Harmonic Distortion (THDv) at the Point of
Commencement of Supply for each consumer connected at 11KV shall be limited to 8% (as per Grid Code of Andhra Pradesh).
(ii) Stage-1 shall be effective on the expiry of one year from the date of publication of
this Regulation. The Commission will notify the compensation amounts for default on this standard on commencement of Stage-I.
(iii) The Commission will specify the effective dates for Stage-2 and Stage-3 after
consultation with the Licensees. (iv) The assessment method for recording harmonic levels shall be as laid out in the
Grid Code of Andhra Pradesh, until the Commission lays down a separate procedure.
III. Complaints about Meters 3.1 The licensee shall inspect and check the correctness of the meter within 7 working days of receiving the complaint in cities and towns and within 15 working days in rural areas. If the meter is not working (stuck up, running slow, fast or creeping), the licensee shall replace the meter at Licensee’s own cost, within 15 days thereafter. 3.2 The Licensee shall replace at Licensee’s own cost the burnt out meters within 7 days of complaint if the burning of meter is due to causes attributable to the Licensee

_____________________________________________________________________________Engineering Staff College of India Page No. A.7
like high voltage, loose contacts, aging of meter, etc. If the meter is burnt due to causes attributable to the consumer such as tampering, defect in consumer’s installation, meter getting wet, connecting unauthorized additional load by the consumer, etc., the Licensee shall serve a notice to the consumer for recovery of cost of the meter within 7 days of detection and shall replace the meter within 7 days of receiving the payment from the consumer and after necessary corrective action is taken to avoid future damage to the meter. IV. Applications for New Connections / Additional Load 4.1 Cases where power supply can be provided from existing network (i) The Licensee shall release supply to an applicant within 30 days of receipt of a
complete application accompanied by prescribed fees, charges and security: Provided that in case of applications requiring supply under Low Tension Agricultural category, such obligation on the part of the Licensee shall be limited to the number of connections that can be covered within the target fixed for the year for release of agricultural connections. The Licensee shall maintain a waiting list of such applicants in a serial order based on the receipt of applications and the waiting list number shall be communicated to the concerned applicant in writing within 15 days of receipt of application. If, however, the applicant’s case cannot be covered in the programme of release of agricultural connections fixed for the year, it shall be so indicated in the said written communication. (ii) The Licensee shall keep the fees, charges and security payable by the applicants for
new connections notified and also specify the same on the application form. 4.2 Cases where power supply requires extension of distribution mains (i) The Licensee shall acknowledge the receipt of the application within 2 days and shall
intimate to the applicant in writing, the amount of security and other charges payable within 7, 15, 30 and 45 days of receipt of application for Low Tension, High Tension (11KV), High Tension (33KV) and Extra High Tension (above 33KV) respectively.
(ii) The supply of electricity in such cases shall be effected by the Licensee within the
time limits specified hereunder:
Voltage of supply
Period from date of payment of required security and other charges, within
which supply of electricity should be provided
Low Tension 30 days High Tension – 11000 Volts 60 days High Tension – 33000 Volts 90 days Extra High Tension – Above 33000 Volts 180 days
Provided that the distribution Licensee may approach the Commission for extension of time specified above, in specific cases where the magnitude of extension of distribution mains is such that it requires more time, duly furnishing the details in support of such claim for extension. Such request should be made immediately after preparation of the estimate for such extension.
_____________________________________________________________________________Engineering Staff College of India Page No. A.8
4.3 Erection of substation to extend supply In cases of application for new connection, where extension of supply requires erection and commissioning of new 33/11KV substation, the distribution Licensee shall submit to the Commission within 15 days of receipt of such application, a proposal for erection of such 33/11KV substation together with the time required for erecting and commissioning the substation, and get the same approved by the Commission. The Licensee shall commence power supply to the applicant within the time period so approved by the Commission : Provided that if the substation is meant to extend supply to an individual consumer, the Licensee shall commence erection of the substation only after receipt of necessary security from the applicant : Provided further that where such substation is covered in the investment plan approved by the Commission, the distribution Licensee shall not be required to take any further approval from the Commission and shall complete erection of such substation within the time period specified in such investment plan. 4.4 The Licensee shall not, however, be held responsible for the delay, if any, in extending supply, if the same is on account of problems relating to statutory clearances, right of way, acquisition of land, or the delay in consumer’s obligation to obtain approval of Chief Electrical Inspector to Government for his High Tension or Extra High Tension installation, etc. over which Licensee has no reasonable control. V Transfer of Ownership and Conversion of Services 5. The Licensee shall give effect to transfer of ownership, change of category and conversion of the existing services from Low Tension to High Tension and vice-versa within the following time limits: (a) Title transfer of ownership - within 7 days of receipt of application, with necessary
documents and prescribed fee, if any (b) Change of category (c) Conversion from Low Tension - within 30 days from the date of single phase to Low
Tension payment of necessary charges by 3-phase and vice-versa the consumer (d) Conversion from Low Tension - within 60 days from the date of to High Tension and
payment of necessary charges by vice-versa the consumer
Provided that in case of conversion from Low Tension to High Tension and vice-versa, the Licensee shall not be held responsible for the delay if the same is on account of delay in consumer’s obligation to obtain approval of Chief Electrical Inspector to Government, for such installation. VI. Complaints about Consumer’s Bills 6.1 (i) The Licensee shall acknowledge the consumer’s complaint immediately, if received in person and within 2 working days, if received by post. The Licensee shall resolve the complaint regarding electricity bills within 24 working hours of its receipt, if no additional information is required to be collected and within 7 working days of receipt of complaint in case any additional information is required. (ii) In case the complaint is genuine and revision of bill already issued becomes necessary, the due date for payment of bill shall be reckoned from the date of revised
_____________________________________________________________________________Engineering Staff College of India Page No. A.9
bill for the purpose of disconnection of supply or for levy of additional charges for belated payment. 6.2 Reconnection of supply following disconnection due to non-payment of bills The Licensee shall restore power supply to a consumer, whose supply has been disconnected due to non-payment of electricity bills, within 4 working hours of receipt of production of proof of payment by the consumer in towns and cities, and within 12 working hours of production of proof of payment by the consumer in rural areas.
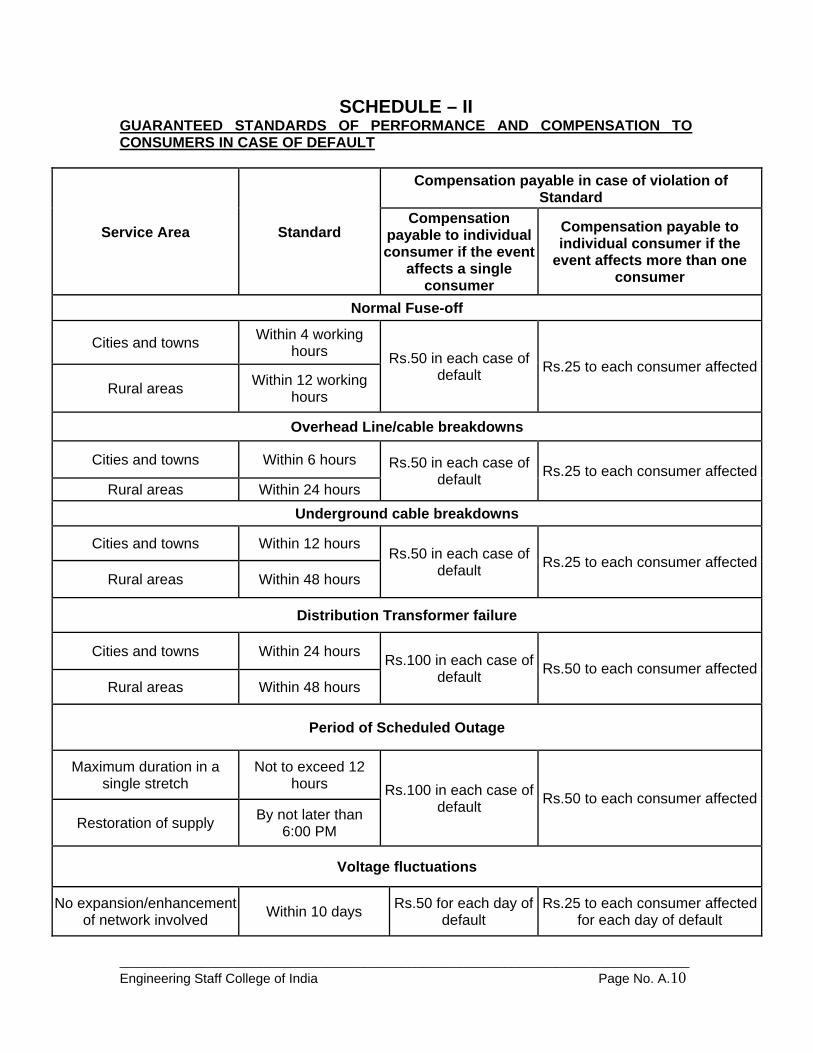
_____________________________________________________________________________Engineering Staff College of India Page No. A.10
SCHEDULE – II GUARANTEED STANDARDS OF PERFORMANCE AND COMPENSATION TO CONSUMERS IN CASE OF DEFAULT
Service Area Standard
Compensation payable in case of violation of Standard
Compensation payable to individual consumer if the event
affects a single consumer
Compensation payable to individual consumer if the
event affects more than one consumer
Normal Fuse-off
Cities and towns Within 4 working hours Rs.50 in each case of
default Rs.25 to each consumer affectedRural areas Within 12 working
hours
Overhead Line/cable breakdowns
Cities and towns Within 6 hours Rs.50 in each case of default Rs.25 to each consumer affected
Rural areas Within 24 hours Underground cable breakdowns
Cities and towns Within 12 hours Rs.50 in each case of
default Rs.25 to each consumer affectedRural areas Within 48 hours
Distribution Transformer failure
Cities and towns Within 24 hours Rs.100 in each case of default Rs.50 to each consumer affected
Rural areas Within 48 hours
Period of Scheduled Outage
Maximum duration in a single stretch
Not to exceed 12 hours Rs.100 in each case of
default Rs.50 to each consumer affected
Restoration of supply By not later than 6:00 PM
Voltage fluctuations
No expansion/enhancement of network involved Within 10 days Rs.50 for each day of
default Rs.25 to each consumer affected
for each day of default
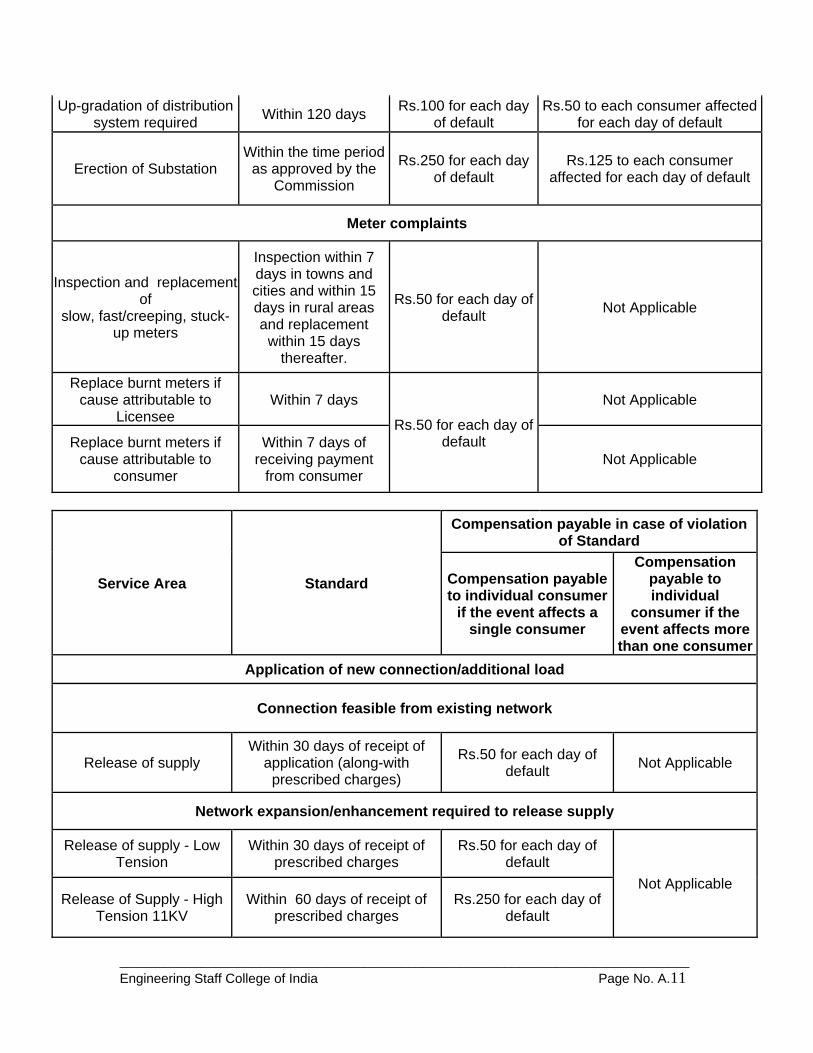
_____________________________________________________________________________Engineering Staff College of India Page No. A.11
Up-gradation of distribution system required Within 120 days Rs.100 for each day
of default Rs.50 to each consumer affected
for each day of default
Erection of Substation Within the time period
as approved by the Commission
Rs.250 for each day of default
Rs.125 to each consumer affected for each day of default
Meter complaints
Inspection and replacement of
slow, fast/creeping, stuck-up meters
Inspection within 7 days in towns and cities and within 15 days in rural areas and replacement
within 15 days thereafter.
Rs.50 for each day of default Not Applicable
Replace burnt meters if cause attributable to
Licensee Within 7 days
Rs.50 for each day of default
Not Applicable
Replace burnt meters if cause attributable to
consumer
Within 7 days of receiving payment
from consumer Not Applicable
Service Area Standard
Compensation payable in case of violation of Standard
Compensation payable to individual consumer
if the event affects a single consumer
Compensation payable to individual
consumer if the event affects more than one consumer
Application of new connection/additional load
Connection feasible from existing network
Release of supply Within 30 days of receipt of
application (along-with prescribed charges)
Rs.50 for each day of default Not Applicable
Network expansion/enhancement required to release supply
Release of supply - Low Tension
Within 30 days of receipt of prescribed charges
Rs.50 for each day of default
Not Applicable Release of Supply - High
Tension 11KV Within 60 days of receipt of
prescribed charges Rs.250 for each day of
default
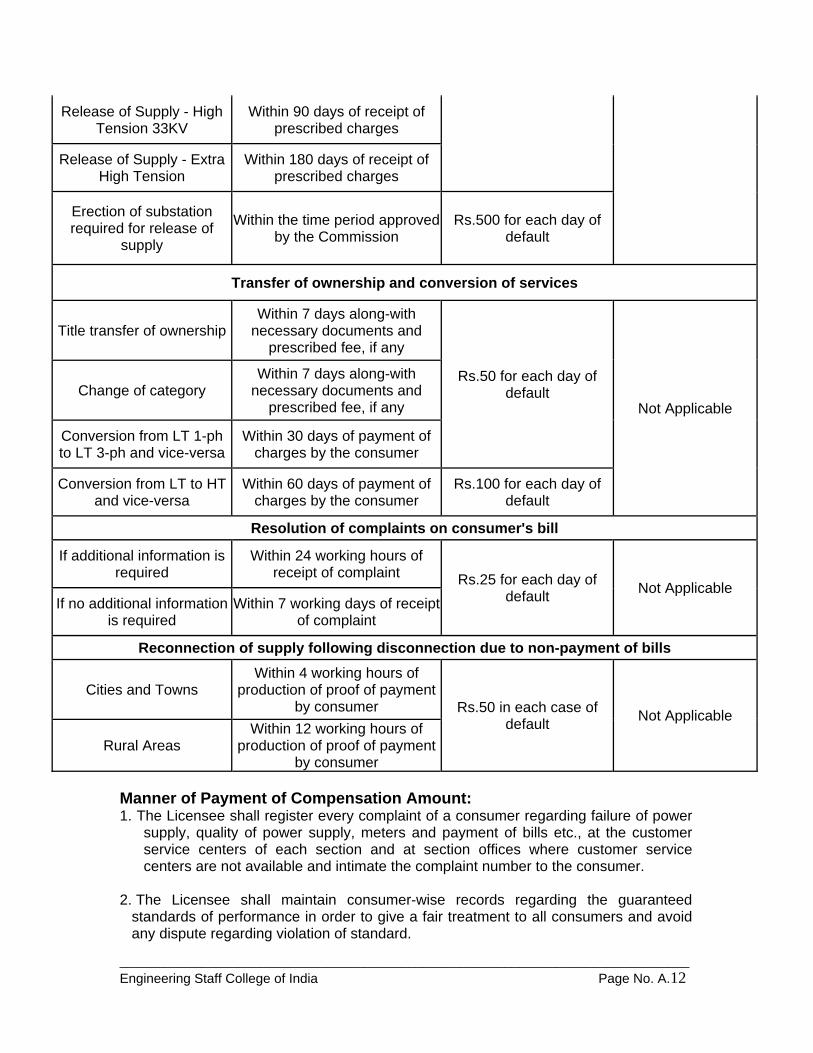
_____________________________________________________________________________Engineering Staff College of India Page No. A.12
Release of Supply - High Tension 33KV
Within 90 days of receipt of prescribed charges
Release of Supply - Extra High Tension
Within 180 days of receipt of prescribed charges
Erection of substation required for release of
supply
Within the time period approved by the Commission
Rs.500 for each day of default
Transfer of ownership and conversion of services
Title transfer of ownership Within 7 days along-with
necessary documents and prescribed fee, if any
Rs.50 for each day of default
Not Applicable Change of category
Within 7 days along-with necessary documents and
prescribed fee, if any
Conversion from LT 1-ph to LT 3-ph and vice-versa
Within 30 days of payment of charges by the consumer
Conversion from LT to HT and vice-versa
Within 60 days of payment of charges by the consumer
Rs.100 for each day of default
Resolution of complaints on consumer's bill
If additional information is required
Within 24 working hours of receipt of complaint Rs.25 for each day of
default Not Applicable If no additional information
is required Within 7 working days of receipt
of complaint
Reconnection of supply following disconnection due to non-payment of bills
Cities and Towns Within 4 working hours of
production of proof of payment by consumer Rs.50 in each case of
default Not Applicable
Rural Areas Within 12 working hours of
production of proof of payment by consumer
Manner of Payment of Compensation Amount: 1. The Licensee shall register every complaint of a consumer regarding failure of power
supply, quality of power supply, meters and payment of bills etc., at the customer service centers of each section and at section offices where customer service centers are not available and intimate the complaint number to the consumer.
2. The Licensee shall maintain consumer-wise records regarding the guaranteed
standards of performance in order to give a fair treatment to all consumers and avoid any dispute regarding violation of standard.
_____________________________________________________________________________Engineering Staff College of India Page No. A.13
3. All payments of compensation shall be made by way of adjustment against current and/or future bills for supply of electricity, but not later than 90 days from the date of violation of a Guaranteed Standard.
4. If the Licensee, however, fails to dispense the compensation amount as laid out in
paragraph 3 above the aggrieved consumer(s) can approach the Forum for redressal of grievances of consumers to seek such compensation.

_____________________________________________________________________________Engineering Staff College of India Page No. A.14
SCHEDULE- III OVERALL STANDARDS OF PERFORMANCE
1.1 Normal fuse-off calls: The Licensee shall maintain the percentage of fuse-off calls rectified within the time limits prescribed under sub-paragraph 1.1 of Schedule-I to total calls received at a value not less than 99%. 1.2 Line Breakdowns: In case of line breakdowns, the Licensee shall ensure restoration of power supply within 6 hours of occurrence of breakdown in towns and cities and within 24 hours of occurrence of breakdown in rural areas as prescribed in sub-paragraph 1.2 of Schedule-I. The Licensee shall achieve this standard of performance in at least 95% of the cases. 1.3 Distribution Transformer Failures: The Licensee shall maintain the percentage of distribution transformers replaced within the time limits prescribed in sub-paragraph 1.3 of Schedule-I to the total distribution transformers failed at a value not less than 95%. 1.4 Period of scheduled outages: As specified in sub-paragraph 1.5 of Schedule-I, interruption in power supply due to scheduled outages, other than the load-shedding, has to be notified in advance and shall not exceed 12 hours in a day and in each such event, the Licensee has to ensure that the supply is restored by 6:00PM. The Licensee shall achieve both of these standards of performance in at least 95% of the cases. 1.5 Street Light faults 1.5.1 The Licensee shall rectify line faults and restore streetlights within 24 hours of detection or receipt of complaint, whichever is earlier, and shall achieve this standard of performance in at least 90% of the cases. 1.5.2 In case of a fused light or defective unit, the Licensee, wherever responsible for maintenance of street lights, shall replace the light or rectify/replace the unit within 24 hours of detection or receipt of complaint, whichever is earlier, and shall achieve this standards of performance in at least 90% of the cases. 1.6 Reliability Indices (i) The following reliability/outage indices are prescribed by the Institute of Electrical and
Electronics Engineers (IEEE) Standard 1366 of 1998. The Licensee shall compute and report the value of these indices from 2002-03 onwards: (a) System Average Interruption Frequency Index (SAIFI): The Licensee shall
calculate the value as per the formula and methodology specified below. (b) System Average Interruption Duration Index (SAIDI): The Licensee shall
calculate the value as per the formula and methodology specified below. (c) Momentary Average Interruption Frequency Index (MAIFI): The Licensee
shall calculate the value as per the formula and methodology specified below. Method to Compute Distribution System Reliability Indices The Indices shall be computed for the Discom as a whole by stacking, for each month all the 11KV/33KV feeders in the supply area, excluding those serving predominantly agricultural loads, and then aggregating the number and duration of all interruptions in
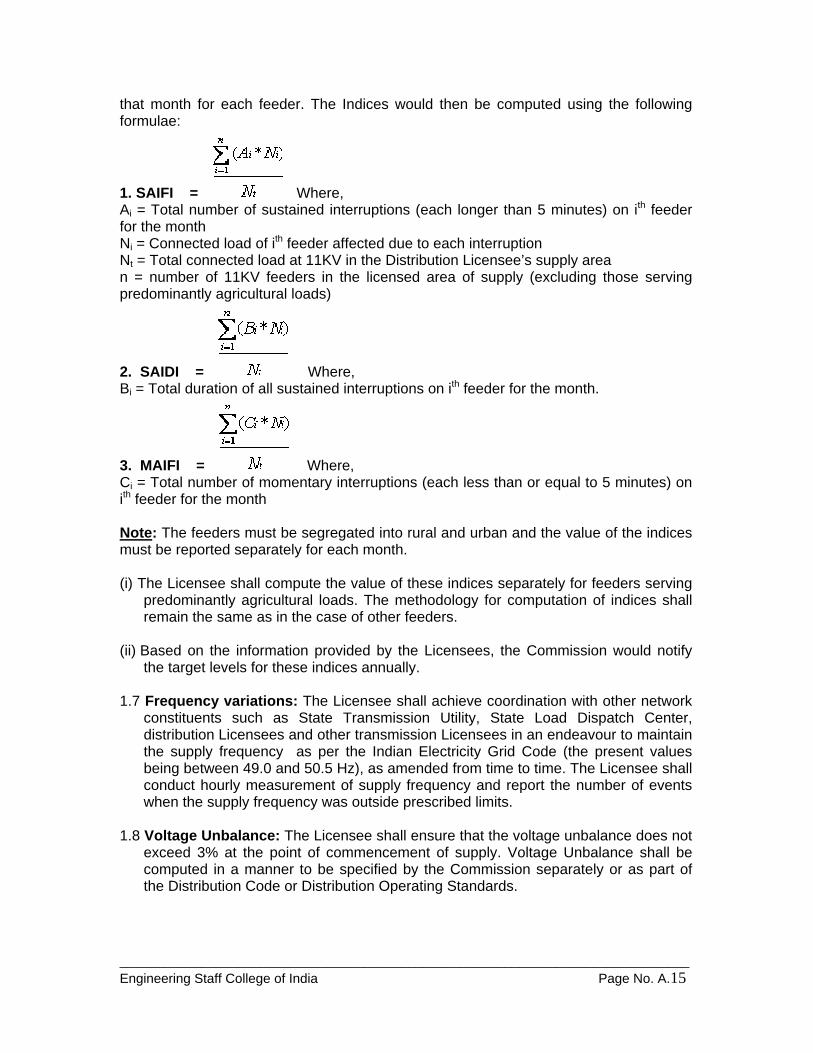
_____________________________________________________________________________Engineering Staff College of India Page No. A.15
that month for each feeder. The Indices would then be computed using the following formulae:
1. SAIFI = Where, Ai = Total number of sustained interruptions (each longer than 5 minutes) on ith feeder for the month Ni = Connected load of ith feeder affected due to each interruption Nt = Total connected load at 11KV in the Distribution Licensee’s supply area n = number of 11KV feeders in the licensed area of supply (excluding those serving predominantly agricultural loads)
2. SAIDI = Where, Bi = Total duration of all sustained interruptions on ith feeder for the month.
3. MAIFI = Where, Ci = Total number of momentary interruptions (each less than or equal to 5 minutes) on ith feeder for the month Note: The feeders must be segregated into rural and urban and the value of the indices must be reported separately for each month. (i) The Licensee shall compute the value of these indices separately for feeders serving
predominantly agricultural loads. The methodology for computation of indices shall remain the same as in the case of other feeders.
(ii) Based on the information provided by the Licensees, the Commission would notify
the target levels for these indices annually. 1.7 Frequency variations: The Licensee shall achieve coordination with other network
constituents such as State Transmission Utility, State Load Dispatch Center, distribution Licensees and other transmission Licensees in an endeavour to maintain the supply frequency as per the Indian Electricity Grid Code (the present values being between 49.0 and 50.5 Hz), as amended from time to time. The Licensee shall conduct hourly measurement of supply frequency and report the number of events when the supply frequency was outside prescribed limits.
1.8 Voltage Unbalance: The Licensee shall ensure that the voltage unbalance does not
exceed 3% at the point of commencement of supply. Voltage Unbalance shall be computed in a manner to be specified by the Commission separately or as part of the Distribution Code or Distribution Operating Standards.
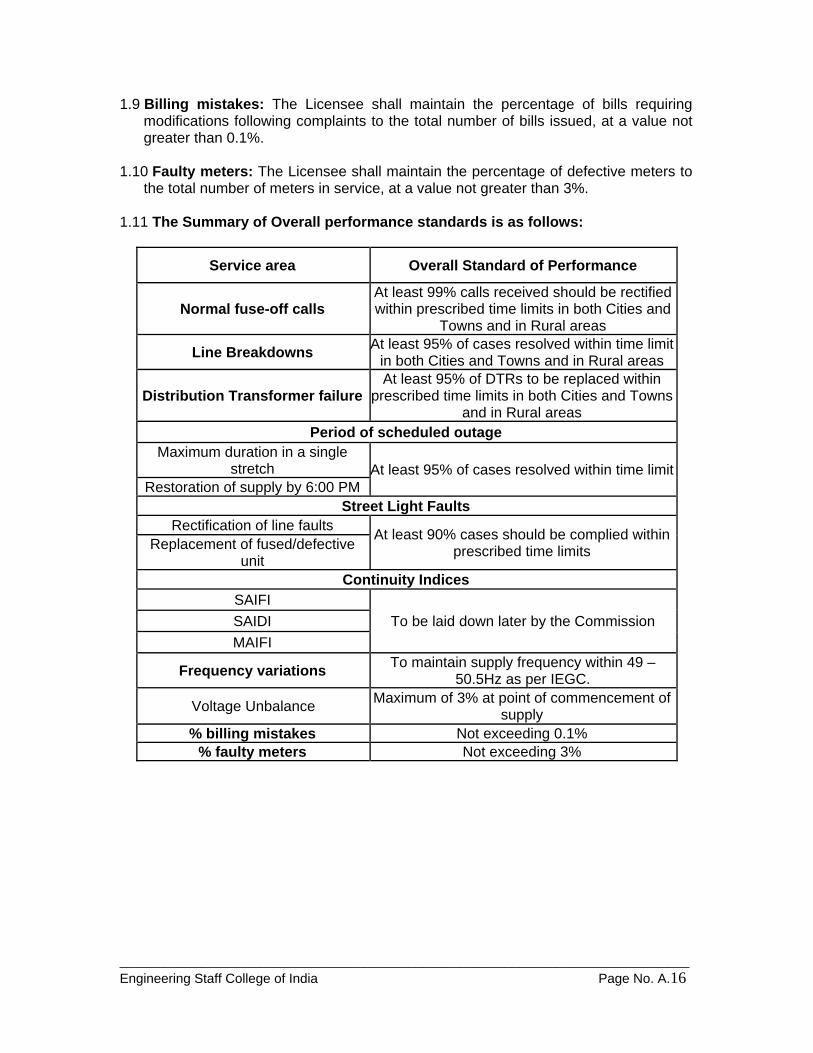
_____________________________________________________________________________Engineering Staff College of India Page No. A.16
1.9 Billing mistakes: The Licensee shall maintain the percentage of bills requiring modifications following complaints to the total number of bills issued, at a value not greater than 0.1%.
1.10 Faulty meters: The Licensee shall maintain the percentage of defective meters to
the total number of meters in service, at a value not greater than 3%. 1.11 The Summary of Overall performance standards is as follows:
Service area Overall Standard of Performance
Normal fuse-off calls At least 99% calls received should be rectified within prescribed time limits in both Cities and
Towns and in Rural areas
Line Breakdowns At least 95% of cases resolved within time limit in both Cities and Towns and in Rural areas
Distribution Transformer failureAt least 95% of DTRs to be replaced within
prescribed time limits in both Cities and Towns and in Rural areas
Period of scheduled outage Maximum duration in a single
stretch At least 95% of cases resolved within time limitRestoration of supply by 6:00 PM
Street Light Faults Rectification of line faults At least 90% cases should be complied within
prescribed time limits Replacement of fused/defective unit
Continuity Indices SAIFI
To be laid down later by the Commission SAIDI MAIFI
Frequency variations To maintain supply frequency within 49 – 50.5Hz as per IEGC.
Voltage Unbalance Maximum of 3% at point of commencement of supply
% billing mistakes Not exceeding 0.1% % faulty meters Not exceeding 3%
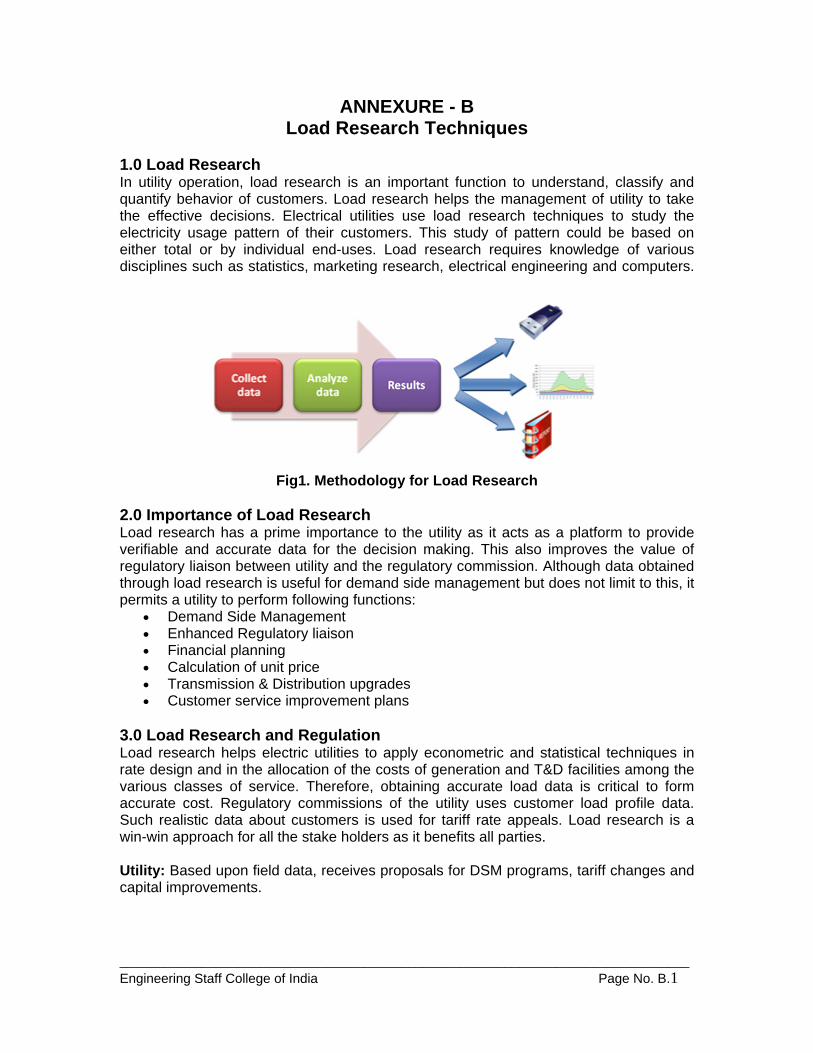
_____________________________________________________________________________Engineering Staff College of India Page No. B.1
ANNEXURE - B Load Research Techniques
1.0 Load Research In utility operation, load research is an important function to understand, classify and quantify behavior of customers. Load research helps the management of utility to take the effective decisions. Electrical utilities use load research techniques to study the electricity usage pattern of their customers. This study of pattern could be based on either total or by individual end-uses. Load research requires knowledge of various disciplines such as statistics, marketing research, electrical engineering and computers.
Fig1. Methodology for Load Research
2.0 Importance of Load Research Load research has a prime importance to the utility as it acts as a platform to provide verifiable and accurate data for the decision making. This also improves the value of regulatory liaison between utility and the regulatory commission. Although data obtained through load research is useful for demand side management but does not limit to this, it permits a utility to perform following functions:
• Demand Side Management • Enhanced Regulatory liaison • Financial planning • Calculation of unit price • Transmission & Distribution upgrades • Customer service improvement plans
3.0 Load Research and Regulation Load research helps electric utilities to apply econometric and statistical techniques in rate design and in the allocation of the costs of generation and T&D facilities among the various classes of service. Therefore, obtaining accurate load data is critical to form accurate cost. Regulatory commissions of the utility uses customer load profile data. Such realistic data about customers is used for tariff rate appeals. Load research is a win-win approach for all the stake holders as it benefits all parties. Utility: Based upon field data, receives proposals for DSM programs, tariff changes and capital improvements.
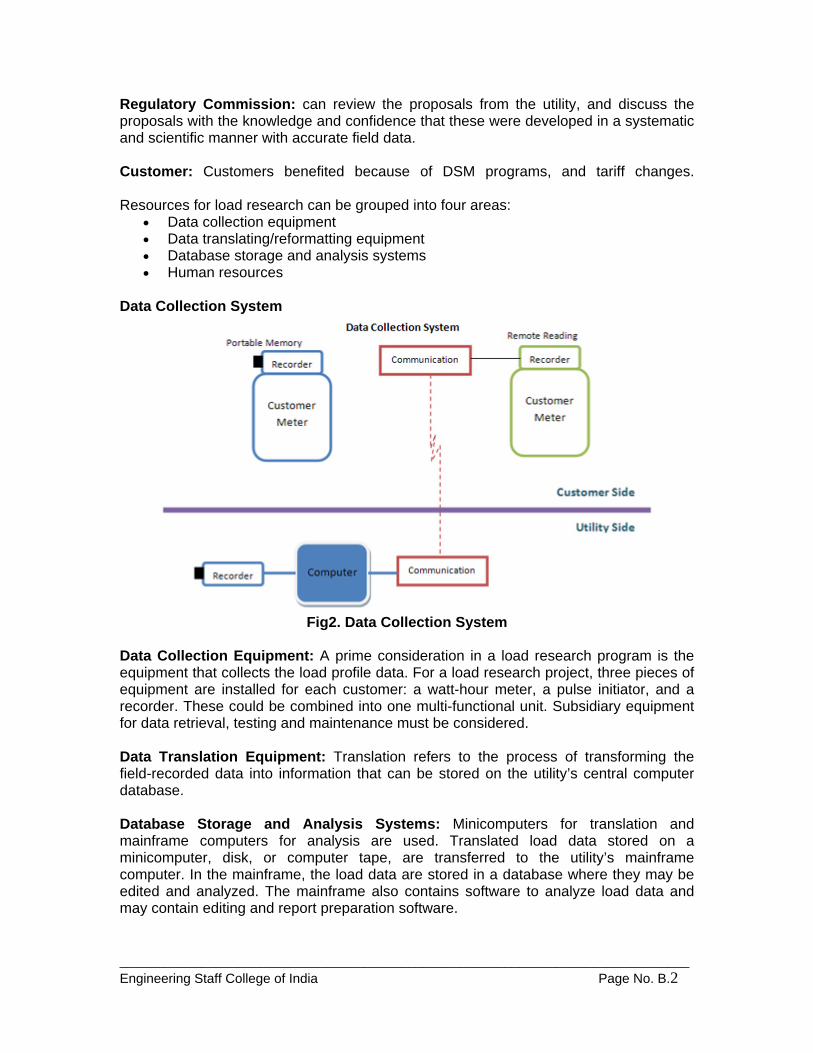
_____________________________________________________________________________Engineering Staff College of India Page No. B.2
Regulatory Commission: can review the proposals from the utility, and discuss the proposals with the knowledge and confidence that these were developed in a systematic and scientific manner with accurate field data. Customer: Customers benefited because of DSM programs, and tariff changes. Resources for load research can be grouped into four areas:
• Data collection equipment • Data translating/reformatting equipment • Database storage and analysis systems • Human resources
Data Collection System
Fig2. Data Collection System
Data Collection Equipment: A prime consideration in a load research program is the equipment that collects the load profile data. For a load research project, three pieces of equipment are installed for each customer: a watt-hour meter, a pulse initiator, and a recorder. These could be combined into one multi-functional unit. Subsidiary equipment for data retrieval, testing and maintenance must be considered. Data Translation Equipment: Translation refers to the process of transforming the field-recorded data into information that can be stored on the utility’s central computer database. Database Storage and Analysis Systems: Minicomputers for translation and mainframe computers for analysis are used. Translated load data stored on a minicomputer, disk, or computer tape, are transferred to the utility’s mainframe computer. In the mainframe, the load data are stored in a database where they may be edited and analyzed. The mainframe also contains software to analyze load data and may contain editing and report preparation software.
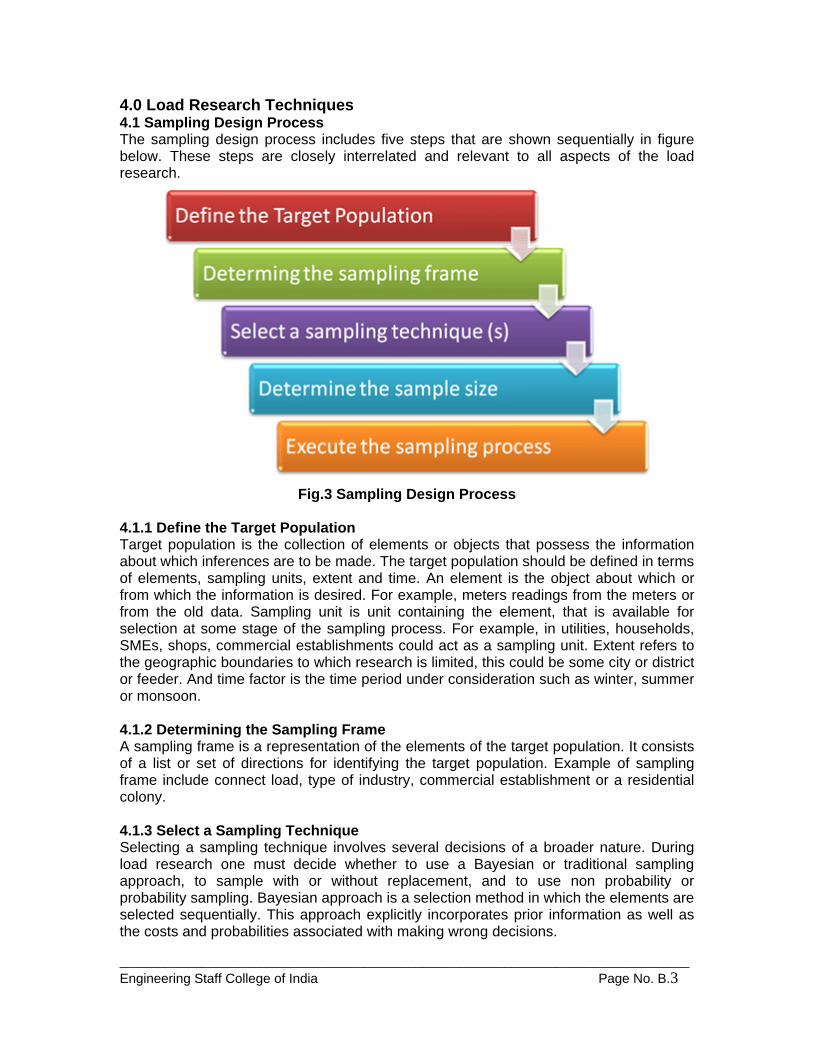
_____________________________________________________________________________Engineering Staff College of India Page No. B.3
4.0 Load Research Techniques 4.1 Sampling Design Process The sampling design process includes five steps that are shown sequentially in figure below. These steps are closely interrelated and relevant to all aspects of the load research.
Fig.3 Sampling Design Process
4.1.1 Define the Target Population Target population is the collection of elements or objects that possess the information about which inferences are to be made. The target population should be defined in terms of elements, sampling units, extent and time. An element is the object about which or from which the information is desired. For example, meters readings from the meters or from the old data. Sampling unit is unit containing the element, that is available for selection at some stage of the sampling process. For example, in utilities, households, SMEs, shops, commercial establishments could act as a sampling unit. Extent refers to the geographic boundaries to which research is limited, this could be some city or district or feeder. And time factor is the time period under consideration such as winter, summer or monsoon. 4.1.2 Determining the Sampling Frame A sampling frame is a representation of the elements of the target population. It consists of a list or set of directions for identifying the target population. Example of sampling frame include connect load, type of industry, commercial establishment or a residential colony. 4.1.3 Select a Sampling Technique Selecting a sampling technique involves several decisions of a broader nature. During load research one must decide whether to use a Bayesian or traditional sampling approach, to sample with or without replacement, and to use non probability or probability sampling. Bayesian approach is a selection method in which the elements are selected sequentially. This approach explicitly incorporates prior information as well as the costs and probabilities associated with making wrong decisions.
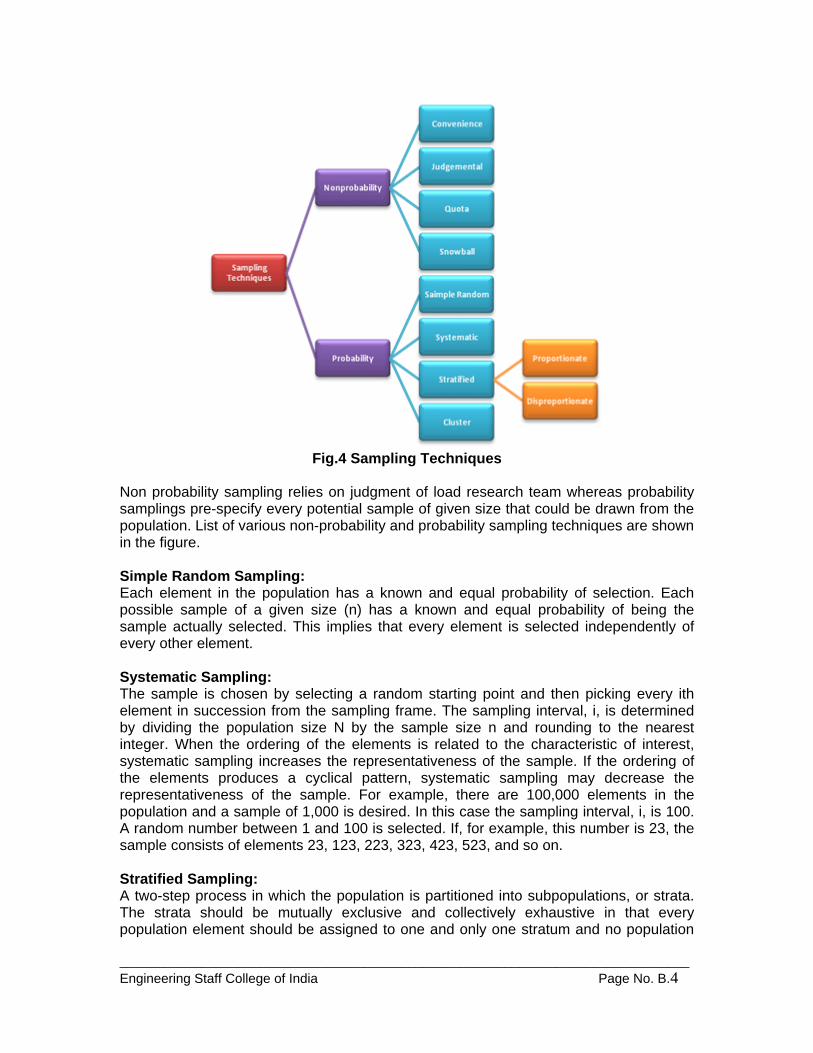
_____________________________________________________________________________Engineering Staff College of India Page No. B.4
Fig.4 Sampling Techniques
Non probability sampling relies on judgment of load research team whereas probability samplings pre-specify every potential sample of given size that could be drawn from the population. List of various non-probability and probability sampling techniques are shown in the figure. Simple Random Sampling: Each element in the population has a known and equal probability of selection. Each possible sample of a given size (n) has a known and equal probability of being the sample actually selected. This implies that every element is selected independently of every other element. Systematic Sampling: The sample is chosen by selecting a random starting point and then picking every ith element in succession from the sampling frame. The sampling interval, i, is determined by dividing the population size N by the sample size n and rounding to the nearest integer. When the ordering of the elements is related to the characteristic of interest, systematic sampling increases the representativeness of the sample. If the ordering of the elements produces a cyclical pattern, systematic sampling may decrease the representativeness of the sample. For example, there are 100,000 elements in the population and a sample of 1,000 is desired. In this case the sampling interval, i, is 100. A random number between 1 and 100 is selected. If, for example, this number is 23, the sample consists of elements 23, 123, 223, 323, 423, 523, and so on. Stratified Sampling: A two-step process in which the population is partitioned into subpopulations, or strata. The strata should be mutually exclusive and collectively exhaustive in that every population element should be assigned to one and only one stratum and no population
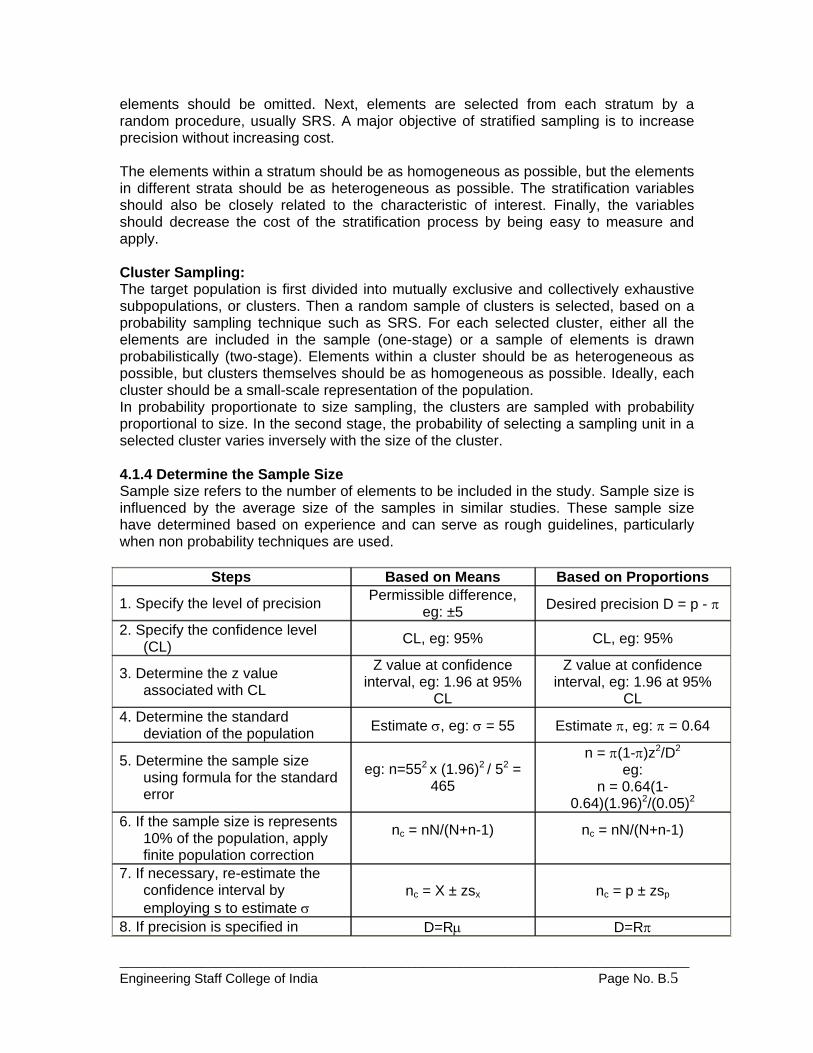
_____________________________________________________________________________Engineering Staff College of India Page No. B.5
elements should be omitted. Next, elements are selected from each stratum by a random procedure, usually SRS. A major objective of stratified sampling is to increase precision without increasing cost. The elements within a stratum should be as homogeneous as possible, but the elements in different strata should be as heterogeneous as possible. The stratification variables should also be closely related to the characteristic of interest. Finally, the variables should decrease the cost of the stratification process by being easy to measure and apply. Cluster Sampling: The target population is first divided into mutually exclusive and collectively exhaustive subpopulations, or clusters. Then a random sample of clusters is selected, based on a probability sampling technique such as SRS. For each selected cluster, either all the elements are included in the sample (one-stage) or a sample of elements is drawn probabilistically (two-stage). Elements within a cluster should be as heterogeneous as possible, but clusters themselves should be as homogeneous as possible. Ideally, each cluster should be a small-scale representation of the population. In probability proportionate to size sampling, the clusters are sampled with probability proportional to size. In the second stage, the probability of selecting a sampling unit in a selected cluster varies inversely with the size of the cluster. 4.1.4 Determine the Sample Size Sample size refers to the number of elements to be included in the study. Sample size is influenced by the average size of the samples in similar studies. These sample size have determined based on experience and can serve as rough guidelines, particularly when non probability techniques are used.
Steps Based on Means Based on Proportions
1. Specify the level of precision Permissible difference, eg: ±5 Desired precision D = p - π
2. Specify the confidence level (CL) CL, eg: 95% CL, eg: 95%
3. Determine the z value associated with CL
Z value at confidence interval, eg: 1.96 at 95%
CL
Z value at confidence interval, eg: 1.96 at 95%
CL 4. Determine the standard
deviation of the population Estimate σ, eg: σ = 55 Estimate π, eg: π = 0.64
5. Determine the sample size using formula for the standard error
eg: n=552 x (1.96)2 / 52 = 465
n = π(1-π)z2/D2 eg:
n = 0.64(1-0.64)(1.96)2/(0.05)2
6. If the sample size is represents 10% of the population, apply finite population correction
nc = nN/(N+n-1)
nc = nN/(N+n-1)
7. If necessary, re-estimate the confidence interval by employing s to estimate σ
nc = X ± zsx nc = p ± zsp
8. If precision is specified in D=Rµ D=Rπ
_____________________________________________________________________________Engineering Staff College of India Page No. B.6
relative rather than absolute terms, then use these equations to determine the sample size
n = C2z2/R2 n = Z2(1-π)/R2π
4.1.5 Execute the Sampling Process Execution of the sampling process requires a detailed specifications of how the sampling design decisions with respect to the population, sampling frame, sampling unit, sampling techniques, and sample size to be implemented. A preliminary questionnaire designed to identify various DSM projects (both pilot and full scale regional level projects) can be sent to relevant authorities at the state level who are willing to share the information. This can certainly help in understanding the various aspects of the DSM as well as preliminary information regarding the case studies. This information can also be used in the development of a database of DSM initiatives undertaken by the utilities at the state level. Based on the analysis of the Preliminary Questionnaire, a detailed questionnaire can be developed specific to DSM measures undertaken by the Distribution Utilities to identify the precise nature of measure, mode of implementation, impact on the consumer as well as the Utility and key learning. This information can be used in the development of detailed case studies and best pest practices which can further set standards for different utilities looking forward to implement DSM initiatives. This section provides a sample questionnaire that can help different stakeholders of DSM programs seeking for preliminary information regarding the development and implementation of various DSM initiatives. This questionnaire can also be suitably modified by the stakeholders to collect specific information pertaining to the function of the stakeholders’ organizations. 5.0 References Debs A.S. 1988 Modern power system control and operation.
_________________________________________________________________
IInncceennttiivvee RReegguullaattiioonn ooff EElleeccttrriicciittyy DDiissttrriibbuuttiioonn NNeettwwoorrkkss::
LLeessssoonnss ooff EExxppeerriieennccee ffrroomm BBrriittaaiinn
_________________________________________________________________
Tooraj Jamasb*
Faculty of Economics University of Cambridge
Michael Pollitt Judge Business School
University of Cambridge
13 February 2007
* Corresponding author. Faculty of Economics, Electricity Policy Research Group,
University of Cambridge, Sidgwick Avenue, Austin Robinson Building, Cambridge CB3 9DE, United Kingdom. Telephone: +44-(0)1223-335271, Fax: +44-(0)1223-335299, Email: [email protected]
The authors would like to thank anonymous referees for their detailed comments and acknowledge the support from the Swiss State Secretariat for Economic Development (SECO) and the UK Economic and Social Research Council (ESRC) for this study.
Abstract
This paper reviews the recent experience of the UK electricity distribution sector under incentive regulation. The UK has a significant and transparent history in implementing incentive regulation in the period since 1990. We demonstrate the successes of this period in reducing costs, prices and energy losses while maintaining quality of service. We also draw out the lessons for other countries in implementing distribution sector reform. We conclude by discussing the place of incentive regulation of networks within the wider reform context, the required legislative framework, the need for appropriate unbundling, the importance of quality of service incentives, the regulatory information requirements and the role of sector rationalisation. JEL Classification: L52, L94, Q48 Key words: Electricity, liberalisation, regulation, benchmarking
__________________________________________________________________ 1. Introduction In the mid-1980s, Britain pioneered an extensive privatisation and market-based reform of the state-owned industries. A particular aspect of the British reform that has attracted much attention has been the use of restructuring, competition, and independent regulation in infrastructure and network industries such as telecoms, transport, and energy including the electricity industry. These reformed industries consist of potentially competitive and natural monopoly network activities. The reforms have separated these activities followed by introduction of competition in the former and by regulating the latter. The aim of network regulation is to facilitate competition over the networks based on non-discriminatory access to these and to improve their efficiency. An innovative and important part of the regulation of natural monopoly networks has been the use of an incentive-based regulatory regime which, in the absence of competition, attempts to mimic competitive market pressures. The effects of incentive-based regulation can best be assessed in the long-run as the firms need time to adjust to their new operating environment and the sector regulators must gain experience. The length and features of the British reform make it relevant for drawing useful lessons for other countries. The aim of this paper is to assess the context, process, and performance of the British model of incentive-based regulation of electricity distribution networks. We then draw lessons of experience for other countries and in particular in non-reforming countries. Since the British reform, many countries around the world and Europe have embarked on reforming their sectors with the latter partly driven and coordinated by the European Commission’s Electricity Directives. Many other countries however lag behind in their progress with reform as a result of unsuccessful reform proposals and or because they lack the sort of pressure that being directly bound by the Electricity Directives give. For example, the Swiss sector is the least reformed sector in the OECD-Europe and is one for which this paper may be directly relevant. The next section discusses the main aspects of incentive-based regulation and benchmarking of electricity distribution networks. Section 3 consists of a review of the background and the experience with distribution network regulation in Britain. Section 4 describes the five-year distribution price control reviews since the privatisation of the industry. Section 5 addresses some specific issues of importance in distribution network regulation. Section 6 draws some general lessons from experience for other countries.
1
__________________________________________________________________ 2. Incentive-Based Regulation and Benchmarking of Electricity
Distribution Networks 2.1 The electricity industry Electricity is an indispensable part of modern social and economic life. A reliable and efficient electricity industry is crucial for economic development and competitiveness. The electricity sector is a network industry comprising distinct but inter-related activities with many actors whose production and consumption decisions affect the operation of the whole system. The electricity system consists of generation, transmission, distribution and supply (or retailing) activities. Generation comprises production and conversion of electric power. Transmission involves long distance transportation of electricity at high voltage. Distribution is transportation of low voltage electricity through local networks and consists of overhead lines, cables, switchgear, transformers, control systems and meters to transfer electricity from the transmission system to customers’ premises. The supply function consists of metering, billing, and sale of electricity to end-users. The generation and supply activities are generally regarded as potentially competitive while the transmission and distribution networks are characterised as natural monopolies. The network characteristics of the industry and economies of coordination among the different activities led to creation of vertically integrated structures in many electricity sectors. At the same time, end-users are diverse - including residential, commercial, and industrial consumers - with different usage patterns with different economic values attached to their consumption, Moreover, the strategic importance of the sector and public service view of provision of electricity often justified public ownership of the industry. Electricity is a technically homogeneous and non-storable product and system reliability requires that supply and demand are matched simultaneously. At the same time, the electricity industry is highly capital intensive with much of the assets becoming sunk costs upon investment. As the existing assets in place need to be renewed and demand continuously increases, the sector can experience investment cycles. At the same time, the assets have long economic lives with long-term implications for the composition of the sector.
2
__________________________________________________________________
The electricity reforms have generally regarded the generation and supply activities as potentially competitive while the transmission and distribution networks are natural monopoly activities that need to be regulated. 2.2 Electricity sector reforms and incentive regulation Since the mid-1980s, a world-wide reform trend has transformed the institutional framework, organisation, and operating environment of the infrastructure and network industries including electricity. This has given rise to considerable interest in incentive-based regulation of the natural monopoly segments of the reformed industries. In the electricity sector, reforms have involved measures such as privatisation, establishment of sector regulators, introduction of competition into generation, design of organised wholesale and retail markets, and unbundling of generation, transmission, distribution, and retail activities (Joskow, 1998; Newbery, 2002). Incentive regulation must therefore be viewed within the wider context of regulatory reform of the sector.1
Moreover, some shortcomings in the incentive properties of the traditional rate-of-return (ROR) regulation, most notably over-capitalisation of the regulatory asset base shown by Averch and Johnson (1962) were also apparent prior to the reforms. The trend towards sectoral reforms and the renewed interest in regulation have led to advances in the theoretical and conceptual aspects of incentive regulation as an alternative to the traditional rate-of-return or cost-of-service regulation.2
From an economic point of view, the aim of electricity reform in general and incentive regulation of networks in particular is to provide utilities with incentives to improve their operating and investment efficiency and to ensure that consumers benefit from the gains. Within this context, the aim of incentive regulation is to achieve these objectives through financial reward or penalty incentive schemes. Shleifer (1985) suggests that incentive regulation can mimic the outcome of the markets by setting an external performance standard that represents some average industry performance excluding the firm in question.
1 As such, the theory and empirical evidence on the merits of private ownership and privatization in the context of market-oriented infrastructure reforms can be characterized as inconclusive (Jamasb et al., 2004a; Mota, 2004; Zhang et al., 2002). However, when accompanied by effective regulation, privatization has achieved efficiency improvements. 2 In the US, incentive regulation is often referred to as Performance Based Regulation (PBR).
3
__________________________________________________________________
The most widely discussed and adopted schemes are based on price cap, revenue cap, yardstick regulation, and targeted-incentive regulation models. Other incentive models include sliding scale, menu of contracts, and partial cost adjustment. In practice, regulators have adopted a variety of approaches to incentive regulation and many incentive schemes use a combination of different models. 3. The British Electricity Sector Reform and the Regulation of
Distribution Networks 3.1 The Historical Context The history of public utilities and network industries and their regulation in Britain constitutes a remarkable tale. In 1812, public supply of town gas began and rapidly developed into a competitive industry with many firms involved. The “wasteful" competition” was ended by the 1860 Metropolis Gas Act making provisions for establishing local natural monopolies. The industry also saw alternative incentive regulation schemes offered to the firms such as a basic price system, maximum prices, and sliding scales (see Hammond, et al. 2002; Joskow and Schmalensee, 1986).3 The post-1945 period then witnessed the nationalisation of municipal and private utilities and infrastructure industries. Finally, the period between the late-1980s until mid-1990 was characterised by the privatisation of these industries and the return of incentive regulation. The first known case of incentive regulation of network utilities dates back to 1855 and the sliding scale plan in Britain approved in the Sheffield Gas Act for the Sheffield Company a supplier of town gas. This was followed by a similar plan in 1893 for the electricity industry. The first case in the US is the sliding scale scheme in Boston Plan of 1906 for the price of gas. The above scheme was later abundant due to high inflation rates which followed its implementation (Schmidt, 2000). The history of electricity supply industry (ESI) in Britain dates back to the late nineteenth century. Electric light first emerged as the fourth generation lighting technology to replace other sources of lighting, such as town gas, as the modest modern
3 The basic price system was based on fixed prices and dividends. When actual revenue would be lower than the allowed revenue by the basic price, a specified portion of the difference between the basic and actual revenue would be shared between the shareholders (as extra dividends) and employees (as bonuses). Under the sliding scale system, lower prices would be rewarded by higher dividends (for detailed descriptions see Hammond et al, 2002).
4
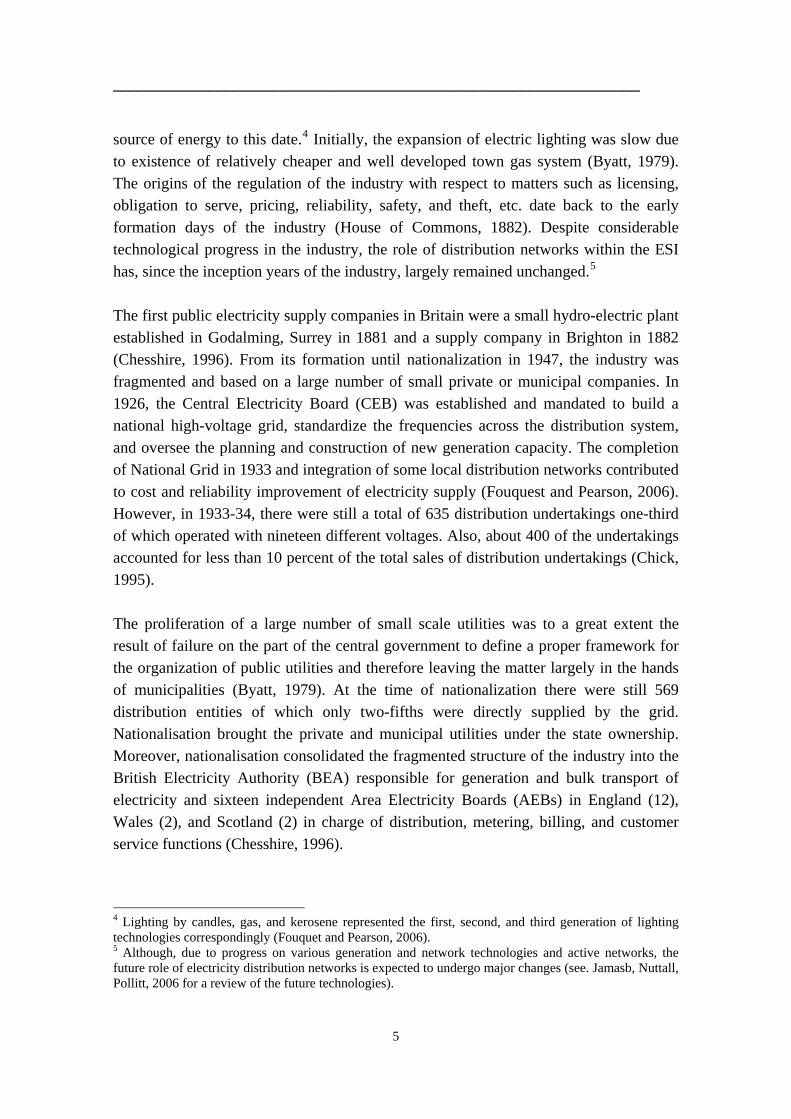
__________________________________________________________________
source of energy to this date.4 Initially, the expansion of electric lighting was slow due to existence of relatively cheaper and well developed town gas system (Byatt, 1979). The origins of the regulation of the industry with respect to matters such as licensing, obligation to serve, pricing, reliability, safety, and theft, etc. date back to the early formation days of the industry (House of Commons, 1882). Despite considerable technological progress in the industry, the role of distribution networks within the ESI has, since the inception years of the industry, largely remained unchanged.5
The first public electricity supply companies in Britain were a small hydro-electric plant established in Godalming, Surrey in 1881 and a supply company in Brighton in 1882 (Chesshire, 1996). From its formation until nationalization in 1947, the industry was fragmented and based on a large number of small private or municipal companies. In 1926, the Central Electricity Board (CEB) was established and mandated to build a national high-voltage grid, standardize the frequencies across the distribution system, and oversee the planning and construction of new generation capacity. The completion of National Grid in 1933 and integration of some local distribution networks contributed to cost and reliability improvement of electricity supply (Fouquest and Pearson, 2006). However, in 1933-34, there were still a total of 635 distribution undertakings one-third of which operated with nineteen different voltages. Also, about 400 of the undertakings accounted for less than 10 percent of the total sales of distribution undertakings (Chick, 1995). The proliferation of a large number of small scale utilities was to a great extent the result of failure on the part of the central government to define a proper framework for the organization of public utilities and therefore leaving the matter largely in the hands of municipalities (Byatt, 1979). At the time of nationalization there were still 569 distribution entities of which only two-fifths were directly supplied by the grid. Nationalisation brought the private and municipal utilities under the state ownership. Moreover, nationalisation consolidated the fragmented structure of the industry into the British Electricity Authority (BEA) responsible for generation and bulk transport of electricity and sixteen independent Area Electricity Boards (AEBs) in England (12), Wales (2), and Scotland (2) in charge of distribution, metering, billing, and customer service functions (Chesshire, 1996).
4 Lighting by candles, gas, and kerosene represented the first, second, and third generation of lighting technologies correspondingly (Fouquet and Pearson, 2006). 5 Although, due to progress on various generation and network technologies and active networks, the future role of electricity distribution networks is expected to undergo major changes (see. Jamasb, Nuttall, Pollitt, 2006 for a review of the future technologies).
5
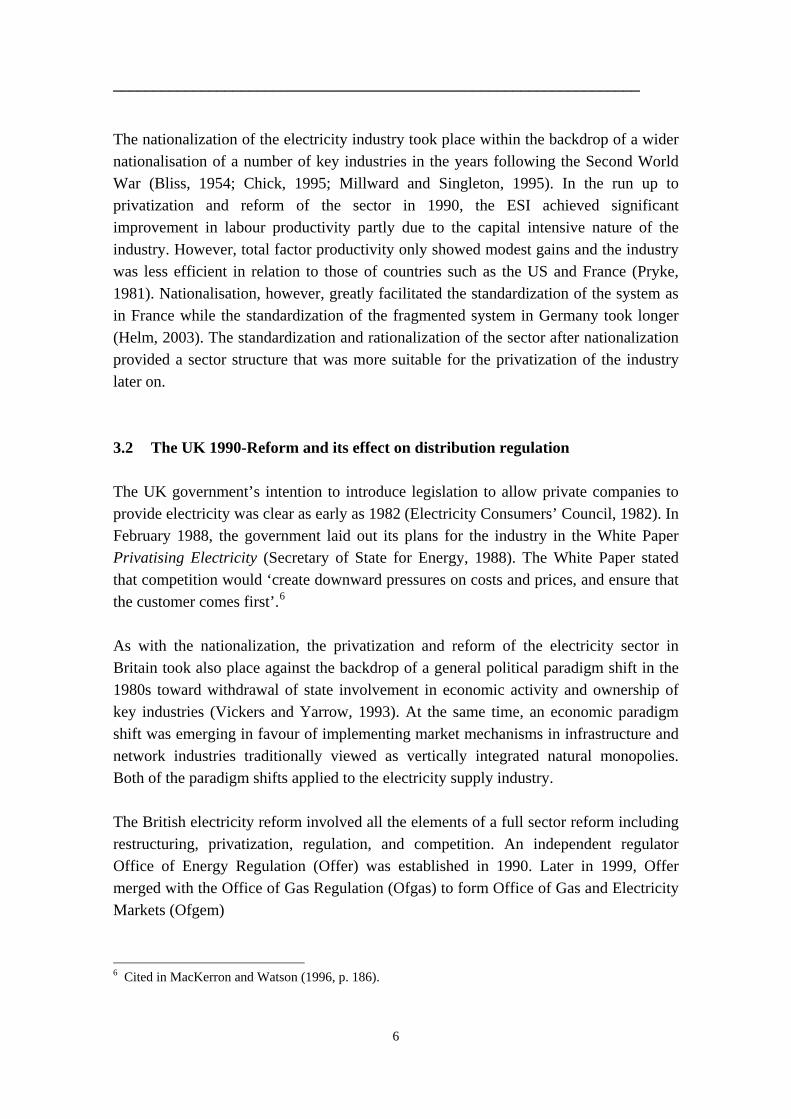
__________________________________________________________________
The nationalization of the electricity industry took place within the backdrop of a wider nationalisation of a number of key industries in the years following the Second World War (Bliss, 1954; Chick, 1995; Millward and Singleton, 1995). In the run up to privatization and reform of the sector in 1990, the ESI achieved significant improvement in labour productivity partly due to the capital intensive nature of the industry. However, total factor productivity only showed modest gains and the industry was less efficient in relation to those of countries such as the US and France (Pryke, 1981). Nationalisation, however, greatly facilitated the standardization of the system as in France while the standardization of the fragmented system in Germany took longer (Helm, 2003). The standardization and rationalization of the sector after nationalization provided a sector structure that was more suitable for the privatization of the industry later on. 3.2 The UK 1990-Reform and its effect on distribution regulation The UK government’s intention to introduce legislation to allow private companies to provide electricity was clear as early as 1982 (Electricity Consumers’ Council, 1982). In February 1988, the government laid out its plans for the industry in the White Paper Privatising Electricity (Secretary of State for Energy, 1988). The White Paper stated that competition would ‘create downward pressures on costs and prices, and ensure that the customer comes first’.6
As with the nationalization, the privatization and reform of the electricity sector in Britain took also place against the backdrop of a general political paradigm shift in the 1980s toward withdrawal of state involvement in economic activity and ownership of key industries (Vickers and Yarrow, 1993). At the same time, an economic paradigm shift was emerging in favour of implementing market mechanisms in infrastructure and network industries traditionally viewed as vertically integrated natural monopolies. Both of the paradigm shifts applied to the electricity supply industry. The British electricity reform involved all the elements of a full sector reform including restructuring, privatization, regulation, and competition. An independent regulator Office of Energy Regulation (Offer) was established in 1990. Later in 1999, Offer merged with the Office of Gas Regulation (Ofgas) to form Office of Gas and Electricity Markets (Ofgem)
6 Cited in MacKerron and Watson (1996, p. 186).
6
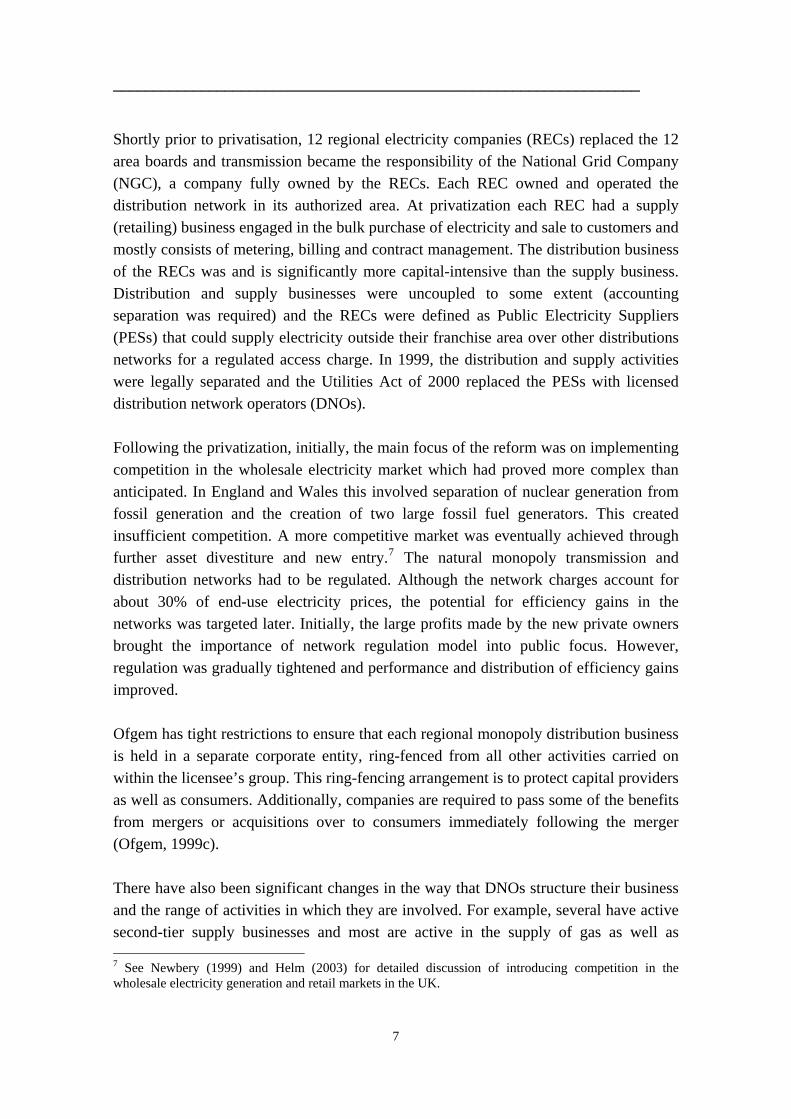
__________________________________________________________________
Shortly prior to privatisation, 12 regional electricity companies (RECs) replaced the 12 area boards and transmission became the responsibility of the National Grid Company (NGC), a company fully owned by the RECs. Each REC owned and operated the distribution network in its authorized area. At privatization each REC had a supply (retailing) business engaged in the bulk purchase of electricity and sale to customers and mostly consists of metering, billing and contract management. The distribution business of the RECs was and is significantly more capital-intensive than the supply business. Distribution and supply businesses were uncoupled to some extent (accounting separation was required) and the RECs were defined as Public Electricity Suppliers (PESs) that could supply electricity outside their franchise area over other distributions networks for a regulated access charge. In 1999, the distribution and supply activities were legally separated and the Utilities Act of 2000 replaced the PESs with licensed distribution network operators (DNOs). Following the privatization, initially, the main focus of the reform was on implementing competition in the wholesale electricity market which had proved more complex than anticipated. In England and Wales this involved separation of nuclear generation from fossil generation and the creation of two large fossil fuel generators. This created insufficient competition. A more competitive market was eventually achieved through further asset divestiture and new entry.7 The natural monopoly transmission and distribution networks had to be regulated. Although the network charges account for about 30% of end-use electricity prices, the potential for efficiency gains in the networks was targeted later. Initially, the large profits made by the new private owners brought the importance of network regulation model into public focus. However, regulation was gradually tightened and performance and distribution of efficiency gains improved. Ofgem has tight restrictions to ensure that each regional monopoly distribution business is held in a separate corporate entity, ring-fenced from all other activities carried on within the licensee’s group. This ring-fencing arrangement is to protect capital providers as well as consumers. Additionally, companies are required to pass some of the benefits from mergers or acquisitions over to consumers immediately following the merger (Ofgem, 1999c). There have also been significant changes in the way that DNOs structure their business and the range of activities in which they are involved. For example, several have active second-tier supply businesses and most are active in the supply of gas as well as
7 See Newbery (1999) and Helm (2003) for detailed discussion of introducing competition in the wholesale electricity generation and retail markets in the UK.
7
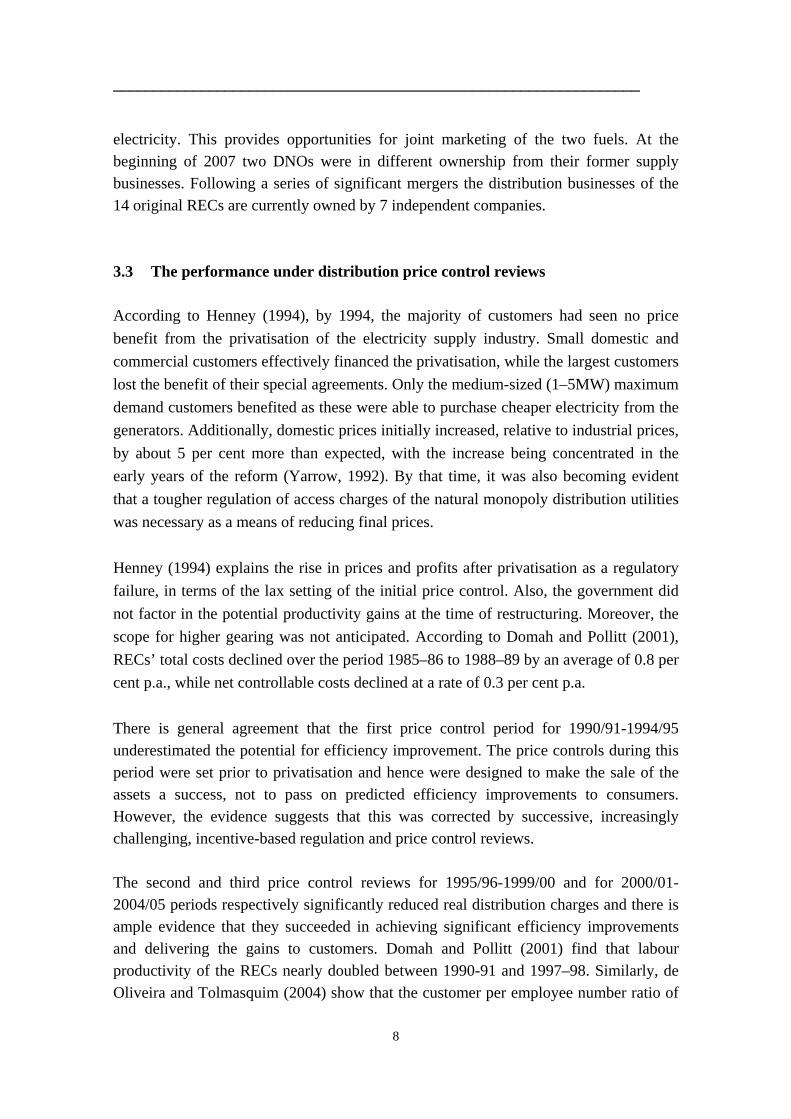
__________________________________________________________________ electricity. This provides opportunities for joint marketing of the two fuels. At the beginning of 2007 two DNOs were in different ownership from their former supply businesses. Following a series of significant mergers the distribution businesses of the 14 original RECs are currently owned by 7 independent companies. 3.3 The performance under distribution price control reviews According to Henney (1994), by 1994, the majority of customers had seen no price benefit from the privatisation of the electricity supply industry. Small domestic and commercial customers effectively financed the privatisation, while the largest customers lost the benefit of their special agreements. Only the medium-sized (1–5MW) maximum demand customers benefited as these were able to purchase cheaper electricity from the generators. Additionally, domestic prices initially increased, relative to industrial prices, by about 5 per cent more than expected, with the increase being concentrated in the early years of the reform (Yarrow, 1992). By that time, it was also becoming evident that a tougher regulation of access charges of the natural monopoly distribution utilities was necessary as a means of reducing final prices. Henney (1994) explains the rise in prices and profits after privatisation as a regulatory failure, in terms of the lax setting of the initial price control. Also, the government did not factor in the potential productivity gains at the time of restructuring. Moreover, the scope for higher gearing was not anticipated. According to Domah and Pollitt (2001), RECs’ total costs declined over the period 1985–86 to 1988–89 by an average of 0.8 per cent p.a., while net controllable costs declined at a rate of 0.3 per cent p.a. There is general agreement that the first price control period for 1990/91-1994/95 underestimated the potential for efficiency improvement. The price controls during this period were set prior to privatisation and hence were designed to make the sale of the assets a success, not to pass on predicted efficiency improvements to consumers. However, the evidence suggests that this was corrected by successive, increasingly challenging, incentive-based regulation and price control reviews. The second and third price control reviews for 1995/96-1999/00 and for 2000/01-2004/05 periods respectively significantly reduced real distribution charges and there is ample evidence that they succeeded in achieving significant efficiency improvements and delivering the gains to customers. Domah and Pollitt (2001) find that labour productivity of the RECs nearly doubled between 1990-91 and 1997–98. Similarly, de Oliveira and Tolmasquim (2004) show that the customer per employee number ratio of
8
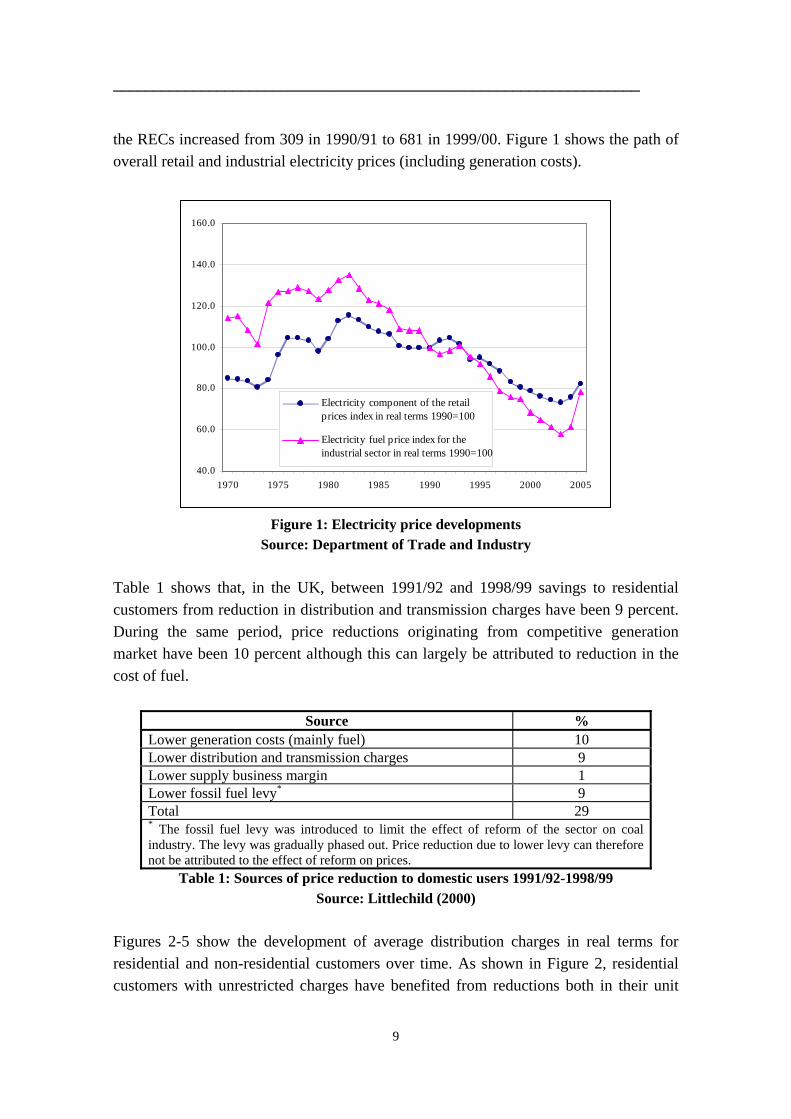
__________________________________________________________________ the RECs increased from 309 in 1990/91 to 681 in 1999/00. Figure 1 shows the path of overall retail and industrial electricity prices (including generation costs).
40.0
60.0
80.0
100.0
120.0
140.0
160.0
1970 1975 1980 1985 1990 1995 2000 2005
Electricity component of the retailprices index in real terms 1990=100
Electricity fuel price index for theindustrial sector in real terms 1990=100
Figure 1: Electricity price developments
Source: Department of Trade and Industry Table 1 shows that, in the UK, between 1991/92 and 1998/99 savings to residential customers from reduction in distribution and transmission charges have been 9 percent. During the same period, price reductions originating from competitive generation market have been 10 percent although this can largely be attributed to reduction in the cost of fuel.
Source % Lower generation costs (mainly fuel) 10 Lower distribution and transmission charges 9 Lower supply business margin 1 Lower fossil fuel levy* 9 Total 29 * The fossil fuel levy was introduced to limit the effect of reform of the sector on coal industry. The levy was gradually phased out. Price reduction due to lower levy can therefore not be attributed to the effect of reform on prices.
Table 1: Sources of price reduction to domestic users 1991/92-1998/99 Source: Littlechild (2000)
Figures 2-5 show the development of average distribution charges in real terms for residential and non-residential customers over time. As shown in Figure 2, residential customers with unrestricted charges have benefited from reductions both in their unit
9
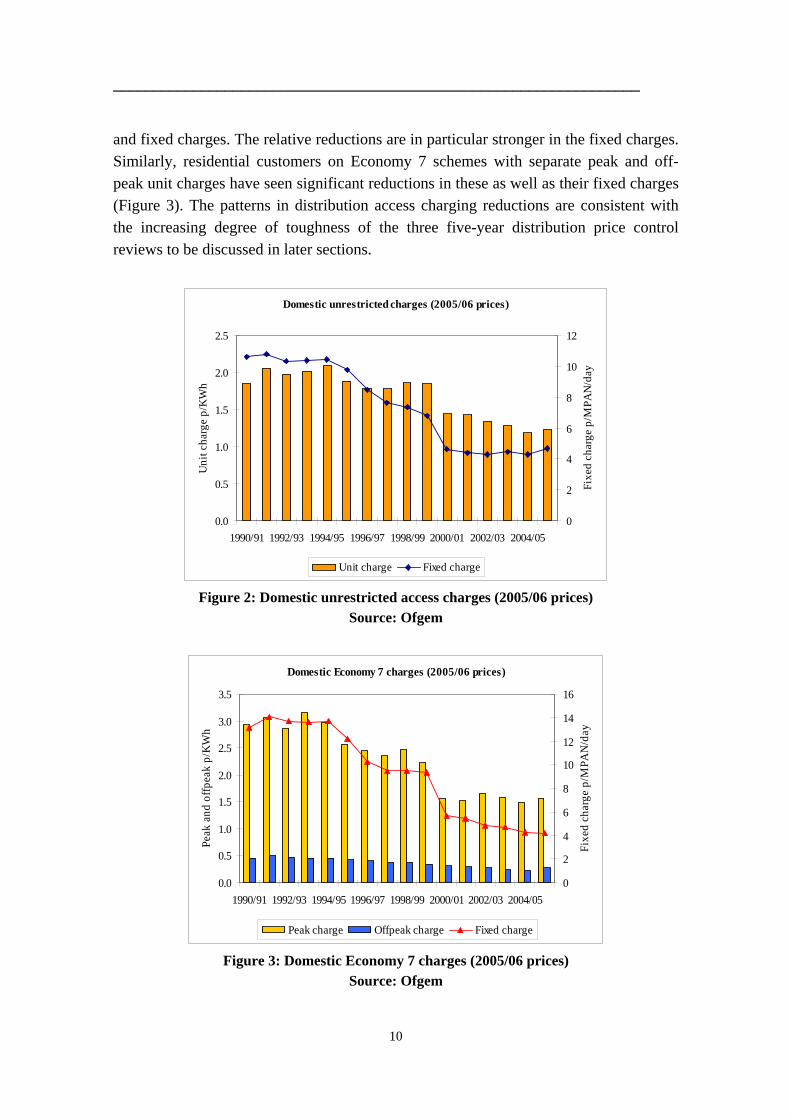
__________________________________________________________________ and fixed charges. The relative reductions are in particular stronger in the fixed charges. Similarly, residential customers on Economy 7 schemes with separate peak and off-peak unit charges have seen significant reductions in these as well as their fixed charges (Figure 3). The patterns in distribution access charging reductions are consistent with the increasing degree of toughness of the three five-year distribution price control reviews to be discussed in later sections.
Domestic unrestricted charges (2005/06 prices)
0.0
0.5
1.0
1.5
2.0
2.5
1990/91 1992/93 1994/95 1996/97 1998/99 2000/01 2002/03 2004/05
Uni
t cha
rge
p/K
Wh
0
2
4
6
8
10
12
Fixe
d ch
arge
p/M
PAN
/day
Unit charge Fixed charge
Figure 2: Domestic unrestricted access charges (2005/06 prices) Source: Ofgem
Domestic Economy 7 charges (2005/06 prices)
0.0
0.5
1.0
1.5
2.0
2.5
3.0
3.5
1990/91 1992/93 1994/95 1996/97 1998/99 2000/01 2002/03 2004/05
Peak
and
offp
eak
p/K
Wh
0
2
4
6
8
10
12
14
16
Fixe
d ch
arge
p/M
PAN
/day
Peak charge Offpeak charge Fixed charge
Figure 3: Domestic Economy 7 charges (2005/06 prices) Source: Ofgem
10
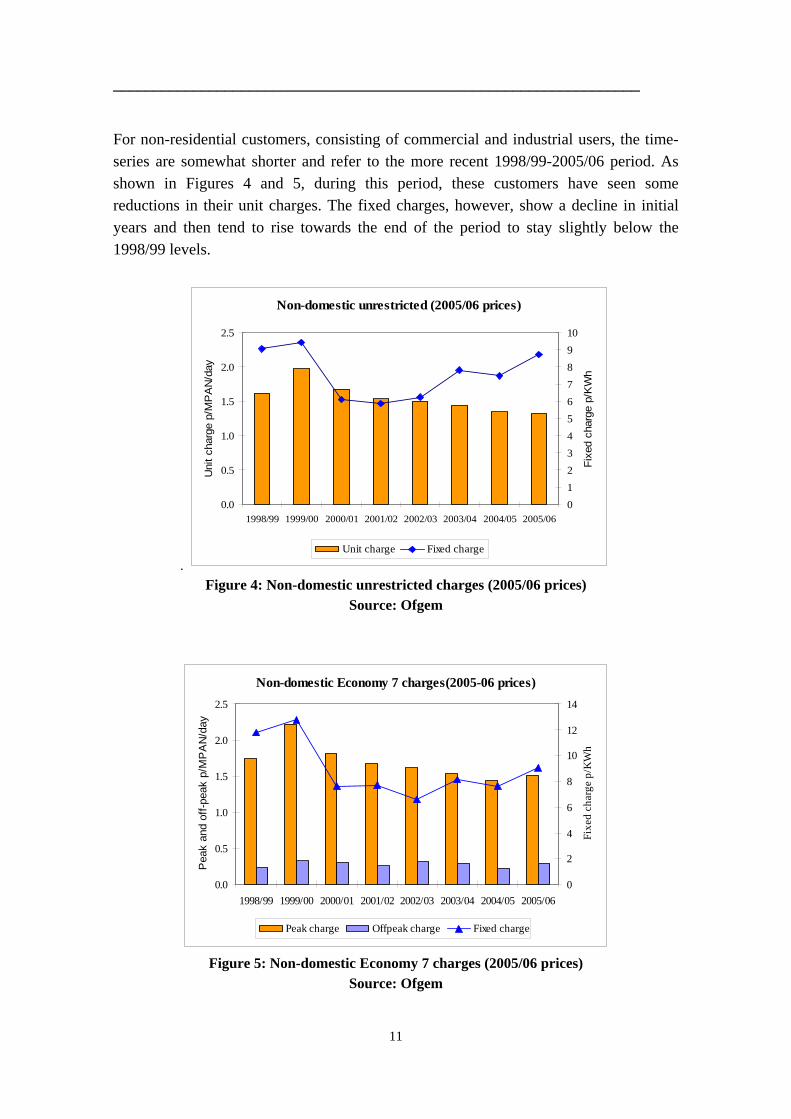
__________________________________________________________________ For non-residential customers, consisting of commercial and industrial users, the time-series are somewhat shorter and refer to the more recent 1998/99-2005/06 period. As shown in Figures 4 and 5, during this period, these customers have seen some reductions in their unit charges. The fixed charges, however, show a decline in initial years and then tend to rise towards the end of the period to stay slightly below the 1998/99 levels.
.
Non-domestic unrestricted (2005/06 prices)
0.0
0.5
1.0
1.5
2.0
2.5
1998/99 1999/00 2000/01 2001/02 2002/03 2003/04 2004/05 2005/06
Uni
t cha
rge
p/M
PA
N/d
ay
012345678910
Fixe
d ch
arge
p/K
Wh
Unit charge Fixed charge
Figure 4: Non-domestic unrestricted charges (2005/06 prices)
Source: Ofgem
Non-domestic Economy 7 charges(2005-06 prices)
0.0
0.5
1.0
1.5
2.0
2.5
1998/99 1999/00 2000/01 2001/02 2002/03 2003/04 2004/05 2005/06
Pea
k an
d of
f-pea
k p/
MP
AN
/day
0
2
4
6
8
10
12
14
Fixe
d ch
arge
p/K
Wh
Peak charge Offpeak charge Fixed charge
Figure 5: Non-domestic Economy 7 charges (2005/06 prices)
Source: Ofgem
11
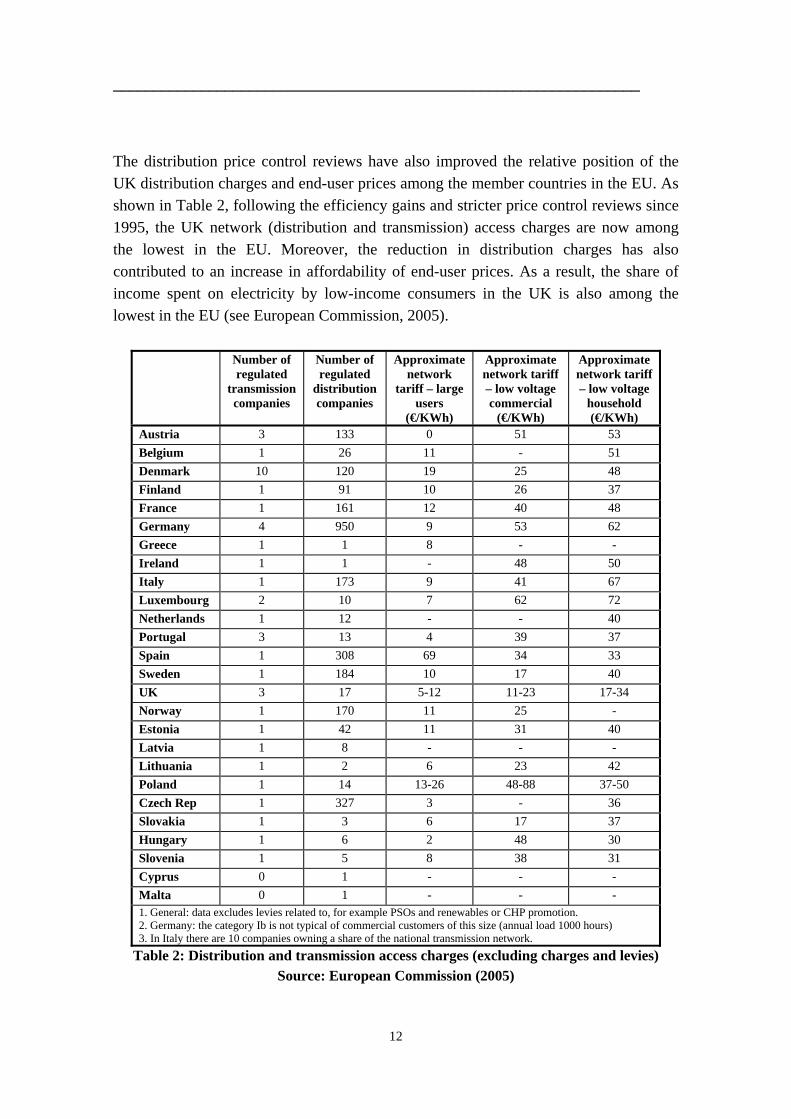
__________________________________________________________________ The distribution price control reviews have also improved the relative position of the UK distribution charges and end-user prices among the member countries in the EU. As shown in Table 2, following the efficiency gains and stricter price control reviews since 1995, the UK network (distribution and transmission) access charges are now among the lowest in the EU. Moreover, the reduction in distribution charges has also contributed to an increase in affordability of end-user prices. As a result, the share of income spent on electricity by low-income consumers in the UK is also among the lowest in the EU (see European Commission, 2005).
Number of regulated
transmission companies
Number of regulated
distribution companies
Approximate network
tariff – large users
(€/KWh)
Approximate network tariff – low voltage commercial
(€/KWh)
Approximate network tariff – low voltage
household (€/KWh)
Austria 3 133 0 51 53 Belgium 1 26 11 - 51 Denmark 10 120 19 25 48 Finland 1 91 10 26 37 France 1 161 12 40 48 Germany 4 950 9 53 62 Greece 1 1 8 - - Ireland 1 1 - 48 50 Italy 1 173 9 41 67 Luxembourg 2 10 7 62 72 Netherlands 1 12 - - 40 Portugal 3 13 4 39 37 Spain 1 308 69 34 33 Sweden 1 184 10 17 40 UK 3 17 5-12 11-23 17-34 Norway 1 170 11 25 - Estonia 1 42 11 31 40 Latvia 1 8 - - - Lithuania 1 2 6 23 42 Poland 1 14 13-26 48-88 37-50 Czech Rep 1 327 3 - 36 Slovakia 1 3 6 17 37 Hungary 1 6 2 48 30 Slovenia 1 5 8 38 31 Cyprus 0 1 - - - Malta 0 1 - - - 1. General: data excludes levies related to, for example PSOs and renewables or CHP promotion. 2. Germany: the category Ib is not typical of commercial customers of this size (annual load 1000 hours) 3. In Italy there are 10 companies owning a share of the national transmission network.
Table 2: Distribution and transmission access charges (excluding charges and levies) Source: European Commission (2005)
12
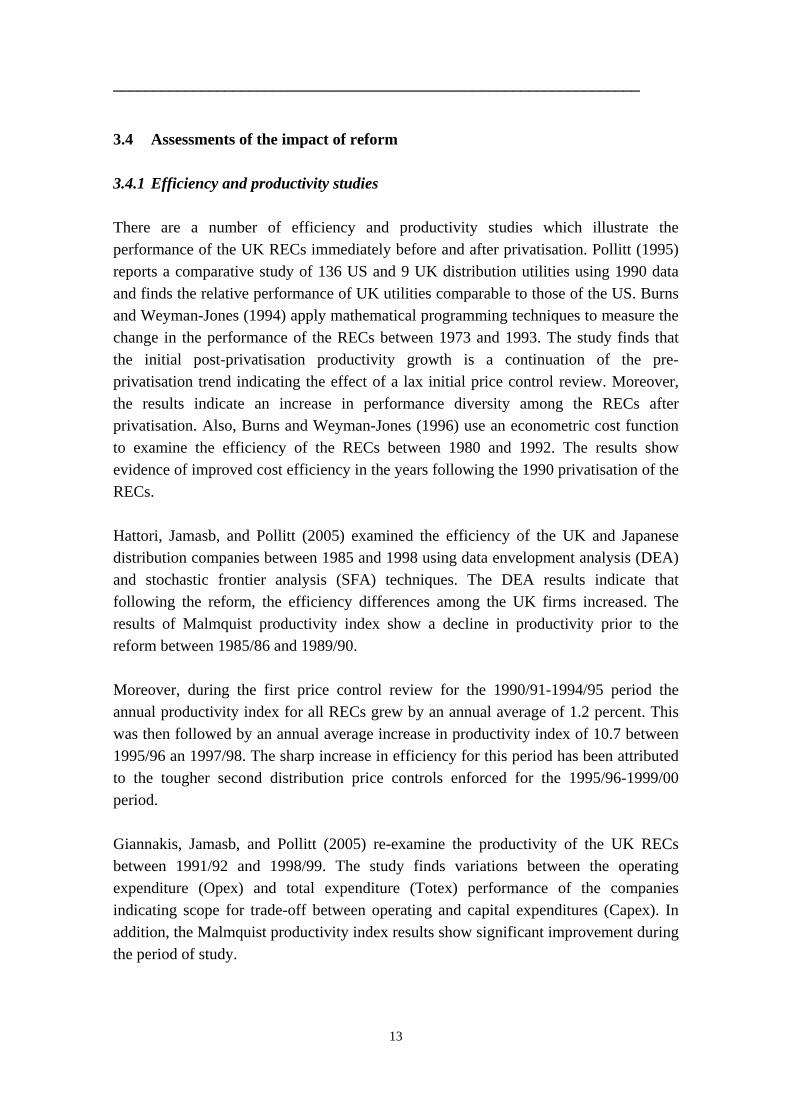
__________________________________________________________________ 3.4 Assessments of the impact of reform 3.4.1 Efficiency and productivity studies There are a number of efficiency and productivity studies which illustrate the performance of the UK RECs immediately before and after privatisation. Pollitt (1995) reports a comparative study of 136 US and 9 UK distribution utilities using 1990 data and finds the relative performance of UK utilities comparable to those of the US. Burns and Weyman-Jones (1994) apply mathematical programming techniques to measure the change in the performance of the RECs between 1973 and 1993. The study finds that the initial post-privatisation productivity growth is a continuation of the pre-privatisation trend indicating the effect of a lax initial price control review. Moreover, the results indicate an increase in performance diversity among the RECs after privatisation. Also, Burns and Weyman-Jones (1996) use an econometric cost function to examine the efficiency of the RECs between 1980 and 1992. The results show evidence of improved cost efficiency in the years following the 1990 privatisation of the RECs. Hattori, Jamasb, and Pollitt (2005) examined the efficiency of the UK and Japanese distribution companies between 1985 and 1998 using data envelopment analysis (DEA) and stochastic frontier analysis (SFA) techniques. The DEA results indicate that following the reform, the efficiency differences among the UK firms increased. The results of Malmquist productivity index show a decline in productivity prior to the reform between 1985/86 and 1989/90. Moreover, during the first price control review for the 1990/91-1994/95 period the annual productivity index for all RECs grew by an annual average of 1.2 percent. This was then followed by an annual average increase in productivity index of 10.7 between 1995/96 an 1997/98. The sharp increase in efficiency for this period has been attributed to the tougher second distribution price controls enforced for the 1995/96-1999/00 period. Giannakis, Jamasb, and Pollitt (2005) re-examine the productivity of the UK RECs between 1991/92 and 1998/99. The study finds variations between the operating expenditure (Opex) and total expenditure (Totex) performance of the companies indicating scope for trade-off between operating and capital expenditures (Capex). In addition, the Malmquist productivity index results show significant improvement during the period of study.
13
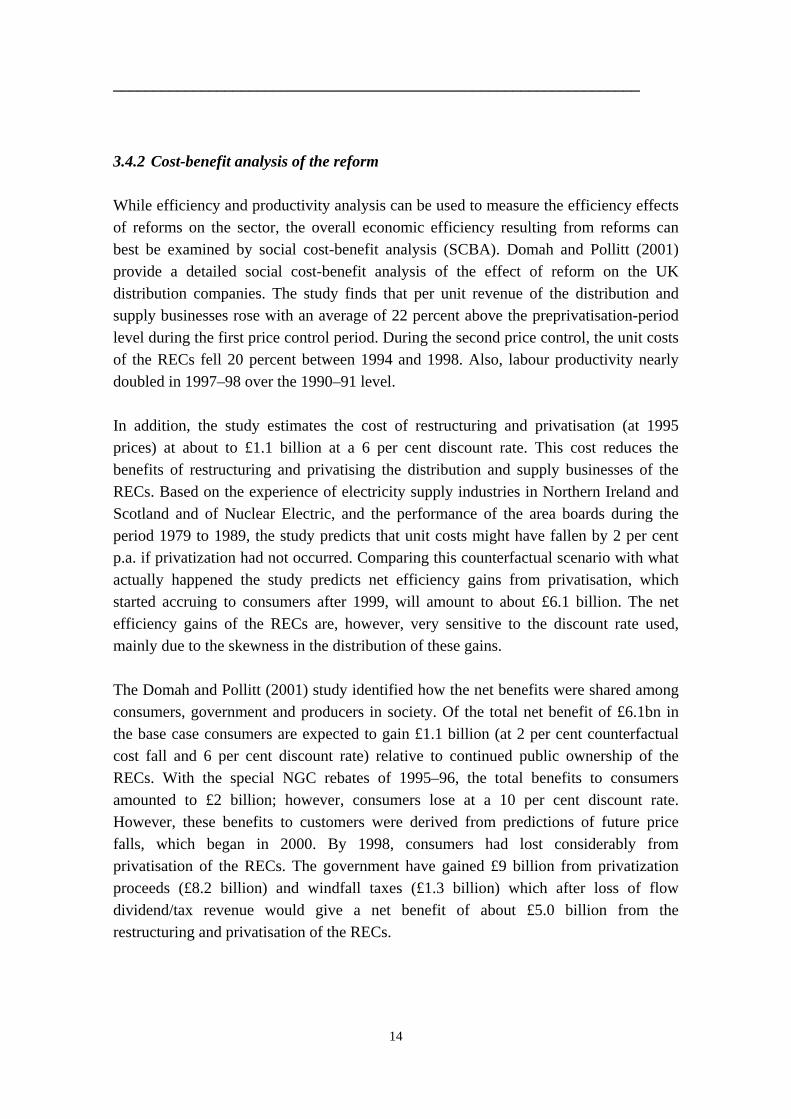
__________________________________________________________________ 3.4.2 Cost-benefit analysis of the reform While efficiency and productivity analysis can be used to measure the efficiency effects of reforms on the sector, the overall economic efficiency resulting from reforms can best be examined by social cost-benefit analysis (SCBA). Domah and Pollitt (2001) provide a detailed social cost-benefit analysis of the effect of reform on the UK distribution companies. The study finds that per unit revenue of the distribution and supply businesses rose with an average of 22 percent above the preprivatisation-period level during the first price control period. During the second price control, the unit costs of the RECs fell 20 percent between 1994 and 1998. Also, labour productivity nearly doubled in 1997–98 over the 1990–91 level. In addition, the study estimates the cost of restructuring and privatisation (at 1995 prices) at about to £1.1 billion at a 6 per cent discount rate. This cost reduces the benefits of restructuring and privatising the distribution and supply businesses of the RECs. Based on the experience of electricity supply industries in Northern Ireland and Scotland and of Nuclear Electric, and the performance of the area boards during the period 1979 to 1989, the study predicts that unit costs might have fallen by 2 per cent p.a. if privatization had not occurred. Comparing this counterfactual scenario with what actually happened the study predicts net efficiency gains from privatisation, which started accruing to consumers after 1999, will amount to about £6.1 billion. The net efficiency gains of the RECs are, however, very sensitive to the discount rate used, mainly due to the skewness in the distribution of these gains. The Domah and Pollitt (2001) study identified how the net benefits were shared among consumers, government and producers in society. Of the total net benefit of £6.1bn in the base case consumers are expected to gain £1.1 billion (at 2 per cent counterfactual cost fall and 6 per cent discount rate) relative to continued public ownership of the RECs. With the special NGC rebates of 1995–96, the total benefits to consumers amounted to £2 billion; however, consumers lose at a 10 per cent discount rate. However, these benefits to customers were derived from predictions of future price falls, which began in 2000. By 1998, consumers had lost considerably from privatisation of the RECs. The government have gained £9 billion from privatization proceeds (£8.2 billion) and windfall taxes (£1.3 billion) which after loss of flow dividend/tax revenue would give a net benefit of about £5.0 billion from the restructuring and privatisation of the RECs.
14
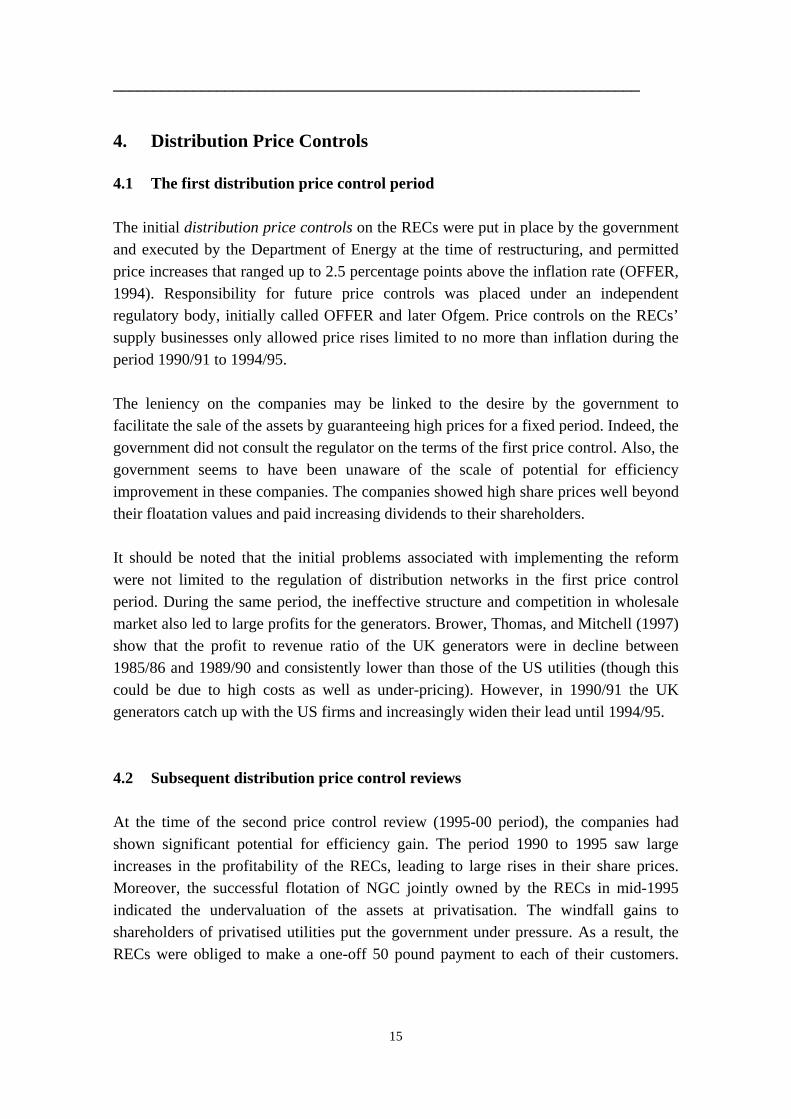
__________________________________________________________________ 4. Distribution Price Controls 4.1 The first distribution price control period The initial distribution price controls on the RECs were put in place by the government and executed by the Department of Energy at the time of restructuring, and permitted price increases that ranged up to 2.5 percentage points above the inflation rate (OFFER, 1994). Responsibility for future price controls was placed under an independent regulatory body, initially called OFFER and later Ofgem. Price controls on the RECs’ supply businesses only allowed price rises limited to no more than inflation during the period 1990/91 to 1994/95. The leniency on the companies may be linked to the desire by the government to facilitate the sale of the assets by guaranteeing high prices for a fixed period. Indeed, the government did not consult the regulator on the terms of the first price control. Also, the government seems to have been unaware of the scale of potential for efficiency improvement in these companies. The companies showed high share prices well beyond their floatation values and paid increasing dividends to their shareholders. It should be noted that the initial problems associated with implementing the reform were not limited to the regulation of distribution networks in the first price control period. During the same period, the ineffective structure and competition in wholesale market also led to large profits for the generators. Brower, Thomas, and Mitchell (1997) show that the profit to revenue ratio of the UK generators were in decline between 1985/86 and 1989/90 and consistently lower than those of the US utilities (though this could be due to high costs as well as under-pricing). However, in 1990/91 the UK generators catch up with the US firms and increasingly widen their lead until 1994/95. 4.2 Subsequent distribution price control reviews At the time of the second price control review (1995-00 period), the companies had shown significant potential for efficiency gain. The period 1990 to 1995 saw large increases in the profitability of the RECs, leading to large rises in their share prices. Moreover, the successful flotation of NGC jointly owned by the RECs in mid-1995 indicated the undervaluation of the assets at privatisation. The windfall gains to shareholders of privatised utilities put the government under pressure. As a result, the RECs were obliged to make a one-off 50 pound payment to each of their customers.
15
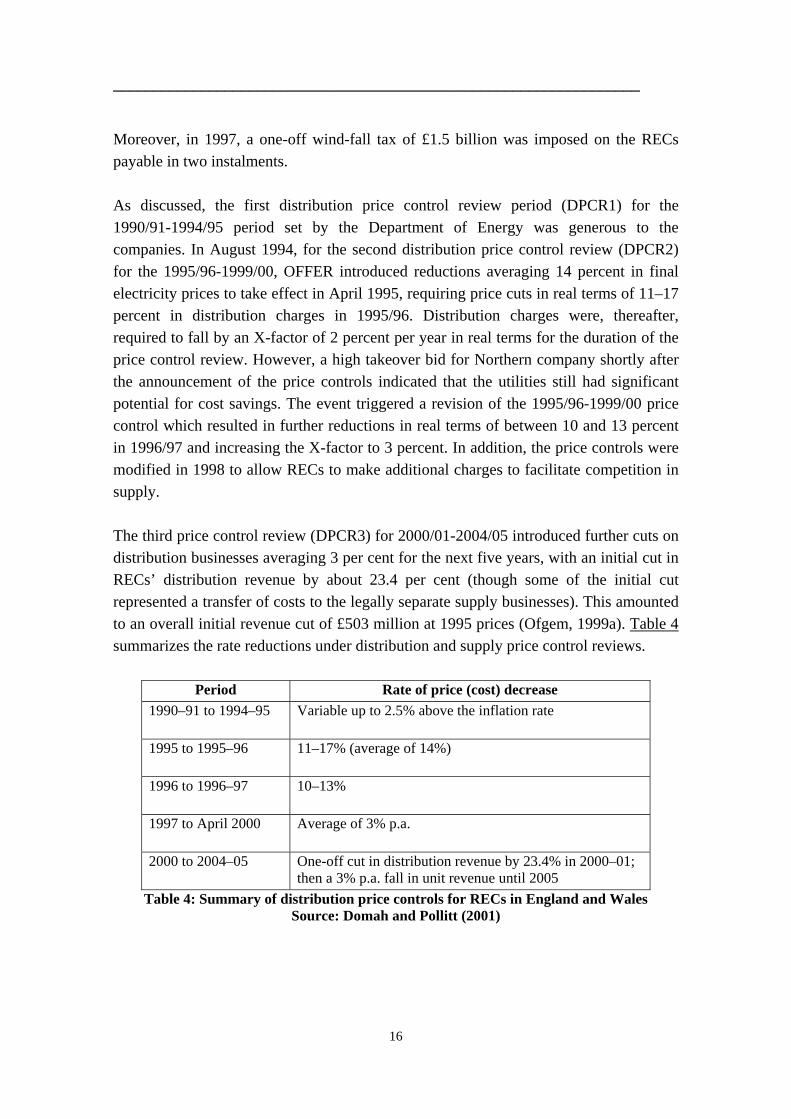
__________________________________________________________________ Moreover, in 1997, a one-off wind-fall tax of £1.5 billion was imposed on the RECs payable in two instalments. As discussed, the first distribution price control review period (DPCR1) for the 1990/91-1994/95 period set by the Department of Energy was generous to the companies. In August 1994, for the second distribution price control review (DPCR2) for the 1995/96-1999/00, OFFER introduced reductions averaging 14 percent in final electricity prices to take effect in April 1995, requiring price cuts in real terms of 11–17 percent in distribution charges in 1995/96. Distribution charges were, thereafter, required to fall by an X-factor of 2 percent per year in real terms for the duration of the price control review. However, a high takeover bid for Northern company shortly after the announcement of the price controls indicated that the utilities still had significant potential for cost savings. The event triggered a revision of the 1995/96-1999/00 price control which resulted in further reductions in real terms of between 10 and 13 percent in 1996/97 and increasing the X-factor to 3 percent. In addition, the price controls were modified in 1998 to allow RECs to make additional charges to facilitate competition in supply. The third price control review (DPCR3) for 2000/01-2004/05 introduced further cuts on distribution businesses averaging 3 per cent for the next five years, with an initial cut in RECs’ distribution revenue by about 23.4 per cent (though some of the initial cut represented a transfer of costs to the legally separate supply businesses). This amounted to an overall initial revenue cut of £503 million at 1995 prices (Ofgem, 1999a). Table 4 summarizes the rate reductions under distribution and supply price control reviews.
Period Rate of price (cost) decrease 1990–91 to 1994–95
Variable up to 2.5% above the inflation rate
1995 to 1995–96
11–17% (average of 14%)
1996 to 1996–97
10–13%
1997 to April 2000
Average of 3% p.a.
2000 to 2004–05
One-off cut in distribution revenue by 23.4% in 2000–01; then a 3% p.a. fall in unit revenue until 2005
Table 4: Summary of distribution price controls for RECs in England and Wales Source: Domah and Pollitt (2001)
16
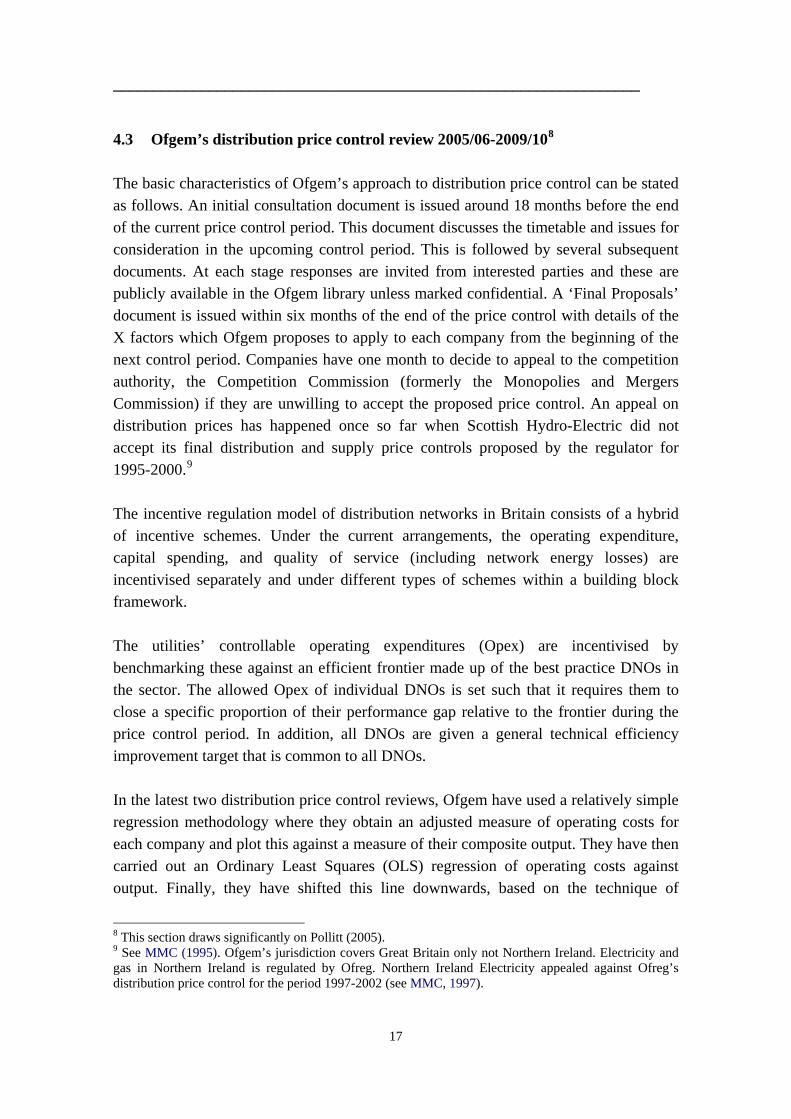
__________________________________________________________________
4.3 Ofgem’s distribution price control review 2005/06-2009/108
The basic characteristics of Ofgem’s approach to distribution price control can be stated as follows. An initial consultation document is issued around 18 months before the end of the current price control period. This document discusses the timetable and issues for consideration in the upcoming control period. This is followed by several subsequent documents. At each stage responses are invited from interested parties and these are publicly available in the Ofgem library unless marked confidential. A ‘Final Proposals’ document is issued within six months of the end of the price control with details of the X factors which Ofgem proposes to apply to each company from the beginning of the next control period. Companies have one month to decide to appeal to the competition authority, the Competition Commission (formerly the Monopolies and Mergers Commission) if they are unwilling to accept the proposed price control. An appeal on distribution prices has happened once so far when Scottish Hydro-Electric did not accept its final distribution and supply price controls proposed by the regulator for 1995-2000.9
The incentive regulation model of distribution networks in Britain consists of a hybrid of incentive schemes. Under the current arrangements, the operating expenditure, capital spending, and quality of service (including network energy losses) are incentivised separately and under different types of schemes within a building block framework. The utilities’ controllable operating expenditures (Opex) are incentivised by benchmarking these against an efficient frontier made up of the best practice DNOs in the sector. The allowed Opex of individual DNOs is set such that it requires them to close a specific proportion of their performance gap relative to the frontier during the price control period. In addition, all DNOs are given a general technical efficiency improvement target that is common to all DNOs. In the latest two distribution price control reviews, Ofgem have used a relatively simple regression methodology where they obtain an adjusted measure of operating costs for each company and plot this against a measure of their composite output. They have then carried out an Ordinary Least Squares (OLS) regression of operating costs against output. Finally, they have shifted this line downwards, based on the technique of
8 This section draws significantly on Pollitt (2005). 9 See MMC (1995). Ofgem’s jurisdiction covers Great Britain only not Northern Ireland. Electricity and gas in Northern Ireland is regulated by Ofreg. Northern Ireland Electricity appealed against Ofreg’s distribution price control for the period 1997-2002 (see MMC, 1997).
17
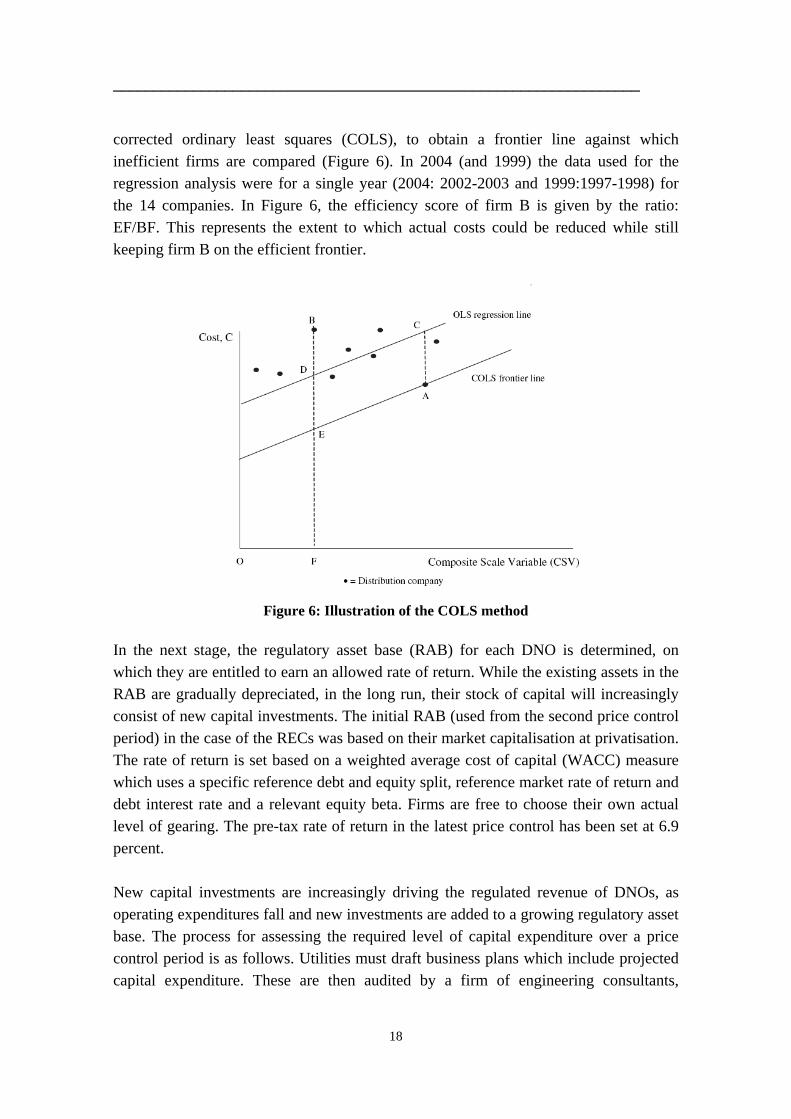
__________________________________________________________________ corrected ordinary least squares (COLS), to obtain a frontier line against which inefficient firms are compared (Figure 6). In 2004 (and 1999) the data used for the regression analysis were for a single year (2004: 2002-2003 and 1999:1997-1998) for the 14 companies. In Figure 6, the efficiency score of firm B is given by the ratio: EF/BF. This represents the extent to which actual costs could be reduced while still keeping firm B on the efficient frontier.
Figure 6: Illustration of the COLS method
In the next stage, the regulatory asset base (RAB) for each DNO is determined, on which they are entitled to earn an allowed rate of return. While the existing assets in the RAB are gradually depreciated, in the long run, their stock of capital will increasingly consist of new capital investments. The initial RAB (used from the second price control period) in the case of the RECs was based on their market capitalisation at privatisation. The rate of return is set based on a weighted average cost of capital (WACC) measure which uses a specific reference debt and equity split, reference market rate of return and debt interest rate and a relevant equity beta. Firms are free to choose their own actual level of gearing. The pre-tax rate of return in the latest price control has been set at 6.9 percent. New capital investments are increasingly driving the regulated revenue of DNOs, as operating expenditures fall and new investments are added to a growing regulatory asset base. The process for assessing the required level of capital expenditure over a price control period is as follows. Utilities must draft business plans which include projected capital expenditure. These are then audited by a firm of engineering consultants,
18
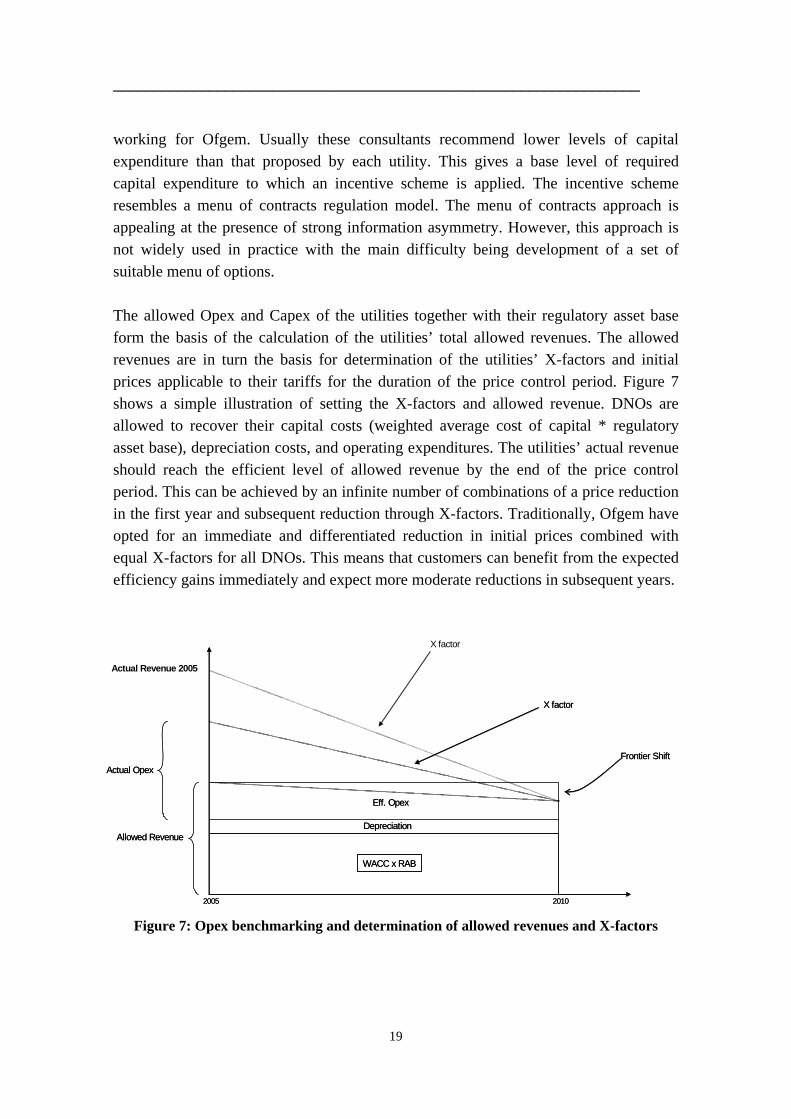
__________________________________________________________________ working for Ofgem. Usually these consultants recommend lower levels of capital expenditure than that proposed by each utility. This gives a base level of required capital expenditure to which an incentive scheme is applied. The incentive scheme resembles a menu of contracts regulation model. The menu of contracts approach is appealing at the presence of strong information asymmetry. However, this approach is not widely used in practice with the main difficulty being development of a set of suitable menu of options. The allowed Opex and Capex of the utilities together with their regulatory asset base form the basis of the calculation of the utilities’ total allowed revenues. The allowed revenues are in turn the basis for determination of the utilities’ X-factors and initial prices applicable to their tariffs for the duration of the price control period. Figure 7 shows a simple illustration of setting the X-factors and allowed revenue. DNOs are allowed to recover their capital costs (weighted average cost of capital * regulatory asset base), depreciation costs, and operating expenditures. The utilities’ actual revenue should reach the efficient level of allowed revenue by the end of the price control period. This can be achieved by an infinite number of combinations of a price reduction in the first year and subsequent reduction through X-factors. Traditionally, Ofgem have opted for an immediate and differentiated reduction in initial prices combined with equal X-factors for all DNOs. This means that customers can benefit from the expected efficiency gains immediately and expect more moderate reductions in subsequent years.
2005 20102005 2010
WACC x RABWACC x RAB
DepreciationDepreciation
Eff. OpexEff. Opex
X factor
Figure 7: Opex benchmarking and determination of allowed revenues and X-factors
Allowed RevenueAllowed Revenue
Frontier ShiftFrontier ShiftActual Opex
X factor
Actual Opex
X factor
Actual Revenue 2005
19
__________________________________________________________________ Quality of service and network energy losses are incentivised separately through performance targets. The targets for each DNO are individual and deviation from these results in company specific penalties and rewards calculated based on an elaborate system. The reward and penalty affect the total allowed revenue. In order to avoid jeopardizing financial viability of the companies, the maximum amount subject to quality of service reward and penalty scheme is capped as a percentage of allowed revenue. Collectively, these incentive schemes amount to a revenue cap incentive regulation. Due to the presence of trade-offs between Opex, Capex, quality of service, and network losses, from an economic efficiency point of view, it is preferable to use an integrated benchmarking model. Such a model would be based on a single total expenditure (Totex) measure where all cost measures as well as some measure of monetary values of service quality and network losses are added together. The hybrid system in Britain is contrary to the notion of integrated overall incentive regulation. However, the adopted approach – segmented regulation - gives more control to the regulator to address specific areas of focus. It also involves less complicated modelling than would a fully integrated benchmarking model and is more transparent in its operation. At the same time, the current incentive system does not reflect the potential trade-off between the specific regulated aspects of the utilities. 5. Some Issues in Regulation Benchmarking In this section we discuss some of the issues with which incentive regulation has to deal. Each of these issues has been faced by Offer/Ofgem in the UK. We examine issues to do with identifying the right X-factor, incentivisation of quality of supply, network losses and new investments. Each of which poses particular challenges within the price review process. 5.1 Setting the right benchmark The appeal of benchmarking as a practical approach to operationalize the concept of incentive regulation is evident. In particular, benchmarking has the potential to reduce information asymmetry between the regulator and the firm. However, the information requirement for conducting a robust benchmarking exercise has proved to be more complicated than expected. Establishing the appropriate reporting
20
__________________________________________________________________ formats, standardisation of data, and ensuring the quality of data have been non-trivial. Moreover, the legal aspects surrounding the collection of the required data and the use of benchmarking have caused delays and complicated some regulatory proceedings. A major reservation against assigning firm specific X-factors has been that the cost saving incentives can be blunted if companies are not allowed to retain efficiency savings beyond the next price review. Benchmarking may result in firms having to run to stand still and hence there may be strong incentives to subvert the regulatory process. Frontier approaches are also susceptible to shocks and errors in data. This is especially the case when cross-sectional data is used and there is no allowance for errors. In order to minimise problems due to data errors there should be very careful handling of data accuracy. Recognising the importance of data quality in benchmarking, the Norwegian and UK regulators have made considerable efforts to improve data standardisation and accuracy. Determining the future rate of movement of the frontier is problematic. Measures of past productivity growth usually include both frontier shift effects and movements towards the frontier. However, the problem can be reduced if firms are compared to world best practice as the variation in world best practice frontier shifts (given international benchmarking) is small (1-2% p.a.). Once efficiency scores are calculated, the crucial assumption in deciding the X-factors is the rate at which the efficiency gaps can be closed. The regulators will need to make allowance both for this and for in-country heterogeneity. The issue of the scope for the use of benchmarking in incentive regulation has been important. For example, separate analysis of capital costs and operating expenses can encourage intermediation between these cost categories. Firms may attempt to seek higher capital expenditure to reduce operating costs. While, in principle, benchmarking should ideally apply to total costs, this is difficult given the heterogeneous nature of capital (which could simply be a function of differing accounting standards). As a result, regulators in leading countries such as the UK and Norway have made considerable effort to handle the possibility of intermediation. International comparisons are often restricted to comparison of operating costs because of the heterogeneity of capital but this may limit their applicability. Moreover, strategic behaviour or gaming by firms within the regulatory process is a longstanding regulatory issue as the regulator is dependent, to a degree, on information supplied by the firms. However, although benchmarking may not prevent gaming
21
__________________________________________________________________
entirely it could relate to it (see Jamasb, Nillesen, and Pollitt, 2003, 2004). Di Tella and Dyck (2002) examine the strategic behaviour associated with price-cap regulation of electricity distribution utilities in Chile. The findings indicate a downward cost trend, but one year in four the cost was about 1.4 percent above trend. These cost reversals occurred in the year preceding a price review. The cost increase appears to lead to higher returns for stock prices of the firms. The study suggests that this represents a perverse incentive in the regulation model, as cost reversal in the year of price determination leads to higher prices in the following control period. Furthermore, in many cases, though mostly in developing countries, lack of regulatory experience and inadequate implementation of incentive regulation models have led to major contract renegotiations (Benavides and Fainboim, 1999; Abdala, 2001; Basañes et al., 1999). Guasch (2003, 2004) finds that contract renegotiations after the award of infrastructure concessions have been significantly more likely for concessions under price cap than for rate of return regulation models. Renegotiations often reduced the incentive property of the regulation models by making them more similar to rate of return regulation. In addition, the achieved efficiency gains were often not passed to consumers and instead benefited the companies or the government (Estache et al., 2003). Maintaining the incentive property of the UK price cap regulation can gradually become difficult as the share of benchmarked costs declines (Thomas, 2004). 5.2 Quality of Service The social and economic costs of supply interruptions are substantial.10 At the same time, introduction of incentive regulation has brought to attention the issue of the trade-offs between costs and non-tradable outputs or attributes of the utilities. In particular, regulators are concerned with the trade-offs between capital and operating costs on the one hand and service quality on the other. Incentive regulation tends to narrow down the focus of the utilities on those aspects of their operation that are incentivised by the scheme. Under the prevalent incentive regulation schemes, utilities face strong incentives to undertake cost savings. Therefore, in the absence of specific regulation quality of service is likely to deteriorate.11
Improving quality of service involves operating and capital costs for the utilities. However, the companies have better information about their ability to improve quality
10 This section draws significantly from Giannakis, Jamasb, and Pollitt (2005). 11 It should be noted that quality of electricity services can be affected at generation, transmission, and distribution stages of the system.
22
__________________________________________________________________ and the associated costs than the regulator. At the same time, the socio-economic cost or customer valuation of quality is difficult to measure. From a pure economic point of view, the optimum is where the marginal cost of improving quality is equal to the socio-economic value of quality improvement. In the absence of proper incentives to achieve optimal quality, it is very unlikely that a regulated utility will be offering optimal quality. Either the incentives to improve quality will be too low and there will be under-performance or the regulatory process will have allowed expensive quality investments which push the level of quality above the optimal level. A survey of the literature in Sappington (2005) concludes that there are no simple policy solutions for effective regulation of quality of service but they depend on the information available to the regulator, institutional settings, and consumer preferences. The paper argues in favour of providing the regulated firm with proper reward and penalty incentives for service quality when the regulator has sufficient information on consumer preferences and production technologies. The concern surrounding the impacts of incentive regulation on service quality has been recognised ever since price cap regulation was first implemented as part of the British telecommunication industry restructuring (Waddams Price et al., 2002). However, the strong focus of regulators on incentivising quality is of more recent date as reforms progressively evolve beyond pure cost efficiency considerations to encompass non-marketable aspects of the distribution networks. Tangerås (2003) argues that, when quantity is regulated, yardstick competition results in lower quality than under individual regulation although under individual regulation, the quality would be too high. In principle, the above argument also holds for revenue and price cap regulation models. Evidence shows that utilities respond to explicit service quality incentives and strong regulation can prevent deterioration of quality. For example, evidence from the UK and Norway shows that, although their approaches to regulation differ, utilities have responded to quality of service incentives. Also, Ter-Martirosyan (2003), in a study of performance based regulation of the US electric utilities finds that, in the absence of explicit regulation, quality of service tends to decline. At the same time, the individual non-incentivised reliability indicators do not necessarily improve (CPB, 2004). This indicates both the power of incentives and the importance of defining the appropriate indicators. There are different approaches for providing quality incentives to distribution utilities: (i) marginal rewards and penalties, (ii) absolute fines, and (iii) quality-incorporated benchmarking (Frontier Economics, 2003). The marginal reward and penalty scheme is
23

__________________________________________________________________ based on reward or penalty per unit of quality improvements (degradation) that reflect marginal value of quality to customers. In equilibrium, a profit-maximising firm will operate at an efficient level according to its individual marginal cost curve. These mechanisms are referred to as “decentralised”, as they allow firms to choose their level of quality provision. Absolute fines are centralised and require the company to pay a specified amount if quality drops below a threshold. Although absolute schemes are economically inferior to marginal ones, they entail broader social and political benefits by ensuring that customers are protected by performance standards. Regulators can also use a combination of marginal and absolute incentives. Quality-incorporated benchmarking is also based on marginal rewards and penalties. For example, under price cap regulation, a company that improves quality may be allowed to raise its price by an amount that reflects the social value of the increased quality. Similar to marginal reward and penalty schemes, these methods are decentralised, thus minimising the need for regulatory intervention. The challenge associated with incorporating service quality in benchmarking is to balance the cost and quality-oriented incentives. Moreover, cost-quality benchmarking introduces the dynamic benefits of competition into the provision of service quality. In effect, by using benchmarking, regulated firms compete to deliver an optimal bundle of cost and service quality. Thus, in addition to static gain maximisation (achieved by adjusting the quality level subject to a fixed cost curve), firms also face an incentive to pursue long-term investments that shift quality provision costs downwards. In designing quality-incorporated regulatory mechanisms, regulators are faced with the task of determining a market demand curve for service quality. Lack of detailed and accurate data is also a common problem. For instance, the Norwegian regulator estimates interruption costs at an aggregate level, where customers are classified as being either residential/agricultural or industrial/commercial (Langset et al., 2001). Service quality regulation also involves a political aspect that can come into conflict with economic considerations. Customers’s valuation of quality may differ between distribution companies. This would imply that individually tailored service qualities are the efficient outcome. However this may be politically unacceptable if poorer regions ended up with worse levels of quality. At the same time, regulators have not yet explicitly integrated quality of service in their benchmarking exercise. A notable exception is, however, Norway which introduced quality-dependent revenue caps in 2001 (Heggset et al., 2001; Langset et al., 2001).
24
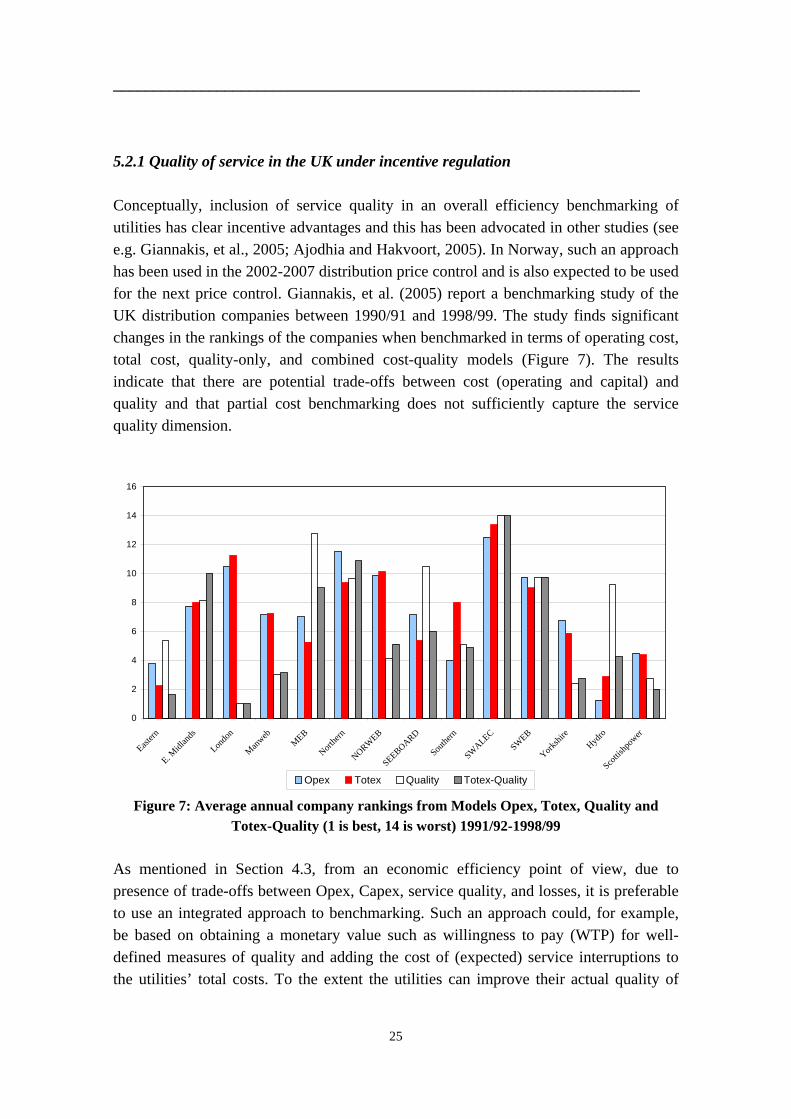
__________________________________________________________________ 5.2.1 Quality of service in the UK under incentive regulation Conceptually, inclusion of service quality in an overall efficiency benchmarking of utilities has clear incentive advantages and this has been advocated in other studies (see e.g. Giannakis, et al., 2005; Ajodhia and Hakvoort, 2005). In Norway, such an approach has been used in the 2002-2007 distribution price control and is also expected to be used for the next price control. Giannakis, et al. (2005) report a benchmarking study of the UK distribution companies between 1990/91 and 1998/99. The study finds significant changes in the rankings of the companies when benchmarked in terms of operating cost, total cost, quality-only, and combined cost-quality models (Figure 7). The results indicate that there are potential trade-offs between cost (operating and capital) and quality and that partial cost benchmarking does not sufficiently capture the service quality dimension.
0
2
4
6
8
10
12
14
16
Eastern
E. Midl
ands
Londo
n
Manweb
MEB
Northe
rn
NORWEB
SEEBOARD
Southe
rn
SWALEC
SWEB
Yorkshi
reHyd
ro
Scottis
hpow
er
Opex Totex Quality Totex-Quality
Figure 7: Average annual company rankings from Models Opex, Totex, Quality and Totex-Quality (1 is best, 14 is worst) 1991/92-1998/99
As mentioned in Section 4.3, from an economic efficiency point of view, due to presence of trade-offs between Opex, Capex, service quality, and losses, it is preferable to use an integrated approach to benchmarking. Such an approach could, for example, be based on obtaining a monetary value such as willingness to pay (WTP) for well-defined measures of quality and adding the cost of (expected) service interruptions to the utilities’ total costs. To the extent the utilities can improve their actual quality of
25
__________________________________________________________________ service performance they can retain the difference between the actual and expected cost of interruptions. Hence, the utilities will have incentive to improve service quality up to the point where the cost of doing so equals the WTP value of quality. The current regulatory arrangements in the UK treat Opex, Capex and service quality separately. This may provide firms with distorted incentives that lead them to adopt an inefficient output mix. Under the current regulatory regime, a firm receives greater benefits from saving Opex than by an equal amount of Capex reduction (Ofgem, 2003a). Thus, firms may seek to capitalise Opex to obtain higher efficiency score and allowed revenue. Unless utilities face incentives that reflect the social value of service quality, they are unlikely to provide socially optimal levels of quality. A further issue is related to the periodicity of the price reviews. Under the present scheme, companies retain 27% of the present value of a cost reduction made in the first year of a review period but only 6% of the present value of an equal cost saving made in the final year (Ofgem, 2003a). Thus, companies may delay efficiency improvements and/or adopt distorted capital investment programmes. Such distortions of incentives exist for quality enhancing investments, where the quality benchmarks are reset every five years. This means that any benefits of investments may not be retained beyond the current distribution price review period. Between 1990 and 2000, quality of service in Great Britain was regulated through guaranteed standards of performance, which entitle consumers to compensation if the firms breach them, and overall standards, which refer to system-level performance. Originally, 10 guaranteed standards were applied and a further one was introduced in 1998. Overall standards were also set for each firm. The regulator has progressively tightened the standards and consultations with DNOs and other stakeholders have been carried out. However, there is no direct evidence with regards to the effectiveness of the reward and penalty schemes (Waddams Price et al., 2002). However for the current price control period (2005-2010) considerable improvements in quality are expected. The third price control review set company-specific quality standards for 2004/05 on the basis of their historic performance (Ofgem, 1999a). The regulator and the companies generally supported the introduction of an incentive-based regime for service quality regulation (Ofgem, 1999b). However, since the necessary foundation work had not been carried out, it was proposed that the incentive mechanisms should be developed as part of a work programme, the Information and Incentives Project (IIP), and applied from 2002/03, rather than the start of the price control period (2000/01).
26
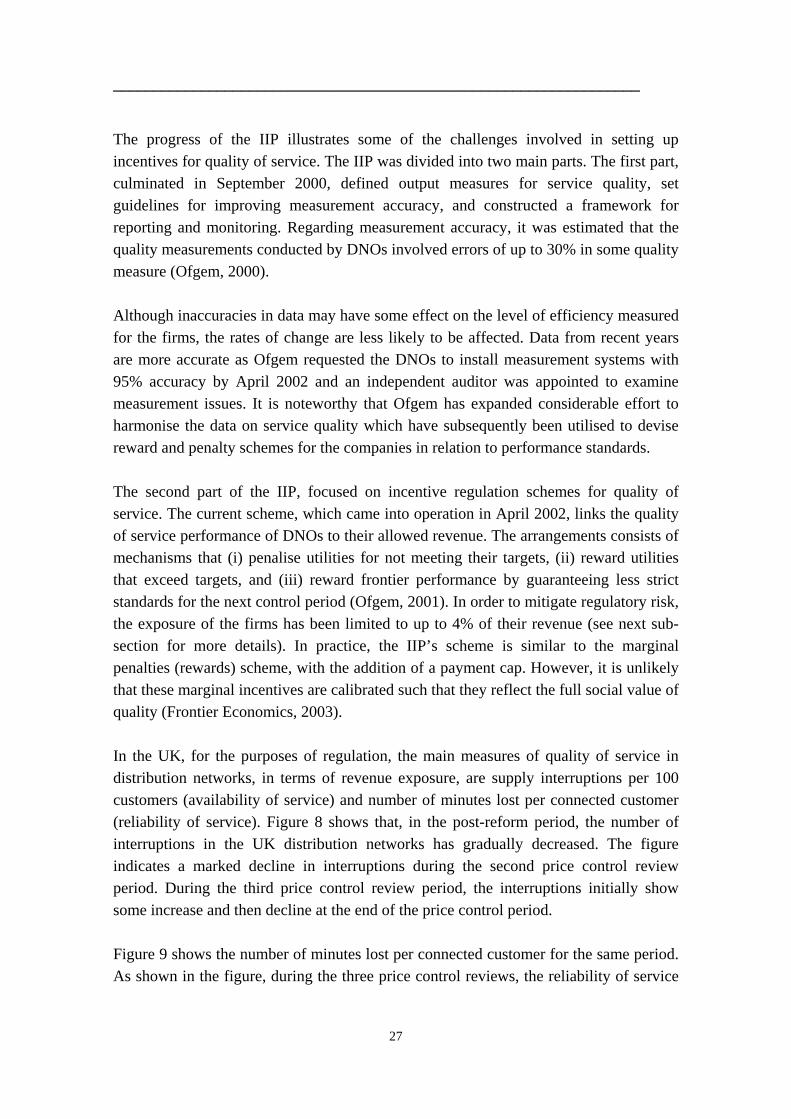
__________________________________________________________________ The progress of the IIP illustrates some of the challenges involved in setting up incentives for quality of service. The IIP was divided into two main parts. The first part, culminated in September 2000, defined output measures for service quality, set guidelines for improving measurement accuracy, and constructed a framework for reporting and monitoring. Regarding measurement accuracy, it was estimated that the quality measurements conducted by DNOs involved errors of up to 30% in some quality measure (Ofgem, 2000). Although inaccuracies in data may have some effect on the level of efficiency measured for the firms, the rates of change are less likely to be affected. Data from recent years are more accurate as Ofgem requested the DNOs to install measurement systems with 95% accuracy by April 2002 and an independent auditor was appointed to examine measurement issues. It is noteworthy that Ofgem has expanded considerable effort to harmonise the data on service quality which have subsequently been utilised to devise reward and penalty schemes for the companies in relation to performance standards. The second part of the IIP, focused on incentive regulation schemes for quality of service. The current scheme, which came into operation in April 2002, links the quality of service performance of DNOs to their allowed revenue. The arrangements consists of mechanisms that (i) penalise utilities for not meeting their targets, (ii) reward utilities that exceed targets, and (iii) reward frontier performance by guaranteeing less strict standards for the next control period (Ofgem, 2001). In order to mitigate regulatory risk, the exposure of the firms has been limited to up to 4% of their revenue (see next sub-section for more details). In practice, the IIP’s scheme is similar to the marginal penalties (rewards) scheme, with the addition of a payment cap. However, it is unlikely that these marginal incentives are calibrated such that they reflect the full social value of quality (Frontier Economics, 2003). In the UK, for the purposes of regulation, the main measures of quality of service in distribution networks, in terms of revenue exposure, are supply interruptions per 100 customers (availability of service) and number of minutes lost per connected customer (reliability of service). Figure 8 shows that, in the post-reform period, the number of interruptions in the UK distribution networks has gradually decreased. The figure indicates a marked decline in interruptions during the second price control review period. During the third price control review period, the interruptions initially show some increase and then decline at the end of the price control period. Figure 9 shows the number of minutes lost per connected customer for the same period. As shown in the figure, during the three price control reviews, the reliability of service
27
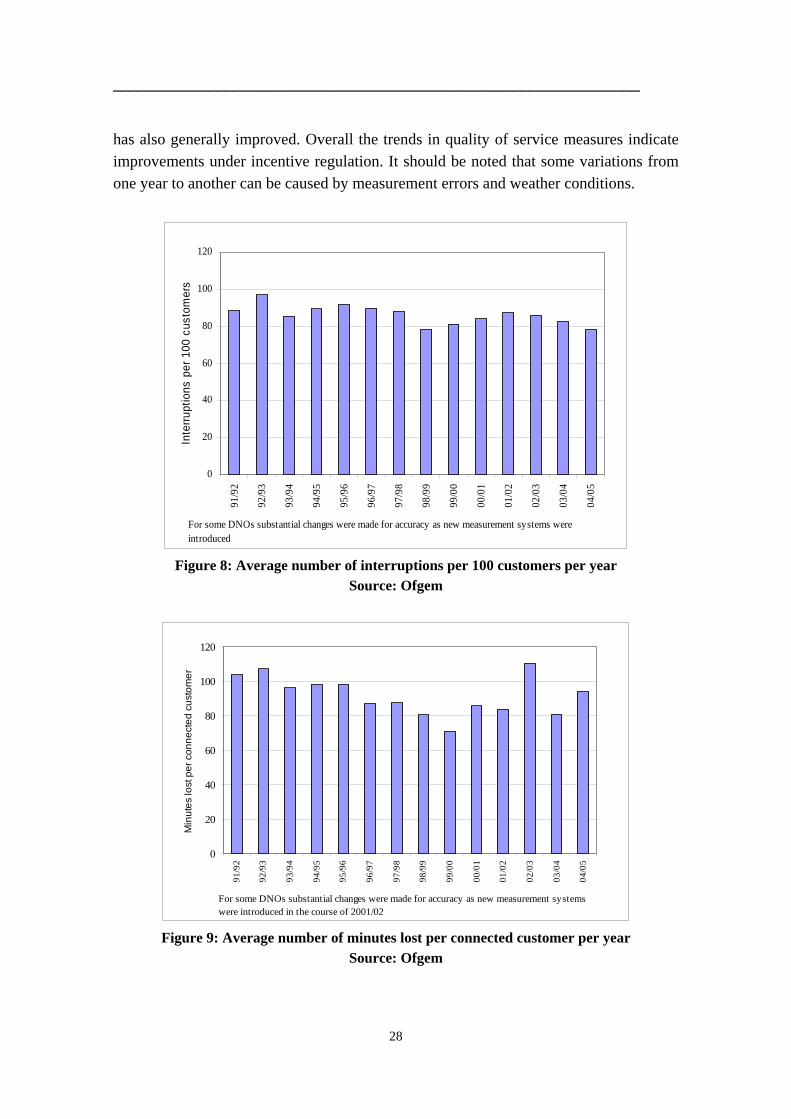
__________________________________________________________________ has also generally improved. Overall the trends in quality of service measures indicate improvements under incentive regulation. It should be noted that some variations from one year to another can be caused by measurement errors and weather conditions.
0
20
40
60
80
100
120
91/9
2
92/9
3
93/9
4
94/9
5
95/9
6
96/9
7
97/9
8
98/9
9
99/0
0
00/0
1
01/0
2
02/0
3
03/0
4
04/0
5
Inte
rrupt
ions
per
100
cus
tom
ers
For some DNOs substantial changes were made for accuracy as new measurement systems were introduced
Figure 8: Average number of interruptions per 100 customers per year
Source: Ofgem
0
20
40
60
80
100
120
91/9
2
92/9
3
93/9
4
94/9
5
95/9
6
96/9
7
97/9
8
98/9
9
99/0
0
00/0
1
01/0
2
02/0
3
03/0
4
04/0
5
Min
utes
lost
per
con
nect
ed c
usto
mer
For some DNOs substantial changes were made for accuracy as new measurement systems were introduced in the course of 2001/02
Figure 9: Average number of minutes lost per connected customer per year Source: Ofgem
28
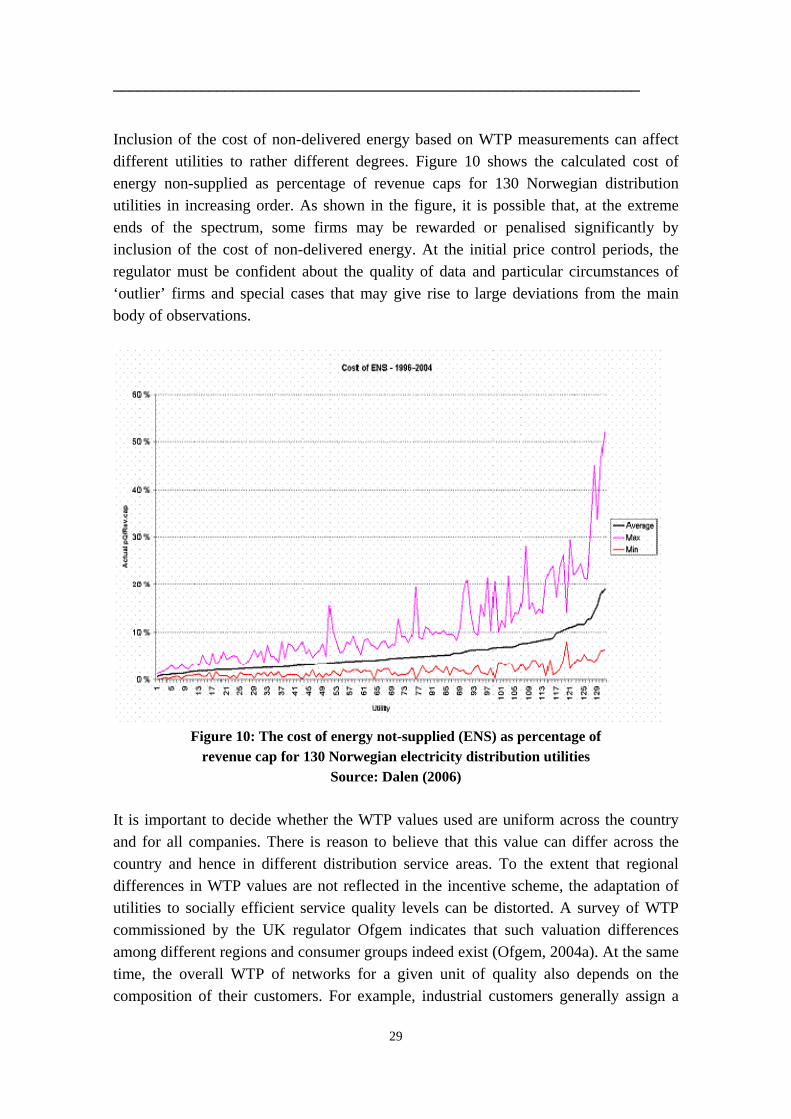
__________________________________________________________________ Inclusion of the cost of non-delivered energy based on WTP measurements can affect different utilities to rather different degrees. Figure 10 shows the calculated cost of energy non-supplied as percentage of revenue caps for 130 Norwegian distribution utilities in increasing order. As shown in the figure, it is possible that, at the extreme ends of the spectrum, some firms may be rewarded or penalised significantly by inclusion of the cost of non-delivered energy. At the initial price control periods, the regulator must be confident about the quality of data and particular circumstances of ‘outlier’ firms and special cases that may give rise to large deviations from the main body of observations.
Figure 10: The cost of energy not-supplied (ENS) as percentage of
revenue cap for 130 Norwegian electricity distribution utilities Source: Dalen (2006)
It is important to decide whether the WTP values used are uniform across the country and for all companies. There is reason to believe that this value can differ across the country and hence in different distribution service areas. To the extent that regional differences in WTP values are not reflected in the incentive scheme, the adaptation of utilities to socially efficient service quality levels can be distorted. A survey of WTP commissioned by the UK regulator Ofgem indicates that such valuation differences among different regions and consumer groups indeed exist (Ofgem, 2004a). At the same time, the overall WTP of networks for a given unit of quality also depends on the composition of their customers. For example, industrial customers generally assign a
29
__________________________________________________________________ higher value and opportunity cost to service quality than residential and commercial customers. Nevertheless, the potential political sensitivities of explicit use of differentiated service quality valuations are clear. However these sensitivities may be a particular feature of central government, local governments may be much freer to assign different quality valuations compared with their peers. It is important to note that the marginal cost curve of improving service quality varies across the companies. An implication of subjecting the firms to their marginal cost of quality improvements is that, in the long-run, this could result in differentiated service quality levels across the country. If there are substantial performance differences in term of quality of service, the share of quality incentives as their total allowed revenues can be substantial. The effect of the value of quality on total allowed revenues for some utilities may become stronger than those of the Norwegian utilities depicted in Figure 10. It is preferable to first aim at bringing the quality of service to comparable levels across the sector before integrating them with the companies’ own costs and incorporating them fully into the benchmarking model. For some firms with low quality performance, the transition to a high quality network may require large capital investments and time. In the UK, there is a 46 percent allowed increase in real capital investments in the 2005-2010 distribution price control period over the previous period that is partly intended to improve the quality of service during this period. Exempting investments from benchmarking offers some flexibility in addressing investment related priority targets. In contrast, it must be noted that, total cost benchmarking methods do not have built-in mechanisms that would signal increased investment in specific areas such as quality. In Norway, the regulator has incorporated the value of non-delivered energy to customers as a cost in the benchmarking model. The values are obtained from surveys and studies of different consumer groups. Both the UK and Norwegian benchmarking models, despite the differences in their approach, have succeeded in improving the quality of service. 5.2.2 Quality of service incentives within UK price controls As noted, regulation pertaining to quality of service of DNOs has evolved gradually since the first distribution price control review. Quality of service in distribution networks is multi-faceted and extends beyond the number and length of service interruptions. Recognising this, the quality of service incentives in Ofgem’s price controls through revenue exposure consist of: (i) interruption (continuity of service)
30
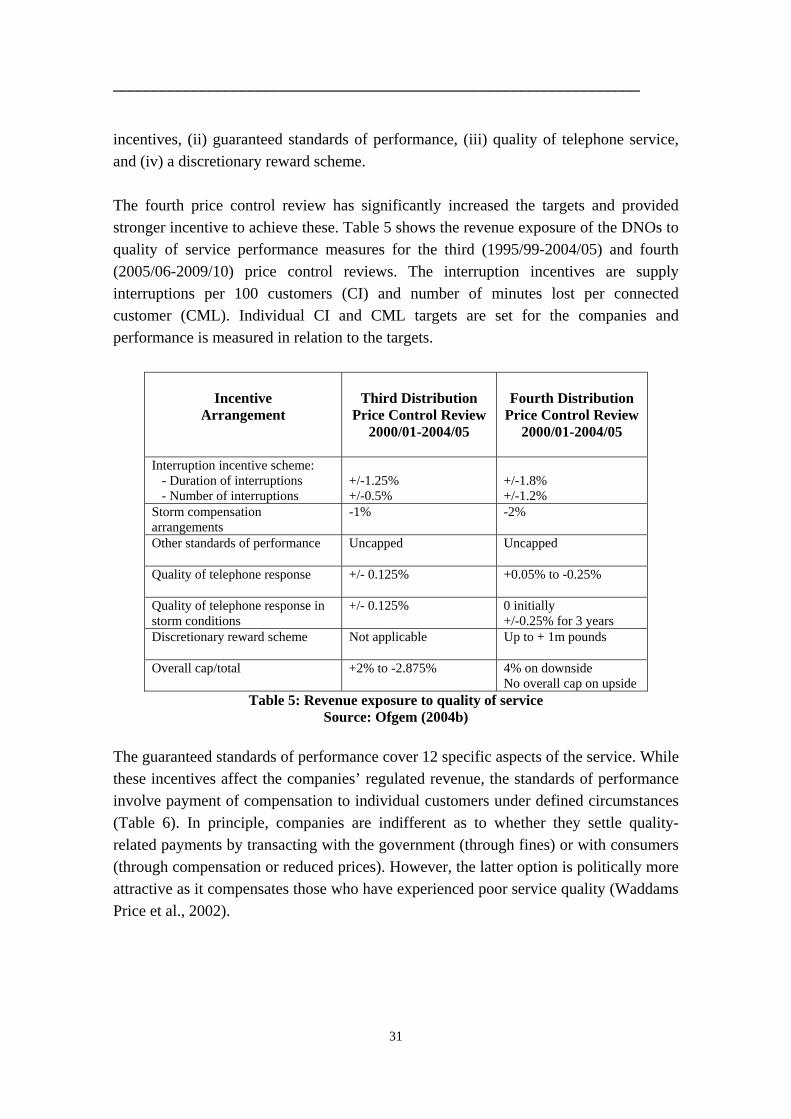
__________________________________________________________________ incentives, (ii) guaranteed standards of performance, (iii) quality of telephone service, and (iv) a discretionary reward scheme. The fourth price control review has significantly increased the targets and provided stronger incentive to achieve these. Table 5 shows the revenue exposure of the DNOs to quality of service performance measures for the third (1995/99-2004/05) and fourth (2005/06-2009/10) price control reviews. The interruption incentives are supply interruptions per 100 customers (CI) and number of minutes lost per connected customer (CML). Individual CI and CML targets are set for the companies and performance is measured in relation to the targets.
Incentive
Arrangement
Third Distribution
Price Control Review 2000/01-2004/05
Fourth Distribution
Price Control Review 2000/01-2004/05
Interruption incentive scheme: - Duration of interruptions - Number of interruptions
+/-1.25% +/-0.5%
+/-1.8% +/-1.2%
Storm compensation arrangements
-1% -2%
Other standards of performance Uncapped Uncapped
Quality of telephone response +/- 0.125% +0.05% to -0.25%
Quality of telephone response in storm conditions
+/- 0.125% 0 initially +/-0.25% for 3 years
Discretionary reward scheme Not applicable Up to + 1m pounds
Overall cap/total +2% to -2.875% 4% on downside No overall cap on upside
Table 5: Revenue exposure to quality of service Source: Ofgem (2004b)
The guaranteed standards of performance cover 12 specific aspects of the service. While these incentives affect the companies’ regulated revenue, the standards of performance involve payment of compensation to individual customers under defined circumstances (Table 6). In principle, companies are indifferent as to whether they settle quality-related payments by transacting with the government (through fines) or with consumers (through compensation or reduced prices). However, the latter option is politically more attractive as it compensates those who have experienced poor service quality (Waddams Price et al., 2002).
31
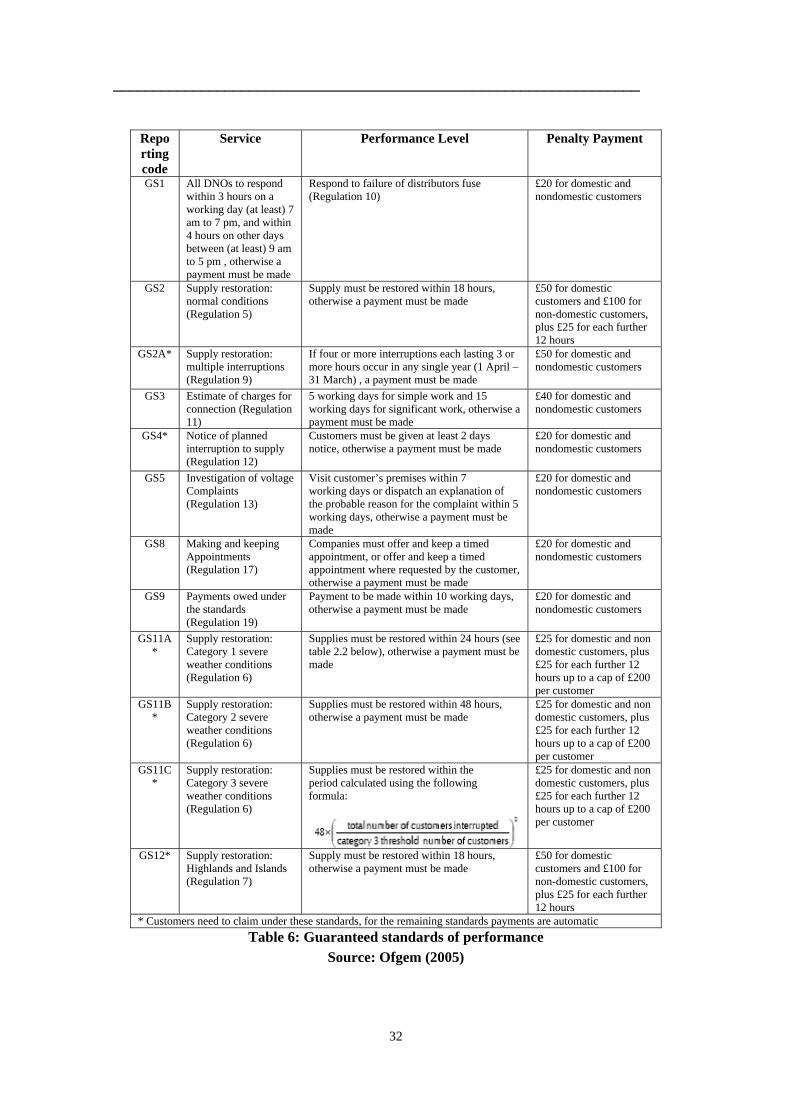
__________________________________________________________________
Reporting code
Service Performance Level Penalty Payment
GS1
All DNOs to respond within 3 hours on a working day (at least) 7 am to 7 pm, and within 4 hours on other days between (at least) 9 am to 5 pm , otherwise a payment must be made
Respond to failure of distributors fuse (Regulation 10)
£20 for domestic and nondomestic customers
GS2 Supply restoration: normal conditions (Regulation 5)
Supply must be restored within 18 hours, otherwise a payment must be made
£50 for domestic customers and £100 for non-domestic customers, plus £25 for each further 12 hours
GS2A*
Supply restoration: multiple interruptions (Regulation 9)
If four or more interruptions each lasting 3 or more hours occur in any single year (1 April – 31 March) , a payment must be made
£50 for domestic and nondomestic customers
GS3
Estimate of charges for connection (Regulation 11)
5 working days for simple work and 15 working days for significant work, otherwise a payment must be made
£40 for domestic and nondomestic customers
GS4*
Notice of planned interruption to supply (Regulation 12)
Customers must be given at least 2 days notice, otherwise a payment must be made
£20 for domestic and nondomestic customers
GS5
Investigation of voltage Complaints (Regulation 13)
Visit customer’s premises within 7 working days or dispatch an explanation of the probable reason for the complaint within 5 working days, otherwise a payment must be made
£20 for domestic and nondomestic customers
GS8
Making and keeping Appointments (Regulation 17)
Companies must offer and keep a timed appointment, or offer and keep a timed appointment where requested by the customer, otherwise a payment must be made
£20 for domestic and nondomestic customers
GS9
Payments owed under the standards (Regulation 19)
Payment to be made within 10 working days, otherwise a payment must be made
£20 for domestic and nondomestic customers
GS11A*
Supply restoration: Category 1 severe weather conditions (Regulation 6)
Supplies must be restored within 24 hours (see table 2.2 below), otherwise a payment must be made
£25 for domestic and non domestic customers, plus £25 for each further 12 hours up to a cap of £200 per customer
GS11B*
Supply restoration: Category 2 severe weather conditions (Regulation 6)
Supplies must be restored within 48 hours, otherwise a payment must be made
£25 for domestic and non domestic customers, plus £25 for each further 12 hours up to a cap of £200 per customer
GS11C*
Supply restoration: Category 3 severe weather conditions (Regulation 6)
Supplies must be restored within the period calculated using the following formula:
£25 for domestic and non domestic customers, plus £25 for each further 12 hours up to a cap of £200 per customer
GS12*
Supply restoration: Highlands and Islands (Regulation 7)
Supply must be restored within 18 hours, otherwise a payment must be made
£50 for domestic customers and £100 for non-domestic customers, plus £25 for each further 12 hours
* Customers need to claim under these standards, for the remaining standards payments are automatic Table 6: Guaranteed standards of performance
Source: Ofgem (2005)
32
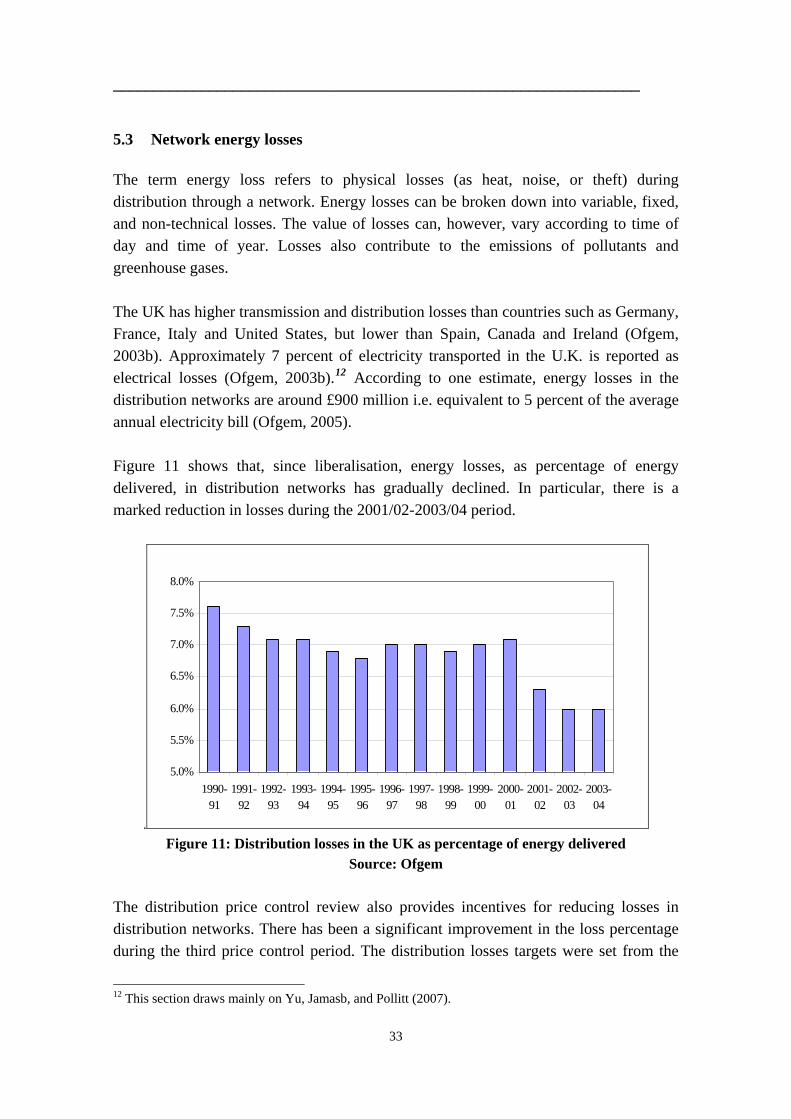
__________________________________________________________________ 5.3 Network energy losses The term energy loss refers to physical losses (as heat, noise, or theft) during distribution through a network. Energy losses can be broken down into variable, fixed, and non-technical losses. The value of losses can, however, vary according to time of day and time of year. Losses also contribute to the emissions of pollutants and greenhouse gases. The UK has higher transmission and distribution losses than countries such as Germany, France, Italy and United States, but lower than Spain, Canada and Ireland (Ofgem, 2003b). Approximately 7 percent of electricity transported in the U.K. is reported as electrical losses (Ofgem, 2003b).12 According to one estimate, energy losses in the distribution networks are around £900 million i.e. equivalent to 5 percent of the average annual electricity bill (Ofgem, 2005). Figure 11 shows that, since liberalisation, energy losses, as percentage of energy delivered, in distribution networks has gradually declined. In particular, there is a marked reduction in losses during the 2001/02-2003/04 period.
.
5.0%
5.5%
6.0%
6.5%
7.0%
7.5%
8.0%
1990-91
1991-92
1992-93
1993-94
1994-95
1995-96
1996-97
1997-98
1998-99
1999-00
2000-01
2001-02
2002-03
2003-04
..
Figure 11: Distribution losses in the UK as percentage of energy delivered
Source: Ofgem The distribution price control review also provides incentives for reducing losses in distribution networks. There has been a significant improvement in the loss percentage during the third price control period. The distribution losses targets were set from the
12 This section draws mainly on Yu, Jamasb, and Pollitt (2007).
33
__________________________________________________________________ first through to the second and third price control reviews (Ofgem, 1999b). Each DNO is evaluated based on a yardstick loss figure derived by taking total GWh losses for all firms and constructing a composite explanatory variable weighted on GWh (70%), transformer capacity (20%), and network length (10%). Financial penalties up to 0.25 percent of revenue are imposed on distribution firms if losses exceed the yardstick losses. Rewards are available for firms if the losses have decreased below yardstick levels (Ofgem, 1999b). Currently, an additional financial rewards and penalties of the incentive at 2.9 pence per kWh is applied to the difference between the actual and the target level of losses valued by the incentive rate in the first year. The reward and penalty falls in a straight line over ten years. Starting from the fourth price control period, for every kWh of loss reduction (increase), DNOs will be rewarded (penalized) at 4.8 pence per kWh (in 2004/05 prices). Losses targets are set between the ranges of 4.96% to 8.73% among DNOs (Ofgem, 2004b). The target level of losses is based on a proportion of units distributed and is fixed for five years. The fixed target would be based on past performance of the DNO, as measured by the average proportion of energy lost between 1994/95 and 2003/04. The rolling retention mechanism will be in place to ensure that DNOs receive full benefit of incremental improvements in performance for a period of 5 years. In many cases, DNOs will face conflicting incentives on losses, capital efficiency, operating efficiency, and quality of supply. For example, due to the location of system open points, the loss-related incentives can conflict with the quality of service incentives. Such conflict can also occur between Capex and losses where firms may prefer to invest in conventional transformers rather than low-loss transformers in order to reduce expenditures (Ofgem, 2003b). 5.4 Incentivising efficient new Investments As mentioned earlier, minimising the cost of network expansion and upgrade is a major issue for the regulators and benchmarking of new investment can be an increasingly important part of the price control process. The investment efficiency incentive scheme adopted by Ofgem as part of the 2005-2010 distribution price control review exhibits some flexibility for firms to perform better than their allowed and expected investment needs. This approach also enable the firms, when possible, to take the trade-offs with operating expenditures into consideration.
34
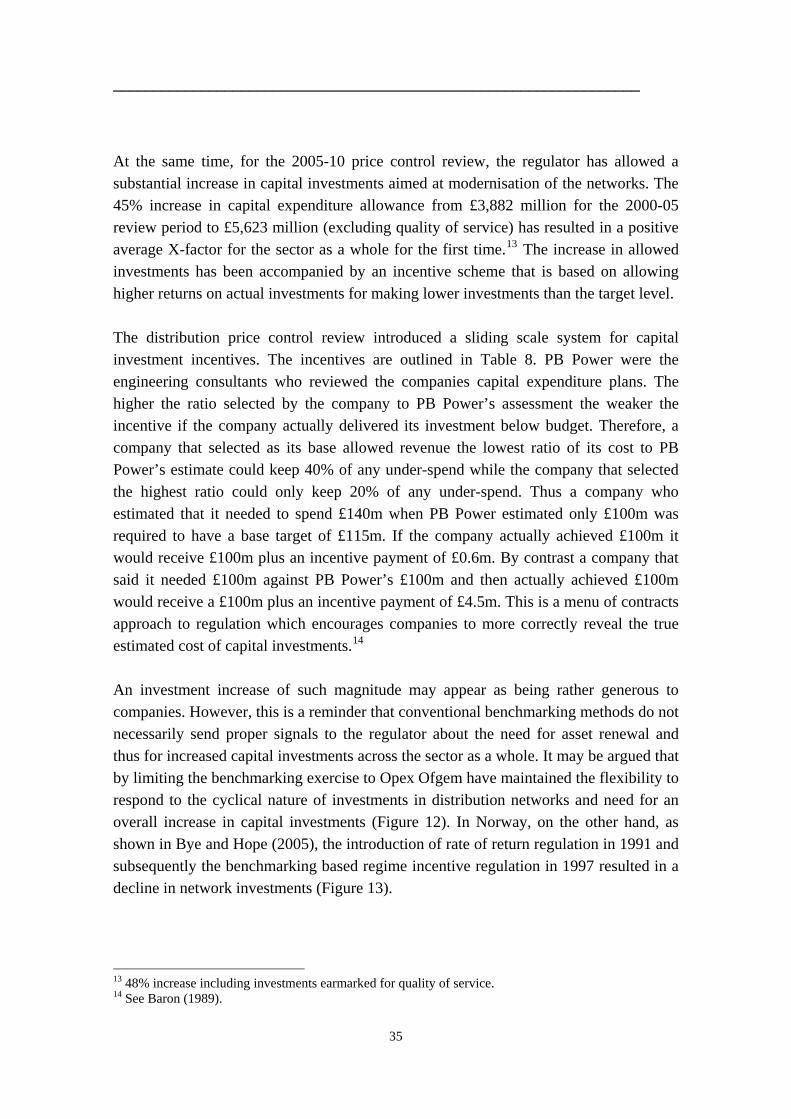
__________________________________________________________________
At the same time, for the 2005-10 price control review, the regulator has allowed a substantial increase in capital investments aimed at modernisation of the networks. The 45% increase in capital expenditure allowance from £3,882 million for the 2000-05 review period to £5,623 million (excluding quality of service) has resulted in a positive average X-factor for the sector as a whole for the first time.13 The increase in allowed investments has been accompanied by an incentive scheme that is based on allowing higher returns on actual investments for making lower investments than the target level. The distribution price control review introduced a sliding scale system for capital investment incentives. The incentives are outlined in Table 8. PB Power were the engineering consultants who reviewed the companies capital expenditure plans. The higher the ratio selected by the company to PB Power’s assessment the weaker the incentive if the company actually delivered its investment below budget. Therefore, a company that selected as its base allowed revenue the lowest ratio of its cost to PB Power’s estimate could keep 40% of any under-spend while the company that selected the highest ratio could only keep 20% of any under-spend. Thus a company who estimated that it needed to spend £140m when PB Power estimated only £100m was required to have a base target of £115m. If the company actually achieved £100m it would receive £100m plus an incentive payment of £0.6m. By contrast a company that said it needed £100m against PB Power’s £100m and then actually achieved £100m would receive a £100m plus an incentive payment of £4.5m. This is a menu of contracts approach to regulation which encourages companies to more correctly reveal the true estimated cost of capital investments.14
An investment increase of such magnitude may appear as being rather generous to companies. However, this is a reminder that conventional benchmarking methods do not necessarily send proper signals to the regulator about the need for asset renewal and thus for increased capital investments across the sector as a whole. It may be argued that by limiting the benchmarking exercise to Opex Ofgem have maintained the flexibility to respond to the cyclical nature of investments in distribution networks and need for an overall increase in capital investments (Figure 12). In Norway, on the other hand, as shown in Bye and Hope (2005), the introduction of rate of return regulation in 1991 and subsequently the benchmarking based regime incentive regulation in 1997 resulted in a decline in network investments (Figure 13).
13 48% increase including investments earmarked for quality of service. 14 See Baron (1989).
35
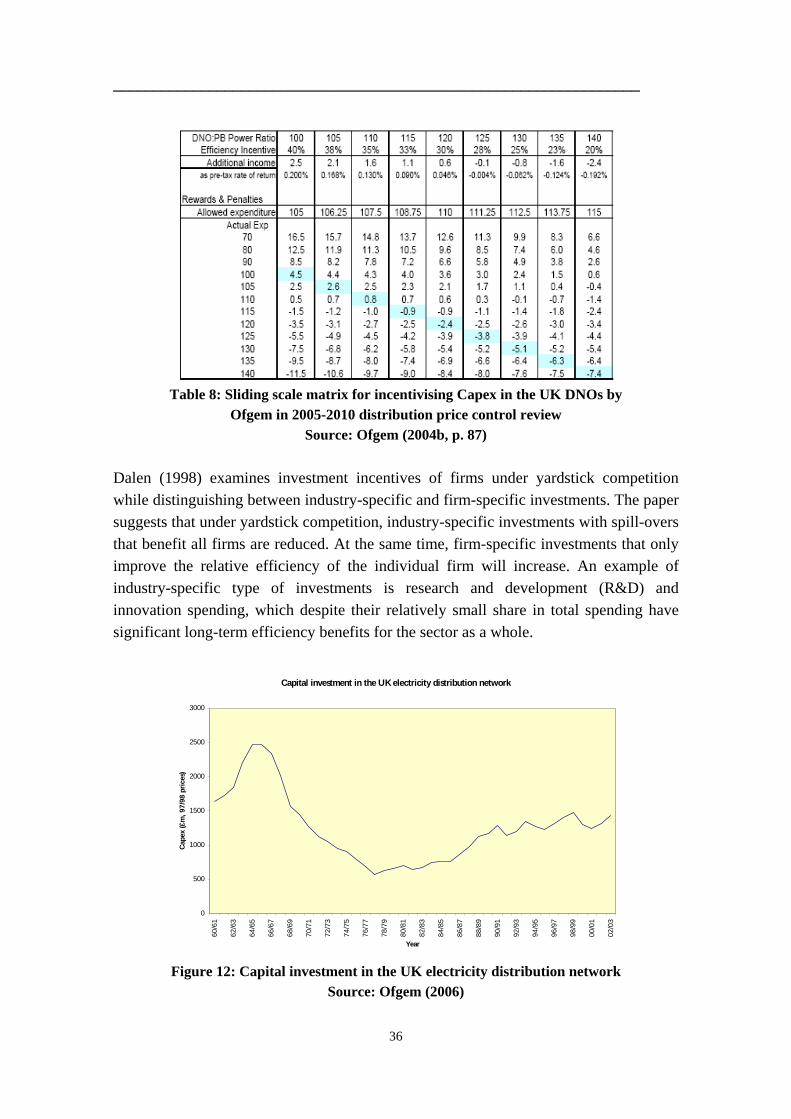
__________________________________________________________________
Table 8: Sliding scale matrix for incentivising Capex in the UK DNOs by
Ofgem in 2005-2010 distribution price control review Source: Ofgem (2004b, p. 87)
Dalen (1998) examines investment incentives of firms under yardstick competition while distinguishing between industry-specific and firm-specific investments. The paper suggests that under yardstick competition, industry-specific investments with spill-overs that benefit all firms are reduced. At the same time, firm-specific investments that only improve the relative efficiency of the individual firm will increase. An example of industry-specific type of investments is research and development (R&D) and innovation spending, which despite their relatively small share in total spending have significant long-term efficiency benefits for the sector as a whole.
Capital investment in the UK electricity distribution network
0
500
1000
1500
2000
2500
3000
60/6
1
62/6
3
64/6
5
66/6
7
68/6
9
70/7
1
72/7
3
74/7
5
76/7
7
78/7
9
80/8
1
82/8
3
84/8
5
86/8
7
88/8
9
90/9
1
92/9
3
94/9
5
96/9
7
98/9
9
00/0
1
02/0
3
Year
Cape
x (£
m, 9
7/98
pric
es)
Figure 12: Capital investment in the UK electricity distribution network
Source: Ofgem (2006)
36
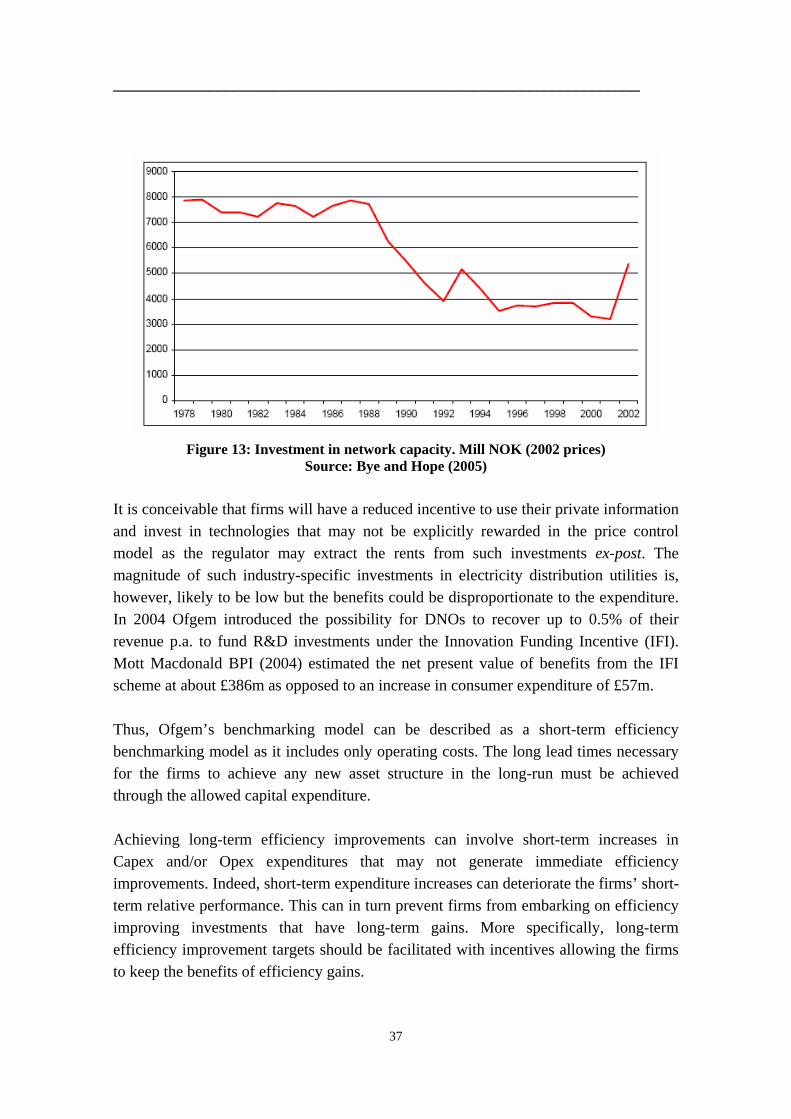
__________________________________________________________________
Figure 13: Investment in network capacity. Mill NOK (2002 prices)
Source: Bye and Hope (2005) It is conceivable that firms will have a reduced incentive to use their private information and invest in technologies that may not be explicitly rewarded in the price control model as the regulator may extract the rents from such investments ex-post. The magnitude of such industry-specific investments in electricity distribution utilities is, however, likely to be low but the benefits could be disproportionate to the expenditure. In 2004 Ofgem introduced the possibility for DNOs to recover up to 0.5% of their revenue p.a. to fund R&D investments under the Innovation Funding Incentive (IFI). Mott Macdonald BPI (2004) estimated the net present value of benefits from the IFI scheme at about £386m as opposed to an increase in consumer expenditure of £57m. Thus, Ofgem’s benchmarking model can be described as a short-term efficiency benchmarking model as it includes only operating costs. The long lead times necessary for the firms to achieve any new asset structure in the long-run must be achieved through the allowed capital expenditure. Achieving long-term efficiency improvements can involve short-term increases in Capex and/or Opex expenditures that may not generate immediate efficiency improvements. Indeed, short-term expenditure increases can deteriorate the firms’ short-term relative performance. This can in turn prevent firms from embarking on efficiency improving investments that have long-term gains. More specifically, long-term efficiency improvement targets should be facilitated with incentives allowing the firms to keep the benefits of efficiency gains.
37
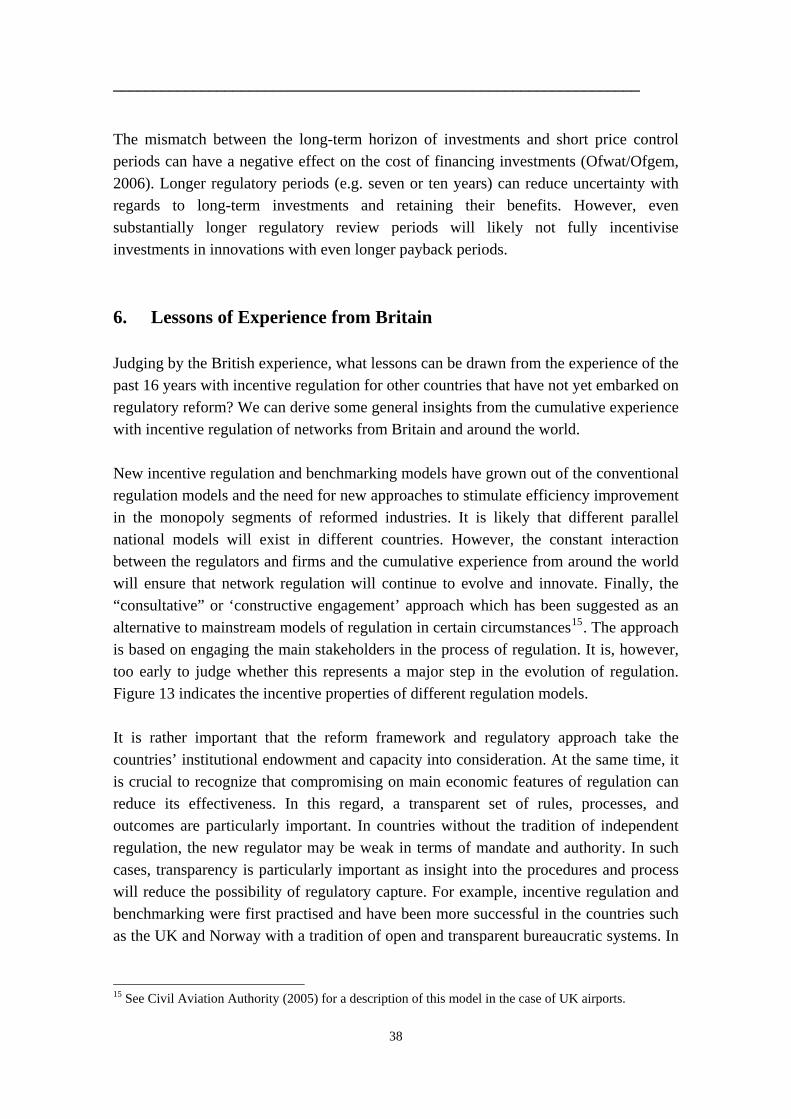
__________________________________________________________________
The mismatch between the long-term horizon of investments and short price control periods can have a negative effect on the cost of financing investments (Ofwat/Ofgem, 2006). Longer regulatory periods (e.g. seven or ten years) can reduce uncertainty with regards to long-term investments and retaining their benefits. However, even substantially longer regulatory review periods will likely not fully incentivise investments in innovations with even longer payback periods. 6. Lessons of Experience from Britain Judging by the British experience, what lessons can be drawn from the experience of the past 16 years with incentive regulation for other countries that have not yet embarked on regulatory reform? We can derive some general insights from the cumulative experience with incentive regulation of networks from Britain and around the world. New incentive regulation and benchmarking models have grown out of the conventional regulation models and the need for new approaches to stimulate efficiency improvement in the monopoly segments of reformed industries. It is likely that different parallel national models will exist in different countries. However, the constant interaction between the regulators and firms and the cumulative experience from around the world will ensure that network regulation will continue to evolve and innovate. Finally, the “consultative” or ‘constructive engagement’ approach which has been suggested as an alternative to mainstream models of regulation in certain circumstances15. The approach is based on engaging the main stakeholders in the process of regulation. It is, however, too early to judge whether this represents a major step in the evolution of regulation. Figure 13 indicates the incentive properties of different regulation models. It is rather important that the reform framework and regulatory approach take the countries’ institutional endowment and capacity into consideration. At the same time, it is crucial to recognize that compromising on main economic features of regulation can reduce its effectiveness. In this regard, a transparent set of rules, processes, and outcomes are particularly important. In countries without the tradition of independent regulation, the new regulator may be weak in terms of mandate and authority. In such cases, transparency is particularly important as insight into the procedures and process will reduce the possibility of regulatory capture. For example, incentive regulation and benchmarking were first practised and have been more successful in the countries such as the UK and Norway with a tradition of open and transparent bureaucratic systems. In
15 See Civil Aviation Authority (2005) for a description of this model in the case of UK airports.
38
__________________________________________________________________ the case of regulation this increases the checks and balances of the process and ensures a credible process which is crucial to any regulatory framework.
Figure 13: The evolution pattern of regulation
Source: Viljainen (2005) Network regulation can play a significant role in reducing the cost of electricity supply. In the UK the efficiency gains from incentive regulation of the distribution networks are at least comparable (in terms of relative share in final price) to those gained from competition in the wholesale markets. New Zealand, by contrast, where the reform failed to properly regulate the distribution companies saw the reform gains achieved in the generation sector captured by the distribution companies as higher profits (see Bertrand and Twaddle, 2006). As discussed in the previous sections, the British model of distribution network incentive regulation has brought about significant price reductions to the customers. Admittedly, in the initial years the companies made large profits which with the benefits of hindsight could have been avoided. This can partly be attributed to underestimation of the potential for efficiency improvement in the networks, the focus on implementing competition in generation and the price formulae set out by the government as part of the selling off the assets rather than to ineffectiveness of incentive regulation per se. As noted above, through the subsequent price control reviews, the British network regulation model has successfully: substantially reduced distribution access charges, maintained and improved quality of service, and ensured sufficient investments. A tough regime of operating expenditure benchmarking has meant that the benchmarked
39
__________________________________________________________________ share of total revenues has consistently been reduced. This has focussed regulation on dealing effectively with the persistent question of investment adequacy and the long-term reliability of the networks. The question of how to correctly incentivise new investments, especially as these become more significant due to replacement cycles and the demands of new distributed/renewable generation, emerges as an important challenge to both incentive regulation approach and benchmarking. Although the fragmented regulation and benchmarking approach consisting of the benchmarking of operating expenditures, the review of capital investment plans, and penalty/reward schemes for quality of service and network energy losses do not strictly conform to an ideal integrated theoretical framework, this approach has performed well and has given the regulator flexibility to address and incentivise specific aspects of network regulation. As noted in Jamasb and Pollitt (2005), the process of liberalisation towards the internal electricity market in the European Union is currently the only cross-country broad reform process in progress. Although the pace of the EU-wide reform has been slow, the centralised initiatives and the Electricity Directives have managed to maintain some momentum in the process. In the absence of EU-led initiatives, many member countries would have undertaken considerably less progressive reform measures. For example, Switzerland by the virtue of not being a member of the EU has not been obliged to take part in the liberalisation of the European electricity sector liberalisation. In the absence of external pressure from the EU, the domestic support has not been sufficiently strong to press forward a reform agenda. But does this mean that countries like Switzerland have foregone improvement in terms of the efficiency of the sector or economic competitiveness? The answer may lie partly in the current efficiency level of the sector and partly in the potential for improvement in the sector. The latter must be carefully viewed within the backdrop of institutional factors that may constraint implementation of a workable reform. A partially implemented reform can indeed be less desirable than a non-reformed sector. The history of the British electricity distribution networks shows that the past nationalisation harmonized the technical standards and reduced the number of networks over time making some potential economies of scale available. This facilitated the subsequent privatisation and introduction of incentive regulation in the UK. The following more specific insights from the electricity distribution sector reform in Britain and elsewhere offer several insights and lessons of experience for other
40
__________________________________________________________________
countries at earlier stages of reform in general and incentive regulation of networks in particular.
• Incentive regulation and the wider reform - In the implementation of incentive regulation for the distribution networks, it is not necessary to introduce the reform steps in the same order as in the British case. Contrary to common practice worldwide, it is not imperative to implement incentive regulation of distribution networks at the same time as or after introducing competition in the wholesale and retail markets. A crucial role of the distribution system in reforms is to provide regulated third-party access for wholesale and retail market competition over the networks. However, access to networks is an entirely different matter from incentive regulation of them. Neither is privatisation a prerequisite for implementing incentive regulation as the publicly owned Norwegian and Dutch electricity distribution networks illustrate. It may, however, be useful to distinguish between local and municipal ownership on the one hand and state ownership on the other as the latter may be less efficient. It then follows that, if the introduction of competition is not feasible or desirable, there is no reason for not considering incentive regulation of the networks on its own merits. Likewise, lack of willingness or support for privatisation of networks should not be an obstacle for incentive regulation of this.16
• Reform policy - A recent OECD report on regulatory reform in Switzerland
states that “An evolutionary process is underway, partly in anticipation of market opening, toward consolidation, partnership and cooperation, and sale of public equity.” (OECD, 2005, p.126). There is reason to believe that ad hoc and unsupervised structural and positioning in advance and anticipation of the actual reform are not only unhelpful but are also likely to constrain and complicate the implementation of a future reform and the tasks of the regulator. Any restructuring or reorganisation with a view to a reform should ideally take place under the oversight of an independent sector regulator (although this was not the case in Britain) and as part of a coherent reform agenda. The British reform benefited greatly from initially having 14 independent, roughly comparable, DNOs to regulate. Such early developments can create new vested interests and put in place ineffective structures that regulation cannot easily alter or correct
16 The case of incentive regulation of municipal and county owned utilities in Nordic countries is testimony to this. However the consequences of applying incentive regulation – designed for profit maximising private companies - to locally/publicly owned companies may need to be better understood. See Magnus (2000) for a discussion of the case of introduction of incentive regulation for locally owned utilities in Norway.
41
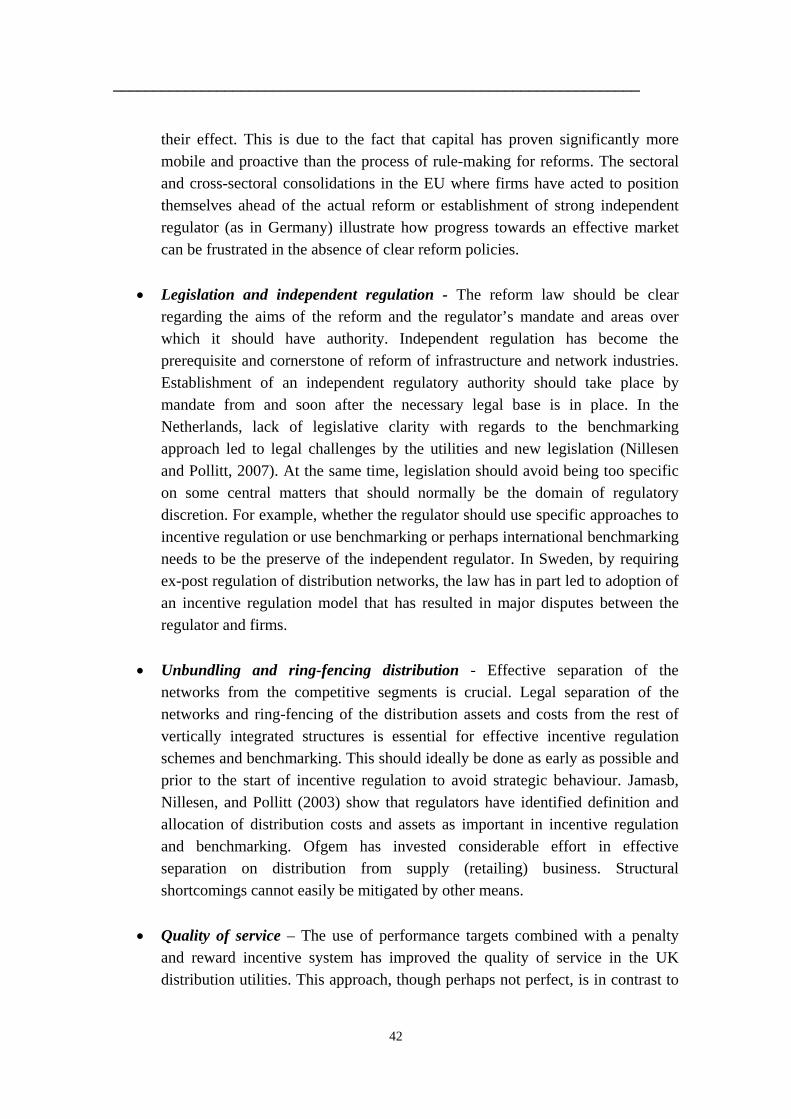
__________________________________________________________________
rds an effective market can be frustrated in the absence of clear reform policies.
•
on model that has resulted in major disputes between the regulator and firms.
•
business. Structural shortcomings cannot easily be mitigated by other means.
•
distribution utilities. This approach, though perhaps not perfect, is in contrast to
their effect. This is due to the fact that capital has proven significantly more mobile and proactive than the process of rule-making for reforms. The sectoral and cross-sectoral consolidations in the EU where firms have acted to position themselves ahead of the actual reform or establishment of strong independent regulator (as in Germany) illustrate how progress towa
Legislation and independent regulation - The reform law should be clear regarding the aims of the reform and the regulator’s mandate and areas over which it should have authority. Independent regulation has become the prerequisite and cornerstone of reform of infrastructure and network industries. Establishment of an independent regulatory authority should take place by mandate from and soon after the necessary legal base is in place. In the Netherlands, lack of legislative clarity with regards to the benchmarking approach led to legal challenges by the utilities and new legislation (Nillesen and Pollitt, 2007). At the same time, legislation should avoid being too specific on some central matters that should normally be the domain of regulatory discretion. For example, whether the regulator should use specific approaches to incentive regulation or use benchmarking or perhaps international benchmarking needs to be the preserve of the independent regulator. In Sweden, by requiring ex-post regulation of distribution networks, the law has in part led to adoption of an incentive regulati
Unbundling and ring-fencing distribution - Effective separation of the networks from the competitive segments is crucial. Legal separation of the networks and ring-fencing of the distribution assets and costs from the rest of vertically integrated structures is essential for effective incentive regulation schemes and benchmarking. This should ideally be done as early as possible and prior to the start of incentive regulation to avoid strategic behaviour. Jamasb, Nillesen, and Pollitt (2003) show that regulators have identified definition and allocation of distribution costs and assets as important in incentive regulation and benchmarking. Ofgem has invested considerable effort in effective separation on distribution from supply (retailing)
Quality of service – The use of performance targets combined with a penalty and reward incentive system has improved the quality of service in the UK
42
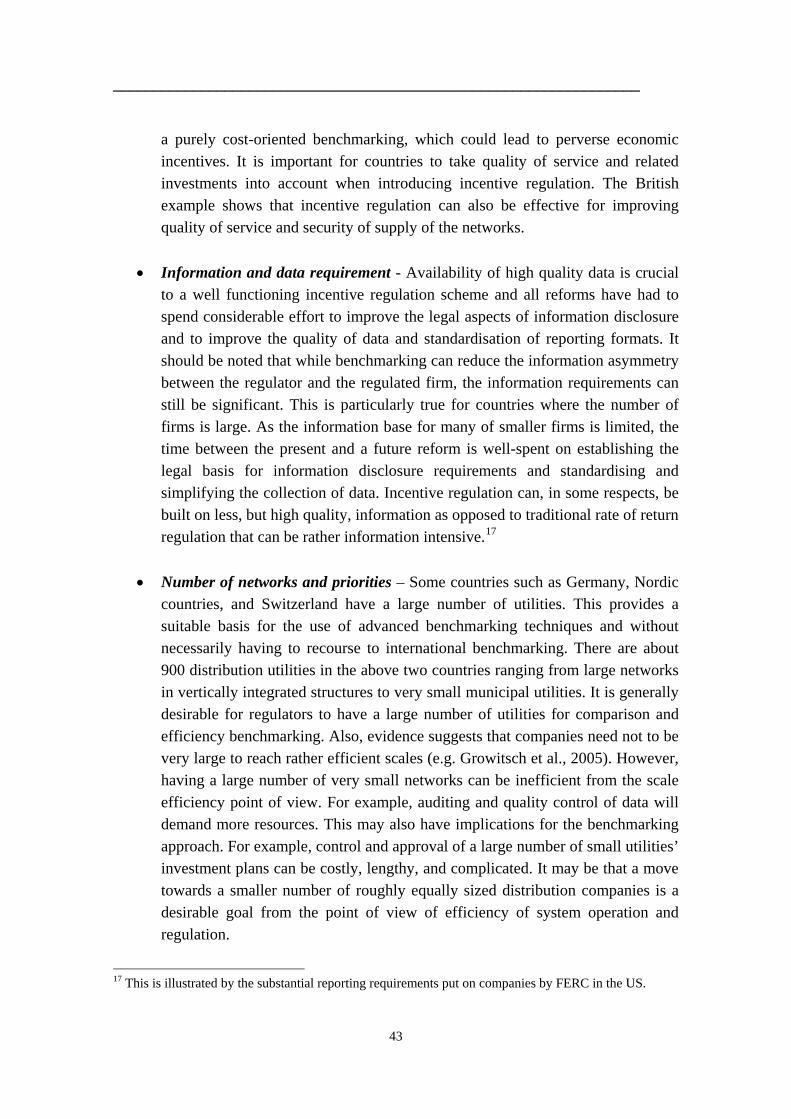
__________________________________________________________________
a purely cost-oriented benchmarking, which could lead to perverse economic incentives. It is important for countries to take quality of service and related investments into account when introducing incentive regulation. The British example shows that incentive regulation can also be effective for improving quality of service and security of supply of the networks.
• Information and data requirement - Availability of high quality data is crucial
to a well functioning incentive regulation scheme and all reforms have had to spend considerable effort to improve the legal aspects of information disclosure and to improve the quality of data and standardisation of reporting formats. It should be noted that while benchmarking can reduce the information asymmetry between the regulator and the regulated firm, the information requirements can still be significant. This is particularly true for countries where the number of firms is large. As the information base for many of smaller firms is limited, the time between the present and a future reform is well-spent on establishing the legal basis for information disclosure requirements and standardising and simplifying the collection of data. Incentive regulation can, in some respects, be built on less, but high quality, information as opposed to traditional rate of return regulation that can be rather information intensive.17
• Number of networks and priorities – Some countries such as Germany, Nordic
countries, and Switzerland have a large number of utilities. This provides a suitable basis for the use of advanced benchmarking techniques and without necessarily having to recourse to international benchmarking. There are about 900 distribution utilities in the above two countries ranging from large networks in vertically integrated structures to very small municipal utilities. It is generally desirable for regulators to have a large number of utilities for comparison and efficiency benchmarking. Also, evidence suggests that companies need not to be very large to reach rather efficient scales (e.g. Growitsch et al., 2005). However, having a large number of very small networks can be inefficient from the scale efficiency point of view. For example, auditing and quality control of data will demand more resources. This may also have implications for the benchmarking approach. For example, control and approval of a large number of small utilities’ investment plans can be costly, lengthy, and complicated. It may be that a move towards a smaller number of roughly equally sized distribution companies is a desirable goal from the point of view of efficiency of system operation and regulation.
17 This is illustrated by the substantial reporting requirements put on companies by FERC in the US.
43
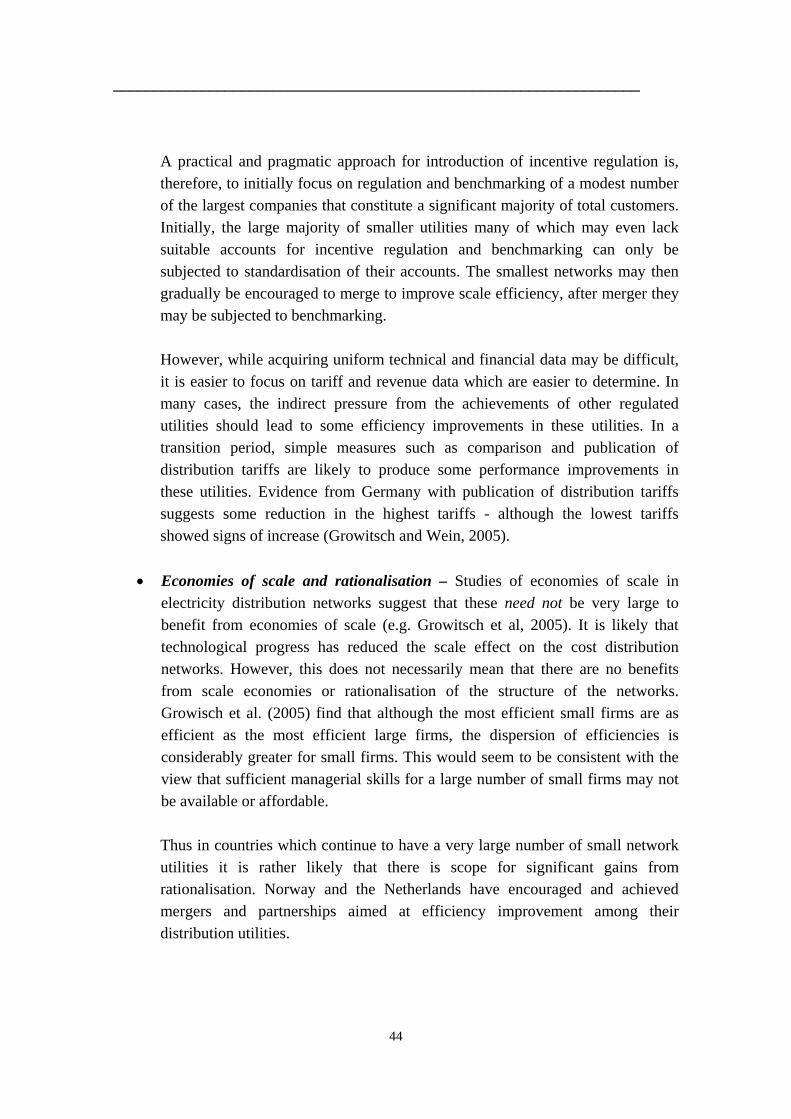
__________________________________________________________________
A practical and pragmatic approach for introduction of incentive regulation is, therefore, to initially focus on regulation and benchmarking of a modest number of the largest companies that constitute a significant majority of total customers. Initially, the large majority of smaller utilities many of which may even lack suitable accounts for incentive regulation and benchmarking can only be subjected to standardisation of their accounts. The smallest networks may then gradually be encouraged to merge to improve scale efficiency, after merger they may be subjected to benchmarking.
However, while acquiring uniform technical and financial data may be difficult, it is easier to focus on tariff and revenue data which are easier to determine. In many cases, the indirect pressure from the achievements of other regulated utilities should lead to some efficiency improvements in these utilities. In a transition period, simple measures such as comparison and publication of distribution tariffs are likely to produce some performance improvements in these utilities. Evidence from Germany with publication of distribution tariffs suggests some reduction in the highest tariffs - although the lowest tariffs showed signs of increase (Growitsch and Wein, 2005).
• Economies of scale and rationalisation – Studies of economies of scale in
electricity distribution networks suggest that these need not be very large to benefit from economies of scale (e.g. Growitsch et al, 2005). It is likely that technological progress has reduced the scale effect on the cost distribution networks. However, this does not necessarily mean that there are no benefits from scale economies or rationalisation of the structure of the networks. Growisch et al. (2005) find that although the most efficient small firms are as efficient as the most efficient large firms, the dispersion of efficiencies is considerably greater for small firms. This would seem to be consistent with the view that sufficient managerial skills for a large number of small firms may not be available or affordable.
Thus in countries which continue to have a very large number of small network utilities it is rather likely that there is scope for significant gains from rationalisation. Norway and the Netherlands have encouraged and achieved mergers and partnerships aimed at efficiency improvement among their distribution utilities.
44
__________________________________________________________________ Postscript: Electricity network regulation in the Future In closing, we note the impact of future innovation on network regulation. Technological progress has in the past and will continue in the future to transform the nature and economics of networks. It is therefore very important that any regulatory framework will provide the right incentives for innovation and adoption of new technologies in the networks. It is also important that the regulatory system is flexible. The UK system of regulation has performed well from 1990 to 2006. However it will need to evolve in the face of new technology and the challenge of demands from electricity consumers and producers for cleaner and more decentralised production (see Jamasb, Nuttall and Pollitt, 2006). Thus an important question is whether the UK regulation model provides the necessary incentives for innovation and accommodates the “active networks” of future with renewables, distributed generation, micro-generation, and active demand. Micro-generation units installed by households, industrial CHP, decentralised renewable generation sources will impose new challenges on networks. This implies that European electricity regulators should take into account the power and long-term effects of incentive schemes in influencing the features and behaviour of regulated firms. In responding to the choice of benchmarking models and target variables firms are led to follow a certain path. This can mean a narrow focus on a limited number of strategic variables. Regulatory models will therefore need to be reviewed and evolve constantly to meet the needs of future networks.
45
__________________________________________________________________ References Abdala, M.A. (2001). Institutions, Contracts and Regulation of Infrastructure in
Argentina, Journal of Applied Economics, Vol. IV (2), 217–254. Ajodhia, V. and Hakvoort, R. (2005). Economic Regulation of Quality in Electricity
Distribution Networks, Utilities Policy, Vol. 13, No. 3, 211-221. Averch, H. and Johnson, L. L. (1962). Behaviour of the Firm under Regulatory
Constraint, American Economic Review, 52 (December), 1052-1069. Baron, D. P. (1989). Design of Regulatory Mechanisms and Institutions, in
Schmalensee, R. and Willig R. D. (eds.), Handbook of Industrial Organization, Amsterdam: North-Holland.
Basañes, C.F., Saavedra, E., Soto, R. (1999). Post- Privatization Renegotiation and
Disputes in Chile. Infrastructure and Financial Markets Division, Sustainable Development Department, Inter-American Development Bank, Washington, D.C.
Benavides, J., Fainboim, I. (1999). Private Participation in Infrastructure in Colombia:
Renegotiations and Disputes. Infrastructure and Financial Markets Division, Sustainable Development Department, Inter-American Development Bank, Washington, D.C.
Bertrand, G. and Twaddle, D. (2005). Price-Cost Margins and Profit Rates in New
Zealand Electricity Distribution Networks Since 1994: The Cost of Light Handed Regulation, Journal of Regulatory Economics; Vol. 27:3 281–307.
Bliss, B. (1954). Nationalisation in France and Great Britain of the Electricity Supply
Industry, International and Comparative Law Quarterly, Vol. 8, April, 277-290. Brower, M., Thomas, S., and Mitchell, C. M. (1997). Lessons from the British
Restructuring Experience, The Electricity Journal, April, 40-51. Burns, P. and Weyman-Jones, T. G. (1994). Regulatory Incentives, Privatisation and
Productivity Growth in UK Electricity Distribution’, CRI Technical Paper No. 1, London: CIPFA.
46
__________________________________________________________________ Burns, P. and Weyman-Jones, T. G. (1996). Cost Functions and Cost Efficiency in
Electricity Distribution: A Stochastic Frontier Approach, Bulletin of Economic Research, Vol. 48:1, 41-64.
Bye, T. and Hope, E. (2005). Deregulation of Electricity Markets – The Norwegian
Experience, Discussion Paper No. 433, Research Department, Statistics Norway, September.
Byatt, I. C. R. (1979). The British Electrical Industry 1875-1914: The Economic
Returns to a New Technology, Clarendon Pres: Oxford. Chessire, J. (1996). UK Electricity Supply under Public Ownership, in Surrey, J., The
British Electricity Experiment – Privatization: The Record, the Issues, the Lessons, Earthscan: London.
Chick, M. (1995). The Political Economy of Nationalisation: The Electricity Industry,
in The Political Economy of Nationalisation in Britain 1920-1950, Milward, R. and Singleton, J. (eds.), Cambridge University Press, Cambridge.
Civil Aviation Authority (2005). Airport Regulation – the process for constructive
engagement, Civil Aviation Authority: London. CPB (2004). Better Safe Than Sorry? - Reliability Policy in Network Industries,
Netherlands Bureau for Economic Policy Analysis, No. 73, December. Dalen, D. M. (2006). Presentation at the International Scientific Conference of the
Bundesnetagentur (BnetsA) on Incentive Regulation in the German Electricity and Gas Sector, Bonn/Bad Godesberg, 25-26 April.
Dalen, D. M. (1998). Yardstick Competition and Investment Incentives, Journal of
Economics and Management Strategy, Vol. 7, No. 1, Spring, 105-1026. De Oliveira, R. G. and Tolmasquim, M. T. (2004). Regulatory Performance Analysis
Case Study: Britain’s Electricity Industry, Energy Policy, Vol. 32, 1261-1276. Di Tella, R., Dyck, I.J.A. (2002). Cost Reductions, Cost Padding and Stock Market
Prices: The Chilean Experience with Price Cap Regulation, Harvard NOM Working Paper 03-22; HBS Working Paper 03-050.
47
__________________________________________________________________ Domah, P. and Pollitt, M. (2001). The Restructuring and Privatisation of Electricity
Distribution and Supply Businesses in England and Wales: A Social Cost-Benefit Analysis, Fiscal Studies, Vol. 22, No. 1, 107-146.
Electricity Consumers’ Council (1982), Annual Report and Accounts, London:
Electricity Consumers’ Council. Estache, A., Guasch, J.L., and Trujillo, L. (2003). Price Caps, Efficiency Payoffs and
Infrastructure Contract Renegotiation in Latin America, Policy Research Working Paper 3129, World Bank, Washington, D.C.
European Commission (2005). Report on Progress in Creating the Internal Gas and
Electricity Market, Technical Annex to the Report from the Commission to the Council and the European Parliament, Commission Staff Working Document SEC(2005) XXXX, Commission of the European Communities, Brussels.
Fouquest, R. and Pearson, P. J. G. (2006). Seven Centuries of Energy Services: The
Price and Use of Light in the United kingdom (1300-2000), The Energy Journal, Vol. 27(1), 139-177.
Frontier Economics (2003). Developing Monopoly Price Controls, Workstream B,
Balancing Incentives. A final report prepared for Ofgem, Standard project document, London, March.
Giannakis, D., Jamasb, T., and Pollitt, M. (2005). Benchmarking and Incentive
Regulation of Quality of Service: An Application to the UK Electricity Distribution Networks, Energy Policy, Vol. 33, Issue 17, November, 2256-2271.
Growitsch, C., Jamasb, T. and Pollitt, M. (2005). Quality of Service, Efficiency and
Scale in Network Industries: An analysis of European electricity distribution, Electricity Policy Research Group Working Paper No.05/04.
Growitsch, C. and Wein, T. (2005). Negotiated Third Party Access – An Industrial
Organisation Perspective, European Journal of Law and Economics, Vol. 20, 165-183.
Guasch, J. L. (2003). Infrastructure Concessions in Latin America and the Caribbean:
The Renegotiation Issue and Its Determinants, Infrastructure and Financial Markets Review 9(2), June, Sustainable Development Department, Infrastructure
48
__________________________________________________________________
and Financial Markets Division, Inter-American Development Bank, Washington, D.C.
Guasch, J.L. (2004). Granting and Renegotiating Infrastructure Concessions. World
Bank Development Studies Series, World Bank, Washington, D.C. Hammond, C. J., Jones, G., and Robinson, T. (2002). Technical Efficiency under
Alternative Regulatory Regimes: Evidence from the Inter-war British Gas Industry, Journal of Regulatory Economics, Vol. 22:3, 251-270.
Hattori, T., Jamasb, T., and Pollitt, M. (2005). Electricity Distribution in the UK and
Japan: A Comparative Efficiency Analysis 1985-1998, The Energy Journal, Vol. 26, Issue 2, 23-47.
Heggset, J., Kjølle, G. H., Trengereid, F., and Ween, F. (2001). Quality of Supply in the
Deregulated Norwegian Power System. IEEE Porto Powertech 2001, Porto, September.
Helm, D. (2003). Energy, the State, and the Market: British Energy Policy Since 1979,
Oxford University Press: Oxford. Henney, A. (1994). A Study of the Privatisation of the Electricity Supply Industry in
England & Wales, EEE: London. House of Commons (1882). Bill to facilitate and regulate supply of Electricity for
Lighting in Great Britain and Ireland: As amended by Select Committee, 1882 (200), House of Commons, London.
Jamasb, T., Nillesen, P., and Pollitt, M. (2004). Strategic Behaviour under Regulatory
Benchmarking, Energy Economics, Volume 26, 825-843.
Jamasb, T., Nillesen, P., and Pollitt, M. (2003). Gaming the Regulator: A Survey, The Electricity Journal, Vol. 16, Issue 10, December, 68-80.
Jamasb, T., Nuttall, W. J., and Pollitt, M. (2006). Future Electricity Technologies and
Systems, Cambridge University Press: Cambridge. Jamasb, T., Mota, R., Newbery, D., Pollitt, M. (2004). Performance of Electricity Sector
Reforms: A Survey of Practice and Evidence, Cambridge Working Papers in
49
__________________________________________________________________
Economics CWPE0439, CMI Electricity Project CMI EP 47, Department of Applied Economics, University of Cambridge.
Jamasb, T. and Pollitt, M. (2005). Electricity Market Reform in the European Union:
Review of Progress toward Liberalisation & Integration, The Energy Journal, Vol. 26, Special Issue, 11-41.
Joskow, P. L. (1998). Electricity Sectors in Transition, The Energy Journal, Vol. 19,
No. 2, 25-55. Joskow, P.J., Schmalensee, R. (1986). Incentive Regulation for Electric Utilities, Yale
Journal on Regulation, Vol. 4, No. 1, 1–49. Langset, T., Trengereid, F., Samdal, K., and Heggset, J. (2001). Quality Dependent
Revenue Caps — A Model for Quality of Supply. CIRED 2001, June, Amsterdam.
Littlechild, S (2000) ‘Privatization, Competition, and Regulation in the British
Electricity Industry, With implications for Developing Countries’ Energy Sector Management Assistance Program (ESMAP), February, World Bank
MacKerron, G. and Watson, J. (1996). The Winners and Losers So Far, in Surrey, J.,
The British Electricity Experiment: Privatisation, the Record, the Issues, Earthscan Publications Ltd.: London.
Magnus, E. (2000). Owner Attitudes and Public-company Behaviour in a Restructured
Electricity Sector, in Magnus, E. and Midttun, A. (Eds.), Electricity Market Reform in Norway, MacMillan Press: London.
Millward, R. and Singleton, J., Eds. (1995). The Electricity Industry, in The Political
Economy of Nationalisation in Britain 1920-1950, Cambridge University Press, Cambridge.
MMC (1995). Scottish Hydro-Electric plc: a Report on a Reference under Section 12 of
the Electricity Act 1989. Monopolies and Mergers Commission, London. MMC (1997). Northern Ireland Electricity Plc: A Report on a Reference under Article
15 of the Electricity (Northern Ireland) Order 1992. Monopolies and Mergers Commission, London.
50
__________________________________________________________________ Mota, R.L. (2004). Comparing Brazil and USA Electricity Distribution Performance:
What Was the Impact of Privatisation? Cambridge Working Papers in Economics CWPE 0423, Department of Applied Economics, University of Cambridge.
Mott Macdonald BPI (2004). Innovation in Electricity Distribution Networks, Final
Report, Brighton: Mott Macdonald BPI. Newbery, D.M. (2002). Issues and Options for Restructuring Electricity Supply
Industries CMI Working Paper CMI EP 01, DAE Working Paper WP 0210, Department of Applied Economics, University of Cambridge.
Newbery, D. M. (1999). Privatization, Restructuring, and Regulation of Network
Industries, The MIT Press: Cambridge, Mass. Nillesen, P.L. and Pollitt, M.G. (2007). The Consequences for Consumer Welfare of the
2001-2003 Electricity Distribution Price Review in The Netherlands, Journal of Regulatory Economics (forthcoming).
OECD (2005). Regulatory Reform in Switzerland: Seizing the Opportunities for
Growth, SG/SGR(2005)5, Special Group on Regulatory Policy, General Secretariat, November, Organisation for Economic Co-operation and Development, Paris.
Offer (1994). The Distribution Price Control: Proposals, Office of Electricity
Regulation, Birmingham. Ofgem (2006). Our Energy Challenge: Ofgem’s Response, Office of Gas and Electricity
Markets, May, London. Ofgem (2005). 2004/05 Electricity Distribution Quality of Service Report, Office
of Gas and Electricity Markets, November, London. Ofgem (2004a). Consumer Expectations of DNOs and WTP for Improvements in
Service (June 2004), 145f/04, Report prepared by Accent Marketing & Research for the Office of Gas and Electricity Markets, London.
Ofgem (2004b), Electricity Distribution Price Control Review, Final Proposals, 265/04,
November, Office of Gas Electricity Markets, London.
51
__________________________________________________________________ Ofgem (2003a). Developing Monopoly Price Controls. Update Document, Consultation
Document, February, Office of Gas and Electricity Markets, London. Ofgem (2003b). Background Study on the Use of Benchmarking to Assess Efficiency
for the 2005 Distribution Price Control. Prepared by Cambridge Economic Policy Associates (CEPA) for the Office of Gas and Electricity Markets, 109/03, September, London.
Ofgem (2001). Information and Incentives Project, Incentive Schemes. Final Proposals,
Decision Document, December, Office of Gas and Electricity Markets, London. Ofgem (2000). Information and Incentives Project, Output Measures and Monitoring
Delivery between Reviews. Final Proposals, Consultation Document, September, Office of Gas and Electricity Markets, London.
Ofgem (1999a). Review of Public Electricity Suppliers 1998–2000. Distribution Price
Control Review, Initial proposals, Consultation Document, October, Office of Gas and Electricity Markets, London.
Ofgem (1999b). Reviews of Public Electricity Suppliers 1998 to 2000. Distribution
Price Control Review, Final Proposals, Consultation Document, December, Office of Gas and Electricity Markets, London.
Ofgem (1999c). Electricity Distribution Licences: Initial Proposals on Standard
Conditions for the Financial ‘Ringfence’, A Consultation paper, Office of Gas and Electricity Markets, London
Ofwat/Ofgem (2006). Financing Networks: A Discussion Paper, Office of Water
Regulation/Office of Gas and Electricity Markets, February, London. Pollitt, M. (1995). Ownership and Performance in Electric Utilities. Oxford: Oxford
University Press. Pollitt, M. (2005). The Role of Efficiency Estimates in Regulatory Price Reviews:
Ofgem’s Approach to Benchmarking Electricity Networks, Utilities Policy, Vol.13, No.4, 279-288.
Pryke, R. (1981). The Nationalised Industries: Policies and Performance Since 1968,
Martin Robinson: Oxford.
52
__________________________________________________________________ Sappington, D. E. M. (2005). Regulating Service Quality: A Survey, Journal of
Regulatory Economics, Vol. 27, Issue 22, 123-154. Schmidt, M. R. (2000). Performance-Based Ratemaking: Theory and Practice, Public
Utilities Reports, Inc., Vienna, Virginia. Secretary of State for Energy (1988). Privatising Electricity: The Government’s
Proposal for the Privatisation of the Electricity Supply Industry in England and Wales, Cm 322, HMSO, London
Shleifer, A. (1985). A Theory of Yardstick Competition, Rand Journal of Economics,
Vol. 16, 319-327. Tangerås, T. P. (2003). Yardstick Competition and Quality, Swedish Network for
European Studies in Economics and Business, Discussion paper, April. Weblink: http://www.snee.org/filer/papers/205.pdf
Ter-Martirosyan, A. (2003). The Effects of Incentive Regulation on Quality of Service
in Electricity Markets. Department of Economics, George Washington University, Working Paper, March.
Thomas, S. (2004). Evaluating the British Model of Electricity Deregulation. Annals of
Public and Cooperative Economics, Vol. 75, No. 3, 367–398. Vickers, J. and Yarrow, G. (1993). Privatization: An Economic Assessment, The MIT
Press: Cambridge, Mass. Viljainen, S. (2005). Regulation Design in the Electricity Distribution Sector- Theory
and Practice, PhD Thesis, Lappeenranta University of Technology. Waddams Price, C., Brigham, B., and Fitzgerald, L. (2002). Service quality in
Regulated Monopolies, Working Paper CCR 02-4, August, Centre for Competition and Regulation, University of East Anglia.
Yarrow, G. (1992). British Electricity Prices Since Privatisation, Regulatory Policy
Institute, Studies in Regulation, Paper No. 1, Oxford.
53

__________________________________________________________________ Yu, W., Jamasb, T. and Pollitt, M. (2007). Incorporating the Price of Quality into
Benchmarking UK electricity Distribution (forthcoming). Zhang, Y.F., Parker, D., Kirkpatrick, C. (2002). Electricity Sector Reform in
Developing Countries: An Econometric Assessment of the Effects of Privatisation, Competition and Regulation, Working Paper 31, Centre on Regulation and Competition, Institute for Development Policy and Management, University of Manchester.
54
Engineering Staff College of India Page No. D.1
ANNEXURE - D
Emergent Regulatory Governance in India: Comparative Case Studies of Electricity Regulation
Paper Presented at a Conference on “Frontiers of Regulation: Assessing Scholarly Debates and Policy
Challenges” September 7-8, 2006, University of Bath, UK.
Navroz K. Dubash ([email protected]) Narasimha Rao ([email protected])
Abstract This paper maps out the contours of an emergent politics of regulation in India by looking at the case of electricity regulation in two states. Electricity regulation was introduced through the intervention of donor agencies as part of a larger package of reforms. Following two faltering efforts at privatization, regulation has morphed from a means of signalling credibility to investors to being an institutional check on state authority, even under continued state ownership of utilities. The paper describes this national political context for the introduction of electricity regulation before considering two detailed case studies in the states of Andhra Pradesh and Delhi. We draw on Hancher and Moran's device of “regulatory space” to understand the forces that shape the structure and functioning of regulation. For each case, we examine the political context for introduction of regulation, the factors shaping the regulator's internal institutional form, regulatory practice with attention to interaction between regulator, state and utility, and the potential for new forms of regulatory governance. The paper highlights the extent to which regulation has been re-absorbed into the larger political and bureaucratic process, largely contrary to the hopes of its designers. However, the cases also show how procedures for transparency and participation are being evoked and productively used by a range of stakeholders. We discuss the implications of these developments for regulatory legitimacy and effectiveness, and the emergence of regulators as new embryonic democratic spaces. The paper concludes with some broader themes from the India case of relevance to the empirical study of regulation in other developing countries. Introduction Independent regulatory agencies have entered India through the back-door, little remarked upon and even less understood. Proponents of regulatory bodies – notably donor agencies – view the mechanism as a way to insulate politics from decision making. Insiders to Indian government and administration, notably including some regulators and regulated, dismiss regulatory bodies as one more layer of government, barely distinguishable from preceding layers. In this paper, we suggest that regulation in India has certainly not fulfilled the naïve expectations of the designers, but that it has led to a process of re-making governance in India, opening doors to the construction of regulation as a new democratic space. Our aim in this paper is to map out the contours of an emergent politics of regulation in India by looking at the case of electricity regulation.
Engineering Staff College of India Page No. D.2
By looking at India we also intend to contribute to what is currently a very thin literature on regulation in practice in the developing world, with the possible exception of Latin America. There are good reasons to believe that regulation in developing countries will have distinct features from that in either the United States, or the emergent regulatory state in Europe. Common features that shape regulatory outcomes in developing countries include the greater presence and authority of external actors, particularly donors, as vectors of policy transfer, the importance of consultants as knowledge carriers and as implementers, the overbearing but paradoxically also weak state, and the propensity for thin state legitimacy. From a practical perspective, states in the developing world are self-consciously re-orienting themselves toward forms of steering over ownership, without much reflection on whether and how this shift changes the nature of politics and concerns of democratic legitimacy and accountability. In the conclusion we reflect on some of these broader concerns that relate to regulation in the developing world. Our point of entry to regulation in India is the electricity sector. As a leading concern of economic reformers for over a decade, electricity is a good example of efforts to re-make a state-owned and controlled sector around the new vision of private ownership and arms-length regulation. In addition, electricity regulators in India have been established at the state level, allowing for comparison of different states with different political and other conditions, but within the same larger administrative culture and legal traditions. In this paper we examine electricity regulation in Andhra Pradesh, a state with a reputation as a successful reformer, and in Delhi, an early example of an effort to privatize electricity. We use Hancher and Moran's (1989) device of a “regulatory space” as the organizing framework for these cases. The utility of this approach lies not only in its avoidance of the absolutes of the public interest perspective and capture theory, but also its emphasis on specifics of the national context – political, legal and cultural. Mapping the regulatory space in these two states allows us to inductively capture what is potentially different about India in particular, and developing countries in general. For each case, we begin with a discussion of the political context within which regulation was established and has functioned. Following Hancher and Moran we dwell on the significance of historical timing in shaping regulatory structures, but also draw on Thatcher and Stone Sweet’s (2002) discussion of contextual factors that mediate pressures for delegation, notably political leadership and larger patterns of state reform. Next, we delve a little deeper into the shaping of institutional procedure and organizational structure. Hancher and Moran stress the everyday routines and customs that structure regulatory practice, leading us to explore the sources of these practices. This in turn leads us to understand how learning takes place, and to an understanding of “institutional isomorphism,” in the design of regulatory agencies (DiMaggio and Powell 1991). We particularly examine the role of different networks in shaping regulatory bodies, and the practices and cultures that are imported along with networks.

Engineering Staff College of India Page No. D.3
. Third, we explore the dynamics of interaction between regulator, regulated and state, by looking at interactions around specific issues trying to capture what Moran (2002) evocatively describes as the “spirit of regulation”. Hancher and Moran's attempt to elide the public private distinction by pointing out that many private, regulated actors have important attributes of public status is almost a truism in the Indian context, where the regulated are, indeed, either still public entities, as in Andhra Pradesh, or only recently converted to private ownership, as in Delhi. In India, the discussion is about degrees of publicness, the manner in which that publicness is expressed, and the extent of continued control by the state. In looking at this three way interaction between the main actors, we are also attentive to evidence of straight capture (Stigler 1971; Posner 1974), and to the public choice literature's cynicism about the regulatory process. Finally, we look at the role of additional players in the regulatory process – industrial, household, agricultural consumers, other public agencies, unions, and civil society organizations – using the umbrella concept of “regulatory governance.” With their emphasis on publicness and organizations that exhibit this characteristic, Hancher and Moran are silent on regulation as a space for democratic deliberation, although they do draw our attention to understanding patterns of inclusion and exclusion. In his discussion of the rise of the regulatory state in Europe, Majone (1994) makes the point that procedural safeguards, such as public hearings, are an important part of building the legitimacy of a regulatory state.2 Lodge (2004) catalogues and provides critical reflection on the instruments through which transparency and accountability can be facilitated. Prosser (1999) has perhaps developed this argument the farthest in his work on public utilities in the UK, elegantly arguing not only for procedural safeguards, but a form of reflexive proceduralism that examines the conditions under which participation provides necessary safeguards and regulatory legitimacy. By examining both these procedures and how they are used in practice, we explore the role of regulation as “government in miniature” (Prosser 1999). In the following section, we briefly sketch the context of electricity in India and describe the introduction of electricity regulation in the state of Orissa, in order to set the stage for the detailed cases that follow. We then turn to the two cases, Andhra Pradesh and Delhi, organized along the four categories introduced above. We end with a concluding section that sketches the contours of regulatory space for Indian electricity, by drawing on the insights gained from the two cases. Indian Electricity and the Introduction of Regulation3 The recent past of Indian electricity is a story of lock-in to a cycle of destructive practice, a series of incomplete attempts at a quick fix, and a pervasive spiral into ever declining performance. For many observers of the sector, the problem is diagnosed simply as “politics” or political interference. The solution, equally simply, is politically independent regulation. To understand the nature of politics in the sector and the actual circumstances in which independent regulation was introduced it is necessary to briefly tour the recent past of India’s electricity sector. The Tangled Legacy of Indian Electricity Electricity is a “concurrent” subject under India’s constitution, which places it under both central government and state government control. In 1948, the sector was organized

Engineering Staff College of India Page No. D.4
around state-level, publicly owned and controlled State Electricity Boards (SEBs). SEBs were crafted in the crucible of post-independence India, and strongly shaped by the idea that electricity was a tangible and realisable benefit that the state could demonstrate to its citizens as a gain from achieving independence. In particular, SEBs had a dual nature as commercial entities and as instruments of development policy. Since the SEBs effectively operated as extensions of the state Energy Ministries, they have been prey to a range of garden-variety, but crippling, problems of government in India. These span everything from internal markets for staff promotion and placement, to graft for non-payment of bills, to incorporation into the election financing apparatus. Over time, the political fault lines in the sector have crystallised around three issues: farmers hanging on to populist subsidies, industrialists rebelling against the higher tariffs needed to support those subsidies, and increasingly affluent and mobilised urban consumers demanding better service. Meanwhile, finance ministries at state and central levels, backed by international donors, have given notice that budgetary subsidies to the sector must come to an end. State-level independent electricity regulatory commissions have been placed in the unenviable situation of untangling these knots. Regulation Introduced: The Orissa Experiment The genesis of state level electricity regulators can quite conclusively be traced back to a 1993 policy statement by the World Bank (1993) that made lending for the electric power sector conditional on a set of policy directions. First among these was that the “Bank will require countries to set up transparent regulatory processes that are clearly independent of power suppliers and that avoid government interference in day-to-day power company operations” (World Bank 1993, p. 14).4 The World Bank brought that policy to India later the same year and explicitly invited states to take up the bargain. Five states initiated discussion, but only the state of Orissa saw the process through. In Orissa the Bank's reform template was translated into terms that conformed to the then emergent global model of electricity reform: corporatization, privatization, tariff reform and independent regulation (World Bank 1996). The underlying aim was to demonstrate that a model other than the public monopoly model was possible in India, and to do this, privatization had to be made to work. An army of donor funded consultants descended on Orissa to elaborate and assist implementation of this template. According to participants in the process, at any given moment there were 30-40 consultants in the state.5 While donor and consultant led, the reforms could not fairly be described as coerced; a substantial component of the political leadership and bureaucracy, including the then-Chief Minister, supported a fundamental reform orientation. However, even among these reformers, the role or value of independent regulation was not clear. In the opinion of an Indian consultant involved in the process, many officials saw regulation as a requirement of funding institutions or as a relatively costless diversionary tactic to signal seriousness about reform. By contrast the World Bank had a very clear view of the role of the regulator: “...to ensure the sustainability of tariff reform... inter alia to attract sufficient private investment and protect the interests of consumers” (World Bank 1996, p.7). A key contribution of the regulator to achieving these goals was “...to insulate Orissa's power sector from the government and ensure its ... autonomy” (World Bank 1996, Annex 5.3, p. 2). In other

Engineering Staff College of India Page No. D.5
words, the fundamental purpose of electricity regulation was to create an apolitical space for electricity decision, in large part to send a signal of credibility to investors.6 Once the Orissa Electricity Regulatory Commission (OERC) began its work, the doubleedged nature of regulatory “independence” became apparent. The World Bank and reform advocates within Orissa assumed that an independent regulator would quickly raise tariffs to cost recovery rates, in order to attract private investment. Ironically, however, an independent OERC decided only a moderate rise in tariffs, thereby placing the privatisation effort in jeopardy and triggering an explicit request from the World Bank to further raise tariffs for investor comfort. The regulator denied this request, arguing that there were no grounds for placing the cost of high (and unknown) transmission and distribution losses on consumers, and that the utility should bear the cost of these losses as an incentive to reduce them. Even as the government lost control over use of tariff setting for populist and other political purposes, so too did reformers lose control over tariffs as a device to attract investors. Two larger points immediately emerge from the Orissa experience. First, while the larger literature allows for contextual factors to mediate internal pressures to establish regulators,7 the Orissa case suggests these external factors can be determinative. In Orissa, the role of donor agencies as vectors of policy transfer led to a process that lay between mimetism and “coercive isomorphism” (DiMaggio and Powell 1991). Second, Orissa indicates that the need for a regulator to establish credibility not only with investors but also with the broader public is an important factor in explaining regulatory behaviour and regulatory success. This balancing act receives little attention in Levy and Spiller's (1994) influential work on the need for regulatory restraints on arbitrary administrative action as a requirement for attracting investment.8 Regulatory uncertainty in Orissa, as the Bank saw it, combined with other factors – both idiosyncratic and predictable -- to undermine the Orissa experiment.9 Despite these overtones of failure, the Orissa approach to regulation has rapidly spread to other states, and was adopted by the Central Government in the form of an Electricity Regulatory Commissions Act (1998). The underlying presumption that it is indeed feasible to create an apolitical regulatory sphere simply by legislating one, has been retained more or less intact. The following two sections look in more detail at the experience in two states which adopted the reformist mantle – Andhra Pradesh and Delhi. Andhra Pradesh: Regulation under Benign Political Control10 Political context: Political leadership, regulator as second fiddle If politicians in India are accused of lacking the “political will” for electricity reform, then Andhra Pradesh (AP) is widely considered the one case that bucks the trend. At the time the regulator was established in 1999, the Chief Minister, Mr. Naidu, was firmly established as the leading light among state-level economic reformers and was heavily backed by the World Bank. While Andhra Pradesh had developed a home grown reform strategy in the mid-1990s, Naidu pushed implementation into high gear as part of a larger World Bank reform package.11 The reform approach was designed with the help of a large number of consulting firms, funded by the UK Department for International Development. Indeed, Andhra Pradesh rapidly became the poster child of reform for the donor community.
Engineering Staff College of India Page No. D.6
At the time of reform, Andhra Pradesh faced a by-now familiar set of problems: high loss levels; abysmal monitoring of electricity use; threat of industrial flight from the grid; a work force potentially implicated in rent-seeking; and weak and declining infrastructure quality. The context for reforms, including creation of a regulator, was one of stimulating and guiding a dramatic change in the sector. The solution devised by the consultants but endorsed, and vigourously so, by Naidu, rested on privatization of the sector and the introduction of competition as a necessary end. As a prelude to privatization, the state owned system was subjected to bread and butter management improvements, such as new and improved monitoring systems, re-aligning staff incentives around performance, and striking a wage for results deal with labour. These measures were actively supported by the political leadership, symbolized by weekly meetings held between Mr. Naidu and the top management of the electricity utility. These efforts yielded results; between 1999 and 2005 Andhra Pradesh engineered the most dramatic financial turn-around of any state electricity utility. The state also successfully unbundled the sector, creating distinct generation, transmission and four distribution entities under separate management. However, the privatization effort was placed on hold, because of apprehensions that it would be politically unpopular in the 2004 state election, and because other state experiences – Delhi and Orissa – had garnered unfavourable publicity. In 2004, Mr. Naidu nonetheless lost the election, and privatization disappeared off the road map entirely.12 This context has several implications for the subsequent unfolding of the regulatory process. First, regulation was a necessary element in the reform scheme, but by no means the lynchpin. Indeed, Naidu viewed the regulator’s role in quite circumscribed terms as being limited until competition began. By contrast to Orissa, where the state government was supportive but stepped back after the regulator was established, in AP the government was driving the implementation of reforms. Hence the regulator faced a less stern test; it did not have to be a gatekeeper against its own creators to nearly the same extent. Moreover, the responsibility for stewarding change did not lie with the regulator, but instead with the government, acting through the state utility. In Mr. Naidu’s words, “government has to go for reform, not the regulator.”13 Finally, the significant presence of reform consultants spilled over to the regulatory process and considerably shaped the structure and functioning of the regulator. Inside the Regulatory Black Box: A Tale of Three Networks Three networks shaped the internal organizational space of the regulator: the Indian Administrative Service, the technical electricity fraternity, and consulting firms. Before sketching out the role of these networks, it is worth noting that the APERC is established under an AP Reform Act of 1998 that closely mirrors the Orissa act with respect to regulatory structure and functioning.14 (Following passage of a national Electricity Act in 2003, the APERC comes under the purview of the broader national legal framework.) This instance of “institutional isomorphism” (DiMaggio and Powell 1991) may be due, at least in part to the presence of donors and some of the same consultants, but is also at least as likely to be simply following a path of least resistance. More intriguing than the legal framework is how the institution was shaped in practice.

Engineering Staff College of India Page No. D.7
The AP regulatory experience suggests that emergent electricity regulators are embedded within the strong traditions and deep networks of the Indian Administrative Service. Indeed, this very much the norm; a 2003 survey found that 10 of 21 electricity regulators were drawn from the IAS (Prayas 2003). While the Chair does not entirely control the Commission, both AP Chairpersons have been strong figures who have played a leading role in the work of the Commission. The first Chair of the APERC brought a successful track record of turning around a struggling public sector coal unit, and a reputation as an individual with considerable management skills and probity. The second Chair was formerly the Chief Secretary in AP, the highest ranking civil servant in the state. This strong IAS presence has several implications for an emergent electricity regulatory culture. First, IAS dense networks facilitate informal consultation and back-room decision making quite antithetical to the transparent and participatory ethos regulators are meant to foster. Second, regulatory independence from the executive is challenging to pull off if regulators themselves come from a career administering political decisions. This tension becomes particularly strong in the Indian context, where much of the rationale for regulators was to provide arms length separation from a predatory state. Where regulators are appointed directly from positions such as Chief Secretary, they would be required to shift, virtually over-night, from administering and defending the government’s position, to acting as an impartial referee in the sector. While it is by no means necessary that these pressures are entirely determinative, it is quite likely that the predominance of individuals from an IAS background curtail the space for emergence of a new and distinct regulatory culture. The technical fraternity of India’s public electricity utilities constitutes the second network that shapes the regulatory space. Emerging from over fifty years of state ownership, employees of state owned electricity utilities constitute the only available pool for staff, and for regulators with technical expertise. The dependence on public employees is reinforced by the regulator’s human resource rules, which closely follow government scales and promotion criteria. In AP, regulatory staff is often drawn from the regulated utilities. In 1996, three of the top five posts were occupied by individuals drawn from the erstwhile AP State Electricity Board.15 That said, APERC succeeded in attracting non-utility staff to a greater extent than other state regulators, particularly for key positions. For example, the Director of Tariffs was an important exception to the larger pattern and was occupied by an academic. In many cases, staffs is appointed on deputation, and maintain their ties and loyalties to the regulated company. The heavy representation of the technical fraternity within electricity regulators reinforces the image of the regulator as minimally distinct from the government; the APERC is just another government body to which a staff member can receive a posting. In addition, staff members drawn from the public utility bring insider knowledge and personal ties with the regulated company, which can induce a measure of conservatism and resistance to change. For example, APERC staff see little reason to release technical information on issues like new technical investments to laypeople.16 However, control of the use of new investments as means for political patronage are one potentially important contribution of regulation. Finally, with a background operating within vertically integrated monopoly utilities, regulatory staff bring little knowledge of regulatory practice,
Engineering Staff College of India Page No. D.8
let alone new trends in the organization of electricity such as introduction of competition and markets. This shortfall is made up by consultants, who play a substantial role in regulation well beyond the set up period and constitute the third network that shapes regulation in AP. Since the inception of APERC, a consulting firm has had personnel posted within the regulator’s premises to provide full time assistance. Consultants have defined the intellectual approach and agenda of the regulator, constructed the relevant models for implementation, and over a period of a few years handed over implementation to the staff, while they move on to design and implement new approaches. For example, consultants set in place the basic “cost of service” methodology which seeks to set tariffs for consuming classes proportional to their costs.17 Over time, this orthodoxy of regulatory economics has been internalized by regulatory staff, who faithfully apply the model. More recently, consultants have urged the regulator to shift to a “multi-year tariff” approach that incorporates more attention to performance than a simple cost-plus approach would do. This shift is very much in keeping with the larger ideological position driving reforms of shifting from government control to signaling and incentives. Thus consultants are in many ways the intellectual change agents, and play the key role in translating broad policy directions into specific policy measures. The intellectual positions that inform consultants are informed by their typical background as recent business school graduates, with a smattering of ex-public sector employees, and are further developed and propagated through broader consultant networks. For example, the desirability and indeed inevitability of performance based regulation is drawn from senior overseas colleagues who draw on international experience. Individual consultants working within the AP regulatory who gain expertise in performance based regulation, then in turn are delegated to assist other states, and thereby become a vector through which the approach spreads across states.18 Through consultant network-based propagation, new regulatory ideas are disseminated and implemented, without public debate and verification. In a peculiarity of AP, regulatory consultants were also linked with consultants to the state government and those helping the public utility in a semi-formal network, all funded through a DFID contract. Bound by informal ties developed through considerable crosspollination of staff between these firms and through a formal quarterly coordination meeting mandated by their contract, consultants became a back avenue for resolving contentious issues off line.19 These informal channels become the mechanism for attempting to forge an intellectual convergence on issues, some of which are highly political, such as details pertaining to an “open access” surcharge which could considerably change the effective cost of electricity for industrial users. This is not to say that client positions and perspectives did not play a role, but it is to point out that debates happened between proxies rather than the principals. In AP, consultants have not only played the role of knowledge shapers, but also as mechanisms for coordination across government departments. Within the regulator, decisions are shaped by interaction within the three components of regulators, staff and consultants. The long-standing embedding of consultants within the regulator has led to a productive dynamic where consultants act as specialized members

Engineering Staff College of India Page No. D.9
of larger teams within the staff, and where staff learn skills and techniques from consultants. This is particularly true in the tariff division, and may be facilitated by strong capacity of staff members in this division, who notably do not come from a utility background. However, on occasion, consultants may over-ride staff and go directly to regulators. In one example, staff were in favour of using a restrictive definition of working capital, while consultants sought a more expansive definition that would provide more leeway to the regulated company.20 Ultimately, consultants went directly to the Chair, who agreed that the situation called for a flexible approach. Within APERC, regulators use judicial metaphors to describe internal interactions. Consultants often prepare base materials on the request of the Commission, particularly on new policy matters such as performance based regulation. Commissioners then listen to the range of arguments before making a decision. Staff are often seen as representing the consumers point of view and indeed, there is a separate section in each tariff order prepared exclusively by staff, independent from the Commission, which lays out a critical public perspective. Thus, the internal process appears to rest on dialogue, but with a considerable role given to consultants, who by framing issues can set the terms of the debate. Regulation in Practice: Regulation Sidelined? The regulatory task in India’s electricity sector is strongly conditioned by the current historical context, defined by failing public utilities and hesitant attempts at privatization. In Andhra Pradesh, this process resulted in a sector under continued public ownership, but where the determining context was one of reducing theft, retaining the custom of industries and forging a healthier bottom line. Under these circumstances, the dominant dynamic defining the regulatory space is the interaction between the APERC, the government and the Andhra Pradesh Transmission Company (APTransco), which retains authority over transmission and distribution segments despite functional unbundling. By contrast with other states, in AP the public utility itself led a process of management reform, allowing APTransco to meet and preempt annual performance improvement targets set by APERC. For its part, the Government not only backed the reforms put in place by the Transco, but also regularly paid the subsidy required to compensate for the continuing losses, albeit declining over time. The APERC did play a useful role in this process by fostering accountability through a system of reporting, undertaking site visits, and by establishing a timely and credible process of tariff revision. On these grounds, the APERC deserves its reputation within India as among the best functioning electricity regulatory body. However, this is far from a story of regulator-driven reform and change made possible by strong and political independent regulation through target setting and oversight. In particular, changes have not been driven by a strong regulator willing to raise tariffs to cover costs in the face of political objectives, as the World Bank narrative has it. Instead it is more of a story of coordination between the three parties, all of whom share similar objectives. On occasion, the objectives have diverged, but these divergences do not threaten the common purpose of improving performance and bringing down theft and losses. This understanding of the interaction between the three primary organizational players is illuminated by the tariff review process. The APERC is statutorily empowered to
Engineering Staff College of India Page No. D.10
independently set tariffs. In practice, the APERC has to balance the political realities of tariff hikes, the budget available for subsidies, and the requirements of financial health for the utilities.21 Interviews suggest that the available subsidy amount is known to the regulator up front whether through informal communication or through the up front budget exercise. Tariffs have not increased for the subsidized consumer groups. In practice, the balancing act is maintained by setting a performance target for the AP Transco to meet in the event of a discrepancy between utility filings and APERC judgment. This judgment is vetted by the Energy Secretary of the Government, who scrutinizes the tariff order prior to release. This balancing act is made possible by the financial space gained by management reforms initiated by AP Transco. In particular, the utility has worked to improve service to well paying industrial consumers by setting up dedicated lines, giving them preferential access to scarce power and so on. These measures have kept industrial users from exiting the grid to purchase power from private producers or setting up their own plants, both options newly available under India’s Electricity Act of 2003. The APERC has done its part by resisting the temptation to raise them as a way of paying for other loss-making sectors, and indeed by reducing them somewhat. As a result of the elasticity of industrial consumption and the cost of self-generation, industrial revenues have increased, leading to a gain in coverage of costs from 53% in 1999-2000 to 83% in 2004-2005.22 Significantly, these gains have come without having to unduly ruffle the feathers of any major political constituency, with the possible exception of farmers. This result is enormously significant to the AP regulatory experience. It has allowed the regulator to play its balancing role without having to substantially transgress boundaries of either political or economic acceptability. This said, the interests of the three primary organizations in the AP regulatory space do diverge and require negotiated settlement, often with the government being the final arbiter. Here we discuss one such example of the “open access” regime. Given the importance of industrial consumers to the financial health of the system, there was considerable battle over introduction of an “open access” regime allowing large consumers to exit the grid and purchase power from private producers. The APERC was charged with setting a “cross-subsidy surcharge” payable by exiting users to compensate the public system for the loss of subsidy. Set too high, this surcharge would undermine open access and the underlying principle of competition; set too low, it could facilitate industrial flight and devastate the public system.23 The AP Transco provided “fierce representation” against an economic methodology that would facilitate open access, while consultants within the APERC argued strenuously for a methodology that would unleash open access and competition and even presented this approach to other regulators.24 The government issued a letter saying that they could not guarantee a sufficient increase in subsidy to cover the financial losses that might result from an open access regime.25 Stepping back from the advice of their consultants, the APERC chose the more conservative approach, citing consumer interests but also consistent with the path of least political resistance. In sum, post reform the AP electricity sector remains substantially governed through negotiation outside the formal regulatory process between the three main organizations that are statutorily, at least, independent. In a pre-reform world, these same actors were bundled together with clear lines of authority emanating from the Energy Department of
Engineering Staff College of India Page No. D.11
the government. How important was the unbundling and establishment of a regulator compared to political determination and skilful politics? Unbundling and creation of clear functional authorities has introduced a measure of transparency and, in a sense, forced a measure of explicit negotiation and set overall constraints that prohibit postponing difficult decisions to the future. The regulator is the site at which these accommodations are made. However, it is difficult to avoid a conclusion that the institutional innovations at best facilitated what was a larger act of creative politics. Regulatory Governance: The Potential of Small Players Although the introduction of regulation has had a relatively muted impact on intra-governmental interactions, it has had a considerable impact – procedurally and to some extent substantively -- on decision-making in the sector. The introduction of an independent regulatory body has created a new institutional space for engagement by a broad range of interests in the regulatory process. Here we discuss the contours of that space, how it is being used and by whom, and the resultant beginnings of substantively different outcomes. Once again following the Orissa example, the APERC has established a procedural framework enabling access to information about the sector, a required process of public hearings in particular for tariff orders, and a mechanism for filing petitions and pleadings. For example, the APERC has a well functioning and useful website, diligently holds hearings that are well attended, including in locations outside the capital city, has translated regulatory materials into the local language, and has established an Advisory Committee including labor, agricultural and consumer representatives. All of these procedural changes constitute a sea change from the entirely non-transparent closed decision-making process under the pre-reform regime. There remain, of course, some substantial holes in full implementation of the spirit of these procedures. For example, in one case the APERC convened a hearing on an issue only after substantial external pressure, and once it did so, issued a sixty page order the very next day, which clearly could not have incorporated insights from the hearing process (Electricity Governance Initiative – India, 2006). In addition, there remain grey areas on information disclosure, such as on investment plans, where the APERC has no clear policy and procedure, and by default withholds access to these materials.26 Hesitation and confusion on such matters has a great deal to do with the newness of the institution and its staffing by individuals who bring parochial and paternalistic attitudes characterized by former monopoly state utilities. There is little doubt, however, that under external pressure, the institutional space for regulatory governance is slowly but certainly becoming more open. Regulatory procedures on information and participation have expanded the regulatory space in AP, to include labor groups, political parties, consumer groups, individual consumers, industry associations, farmers, and other public bodies such as municipalities. A scan of the tariff order for 2006-07 suggests that these opportunities are, in fact utilized. A total of 46 different individuals or institutions filed a total of 330 objections to

Engineering Staff College of India Page No. D.12
the tariff orders of the three distribution companies in the state.27 Of these, we categorized 302 as “substantive” pertaining to issues that had to do with details of the tariff process, as compared to 28 “grievances” that were related to more narrow concerns that affected only the complainant or contained little or no substantive argumentation. Not surprisingly the largest number, 106, were by individual consumers, but substantial numbers of comments, in each case between 25 and 70, were filed by political parties (42), public entities (28), industry (36), unions (68) and consumer organizations (43). Interestingly industrial buyers and others with deep pockets are not disproportionately represented in these comments. While in some cases the comments reflect only a basic knowledge of the electricity sector and a nascent understanding of regulatory process, a handful of consistent interveners have won the respect of the Commission, being described as “almost equivalent to Commission staff in caliber”.28 These regular and respected interveners are almost all from consumer groups, in some cases are individuals, rather than from industrial groups. Indeed, the latter were dismissed as narrow and parochial in their comments, rather than focusing on issues in a broader public interest. Respondents at the AP Transco also express enthusiasm for consumer involvement, particularly in scrutinizing power purchase costs, which directly affect their own bottom line. The flurry of public engagement stimulated by creation of the APERC has begun to reshape regulatory politics at three levels. First, consumer groups have actively worked to broaden and deepen the procedural rules. For example, they have demanded hearings at district levels, requested and won local language translation of orders, and forced broader and transparent review of power purchase agreements. Second, they have somewhat disrupted and injected themselves into the triangular negotiation between APERC, the Government and APTransco. The main avenue for doing so is forcing release of information, and forcing public, documented, responses to raised objections, thereby limiting the extent to which adjustments in key parameters can be made behind the scenes. For example, farmer and consumer groups sought release of the agricultural census to measure rural power use conducted by the APERC. They have also sought and obtained public disclosure of the dispatch order of generating plants to ensure that one generator is not unfairly favoured over another. Finally, they have achieved some substantive gains, most significantly in the area of power purchase and approval of new generating plant investment, which accounts for the majority of total electricity cost.29 Significantly, this is truly a public interest issue, as savings in power cost accrue to all consumers, and cannot be captured by any single group. Gains in power purchase were achieved by forcing open the issue for debate before the regulator. In addition to arguments made by consumer groups, the resultant opportunities allow powerful actors such as the APTransco (for whom lower costs mean healthier finances) to pursue the issue to a greater extent than they otherwise would have. Indeed, in one case the process has led to strange bedfellows, with a petition jointly filed by APTransco, the Peoples Monitoring Group on Electricity Regulation, and a journalist with Communist Party affiliation acting in his individual capacity. The expanded scope of
Engineering Staff College of India Page No. D.13
regulatory governance has created new strategic opportunities for key actors in the sector. The power purchase issue also illustrates how the APERC reacts to the various pressures it faces. In the case of one new generation plant, it withstood substantial pressure from the government, informally expressed, to considerably lower profit rates and therefore costs to consumers.30 In another case, faced with considerable government pressure, the regulator was arguably lax about ensuring adequate fuel supply for the plant, and in the process allowed the risk of fuel supply to be passed on to the consumer, potentially substantially hiking costs.31 The latter case is currently under further appeal. The implications of these two cases for the regulator's independence from versus control by the government rests in the details of each case. However, that these issues are debated, and that any gains are made at all, is almost certainly facilitated by public engagement and scrutiny. The broadening of regulatory space to include consumers of all sorts, public interest groups, and media may yet be the most far reaching change brought about by independent regulation. While regulatory governance is at an early stage, the AP experience suggests that future developments will be well worth exploring. Delhi: Regulation in the Shadow of Privatization32 Political context: Regulatory Design to Accommodate Privatization The early years of the Delhi Electricity Regulatory Commission (DERC) have entirely been dominated by the larger context of a high profile privatization in Delhi. Following the experience of Orissa, widely viewed as a failure, Delhi's attempt at privatization was a high stakes effort to get it right. The pressure has been enormous; failure in Delhi would reinforce a signal that privatization in Indian electricity is a hopeless cause, and cause investors to be even more wary of entering the country's electricity sector. The local political stakes are also high. The privatization effort has been personally backed and supported by the Chief Minister, Shiela Dixit, and is a centre piece of her efforts to transform and modernize the capital city. Electricity, along with water, is a central electoral issue in Delhi. In addition to a charged political climate, the privatization context also meant that the DERC was called upon to regulate in the midst of a complicated and high profile privatization effort at its very inception. The DERC was legally established in early 1999 but only got under way with a Regulatory Commissioner and skeletal staff in early 2000, and had hired its first professional staff (other than the Secretary) by the end of 2000. With the introduction of the privatization plan in end 2001, the DERC was required to make important decisions and set benchmarks on which the success of the privatization depended within a year of its formation. It is necessary to briefly spell out some details of the reform to understand its full implications for the regulatory process.33 As in other states, the central objective of reform was to lower technical and, more important, commercial loss levels that together hovered above 50%, and to improve service quality. The context within which the regulator was set was one of rapid and dramatic sectoral reform and change. The reform followed the standard trajectory of separating out transmission and distribution components, and further split distribution into three distribution companies which were
Engineering Staff College of India Page No. D.14
offered for sale. The privatization bid structure was a most interesting one; bidding was based on a trajectory of reductions in technical and commercial losses, with the company promising the biggest loss reductions declared winner. Financial incentives and disincentives were based on meeting those loss reduction trajectories. At the end of a five year transition period, the system as a whole was expected to break even, requiring no further subsidies. The three distribution companies were restructured as a joint venture between the Delhi government and Tata Power in one area and Reliance Power in the other two areas. These two industrial houses are among the largest, most powerful, and politically connected in the country.34 The privatization arrangements constrained the regulator in several ways. The regulator lost control over performance targets, since they were based on bids and embedded in privatization contracts. The Delhi government's policy directive also set the rate of return, and required the regulator to set tariffs uniformly for all companies, thereby losing the ability to link tariffs and economic performance. The regulator retained control over scrutiny of costs and investments, and formal tariff setting authority. However, the regulator was further boxed in by the Delhi government's declaration up front of a total subsidy cap for the transition period, which necessarily included assumptions about the trajectory of tariffs. Without control over performance targets, or means of differentially rewarding the companies based on performance, the regulator faced the challenging task of balancing the hard constraints of available subsidy and required return against the political appetite for tariff increases. Underlying this arrangement was a perceived need by the Delhi government for stability and predictability, especially in tariff setting, in order to reassure new private investors. Indeed, the government had initially asked the DERC to prepare “multi-year tariffs” to grant just this predictability. Citing the enormous information vacuum then prevalent, the regulator refused. The loss-reduction based privatization bid was a way around the problem, but at the cost of curtailing regulatory scope. The DERC vigorously protested the policy directive, but to no avail. Ultimately, the Delhi regulator began its work with a somewhat contentious relationship with the government, a shortened list of instruments with which to do its work, minimal experience and capacity, a highly charged political context, and two very powerful and sophisticated companies to regulate. Inside the Regulatory Black Box: Compensating for Weak Capacity As the foregoing discussion suggests, the DERC began life with a stern challenge and little time to find its feet. The striking features of the Delhi regulatory experience are the use of a single person Commission, a paucity of staff and capacity, and dependence on consultants, but in a very different manner to AP. By way of legal backdrop, the DERC was established under central legislation, the Electricity Regulatory Commissions Act 1998, but this was strongly shaped by the Orissa Act. As in AP, there were few legislative innovations that would shape or structure DERC differently from other regulators in the country. Indeed, even DERC's operational regulations were largely drawn from existing APERC regulations.35 With regard to the regulator, the DERC differed from APERC in two important aspects. First, DERC was led by a single regulator instead of a three person panel for its first several years. The choice of a single regulator seems to have initially been somewhat accidental rather than deliberate, but appointment of subsequent regulators was caught
Engineering Staff College of India Page No. D.15
up on local politics which delayed appointment of subsequent regulators until after the term of the first regulator.36 Participants in the regulatory process suggest that having a single regulator has undermined the checks in the system and permitted more idiosyncratic regulatory behaviour. Second, the Delhi regulator was a rare example of a Chairman not drawn from the IAS but in this case from the electricity fraternity. This relatively weak access to IAS networks may explain why the regulator expended considerable efforts early on to cultivate relationships with politicians and bureaucrats in the Delhi government. Despite the regulator’s connections to the electricity fraternity, the DERC has consistently suffered from weak capacity, and an inability to attract and retain staff. For example, several years after the establishment of DERC, two of the key functional positions, Director of Law and Director of Tariff, were vacant for over a year.37 The majority of staff are drawn from the electricity fraternity, although often from central government electricity bodies rather than from the regulated utility. DERC administrators cite mundane problems of availability of housing, scope for promotion in a small organization and the like as the main reasons for the scarcity. The constraints of government salaries and human resource policies restrict DERC, as in AP, to the existing pool of public employees from which to attract DERC employees. This is a common theme in other regulatory commissions as well, with AP being more of an exception than the rule. The shortage of competent and trained staff with knowledge of regulatory practice has led to a heavy reliance on consultants, as in AP. However, unlike in AP, where staff were able to develop the requisite knowledge and skills to take over the bread and butter operations of the regulator, the DERC continues to rely on external consultants to conduct analysis for and write the annual tariff filing seven years into its existence. This characteristic is typical of other regulators in the country. As a result, the tariff process is not based on the deep knowledge and familiarity that a long-standing relationship between regulator and regulated could bring. Although the DERC used the same consultant for much of its operational period, the consultants only come for relatively brief spells, during which they are also working on tariff orders for other states, often using similar templates. This pattern of functioning almost certainly precludes the in depth knowledge of the nuances – technical, economic and political – that go into regulating electricity. For some, this is seen as an advantage and a way of ensuring arms length relationships and avoiding the cozy relationships that characterized the pre-reform period. It also, however, almost certainly rules out the give and take necessary for the sort of “responsive regulation” of the sort advocated by Braithwaite (2005). In the following section, we discuss specific examples of the costs introduced in the regulatory process by DERC’s seeming lack of deep familiarity with Delhi’s electricity sector. In describing the interaction between regulator, staff and consultants, consultants are presented as simply providing technical input when required by the regulator. However, it is clear that many staff do not have familiarity with the necessary models, and by controlling the models, consultants may also be over-determining the direction and approach to regulation. This is not to argue that the regulator does not have authority and control over the consultant, but rather that through their ability to frame regulatory issues, and by providing first drafts of almost all significant regulatory orders, including
Engineering Staff College of India Page No. D.16
tariff orders, the consultants potentially shape and circumscribe regulatory functioning. The extent to which this occurs in practice requires further exploration. Regulatory Style: The Pitfalls of Hands-off Regulation in an Information Vacuum The underlying presumption behind the Delhi privatization was that private sector resources and competence, when mated through contract to an appropriate incentive framework, would achieve the desired goal of loss reduction and service improvement. In this scheme the regulatory role was circumscribed; DERC was expected to not queer the pitch and to provide regular and predictable tariff increases. How did the interaction between the private providers, the DERC and the Government of Delhi work in practice? The Delhi electricity sector suffered from a history of mis-management which had left an information vacuum and a considerably weakened basis for monitoring and accountability, which left the door open to gaming of all sorts by the utilities, a loophole that was encouraged, if anything, by the complexities of the privatization contract. For example, under some conditions, companies stood to earn more money by shuffling around consumption patterns than actually working to reduce losses. Under the terms of the policy directive, the regulator did not have control over the specifications or levels of performance targets, but could only undertake detailed scrutiny as a way of proactively improving performance. However, citing the need to give private companies a chance, and not to micromanage, the regulator chose a consistently light-handed approach. He sent signals to his staff that they not be seen as investigators and in interviews repeatedly argued that his role was not that of an auditor.38 Not all of his staff saw eye to eye with this position. Several efforts at proactive scrutiny were squashed by the regulator. In one case, a staff member found outright fraud – the reporting of old transformers as brand new ones for the purpose of capital investment. While the books were adjusted for the case in question, no further 18 action, such as imposition of a penalty, was taken, and the staff member was discouraged from further detailed field-based scrutiny.39 Independent analysis conducted by a research organization suggests there are some grounds to doubt the efficacy of the regulator's light-handed approach (Prayas 2006). This analysis suggests that the DERC paid insufficient attention to scrutiny of the companies' investment plans, potentially increasing the rate base unnecessarily. This analysis also finds anomalous consumption patterns in two of the companies suggesting some gaming of the loss reduction incentives. This also went un-scrutinized and unreported by DERC. Two additional factors have damaged the regulator's credibility. First, the first regulator issued a controversial “parallel license,” allowing competition in a lucrative distribution zone that had been retained in public hands, on his very last day in office. To some, including in the Delhi bureaucracy, this was a dubious move that conferred considerable potential benefits to the company in question.40 Second, the regulator has aroused the ire of wealthy consumers in Delhi because of its failure to proactively address and resolve what were seen as heavy handed tactics over metering and monitoring by one of the distribution companies.41 The regulatory politics are made even more interesting by the differing performance turned in by the two companies. The scrutiny discussed above on possible gaming,
Engineering Staff College of India Page No. D.17
overinvestment and consumer interface, has largely focused on one of the two companies. This company has also turned in a far less creditable loss reduction performance, only barely meeting its benchmarks. The other company has met or exceeded its benchmarks and has also received praise from consumers for its attention to service. Over time, the flawed performance of the former company has become associated with a weak DERC and has certainly contributed to tarnishing its reputation, whether fairly or not. In the words of one sceptical former Delhi bureaucrat (albeit also an insider with his own stakes in interpreting the performance of reforms), it is “hard to draw a line between incompetence and capture.” As a result of the indifferent loss reduction performance of the private companies taken together, the regulator has been subject to enormous political pressure in its tariff setting role. It is one of the less well kept secrets of the Delhi regulatory process that in assessing and negotiating these pressures the regulator has maintained close channels of communication to the highest levels of government.42 Such is the public perception, and it is confirmed by insiders.43 While the regulator's role within the reform narrative is precisely to create a bulwark against political pressures, the reality is that the political cost of unpopular tariff hikes still rest with the government, and no regulator is willing to blindly impose those costs on its government with no regard to consequences. A tariff setting incident helps illustrate this dynamic. In the tariff year 2004-05, the straight accounting of costs, returns and revenues required the regulator to approve a tariff hike of 35% to balance the books. A hike of this magnitude would have been politically ruinous, particularly given the failure of one of the private companies to deliver on the promise of better service. The regulator came up with the creative solution of requiring the companies to create a “regulatory asset” in effect using financial jugglery to spread the tariff hike out over future years. The companies disputed this order and the national Appellate Tribunal for electricity matters ruled in favour of the companies, but only two years later, after the regulatory asset had substantially done its work of deferring the tariff hike. In the subsequent year, under a new regime of two newly appointed regulatory commission members, there was a public backlash against a 10% tariff hike for residential consumers (Indian Express 2005). Consumer groups argued that the hike was undeserved in the face of poor service and faulty meters. The regulator said they were only going by the letter and spirit of the law in trying to shift toward cost-reflective tariffs.44 While the government at first held firm in arguing that they supported this decision of an independent commission, under growing political pressure the Delhi government relented and announced a roll-back of the hike (Roy 2005). This episode entirely punctured the fiction that creation of an independent regulatory body had created a wedge between the economic and political content of electricity decision making in Delhi. The narrative above suggests the Delhi regulatory experience was defined by a highly restrictive privatization arrangement. The DERC had neither the control over the regulatory instruments needed to stamp its authority on the companies, nor the capacity with which to do so, nor even a store of credibility with the public that it could draw upon for support of tough decisions. Confronted with this situation, the regulator followed an

Engineering Staff College of India Page No. D.18
accomodationist approach, seeking to limit political fall-out for the government, not unduly threaten the interests of powerful private companies and maintain credibility with consumers. In the process, by failing to take tough decisions either to further hike tariffs or to subject the companies to greater scrutiny, the DERC may have substantially undermined the aim of moving toward financial health that underlay the reform plan. The efforts to shift the regulatory process to a politically more predictable contractual terrain only temporarily concealed political pressures that sporadically re-emerged to shake the government and undermine the regulator's credibility. Regulatory Governance: A Retreat from Regulatory Space to Political Space As in the Andhra Pradesh case, the statutory requirements for hearings, access to information and mechanisms of recourse have created an important new space for regulatory governance in Delhi. However, the weaknesses in the practical application of these procedural requirements are also considerable. For example, the DERC website is incomplete and ill-organized, which along with the lack of an effective library or an organized index of documents makes accessing documents extremely difficult in practice. The hearings are not open to the public, but only to those who have submitted comments. This said, the wide availability of detailed tariff orders to the public, and the ability of consumers and interested parties of all sorts to present their views before the DERC, and obtain an answer from the distribution companies, represents an entirely new institutional space for public deliberation. In 2004-05 the DERC received 212 objections to its tariff orders from 69 different objectors.45 Consumer groups or individuals accounted for about 40 of these while there were about 20 objectors from within industrial user groups. Of the total concerns expressed, by far the majority, (625 out of 683) were substantive complaints as compared to more narrow grievances. By contrast to Andhra Pradesh, however, no small core of competent and knowledge interveners had appeared to win the respect of the regulators. For example, DERC staff say they do not find public submissions helpful in improving the quality of tariff orders. And indeed the capacity base of interveners is thin. Thus, the apex body of Delhi's Resident Welfare Associations (RWAs) which includes the wide spectrum of neighborhoods, including well to do areas, files petitions based on patched together pieces of information, without deploying any resources to obtain specialized knowledge or skills.46 Similarly, the Chamber of Commerce hires a single consultant to write their comments, with little involvement or feedback from the staff, or mechanism of either quality control or ensuring that comments truly represent member interests.47 However, Delhi consumers are extremely active and skilled in the broader political arena around electricity. The apex body of RWAs skilfully uses the media to directly critique the companies and the DERC and to force engagement and consideration of their appeals at the highest political levels. While it is an effective tactic in the context of any particular skirmish, this approach has the effect of de-valuing and de-legitimizing the DERC as a forum for reconciling competing interests. A political mapping of consumer voices in Delhi is also instructive and helps explain the emphasis on organized politics rather than on the DERC. The most vocal subgroup, the
Engineering Staff College of India Page No. D.19
RWAs, speak for a distinct sub-section of Delhi's consumers self-identified as “middle class”, but who include the top end of Delhi's income strata. They place themselves in opposition to small scale and illegal industry owned by local politicians and slum dwellings which contain those politicians vote banks. Both of these categories of consumers, they argue, receive free power at their expense. From this perspective, the DERC is relatively helpless; the problem and the solution, lies in the political process. As a result of the dominance of the RWAs in the public discourse around electricity, the issues that have attained the highest profile in the DERC are questions of metering and billing and other consumer grievance issues, after an initial period when the DERC was seen to be non-responsive. Some of the upstream and more technically detailed matters also before the regulator, notably investment scrutiny, have tended to be ignored. Another important consequence is that voices of lower income groups and especially slum dwellers are seldom heard within the DERC process. In sum, the effect of creating a new institutional space for regulatory governance has had relatively little beneficial effect on the regulatory process in Delhi. To the extent there are any substantive wins, they are on the issues closest to consumers – metering, billing and grievance redressal. The more significant observation is that, if anything, consumer action has by-passed the DERC, to re-focus attention on organized politics. The Contours of Regulatory Space in Indian Electricity: Andhra Pradesh and Delhi Compared India is far from being a regulatory state in Majone’s (1994) characterization of the shift from public ownership, planning and centralized administration to regulation through structuring of incentives and signals. Understood as an essential complement to privatization, regulation has persisted and multiplied even as efforts at privatization have ground to a near halt. Intended as a buffer against political forces to enable private participation, regulation has now become an end in itself, the most tangible expression of, or even a substitute for political reform. At least in electricity, the state itself is most frequently the object of regulation. The result is a regulatory landscape with some quite distinctive features. In this section, we draw on Andhra Pradesh and Delhi experiences, also occasionally drawing in additional state experiences by way of comparison, to sketch the contours of an emerging regulatory space in Indian electricity. First, the sectoral context of a deep and systematic crisis in electricity often places regulators in the situation of being stewards of rapid change. As such, the distinction between policy and regulatory roles, which as Prosser (1999) points out is hard to sustain in the best of circumstances, becomes particularly strained. The debate in AP over the shift toward more competition, and in particular the open access policy is a case in point. While the pressure to be a steward of change is a general structural attribute, it manifests itself and is addressed differently in the two states. In AP, the driver of reform was clearly the government, operating through its public utility, with the regulator a bystander to utility reform, and in a supporting role at most. In Delhi, the story is more complex. The responsibility for stewarding change was scattered, as was authority over the sector, leading to confused lines of accountability. The privatization framework was intended to be the driver of utility reform and the private utilities the agents of change.
Engineering Staff College of India Page No. D.20
Having set in place the framework, the Delhi government, formally at least, took a big step back. The regulator was appointed the overseer and monitor, but when the privatization framework failed to extract the necessary result, the onus for stewarding change shifted to the regulator. However, the regulator’s wings were clipped by the privatization framework. As a result, the DERC had little authority and capacity to undertake any course corrections and as a newly established regulator, it did not have the track record and therefore credibility to be aggressive stewards of change. In a climate of pervasive information asymmetry, the lack of flexibility may well have imposed a cost. In both cases, regulators appear to have been set in place as reform tokenism, as a mechanism considered necessary as a signaling device to donors and investors. However, the larger point that emerges is that establishing a regulator, however well designed, is not a substitute for politically led reform in a context of rapid change. This observation has implications for donor led programs that lean heavily on institutional design as the solution to political problems. Second, that regulatory capacity and expertise are often extremely thin reinforces the point above – the limited ability of regulators to steward change – but also structures individual regulators to a considerable extent. To begin with, weak regulatory capacity contributes to the phenomenon of isomorphism. The framing legislation for most states in India have cascaded down directly from the limited example of Orissa reforms, which, as a small and relatively poor state, received little scrutiny. The operating regulations for Delhi were directly copied from the consultant-aided experience in Andhra Pradesh by a beleaguered and under-resourced Secretary of the Delhi regulator. However, this point has to be tempered by the potential for individual personalities to forge a different trajectory. In the state of Karnataka, for example, an innovative Secretary put in place robust and original internal mechanisms of functioning that deviated from the norm. In addition, weak capacity means that the regulator is established as an empty institutional shell, which is filled out by the operation of networks that early appointees bring to their new positions. The three important networks present in AP and Delhi are the IAS, the electricity fraternity and consultants. The tight embrace of the IAS brings not only paternalism and secrecy as a default mode of operation, but also direct channels to the executive and well developed norms and customs about their use. Direct evidence of this influence is hard to come by, precisely because it is so deeply internalized. However, it seems likely that developing a distinct regulatory culture organized around open debate and transparency is an uphill battle from this starting point. Instead, regulators demonstrate what might be called “everyday forms of state capture.”48 The importance of consultants is considerable, in particular through their role in framing regulatory issues. Consultants bring an ideologically pro-competition and pro-privatization perspective, one that may run counter to the more mundane realities of the Indian context.49 As the AP and Delhi cases show, however, the extent to which consultants are analysis providers versus de facto decision-makers rests considerably on the robustness of the regulatory institution – regulators and staff – within which they are embedded. In AP their influence was reduced over time, but they continued to play a leading role in new shaping new areas of work. In Delhi, consultants come perilously close to serving as a de facto staff for the regulator.
Engineering Staff College of India Page No. D.21
Third, the central dynamic of Indian electricity regulation is the interaction between three complex organizations with different facets of publicness, the regulator, the executive and the regulated utility. The specific nature of this interaction, in each case is structured by the larger political context. In AP, it was framed by the government's strong insistence on internal management reforms that contributed to performance improvements. These improvements created some political space for accommodation of differences among the three state bodies – on issues like open access -- without upsetting the overall dynamic. In some ways, the relative success of the AP regulator is explained by the fact that it was almost never forced into a position of making hard decisions and politically sensitive judgments. In Delhi, the interaction was governed by the policy directive and contractual arrangements underpinning privatization. Here, in the absence of performance gains, the sector did bump against political constraints – public willingness to accept price hikes – and economic constraints – the overall subsidy provided by the government. And it was the regulator that was placed in the position of resolving these tensions, with all the limits on its functioning described earlier. The attempt by the Government to distance itself from sectoral politics failed, however, as public unrest forced the Government to re-occupy centre stage. Notably, the act of privatizing did not depoliticize the sector or contain interaction within the regulatory process alone. The effects of privatization would appear to depend more on the willingness of the private actor to self-regulate, than on the ability of the regulator to provide checks. A third case of AP's neighbouring state of Karnataka provides an interesting counterpoint. Like AP, the regulated utility is unbundled but remains in state hands. Karnataka illustrates a form of parallel regulation, where the state government continues its regulatory function as if the regulator did not exist, and fails to discipline the utility when it disregards the regulatory commission's orders. Taken together the three cases illustrate how strongly the immediate political context shapes regulatory experience. Fourth, while the points above highlight conservative forces that substantially mute the contribution of independent regulation, the broadening of decision-making through regulatory governance holds promise as a genuine departure from business as usual. The availability of procedural safeguards that enable transparency and public debate hold the potential for a new, and influential political space for democratic deliberation and the exercise of accountability. The AP and Delhi examples provide fruitful material to reflect on the implications of this trend. Regulation can only provide an alternative political space for resolution of conflicting interests if it can win broad legitimacy with those interests. This would seem an uphill task, with the re-politicization of Delhi a case in point. Several factors worked against the construction of DERC as a legitimate political space: a single rather than multi-person regulator; weak authority due to the privatization framework; dubious regulatory decisions; and a weak and politically conflicted consumer presence. AP provides insufficient basis to test this claim, as the regulator never became the site of contested politics. At the same time, there are factors that work in favour of constructing regulation as democratic space. In the current political climate, the bar to legitimacy is set quite low.

Engineering Staff College of India Page No. D.22
While the literature is more often concerned with regulators matching the assumed legitimacy of elected representatives (Prosser 1999), in India, the legislature is viewed with considerable skepticism. If regulatory procedural safeguards, which as AP and Delhi show are well constructed on paper, can be made robust in practice, it would considerably enhance regulatory legitimacy. In addition, the regulatory process is currently undermined by the narrow base of participation by wider societal groups. The exclusion of urban slum dwellers in Delhi is a poignant example. Regulatory legitimacy will require more than an open ended stakeholder approach to regulation. It will take a shift toward a reflexive form of the stakeholder approach which also includes proactive measures to equalize the imbalance in bargaining power and capability across stakeholders Prosser (1999). Because the regulatory space is so thinly occupied, this may be easier to achieve in India than in advanced regulatory societies. Both cases show that industrial consumers and others with deep pockets are, so far at least, relatively absent from the regulatory process. Indeed, in AP, among the most effective and influential participants have been individuals and small groups. These observations suggest that Hancher and Moran’s (1989) insistence that regulation is a game for and decided by only large organizations, leaving little space for individuals and smaller NGOs may not prove entirely true in India. That regulatory capacity of civil society organizations will grow in India is suggested by a groundswell of organizing and efforts to train and disseminate information, led by a relatively small and effective group of regulatory interveners in the state of Maharashtra.50 However, procedural integrity and participation will have limited value without substantive gains. Here, the experience of AP, where a small number of consumer groups obtained greater disclosure, forced deeper consideration of new power purchase agreements, provided an opportunity for new strategic alliances in bureaucratic games, and ultimately managed to achieve savings for consumers is both surprising and heartening. While the experience in India is in its nascent stages, the cases suggest that careful proceduralism, a reflexive attention to stakeholder capacity, and demonstrated gains may yet create a constructive form of tripartism between stakeholders, regulator and regulated (Ayres and Braithwaite 1992). Conclusion Electricity regulation in India risks being absorbed and accommodated within the existing political-bureaucratic system with very little impact on decision making. The creation of separate agencies has introduced an element of transparency in decision making, but the impact of this is reduced by the embedding of the process within well worn networks. The signaling and credibility functions are muted by the overarching control of the political process. At root, the pattern of decision making in the sector is only transformed if there is a sustained political impetus to change, as in AP. The only way beyond this dependence on the favourable alignment of larger political forces on a state by state basis is through re-conceptualizing regulation as a new political space, an intent quite
Engineering Staff College of India Page No. D.23
removed from the original designers of electricity regulation. In other words, since the problem of electricity in India is at root a political problem – unchecked state control – the way out lies not in institutional design, but in the explicitly political solution of new, democratic and legitimate regulatory spaces. The Indian electricity example also suggests considerable diversity in outcome at which two cases can only hint. It reinforces the importance of understanding historical timing, bureaucratic traditions and customs, and organizational attributes. In India, the story is particularly bound up with understanding the shifting nature of the state. An inductive approach to regulation would appear necessary to fully sketch out the character of regulatory spaces. At the same time, the Indian experience does suggest some systematic influences that come into play when independent regulation is introduced to developing countries. We conclude this paper with a short discussion of these influences, which might be taken to the study of regulation in other parts of the developing world. Attention to the role of donor agencies as vectors of policy transfer may be a fruitful line of inquiry in many developing countries. The often uncritical acceptance of regulatory institutions as part of a package deal also comes with a lack of reflection on the role of regulation as a shaper of politics, other than the unchallenged assumption that regulation can make politics less relevant. That regulators are often introduced as part of donor driven and defined agendas may homogenize regulatory experience in some respects, and mute the impact of historical timing and geographic specificity. In a climate of low capacity, a condition that holds true in much of the developing world, the role of consultants and consulting firms becomes particularly important. Consultants constitute an increasingly global network that act as generators and transmitters of knowledge, and framers of decision choices. Consultants have increasingly taken on various attributes of publicness through their training functions and their embedding in regulators, and their advisory role to various governmental agencies. The extent and type of consultant influence will be shaped by their entry point-- often through donors, the extent to which they are deployed as knowledge providers versus a substitute for weak capacity, and whether their role is subject to external checks through procedural safeguards. Finally, the Indian experience suggests that attention to “regulatory governance” – the potential for regulation to be conceived of as a new and democratic political space – is worth exploring. Regulatory governance in developing countries brings the challenge of weak and under-resourced civil society and possibly an over-bearing state with little regard for procedural safeguards. However, in the context of other weak and illegitimate public institutions, regulation has the benefit of being a newcomer without the baggage of the past. If the Indian example proves to be more generally true, the theoretical interest and normative contribution of regulation may well lie in its democratic potential. References Agarwal, Manish, Ian Alexander and Bernard Tenenbaum. 2003. The Delhi Electricity Discom Privatization: Some Observations and Recommendations for Future Privatization in India and Elsewhere. Washington DC: World Bank.
Engineering Staff College of India Page No. D.24
Ayres, I., and J. Braithwaite. 1992. Responsive Regulation: Transcending the Deregulation Debate. Oxford: Oxford University Press. Braithwaite, John. 2005. Responsive Regulation and Developing Economics. Global Economic Governance Programme, University College, Oxford. DiMaggio, Paul J., and Walter W. Powell. 1991. The Iron Cage Revisited: Institutional Isomorphism and Collective Rationality. In The New Institutionalism in Organizational Analysis, edited by W. W. Powell and P. J. DiMaggio. Chicago: University of Chicago Press. Dubash, Navroz K, and Sudhir Chella Rajan. 2000. Power Politics: Process of India's Power Sector Reform. Economic and Political Weekly XXXVI (35):3367-3390. Dubash, Navroz K., and Daljit Singh. 2005. Alternating Currents: Introduction to an International Review of Electricity Restructuring. Economic and Political Weekly XL (50):5242-5248. Hancher, and M. Moran. 1989. Organizing Regulatory Space. In Capitalism, Culture and Economic Regulation, edited by L. H. a. M. Moran: Clarendon Press. Hira, Anil, David Huxtable, and Alexandre Leger. 2005. Deregulation and Participation: An International Survey of Participation in Electricity Regulation. Governance: An International Journal of Policy, Administration, and Institutions 18 (1 (January)):53-88. Indian Express. 2005. RWAs Call for Rollback of Power, Water Tariff Hike. The Indian Express. August 7. Levy, Brian, and Pablo T. Spiller. 1994. The Institutional Foundations of Regulatory Commitment: A Comparative Analysis of Telecommunication Regulation. Journal of Law, Economics, & Organization 10 (2):201-246. Lodge, Martin. 2004. Accountability and Transparency in Regulation: Critiques, Doctrines and Instruments. In The Politics of Regulation: Institutions and Regulatory Reforms for the Age of Governance, edited by J. Jordana and D. Levi- Faur. Cheltenham: Edward Elgar Publishing Limited. Majone, Giandomenico. 1994. The Rise of the Regulatory State in Europe. West European Politics 17 (3):77-101. Moran, Michael. 2002. Understanding the Regulatory State. British Journal of Political Science 32:391-413 (1-24). Posner, Richard A. 1974. Theories of Economic Regulation. The Bell Journal of Economics and Management Science 5 (2 (Autumn)):335-358. Prayas. 2003. A Good Begining But Challanges Galore. Pune: Prayas. Available at www.prayaspune.org.
Engineering Staff College of India Page No. D.25
———. 2006. A Critical Review of the Performance of Delhi's Privatized Distribution Companies and the Regulatory Process. Pune: Prayas. Available at www.prayaspune.org. Prosser, Tony. 1999. Theorising Utility Regualtion. The Modern Law Review 62 (2 (March)):196-217. Roy, Subhajit. 2005. Hike Out; Dovt. Discoms to Share 10% Burden. The Indian Express. July 24. Stigler, George J. 1971. The Theory of Economic Regulation. The Bell Journal of Economics and Management Science 2 (1 (Spring)):3-21. Thatcher, Mark. 2002. Delegation to Independent Regulatory Agencies: Pressures, Functions and Contextual Mediation. West European Politics 25 (1):125-147. Thatcher, Mark, and Alec Stone Sweet. 2002. Theory and Practice of Delegation to Non- Majoritarian Institutions. West European Politics 25 (1):1-22. World Bank. 1993. The World Bank's Role in the Electric Power Sector. Washington D.C.: The World Bank. ———. 1996. Staff Appraisal Report: Orissa Power Sector Restructuring Project. Washington DC: World Bank.

Engineering Staff College of India Page No. D.26
1 This paper is one output of a larger research project on electricity regulation in India. The authors are grateful to the Foreign and Commonwealth Office of the UK Government for their support of this project, and to the National Institute of Public Finance and Policy and Indian Institute of Management-Bangalore, with which the authors were affiliated, respectively, for much of the project. Finally, we wish to acknowledge Bronwen Morgan for fruitful discussions and guidance on relevant literature on regulation. 2See Hira et. al. (2005) for an interesting cross-country empirical comparison of procedural measures in use in electricity regulation. See the Electricity Governance Initiative at http://electricitygovernance.wri.org for an attempt to develop and test indicators of regulatory governance across countries. 3 This section draws on the historical review of electricity reform in Dubash and Rajan (2000). 4 The other conditions -- commercialisation and corporatisation, importation of services, and encouragement of private investment – would soon become intertwined with the emergent model of competitive electricity markets emanating from the UK, to become a standard model of electricity restructuring applied to the developing world (Williams & Dubash, 2004). 5Interview with consultant in the Orissa process, 8/12/05. 6The goal of insulation from political process led to interesting design debates. According to Indian consultants, foreign consultants were naïve about how to achieve this outcome. For example, it was at the insistence of Indian consultants that the Orissa reform act explicitly prohibited elected officials from ever assuming office as a regulator. 7See, for example, Thatcher (2002). 8Levy (a World Bank staffer when he wrote the article) and Spiller are highly sophisticated in their treatment of this link between restraints on administrative discretion and investment, allowing for a range of institutional forms to signal credibility, including continued public ownership. In the process of translating these ideas to policy in Orissa, this nuance appears to have been entirely lost. 9Notable among problems that could have been predicted was the decision to load the bulk of the public debt onto the transmission company that remained in state hands, which caused the financial situation of the sector as a whole into crisis. Idiosyncratic factors included a major cyclone that destroyed the electricity infrastructure in part of the state, and the financial problems of the parent AES corporation, one of the two private investors, which contributed to its eventual withdrawal from Orissa. 10This section is based on ongoing research in Andhra Pradesh conducted by the authors. This discussion draws on interviews with APERC regulators and staff, consultants, government officials, industrial and domestic consumers, farmers groups, and NGOs, as well as documentary analysis of APERC orders, regulations, and selected internal documents. Since many of the interviews were conducted on a not for attribution basis to protect confidentiality and encourage candour, only institutional affiliations of interviewees are reported here. 11 Interview with former government and power sector official 1/5/06. 12Interview with consultant involved in AP reforms, 3/5/06. 13 Interview with Mr. Naidu, former Chief Minister of AP, Hyderabad, 1/6/06.
Engineering Staff College of India Page No. D.27
14 Government of Andhra Pradesh (insert url) and Government of Orissa (insert url). Main deviations are slight modifications to the selection committee for regulators that replace one government official with another, and the addition of three functions to an already long list of eight. 15Interview with APERC staff, 25/5/06. 16Interview with APERC staff, 1/6/06. 17 This measure was taken prior to the passage of the Electricity Act, which requires cost of service as a matter of law, albeit somewhat controversially so. 18Interview with consultant to APERC, 2/6/06. 19Interview with consultants, 3/5/06, and 2/5/06. 20Interview with consultant, 2/5/06 21Interview with APERC staff, 26/5/06. 22APERC tariff order 2004-05 available at www.ercap.org 23That the regulator was charged with such an intensely political issue itself reinforces the political nature of the regulatory task. 24Interview with consultants, 2/5/06 and 3/5/06. 25APRC order on Open Access. Available at www.ercap.org 26 This observation is based on a personal visit, during which the authors were allowed to open and view files on investment plans on the premises, but only after initial denial followed by a personal appeal to the Chairperson. 27 Based on analysis conducted by the authors using data from tariff orders supplemented with information from APERC. This analysis excludes local language petitions, which are currently being translated. 28 Interview with APERC, 2/5/06. 29Interview with senior management of APTransco, 19/5/06. 30Interview with APERC official, 1/5/06. 31Interview with citizen petitioner before APERC, 2/5/06, and with senior management of APTransco,19/5/06. 32This section is based on ongoing research in Delhi conducted by the authors. This discussion draws on interviews with DERC regulators and staff, consultants, government officials, industrial and domestic consumers, NGOs, and media as well as documentary analysis of DERC orders,regulations, and selected internal documents. Since many of the interviews were conducted on a not for attribution basis to protect confidentiality and encourage candour, only institutional affiliations of interviewees are reported here.
Engineering Staff College of India Page No. D.28
33These details are available in the early orders (1999-2002) of the DERC at www.dercind.org and succinctly summarized in Prayas (2006). They are also discussed in some detail in Agarwal, Alexander and Tenenbaum (2003). 34It is worth noting that the initial bids failed to meet the minimum loss reduction trajectory set by the government. The floor level of reduction had to be abandoned to entice private actors to participate in the sector. 35Interview with former staff of DERC, 2/2006. 36Interview with former Delhi government official, 22/2/06. 37Interview with DERC staff, 7/12/05. 38Interview with former DERC Chairman, 24/3/06. 39Interview with former DERC staff, 16/2/06. 40Interview with former Delhi government official, 22/2/06. 41Interview with consumer representative, 20/1/06. 42Interview with consumer representative, 20/1/06. 43Interview with former Delhi government officials, 30/1/06 and 22/2/06. 44 The average required tariff hike was 6.6%. The DERC raised the tariffs of subsidized customers by 10% and subsidizing customers, largely industry by 4-5% in order to shift toward cost reflective tariffs. 45Based on analysis conducted by the authors using data in DERC tariff orders. 46Interview with consumer representative, 20/1/06. 47Interview with Chamber of Commerce representative, 31/1/06. 48The phrase is, of course, taken and adapted from James Scott's fascinating work in the entirely separate context of peasant resistance. 49For a critical discussion of the global approach to electricity restructuring and specifically of its applicability to India and other developing countries, see Dubash and Singh (2005). 50 Maharashtra is the fourth case in the larger project of which the AP and Delhi cases are a part.
The World Bank Group September 1996
Note No. 87
Private Sector Development Department ▪ Vice Presidency for Finance and Private Sector Development
This Note compares the effects of price cap and rate-of-return regulation on the risks borne by
regulated utilities. It presents evidence that price cap regulation subjects firms to greater risks
and therefore raises their cost of capital. This result has one clear implication: firms regulated by
price caps must be permitted to earn higher returns. If they are not, they will be unable to attract
new investment capital and the quality of their service will decline.
the rule is RPI + K, where K represents bothexpected productivity gains and a permittedannual increase in the real price of water toallow for quality improvements (think of it asRPI – X + Q, where Q stands for the qualityimprovement). Since 1989, price caps have alsobeen used in the United States to adjust theprices charged by the long-distance telephonecompany AT&T. In New Zealand, a price capis used to adjust Telecom New Zealand’s rentalcharge for a residential phone line. Price capsare also used in some developing countries.Malaysia, Mexico, and Peru, for example, usethem for telecommunications, and Argentinauses them for gas and electricity as well.
In practice, price cap and rate-of-return regula-tion are less different than they might seem. First,a rule like RPI – X considers only how pricesshould be changed from year to year; it doesn’ttell a regulator how to set them in the first year.A regulator wanting to use price cap regulationfor a new service would need to set the initialprice in some way, and one obvious option isto consider the price the firm needs to chargeto earn a satisfactory rate of return. Second, aprice cap needs to be periodically reviewed: aregulator cannot reliably predict what changesin productivity will be possible in, say, ten years.In the United Kingdom, price caps typically arereviewed every five years. And during a review,
Price Caps, Rate-of-Return Regulation,and the Cost of Capital
Ian Alexanderand TimothyIrwin
Price caps and rate-of-return regulation
There are two main approaches to preventingmonopolistic infrastructure firms from chargingexcessively high prices: price cap regulation andrate-of-return regulation. The rate-of-return ap-proach is used in Canada, Japan, and the UnitedStates, where regulatory agencies fix the rate ofreturn that a utility can earn on its assets. Theyset the price the utility can charge so as to al-low it to earn a specified rate of return—and nomore. The regulated price can be adjusted up-ward if the utility starts making a lower rate ofreturn, and it will be adjusted downward if theutility makes a higher rate.
Over the past decade or so, the price cap ap-proach has become increasingly common in-ternationally because it is thought to give firmsstronger incentives to be efficient. Under thisapproach, the regulated price is adjusted eachyear by the rate of inflation plus or minus somepredetermined amount and without regard tochanges in the firm’s profits. In the United King-dom, for example, utilities are permitted toincrease their prices by the change in the con-sumer price index plus or minus a specifiedamount. In gas and electricity, the price-settingrule is called RPI – X, where RPI is the retailprice index and X represents the expected an-nual gain in the utility’s efficiency. In water,
PrivatesectorP U B L I C P O L I C Y F O R T H E
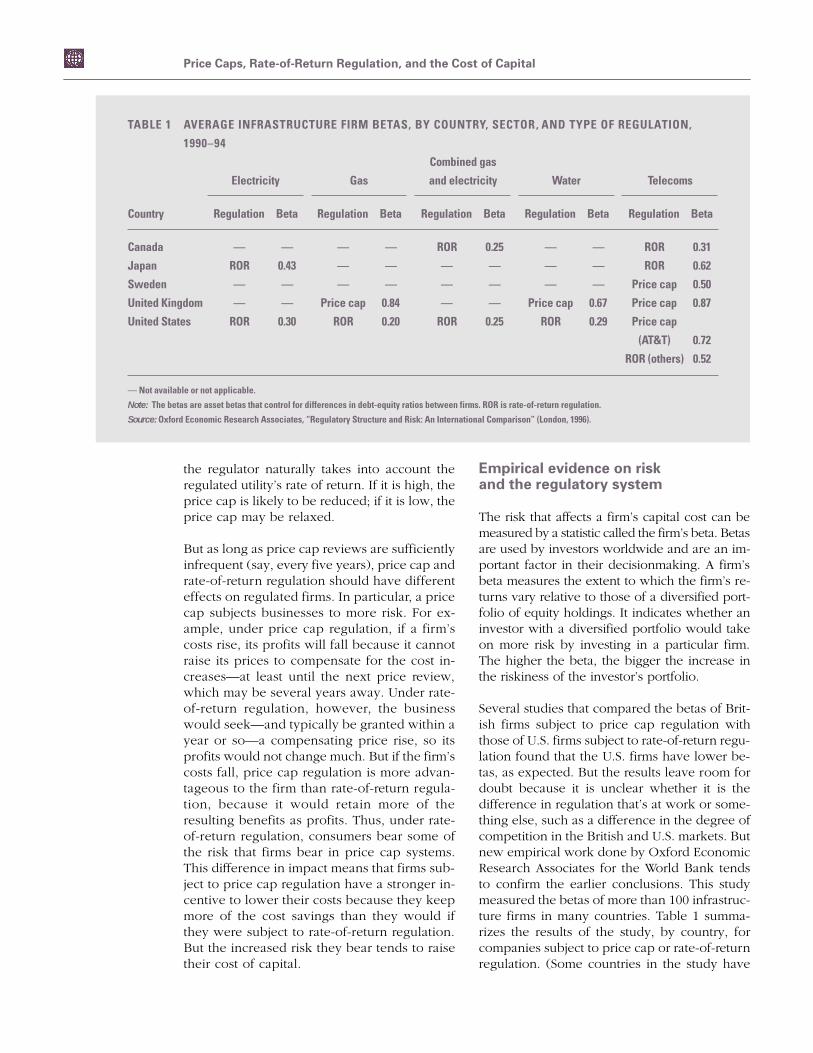
Price Caps, Rate-of-Return Regulation, and the Cost of Capital
the regulator naturally takes into account theregulated utility’s rate of return. If it is high, theprice cap is likely to be reduced; if it is low, theprice cap may be relaxed.
But as long as price cap reviews are sufficientlyinfrequent (say, every five years), price cap andrate-of-return regulation should have differenteffects on regulated firms. In particular, a pricecap subjects businesses to more risk. For ex-ample, under price cap regulation, if a firm’scosts rise, its profits will fall because it cannotraise its prices to compensate for the cost in-creases—at least until the next price review,which may be several years away. Under rate-of-return regulation, however, the businesswould seek—and typically be granted within ayear or so—a compensating price rise, so itsprofits would not change much. But if the firm’scosts fall, price cap regulation is more advan-tageous to the firm than rate-of-return regula-tion, because it would retain more of theresulting benefits as profits. Thus, under rate-of-return regulation, consumers bear some ofthe risk that firms bear in price cap systems.This difference in impact means that firms sub-ject to price cap regulation have a stronger in-centive to lower their costs because they keepmore of the cost savings than they would ifthey were subject to rate-of-return regulation.But the increased risk they bear tends to raisetheir cost of capital.
Empirical evidence on riskand the regulatory system
The risk that affects a firm’s capital cost can bemeasured by a statistic called the firm’s beta. Betasare used by investors worldwide and are an im-portant factor in their decisionmaking. A firm’sbeta measures the extent to which the firm’s re-turns vary relative to those of a diversified port-folio of equity holdings. It indicates whether aninvestor with a diversified portfolio would takeon more risk by investing in a particular firm.The higher the beta, the bigger the increase inthe riskiness of the investor’s portfolio.
Several studies that compared the betas of Brit-ish firms subject to price cap regulation withthose of U.S. firms subject to rate-of-return regu-lation found that the U.S. firms have lower be-tas, as expected. But the results leave room fordoubt because it is unclear whether it is thedifference in regulation that’s at work or some-thing else, such as a difference in the degree ofcompetition in the British and U.S. markets. Butnew empirical work done by Oxford EconomicResearch Associates for the World Bank tendsto confirm the earlier conclusions. This studymeasured the betas of more than 100 infrastruc-ture firms in many countries. Table 1 summa-rizes the results of the study, by country, forcompanies subject to price cap or rate-of-returnregulation. (Some countries in the study have
TABLE 1 AVERAGE INFRASTRUCTURE FIRM BETAS, BY COUNTRY, SECTOR, AND TYPE OF REGULATION,
1990–94
Combined gas
Electricity Gas and electricity Water Telecoms
Country Regulation Beta Regulation Beta Regulation Beta Regulation Beta Regulation Beta
Canada — — — — ROR 0.25 — — ROR 0.31
Japan ROR 0.43 — — — — — — ROR 0.62
Sweden — — — — — — — — Price cap 0.50
United Kingdom — — Price cap 0.84 — — Price cap 0.67 Price cap 0.87
United States ROR 0.30 ROR 0.20 ROR 0.25 ROR 0.29 Price cap
(AT&T) 0.72
ROR (others) 0.52
— Not available or not applicable.
Note: The betas are asset betas that control for differences in debt-equity ratios between firms. ROR is rate-of-return regulation.
Source: Oxford Economic Research Associates, “Regulatory Structure and Risk: An International Comparison” (London, 1996).
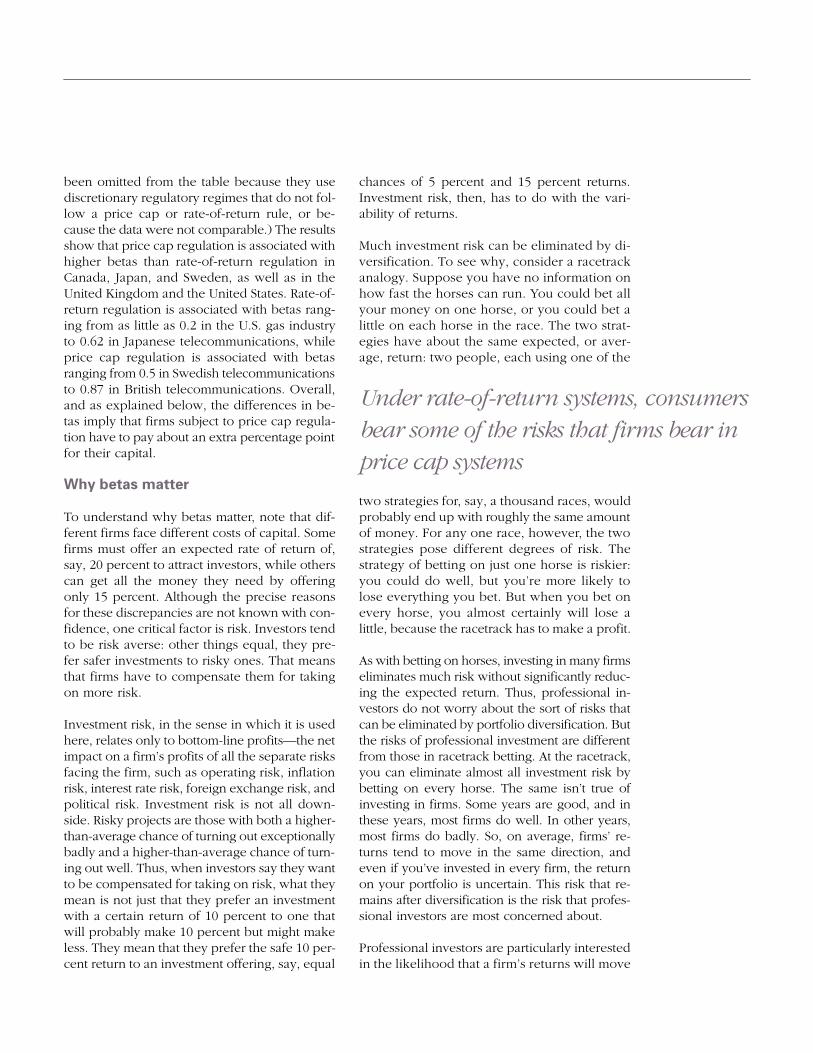
been omitted from the table because they usediscretionary regulatory regimes that do not fol-low a price cap or rate-of-return rule, or be-cause the data were not comparable.) The resultsshow that price cap regulation is associated withhigher betas than rate-of-return regulation inCanada, Japan, and Sweden, as well as in theUnited Kingdom and the United States. Rate-of-return regulation is associated with betas rang-ing from as little as 0.2 in the U.S. gas industryto 0.62 in Japanese telecommunications, whileprice cap regulation is associated with betasranging from 0.5 in Swedish telecommunicationsto 0.87 in British telecommunications. Overall,and as explained below, the differences in be-tas imply that firms subject to price cap regula-tion have to pay about an extra percentage pointfor their capital.
Why betas matter
To understand why betas matter, note that dif-ferent firms face different costs of capital. Somefirms must offer an expected rate of return of,say, 20 percent to attract investors, while otherscan get all the money they need by offeringonly 15 percent. Although the precise reasonsfor these discrepancies are not known with con-fidence, one critical factor is risk. Investors tendto be risk averse: other things equal, they pre-fer safer investments to risky ones. That meansthat firms have to compensate them for takingon more risk.
Investment risk, in the sense in which it is usedhere, relates only to bottom-line profits—the netimpact on a firm’s profits of all the separate risksfacing the firm, such as operating risk, inflationrisk, interest rate risk, foreign exchange risk, andpolitical risk. Investment risk is not all down-side. Risky projects are those with both a higher-than-average chance of turning out exceptionallybadly and a higher-than-average chance of turn-ing out well. Thus, when investors say they wantto be compensated for taking on risk, what theymean is not just that they prefer an investmentwith a certain return of 10 percent to one thatwill probably make 10 percent but might makeless. They mean that they prefer the safe 10 per-cent return to an investment offering, say, equal
chances of 5 percent and 15 percent returns.Investment risk, then, has to do with the vari-ability of returns.
Much investment risk can be eliminated by di-versification. To see why, consider a racetrackanalogy. Suppose you have no information onhow fast the horses can run. You could bet allyour money on one horse, or you could bet alittle on each horse in the race. The two strat-egies have about the same expected, or aver-age, return: two people, each using one of the
two strategies for, say, a thousand races, wouldprobably end up with roughly the same amountof money. For any one race, however, the twostrategies pose different degrees of risk. Thestrategy of betting on just one horse is riskier:you could do well, but you’re more likely tolose everything you bet. But when you bet onevery horse, you almost certainly will lose alittle, because the racetrack has to make a profit.
As with betting on horses, investing in many firmseliminates much risk without significantly reduc-ing the expected return. Thus, professional in-vestors do not worry about the sort of risks thatcan be eliminated by portfolio diversification. Butthe risks of professional investment are differentfrom those in racetrack betting. At the racetrack,you can eliminate almost all investment risk bybetting on every horse. The same isn’t true ofinvesting in firms. Some years are good, and inthese years, most firms do well. In other years,most firms do badly. So, on average, firms’ re-turns tend to move in the same direction, andeven if you’ve invested in every firm, the returnon your portfolio is uncertain. This risk that re-mains after diversification is the risk that profes-sional investors are most concerned about.
Professional investors are particularly interestedin the likelihood that a firm’s returns will move
Under rate-of-return systems, consumersbear some of the risks that firms bear inprice cap systems
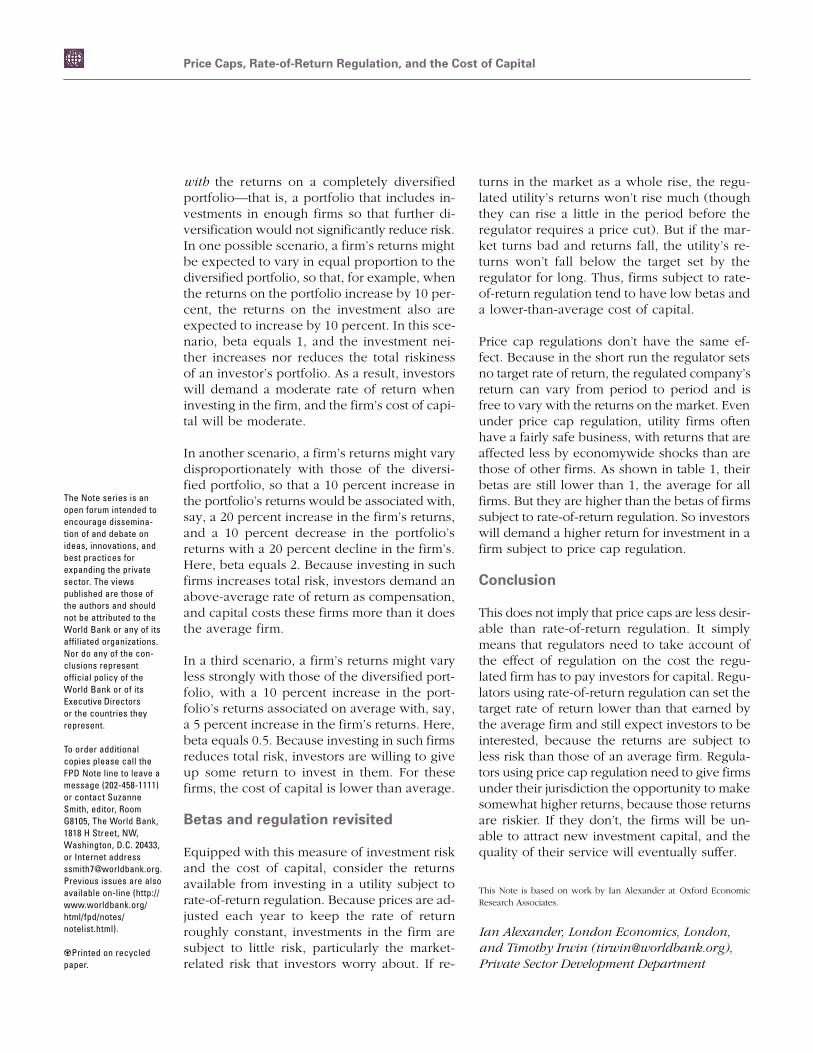
Price Caps, Rate-of-Return Regulation, and the Cost of Capital
with the returns on a completely diversifiedportfolio—that is, a portfolio that includes in-vestments in enough firms so that further di-versification would not significantly reduce risk.In one possible scenario, a firm’s returns mightbe expected to vary in equal proportion to thediversified portfolio, so that, for example, whenthe returns on the portfolio increase by 10 per-cent, the returns on the investment also areexpected to increase by 10 percent. In this sce-nario, beta equals 1, and the investment nei-ther increases nor reduces the total riskinessof an investor’s portfolio. As a result, investorswill demand a moderate rate of return wheninvesting in the firm, and the firm’s cost of capi-tal will be moderate.
In another scenario, a firm’s returns might varydisproportionately with those of the diversi-fied portfolio, so that a 10 percent increase inthe portfolio’s returns would be associated with,say, a 20 percent increase in the firm’s returns,and a 10 percent decrease in the portfolio’sreturns with a 20 percent decline in the firm’s.Here, beta equals 2. Because investing in suchfirms increases total risk, investors demand anabove-average rate of return as compensation,and capital costs these firms more than it doesthe average firm.
In a third scenario, a firm’s returns might varyless strongly with those of the diversified port-folio, with a 10 percent increase in the port-folio’s returns associated on average with, say,a 5 percent increase in the firm’s returns. Here,beta equals 0.5. Because investing in such firmsreduces total risk, investors are willing to giveup some return to invest in them. For thesefirms, the cost of capital is lower than average.
Betas and regulation revisited
Equipped with this measure of investment riskand the cost of capital, consider the returnsavailable from investing in a utility subject torate-of-return regulation. Because prices are ad-justed each year to keep the rate of returnroughly constant, investments in the firm aresubject to little risk, particularly the market-related risk that investors worry about. If re-
turns in the market as a whole rise, the regu-lated utility’s returns won’t rise much (thoughthey can rise a little in the period before theregulator requires a price cut). But if the mar-ket turns bad and returns fall, the utility’s re-turns won’t fall below the target set by theregulator for long. Thus, firms subject to rate-of-return regulation tend to have low betas anda lower-than-average cost of capital.
Price cap regulations don’t have the same ef-fect. Because in the short run the regulator setsno target rate of return, the regulated company’sreturn can vary from period to period and isfree to vary with the returns on the market. Evenunder price cap regulation, utility firms oftenhave a fairly safe business, with returns that areaffected less by economywide shocks than arethose of other firms. As shown in table 1, theirbetas are still lower than 1, the average for allfirms. But they are higher than the betas of firmssubject to rate-of-return regulation. So investorswill demand a higher return for investment in afirm subject to price cap regulation.
Conclusion
This does not imply that price caps are less desir-able than rate-of-return regulation. It simplymeans that regulators need to take account ofthe effect of regulation on the cost the regu-lated firm has to pay investors for capital. Regu-lators using rate-of-return regulation can set thetarget rate of return lower than that earned bythe average firm and still expect investors to beinterested, because the returns are subject toless risk than those of an average firm. Regula-tors using price cap regulation need to give firmsunder their jurisdiction the opportunity to makesomewhat higher returns, because those returnsare riskier. If they don’t, the firms will be un-able to attract new investment capital, and thequality of their service will eventually suffer.
This Note is based on work by Ian Alexander at Oxford EconomicResearch Associates.
Ian Alexander, London Economics, London,and Timothy Irwin ([email protected]),Private Sector Development Department
The Note series is anopen forum intended toencourage dissemina-tion of and debate onideas, innovations, andbest practices forexpanding the privatesector. The viewspublished are those ofthe authors and shouldnot be attributed to theWorld Bank or any of itsaffiliated organizations.Nor do any of the con-clusions representofficial policy of theWorld Bank or of itsExecutive Directors or the countries theyrepresent.
To order additionalcopies please call theFPD Note line to leave amessage (202-458-1111)or contact SuzanneSmith, editor, RoomG8105, The World Bank,1818 H Street, NW,Washington, D.C. 20433,or Internet [email protected] issues are alsoavailable on-line (http://www.worldbank.org/html/fpd/notes/notelist.html).
9Printed on recycledpaper.
PRICE CAP AND REVENUE CAP REGULATION
Mark A. Jamison Public Utility Research Center
University of Florida P.O. Box 117142
Gainesville, FL 32611-7142 [email protected]
October 2005
For the Encyclopedia of Energy Engineering and Technology (forthcoming).
Keywords: price caps, incentives, revenue caps, information asymmetry
1
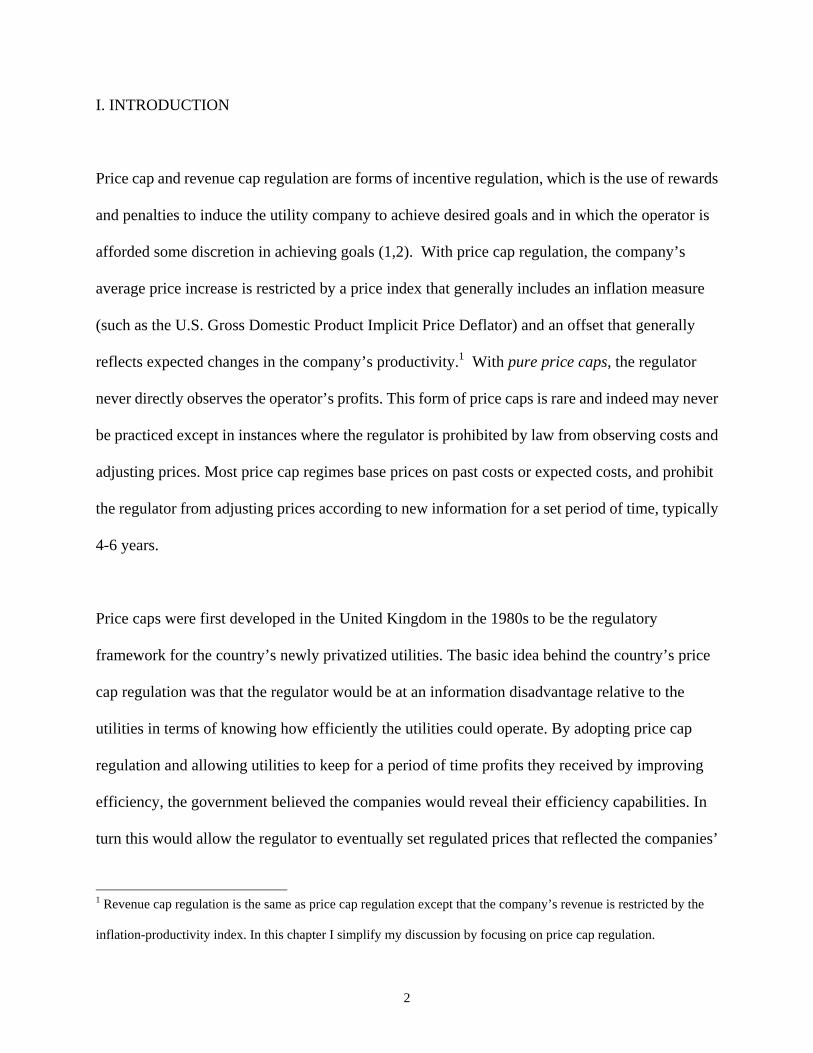
I. INTRODUCTION
Price cap and revenue cap regulation are forms of incentive regulation, which is the use of rewards
and penalties to induce the utility company to achieve desired goals and in which the operator is
afforded some discretion in achieving goals (1,2). With price cap regulation, the company’s
average price increase is restricted by a price index that generally includes an inflation measure
(such as the U.S. Gross Domestic Product Implicit Price Deflator) and an offset that generally
reflects expected changes in the company’s productivity.1 With pure price caps, the regulator
never directly observes the operator’s profits. This form of price caps is rare and indeed may never
be practiced except in instances where the regulator is prohibited by law from observing costs and
adjusting prices. Most price cap regimes base prices on past costs or expected costs, and prohibit
the regulator from adjusting prices according to new information for a set period of time, typically
4-6 years.
Price caps were first developed in the United Kingdom in the 1980s to be the regulatory
framework for the country’s newly privatized utilities. The basic idea behind the country’s price
cap regulation was that the regulator would be at an information disadvantage relative to the
utilities in terms of knowing how efficiently the utilities could operate. By adopting price cap
regulation and allowing utilities to keep for a period of time profits they received by improving
efficiency, the government believed the companies would reveal their efficiency capabilities. In
turn this would allow the regulator to eventually set regulated prices that reflected the companies’
1 Revenue cap regulation is the same as price cap regulation except that the company’s revenue is restricted by the
inflation-productivity index. In this chapter I simplify my discussion by focusing on price cap regulation.
2

true abilities. Price cap regulation did not work out entirely as planned, so adjustments have
been made to the point that the U.K.’s price cap regulation looks a lot like U.S. rate of return
regulation.2
There are three important elements of an incentive regulation plan: (1) the reward/penalty
structure; (2) allowing the company an opportunity to choose its goals; and (3) allowing the
operator latitude in how it will achieve its goals. An example of a reward/penalty structure would
be allowing the company to retain higher (lower) profits if it increases (decreases) its operating
efficiency. Allowing the company a role in choosing its goals is referred to as “a menu of options”
whereby the regulator matches greater potential rewards with more ambitious goals. For example,
the company may be allowed to choose between a goal of decreasing costs by 5 percent and
keeping 50 percent of the profits it receives above its cost of capital, and a goal of decreasing costs
by 10 percent and keeping 100 percent of the profits it receives above its cost of capital.3 If the
company chose the goal of decreasing costs by 10%, the operator would have the latitude to do this
by, for example, negotiating lower input prices from suppliers, decreasing overhead, improving
network reliability, obtaining lower-cost capital, or some combination of methods.
2 Excellent summaries of the U.K experience can be found in several studies (3, 4, 5). A critical difference between
U.S.-style rate of return regulation and U.K.-style price cap regulation are that the U.K. regimes have fixed time
periods between price reviews, while under rate of return regulation price reviews are triggered by high or low
earnings (relative to the cost of capital).
3 A company’s cost of capital is the interest that the company pays on its debt plus the return that it must provide to
shareholders to ensure they continue to invest in the company.
3
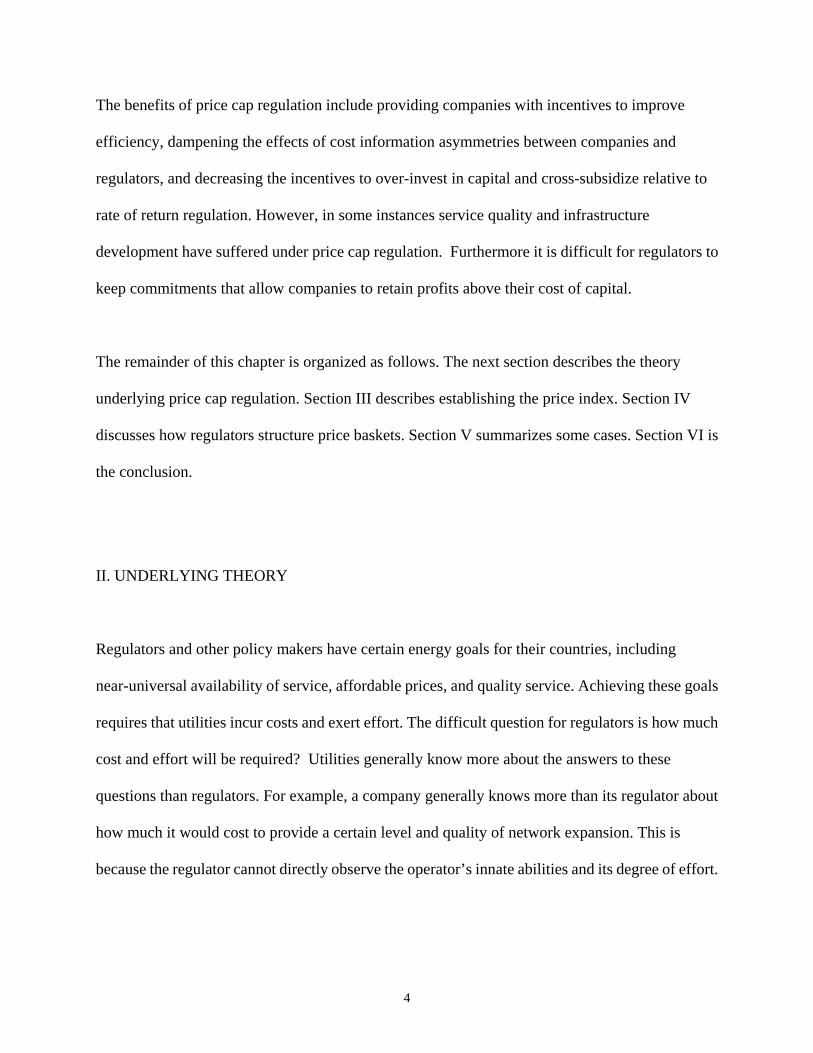
The benefits of price cap regulation include providing companies with incentives to improve
efficiency, dampening the effects of cost information asymmetries between companies and
regulators, and decreasing the incentives to over-invest in capital and cross-subsidize relative to
rate of return regulation. However, in some instances service quality and infrastructure
development have suffered under price cap regulation. Furthermore it is difficult for regulators to
keep commitments that allow companies to retain profits above their cost of capital.
The remainder of this chapter is organized as follows. The next section describes the theory
underlying price cap regulation. Section III describes establishing the price index. Section IV
discusses how regulators structure price baskets. Section V summarizes some cases. Section VI is
the conclusion.
II. UNDERLYING THEORY
Regulators and other policy makers have certain energy goals for their countries, including
near-universal availability of service, affordable prices, and quality service. Achieving these goals
requires that utilities incur costs and exert effort. The difficult question for regulators is how much
cost and effort will be required? Utilities generally know more about the answers to these
questions than regulators. For example, a company generally knows more than its regulator about
how much it would cost to provide a certain level and quality of network expansion. This is
because the regulator cannot directly observe the operator’s innate abilities and its degree of effort.
4
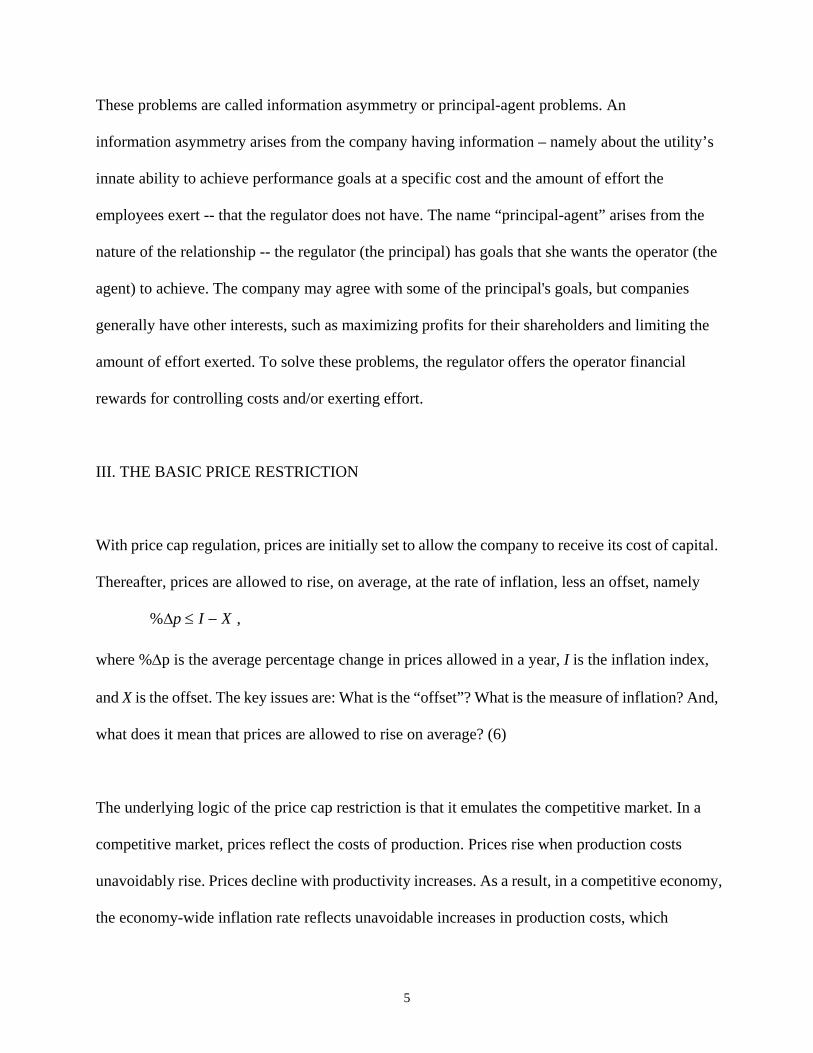
These problems are called information asymmetry or principal-agent problems. An
information asymmetry arises from the company having information – namely about the utility’s
innate ability to achieve performance goals at a specific cost and the amount of effort the
employees exert -- that the regulator does not have. The name “principal-agent” arises from the
nature of the relationship -- the regulator (the principal) has goals that she wants the operator (the
agent) to achieve. The company may agree with some of the principal's goals, but companies
generally have other interests, such as maximizing profits for their shareholders and limiting the
amount of effort exerted. To solve these problems, the regulator offers the operator financial
rewards for controlling costs and/or exerting effort.
III. THE BASIC PRICE RESTRICTION
With price cap regulation, prices are initially set to allow the company to receive its cost of capital.
Thereafter, prices are allowed to rise, on average, at the rate of inflation, less an offset, namely
, XIp −≤∆%
where %∆p is the average percentage change in prices allowed in a year, I is the inflation index,
and X is the offset. The key issues are: What is the “offset”? What is the measure of inflation? And,
what does it mean that prices are allowed to rise on average? (6)
The underlying logic of the price cap restriction is that it emulates the competitive market. In a
competitive market, prices reflect the costs of production. Prices rise when production costs
unavoidably rise. Prices decline with productivity increases. As a result, in a competitive economy,
the economy-wide inflation rate reflects unavoidable increases in production costs, which
5
accounts for productivity gains. If the regulated company is just like the average firm in the
economy, its prices should rise at the general rate of inflation (7).
Therefore, the X-factor should represent the difference between the regulated firm and the average
firm in the economy. There are two key differences to consider, namely, the regulated company’s
ability to improve productivity, and changes in its input costs. If the regulated company can
improve its productivity more than the average firm in the economy, or if the regulated company’s
input prices increase less than input prices for the average firm, this would imply X > 0. The
opposite situations would imply X < 0. If the regulated firm is just like the average firm, this would
imply X = 0. For example, consider a situation in which the average firm in the economy improves
its productivity by 3 percent per year and its input prices increase 1 percent per year. Further
assume that the regulated firm can improve its productivity by 5 percent per year and its input
prices actually decrease 2 percent per year. The appropriate X-factor would be
. ( ) ( ) 51235 =−−−−=X
There are two basic approaches for establishing an X-factor, namely, the historical approach and
the forecast approach. The historical approach compares estimates of the Total Factor Productivity
(TFP) for the average firm in the economy to estimates for the regulated company. The X-factor is
set equal to the difference between the TFP estimates after adjusting for differences in input prices.
A modification to this approach adds a stretch factor, S, that accounts for the effects of historic
regulation and/or anticipated changes in industry conditions. Examples of explicit stretch factors
include 0.5 percent for AT&T by the Federal Communications Commission and 1 percent for local
exchange telephone companies in Canada.
6
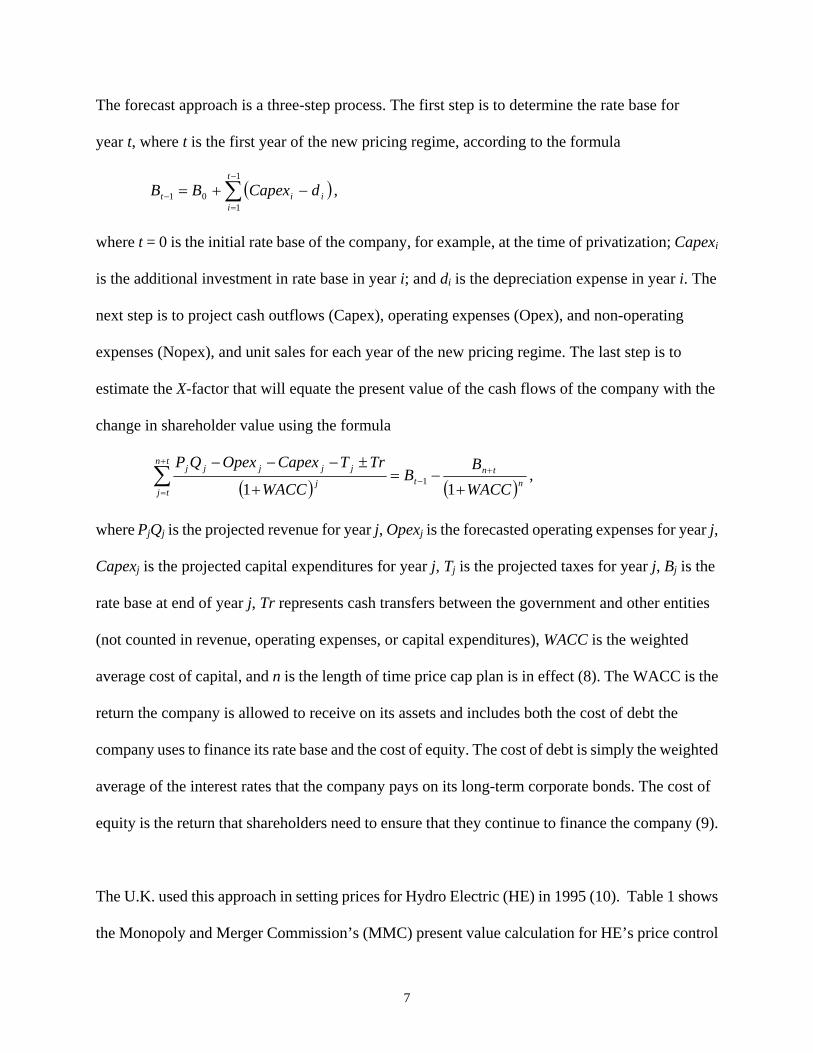
The forecast approach is a three-step process. The first step is to determine the rate base for
year t, where t is the first year of the new pricing regime, according to the formula
, ( )∑−
=− −+=
1
101
t
iiit dCapexBB
where t = 0 is the initial rate base of the company, for example, at the time of privatization; Capexi
is the additional investment in rate base in year i; and di is the depreciation expense in year i. The
next step is to project cash outflows (Capex), operating expenses (Opex), and non-operating
expenses (Nopex), and unit sales for each year of the new pricing regime. The last step is to
estimate the X-factor that will equate the present value of the cash flows of the company with the
change in shareholder value using the formula
( ) ( )n
tnt
tn
tjj
jjjjj
WACCB
BWACC
TrTCapexOpexQP
+−=
+
±−−−+
−
+
=∑
11 1 ,
where PjQj is the projected revenue for year j, Opexj is the forecasted operating expenses for year j,
Capexj is the projected capital expenditures for year j, Tj is the projected taxes for year j, Bj is the
rate base at end of year j, Tr represents cash transfers between the government and other entities
(not counted in revenue, operating expenses, or capital expenditures), WACC is the weighted
average cost of capital, and n is the length of time price cap plan is in effect (8). The WACC is the
return the company is allowed to receive on its assets and includes both the cost of debt the
company uses to finance its rate base and the cost of equity. The cost of debt is simply the weighted
average of the interest rates that the company pays on its long-term corporate bonds. The cost of
equity is the return that shareholders need to ensure that they continue to finance the company (9).
The U.K. used this approach in setting prices for Hydro Electric (HE) in 1995 (10). Table 1 shows
the Monopoly and Merger Commission’s (MMC) present value calculation for HE’s price control
7
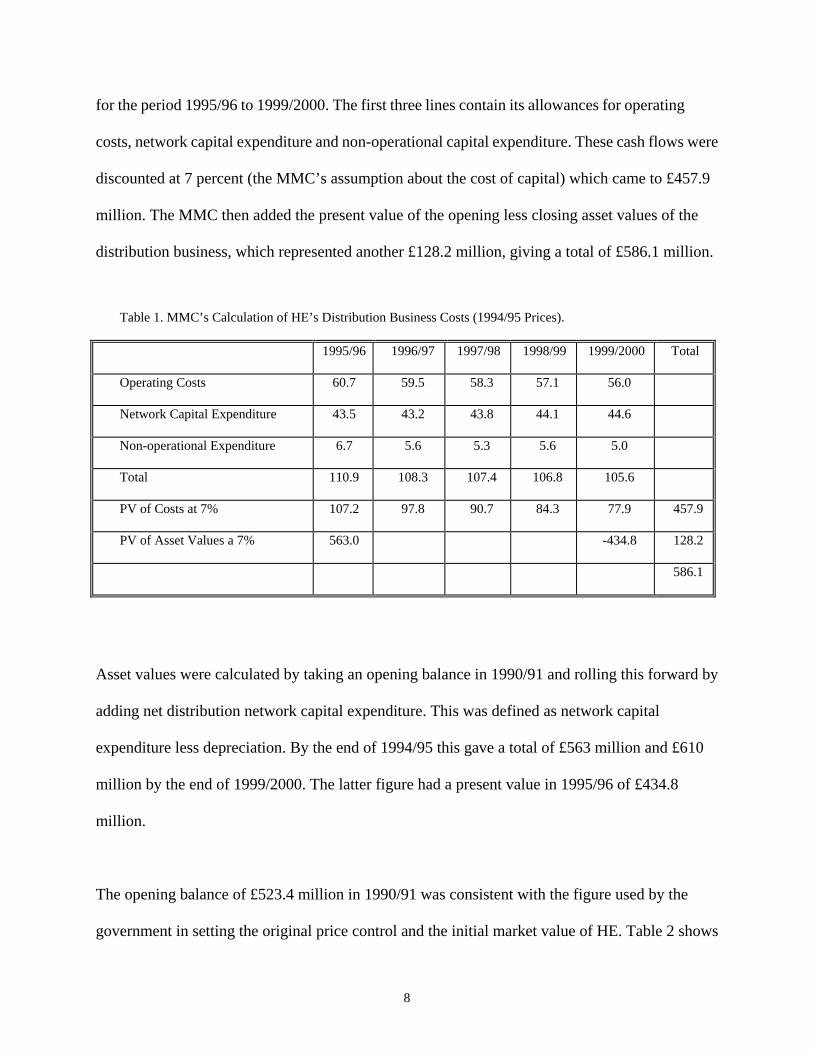
for the period 1995/96 to 1999/2000. The first three lines contain its allowances for operating
costs, network capital expenditure and non-operational capital expenditure. These cash flows were
discounted at 7 percent (the MMC’s assumption about the cost of capital) which came to £457.9
million. The MMC then added the present value of the opening less closing asset values of the
distribution business, which represented another £128.2 million, giving a total of £586.1 million.
Table 1. MMC’s Calculation of HE’s Distribution Business Costs (1994/95 Prices).
1995/96 1996/97 1997/98 1998/99 1999/2000 Total
Operating Costs 60.7 59.5 58.3 57.1 56.0
Network Capital Expenditure 43.5 43.2 43.8 44.1 44.6
Non-operational Expenditure 6.7 5.6 5.3 5.6 5.0
Total 110.9 108.3 107.4 106.8 105.6
PV of Costs at 7% 107.2 97.8 90.7 84.3 77.9 457.9
PV of Asset Values a 7% 563.0 -434.8 128.2
586.1
Asset values were calculated by taking an opening balance in 1990/91 and rolling this forward by
adding net distribution network capital expenditure. This was defined as network capital
expenditure less depreciation. By the end of 1994/95 this gave a total of £563 million and £610
million by the end of 1999/2000. The latter figure had a present value in 1995/96 of £434.8
million.
The opening balance of £523.4 million in 1990/91 was consistent with the figure used by the
government in setting the original price control and the initial market value of HE. Table 2 shows
8
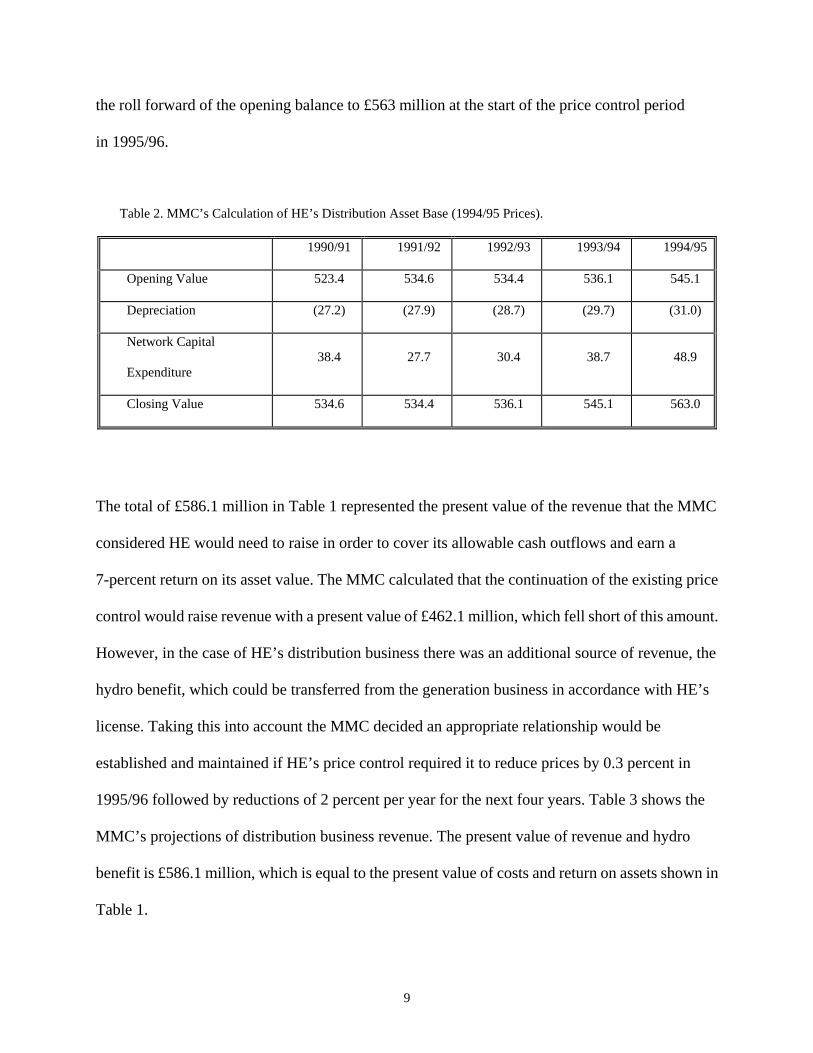
the roll forward of the opening balance to £563 million at the start of the price control period
in 1995/96.
Table 2. MMC’s Calculation of HE’s Distribution Asset Base (1994/95 Prices).
1990/91 1991/92 1992/93 1993/94 1994/95
Opening Value 523.4 534.6 534.4 536.1 545.1
Depreciation (27.2) (27.9) (28.7) (29.7) (31.0)
Network Capital
Expenditure 38.4 27.7 30.4 38.7 48.9
Closing Value 534.6 534.4 536.1 545.1 563.0
The total of £586.1 million in Table 1 represented the present value of the revenue that the MMC
considered HE would need to raise in order to cover its allowable cash outflows and earn a
7-percent return on its asset value. The MMC calculated that the continuation of the existing price
control would raise revenue with a present value of £462.1 million, which fell short of this amount.
However, in the case of HE’s distribution business there was an additional source of revenue, the
hydro benefit, which could be transferred from the generation business in accordance with HE’s
license. Taking this into account the MMC decided an appropriate relationship would be
established and maintained if HE’s price control required it to reduce prices by 0.3 percent in
1995/96 followed by reductions of 2 percent per year for the next four years. Table 3 shows the
MMC’s projections of distribution business revenue. The present value of revenue and hydro
benefit is £586.1 million, which is equal to the present value of costs and return on assets shown in
Table 1.
9
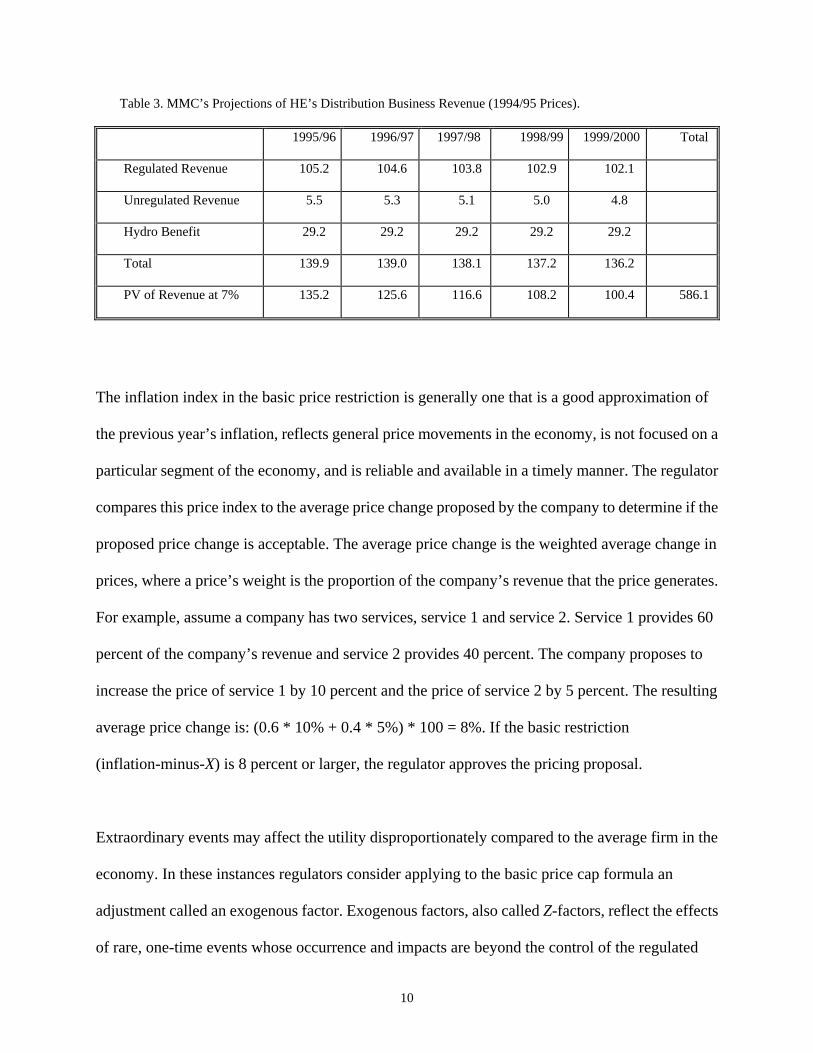
Table 3. MMC’s Projections of HE’s Distribution Business Revenue (1994/95 Prices).
1995/96 1996/97 1997/98 1998/99 1999/2000 Total
Regulated Revenue 105.2 104.6 103.8 102.9 102.1
Unregulated Revenue 5.5 5.3 5.1 5.0 4.8
Hydro Benefit 29.2 29.2 29.2 29.2 29.2
Total 139.9 139.0 138.1 137.2 136.2
PV of Revenue at 7% 135.2 125.6 116.6 108.2 100.4 586.1
The inflation index in the basic price restriction is generally one that is a good approximation of
the previous year’s inflation, reflects general price movements in the economy, is not focused on a
particular segment of the economy, and is reliable and available in a timely manner. The regulator
compares this price index to the average price change proposed by the company to determine if the
proposed price change is acceptable. The average price change is the weighted average change in
prices, where a price’s weight is the proportion of the company’s revenue that the price generates.
For example, assume a company has two services, service 1 and service 2. Service 1 provides 60
percent of the company’s revenue and service 2 provides 40 percent. The company proposes to
increase the price of service 1 by 10 percent and the price of service 2 by 5 percent. The resulting
average price change is: (0.6 * 10% + 0.4 * 5%) * 100 = 8%. If the basic restriction
(inflation-minus-X) is 8 percent or larger, the regulator approves the pricing proposal.
Extraordinary events may affect the utility disproportionately compared to the average firm in the
economy. In these instances regulators consider applying to the basic price cap formula an
adjustment called an exogenous factor. Exogenous factors, also called Z-factors, reflect the effects
of rare, one-time events whose occurrence and impacts are beyond the control of the regulated
10
company and that affect the company differently than the average firm in the economy. An
example might be a special tax placed on electric utilities. These exogenous factors increase or
decrease the price index, depending on how the extraordinary event affected the utility.
IV. SERVICE BASKETS
A service basket is a group of services placed under a common inflation-minus-X restriction.
Services that the regulator wants to protect from price increases or decreases relative to certain
other services are placed in a separate basket. For example, if the regulator does not want the
company to change urban prices relative to rural prices, the regulator might place urban prices in
one basket and rural prices in another.
The company is allowed to change the relative price levels of the services within a basket, subject
to two possible restrictions. The first type of restriction is a limit on individual prices. Regulators
may apply such a restriction by placing an absolute restriction on the price (e.g., the price per kWh
for residential electricity cannot exceed $0.05) or a percentage restriction (e.g., the price per kWh
for residential electricity cannot increase more than 10 percent per year).
Regulators may also apply caps to subsets of services within a basket. For example, the regulator
may apply a restriction of inflation-minus-5 to all services and a sub-restriction of
inflation-minus-3 to residential services. In this case, the company’s average overall price would
need to decrease 5 percent in real terms and residential prices would have to decrease 3 percent in
real terms.
11
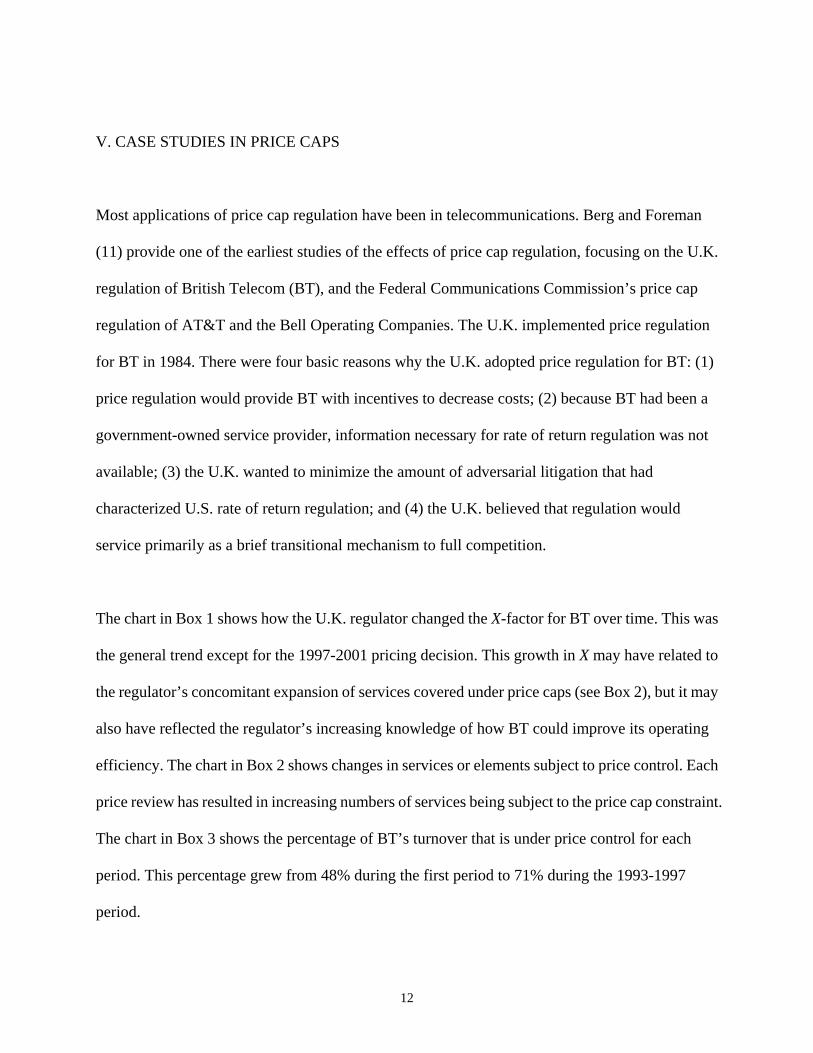
V. CASE STUDIES IN PRICE CAPS
Most applications of price cap regulation have been in telecommunications. Berg and Foreman
(11) provide one of the earliest studies of the effects of price cap regulation, focusing on the U.K.
regulation of British Telecom (BT), and the Federal Communications Commission’s price cap
regulation of AT&T and the Bell Operating Companies. The U.K. implemented price regulation
for BT in 1984. There were four basic reasons why the U.K. adopted price regulation for BT: (1)
price regulation would provide BT with incentives to decrease costs; (2) because BT had been a
government-owned service provider, information necessary for rate of return regulation was not
available; (3) the U.K. wanted to minimize the amount of adversarial litigation that had
characterized U.S. rate of return regulation; and (4) the U.K. believed that regulation would
service primarily as a brief transitional mechanism to full competition.
The chart in Box 1 shows how the U.K. regulator changed the X-factor for BT over time. This was
the general trend except for the 1997-2001 pricing decision. This growth in X may have related to
the regulator’s concomitant expansion of services covered under price caps (see Box 2), but it may
also have reflected the regulator’s increasing knowledge of how BT could improve its operating
efficiency. The chart in Box 2 shows changes in services or elements subject to price control. Each
price review has resulted in increasing numbers of services being subject to the price cap constraint.
The chart in Box 3 shows the percentage of BT’s turnover that is under price control for each
period. This percentage grew from 48% during the first period to 71% during the 1993-1997
period.
12
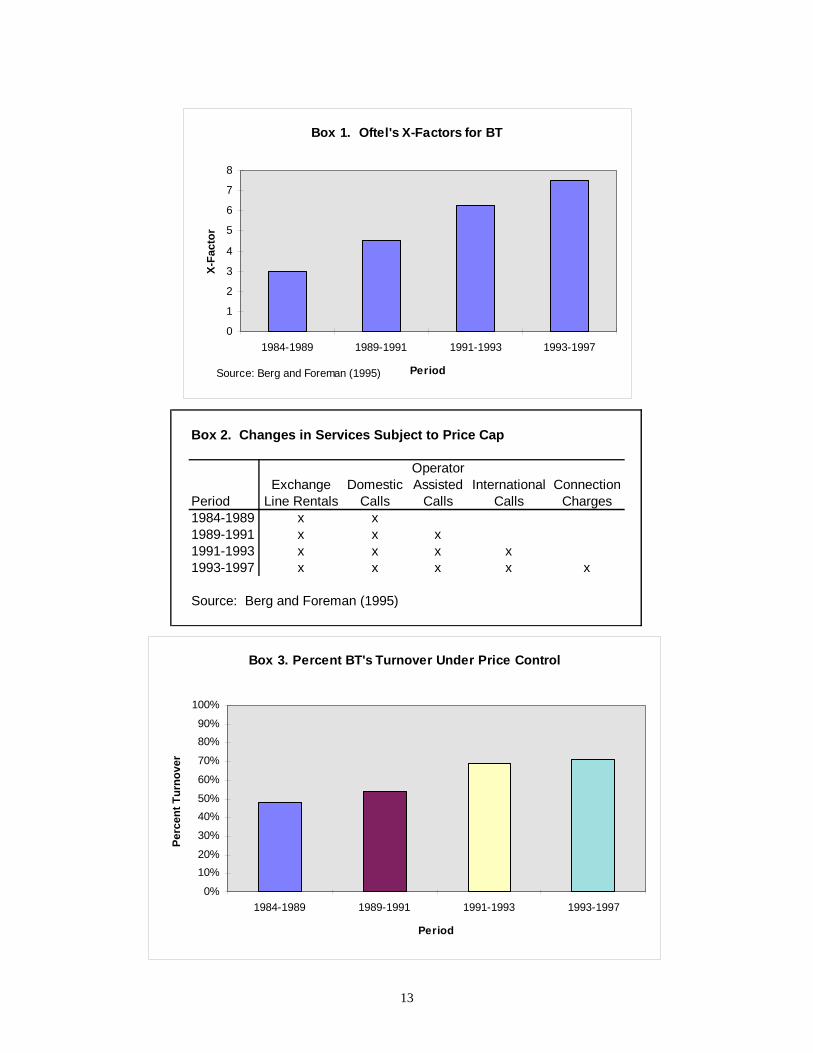
Box 1. Oftel's X-Factors for BT
0
1
2
3
4
5
6
7
8
1984-1989 1989-1991 1991-1993 1993-1997
Period
X-Fa
ctor
Source: Berg and Foreman (1995)
Box 2. Changes in Services Subject to Price Cap
OperatorExchange Domestic Assisted International Connection
Period Line Rentals Calls Calls Calls Charges1984-1989 x x1989-1991 x x x1991-1993 x x x x1993-1997 x x x x x
Source: Berg and Foreman (1995)
Box 3. Percent BT's Turnover Under Price Control
0%
10%20%
30%
40%50%
60%
70%
80%90%
100%
1984-1989 1989-1991 1991-1993 1993-1997
Period
Perc
ent T
urno
ver
13
Berg and Foreman (11) conducted their review using traditional rate evaluation criteria of
simplicity and public acceptability, freedom from controversy, revenue sufficiency, revenue
stability, price stability, fairness in apportionment of total costs, avoidance of undue rate
discrimination, and encouragement of efficiency. They concluded the following:
• Simplicity and public acceptability. It is unlikely that price caps resulted in simplicity
and administrative savings. Design of price caps required attention to service baskets
and price bands, floors, and ceilings. The desire to increase public and other
stakeholder acceptability created the need for additional control features. Each feature
has provided an opportunity for increased debate and litigation.
• Freedom from controversy. All the terms of price caps were controversial, including
service quality, how to handle “excessive” returns, and public perceptions of the
legitimacy of the regulation. Earnings sharing assessments in the U.S. were sensitive to
the same arbitrary cost allocations as rate of return regulation. Bell Operating
Companies were given optional regulatory contracts and generally chose the lower
productivity factors even though these included higher earnings sharing requirements.
• Revenue sufficiency. Competition complicated this objective. This would have been
true regardless of the method of regulation. Weisman (12) concluded that regulators
have less interest in revenue sufficiency once the price cap deal is struck.
14
• Revenue stability. This objective became one of net revenue stability (i.e., net
income) under price cap regulation. As a result, using price caps increases the
importance of making cross-subsidies explicit.
• Price stability. The price cap formula explicitly improves price predictability and
stability relative to other prices in the economy by aligning price changes with changes
in general inflation indices
• Fairness in apportionment of total costs. Initial prices were part of a political
compromise, so it was not immediately clear that price regulation results were different
than rate of return regulation results with respect to this view of fairness.
• Avoidance of undue rate discrimination. Price caps use ceilings and floors to contain
price discrimination. The U.K. regulator made three general changes to the price cap
regime over time relative to this issue: (1) increased the X-factor, perhaps in response to
high earnings by BT; (2) added special constraints to some prices, such as residential
exchange line rental; and (3) added additional services and baskets (such as the median
residential bill) over time.
• Encouragement of efficiency. BT was allowed significant opportunity for rate
rebalancing. Attenborough (13) found a total welfare gain of £2 billion per year in
1990/91 prices and 30 percent of this gain was from more efficient rate design. Price
regulation allowed companies to improve economic efficiency by aligning prices with
15
marginal costs, but competitive pressure, political constraints, and
non-efficiency-related regulatory objectives may prevent this from happening in other
situations.
VI. CONCLUSION
Incentives and opportunities to improve efficiency are generally greater under price cap regulation
than under rate of return regulation. This does not mean, however, that price cap regulation is the
right form of regulation in all situations. Compared to rate of return regulation, price cap
regulation decreases regulators’ concern for revenue adequacy because they have less direct
control over revenues. Also, regulators may come under pressure from consumer groups to break
their commitment to allow higher earnings if the regulated company improves efficiency:
consumers may view the higher profits as evidence that the regulator is not tough enough on the
utility or isn’t knowledgeable. This challenge to regulatory legitimacy has led some regulators to
roll back profits that they once said companies could keep.
When choosing a regulatory scheme, regulators should weigh these potential problems and
benefits of price cap regulation against the corresponding costs and benefits of rate of return
regulation. They may find that neither form of regulation is adequate by itself and adopt a hybrid
system that applies different aspects of different forms of regulation to craft a regulatory scheme
that makes sense for the regulator’s institutional, political, and economic situation (6).
16
REFERENCES
(1) Lewis, Tracy R.; Garmon, Chris. Fundamentals of Incentive Regulation, 12th PURC/World
Bank International Training Program on Utility Regulation and Strategy, Gainesville, FL, Jun
10-21, 2002.
(2) Berg, Sanford V. Introduction to the Fundamentals of Incentive Regulation, 12th PURC/World
Bank International Training Program on Utility Regulation and Strategy, Gainesville, FL, Jun
10-21, 2002.
(3) Baldwin, Robert, and Martin Cave. Understanding Regulation: Theory, Strategy, and
Practice; Oxford University Press: Oxford, U.K., 1999.
(4) Newbery, David M. Privatization, Restructuring, and Regulation of Network Utilities; MIT
Press: Cambridge, MA, 1999.
(5) Lee, Henry. Price cap: The UK’s efforts to regulate regional distribution companies, Kennedy
School of Government Case Program CR14-01-1619.0, Harvard University: Cambridge, MA,
2001.
(6) Sappington, David E.M. Price regulation. In Handbook of Telecommunications Economics;
Cave, Martin E., Majumdar, Sumit K., and Vogelsang, Ingo, Eds. North-Holland: Amsterdam,
2002; Vol. 1, 227-293.
(7) Bernstein, Jeffrey I.. and Sappington, David E. M. How to determine the X in RPI - X
regulation: A user's guide. Telecommunications Policy 2000, 24(1), 63-68.
(8) Green, R., and Martin Rodriguez Pardina. Resetting Price Controls for Privatized Utilities: A
Manual for Regulators, World Bank: Washington, DC, 1999.
17
(9) Bonbright, James C., Albert L. Danielsen, and David R. Kamerschen. Principles of
Public Utility Rates; Public Utilities Reports, Inc.: Arlington, Virginia, 1988.
(10) Office of Electricity Regulator. Transmission price control review of the National Grid
Company, Appendix D. November 1995. Available
http://cbdd.wsu.edu/kewlcontent/cdoutput/TR506/page29.htm (accessed 24 August 2005).
(11) Berg, Sanford V., and R. Dean Foreman. Price cap policies in the transition from monopoly to
competitive markets. Industrial and Corporate Change 1995, 4(4), 671-681.
(12) Weisman, D.L. Why less may be more under price-cap regulation. Journal of Regulatory
Economics 1994, 6,339-361.
(13) Attenborough, N., Foster, R., and Sandbach, J. Economic effects of telephony price changes
in the UK. NERA Topics Paper No. 8; NERA Economic Consulting: London, 1992.
18
Engineering Staff College of India Page No. G.1
ANNEXURE - G Legal Provisions Protecting Consumers Interest in Electricity Act Electricity Act 2003 has provided different sections dedicated to address the consumer issues relating to release of service connections, billing, redressal of grievances and also standards of performance to be achieved by the Licensee. Consumer is the centre of any service industry and electricity sector is no exception to this. All the consumer’s issues are addressed in the Electricity Act 2003, Electricity Rules 2005, National Electricity Policy and also the Tariff Policy. Let us examine these provisions The Preamble of the Electricity Act 2003 Reads: "An Act to consolidate the laws relating to generation, transmission, distribution, trading and use of electricity and generally for taking measures conducive to development of electricity industry, promoting competition therein, protecting interest of consumers and supply of electricity to all areas, rationalization of electricity tariff, ensuring transparent policies regarding subsidies, promotion of efficient and environmentally benign policies, constitution of Central Electricity Authority, Regulatory Commissions and establishment of Appellate Tribunal and for matters connected therewith or incidental thereto." The Act goes on to make Specific Provisions seeking to Protect the Consumers' Interests. Section 43 of the Act provides for universal service obligation for the licensee to provide connection to a consumer within a stipulated period of time, failing which the licensee is liable to pay compensation to the affected consumer. The relevant provision is reproduced below: "Section43. (Duty to Supply on Request): — (1) Save as otherwise provided in this Act, every distribution licensee, shall, on an application by the owner or occupier of any premises, give supply of electricity to such premises, within one month after receipt of the application requiring such supply: Provided that where such supply requires extension of distribution mains, or commissioning of new sub-stations, the distribution licensee shall supply the electricity to such premises immediately after such extension or commissioning or within such period as may be specified by the Appropriate Commission: Provided further that in case of a village or hamlet or area wherein no provision for supply of electricity exists, the Appropriate Commission may extend the said period as it may consider necessary for electrification of such village or hamlet or area. Explanation: For the purposes of this sub-section, "application" means the application complete in all respects in the appropriate form, as required by the distribution licensee, along with documents showing payment of necessary charges and other compliances. (2) It shall be the duty of every distribution licensee to provide, if required, electric plant or electric line for giving electric supply to the premises specified in sub-section (1): Provided that no person shall be entitled to demand, or to continue to receive, from a licensee a supply of electricity for any premises having a separate supply unless he

Engineering Staff College of India Page No. G.2
has agreed with the licensee to pay to him such price as determined by the Appropriate Commission. (3) If a distribution licensee fails to supply the electricity within the period specified in sub-section (1), he shall be liable to a penalty which may extend to one thousand rupees for each day of default." Issues such as whether a prospective consumer is also covered by Section 43 were examined by the courts and the decisions on the same are as follows. Supreme Court in the case of the Lucknow Development Authority (LDA) vs. M.K. Gupta. [CA 6237 (1990) dated 5th November 1993], wherein the Court inter alia interpreted the question as to whether a person who applied for a house from the LDA could be treated as a consumer and observed that a person who 'applied' was a 'potential user' and would be covered by the definitions of the words 'service' and 'consumer' under the said Act and would be eligible for relief for deficiency in service. The relevant extract is reproduced below: The Consumer Protection Act, 1986 opts for no less wider definition. It reads as under: "Consumer" means any person who, (i) buys any goods for a consideration which has been paid or promised or partly paid and partly promised, or under any system of deferred payment and includes any user of such goods other that the person who (buys such goods for consideration paid or promised or partly paid or partly promised or under and system of deferred payment when such use is made with the approval of such person but does not include a person who obtains such goods for resale or for any commercial purpose; or (ii) hires or avails of any services for a consideration which has been paid or promised or partly paid and partly promised, or under any system of deferred payment and includes any beneficiary of such services other than the person who hires or avails of the service for consideration paid or promised, or partly paid and partly promised, or under any system of deferred payment, when such services are availed of with the approval of the first mentioned person: (Explanation - For the purposes of sub-clause (i) "commercial purpose" does not include use by a consumer of goods bought and used by him exclusively for the purpose of earning his livelihood, by means of self employment;) "Service" means service of any description which is made available to potential users and includes the provision of facilities in connection with banking, financing, insurance, transport, processing, supply of electrical or other energy, board or loading or both (housing construction) entertainment, amusement or the purveying of news or other information, but does not include the rendering of any service free of charge or under contract of personal service. The provisions in the Acts, namely, Lucknow Development Act, Delhi Development Act or Bangalore Development Act clearly provide for preparing a plan, development of land, and framing of scheme etc. Therefore if such authority undertakes to construct building or allot houses or building sites to citizens of the State either as amenity or as benefit then it amounts to rendering of service and will be covered in the expression 'service made available to potential users'. A person who applies for allotment of a building site or for a flat constructed by the
Engineering Staff College of India Page No. G.3
development authority or enters into an agreement with a builder or a contractor is a potential user and nature of transaction is covered in the expression 'service of any description' Consumer Protection Act, 1986 has been given precedence over the Electricity Act, 2003 (in terms of sections 173 and 174 of the Act), the above interpretation - that a potential user could be treated as a consumer - would also stand extended to the consumer of electricity to the extent the question of protection of consumers' interest against deficiency of service is concerned. Section 42 of the Electricity Act, 2003 provides, inter alia, for the establishment of a CGRF for settling the grievances of consumers. It also provides for a channel of appeal in the form of ombudsman for settling non-redressal of grievances at the stage of CGRF: "Section 42. (Duties of distribution licensee and open access): — (1) (2) ....................................................................................................... (5) Every distribution licensee shall, within six months from the appointed date or date of grant of licence, whichever is earlier, establish a forum for redressal of grievances of the consumers in accordance with the guidelines as may be specified by the State Commission. (6) Any consumer, who is aggrieved by non-redressal of his grievances under sub-section (5), may make a representation for the redressal of his grievance to an authority to be known as ombudsman to be appointed or designated by the State Commission. (7) The ombudsman shall settle the grievance of the consumer within such time and in such manner as may be specified by the State Commission." Majority of the states have set up CGRF and ombudsmen are also created to redress consumer grievances Section 56 of the Act provides, inter alia, that no sum due from a consumer can be recovered after a period of two years unless such sum has been shown as arrears continuously from the date such sum became first due. The relevant provision is reproduced below: "Section56. (Disconnection of Supply in Default of Payment): — (1) Where any person neglects to pay any charge for electricity or any sum other than a charge for electricity due from him to a licensee or the generating company in respect of supply, transmission or distribution or wheeling of electricity to him, the licensee or the generating company may, after giving not less than fifteen clear days' notice in writing, to such person and without prejudice to his rights to recover such charge or other sum by suit, cut off the supply of electricity and for that purpose cut or disconnect any electric supply line or other works being the property of such licensee or the generating company through which electricity may have been supplied, transmitted, distributed or wheeled and may discontinue the supply until such charge or other sum, together with any expenses incurred by him in cutting off and reconnecting the supply, are paid, but no longer:
Engineering Staff College of India Page No. G.4
Provided that the supply of electricity shall not be cut off if such person deposits, under protest, - (a) an amount equal to the sum claimed from him, or (b) the electricity charges due from him for each month calculated on the basis of average charge for electricity paid by him during the preceding six months, whichever is less, pending disposal of any dispute between him and the licensee. (2) Notwithstanding anything contained in any other law for the time being in force, no sum due from any consumer, under this section shall be recoverable after the period of two years from the date when such sum became first due unless such sum has been shown continuously as recoverable as arrear of charges for electricity supplied and the licensee shall not cut off the supply of the electricity." The term when the amount is first due and the time limitation of 2 years was contested by several customers in the Court of Law and the extract of rulings given by various courts is reproduced below Extract from the judgment dated Novemberl4, 2006 of the Appellate Tribunal in Appeal No. 202 & 203 of 2006 (Ajmer Vidyut Vitran Nigam Limited, vs. Chittorgarh, Rajasthan vs. M/s Sisodia Marble & Granites Pvt. Ltd. & Ors): "The basic question for determination is what is the meaning of the words 'first due' occurring in Section 56(2) of the Electricity Act, 2003. ... In H.D. Shourie vs. Municipal Corporation of Delhi, AIR 1987 Delhi 219, the Delhi High Court has ruled that electricity charges become first due after the bill is sent to the consumer and not earlier thereto. In our opinion, the liability to pay electricity charges is created on the date electricity is consumed or the date the meter reading is recorded or the date meter is found defective or the date theft of electricity is detected but the charges would become first due for payment only after a bill or demand notice for payment is sent by the licensee to the consumer. The date of the first bill/demand notice for payment, therefore, shall be the date when the amount shall become due and it is from that date the period of limitation of two years as provided in Section 56(2) of the Electricity Act, 2003 shall start running." In another case in Calcutta High Court, the time limit on payment of arrears was examined and the bill was set off as time barred. Hon'ble Calcutta High Court in Mahesh Oil Mill & Another, vs. State of West Bengal & Another (Writ Petition No. 516 of 2005) decided on Februaryl9, 2007 may be referred. Paragraphs 7 to 10 of the said judgment read: 7. It is really confusing when the counsel for CESC says that his client did not demand payment of the amount as one due and recoverable from the petitioners. In the bill in question CESC demanded payment of the amount on account of unrealized arrears for the months in question. Therefore, it is apparent that CESC demands the amount as sums due and recoverable from the petitioners as arrears of charges for electricity supplied during the months in question. There can be no doubt, in the face of the clear provisions in Section 56(2), that CESC was simply not empowered and entitled to issue the notice threatening to cut off supply of electricity on failure to pay the amount, from 1993 till raising the bill for September 2004 the amount in question had never been shown in
Engineering Staff College of India Page No. G.5
any bill or in any other document, sent and served on the petitioners, as an amount recoverable from them as arrear of charges for electricity supplied. 8. It is not a case where the petitioners are seeking advantage of any mistake committed by CESC. It is very difficult to give a conclusive finding regarding the case of CESC that it had actually committed a mistake while disclosing the figure of the suspense account before the arbitrator. The disputes were settled by it before the arbitrator. The award was made long ago. There is nothing to show that the mistake was detected by CESC immediately after the award was made. It is a highly disputed question of fact whether it committed any mistake in the matter of maintenance of the suspense account. 9. The admitted fact is that for the period for which it demanded payment from the petitioners, payments had been duly made by the petitioners. If because of its own mistake it received a lesser amount in terms of the award (because of wrong inclusion of subsequent payments in the accounts submitted before the arbitrator), in my opinion, it was not empowered to raise such a bill as was raised in September 2004 calling upon the petitioners to pay for the same period twice over. I therefore hold that for non-payment of the amount demanded by the impugned bill CESC was not entitled to cut off supply of electricity to the petitioners. 10. For these reasons, I set aside the impugned bill (for the month September 2004) and declare that for non-payment of the amount demanded thereby for the months in question, CESC was not and is not entitled to cut off supply of electricity to the petitioners. The writ petition is allowed to this extent. There shall be no order for costs in it. Urgent certified Xerox copy of this order shall be supplied to the parties, if applied for, within three days from the date of receipt of the file by the section concerned. So, it is necessary for the utilities to keep the time limits in view while serving notices for the arrears. Section 57 of the Act requires the appropriate Commission to frame regulations on standards of performance which a licensee is required to follow failing which he is liable to pay penalty. Section 59 of the Act provides for monitoring all such performance standards through periodic reports to be submitted before the Regulatory Commissions: "Section 57. (Consumer Protection: Standards of Performance of Licensee): (1) The Appropriate Commission may, after consultation with the licensees and persons likely to be affected, specify standards of performance of a licensee or a class of licensees. (2) If a licensee fails to meet the standards specified under sub-section (1), without prejudice to any penalty which may be imposed or prosecution be initiated, he shall be liable to pay such compensation to the person affected as may be determined by the Appropriate Commission: Provided that before determination of compensation, the concerned licensee shall be given a reasonable opportunity of being heard. (3) The compensation determined under sub-section (2) shall be paid by the concerned licensee within ninety days of such determination."

Engineering Staff College of India Page No. G.6
"Section 58. (Different Standards of Performance by Licensee): The Appropriate Commission may specify different standards under sub-section (1) of section 57 for a class or classes of licensee "Section59. (Information with Respect to Levels of Performance): — (1) Every licensee shall, within the period specified by the Appropriate Commission, furnish to the Commission the following information, namely:- (a) the level of performance achieved under sub-section (1) of the section 57; (b) the number of cases in which compensation was made under sub-section (2) of section 57 and the aggregate amount of the compensation. (2) The Appropriate Commission shall at least once in every year arrange or the publication, in such form and manner as it considers appropriate, of such of the information furnished to it under sub-section (1)." Section 173. (Inconsistency in Laws): Nothing contained in this Act or any rule or regulation made there under or any instrument having effect by virtue of this Act, rule or regulation shall have effect in so far as it is inconsistent with any other provisions of the Consumer Protection Act, 1986 or the Atomic Energy Act, 1962 or the Railways Act, 1989. Section 174. (Act to have Overriding Effect): Save as otherwise provided in section 173, the provisions of this Act shall have effect notwithstanding anything inconsistent therewith contained in any other law for the time being in force or in any instrument having effect by virtue of any law other than this Act. Provisions in the Electricity Rules 2005 The Government of lndia has also framed rules to set up the CGRF and ombudsman. The relevant rules (Rule 7 of the Electricity Rules, 2005 (as amended) are quoted below: Rule-7. Consumer Grievance Redressal Forum and Ombudsman (1) The distribution licensee shall establish a Forum for Redressal of Grievances of Consumers under sub-section (5) of section 42 which shall consist of officers of the licensee. The Appropriate Commission shall nominate one independent member who is familiar with the consumer affairs. Provided that the manner of appointment and the qualification and experience of the persons to be appointed as member of the Forum and the procedure of dealing with the grievances of the consumers by the Forum and other similar matters would be as per the guidelines specified by the State Commission. (2) The ombudsman to be appointed or designated by the State Commission under sub-section (6) of section 42 of the Act shall be such person as the State Commission may decide from time to time. (3) The ombudsman shall consider the representations of the consumers consistent with the provisions of the Act, the Rules and Regulations made hereunder or general orders or directions given by the Appropriate Government or the Appropriate Commission in this regard before settling their grievances. (4) (a) The ombudsman shall prepare a report on a six monthly basis giving details of the nature of the grievances of the consumer dealt by the ombudsman,
Engineering Staff College of India Page No. G.7
the response of the licensees in the redressal of the grievances and the opinion of the ombudsman on the licensee's compliance of the standards of performance as specified by the Commission under section 57 of the Act during the preceding six months. (b) The report under sub-clause (a) above shall be forwarded to the State Commission and the State Government within 45 days after the end of the relevant period of six months. All the above provisions are intended to ensure proper redressal of grievances and also to review the functioning of the authorities intended to redress the grievances. Provisions in the National Electricity Policy Para 5.13 Protection of Consumers' Interests and Quality Standards "5.13.1 Appropriate Commission should regulate utilities based on predetermined indices on quality of power supply. Parameters should include, amongst others, frequency and duration of interruption, voltage parameters, harmonics, transformer failure rates, waiting time for restoration of supply, percentage defective meters and waiting list of new connections. The Appropriate Commissions would specify expected standards of performance. 5.13.2 Reliability Index (RI) of supply of power to consumers should be indicated by the distribution licensee. A road map for declaration of RI for all cities and towns up to the District Headquarter towns as also for rural areas should be drawn by up SERCs. The data of RI should be compiled and published by CEA. 5.13.3 It is advised that all State Commissions should formulate the guidelines regarding setting up of grievance redressal forum by the licensees as also the regulations regarding the ombudsman and also appoint/designate the ombudsman within six months . 5.13.4 The Central Government, the State Governments and Electricity Regulatory Commissions should facilitate capacity building of consumer groups and their effective representation before the Regulatory Commissions. This will enhance the efficacy of regulatory process." Provisions in the Tariff Policy (TP) "Para 8.0 - Supply of reliable and quality power of specified standards in an efficient manner and at reasonable rates is one of the main objectives of the National Electricity Policy. The State Commission should determine and notify the standards of performance of licensees with respect to quality, continuity and reliability of service for all consumers. It is desirable that the Forum of Regulators determines the basic framework on service standards. A suitable transition framework could be provided for the licensees to reach the desired levels of service as quickly as possible. Penalties may be imposed on licensees in accordance with section 57 of the Act for failure to meet the standards."
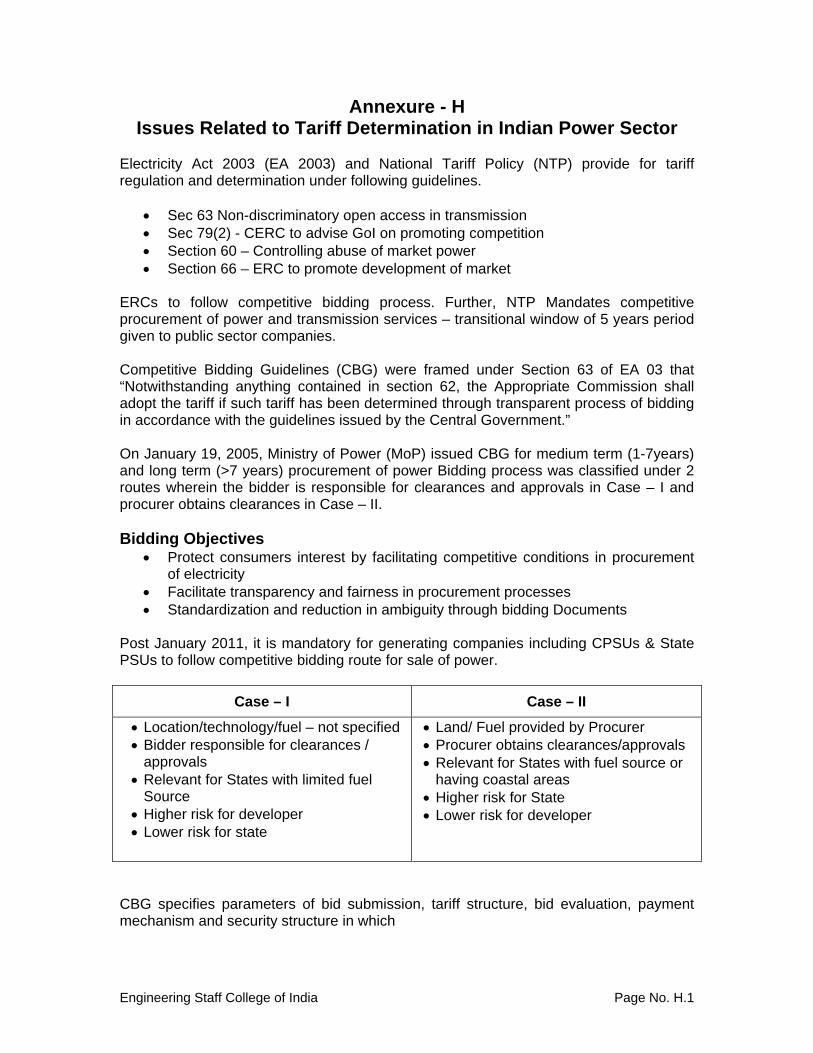
Engineering Staff College of India Page No. H.1
Annexure - H Issues Related to Tariff Determination in Indian Power Sector
Electricity Act 2003 (EA 2003) and National Tariff Policy (NTP) provide for tariff regulation and determination under following guidelines.
• Sec 63 Non-discriminatory open access in transmission • Sec 79(2) - CERC to advise GoI on promoting competition • Section 60 – Controlling abuse of market power • Section 66 – ERC to promote development of market
ERCs to follow competitive bidding process. Further, NTP Mandates competitive procurement of power and transmission services – transitional window of 5 years period given to public sector companies. Competitive Bidding Guidelines (CBG) were framed under Section 63 of EA 03 that “Notwithstanding anything contained in section 62, the Appropriate Commission shall adopt the tariff if such tariff has been determined through transparent process of bidding in accordance with the guidelines issued by the Central Government.” On January 19, 2005, Ministry of Power (MoP) issued CBG for medium term (1-7years) and long term (>7 years) procurement of power Bidding process was classified under 2 routes wherein the bidder is responsible for clearances and approvals in Case – I and procurer obtains clearances in Case – II. Bidding Objectives
• Protect consumers interest by facilitating competitive conditions in procurement of electricity
• Facilitate transparency and fairness in procurement processes • Standardization and reduction in ambiguity through bidding Documents
Post January 2011, it is mandatory for generating companies including CPSUs & State PSUs to follow competitive bidding route for sale of power.
Case – I Case – II
• Location/technology/fuel – not specified • Bidder responsible for clearances /
approvals • Relevant for States with limited fuel
Source • Higher risk for developer • Lower risk for state
• Land/ Fuel provided by Procurer • Procurer obtains clearances/approvals • Relevant for States with fuel source or
having coastal areas • Higher risk for State • Lower risk for developer
CBG specifies parameters of bid submission, tariff structure, bid evaluation, payment mechanism and security structure in which

Engineering Staff College of India Page No. H.2
• Multi-part tariff structure with separate capacity and energy components of tariff form the basis of bidding
• For medium-term procurement of power, a single part tariff or a firm price for each year along with availability is to be used.
When we compare the two cases low Risk may lead to prices being lower in Case II than Case I. Post CBG, ~ 30 numbers of Case-1 and Case-2 bids have been concluded through competitive bidding and PPA s have been executed for an aggregate capacity of 42915 MW including Ultra Mega Power Projects
• Case 1- 16,495 MW • Case 2- 10,420 MW • UMPP – 16,000 MW
It is observed that post CBG private sector participation has increased significantly. The XI Plan period witnessed about 40% of total capacity addition from the private sector and this share is likely to increase to about 50%-60% in the XII Plan period on a study of capacity additions it is seen that out of the total contracted capacity.
• 43 % is based on Domestic coal • 27% on Captive coal blocks • 30% on imported coal
Competitive bidding framework has encouraged several private players to foray into power generation sector viz. Lanco, Jindal, KVK, GMR, India Bulls etc. Tariffs under competitive bidding have been found to be lower than cost plus mechanism – several reports including the statutory advice of CERC regarding timeframe for tariff based competitive bidding bring out this fact Key Issues in the Competitive Bidding Framework
• Co-Existence of Cost regime plus along with Bidding route • Rebidding based on unconvincing grounds • Post Bidding Changes in Standard Bidding Document (SBD) / Nature and
Character of Project • Adherence to Timelines • Transmission Access • Alternative Supply • Coal Related Issues
o Domestic Coal Availability o Imported Coal
• Gas Related Issues Co-Existence of Cost plus regime along with Bidding route is leading to huge burden on the Power Sector though EA 2003 and the NEP has promoted competition to get better tariff
• The bidding mechanism is a marked difference from the earlier cost plus mechanism
• The regulated return allowed as per CERC guidelines is 23% with the RoE fixed at 15.5% and additional incentives of 7.5%
• Likely Equity IRR for the first four UMPPS averages to 16%
Engineering Staff College of India Page No. H.3
Few cases of comparison between Case-I and Case-II are as follows: In case of Rajpura Thermal Power Plant the rate with cost plus was Rs 3.48 and case II Rs.2.89. Tiroda Phase I Thermal Power Plant Rs.2.97 and case II Rs.2.64. Co-Existence of Cost plus regime along with Bidding route is leading to huge burden on the Power Sector
Tariff discovery through competitive bidding has been found to be much lower than cost plus mechanism. The differential (23 paise/unit computed by the CERC) when translated over 25 years period for a 1000 MW project indicates a loss of ~Rs. 4000 Crores MoU is still being adopted as an active route by PSUs and Private Players in which Mass Scale signing of cost-plus PPAs by NTPC aggregating to 37000 MW for project was planned up to 2017. Orissa Govt. signed MoUs with three IPPs (KU Project Ltd; SPI Ports; Nagapatnam Power Co. Ltd) aggregating to 3960 MW (Jan 2011). UP Govt. signed MoU with Welspun Energy to set up 1320 MW TPP (Jan 2011) and with Bajaj Hindusthan for 1980 MW (June 2011). Though preamble to EA03 clearly talks about protecting consumer interest and section 61(d) makes consumer interest as one of the consideration in specifying terms and conditions for determination of tariff, cost plus regime along with bidding route is leading to higher burden on the power sector. Though section 60 authorizes the Regulatory Commissions to intervene if a licensee or generating company enters into any agreement or abuses its dominant position leading to adverse effect on competition in electricity industry and section 66 places responsibility on the ERC to promote development of electricity markets, the huge burden on the power sector and the consumer is not relieved. Several instances of re-bidding have been observed in different states on unconvincing grounds
• Uttar Pradesh – 1980 MW Bara TPP; 1320 MW Karchana TPP • Gujarat – Case 1 tender floated by GUVNL in 2006
At times, rebidding has led to lower tariffs whereas at other times discovered tariff has been higher than the original bids In certain cases post bidding changes in the documents / nature and character of projects have been observed raising the cost of supply.
• Case of UP: Post completion of bidding round for Anpara C, UP permitted change in capacity of the plant (by 20%); and permitted sale of 50% of this additional quantum into merchant market.
• Case of Maharashtra: Under Stage 2 of Case I bidding process, MSEDCL has contracted 2600 MW to various suppliers at levelized tariff ranging from Rs. 2.879/unit to Rs. 3.28/unit PPAs signed between MSEDCL and the selected bidders (i.e. EMCO Energy
Ltd, Indiabulls Power Ltd, Adani Enterprises) revealed difference in certain important clauses in the PPAs. o Indiabulls and EMCO, the scheduled delivery date is mentioned as ‘not
less than four years’ from the PPA being effective . o Adani, the delivery date is 4 years from effective date.
Engineering Staff College of India Page No. H.4
• SBD provides for a period of 30-45 days for shortlisting of bidders and issuance of LOI, from the date of submission of bid. However this is not strictly followed.
In general, issuance of LOI has taken much longer time wherein bidders have to keep extending their bid and bid bond validity. For example, in the Case-I bids in 2009, time taken by different entities from the bid submission date to issuance of LoI were as follows: (i) MSEDCL: 227 days; (ii) RRVPNL: 139 days; (iii) Maharashtra Stage I (2008): 179 days; (iv) Haryana (2007): 243 days; (v) GUVNL: 98 and 79 days for Stage 1 and Stage 2 respectively. This leads to opportunity loss for the unsuccessful bidders who are unable to participate in other bids, as the capacity remains locked up. Also the bidder has to pay for the extension of Bank Guarantee (Bid Bond). Issues related to bid conditions. The Seller shall be wholly responsible to arrange transmission access from the Interconnection Point to the Injection Point. The Procurer(s) shall be wholly responsible to arrange transmission access from the station switchyard of the generation source in case of the generating source being in the same state as that of the Procurer(s).
SBD states that in Case-I the Seller shall be wholly responsible to arrange transmission access from the Interconnection Point to the Injection Point. The Procurer(s) shall be wholly responsible to arrange transmission access from the station switchyard of the generation source in case of the generating source being in the same state as that of the Procurer(s). In such cases, there could be a mismatch between the generation schedule (about 38-40 months) and associated transmission schedule (50-54 months), this is primarily due to (i) time taken in finalization of scope of transmission system; (ii) time consumed in inviting bids & selection of developer; and (iii) time required to construct the system including procurement. As per SBD during the Operating Period if the Seller is unable to provide supply of power to the Procurer up to the Aggregate Contracted Capacity (ACC) from the Power Station except due to a Force Majeure Event or due to a Procurer Event of Default, the Seller is free to supply power up to the ACC from an alternative generation source to meet its obligations under this Agreement. Such power shall be supplied to the Procurer at the same Tariff as per the terms of this Agreement. In case the transmission and other incidental charges, including but not limited to application fees for open access, RLDC/SLDC charges, etc., applicable from the alternative source of power supply are higher than the applicable Transmission Charges from the Injection Point to the Delivery Point, the Seller would be liable to bear such additional charges. The conditions further state that the Seller shall be permitted to supply power to the Procurer from any alternative source for a maximum continuous duration of six (6) Months or a maximum non-continuous period of 12 months during the Operating Period, excluding any period of supply from alternative generation source that the Seller avails prior to the commencement of supply from the generation source named in this Agreement Time limitation on the arrangement of alternate supply should not be there if developer maintains the price and quantity obligation.

Engineering Staff College of India Page No. H.5
No provisions either in the SBD or in the PPA to take care of exigencies / situations are provided beyond the control of the developer.
1. Short supply of coal by CIL leading to fuel cost increase 2. Cancellation of Coal Blocks 3. Change in fuel source/mix due to unavoidable circumstances 4. Change in law in the country of source mine 5. Abnormal increase in pricing in the country of source mine 6. Allocated Coal Blocks falling under ‘No-Go’ Areas or mining not permitted
due to environmental considerations • These issues impact the developers in terms of:
o Reduced availability and consequent loss of capacity payments; or
o Increase in cost due to higher cost of coal from other sources (imports / eauction)- worst hit are Case I PPAs executed on the strength of LoA
• Plants hit include due to Reason 1: KSK Wardha (Maharashtra, 4X135MW), Lanco Amarkantak (Chattisgarh, 600 MW), Adani Mundra (Gujarat, 660 MW)
Coal and gas based projects have inherent differences, as listed below which
need separate SBDs since gas based generation fits well for time of the day power for intermittent and peaking applications because of starting time, ramp up rate and efficiency in part-load operation. The CERC has already issued draft regulations for a separate tariff for peaking rates. Once it is implemented, gas based generation being expensive would automatically get reserved for peaking requirement
Tenure of PPA for gas-based projects: - SBD requires bidders to have fuel tied
up for total installed capacity for the entire term PPA, generally 25 years in order to respond to Case I bids. However, Typically the gas supply contracts (KG D6, RLNG) are of much lower term ~5-7 yrs.
Blended Gas Option: Looking at the availability of domestic gas, option of
blended gas cannot be ruled out. Hence, there is a need to devise a mechanism by which developer is compensated for purchase of LNG from international market
Escalation rate allowed for energy charges for domestic gas: Escalation rate
allowed for energy charges for domestic gas based projects is based on APM (Administrate Price Mechanism) gas prices.
APM gas supplies do not suffice for the entire requirement of the IPPs. In addition, with declining APM gas supplies, the new plants are likely to be allocated gas from the NELP fields. Under NELP, gas price is approved for every 5 year period and it is implausible to forecast NELP gas price for quoting the Tariff in Long Term Case1 bids.


![Active and reactive power control via currents of a otor’s ...journals.ut.ac.ir/article_56038_892b11157dfcc8ea37cc78f83e956927.pdffor DFIG power control [24] and predictive DPC established](https://img.pdfslide.us/doc/110x75/60023984c5b51b78574602d7/active-and-reactive-power-control-via-currents-of-a-otoras-for-dfig-power.jpg)


![CoPoMo: a context-aware power consumption model for …cheng/papers/ett2702.pdffor LTE user equipment ... [17], the power consumption of a device in an idle mode is investigated by](https://img.pdfslide.us/doc/110x75/5af0df347f8b9ac62b8f320d/copomo-a-context-aware-power-consumption-model-for-chengpapersett2702pdffor.jpg)


![Modeling and Experimental Measurement of Power Efficiency ...jmk/pubs/power.lim.sub.modeling.meas.JLT.21.pdffor power-constrained cable design than [22]. II. EXPERIMENTS We examined](https://img.pdfslide.us/doc/110x75/61297ab39ee19d422d32f46f/modeling-and-experimental-measurement-of-power-efficiency-jmkpubspowerlimsubmodelingmeasjlt21pdf.jpg)