Embed Size (px)
Citation preview

FOQA Program SKY Airline RASG-PA Flight Data Analysis Programme seminar (FDAP) | Miami Oct_16

Una nueva experiencia…
Claudio Tobar J. Flight Data Monitoring Chief
A new experience…

Content
SKY Airline
Data Process
FOQA Management
FOQA KPI’s
RNP-AR – Safety
Specific Ops. Events
1
2
3
4
5
6

Content
SKY Airline
Data Process
FOQA Management
FOQA KPI’s
RNP-AR – Safety
Specific Ops. Events
1
2
3
4
5
6

¡Bienvenidos a bordo!
Volamos en Sudamérica y en Chile desde 2002, conectando y encantando a nuestros pasajeros con el mejor servicio.

Seguridad Puntualidad Calidad Somos la primera aerolínea Low Cost
de Sudamérica en recibir la certificación internacional de
seguridad aérea y operacional IOSA de la Asociación de Transporte Aéreo
Internacional (IATA).
Somos una de las aerolínea más puntuales del mundo según FlightView
y flightStats
N°1 Low cost del mundo (enero y marzo 2016)
N°7 de todas las líneas aéreas (Enero 2016)
Elegida por 2 años consecutivos como la Mejor Aerolínea Regional de Sudamérica según SKYtrax, Los
principales premios de la aviación comercial en el mundo.
SKY… Flight Data Monitoring

Evolución de la Seguridad Operacional 2013 – 2016
Nivel Estratégico
Evaluación Total del Sistema
Concepto Integrado Safety, QA & Security
Plan Estratégico Mediano/Largo Plazo
LOW COST
2013 2014 2015 2016
Nivel Táctico
SMS Fase I & II SMS Fase III & IV Implementación
iAMS Diseño Enterprise Risk Management
Auditoria IOSA Diseño de iAMS
SAMS + AIRFASE
Consultoría- Partner IATA
Consultoría Airbus
Resultados
Gerencia de Seguridad Operacional & QA
Certificación IOSA + Membresía IATA
FDM FOQA Comité FOQA
MOQA Comité MOQA
OTP
OTP
7 Estrellas en Seguridad
Airline Ratings
LOC-I RASP-GA
Flight Data Monitoring

FDM concepts…
Maintenance Operations Quality Assurance (MOQA)
“Programa orientado a analizar los aspectos
relativos al mantenimiento.”
Flight Data Monitoring (FDM) – Flight Data Analysis (FDA)
“Proceso para analizar los datos de vuelo registrados a fin de mejorar la seguridad de las operaciones de vuelo.”
Flight Operations Quality Assurance (FOQA)
“Programa orientado a asegurar la calidad de
las operaciones de vuelo.”
Simulator Operations Quality Assurance (SOQA)
“Programa orientado a asegurar la calidad de
las operaciones de vuelo en el simulador.”
Flight Data Monitoring
Content
SKY Airline
Data Process
FOQA Management
FOQA KPI’s
RNP-AR – Safety
Specific Ops. Events
1
2
3
4
5
6

Principio de adquisición de datos para MOQA
Flight Data Monitoring
Crash protected Flight Data Recorder (DFDR) 25 Hours recorder time
Flight Data Interface Management Unit (FDIMU)
WQAR Comm+ Servidor Wireless
ACMS Aircraft Condition Monitoring System

Data Process
Flight Data Interface Management Unit
(FDIMU)
Computador de Adquisición de datos.
Wireless GroundLink® (WGL) System
Computador grabador y
Transmisor de datos
Local Cell Tower
Internet
Server Data Analysis
AirFASE®- Aircraft Flight
Analysis & Safety Explorer
Operations Maintenance & Engineering
Data Analysis
Flight Data Monitoring

Flight Data (2015 – 2016)
% x Fleet x Month
Flight Data Monitoring
0
10
20
30
40
50
60
70
80
90
100
110
120
99%
F
100%
100%
J
100%
96% 100%
S
100%
A
100%
98%
J
100%
99%
J
100%
100%
M
87%
100%
A
96%
100%
M
97%
99%
F
96%
99%
J
93%
99%
D
94%
98%
N
100%
99%
O
100%
99%
S
100%
100%
A
99%
99%
J
100%
99%
J
99%
100%
M
99%
99%
A
100%
96%
M
98%
A320 A319
-1%
-1%
A16
19.129
R16
19.327
A15
27.818
R15
28.066
Content
SKY Airline
Data Process
FOQA Management
FOQA KPI’s
RNP-AR – Safety
Specific Ops. Events
1
2
3
4
5
6

Safety Tools
Flight Data Monitoring
Inspecciones
Auditorías LOSA
Flight Data Análisis (AirFASE)
Reporte Incidente
Investigación en casa
Sistema Reportes

Beneficios del Flight Data Monitoring
Flight Data Monitoring
• Reducción del riesgo de incidentes o accidentes aéreos.
• Mejora en los procedimientos Operacionales.
• Mejora en Consumo de Combustible.
• Mejora en el programa de entrenamiento de Pilotos.
• Reducción de Mantenimiento innecesario y reparaciones.
• Reducción en los costos de seguro.
• Mayor disponibilidad de aviones.

FOQA - MOQA
FOQA _ MOQA Management
Flight Data Monitoring
Gate Keeper
FOQA/MOQA Committee
Just Culture
Data Sharing FDX
Data Sharing Airbus
Operational Events
Maintenance Events

FOQA_ Management (Committee)
Operations Management
Data Analysis
Other sources, SAMS, Pilots
Reports Report
Corrective Action
SMS
Gate Keeper
Flight Data Monitoring

Gate Keeper Flight Data Monitoring
Gatekeeper functions
Protect the de-identified data. Evaluate high severity events, and determine whether
it is an error or a violation Contact crews with significant high severity events. Analyzing flight data and perform root cause analysis. Participate in the FOQA & Just Culture committees Participate in LOSA program.

FDM Promotion (Newsletter) Flight Data Monitoring
FOQA MOQA

Content
SKY Airline
Data Process
FOQA Management
FOQA KPI’s
RNP-AR – Safety
Specific Ops. Events
1
2
3
4
5
6

SKY Safety Concerns Monitoring
LOC_I CFIT
RE
Flight Data Monitoring
MAC

Operational Events all Phases Flight Data Monitoring
DESCENT
TAXI OUT
CRUISE
APPROACH
GO AROUND CLIMB
TAKEOFF
INI CLIMB
LANDING
TAXI IN
TOUCH and GO
RTO
TAXI OUT • Speed high during Taxi
TAKEOFF • Pitch high at Lift-off • Pitch Rate High at Takeoff
CLIMB • Speed High (50-1000 ft) • Speed Low (50-1000 ft) • Pitch high Ini- climb • Pitch low ini-climb • Late landing gear retraction
CRUISE • VRTG high during flight • Autopilot off during cruise
DESCENT • Speed high (FL 100)
APPROACH • High Speed • Low Speed • High ROD • Late LDG Conf • Late head ch. • Low power • Use Speed brk • Bank Angle • GPWS • Spd Brk+Conf Full
LANDING • VRTG high at Landing • Deep LDG • Short LDG • Late Flare • Pitch High • Pitch rate high • Grd Spoilers not armed. • Full reverse at Low Speed
APPROACH •ROD high (2000-1000 ft) • ROD high (1000-500 ft) • Speed High/Low 1000

Warning Events Flight Data Monitoring
• TCAS RA Warning
• Gear Retraction above VLO
• Max Landing Gear Extend Speed VLE
• Exceedance of Flaps / Slat Limit Speed
• Rejected Takeoff
• High Acceleration at Touch down
• Excess EGT at Take Off or Go Around
• Overweight Landing
• Engine In-flight Shutdown
• Smoke Warning
• Takeoff Warning
• In Flight Turn Back
• Tail Strike Risk at Landing
• Tail Strike Risk at Take Off
• Wing Strike Risk at Landing

Warning Effect / Ratio Combined Events
52 Flights
Flight Data Monitoring
Considera todos los eventos High Severity.
Considera todos los eventos All Severity.
3
104
110
20
40
60
80
100
120
140
160
180
4,5
3,5
5,0
4,0
3,0
2,0
1,0
0,0
0,5
1,5
2,5
1934
0,0
1910
0,0
1933
0,1
1919
8 0,4
1914
9 0,4
1922
9 0,4
1920
13 0,6
1923
4,6
# Events Rate HS
# Ev
ents
Event Code
Event Code
# Ev
ents
Warning Effect
Ratio Combined Events
122
34
0
5
10
15
0,02
0,08
0,04
0,12
0,06
0,14
0,16
0,18
0,10
0,00 2000
0,04
2201
0,09
2002
0,09
2003
0,13
2004
0,18
# Events Rate HS
%
%
Event # Event Description1923 Autoland Warning1920 GPWS warning above1000ft AFE 1922 GPWS warning below 500ft AFE 1914 Overweight landing 1919 Level Bust1933 Smoke Warning 1910 Alternate law 1934 Takeoff Warning
Event # Event Description2004 Continuously Steep during final2003 Continuously Fast during final2002 Continuously High during final2201 High Energy Situation in Approach2000 Continuously Low during final

TCAS RA / Vertical Acceleration in Flight Flight Data Monitoring
Total_2015_2016: 12 • Feb: SCL/LPB/CPO/PMC • Mar: ANF • May: SCL • Jun: SCL/PMC • Sep: SCL • Oct: ARI • Jun_16: ANF • Ago_16: SCL
0
1
0
1
0000000
11
0
2
1
0
1
4
0
1
2
3
4
5
6
7
0,35
0,30
0,25
0,20
0,15
0,10
0,05
0,00
0,50
0,45
0,40
O S A J
0
S M A M F J
0
J J M A M F A J D N J
High
Rate HS
95
40 57 5495 79 73
3875 58 40
92
0
1
2
01
0
0
02
4
2
0
0
2
000
210
0
0
50
100
150
200
250
N
128
O
160
M A
220
J J M A M
104
S A J
123
J A
144
M F J S
112
D
105
F
108
J
Low Medium High
2
10
15
0
5
10
15
20
25
0,20
0,15
0,10
0,05
0,00
0,50
0,45
0,40
0,35
0,30
0,25
0,05
-71%
-28%
2016
0,01
2015
0,04
2014
High
Rate HS TCAS_RA_Events
Vertical Acceleration in Flight
# Ev
ents
# Ev
ents
%
# Ev
ents

Wind Shear Warning Flight Data Monitoring
0
1
000
1
0
1
2
1111
0000
0
2
1
0,10
0,40
0,35
0,30
0,25
0,20
0,15
0,05
0,00
12,0
1,5
1,0
0,5
0,0
Total
12
0,0
A
0,0
J
0,0
J
0,0
M
0,0
A
0,1
M
0,0
F
0,0
J
0,1
D
0 0,0
N
0,0
O
0,0
S
0,0
A
0,0
J
0,0
J
0,0
M
0,0
A
0,0
M
0,0
F
0,1
J
0,0 0,0
S
High Rate HS
# Ev
ents
%
Airport
111
23
4
0
1
2
3
4
5
6
7
8 1,5
1,0
0,5
0,0 CJC
0,0
EZE
0,1
BBA
0,1
PMC
0,1
PUQ
0,3
SCL
0,0
High Rate HS
# Ev
ents
%
Month
Number 1903Description Windshear WarningCategory Warning
_WARNING =LOW _WINDSHEAR_PREDICTIVE (SEV INFO)MEDIUM #HIGH _WINDSHEAR_REACTIBE
Event Information
Deviation Limits

High Energy Situation
Flight Data Monitoring
Order Description2002 Continuously High during final2003 Continuously Fast during final2004 Continuously Steep during final2201 High Energy Situation in Approach
Total_High Sev_2015: 35 Total_High Sev_2016: 10
3
8 6
2 2 2 34
2 200 1111011
3
2
0
5
10
15
20
25
S A J J M A M F J D N O S A J J M A M F J
Low Medium High
75
6
10
13
11222
13
10
5
10
15
20
25
30
ZCO PMC CPO SCL PUQ ARI CCP CJC ANF ZAL LSC EZE IQQ LIM
Low Medium High
# Ev
ents
# Ev
ents
High Energy Situation Approach x Month
High Energy Situation Approach x Airport
2015_2016
Airport
Month

Unstabilized Approach

Unstabilized Approach (RE) | 500 ft
Height (AFE) <= 500 ft
High Speed
Low Speed
High Rate Descent
Late Ldg Flap
GPWS
Bank Angle
Heading Change
Speed Brake Use
Flight Data Monitoring
Unstabilized Approach

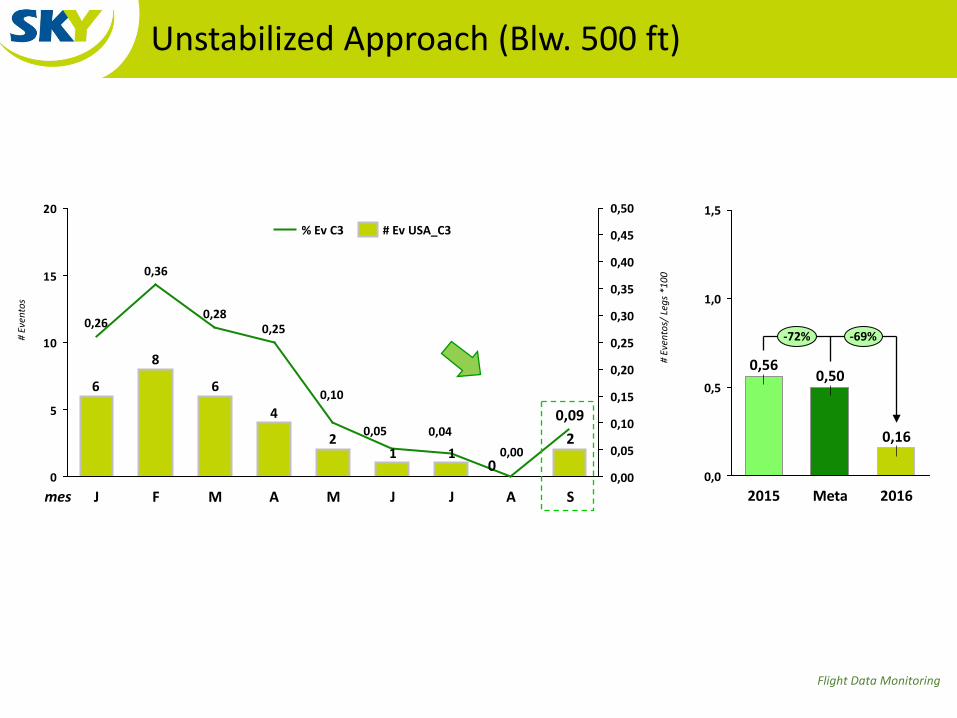
Unstabilized Approach (Blw. 500 ft) Flight Data Monitoring
19
0
11
0
1
0
4
9
3
0
5
10
15
20
1,3 1,4
0,7 0,6
0,9
0,1
1,5
0,8
1,0
0,5
0,0
0,2 0,3 0,4
1,1 1,2
0,04
App Spd Low 500 ft
0,00
Head chg 500 ft
0,04
Low Power app
0,00
Late Ldg Flap
0,18
GPWS 500 ft
0,39
App Spd High 500 ft
0,04
High Rate Desc.
Total Bank Ang App
0,00
Spd Brk use
0,13
Ratio_HS
# Events HS
High / Low Speed High Rate of Descent Bank angle Late heading change Late landing config GPWS Use speed brakes Height (AFE) <= 500 ft
Unstabilized Approach (Blw. 500 ft)
Flight Data Monitoring
2
4
6
8
6
0
5
10
15
20
0,05
0,35
0,30
0,25
0,20
0,15
0,10
0,50
0,45
0,40
0,00 J
0,26
2 0,09
S F
0,36
A
0 0,00
J
1 0,04
J
1 0,05
M
0,10
A
0,25
M
0,28
# Ev USA_C3 % Ev C3
mes
# E
vent
os
# E
vent
os/ L
egs *
100
1,5
1,0
0,5
0,0
-69% -72%
2016
0,16
Meta
0,50
2015
0,56

Unstabilized Approach (Blw. 500 ft)
Flight Data Monitoring
month
# E
vent
s #
Eve
nts/
Legs
*100
30
161616181914
2426
36
4449
61
71131397
111217
222524
20114686
20
50
30
40
340
0
60
10
M
2
A M F J 2016 2015
161
2014
339
D N O S A J J
2,5
2,0
1,5
1,0
0,5
0,0
0,60
N
0,04
0,66
O
0,58
0,65
S
0,09 0,60
0,77
A
0,00
0,40
0,77
J
0,04 0,30
0,52
J
0,05
0,53
0,96
M
0,10
0,56
1,10 -73%
-49%
2016
0,16
2015
0,58
2014
1,13
D
0,32
A
0,25
0,77
1,46
M
0,28
0,87
1,72
F
0,36
0,97
2,03
J
0,26
0,84
2,22
month
2016 2015 2014
2015 2016 2014

Aproximación Desestabilizada (RE) | 1000 ft
Flight Data Monitoring
Height (AFE) <= 1000 ft
High Speed
Low Speed
High Rate Descent
Late Ldg Flap
GPWS Bank Angle
Speed Brake Use
Localizer Deviation
Glide Deviation
Unstabilized Approach

Unstabilized Approach (Blw. 1000 ft)
Flight Data Monitoring
1323
20
49
3339
826973
40
5859
37
6252
8978
89
131
115
0
20
40
60
80
100
120
140
160
180
4,0
5,5
5,0
4,5
3,5
3,0
2,5
2,0
1,5
1,0
0,5
0,0 S
2,74
A
1,65
J
2,63
J
2,50
4,17
A
3,55
M
3,52
F M J
4,04 -54%
S F
3,67
5,06
J
3,01
D
3,35
N
1,78
O
2,58
29 1,27
A
0,57
J
0,98
J
1,02
M
2,47
A
2,06
M
1,81
# Ev USA_C3 % Ev C3
mes
# E
vent
os
# E
vent
os/L
egs*
100

High Acceleration at Touchdown

High Acceleration at Touch Down Flight Data Monitoring

High Acceleration at Touch Down Flight Data Monitoring
VRTG >=LOW 1,5 gMEDIUM 1,6 gHIGH 1,75 g
High_Acc_at_TD
00
00
21003200
0
11
3
01
022
05
10152025
30354045
5055
S A J M A M F J D N O S A J M J J A M F J
Low Medium High
7
11
15
6
0
50
100
150
200
250
300 0,50
0,45
0,40
0,35
0,30
0,25
0,20
0,15
0,10
0,05
0,00
-8%
2016
0,04
2015
0,04
2014
0,05
2013
0,06
Low
Medium
High
Rate HS
# Ev
ents
%
# Ev
ents
# Ev
ents
30156 27734 High Acceleration at Touch Down Month
High Acceleration at Touch Down Airport / 2016
10000
19136
0000
0
100
1011
2
1
0
5
10
15
20
25
30
35 1,6
0,8
1,4
1,2
1,0
0,6
0,4
0,2
0,0
0,25
ZAL
0,79
ZCO
0,34
CPO
0,42
ARI
0,45
ANF
0,37
CJC
0,77
PUQ
1,39
LSC GRU CCP
1,26
IQQ
1,08
PMC
1,22 1,08
0,36
1,33
LIM
0 0,18
BBA SCL
Low Medium High Rate
%

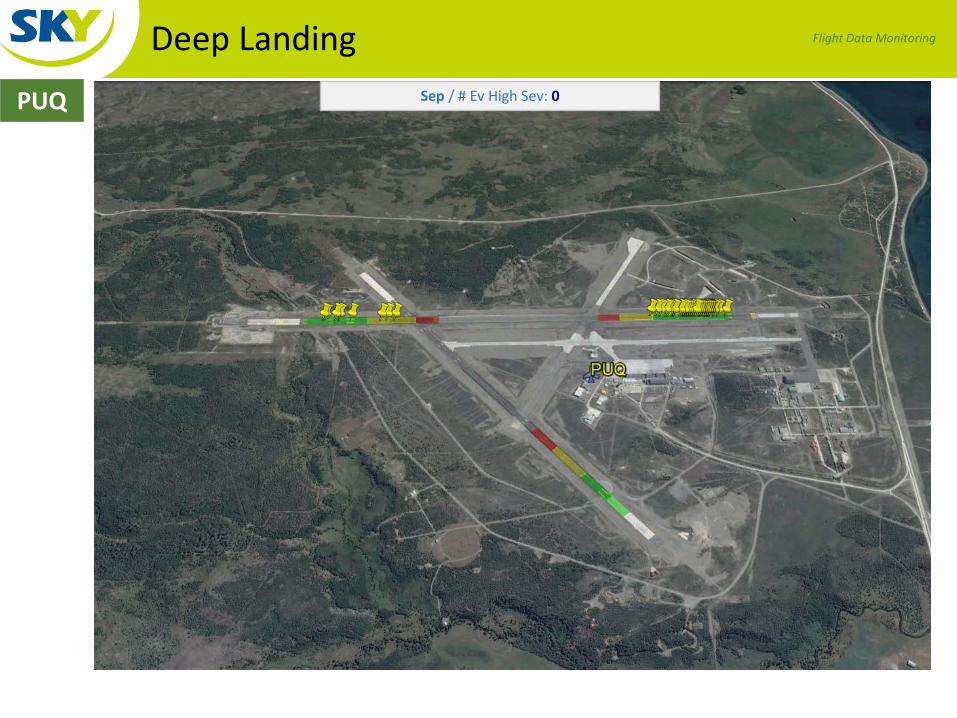
Deep Landing

Deep Landing
Main gear Touch down
50 FT
Flight Data Monitoring

Deep Landing Flight Data Monitoring
ZAL Sep / # Ev High Sev : 0 / Evento High Sev > 600 m
Runway Lenght: 6890 ft

Deep Landing Flight Data Monitoring
ZOS Sep / # Ev High Sev : 0 / Evento High Sev > 600 m
Runway Lenght: 5577 ft

Deep Landing Flight Data Monitoring
Sep / # Ev High Sev: 1 / Evento High Sev > 700 m ZCO
Deep Landing Flight Data Monitoring
PUQ Sep / # Ev High Sev: 0

Deep Landing Flight Data Monitoring
PMC Sep / # Ev High Sev: 0 / Evento High Sev > 760 m

Content
SKY Airline
Data Process
FOQA Management
FOQA KPI’s
RNP-AR – Safety
Specific Ops. Events
1
2
3
4
5
6

RNP-AR Project (Safety)
Flight Data Monitoring
La Serena (LSC)
Calama (CJC)
Balmaceda (BBA)
Iquique (IQQ)
Antofagasta (ANF)
Santiago (SCL)

Antofagasta Airport (ANF)

SCL__ANF / LSC__ANF (Before RNP)
92 Flights
Flight Data Monitoring

SCFA__RNAV (RNP) Z Rwy 01/19
52 Flights
Flight Data Monitoring

Unstable Approaches ANF
52 Flights
Flight Data Monitoring
0.0%
0.5%
1.0%
1.5%
2.0%
2.5%
3.0%
3.5%
0
2
4
6
8
10
12
14
16
J F M A M J J A S O N D J F M A M J J A S O N D J F M A M J J A
# Events Rate
2014 2015 2016
# Ev
ento
s HS
(# Eventos HS/Legs)*100
RNAV (RNP) Rwy’s 01/19

Calama Airport (CJC)

CJC Rwy’s 10/28 | RNP v/s GNSS
52 Flights
Flight Data Monitoring

Unstable Approaches CJC
52 Flights
Flight Data Monitoring
0.0%
1.0%
2.0%
3.0%
4.0%
5.0%
0
2
4
6
8
10
12
14
16
J F M A M J J A S O N D J F M A M J J A S O N D J F M A M J J A
# Events Rate
RNAV (RNP) Rwy’s 10/28

La Serena Airport (LSC)

La Serena (LSC) Airport
Flight Data Monitoring
• Runway: 12/30 • Rwy Lenght: 6358 ft • ILS Category: None • Fog problem (sea) • Valley approach • Non precisión Approach • Offset

Approach SCSE
Flight Data Monitoring

RNAV (GNSS) Rwy 30 (SCSE)
Flight Data Monitoring

Unstabilized Approach LSC
Flight Data Monitoring

RNAV (RNP) Y/Z Rwy 30 (SCSE)
Flight Data Monitoring

RNP LSC Flight Data Monitoring

RNAV (RNP) Y/Z Rwy 30 (SCSE)
Flight Data Monitoring

RNAV (RNP) Y/Z Rwy 30 (SCSE)
Flight Data Monitoring

Unstable Approaches (high sev) LSC
Flight Data Monitoring
52 Flights
0.0%
2.0%
4.0%
6.0%
8.0%
10.0%
12.0%
14.0%
0
2
4
6
8
10
12
14
16
18
J F M A M J J A S O N D J F M A M J J A S O N D J F M A M J J A
# Events Rate
# Ev
ento
s HS
(# Eventos HS/Legs)*100
RNAV (GNSS) Rwy 30 RNAV (RNP) Rwy 30 Gestión Inicial
2014 2015 2016

Content
SKY Airline
Data Process
FOQA Management
FOQA KPI’s
RNP-AR – Safety
Specific Ops. Events
1
2
3
4
5
6
GPWS Sink Rate CJC – ANF Airports

GPWS Sink Rate CJC - ANF Airports Flight Data Monitoring
Sink Rate Warning

GPWS Sink Rate CJC Airport Flight Data Monitoring

GPWS Sink Rate CJC Airport Flight Data Monitoring

GPWS Sink Rate CJC Airport Flight Data Monitoring
63
23
63
47
62 74
48
77
38
54
43 38
59
0 10 20 30 40 50 60 70 80 90
12/12/2015
1/31/2016
3/21/2016
5/10/2016
6/29/2016
8/18/2016
10/7/2016
RALT (ft)
-1076 -1012 -1100 -1028
-1104
-1164
-1044
-1144
-1012 -965
-1068
-1036 -1044
-1400
-1200
-1000
-800
-600
-400
-200
0 12/12/2015
1/31/2016
3/21/2016
5/10/2016
6/29/2016
8/18/2016
10/7/2016
IVV (ft/min)
0
13
8
5 CONF | PF
CONF 3
CONF FULL
CPT
FO
105
19
88
20
89
87 10
161
-52
28
-1.6
-44
68
-100
-50
0
50
100
150
200
12/12/2015
1/31/2016
3/21/2016
5/10/2016
6/29/2016
8/18/2016
10/7/2016
DIST THR (ft)

GPWS Sink Rate ANF Airport Flight Data Monitoring

GPWS Sink Rate ANF Airport Flight Data Monitoring
84
119
307
115 90 83
0
50
100
150
200
250
300
350
1/31/2016
2/20/2016
3/11/2016
3/31/2016
4/20/2016
5/10/2016
5/30/2016
6/19/2016
7/9/2016
7/29/2016
8/18/2016
RALT (ft)
-952
-1092
-1548
-1072 -1016 -1060
-1800
-1600
-1400
-1200
-1000
-800
-600
-400
-200
0 1/31/2016
2/20/2016
3/11/2016
3/31/2016
4/20/2016
5/10/2016
5/30/2016
6/19/2016
7/9/2016
7/29/2016
8/18/2016
IVV (ft/min)
321 481
1376
485 276 188
0
200
400
600
800
1000
1200
1400
1600
1/31/2016
2/20/2016
3/11/2016
3/31/2016
4/20/2016
5/10/2016
5/30/2016
6/19/2016
7/9/2016
7/29/2016
8/18/2016
DIST THR (mts)
3
3 4
2 CONF | PF
CONF 3
CONFFULLCPT

ATA 34 – Navigation

TAT & Pitot Temperature
SCL-FLN (TAT & PITOT RH)
ICE Event
Flight Data Monitoring

TAT & Pitot Temperature
ZONA 1
Flight Data Monitoring

TAT & Pitot Temperature
ZONA 2
Flight Data Monitoring

TAT & Pitot Temperature
ALT_STD
TAT 1
TAT 2
TAT 3
Zona 1
Zona 2
Flight Data Monitoring

ATA 34 – TAT & Pitot Temperature Flight Data Monitoring
Envío de Raw Data Airbus
Análisis para Operaciones
Análisis para Ingeniería & Mantto. SKY

RALT - Fail

Autoland PIREP
Flight Number Tramo Observacion MFL
SKU002 PMC-SCL DURING APCH RA1 AND 2 SIGANL LOST PASSING FROM CAT III DUAL TO CAT II TO CAT I 6022
SKU111 CPO-SCL DURING APROACH ILS CAT III WAS DEGRADED INTERMITTEN TO CAT II 6042
SKU008 PUQ-SCL DURANTE APROX. ILS CAMBIA INTERMITENTEMENTE DE CAT 3 A CAT 2 EN FMA SIN INDICAR FALLA EN EL ECAM 6078
Flight Number Tramo Observacion MFL
SKU161 ANF-SCL DURING ILS APP CAT 3 DUAL REVERT TO CAT 2 6091
SKU002 PMC-SCL DURING APP ILS CAT III REVERTS TO CAT II 6097
SKU161 ANF-SCL BOTH RA INTERMITENT DURING APPROACH 6104
SKU002 PMC-SCL DURING APP ILS CAT III REVERTS TO CAT I 6108

RALT 1 /2 – FAIL Descent
AP 1+2
RA 1
RA 2
AP OFF

RALT 1 /2 – FAIL Descent
RA 1 RA 2
AP OFF

Overweight Landing

Overweight Landing
VRTG
LDG_STATUS = L_R_GRD
PITCH
VRTG max
NO AP ON
ALT_AFE
VRTG min
LDG_STATUS = FULL_GRD
IVV
Parameters Touch Down: • GW: 65610 kg • MLW: 64500 kg • LDG_STATUS: L_R_GRD • VRTG: 1.18 g • VRTG Max: 1.40 g • VRTG min: 0.78 g • AP_STATUS: NO AP ON • IVV: -90 ft/min • PITCH: 8.1°
1.4 g
0.8 g

Overweight Landing
Parameters Touch Down: • GW: 65600 kg • MLW: 64500 kg • LDG_STATUS: L_R_GRD • VRTG: 1.18 g • VRTG Max: • VRTG min: • AP_STATUS: NO AP ON • IVV: -90 ft/min • PITCH: 8.1°

Speed Above VFE (Max Flaps Out Speed)

Speed Above VFE

Speed Above VFE
ALT_AFE : 4205 ft CAS : 251 kts VFE : 230 kts CONF : 0 to 1 Delta CAS-VFE : 21 kts

Speed Above VFE
VFE 350 kts
VFE 230 kts
ALT STD
CONF 0 CONF 1
VFE Event Delta Vel. 21 kts CAS: 251 kts

Speed Above VFE

Speed Above VFE
TASK 05-51-13-200-001-A Inspection after Flap/Slat Extension at more than the Flap/Slat Limiting Speed 1. Reason for the Job 2. Job Set-up Information 3. Job Set-up 4. Procedure
A. General B. Inspection of the Wings C. Inspection of the Flap System D. Inspection of the Slat System E. Operational Test of the Flight Control Surfaces
5. Close-up

Speed Above VFE
Flap No move

Questions…

Flight Data Monitoring
Depto. Flight Data Monitoring E-mail: [email protected] Tel: (56-2) 2663 3877