Embed Size (px)
Citation preview

Food Waste Update
Sustainability/Energy Committee
June 9, 2015

• Background
• Food Waste Contracts – City of Oakland/
Waste Management
– Harvest Power
– Recology
• Overall Food Waste Program – Opportunities
– Infrastructure
– Risks
– O&M Role
• Next Steps
Presentation Outline
2

Background
Project Overview
3
Food Scraps from Routes
Pre-processing Digestion
Slurry
Solid Liquid Separation
Organic Compost
Biogas
Digestate
Renewable CNG
Renewable Electricity

Food Waste Contracts
• City of Oakland/Waste Management
•Harvest Power
• Recology
4

Food Waste Contracts
Waste Management
5
Waste Management
WM Subcontract Status
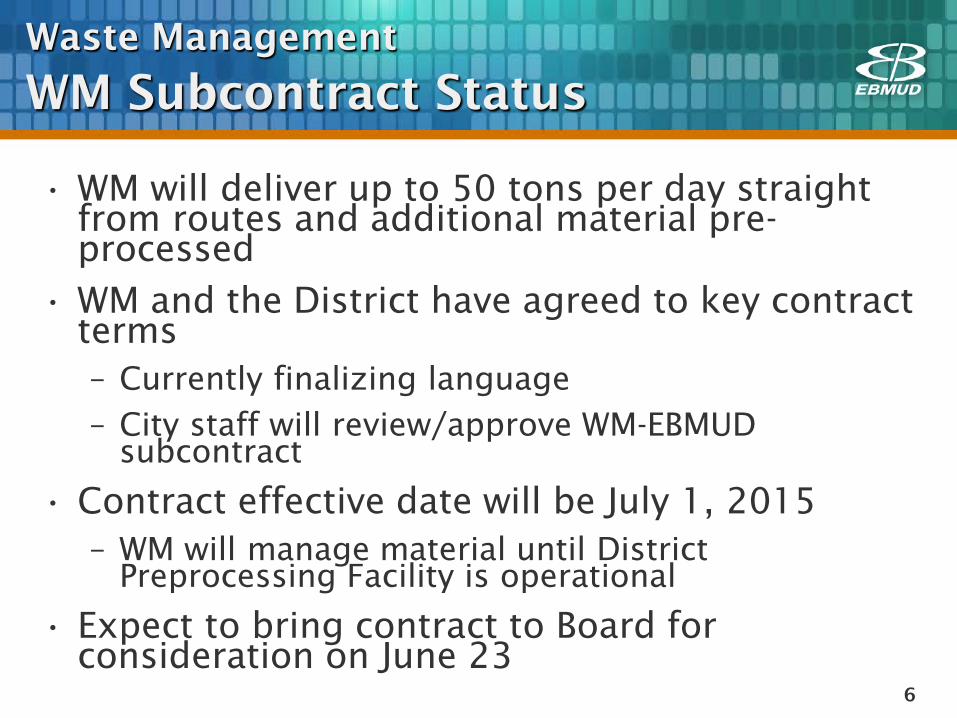
• WM will deliver up to 50 tons per day straight from routes and additional material pre-processed
• WM and the District have agreed to key contract terms – Currently finalizing language
– City staff will review/approve WM-EBMUD subcontract
• Contract effective date will be July 1, 2015 – WM will manage material until District
Preprocessing Facility is operational
• Expect to bring contract to Board for consideration on June 23
6
Food Waste Contracts
Harvest Power
7
Harvest Power
Project Structure
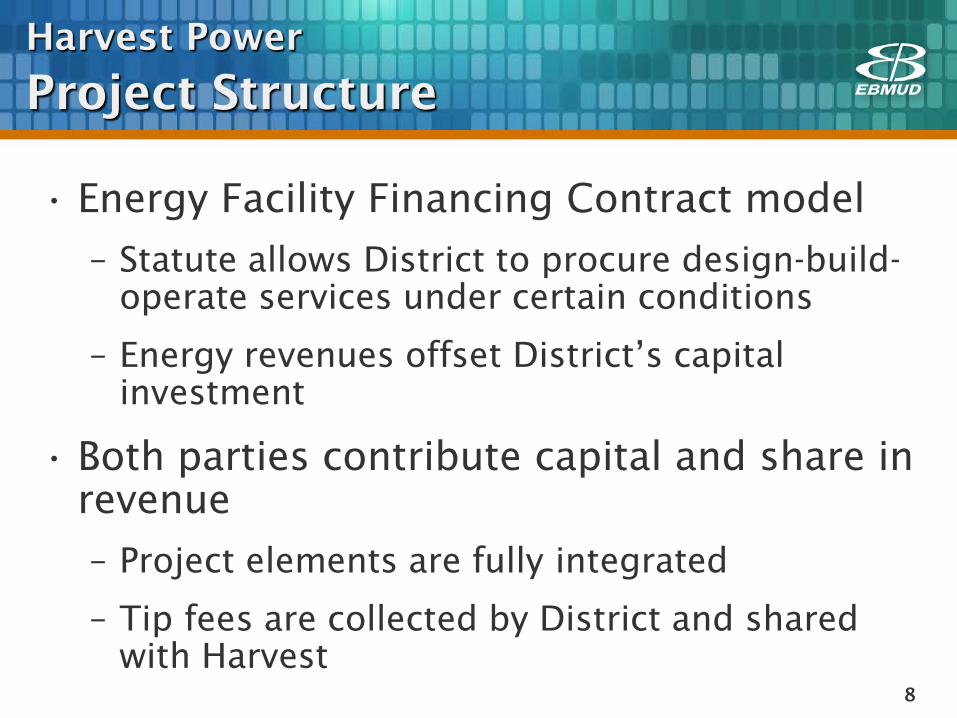
• Energy Facility Financing Contract model
– Statute allows District to procure design-build-operate services under certain conditions
– Energy revenues offset District’s capital investment
• Both parties contribute capital and share in revenue
– Project elements are fully integrated
– Tip fees are collected by District and shared with Harvest
8
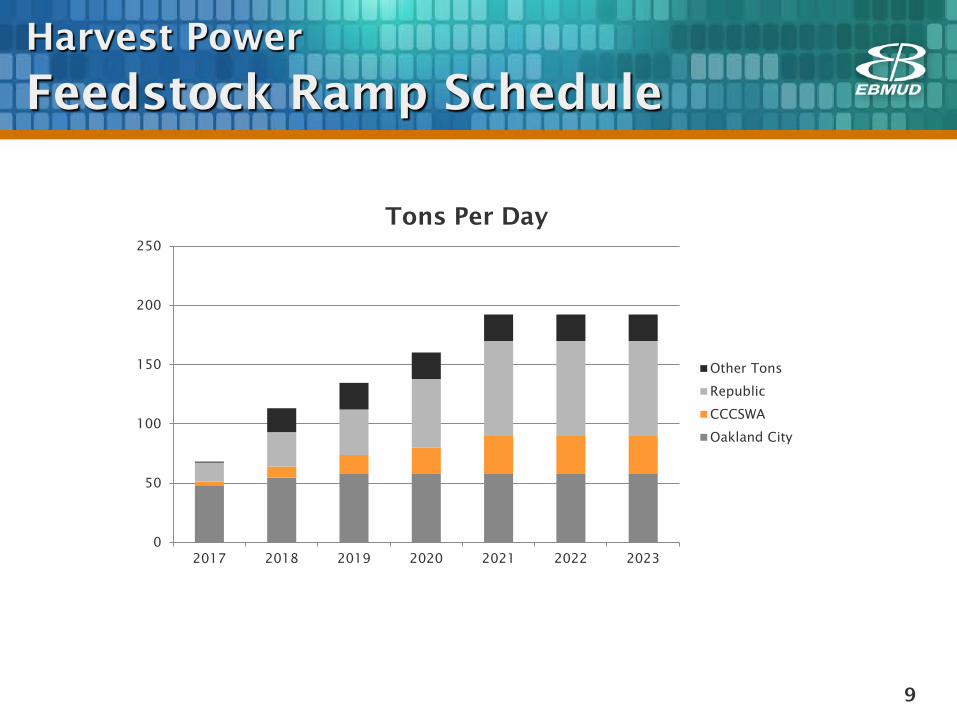
0
50
100
150
200
250
2017 2018 2019 2020 2021 2022 2023
Tons Per Day
Other Tons
Republic
CCCSWA
Oakland City
Harvest Power
Feedstock Ramp Schedule
9

Harvest Power
Feedstock Availability
• Estimated quantities based on state and county waste characterization studies:
10
County Tons per Year Tons per Day
Alameda 91,612 294 Santa Clara (Sunnyvale)
23,858 76
Contra Costa 65,613 210 San Mateo 51,770 166 San Francisco 219,000 702 Total 451,853 1448

Harvest Power
Process Flow
11
Compost Solids
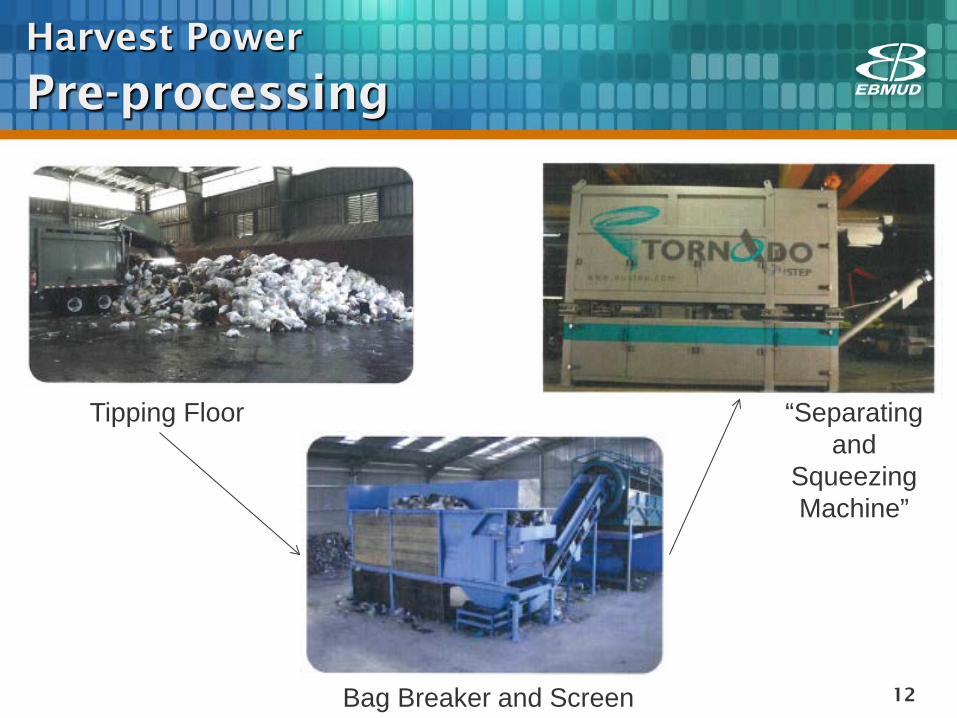
Harvest Power
Pre-processing
12 Bag Breaker and Screen
Tipping Floor “Separating and
Squeezing Machine”

Harvest Power
Site Layout
13
“POST-PROCESSING LEASE AREA”
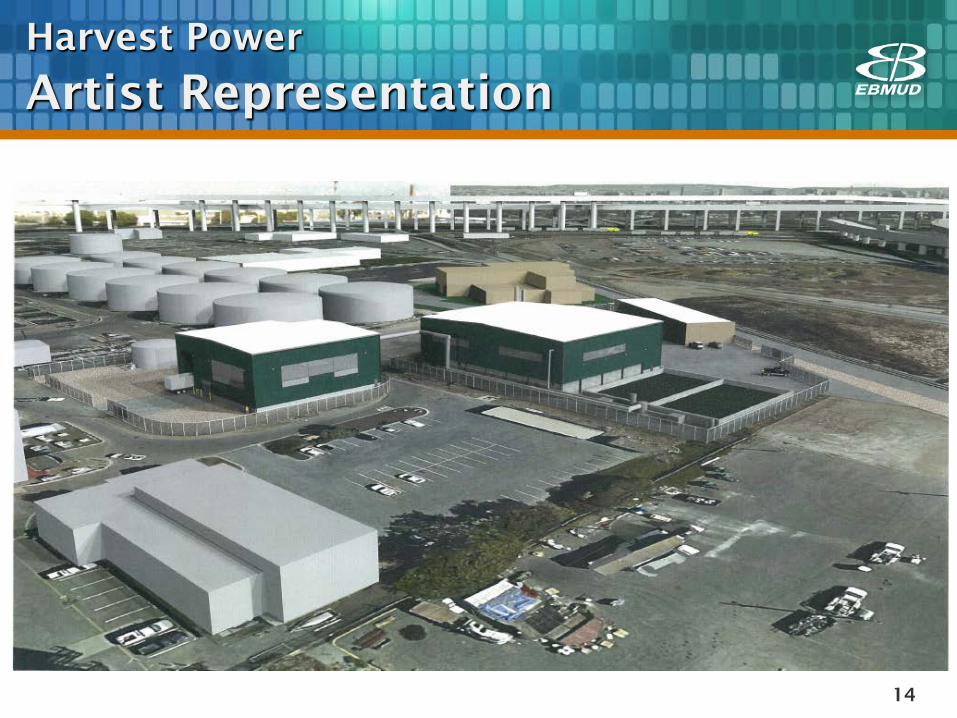
Harvest Power
Artist Representation
14

Harvest Power
Project Cash Flows
Landfill
Compost
Recycling
Oakland Pre-processed $46/ton
Pre-processing Solid Liquid Separation CNG
Oakland As-collected $96/ton
Other As-collected TBD
Service Fee
% of Tip Fee
CNG Revenue
Lease
15

Harvest Power
Project Cash Flows
16
Project
Tip Fee Revenues
Energy (CNG) Revenues
Harvest Capital
District Capital
CEC Grant Funds
Harvest O&M Costs
District O&M Costs
Revenue Share

Total Capital Costs $21,000,000
Harvest Power
Project Cash Flows
Total Gross Revenue $ 232,000,000 Total Operating Costs $ 123,000,000
$ 109,000,000
$-
$2,000,000
$4,000,000
$6,000,000
$8,000,000
$10,000,000
$12,000,000
$14,000,000
Annual Gross Revenues and Annual Operating Costs
Total Revenues
Total Operating Costs

Harvest Power
Discounted Cash Flows
Total Capital Costs $21,000,000 Total Gross Revenue (discounted) $ 131,000,000 Total Operating Costs (discounted) $ 93,000,000
$ 38,000,000
$-
$1,000,000
$2,000,000
$3,000,000
$4,000,000
$5,000,000
$6,000,000
$7,000,000
$8,000,000
Annual Gross Revenues and Annual Operating Costs
Total Revenues (discounted)
Total Operating Costs(discounted)

Harvest Power
Project Net Present Value
19
Scenario Harvest Proposal
Revenue Share Approach
NPV Capital Payback
(yrs)
NPV Capital Payback
(yrs)
Base Case (190 tpd) $4.1M 18 $12.5M 11
Worst Case (Oakland and CC only)
-$23.4M N/A -$2.2M N/A
Reasonable Case (300 tpd)
$24M 8
$37.2M 5

Food Waste Contracts
Recology
20

Recology
Project Overview
• In 2014, Recology was awarded a $3M grant from CalRecycle for organics diversion and digestion at EBMUD
• Project would extract organics from San Francisco mixed solid waste
– Process has two stages:
•Extrusion Press at Recology in SF
•Polisher at EBMUD WWTP
– 70-100 tons/day with significant potential for expansion
21

Recology
Process Schematic
Bag Opener ScreensPress
Hydrocyclone Digesters Dynamic Cyclone
Recology San Francisco
Wet Fraction MSW
EBMUD MWWTP
CH4
Dry Fraction Flotables Grit Digestate

Recology
Project Layout
23
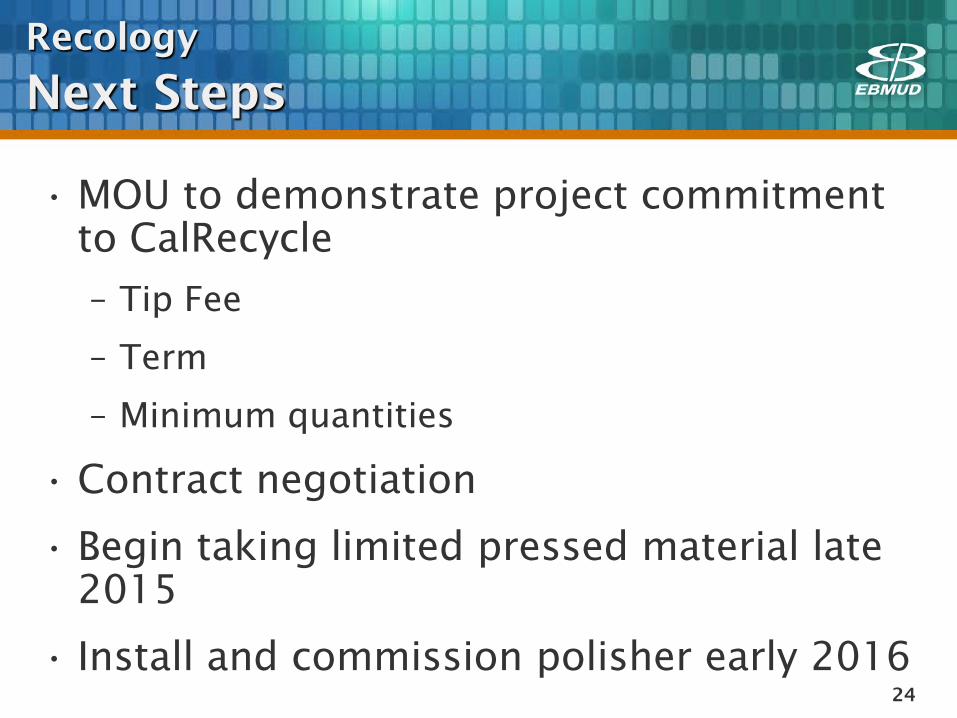
Recology
Next Steps
• MOU to demonstrate project commitment to CalRecycle
– Tip Fee
– Term
– Minimum quantities
• Contract negotiation
• Begin taking limited pressed material late 2015
• Install and commission polisher early 2016 24

Overall Food Waste Program
•Opportunities
• Infrastructure
• Risks
•District O&M Role
25

Overall Food Waste Program
Opportunities
• Project Goals
– Generate renewable energy
– Provide a net benefit to ratepayers
• Food scraps are a local, sustainable source of high-strength waste that offsets losses of other waste streams
– More food waste to become available in the near future
– Composting capacity is limited, and District will have an early market advantage for anaerobic digestion
– Oakland material serves as a base load for the program
26

Food Waste Program Key Infrastructure Needs
• Identify available processing capacity and associated process upgrade needs
• Key Process Areas
– Anaerobic Digestion: Sufficient existing capacity; utilize dedicated digestion to maximize value of digested material and meet project requirements
– Solids Dewatering: Existing capacity and operational limitations; requires new dedicated dewatering capacity
– Gas Management System: Limited capacity; requires CNG facility or expansion of District’s Power Generation Station
• Develop phased-implementation plan to manage capital investments relative to program growth
27

Food Waste Program Capital Improvements
28
Dedicated Digestion Improvements
Solid-Liquid Waste Receiving Station Logistics/Upgrades
Harvest Power Dedicated
Dewatering, CNG Facility
Recology Polisher
Harvest Power Preprocessing Facility
Site/Utility Improvements

Food Waste Program District Capital Costs
• Harvest Power Project (Oakland Food Waste)
– District Contribution to Preprocessing Facility $11.4M
– District share of $5M Harvest CEC Grant ($2.5M)
– Site Improvements (Utilities, Access, Process Upgrades) $3-4M
• Recology Project (Urban Organics)
– Polishing Facility $3-4M
– District share of $3M Recology CalRecycle Grant ($1.2M)
$13.7-15.7M • Proposed FY16-20 CIP
– Includes $14M in FY16-FY18
Note: These are preliminary capital costs and subject to change based on continuing contract negotiations.
29

Food Waste Program Risk Management
• Key Risk Areas
– Financial: Initial capital cost recovery, uncertainty regarding program growth
– Technical: Use of emerging, innovative technologies; source quality issues
– Regulatory: Solid waste permitting with public review process; community concerns regarding odors
– Operational: Uncertain impacts; limited experience
• Identify mitigation measures to address initial risk and reduce overall “residual” risk to acceptable levels, where possible
30
Evaluate Initial Risk Level
Identify Risk Mitigations
Consider in Project Decision Making
Identify Key Risk Areas
Evaluate “Residual” Risk Level

Risk Management Financial
31
Risk
Initial Risk Level
Mitigations
Residual Risk Level
Projected feedstock growth does not materialize HIGH
Long-term base contracts Harvest contract incentives for additional
material District to assist in securing material
MEDIUM
Capital investment is not recovered or longer than expected payback period HIGH
Both parties share capital risk Share grant funding Implement project in phases Require long-term contract obligations
MEDIUM
District is unable to meet required facility startup date (e.g., construction/permitting delays) and City does not approve extended schedule
HIGH
Contract with City has an allowance to request an extension of startup date Include Harvest contract incentives Start permitting process early
HIGH
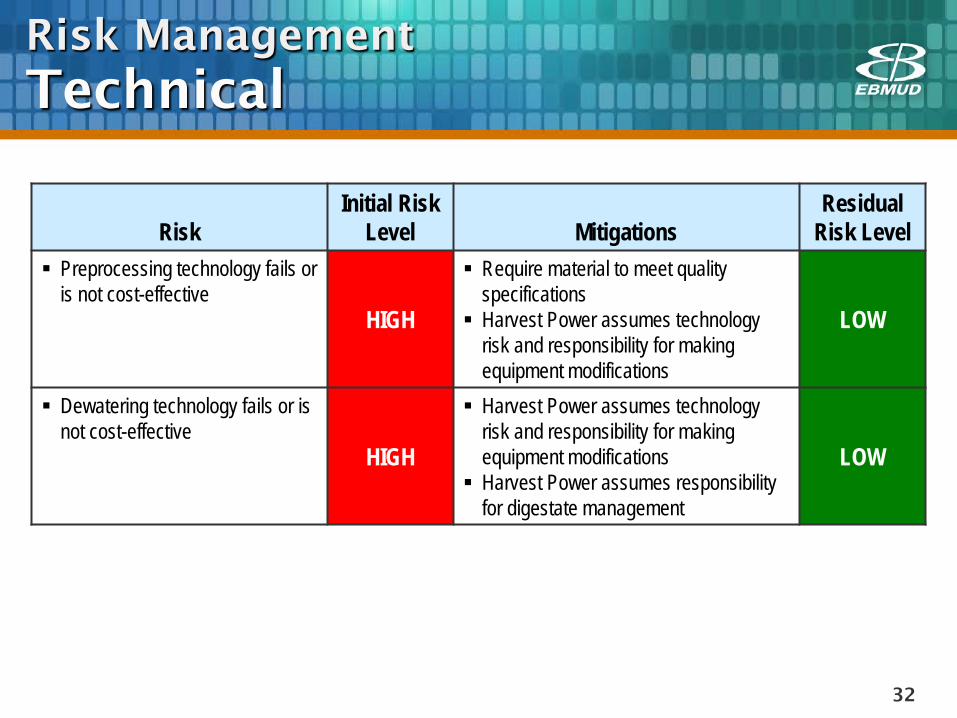
Risk Management Technical
32
Risk
Initial Risk Level
Mitigations
Residual Risk Level
Preprocessing technology fails or is not cost-effective
HIGH
Require material to meet quality specifications Harvest Power assumes technology
risk and responsibility for making equipment modifications
LOW
Dewatering technology fails or is not cost-effective
HIGH
Harvest Power assumes technology risk and responsibility for making equipment modifications Harvest Power assumes responsibility
for digestate management
LOW

Risk Management Regulatory
33
Risk
Initial Risk Level
Mitigations
Residual Risk Level
Harvest and/or District are unable to secure a solid waste permit for preprocessing facility MEDIUM
Start permitting process early and allow time to address any concerns from the public or local enforcement agency (LEA) Coordinate outreach efforts with Harvest
LOW
Solid waste permitting process requires additional project requirements
MEDIUM Implement effective outreach efforts Build significant facility and operational
controls into initial project phase LOW
Facility odors cause off-site impacts HIGH
Require building enclosure, odor control systems, operational controls Implement additional odor controls, as
needed
MEDIUM
Increased gas flaring with potential permit implications MEDIUM Require Harvest to construct CNG
facilities to minimize flaring potential LOW
LOW

Risk Management Operational
34
Risk
Initial Risk Level
Mitigations
Residual Risk Level
Poor quality material with unforeseen or greater than expected process impacts/costs (e.g., high contamination, low gas value)
HIGH
Require material quality specifications for WM, Harvest, Recology Review WM customer lists Implement quality testing protocol District to provide support for targeted
customer education
MEDIUM
District and/or its contractors are periodically unable to process mat’l HIGH WM is responsible for material during
facility downtime LOW
Inadequate solids dewatering capacity HIGH Require dedicated dewatering facility
with phased expansion LOW
Inability to operate facilities due to grit impacts HIGH
Require Harvest to include a grit removal process and “buffer” tank Include digester cleaning costs and
dedicated dewatering facility
LOW
Waste receiving, processing, and feeding logistics limit capacity MEDIUM Ensure District has adequate
operational flexibility LOW

Risk Management Summary
35
Significant Residual Risks
Residual Risk Level
Financial Projected feedstock growth does not materialize Capital investment is not recovered or longer than expected payback period District is unable to meet required facility startup date and City does not
approve extended schedule
MEDIUM
Operational Poor quality material with unforeseen or greater than expected process impacts/costs MEDIUM
HIGH

Food Waste Program
District O&M Role
•Harvest Power to operate dewatering due to integration
36
Dewatering
Preprocessing Compost
Grit Removal
Chemical Addition
Cake Dryness
Product Quality

Food Waste Program
District O&M Role (cont.)
•District to operate Recology polisher
• Considering operation of CNG
• 10-year check-in with Harvest Power to re-evaluate O&M roles
37

Next Steps
• Continue contract negotiations with focus on maximizing benefits while minimizing risks to the District
• Continue to update the financial model to ensure there is sufficient net value to offset outstanding risks, as well as provide a financial benefit to the District’s customers
• Provide future updates as contract negotiations progress toward conclusion
• Submit contracts for Board consideration – WM Subcontract for Oakland – Harvest Power – Recology
38


![Developments in upgrading digestate Pelletizing - …...Nutrients of digestate 5 Type of digestate DM [%] N total [kg/m³] NH 4 [kg/m³] P 2 O 5 [kg/m³] K 2 O [kg/m³] Liquid digestate](https://img.pdfslide.us/doc/110x75/5fb935f7ef3b3f270171ee43/developments-in-upgrading-digestate-pelletizing-nutrients-of-digestate-5-type.jpg)