Embed Size (px)
Citation preview

1
Food service in hospital: an indicative model for patient satisfaction.

2
H.J. HARTWELL, J.S.A. EDWARDS, AND J. BEAVIS The Worshipful Company of
Cooks Research Centre, Bournemouth University, Talbot Campus, Poole, Dorset, BH12
5BB
Corresponding author: Heather Hartwell, Tel: 01202 595585 e-mail:
3
Abstract
Purpose: The aim of this research was to explore the antecedents to patient satisfaction
with food quality within a hospital setting and develop an indicative model.
Methodology: A consumer opinion card concentrating on the quality indicators of core
foods was used to measure patient satisfaction and compare two systems of delivery;
plate and trolley.
Findings: Results show that the bulk trolley method of food distribution enables all
foods to have a better texture, and for some foods (potato, poached fish and minced
beef) temperature, and for other foods (broccoli, carrots, and poached fish) flavour than
the plate system of delivery, where flavour is associated with bad opinion or
dissatisfaction.
Practical implications: This research confirms patient satisfaction is enhanced by
choice at the point of consumption; however, portion size was not the controlling
dimension. Temperature and texture were the most important attributes which measure
patient satisfaction with food, therefore defining the focus for hospital food service
managers.
Originality: An indicative model outlining patient satisfaction with hospital food
service has not been previously published and adds to the body of knowledge in this
field.
Key Words patient satisfaction, food service, food quality, research paper
Total word count
4
Introduction
The provision of hospital meals is a complex and difficult operation, perhaps the most
diverse within the healthcare industry, aggravated by the number of stakeholders.
Catering systems can have a major impact on the nutritional intake of hospitalised
patients where the potential for malnutrition is well recognised (McWhirter and
Pennington, 1994; Mowe et al, 2006). An essential component in successful catering
management is customer satisfaction; however, in a hospital setting, this is a
complicated phenomenon and influenced by many factors. The public generally view
hospitals as institutions and institutional catering has a reputation for being poor
(Bender, 1984). Customer satisfaction with hospital food service is multifactorial and
difficult to assess, particularly as each patient has his or her own expectations. Some
studies report that food quality is the most important indicator (Dubé et al., 1994;
O’Hara et al., 1997; Lau and Gregoire, 1998; Hwang et al., 2003) while other studies
suggest that ‘interpersonal’ or service aspects are the most pertinent (DeLuco and
Cremer, 1990; Gregoire, 1994; Bélanger and Dubé, 1996). Previous research has shown
that food preference and acceptance constitutes 50% of the variability in consumption
(Cardello et al, 1996), and is not only a result of the intrinsic quality of the food; but can
also be related to consumer expectations and the degree to which the food item matches
them (Oh, 2000).
As ‘eating out’ increases, consumers are becoming more sophisticated and demanding,
and their expectations of quality are high (Mintel, 2000). This is reflected in all areas of
public health food service including hospitals. Food quality is problematic to define as it
is dependent on the evaluation of the consumer; it is both perceptually based and
evaluative. Notwithstanding, perceptions of a food product have been shown to be
affected by many individual factors including taste, odour, information from labelling,
5
attitudes and memories of previous experiences (Imram, 1999). Sensory characteristics
such as appearance, flavour, texture and temperature have been found to be most
important to hospital patients when judging food quality (Cardello, 1982; Clark, 1998).
Texture and flavour have a profound effect on perception and acceptability, however
‘the first taste is almost always with the eye’ (Szczesniak, 1972). The role of texture is
very product dependent however, attributes such as soggy, watery, lumpy, sticky, slimy,
crumbly and tough, all which give a lack of control in the mouth are generally disliked
(Cardello, 1996). The relative importance of any one attribute is dependent on the
particular food item. For example, for chicken soup the predominant factor determining
acceptance may be flavour, whereas for bread, texture could be the most important
factor.
Perceived control over a situation also influences satisfaction (Bélanger and Dubé,
1996). It is predicted that where patients have increased involvement with the food
service process (Sheehan-Smith L.M., 2004), such as in the trolley style of delivery
where choice is at the point of consumption, satisfaction would be increased. For
patients, food service, to a certain extent, provides one of the few hospital experiences
that they can control.
Notwithstanding, food quality, preference and satisfaction of each patient group will
need to be addressed if hospital food service is to fulfil both physiological and
psychological requirements. Patient malnutrition can be reduced by better catering
services (O’Flynn et al, 2005). The reported study formed part of a larger research
programme and was designed to enhance and validate information already gathered.
The aim of this research was to explore the antecedents to patient satisfaction with food
quality within a hospital setting and develop an indicative model.
6
Methodology
A NHS hospital was identified in the South of England where a plated system of food
delivery was in place (June 2000) but where a bulk trolley system was due to be
introduced (June, 2001). Permission was sought and granted by the Local Research
Ethics Committee to conduct this research and an information sheet together with a
patient consent form was given to participating patients.
The hospital selected for the case study serves approximately 800 meals at each main
meal using a four week menu cycle and was allowed £1.98 per patient per day (July
1999) for food and beverage costs.
At breakfast there was a choice of white or brown bread, the option of fruit juice,
porridge and cereal. For lunch, the first course was characterised by ‘home-made’ soup
or fruit juice. Main courses comprised sandwiches, meats, fish and vegetarian meals
with carbohydrates as accompaniment. There were five choices of main course and a
potato dish was offered every day; with creamed potato the most frequent option.
‘Milky’ puddings and ice cream were available for dessert at lunch time. For the
evening meal, fruit juice or soup were offered, however this time, dried soup powder
was used. There were five choices of main course, including a vegetarian option,
followed by dessert, which could be a trifle/mousse/ice cream or cheese and biscuits.
Data were collected from patients in the Orthopaedic wards for both systems of
delivery. These wards were identified with the help of medical staff as the most suitable
in that patients are more likely to stay longer, their medical condition would not
interfere with food consumption, they are capable of independent judgement, and are
highly critical, as evidenced by past surveys conducted by the food service manager.
Demographic patient details are given in more detail in Table 1. It was concluded that
7
research findings would have implications for the rest of the hospital as these patients
are the most difficult to satisfy. Wards selected were also last to receive their meals
being either at the end of the ‘belt run’ for the plated system or the final ward for trolley
service delivery. Therefore the research setting constituted the worst case scenario for
food acceptability and satisfaction.
The consistency of the sample was ensured as the wards chosen were for elective
surgery, implying that the patient profile generally remains static and the medical
conditions are similar. Food service staff and menu choice were identical for both plate
and trolley system of delivery and therefore any change observed would be due to the
factor of food service system.
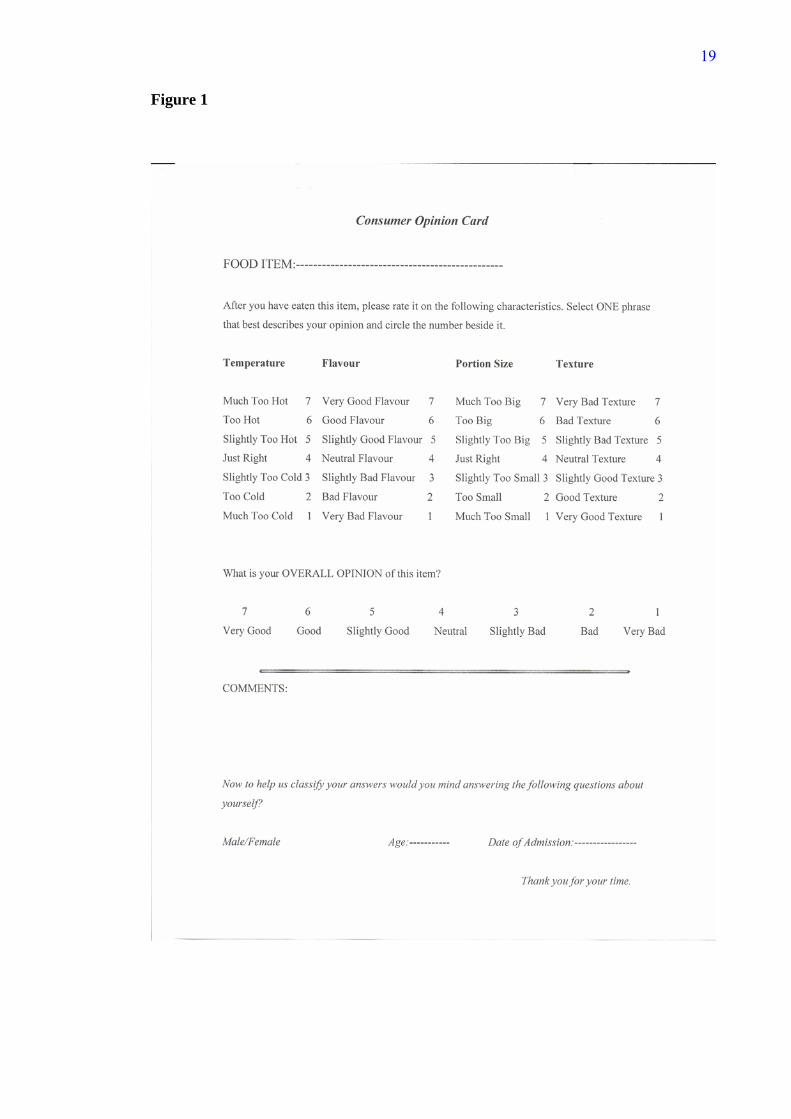
A consumer opinion card, adapted from Cardello (1982), concentrating on the quality
indicators of core foods was used to measure patient satisfaction and compare the two
systems of delivery, plate and trolley. The critical aspect of quality assessment of foods
is often subjective, however by using contemporary psychophysical (sensory) and
psychometric (opinion survey) measures, these subjective variables can be measured
objectively (Cardello et al, 1984).
The opinion card as presented at Figure 1, was developed at the U.S. Army Natick
Research and Development Laboratories to assess patient and staff acceptance for food
items served at military hospitals. The reliability and validity of the card has been
previously evaluated and has been shown to be superior to other forms with similar
formats (Cardello, 1982).
Insert Figure 1 here
The survey instrument consisted of five, 7-point rating scales, three questions were
coded 7=very positive to 1=very negative and two questions coded as a ‘just about
right’ scale. Space for open ended comments was also given. Five attributes of the food
8
were rated; temperature, texture, flavour, portion size, as well as the respondent’s
overall opinion of the food. To prevent respondent pattern response, categories were
inverted for some questions. These were then coded appropriately for data analysis.
The core foods selected were carrots, broccoli, minced beef dish, a poached fish dish,
creamed potatoes and a cold pudding. These items were chosen as they appeared on
both the plate and trolley system menu and therefore enabled a direct comparison
between the two food service systems.
The opinion card was distributed (n=180) by the researcher on the wards during meal
times for both systems of delivery. Patients were asked to complete the cards once they
had received their trays while consuming their meal. The responses were then collected
for analysis which used non-parametric statistics as normal distribution was not
confirmed. Comparison between service style and food attribute was tested using the
Mann-Whitney U Test.
Binary logistic regression analysis was used to build a model which would predict food
service style on the basis of the food attributes measured. Further investigation used
multinomial logistic regression to predict opinion for the assessment of each food
attribute within food service style. The theoretical distinction between the two is that the
former produces predictions at the individual case level while the latter internally
aggregates cases to form subpopulations and is therefore, more general.
i. Binary Logistic Regression
This analysis can be used when an outcome is to be predicted based on values of
a set of predictor variables. It is suited to models where the dependent variable is
dichotomous or binary i.e. food service and is the preferred analytical technique
when compared to linear regression and discriminant analysis, as the set of
independent variables may be categorical, continuous, discrete, or a mix (28).
9
Logistic regression coefficients can be used to estimate odds ratios for each of
the independent variables in the model.
Temperature and portion size were defined as categorical, as the scale used was
a ‘just about right’ scale while flavour and texture items were defined as ordinal.
Optimising the model was not pursued as the object of the analysis was to
ascertain which of the variables was most influential in making the classification
of food service style. The model was therefore estimated using a block entry of
variables.
ii. Multinomial Logistic Regression
This type of analysis can be used when subjects are classified based on values of
a set of predictor variables. In multinomial logistic regression the dependent
variable should be categorical and larger than binary. Quality attributes were
used for the selected core foods as predictor variables in a model classifying
response in terms of a category opinion scale. A satisfied response was defined
as either ‘good’ or ‘very good’, for example the top end of the opinion scale
(29). Again the model was not optimised as the purpose of the analysis was to
gain an insight into the variables which were most influential towards
satisfaction.
Results
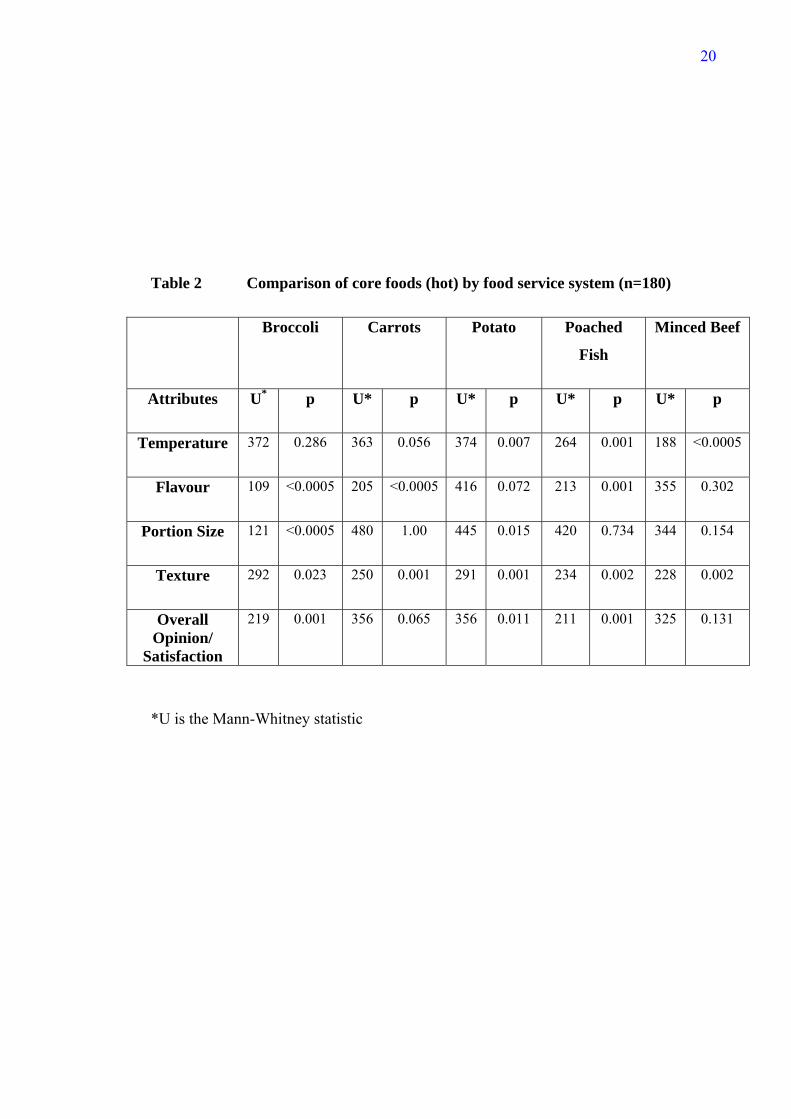
Results of the consumer opinion/satisfaction card (n= 180) are summarised in Table 2.
A significant difference in the rating of temperature for the minced beef, poached fish
and potato dish was shown. Further analysis revealed that patients thought these dishes
were significantly hotter served by the trolley system. However, it was observed that the
vegetables; carrots and broccoli, were spread out in the gastronome pan on the bulk
trolley, dissipating heat, mirroring the situation found on a plate. Temperature,
therefore, of these items demonstrated no significant difference between the two food
10
service systems. Flavour of the vegetables and fish dish together with texture for all
foods however, were significantly enhanced by the bulk trolley system of food delivery.
There was a significant difference (p≤0.05) in satisfaction with portion size for broccoli
and potato. Overall patients’ opinion showed that the broccoli, creamed potato, and fish
dish benefited by choice at the point of consumption. Satisfaction with cold desserts
such as trifles was found not to be dependent on the delivery system.
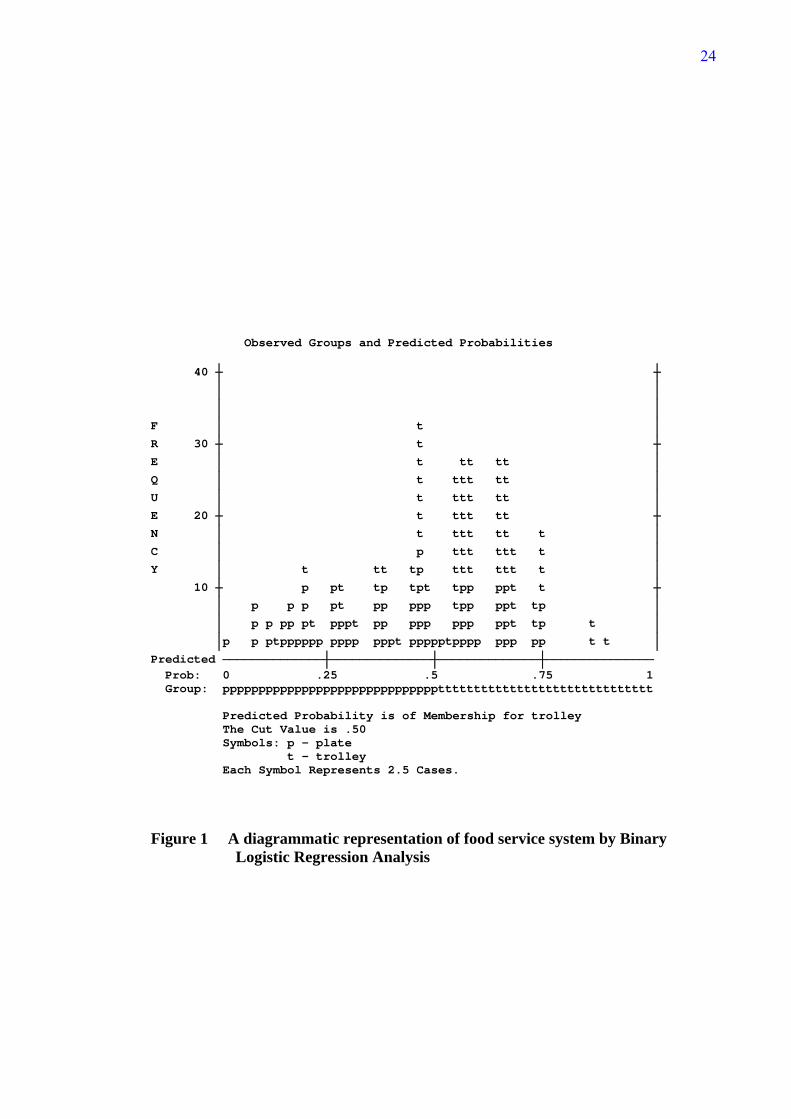
Binary Logistic Regression Analysis
Table 3 shows the summary statistics of binary logistic regression for the model of food
service calculated before the procedure terminated. This procedure initially classifies all
cases to the plate service (plate=0). As the model progresses and terminates, some cases
are reassigned to the trolley service (trolley=1) and a predicted probability of
membership to a food service system is achieved. The overall ‘goodness of fit’ of the
model was assessed using the Hosmer and Lemeshow test, and was found not to be
significant (p=0.2), showing that the model reasonably fitted the data. The Nagelkerke
R-squared statistic indicates that the model, as fitted, explains 20.6 % of the variability
and classification improved by 15%. The conclusions that can be drawn, therefore, are
only a tentative indication of strength of relationship. The results of the logistic
regression analysis indicate that there was a significant influence between the two
independent variables, portion size and texture and the dependent variable, food service
style. This suggests that the texture of food is influential in assigning a case to the
trolley system of delivery, whereas the attribute portion size is related to the plate
system. A diagrammatic representation is presented in Figure 1.
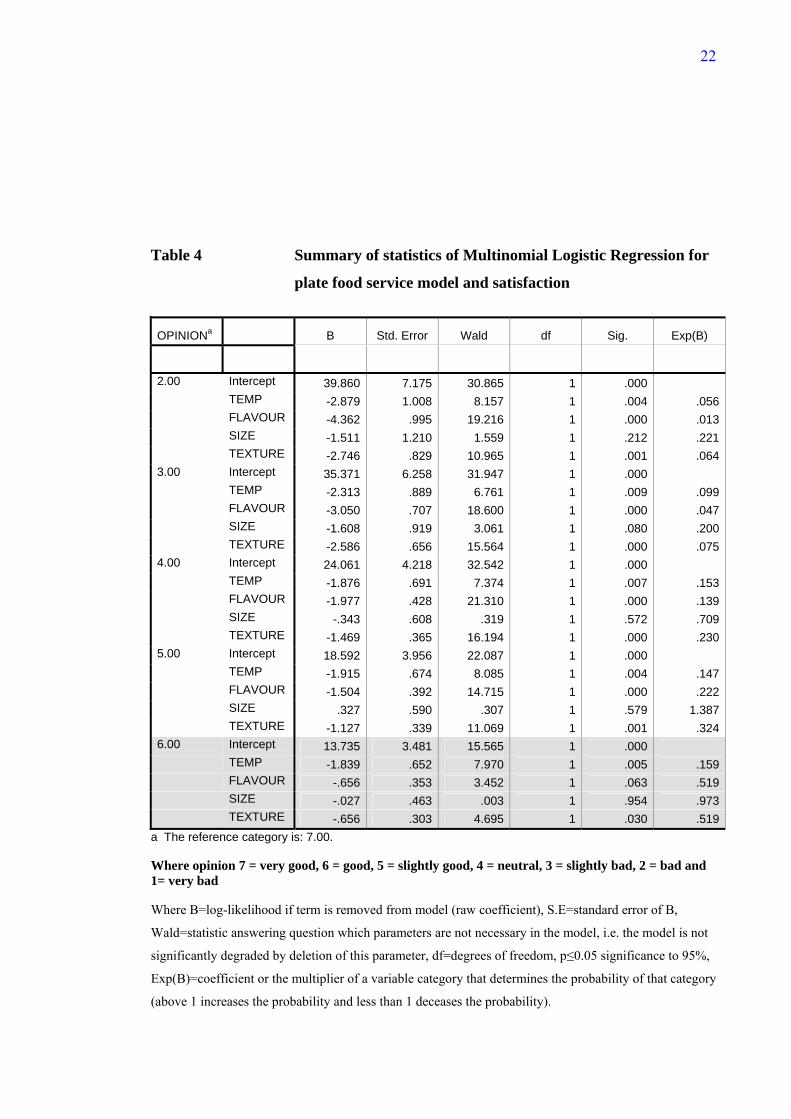
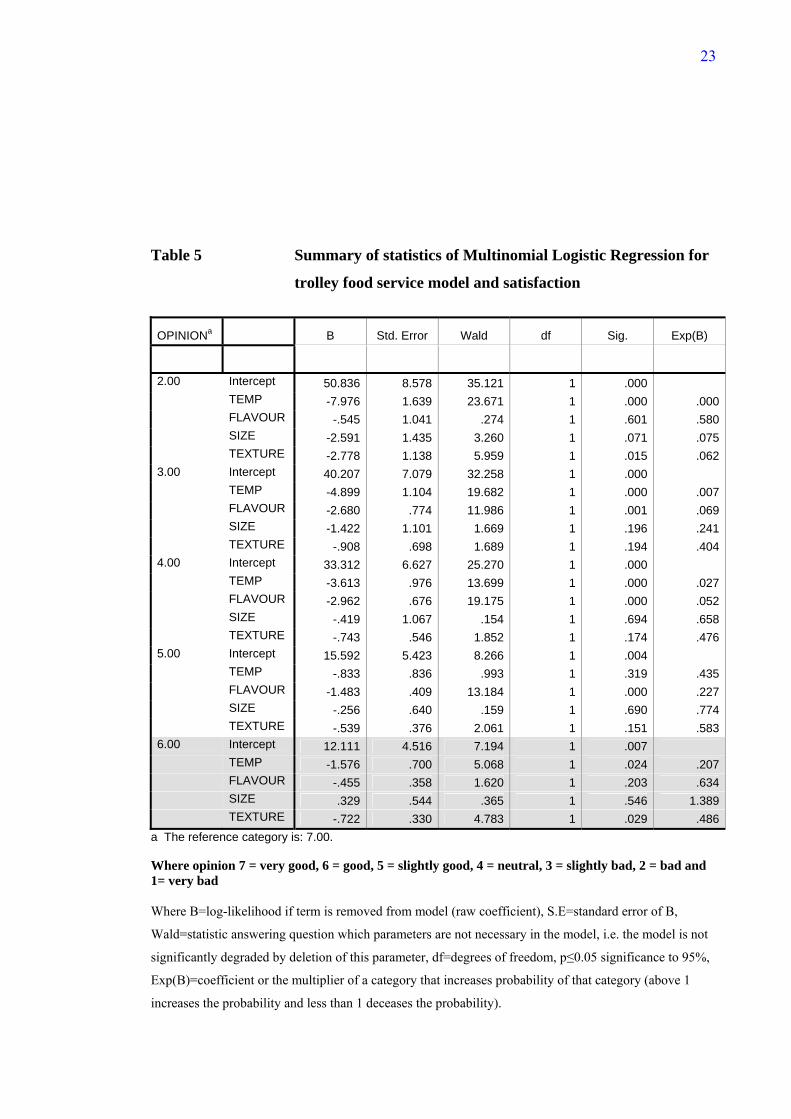
Multinomial Logistic Regression Analysis
Multinomial logistic regression was used to predict opinion using the quality attributes
of selected core foods. The categorical variables, temperature and portion size, were
recoded from a ‘just about right’ scale into an ordinal scale (level 1-4) and then
11
multinomial logistic regression analysis conducted on both serving systems, plate and
trolley. For the plate system of delivery the Nagelkerke R-squared value (0.72)
demonstrated that 72% of the variance was explained by the model and classification
improved by 29%. Results are presented in Table 4. For the trolley system of delivery
the Nagelkerke R-squared value (0.71) demonstrated that 71% of the variance was
explained by the model and classification improved by 24%. Results are presented in
Table 5.
When overall satisfaction is considered in a continuous way for both styles of food
service, it is predicted by the attributes of temperature and texture. As satisfaction
groups are created (bad opinion, slightly bad, neutral, slightly good and good) it can be
seen that for the plate system of delivery the attribute flavour could be important too.
Results are rather contradictory for the trolley system of delivery. The literature
suggests that in reality there may be little substantive difference between someone who
is very satisfied and someone who is somewhat satisfied (20).
Discussion
The consideration of patient’s expectations and perceptions should have particular
significance in shaping the objectives of any food service operation. Patient meal
satisfaction has been previously studied (30) but discussion centred on menu changes
rather than improving the food quality of the dishes already offered and service style.
Other research (31) has addressed issues such as the physical environment of the
hospital meal and its perceived importance, however to date a model has not been
proposed, predicting patient satisfaction with the quality of food as served. Taking an
overview and using the three different analytical approaches to data analysis (Mann-
Whitney U, Binary Logistic Regression and Multinomial Regression), it is reasonable to
assert that, temperature and overall flavour attributes were not significantly different
between the two styles of food service, conversely portion size and texture of food are
12
different. However, consumer satisfaction is dependent on temperature and texture
attributes. Portion size was not found to influence satisfaction and therefore the attribute
‘texture’ appears to be the main dimension in this research which relates patient
satisfaction with food service and the trolley system of delivery. Expectations were
matched by the trolley service of delivery and hence a corresponding level of
satisfaction was achieved. Results obtained from the consumer opinion card show that
the bulk trolley method of food distribution enables all foods to have a better texture,
and for some foods (potato, poached fish and minced beef) temperature, and for other
foods (broccoli, carrots, and poached fish) flavour than the plate system of delivery,
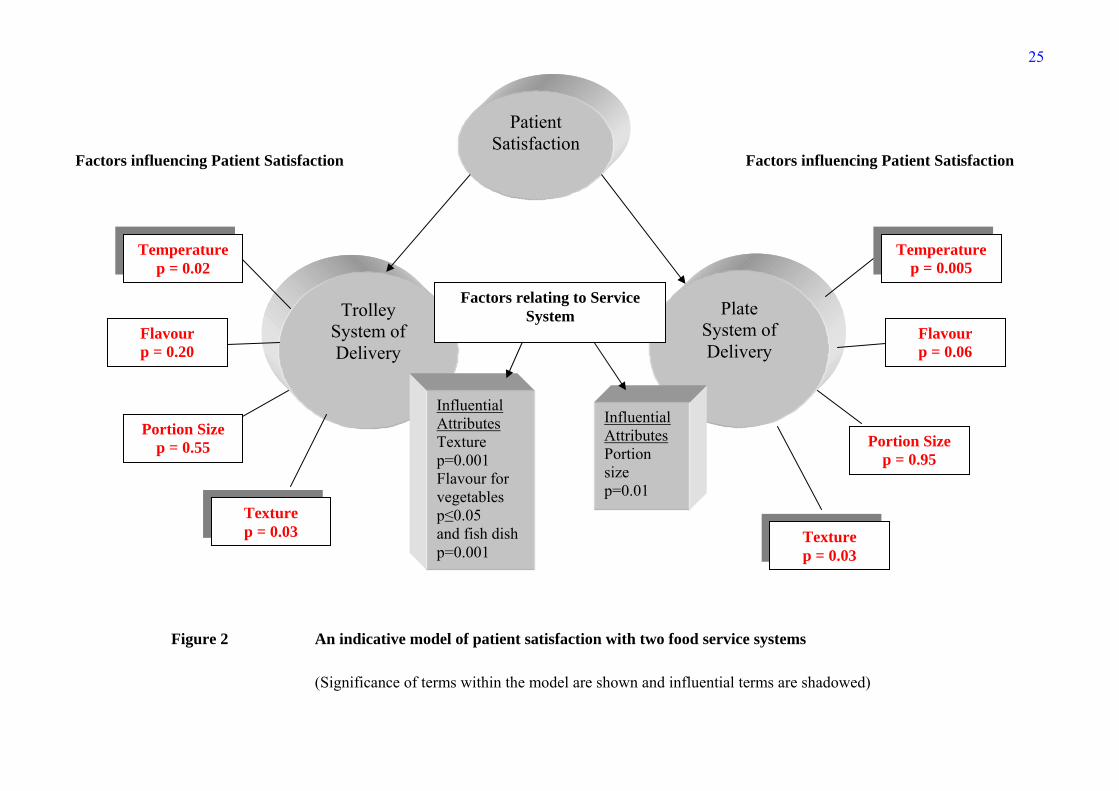
where flavour is associated with bad opinion or dissatisfaction. An indicative model of
the factors involved in consumer satisfaction with two food service systems is presented
in Figure 2.
Unfortunately hospital food service has an image problem, before even tasting any food
patients generally expect poor quality (32); this has been described as ‘institutionalised
stereotyping’ (11). Food quality attributes have been demonstrated in this study to have
a critical effect on patient satisfaction. While confirming previous results (19-22),
attributes of significance (temperature and texture) have been established by comparing
two systems of delivery. Strong preferences have been shown for the appropriate
temperature of food and this can influence acceptance (33-34). Texture is a sensory
characteristic which has also been shown to influence satisfaction (35) and is
susceptible in institutional food (36). Sensory characteristics have been identified in the
literature as being important to hospital patients when judging food quality (14-15).
This research confirms patient satisfaction is enhanced by choice at the point of
consumption; however, portion size was not the controlling dimension. Temperature
and texture were the most important attributes which determine patient satisfaction with
13
food, therefore defining the focus for hospital food service managers. The first step to
better hospital food is quality. Food served with appropriate sensory properties would
tempt jaded appetites and encourage self recovery and as summarised by one patient.
‘…what we need is basic care, the food that we want, it should be hot, it should be well
presented and well cooked. If we don’t eat we will be in hospital for longer and all we
want to do is go home’
Acknowledgements
Permission was sought and granted by the NHS Trust Research Ethics Committee to
conduct this research.
Data confidentiality:
Although subjects were identified by sex, ward, bay and bed number, this was done
purely as a means of identifying patients in order to eliminate the likelihood of data
being transposed. A unique number was used for data analysis
References
Bélanger M-C. and Dubé L. (1996) The emotional experience of hospitalization: It's
moderators and it's role in patient satisfaction with foodservices. Journal of The
American Dietetic Association, 96, 354-360.
Bender A.E. (1984) Insitutional malnutrition. British Medical Journal, 288, 92-93.
Cardello A. (1982) Hospital Patient Feeding Systems, Washington D.C.: National
Academic Press.
Cardello A. (1996) The role of human senses in food acceptance In Meiselman H.L. and
MacFie H.J.H. (ed.) Food choice, acceptance and consumption., London: Blackie
academic and professional.
14
Cardello A., Bell R. and Kramer M. (1996) Attitudes of consumers toward military
and other institutional foods. Food Quality and Preference, 7, 7-20.
Clark J.E. (1998) Taste and flavour: their importance in food choice and acceptance.
Proceedings of the Nutrition Society, 57, 639-643.
DeLuco D. and Cremer M. (1990) Consumers' perceptions of hospital food and dietary
services. Journal of The American Dietetic Association, 90, 1711-1715.
Dubé L., Trudeau E. and Bélanger M-C (1994) Determining the complexity of patient
satisfaction with foodservices. Journal of The American Dietetic Association, 94, 394-
400.
Gregoire M. B. (1994) Quality of patient meal service in hospitals: Delivery of meals by
dietary employees vs delivery by nursing employees. Journal of The American Dietetic
Association, 94, 1129-1134.
Hwang Li-Jen J., Eves A. and Desombre T. (2003) Gap analysis of patient meal service
perceptions. International Journal of Health Care Quality Assurance, 16, 143-153.
Imram N. (1999) The role of visual cues in consumer perception and acceptance of a
food product. Nutrition and Food Science, 5, 224-228.
Oh H. (2000) Diners' Perceptions of Quality, Value and Satisfaction. Cornell Hotel and
Restaurant Administration Quarterly, June, 58-66.
O’Flynn J., Peake H., Hickson M., Foster D. and Frost G. (2005) The prevalence of
malnutrition in hospitals can be reduced: Results from three consecutive corss-sectional
studies. Clinical Nutrition, 24, 6, 1078-1088.
O'Hara P.A., Harper D.W., Kangas M., Dubeau J., Borsutzky C. and Lemire N. (1997)
Taste, temperature and presentation predict satisfaction with food services in a Canadian
continuing-care hospital. Journal of the American Dietetic Association, 97, 401-405.
15
Lau C. and Gregoire M. B. (1998) Quality ratings of a hospital food service
department by inpatients and post-discharge patients. Journal of The American Dietetic
Association, 98, 1303-1307.
McWhirter J.P. and Pennington C.R. (1994) Incidence and Recognition of Malnutrition
in Hospitals. British Medical Journal, 308, 945-948.
Mintel Consumer Report (2000) Eating Out Habits, London: Mintel International Group
Limited.
Mowe M., Bosaeus I., Rasmussen H., Kondrup J., Unossen M. and Øivind I. (2006)
Nutritional routines and attitudes among doctors and nurses in Scandinavia: A
questionnaire based survey, Clinical Nutrition, 25, 524-532.
Sheehan-Smith L.M., (2004) Hotel-style room service in hospitals: the new paradigm of
meal delivery for achieving patient satisfaction of food service. Journal of The
American Dietetic Association, 104, Supplement 2, 43.
Szczesniak A.S. (1972) Symposium: texture measurement. Instrumental methods of
texture measurement. Food Technology, 26, 50-63.
1. Kipps M. and Middleton T.C. (1990) Achieving quality and choice for the customer in hospital catering. International Journal of Hospitality Management, 9, 69-83.
2. Barrie D. (1996) The provision of food and catering services in hospital. Journal of Hospital Infection, 33, 13-33.
3. Bolton S. (2002) Consumer as king in the NHS. The International Journal of Public Sector Management, 15, 129-139.
4. Pizam A. and Ellis T. (1999) Customer satisfaction and its measurement in hospitality enterprises. International Journal of Contemporary Hospitality Management, 11, 326-339.
16
5. Mela D.J. (1999) Food choice and intake: the human factor. Proceedings of the Nutrition Society, 58, 513-521.
6. Faulkner M. (2001) A measure of patient empowerment in hospital environments catering for older people. Journal of Advanced Nursing, 34, 676-686.
7. Wilson A., Evans S. and Frost G. (2000) A comparison of the amount of food served and consumed according to meal service system. Journal of Human Nutrition and Dietetics, 13, 271-275.
8. Hetherington M.J. and MacDougall D.B. (1992) Visual and instrumental attribute models of fruit juices and milk. Food Quality and Preference, 3, 165-174.
9. Pizam A. and Ellis T. (1999) Customer satisfaction and its measurement in hospitality enterprises. International Journal of Contemporary Hospitality Management, 11, 326-339.
10. Cardello A., Maller O. and Kluter R (1984) Multi-user assessment of a hospital cook-freeze food service system. Journal of Foodservice Systems, 3, 153-169.
11. Kivela J., Reece J. and Inbakaran R. (1999) Consumer research in the restaurant environment. Part 2: research design and analytical methods. International Journal of Contemporary Hospitality Management, 11, 269-286.
12. Woods S.E. and Heidari Z. (2003) The influence of gender on patient satisfaction. Journal of Gender-Specific Medicine, 6, 30-35.
13. Watters C., Sorensen J., Fiala A. and Wismer W. (2003) Exploring patient satisfaction with foodservice through focus groups and meal rounds. Journal of the American Dietetic Association, 103, 10, 1347-1349.
14. Lassen K., Kruse F. and Bjerrum M. (2005) Nutritional care of Danish medical inpatients – patients’ perspectives. Scand J. Caring Sci, 19, 259-267
15. Beck A.M., Balknäs U.N., Fürst P., Hasunenk., Jones L., Keller U., Melchior J-C., Mikkelsen B.E., Schauder P., Sivonen L., Zinck O., Řien H. and Ovesen L. (2001) Food and nutritional care in hospitals: how to prevent undernutrition -report and guidelines from the Council of Europe. Clinical Nutrition, 20, 455-460.
16. Ryynanen S., Tuorila A, H., Hyvonen, L. (2001) Perceived temperature effects on microwave heated meals and meal components. Food Service Technology, 1, 141-148.
17. Capra S., Wright O., Sardie M., Bauer J. and Askew D. (2005) The acute hospital foodservice patient satisfaction questionnaire: the development of a valid and reliable tool to measure patient satisfaction with acute care hospital foodservices. Foodservice Research International, 16, 1-14
18. Rosenthal A. J. (1999) Food Texture: measurement and perception, Gaithersburg: Aspen.
19. Royal Commission on the National Health Service (1978) Patients' attitudes to the hospital service, London: HMSO.

17
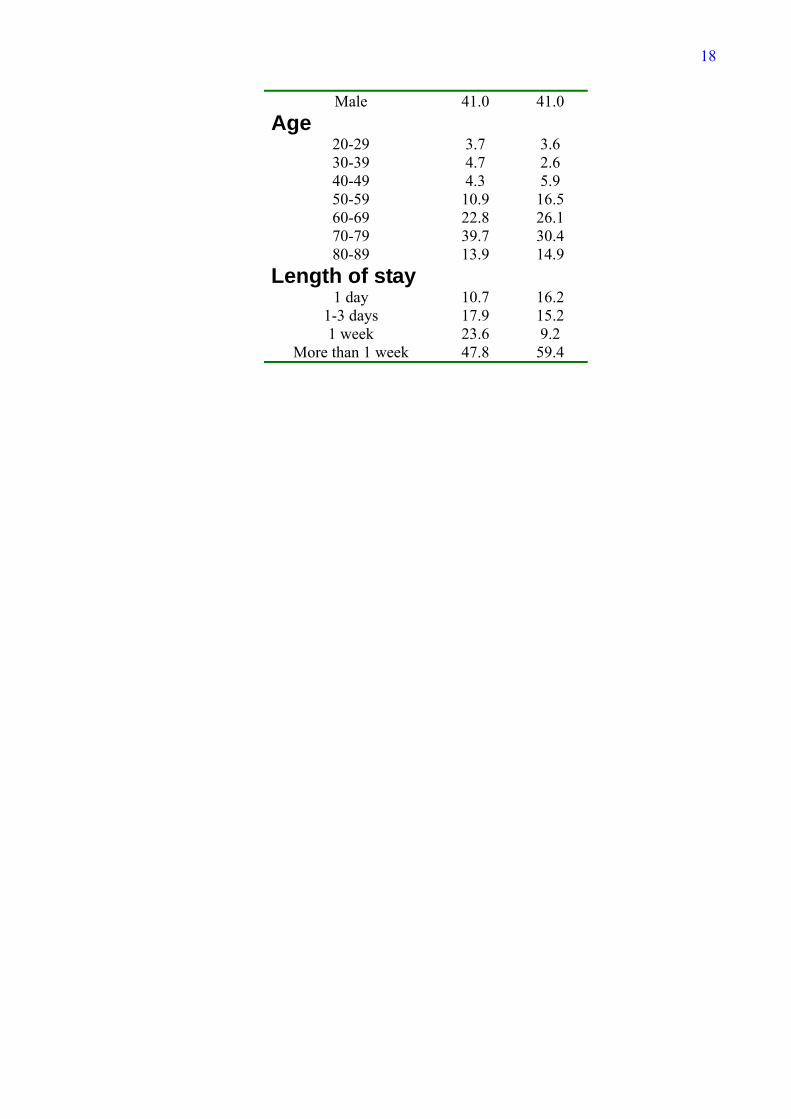
Table 1:
The demographic characteristics of patients (n=180)
Characteristic
Plate system
of delivery
Trolley system
of delivery
Sex % % Female 59.0 59.0
18
Male 41.0 41.0 Age
20-29 3.7 3.6 30-39 4.7 2.6 40-49 4.3 5.9 50-59 10.9 16.5 60-69 22.8 26.1 70-79 39.7 30.4 80-89 13.9 14.9
Length of stay 1 day 10.7 16.2
1-3 days 17.9 15.2 1 week 23.6 9.2
More than 1 week 47.8 59.4
19
Figure 1
20
Table 2 Comparison of core foods (hot) by food service system (n=180)
Broccoli Carrots Potato Poached
Fish
Minced Beef
Attributes U* p U* p U* p U* p U* p
Temperature 372 0.286 363 0.056 374 0.007 264 0.001 188 <0.0005
Flavour 109 <0.0005 205 <0.0005 416 0.072 213 0.001 355 0.302
Portion Size 121 <0.0005 480 1.00 445 0.015 420 0.734 344 0.154
Texture 292 0.023 250 0.001 291 0.001 234 0.002 228 0.002
Overall Opinion/
Satisfaction
219 0.001 356 0.065 356 0.011 211 0.001 325 0.131
*U is the Mann-Whitney statistic
21
Table 3 Summary of statistics of Binary Logistic Regression for food
service model
Variables B S.E. Wald df p Exp(B) Temp 5.59 4 0.23 Temp(1) -20.93 21983.5 0.00 1 1.00 0.00 Temp(2) -0.95 1.34 0.51 1 0.48 0.39 Temp(3) 0.25 1.26 0.40 1 0.84 1.28 Temp(4) 0.30 1.25 0.06 1 0.81 1.35 Flavour 0.01 0.14 0.01 1 0.96 1.00 Size 24.07 5 <0.0005 Size(1) -3.30 1.70 3.78 1 0.05 0.04 Size(2) -3.90 1.12 12.13 1 <0.0005 0.02 Size(3) -3.54 0.93 14.51 1 <0.0005 0.03 Size(4) -2.28 0.87 6.85 1 0.01 0.10 Size(5) -1.98 0.95 4.36 1 0.04 0.14 Texture 0.41 0.13 10.39 1 0.001 1.51 Constant 0.42 1.52 0.08 1 0.78 1.52
Where B=log-likelihood if term is removed from model (raw coefficient), S.E=standard error of B,
Wald=statistic answering question which parameters are not necessary in the model, i.e. the model is not
significantly degraded by deletion of this parameter, df=degrees of freedom, p≤0.05 significance to 95%,
Exp(B)=coefficient or the multiplier of a variable category that determines the probability that a case is
assigned to plate (0) or trolley (1) service style.
22
Table 4 Summary of statistics of Multinomial Logistic Regression for
plate food service model and satisfaction
OPINIONa B Std. Error Wald df Sig. Exp(B)
2.00 Intercept 39.860 7.175 30.865 1 .000 TEMP -2.879 1.008 8.157 1 .004 .056 FLAVOUR -4.362 .995 19.216 1 .000 .013 SIZE -1.511 1.210 1.559 1 .212 .221 TEXTURE -2.746 .829 10.965 1 .001 .0643.00 Intercept 35.371 6.258 31.947 1 .000 TEMP -2.313 .889 6.761 1 .009 .099 FLAVOUR -3.050 .707 18.600 1 .000 .047 SIZE -1.608 .919 3.061 1 .080 .200 TEXTURE -2.586 .656 15.564 1 .000 .0754.00 Intercept 24.061 4.218 32.542 1 .000 TEMP -1.876 .691 7.374 1 .007 .153 FLAVOUR -1.977 .428 21.310 1 .000 .139 SIZE -.343 .608 .319 1 .572 .709 TEXTURE -1.469 .365 16.194 1 .000 .2305.00 Intercept 18.592 3.956 22.087 1 .000 TEMP -1.915 .674 8.085 1 .004 .147 FLAVOUR -1.504 .392 14.715 1 .000 .222 SIZE .327 .590 .307 1 .579 1.387 TEXTURE -1.127 .339 11.069 1 .001 .3246.00 Intercept 13.735 3.481 15.565 1 .000 TEMP -1.839 .652 7.970 1 .005 .159 FLAVOUR -.656 .353 3.452 1 .063 .519 SIZE -.027 .463 .003 1 .954 .973 TEXTURE -.656 .303 4.695 1 .030 .519
a The reference category is: 7.00. Where opinion 7 = very good, 6 = good, 5 = slightly good, 4 = neutral, 3 = slightly bad, 2 = bad and 1= very bad Where B=log-likelihood if term is removed from model (raw coefficient), S.E=standard error of B,
Wald=statistic answering question which parameters are not necessary in the model, i.e. the model is not
significantly degraded by deletion of this parameter, df=degrees of freedom, p≤0.05 significance to 95%,
Exp(B)=coefficient or the multiplier of a variable category that determines the probability of that category
(above 1 increases the probability and less than 1 deceases the probability).
23
Table 5 Summary of statistics of Multinomial Logistic Regression for
trolley food service model and satisfaction
OPINIONa B Std. Error Wald df Sig. Exp(B)
2.00 Intercept 50.836 8.578 35.121 1 .000 TEMP -7.976 1.639 23.671 1 .000 .000 FLAVOUR -.545 1.041 .274 1 .601 .580 SIZE -2.591 1.435 3.260 1 .071 .075 TEXTURE -2.778 1.138 5.959 1 .015 .0623.00 Intercept 40.207 7.079 32.258 1 .000 TEMP -4.899 1.104 19.682 1 .000 .007 FLAVOUR -2.680 .774 11.986 1 .001 .069 SIZE -1.422 1.101 1.669 1 .196 .241 TEXTURE -.908 .698 1.689 1 .194 .4044.00 Intercept 33.312 6.627 25.270 1 .000 TEMP -3.613 .976 13.699 1 .000 .027 FLAVOUR -2.962 .676 19.175 1 .000 .052 SIZE -.419 1.067 .154 1 .694 .658 TEXTURE -.743 .546 1.852 1 .174 .4765.00 Intercept 15.592 5.423 8.266 1 .004 TEMP -.833 .836 .993 1 .319 .435 FLAVOUR -1.483 .409 13.184 1 .000 .227 SIZE -.256 .640 .159 1 .690 .774 TEXTURE -.539 .376 2.061 1 .151 .5836.00 Intercept 12.111 4.516 7.194 1 .007 TEMP -1.576 .700 5.068 1 .024 .207 FLAVOUR -.455 .358 1.620 1 .203 .634 SIZE .329 .544 .365 1 .546 1.389 TEXTURE -.722 .330 4.783 1 .029 .486
a The reference category is: 7.00. Where opinion 7 = very good, 6 = good, 5 = slightly good, 4 = neutral, 3 = slightly bad, 2 = bad and 1= very bad Where B=log-likelihood if term is removed from model (raw coefficient), S.E=standard error of B,
Wald=statistic answering question which parameters are not necessary in the model, i.e. the model is not
significantly degraded by deletion of this parameter, df=degrees of freedom, p≤0.05 significance to 95%,
Exp(B)=coefficient or the multiplier of a category that increases probability of that category (above 1
increases the probability and less than 1 deceases the probability).
24
Observed Groups and Predicted Probabilities 40 ô ô
ó ó ó ó
F ó t ó
R 30 ô t ô
E ó t tt tt ó
Q ó t ttt tt ó
U ó t ttt tt ó
E 20 ô t ttt tt ô
N ó t ttt tt t ó
C ó p ttt ttt t ó
Y ó t tt tp ttt ttt t ó
10 ô p pt tp tpt tpp ppt t ô
ó p p p pt pp ppp tpp ppt tp ó
ó p p pp pt pppt pp ppp ppp ppt tp t ó
óp p ptpppppp pppp pppt ppppptpppp ppp pp t t ó
Predicted òòòòòòòòòòòòòòôòòòòòòòòòòòòòòôòòòòòòòòòòòòòòôòòòòòòòòòòòòòòò Prob: 0 .25 .5 .75 1 Group: pppppppppppppppppppppppppppppptttttttttttttttttttttttttttttt Predicted Probability is of Membership for trolley The Cut Value is .50 Symbols: p - plate t - trolley Each Symbol Represents 2.5 Cases. Figure 1 A diagrammatic representation of food service system by Binary
Logistic Regression Analysis
25
Factors influencing Patient Satisfaction Factors influencing Patient Satisfaction
Trolley System of Delivery
Temperaturep = 0.02
Flavour p = 0.20
Portion Size p = 0.55
Plate System of Delivery
Texture p = 0.03
Portion Size p = 0.95
Flavour p = 0.06
Temperature p = 0.005
Texture p = 0.03
Influential Attributes Texture p=0.001 Flavour for vegetables p≤0.05 and fish dish p=0.001
Factors relating to Service System
Influential Attributes Portion size p=0.01
Patient Satisfaction
(Significance of terms within the model are shown and influential terms are shadowed)
Figure 2 An indicative model of patient satisfaction with two food service systems