Embed Size (px)
Citation preview
FOOD SAFETY AND LEAN SIX SIGMA MODEL
by
Ying Zhen
An Abstract
of a thesis submitted in partial fulfillment
of the requirements for the degree of
Master of Science
in the Department of Safety Science
University of Central Missouri
October, 2011
ABSTRACT
by
Ying Zhen
Food safety is a scientific discipline describing handling, preparation, and storage of
food in ways that prevent foodborne illness. This research introduces the application
of industrial hygiene (IH) aspects in food safety system and Lean Six Sigma tools in
frozen salmon processing. The utilization of Failure Mode Effect Analysis (FMEA)
process and the implementation of a Hazard Analysis Critical Control Point (HACCP)
plan led to the minimization of physical, chemical and biological hazard
contamination probability. Process cycle efficiency (PCE) was improved from 5.02%
to 17.46% due to the implementation of Lean practices. The data demonstrates that
Lean Six Sigma tools will contribute to the implementation of the food safety system
to minimize risk, improve productivity and quality of products, and reduce
unnecessary waste and time.
FOOD SAFETY AND LEAN SIX SIGMA MODEL
by
Ying Zhen
Thesis
of a thesis submitted in partial fulfillment
of the requirements for the degree of
Master of Science
in the Department of Safety Science
University of Central Missouri
October, 2011

© 2011
Ying Zhen
ALL RIGHTS RESERVED
A MODEL FOR FOOD SAFETY AND LEAN PRACTICES
by
Ying Zhen
October, 2011
APPROVED:
______________________________
Thesis Chair
______________________________
Thesis Committee Member
______________________________
Thesis Committee Member
ACCEPTED:
______________________________
Chair, School of Environmental, Physical & Applied Sciences
______________________________
Dean, Graduate Studies
UNIVERSITY OF CENTRAL MISSOURI
WARRENSBURG, MISSOURI

A MODEL FOR FOOD SAFETY AND LEAN PRACTICES
by
Ying Zhen
October, 2011
APPROVED:
~(~
Thesis Committee Member
Thesis Committee Member
Chair, School of Environmental, Physical & Applied Sciences
UNIVERSITY OF CENTRAL MISSOURI
WARRENSBURG, MISSOURI
A MODEL FOR FOOD SAFETY AND LEAN PRACTICES
by
Ying Zhen
October, 2011
APPROVED:
~(~
Thesis Committee Member
Thesis Committee Member
Chair, School of Environmental, Physical & Applied Sciences
UNIVERSITY OF CENTRAL MISSOURI
WARRENSBURG, MISSOURI
ACKNOWLEDGMENTS
This research was developed based on knowledge obtained from the Food Safety class. I
would like to thank the chairman of my thesis committee, Dr. Popov, who not only taught my
Food Safety class but also lead me into a world of Lean and Six Sigma. I also want to thank
other thesis committee members: Dr. Samuel Allen Iske and Dr. Leigh Ann Blunt for their
helpful guidance and critiques.
I acknowledge that the Safety Science Department gave me a new start to my life. I
found myself in the past two years; I learned to be strong and independent. Thanks for the
people I respect and I love, no matter where I am you are my tutors and friends forever.
vii
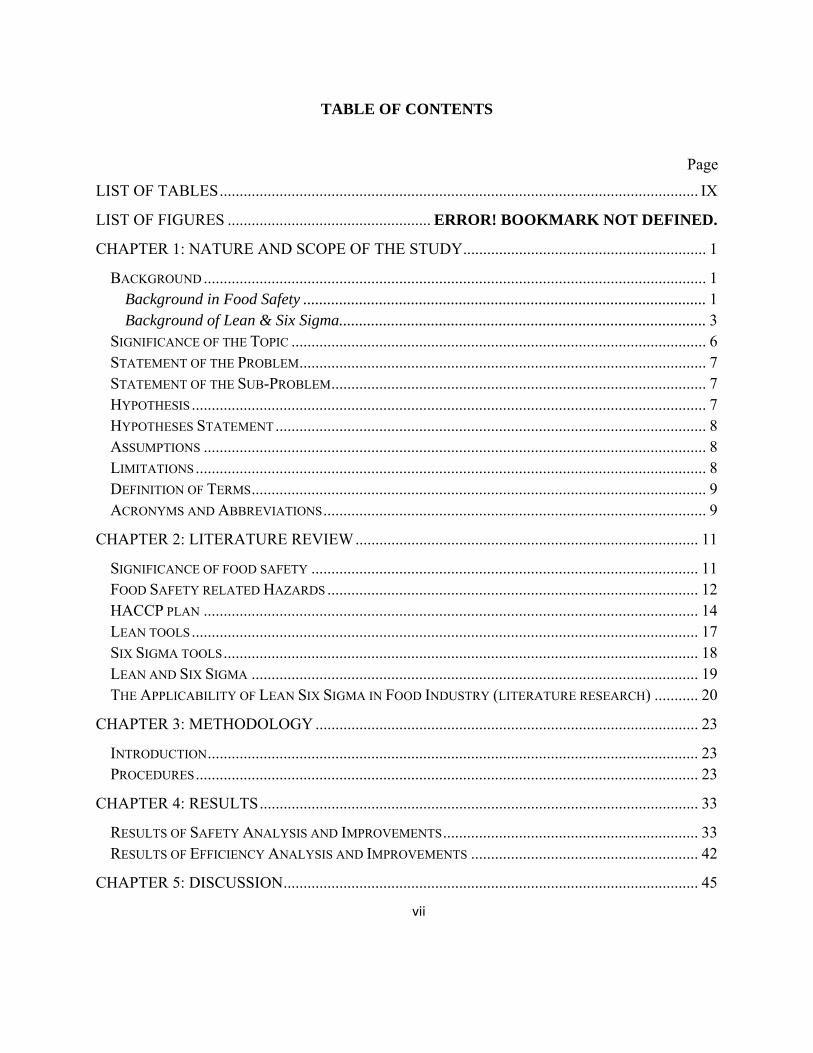
TABLE OF CONTENTS
Page
LIST OF TABLES ........................................................................................................................ IX
LIST OF FIGURES ................................................... ERROR! BOOKMARK NOT DEFINED.
CHAPTER 1: NATURE AND SCOPE OF THE STUDY ............................................................. 1
BACKGROUND .............................................................................................................................. 1 Background in Food Safety ..................................................................................................... 1 Background of Lean & Six Sigma............................................................................................ 3
SIGNIFICANCE OF THE TOPIC ........................................................................................................ 6 STATEMENT OF THE PROBLEM ...................................................................................................... 7 STATEMENT OF THE SUB-PROBLEM .............................................................................................. 7 HYPOTHESIS ................................................................................................................................. 7 HYPOTHESES STATEMENT ............................................................................................................ 8 ASSUMPTIONS .............................................................................................................................. 8 LIMITATIONS ................................................................................................................................ 8 DEFINITION OF TERMS .................................................................................................................. 9 ACRONYMS AND ABBREVIATIONS ................................................................................................ 9
CHAPTER 2: LITERATURE REVIEW ...................................................................................... 11
SIGNIFICANCE OF FOOD SAFETY ................................................................................................. 11 FOOD SAFETY RELATED HAZARDS ............................................................................................. 12 HACCP PLAN ............................................................................................................................ 14 LEAN TOOLS ............................................................................................................................... 17 SIX SIGMA TOOLS ....................................................................................................................... 18 LEAN AND SIX SIGMA ................................................................................................................ 19 THE APPLICABILITY OF LEAN SIX SIGMA IN FOOD INDUSTRY (LITERATURE RESEARCH) ........... 20
CHAPTER 3: METHODOLOGY ................................................................................................ 23
INTRODUCTION ........................................................................................................................... 23 PROCEDURES .............................................................................................................................. 23
CHAPTER 4: RESULTS .............................................................................................................. 33
RESULTS OF SAFETY ANALYSIS AND IMPROVEMENTS ................................................................ 33 RESULTS OF EFFICIENCY ANALYSIS AND IMPROVEMENTS ......................................................... 42
CHAPTER 5: DISCUSSION ........................................................................................................ 45
viii
SAFETY ANALYSIS DATA ........................................................................................................... 45 EFFICIENCY ANALYSIS DATA ..................................................................................................... 46
REFERENCES ............................................................................................................................. 49
ix
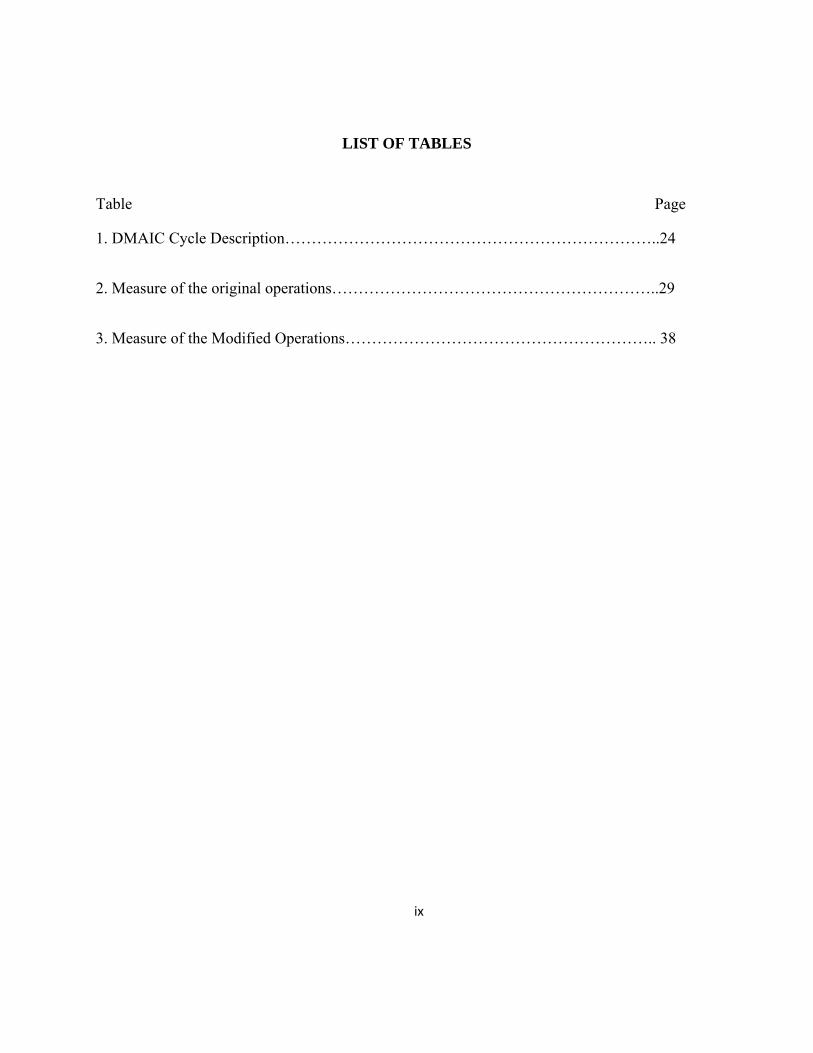
LIST OF TABLES
Table Page
1. DMAIC Cycle Description……………………………………………………………..24
2. Measure of the original operations……………………………………………………..29
3. Measure of the Modified Operations………………………………………………….. 38
x
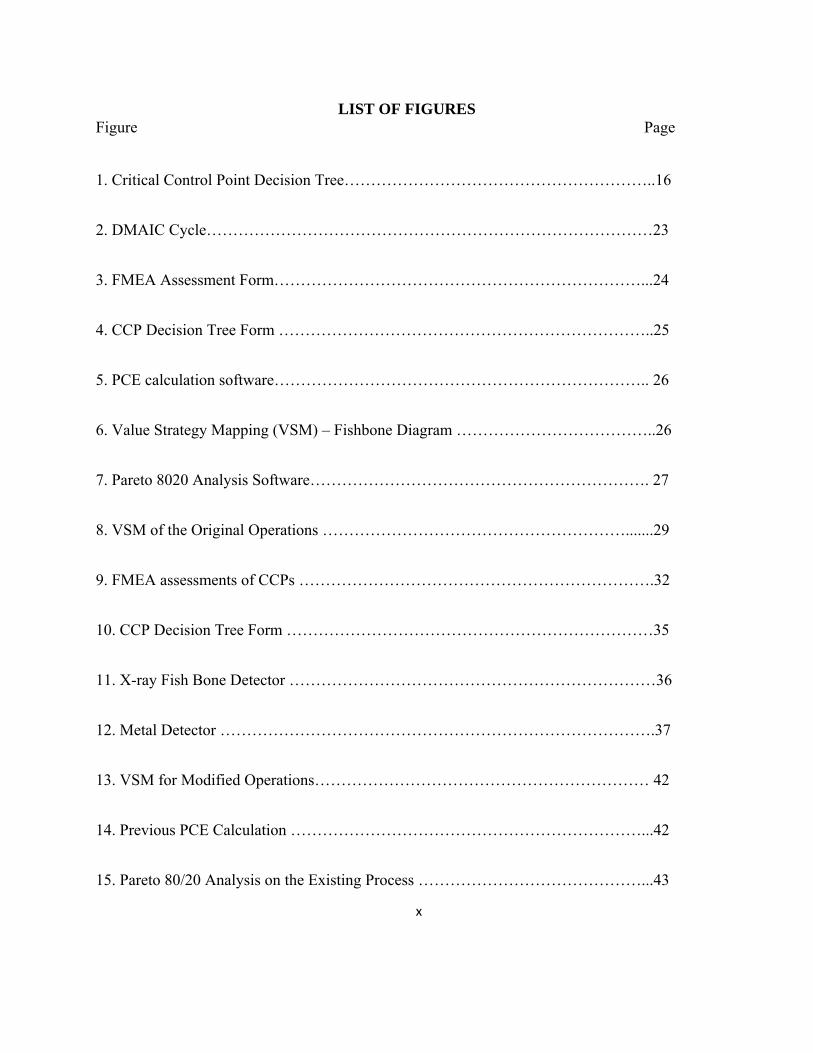
LIST OF FIGURES Figure Page
1. Critical Control Point Decision Tree…………………………………………………..16
2. DMAIC Cycle…………………………………………………………………………23
3. FMEA Assessment Form……………………………………………………………...24
4. CCP Decision Tree Form ……………………………………………………………..25
5. PCE calculation software…………………………………………………………….. 26
6. Value Strategy Mapping (VSM) – Fishbone Diagram ………………………………..26
7. Pareto 8020 Analysis Software………………………………………………………. 27
8. VSM of the Original Operations ………………………………………………….......29
9. FMEA assessments of CCPs ………………………………………………………….32
10. CCP Decision Tree Form ……………………………………………………………35
11. X-ray Fish Bone Detector ……………………………………………………………36
12. Metal Detector ……………………………………………………………………….37
13. VSM for Modified Operations……………………………………………………… 42
14. Previous PCE Calculation …………………………………………………………...42
15. Pareto 80/20 Analysis on the Existing Process ……………………………………...43
xi
16. Post PCE Calculation ………………………………………………………………..44
17. Pareto 80/20 Analysis on the Improved Process …………………………………….47
Food Safety and Lean Six Sigma Model 1
CHAPTER 1 NATURE AND SCOPE
OF THE STUDY
Background
Background in Food Safety
Thousands of years ago, ancient people already noticed that soured or contaminated
food made people sick. Throughout history, various methods were implemented to preserve
food and to reduce the threat of foodborne illnesses. The use of refrigeration and pasteurization
technology is led to the development of food preservation practices. In the modern world, the
food industry was successfully developed from raw material production, procurement and
handling, to manufacturing, distribution, and consumption of food products. Almost every
person relies on the national and international food supply system nationally or internationally
(Roberts, A. C., 2001). However, these developments increased the risk of foodborne illnesses.
A simple mistake in one step of food manufacturing may cause a large group of people to get
sick in different locations at the same time, which makes food safety one of the hottest topics in
the 21 Century. Hazardous Analysis Critical Control Points (HACCP) is a management system
extensively used in advanced food companies to analyze and control biological, chemical and
physical hazards through the whole food production process to achieve food safety (U.S.FDA,
2011).
Food Safety and Lean Six Sigma Model 2
HACCP was developed by Pillsbury Corporation with NASA in 1960’s to ensure the
safety of foods for space flights. In the 1970s, HACCP was widely applied in the industry. In
1994, the organization of the international HACCP Alliance was established for the US meat and
poultry industries. The National Advisory Committee on Microbiological Criteria for Foods
(NACMCF) provided information for international standards on the development and
implementation of HACCP principles. The General Accounting Office (GAO) endorsed
HACCP as a scientific, risk-based system to protect public health. In 1996, the Food Safety and
Inspection Service (FSIS) of the US published a final rule of HACCP. In 2005, ISO issued ISO
22000 “Food Safety Management System- Requirements for Organizations in Food Chain”,
which is a complete food safety and quality management system that included all HACCP
principles and incorporated the prerequisite programs, such as, Good Manufacturing Practice
(GMP), and Sanitation Standard Operation Procedures (SSOP) (Standard Kalite, n.d.).
HACCP has Seven Principles (National Advisory Committee on Microbiological Criteria
for Foods, 1997):
1) Conduct a hazard analysis
2) Identify critical control points
3) Establish critical limits for each critical control point
4) Establish critical control point monitoring requirements
Food Safety and Lean Six Sigma Model 3
5) Establish corrective actions
6) Establish record keeping procedures
7) Establish procedures for ensuring the HACCP system is working as intended.
Background of Lean & Six Sigma
1. Introduction of Lean
Lean Manufacturing or Lean Production has become a popular topic in the industry in
recent years. According to American Production and Inventory Control Society (APICS)
dictionary, Lean is defined as a philosophy concept to identify and eliminate non-value-adding
activities in the organization. The main principle of Lean Production is reducing all the non-
value-adding activities and wastes in the whole supply chain to accomplish high quality,
reliability products at an appropriate cost, and to gain the highest profit and reputation at the
same time (Lixia, C. & Bo, M., 2010). Nowadays, the definition of Lean from some companies
has been adopted as the best theory for company, community and environment: “Develop the
highest quality products, at the lowest cost, with the shortest lead time by systematically and
continuously eliminating waste, while respecting people and the environment” (EPA, 2009, p10).
Lean implementation in the United States began in the 1980s, and was limited to the automotive
and aerospace sectors. However, 30 years later, numerous companies within the manufacturing
industry implement Lean Productions. In addition, Lean Production started being used in the
service industry and also by government agencies. Seventy percent of all the U.S. plants were
Food Safety and Lean Six Sigma Model 4
reported as adopting Lean manufacturing within the 2007 Industrial Week/Manufacturing
Process Improvement Census of Manufactures (U.S. EPA, 2009, p12).
2. History of Lean
This philosophy of Lean can be traced back to the 1450s with examples of rigorous process
thinking in Arsenal, Venice, but the official foundation of Lean was implemented by Henry Ford
in the early 20th Century. He established ever the first assembly line in 1913, which achieved the
production of a vehicle within four minutes. Ford Motor Company enjoyed great production
success in the market at that time through low prices, but finally the company failed by not
offering diversified product. After World War II, Kiichiro Toyoda, Taiichi Ohno, and others
from the Toyota Company learned success of Ford Motor Company, and they made a series of
innovations on the continuity of process flow with a wide variety and created the Toyota
Production System (TPS). TPS focuses on individual machines and their utilization to the
production flow of the whole process in order to achieve low cost, high quality, high variety,
significant improvement in the process, and to meet customers’ desires at the same time. As a
successful example of Lean enterprise, Toyota has become the largest automaker in the world,
and it is famously known as the leading Lean exemplar. In 1990, James P. Womack, Daniel
Roos, and Danel T. Jones described Lean process in the book The Machine that Changed the
World, and they further introduced Lean Thinking in 1996 with Five Lean Principles (Lean
Enterprise Institute, 2009):
Food Safety and Lean Six Sigma Model 5
1) Specify the value of customer requirement
2) Identify the value stream for productions and reduce the waste steps
3) Make sure the remaining valued-added steps can work continuously
4) Introduce pull between steps that are possible for continuous flow
5) Conduct perfect management and eliminate the number of steps, the time and
information.
3. Introduction of Six Sigma
Six Sigma is a set of statistically-based quality control methodologies that are used to
identify and reduce variations and defects in the process, and finally reach a goal as near-
perfection (Six Sigma, 2011). Sigma is a Greek letter that stands for the standard deviation from
a statistical population. The higher the sigma level, the less the defects exist. The processes of
most companies are around sigma level three or four, which means the defects in the process are
between 6,210 to 66,807 out of one million opportunities; while, Six Sigma represents 3.4
defects per million opportunities, which is almost the perfect process (George, L. M., 2002, p16).
4. History of Six Sigma
The thought of Six Sigma can be traced back to the eighteenth century in Europe. The
application of Six Sigma started in the1920s to optimize the manufacturing process and to
eliminate defect. However, the real Six Sigma era did not emerge until the late 1980s. The Six
Sigma philosophy was formulated by Bill Smith at Motorola in 1986 and it contributes
Food Safety and Lean Six Sigma Model 6
significantly to the financial and reputational benefits to Motorola. Over $20 billion dollars was
saved by the organization since 1986, and the Return on Investment (ROI) has been between
10:1 to 50:1 (Motorola University, 2008). The success story of Motorola inspired many
companies in various industrial sectors to adopt Six Sigma. Jack Welch, the CEO of General
Electric (GE), further expanded the application of Six Sigma by adopting the techniques in GE in
1995. During the first five years of the implementation, GE roughly gained a benefit of $10
billion (Six Sigma, 2011).
Significance of the Topic
Food is the basic life demand for everyone in the world. Food safety relates closely to
public health and safety. As Donna Shalala, the secretary of U.S. Department of Health &
Human Services said, “Every American, their children, their cats, their dogs, everything we care
about is related to food safety. It’s one of the top issues.” According to CDC’s rough estimation,
one out of six Americans (or 48 million people) gets sick from food poisoning each year;
128,000 of them are hospitalized, and 3,000 die from foodborne diseases (U.S. CDC, 2011).
Imagine how serious food safety situations in other countries must be, since the U.S. already has
the best food safety environment in the whole world. Foodborne illness should be prevented
efficiently in a timely manner in order to protect the public.
Although food safety is a significant issue to individuals, communities and societies, the
food industry, as one of the biggest industries in the world, is also challenged by food safety.
Food Safety and Lean Six Sigma Model 7
The quality of products and the speed of production directly influence the competitiveness of a
food company in the whole market. Therefore, effective methods can achieve the food safety,
high productivity, and high profits are expected in the food industry.
Statement of the Problem
The primary goal in this thesis is to explore the opportunities for incorporating Lean Six
Sigma manufacturing practices with food safety management in the food industry. Reduction of
waste, improved efficiency and enhanced quality are the primary goals as they are applied in
other industries.
Statement of the Sub-Problem
Sub-Problem Statement 1: Is the Lean Six Sigma system applicable in the food manufacturing
environment?
Sub-Problem Statement 2: What Lean and Six Sigma manufacturing tools can be applied in the
food industry?
Sub-Problem Statement 3: How efficient a Lean Six Sigma model can be in food manufacturing?
Hypothesis
H 1 1: Lean Six Sigma tools are applicable in the food industry.
Food Safety and Lean Six Sigma Model 8
H 1 2: Lean Six Sigma can be integrated with HACCP to improve food safety and minimize the
risk of foodborne illnesses.
H 1 3: Lean Six Sigma can facilitate food companies to be competitive in the market by
improving productivity and quality of products and by reducing unnecessary waste and lead time.
Hypotheses Statement
In the United States, efficient Lean Six Sigma practices are available and applicable in
the food industry to improve productivity and quality, reduce waste, lead time, and minimize the
risk of foodborne illnesses. In this thesis, salmon processing will be used as an example in the
food industry.
Assumptions
Assumption1: The application of the Lean Six Sigma practices will have the complete support
from the management committee and will be followed strictly by everyone in the process.
Assumption 2: Lean and Six Sigma tools will be readily available for evaluation and application
in the selected process.
Limitations
Limitation 1: The analysis of the process is only related to the salmon manufacturing processes.
Differences may exist in different food industries.
Food Safety and Lean Six Sigma Model 9
Limitation 2: All the data being used in this thesis is based on professional evaluation and
judgment of the processing. They are not specifically from one company.
Definition of Terms
Lean manufacturing: Lean manufacturing is a business model and collection of methods that
help eliminate waste while delivering quality products on time and at reduced cost.
Acceptable level: Acceptable level is the level of the hazard which seems not likely to cause an
unacceptable health risk (U.S. FDA, 1999).
Critical Control Point: According to the Food Code, the Critical Control Point is a point which
loss of control will lead to an unacceptable health risk (U.S. FDA, 1999).
Process Cycle Efficiency (PCE): It is a systematic assessment of the worth and merit of some
objects and provides useful feedback. PCE is calculated as the value-added time divided by the
total lead time (George, L. M., 2002, p36)
Lead time: It is the latency between the initiation and execution of a process.
Pareto Principle: 80% of the delay is caused by less than 20% of the work stations
(George, L. M., 2002, p51)
Acronyms and Abbreviations
U.S. CDC: Centers for Disease Control and Prevention.
Food Safety and Lean Six Sigma Model 10
U.S. FDA: U.S. Food and Drug Administation
HACCP: Hazard Analysis and Critical Control Points.
CCP: Critical Control Points.
GMP: Good Manufacturing Practices
SSOP: Sanitation Standard Operation Procedures.
NASA: National Aeronautics and Space Administration
FMEA: Failure Mode Effect Analysis
RPN: Risk Priority Number
SEV: Severity Rating
DET: Detection Effectiveness
PCE: Process Cycle Efficiency
DMAIC: Define, Measure, Analyze, Improve and Control
WHO: World Health Organization
ISO: International Organization for Standardization.
Food Safety and Lean Six Sigma Model 11
CHAPTER 2 LITERATURE REVIEW
Significance of Food Safety
World Health Organization (WHO) claims that “food safety is an increasing important
public health issue”. Foodborne diseases are widespread, which not only threatens public health,
but also significantly reduces the economic productivity.
According to WHO’s estimation, foodborne and water borne diarrheal diseases kill
approximately 2.2 million people annually (World Health Organization, 2011). About 13
million children under the age of five die each year from infections and malnutrition, most often
attributed to contaminated food”(World Health Organization, 2007). According to CDC’s
research and analysis based on the information from multiple surveillance systems and other
sources, foodborne diseases cause approximately 76 million illnesses, 325,000 hospitalizations,
and 5,000 deaths in the United States every year (Mead, P. V., 2000).
The costs of the food contamination are a social and economic burden to the community.
“In the United States, the estimated annual medical costs/productivity losses due to the seven
major foodborne pathogens range from $6.6 billion to $37.1 billion”, according to USDA and
CDC figure (Daniell, B., 2000). Five hundred million dollars was lost in fish and fishery
product in Peru in 1991 due to cholera (World Health Organization, 2007).
Food Safety and Lean Six Sigma Model 12
More than 200 known diseases are transmitted through food. For example, E. coil, which
is one of the most common foodborne pathogens, will normally cause problems. A food
poisoning outbreak in August 12, 2011, at a daycare facility resulted in that an infant and a
toddler had tested positive for E. coli (Haglund, N., 2011). News like this happens all the time in
different locations. E. coli related disease causes diarrhea and stomach cramping, sometimes
even kidney failure or death especially for young children and elderly. By August 13th 2011,
310,248 pounds of ground beef products had been recalled due to E. coli contamination (Drew,
F., 2011). It is a direct threat to public health and a survival challenge to the food processing
companies.
Food Safety Related Hazards
Food industry is different from other industries. It needs an excellent understanding of the
characteristics of products being handled to efficiently prevent the development of potential
hazards and to control the ones that exist.
Three categories of hazards are related to food safety:
Biological hazards
Chemical hazards
Physical hazards
Biological food hazards include bacterial pathogens, viruses, and parasites. Typical
hazardous microorganisms frequently cause foodborne illnesses including Listeria
Food Safety and Lean Six Sigma Model 13
monocytogenes, Escherichia coli O157:H7, Salmonella typhi, and so on. Listeria monocytogene
is one of the most virulent foodborne pathogens. It causes the highest fatality rate among
foodborne bacterial pathogens. Listeria monocytogenes frequently result in septicemia,
meningitis, encephalitis, and many other illnesses. The main sources of Listeria monocytogens
are raw milk, ice cream, raw meat, and sea food. It can survive at temperatures as low as 0°C.
The infection of E. Coli O157:H7 leads to hemorrhagic diarrhea, abdominal cramps, and even
kidney failure, especially in young children and elderly. It is transmitted via the fecal-oral route,
and the main source of infection is undercooked food, such as ground beef, unpasteurized milk,
vegetables, and water. Salmonella typhi normally causes diarrhea, and the infection can be very
serious to small children and the elderly. The main food sources are meats, poultry, eggs, and
milk. Hepatitis A and Norwalk viruses are representations of enteric viruses associated with
food. Undercooked meat or contaminated ready-to-eat foods may be infected by parasites
(Roberts, A. C., 2001).
Chemical food hazards are the chemical substances or compounds that exist in food, which
will cause health problems to a sensitive population or even the general public by consumption.
Different from biological hazards that always have a quick response, chemical hazards can either
cause acute foodborne illnesses by a high dose, or result in chronic illness at a lower level.
Hazardous chemicals in food may be the product’s ingredients, intentionally added or
unintentionally added to food. Naturally occurring chemicals include shellfish toxins,
mycotoxins, scombrotoxin (histamine), ciguatoxin, toxic mushroom species, and many other
Food Safety and Lean Six Sigma Model 14
chemical substances or mycotoxins. Paralytic Shellfish Poison (PSP) and Diarrhetic Shellfish
Poison (DSP) are two types of shellfish toxins. PSP toxins are neurotoxic alkaloids that can
block the entrance of sodium ions into nerve cells, and people may die because the muscles of
respiration lose control. DSP causes slight sickness in the gastrointestinal tract (GI) system.
Mycotoxin is the metabolic product of fungus. The common kinds of mycotoxins include
aflatoxins, trichothecene mycotoxin, ochratoxins, saxitoxins, and grayanotoxins. They exist in
different kinds of foods and have various symptoms, but they all threaten human and animals’
safety and health. Further, there are added chemicals in the process. Agricultural chemicals,
such as pesticides, fungicides, fertilizers, and growth hormones are added to facilitate the growth
of raw material. Food additives are added as preservatives, flavor enhancers, nutritional
additives, or color enhancements. The application of additives should follow the allowable
limits under GMPs. Chemicals added into food products unintentionally are also a threat to
customers, such as cleaners and sanitizers (U.S. FDA, 1999, p366).
Physical food hazards mean the objects in food that may cause injuries or illnesses. The
main materials considered as physical hazards include glass fragments, wood, stone, metal
fragments, insulation, bone, plastic, and many others. Physical food hazards are usually not as
harmful as others. However, they can lead to life threatening events for young children and
elderly.
HACCP Plan
Food Safety and Lean Six Sigma Model 15
The application of the HACCP plan in food manufacturing is recommended by FDA
because it is considered the most effective and efficient management system to prevent and
control food hazards, and to produce safe products. HACCP provides a scientific safety
assurance theory that prevents the safety hazards before they occur instead of evaluating the
products by end-testing (U.S.FDA, 1997, p363).
In a HACCP plan, Critical Control Point (CCP) identification is the foundation of the
whole plan. CCP is a point or a step in the food processing where controls can be taken to
prevent, eliminate, or reduce the occurrence or the severity of food hazards. The identification
process is based on the knowledge of the production process, characteristics of the food products,
and the potential food hazards. A CCP decision tree was developed to incorporate with step
directions and facilitate the identification process (see Figure 1). For each procedure, food
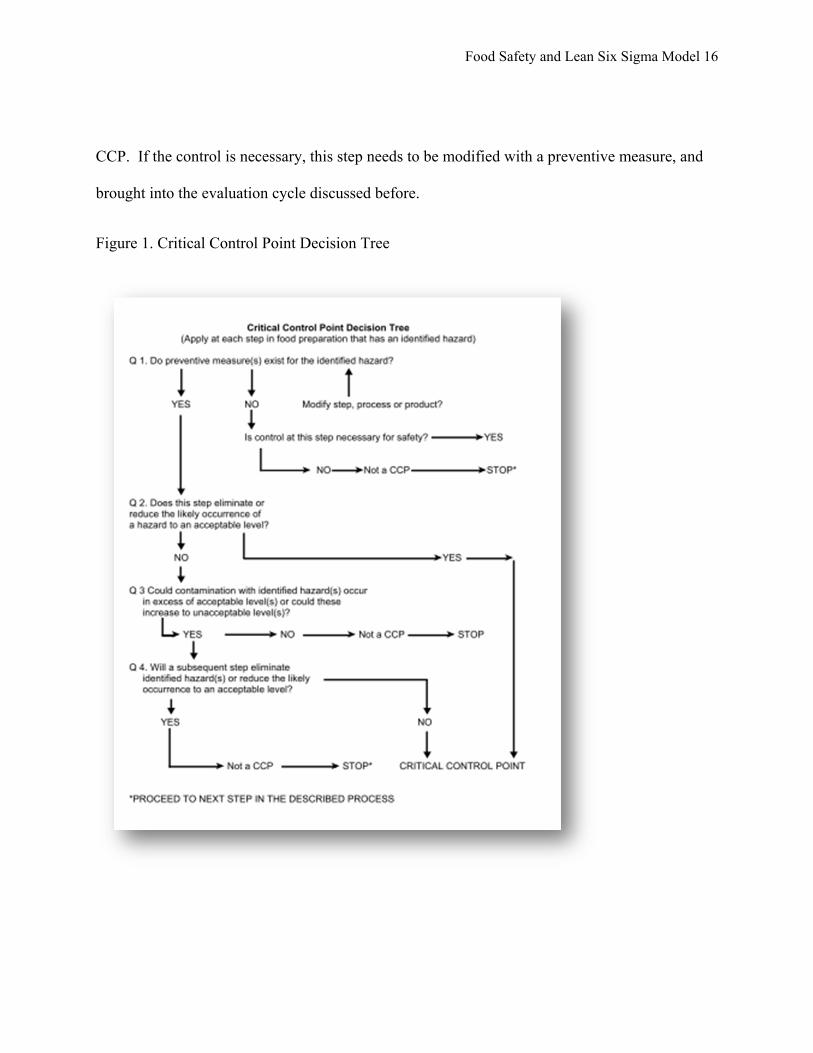
hazards are evaluated. The first thing that needs to be considered is Question 1, which is, if there
are any control measures for the identified hazard. If yes, the efficiency of the measurement
should be evaluated by Question 2. Is the occurrence of the hazard eliminated or reduced to an
acceptable level? If the answer is positive, then it is a CCP. If the answer is negative, then the
severity of the hazards will be evaluated. If no health threat exists from this food hazards, it is
not a CCP and the process stops. If the contamination is serious enough to risk human's health,
then consider the subsequent step. If there is no efficient subsequent step, it is a CCP; otherwise,
it is not. For this process, if the Question 1 preventive measure does not exist for the identified
hazard, then the necessity of the control will be questioned. If there is no necessity, it is not a
Food Safety and Lean Six Sigma Model 16
CCP. If the control is necessary, this step needs to be modified with a preventive measure, and
brought into the evaluation cycle discussed before.
Figure 1. Critical Control Point Decision Tree
Food Safety and Lean Six Sigma Model 17
Lean Tools
Lean concepts include a set of tools, such as the 5S program which use post-5S: sort, set in
order, shine, standardize, and sustain instead of pre-5S: scrounge, steal, stash, scramble, and
search. This change will improve the work safety and efficiency (Lean Manufactory Solution
Inc, 2008). Lately, safety was added to the 5S process as the sixth S. Therefore, the 6S model
was introduced. 6S uses the five pillars of 5S and an added pillar for Safety. According to EPA,
(EPA, 2011) 6S model is a method used to create and maintain a clean, orderly, and safe work
environment. 6S is based upon the five pillars (5S) of the visual workplace in the Toyota
Production System and often used as a foundation to implement the Lean program. The
combination of the Lean program and safety as the sixth S has significant benefits. Not only
does it help companies to increase productivity, reduce defects and costs, but also it minimizes
the health risk of employees and the environmental threat. Inserting safety into the application of
efficient management tools, such as Lean and Six Sigma, is the trend of business developing-
improving quality, and reducing waste time in a safe and environmentally healthy way.
Value stream mapping (VSM) is the foundational tool in the Lean toolset, which
demonstrates a process with the information and material flows from customer to supplier in a
visual manner. VSM is normally used to identify major sources of non-value added time in the
process and help to envision an improved future status by developing applicable Lean practices.
(George L. M., 2002, p51)
Food Safety and Lean Six Sigma Model 18
Process cycle efficiency (PCE) is another popular Lean tool to evaluate the efficiency of a
process. It is a systematic assessment of the worth and merit of some objects and provides useful
feedback. PCE is calculated as the value-added time divided by the total lead time (George L.
M., 2002, p36).
Six Sigma Tools
Define Measure Analysis Improve and Control (DMAIC) is a typical Six Sigma tool that
dividies the problem into five phases naturally to solve the problem: define phase, measure
phase, analyze phase, improve phase and control phase. This process facilitates the identification
of process waste and variations, and guides the selection of proper statistical tools (U.S. EPA,
2009, p26).
Define phase aims to demonstrate the goal of a project by the assessment of the given
process, and identifies the issues that exist and can be improved for a higher sigma level.
Measure phase is a data collection process for all the information of the target process.
Analyze phase is the time the professional team examines data and the process to identify the
time traps, and to confirm the results with proper statistical tools.
Improve phase implements all the tools and solutions designed to reduce or eliminate the
defects and variations for a higher quality and faster process.
Control phase is the last phase to keep the achieved improvement and quality or speed level.
Several control tools can be used in this phase, such as mistake proofing “Poka-Yoke”. This
Food Safety and Lean Six Sigma Model 19
final performance should be monitored periodically to guarantee the profits (George L. M.,
2002, p25).
Failure Mode Efficiency Analysis (FMEA) is a methodology to analyze the potential
failure modes that may occur in a product or process, and the risk assessment, such as the
severity, the occurrence and the detected level of each failure mode. Then, to prioritize all the
failure modes based on their urgency, and provide with prevention actions, especially to the most
urgent failure to eliminate the harm. (Crow, K., 2002)
Pareto 80/20 analysis is a software built based on the Pareto Principle that the majority of
the problem usually comes from the “vital few” causes (George L. M., 2002, p51).
Lean and Six Sigma
Michael George published a book called Lean Six Sigma: combining Six Sigma "quality"
with Lean "speed", where he pointed out that Lean and Six Sigma should be integrated to
“maximize shareholder value by achieving the fastest rate of improvement in customer
satisfaction, cost, quality, process speed and invested capital”. His evidences for that point are:
Lean alone cannot achieve statistical control to improve quality, while, Six Sigma alone cannot
improve process speed dramatically. Therefore, the combination of Lean Six Sigma is the union
of quality and speed, which represents a successful business model.
Food Safety and Lean Six Sigma Model 20
The system safety tools, such as FMEA, work very well to assist hazard analysis in food
processing. FMEA form provides a detailed analysis of each operation based on the occurrence,
the severity, and the detection of hazards, which is the similar theory to the hazard analysis of
CCP. Therefore, this evaluation can be used to facilitate the identification of the CCP. The
evaluation system leads to a RPN (risk priority number) to prioritize the risk of hazard by the
complete information in the form. The analysis of the recommended actions includes an
evaluation of the effectiveness of each action. This can also be a guideline of the critical control
actions. Compare the RPNs of different operations, the priority of the operations that need to be
controlled will be listed from the highest number to the lowest. The organization can distribute
their budget wisely with the RPNs. Considering the significance FMEA can bring to the hazard
analysis, it is an effective tool to be used in food processing.
The Applicability of Lean Six Sigma in the Food Industry
Successful stories of Lean Six Sigma implementation are common in general industry.
Unfortunately, the implementation of Lean Six Sigma in the food industry is still limited.
However, in the Lean Six Sigma case studies, they showed the possibilities of continuous
quality improvement in the food industry (Kovach, T. & Cho, R., 2011). Theoretical research
has been done on applying Six Sigma in food industry as well as applying Lean in food industry
and the benefit of these principles.
Different from general industry, the food and beverage industry faces its own challenges.
Fierce competition, high variable material costs, regulatory requirements, and quality
Food Safety and Lean Six Sigma Model 21
management are just a few examples (Cutler, R. T., 2007). Compared to the automotive
industry, trust and contract complexity between buyer-supplier is significantly different (Moore,
M., 2007). The president of Escape Velocity Systems, Evan Garber said, “formulas are a
proprietary competitive edge and critical to quality and safety control” (Cutler, R.T., 2007).
Achieving quality control and continuous improvement by Lean Six Sigma is more critical in
the food industry.
Six Sigma education institute – Aveta Business published article “Practical Applications in
Fast Food”, which theoretically elaborated that the idea of Lean Six Sigma is to eliminate wastes
and improve process efficiency is a perfect match with fast food industry (Six Sigma Online,
2009). Thomas R. Cutler, the president & CEO of Florida-based TR Cutler, Inc. wrote an article
about “Food manufacturing and Six Sigma”, which pointed out that developing a Six Sigma
program will benefit a food company substantially and lead to the success in the food and
beverage industry. Thomas introduced DMAIC and Quality Function Deployment (QFD) as
recommendations for this industry (Cutler, R.T., 2007). An article from Business Process
Improvement and Innovation introduced applying Lean in the food industry. It explains that the
critical points of Lean are Just in Time (JIT) delivery and the elimination of waste. Tesco, an
international grocery supply company, used a toolset of JIT called “Kanban”. They were able to
successfully keep inventory low and efficient, which reduced finical losses (Moore, M., 2007).
Industrial Engineer published an article “Better Processes Make Good Eats”, which elaborated
the importance of continuous quality improvement in the food industry. The authors analyzed
Food Safety and Lean Six Sigma Model 22
the specifications of food industry from the customers’ expectation to the variations in this
manufacturing. A theoretical case study was given out to how to start a Lean Six Sigma case
(Kovach, T.,& Cho, R., 2011).
Food Safety and Lean Six Sigma Model 23
CHAPTER 3 METHODOLOGY
Introduction
In this thesis, the study was based on a scenario of salmon processing to demonstrate the
application of Lean Six Sigma tools combined with the safety management system. The product
process of the factory in this scenario is simulated based on the information from the U.S. FDA
training materials in 2002. The detailed data was designed by common sense and professional
judgment.
Procedures
The methodology of this study uses the DMAIC cycle as a guideline to define the problem,
measure the data, analyze the current situation, improve the process, and control the final
benefits. The overview of this process demonstrates that no comprehensive safety management
system was available in this factory, which causes an increased safety concern for the food
products. Furthermore, from materials receiving to products transporting to market takes nine
days. This fact categorized the process as a time consuming one.
Food Safety and Lean Six Sigma Model 24
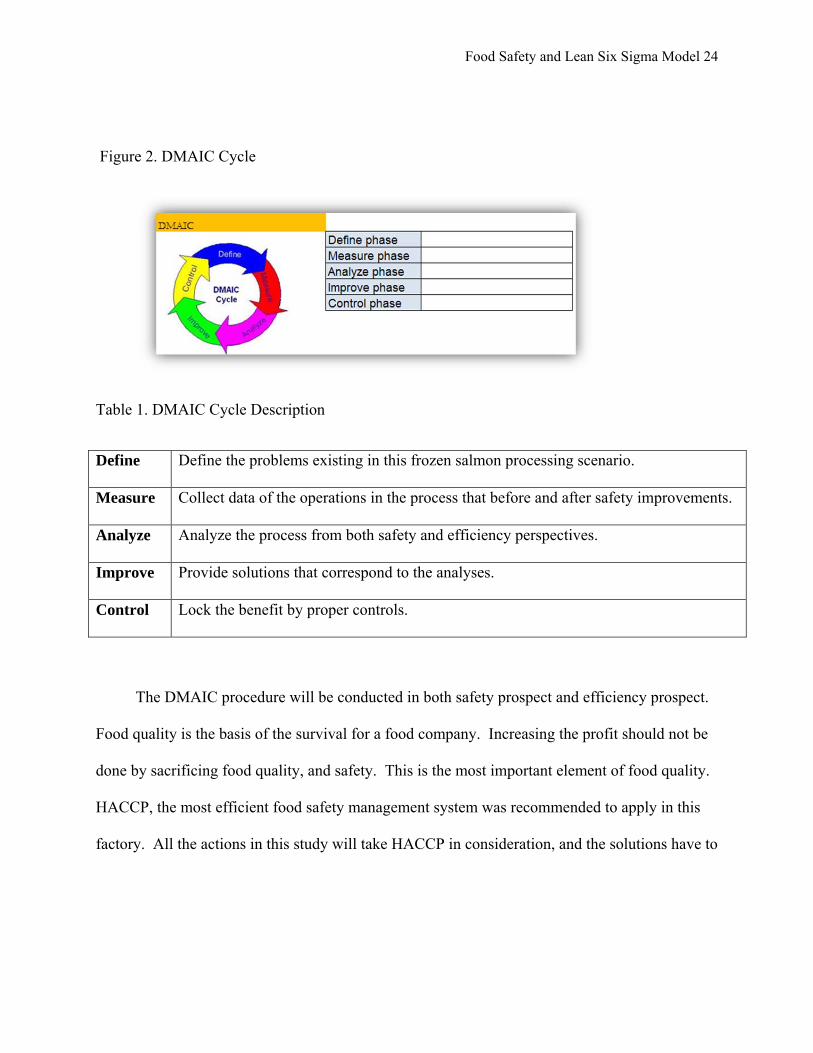
Figure 2. DMAIC Cycle
Table 1. DMAIC Cycle Description
Define Define the problems existing in this frozen salmon processing scenario.
Measure Collect data of the operations in the process that before and after safety improvements.
Analyze Analyze the process from both safety and efficiency perspectives.
Improve Provide solutions that correspond to the analyses.
Control Lock the benefit by proper controls.
The DMAIC procedure will be conducted in both safety prospect and efficiency prospect.
Food quality is the basis of the survival for a food company. Increasing the profit should not be
done by sacrificing food quality, and safety. This is the most important element of food quality.
HACCP, the most efficient food safety management system was recommended to apply in this
factory. All the actions in this study will take HACCP in consideration, and the solutions have to
Food Safety and Lean Six Sigma Model 25
cooperate with HACCP. The food safety investigation will be performed first, then, the
efficiency investigation should be conducted based on the safety modified process.
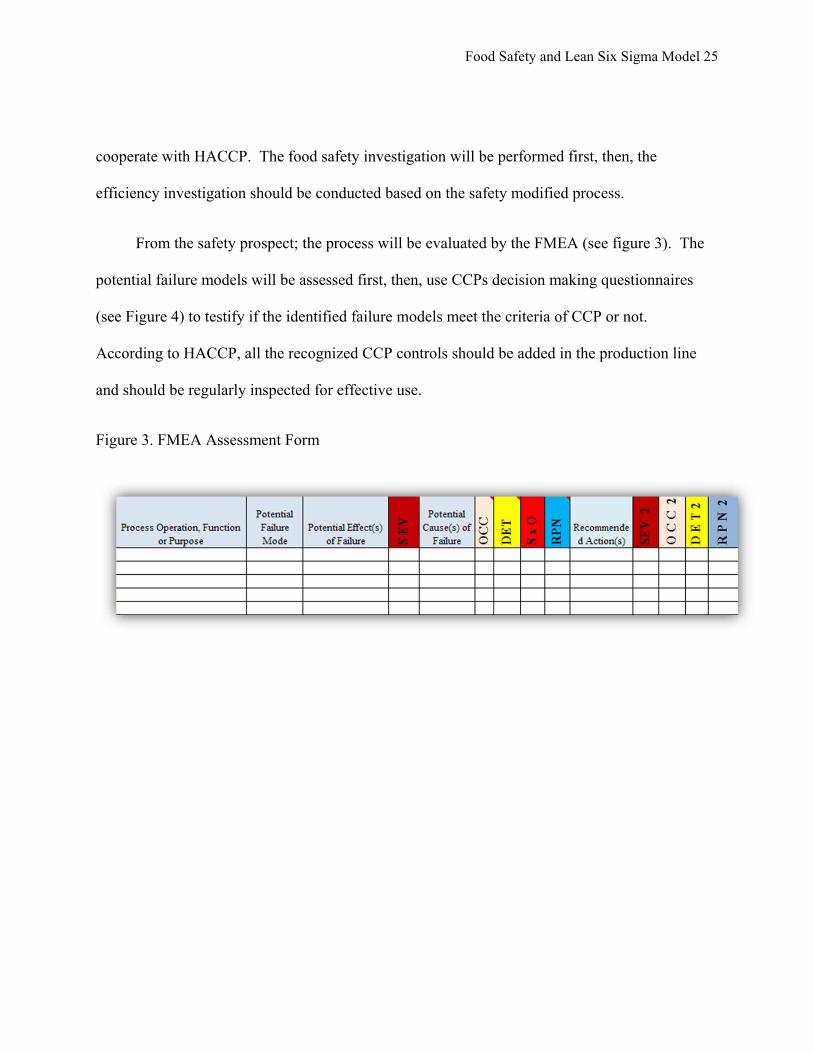
From the safety prospect; the process will be evaluated by the FMEA (see figure 3). The
potential failure models will be assessed first, then, use CCPs decision making questionnaires
(see Figure 4) to testify if the identified failure models meet the criteria of CCP or not.
According to HACCP, all the recognized CCP controls should be added in the production line
and should be regularly inspected for effective use.
Figure 3. FMEA Assessment Form
Food Safety and Lean Six Sigma Model 26
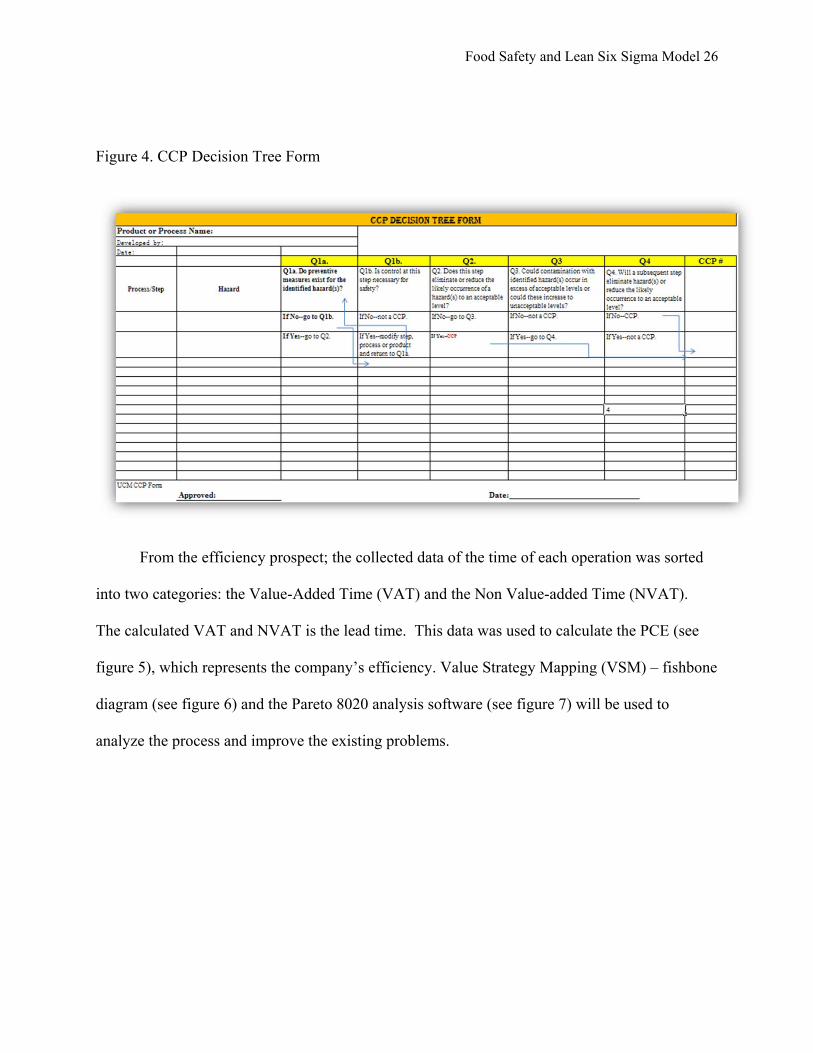
Figure 4. CCP Decision Tree Form
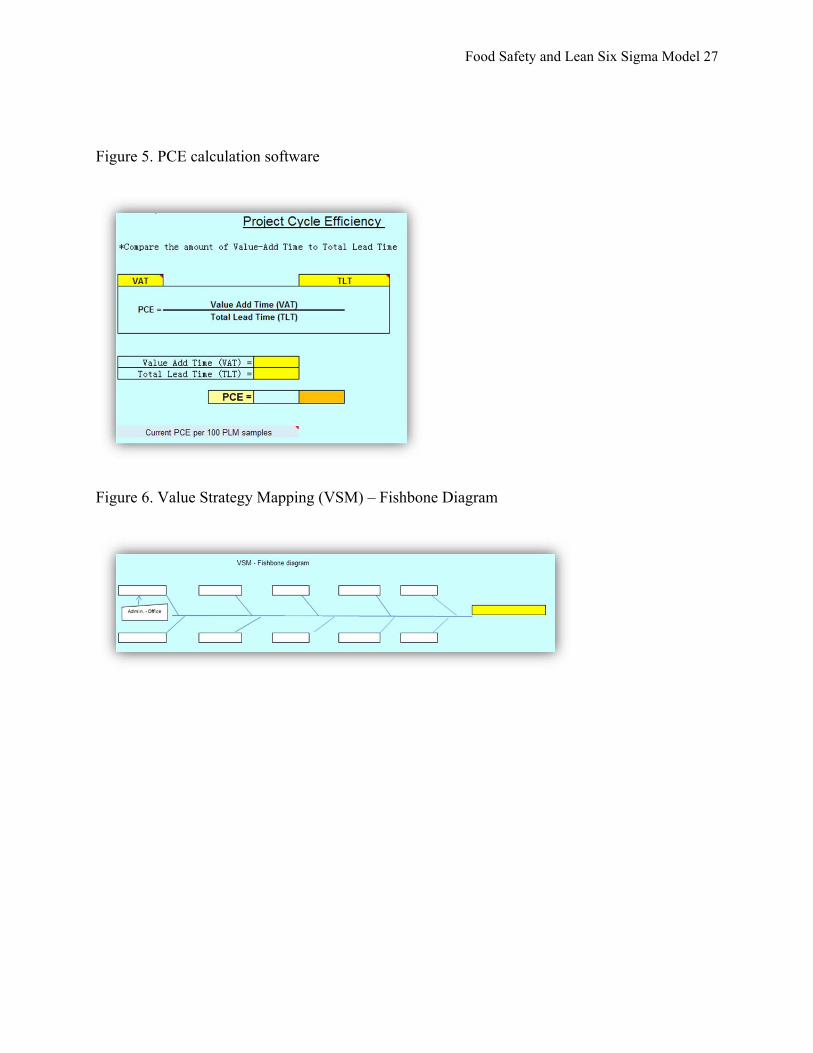
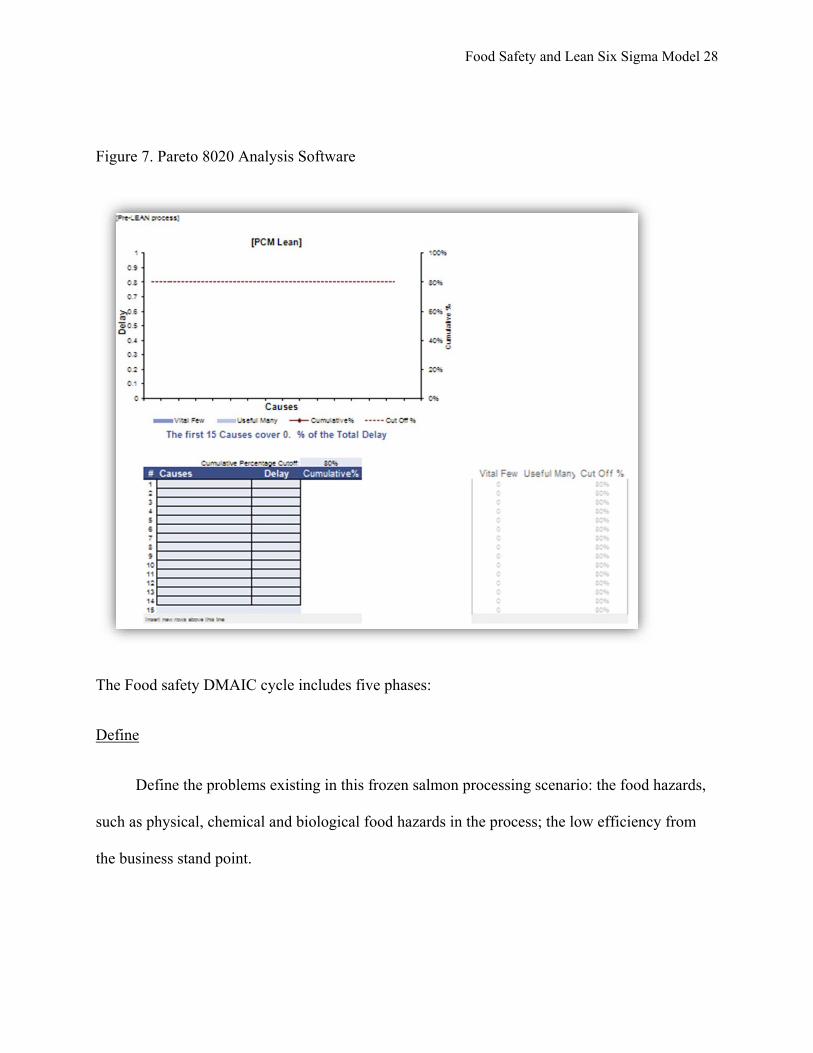
From the efficiency prospect; the collected data of the time of each operation was sorted
into two categories: the Value-Added Time (VAT) and the Non Value-added Time (NVAT).
The calculated VAT and NVAT is the lead time. This data was used to calculate the PCE (see
figure 5), which represents the company’s efficiency. Value Strategy Mapping (VSM) – fishbone
diagram (see figure 6) and the Pareto 8020 analysis software (see figure 7) will be used to
analyze the process and improve the existing problems.
Food Safety and Lean Six Sigma Model 27
Figure 5. PCE calculation software
Figure 6. Value Strategy Mapping (VSM) – Fishbone Diagram
Food Safety and Lean Six Sigma Model 28
Figure 7. Pareto 8020 Analysis Software
The Food safety DMAIC cycle includes five phases:
Define
Define the problems existing in this frozen salmon processing scenario: the food hazards,
such as physical, chemical and biological food hazards in the process; the low efficiency from
the business stand point.
Food Safety and Lean Six Sigma Model 29
Measure (Safety Prospect)
Collect data of all the original operations in the process (see Table 2):
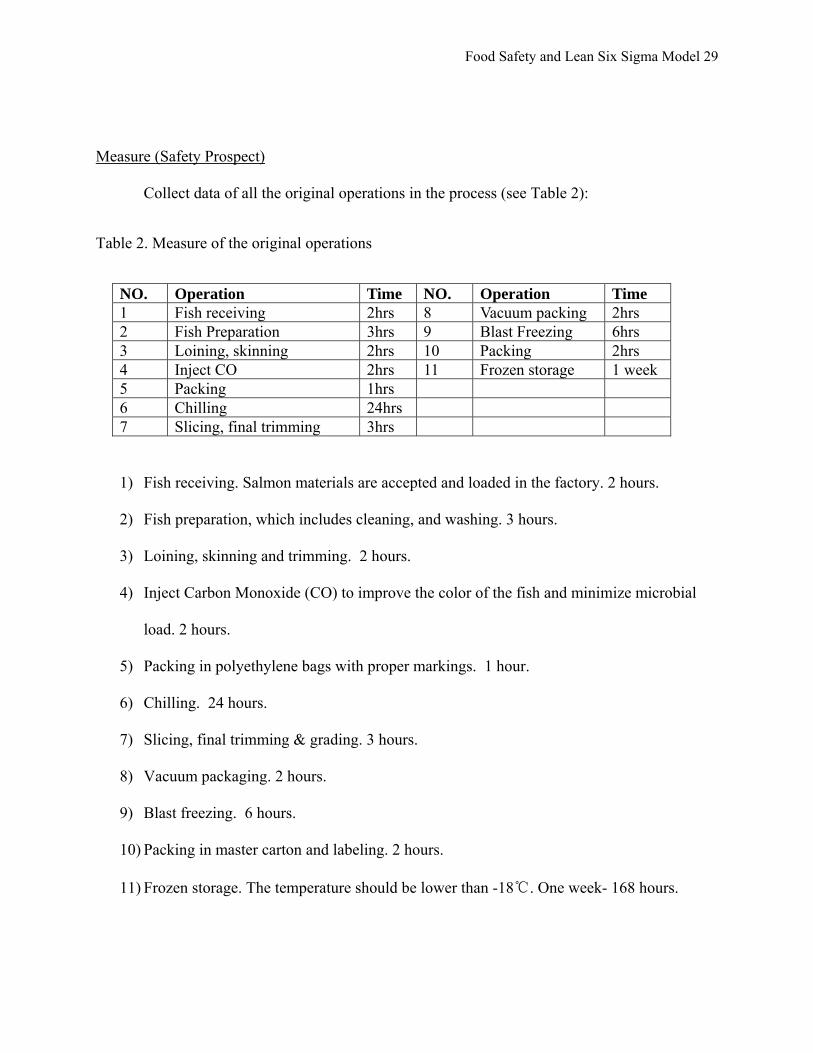
Table 2. Measure of the original operations
NO. Operation Time NO. Operation Time 1 Fish receiving 2hrs 8 Vacuum packing 2hrs 2 Fish Preparation 3hrs 9 Blast Freezing 6hrs 3 Loining, skinning 2hrs 10 Packing 2hrs 4 Inject CO 2hrs 11 Frozen storage 1 week 5 Packing 1hrs 6 Chilling 24hrs 7 Slicing, final trimming 3hrs
1) Fish receiving. Salmon materials are accepted and loaded in the factory. 2 hours.
2) Fish preparation, which includes cleaning, and washing. 3 hours.
3) Loining, skinning and trimming. 2 hours.
4) Inject Carbon Monoxide (CO) to improve the color of the fish and minimize microbial
load. 2 hours.
5) Packing in polyethylene bags with proper markings. 1 hour.
6) Chilling. 24 hours.
7) Slicing, final trimming & grading. 3 hours.
8) Vacuum packaging. 2 hours.
9) Blast freezing. 6 hours.
10) Packing in master carton and labeling. 2 hours.
11) Frozen storage. The temperature should be lower than -18℃. One week- 168 hours.
Food Safety and Lean Six Sigma Model 30
12) Salmon is transported by container every week to ship the products to market. The
process in this factory ends.
Analyze and Improve (Safety Prospect)
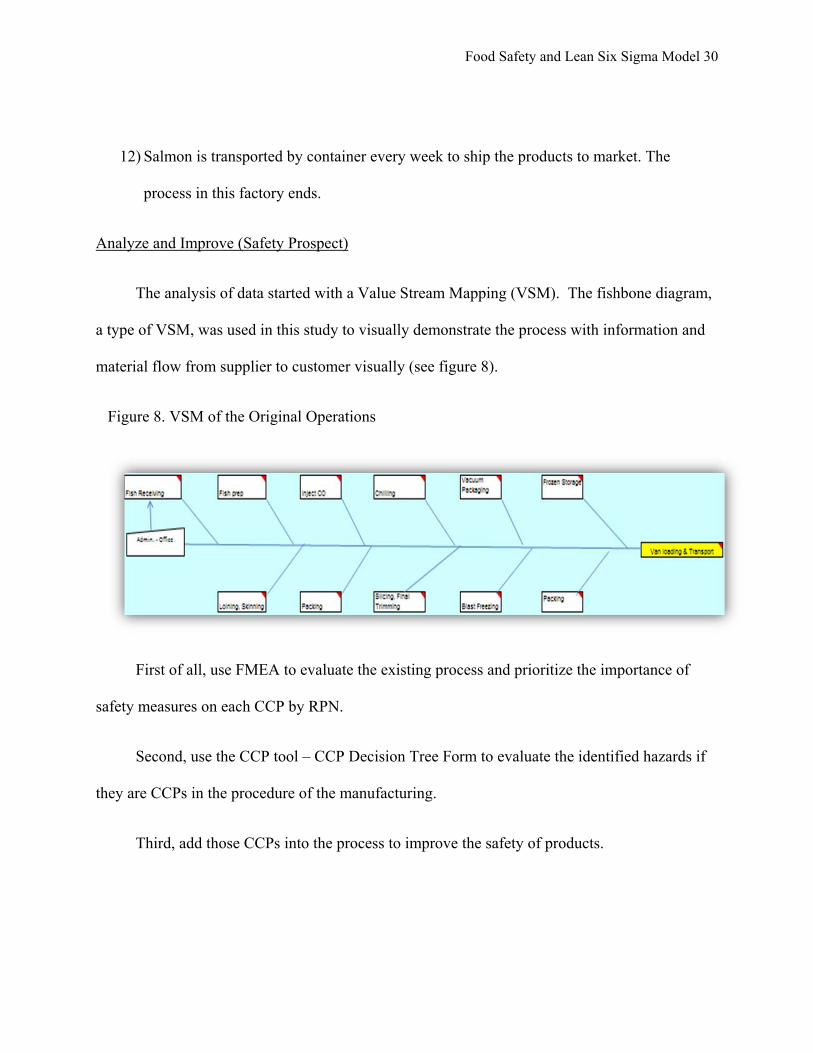
The analysis of data started with a Value Stream Mapping (VSM). The fishbone diagram,
a type of VSM, was used in this study to visually demonstrate the process with information and
material flow from supplier to customer visually (see figure 8).
Figure 8. VSM of the Original Operations
First of all, use FMEA to evaluate the existing process and prioritize the importance of
safety measures on each CCP by RPN.
Second, use the CCP tool – CCP Decision Tree Form to evaluate the identified hazards if
they are CCPs in the procedure of the manufacturing.
Third, add those CCPs into the process to improve the safety of products.
Food Safety and Lean Six Sigma Model 31
With the safety improvements the operation data was modified and it was further
categorized into VAT and NVAT.
Measure (Efficiency Prospect)
Collect the safety improved operation data.
Analyze and Improve (Efficiency Prospect)
Analyze the safety improved fish-bone VSM flow chart. According to data analyzed in the
last phase, the total of the VAT and NVAT can be calculated, and then the PCE can be calculated
by the PCE software.
In the efficiency prospect, the PCE is expected to be increased significantly during the
improved phase. Pareto 80/20 analysis software can be used to identify the vital few operations
that cause the majority of problems and prioritize the operations for the one that needs to be
improved the most. Give solution to reduce time waste in those operations, and calculate the
PCE for the improvement. Then, Pareto 80/20 can be used again to analyze the new process, the
second time consuming operation will be identified and solutions are expected. Step by step, the
whole process will be optimized. In business terms, this process is known as current state vs.
future state analysis.
Food Safety and Lean Six Sigma Model 32
Control
Control step is used to lock the benefit increased by the improvements. Engineering
control and administration control are the common actions for quality control.
Food Safety and Lean Six Sigma Model 33
CHAPTER 4 RESULTS
Results of Safety Analysis and Improvements
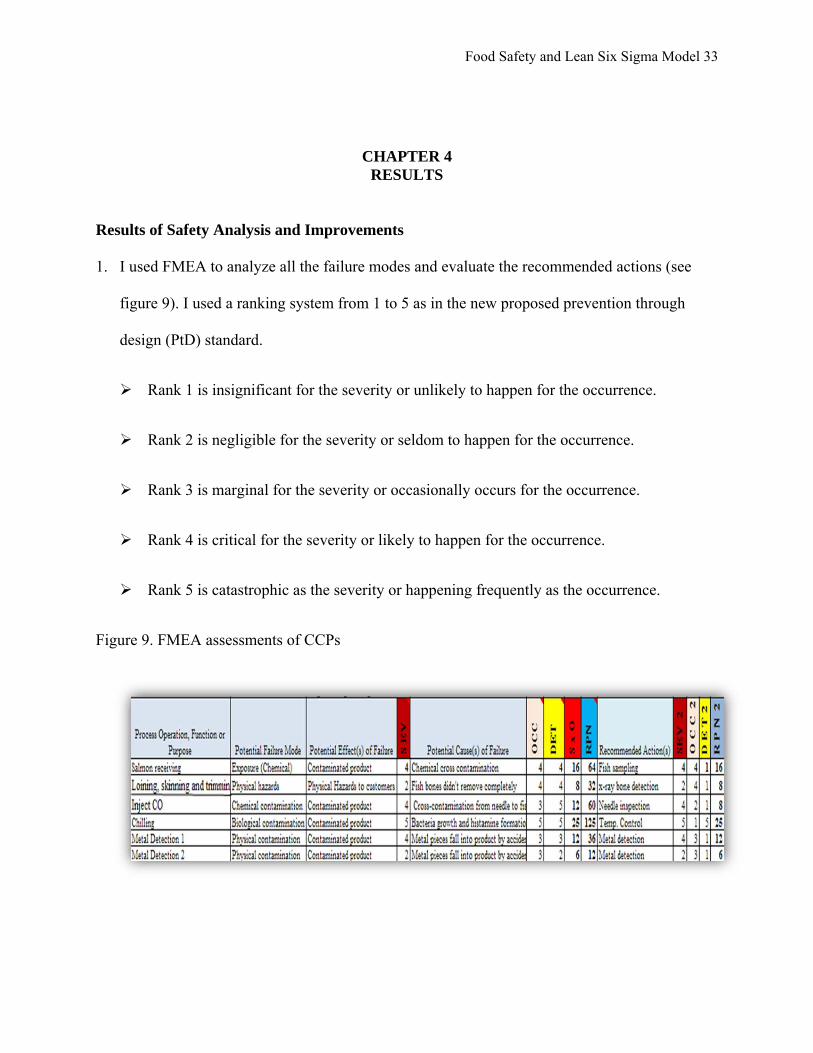
1. I used FMEA to analyze all the failure modes and evaluate the recommended actions (see
figure 9). I used a ranking system from 1 to 5 as in the new proposed prevention through
design (PtD) standard.
Rank 1 is insignificant for the severity or unlikely to happen for the occurrence.
Rank 2 is negligible for the severity or seldom to happen for the occurrence.
Rank 3 is marginal for the severity or occasionally occurs for the occurrence.
Rank 4 is critical for the severity or likely to happen for the occurrence.
Rank 5 is catastrophic as the severity or happening frequently as the occurrence.
Figure 9. FMEA assessments of CCPs
Food Safety and Lean Six Sigma Model 34
SEV means severity; OCC is the possibility of occurrence; DET stands for detection,
which is sometimes termed effectiveness. RPN is the short of Risk Priority Number, which is a
measure used when assessing risk to help identify critical failure modes associated with one’s
design or process. RPN = SEV × OCC× DET
1) During the salmon receiving, chemical cross contamination may contaminate fish
products before receiving them. The SEV of the contaminated product was 4, OCC was
considered 4, and DET was 4, which leads to a RPN as 64. However, introducing a step
of salmon sampling, the SEV and OCC will not change, but the DET will be reduced to
one. The RPN will be reduced to sixteen.
2) For the process of loining, skinning and trimming, the SEV (the severity of the physical
hazard, such as, fish-bone) was considered as 2, OCC was 4, and DET was 4, which
resulted in a RPN as 32. While, if applying an x-ray detection for fish-bone, the SEV
and OCC will not change, but the DET will be reduced to one, and the RPN will drop to
eight.
3) During the CO injection operation, the SEV of chemical contamination was four for the
unknown chemical or biological contaminations; OCC was three because the chance for
needles being contaminated with affective dose is rare; DET was five since no one can
identify the contamination by naked eye. RPN was sixty by the data. While, the action
Food Safety and Lean Six Sigma Model 35
step of needle inspection will drop the OCC to two and DET to one, then the RPN will
be eight.
4) Without temperature control of the chilling process, bacteria can grow out of control and
cause a SEV five, OCC five and DET five. The RPN was 125. However, the
temperature control action for the whole process will reduce the OCC to one.
Therefore, the RPN will drop to 25.
5) Metal pieces may exist in the final individual products without notice. The situation can
be described as SEV four, OCC three and DET three. The RPN was 36 in total.
However, a metal detection step during packing for individual products will change the
DET to one. The RPN will finally be twelve.
6) Metal pieces in the carton boxes will affect the reputation of the company significantly.
The SEV was two, OCC three, DET two. With the metal detection process, the SEV and
OCC will not change, but the DET will be reduced to one. Thus, PRN becomes six
compares to the twelve at the beginning.
The improvements will be achieved by incorporating all the suggestions in the individual
dazed on the analysis above.
2. According to the methodology, all the failure modes and the recommended actions should be
evaluated to identify if they are the Critical Control Points (CCP) by the CCP decision tree form
(see Figure 10). Six CCPs were identified as follows:
Food Safety and Lean Six Sigma Model 36
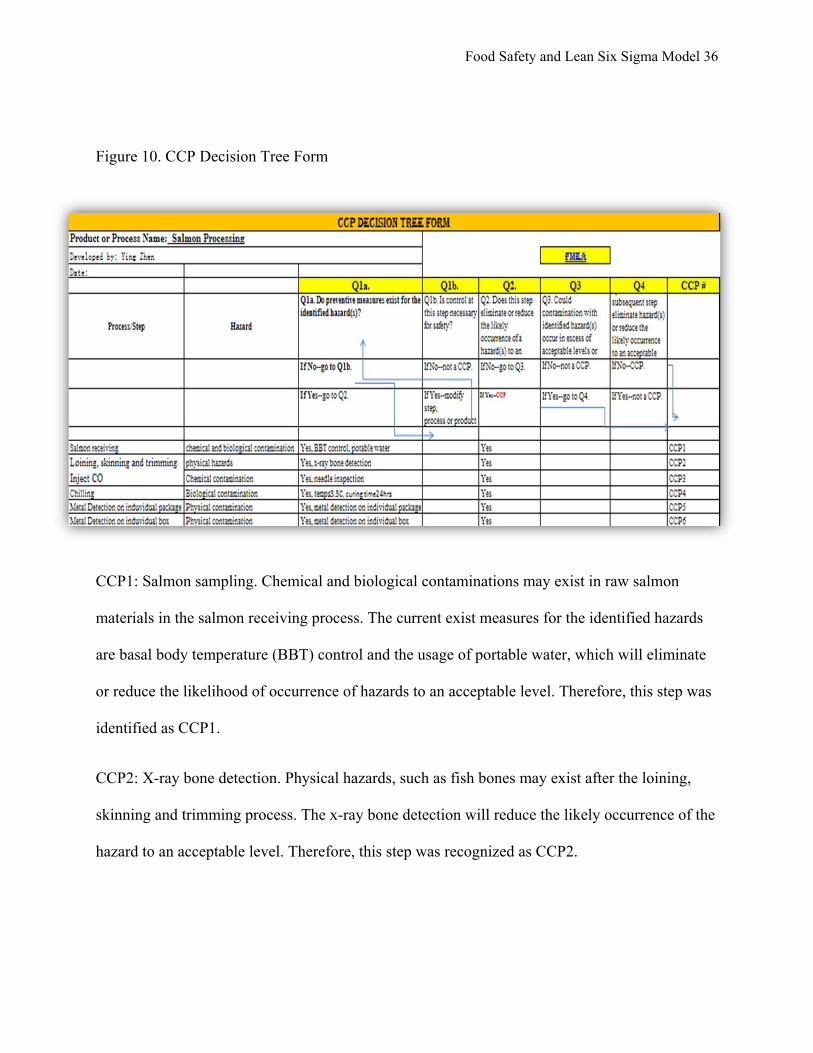
Figure 10. CCP Decision Tree Form
CCP1: Salmon sampling. Chemical and biological contaminations may exist in raw salmon
materials in the salmon receiving process. The current exist measures for the identified hazards
are basal body temperature (BBT) control and the usage of portable water, which will eliminate
or reduce the likelihood of occurrence of hazards to an acceptable level. Therefore, this step was
identified as CCP1.
CCP2: X-ray bone detection. Physical hazards, such as fish bones may exist after the loining,
skinning and trimming process. The x-ray bone detection will reduce the likely occurrence of the
hazard to an acceptable level. Therefore, this step was recognized as CCP2.
Food Safety and Lean Six Sigma Model 37
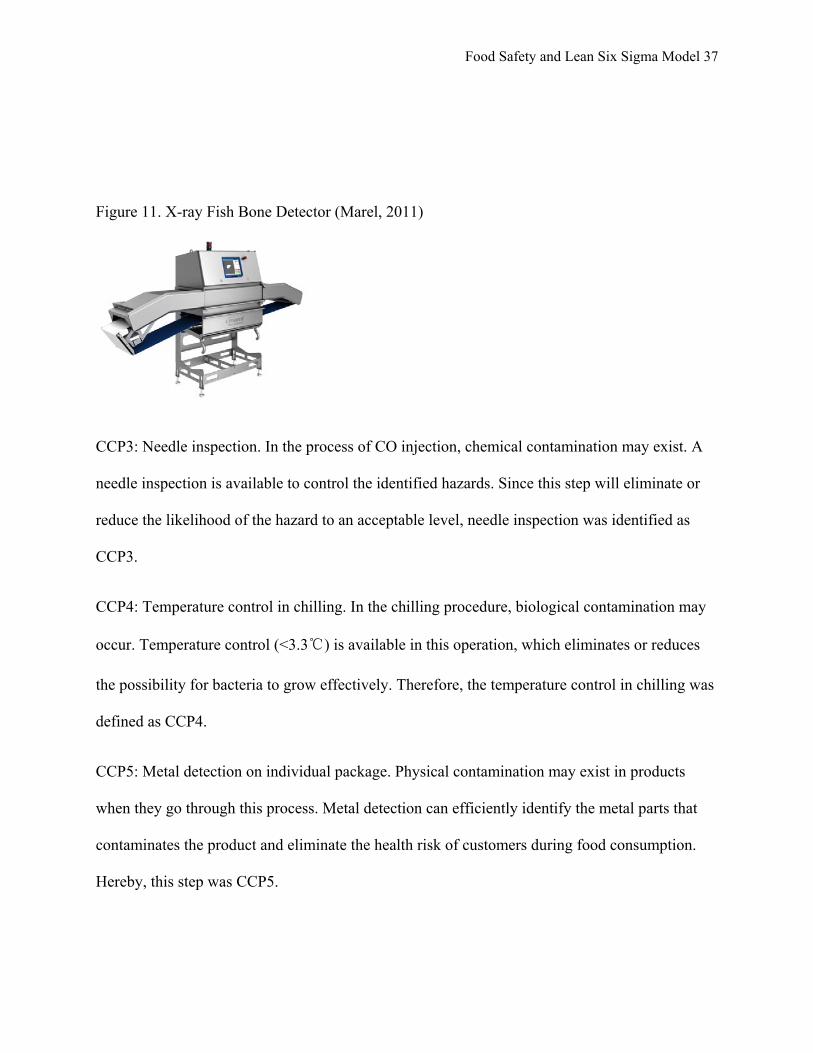
Figure 11. X-ray Fish Bone Detector (Marel, 2011)
CCP3: Needle inspection. In the process of CO injection, chemical contamination may exist. A
needle inspection is available to control the identified hazards. Since this step will eliminate or
reduce the likelihood of the hazard to an acceptable level, needle inspection was identified as
CCP3.
CCP4: Temperature control in chilling. In the chilling procedure, biological contamination may
occur. Temperature control (<3.3℃) is available in this operation, which eliminates or reduces
the possibility for bacteria to grow effectively. Therefore, the temperature control in chilling was
defined as CCP4.
CCP5: Metal detection on individual package. Physical contamination may exist in products
when they go through this process. Metal detection can efficiently identify the metal parts that
contaminates the product and eliminate the health risk of customers during food consumption.
Hereby, this step was CCP5.
Food Safety and Lean Six Sigma Model 38
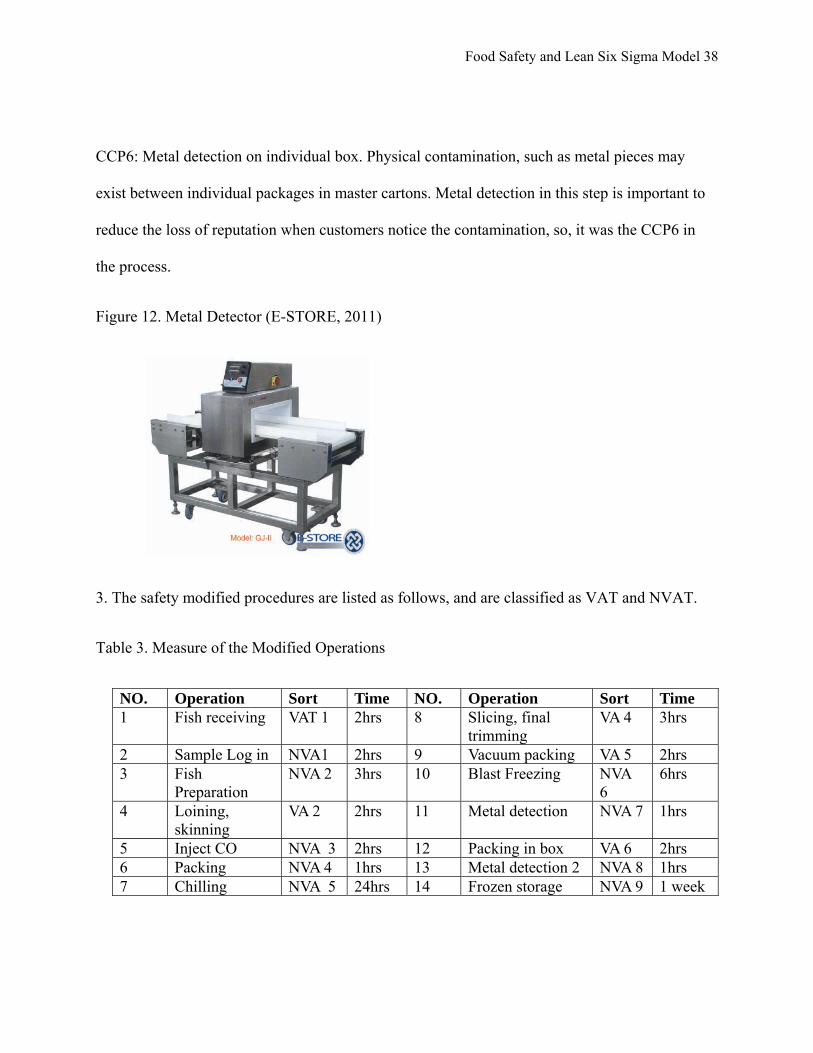
CCP6: Metal detection on individual box. Physical contamination, such as metal pieces may
exist between individual packages in master cartons. Metal detection in this step is important to
reduce the loss of reputation when customers notice the contamination, so, it was the CCP6 in
the process.
Figure 12. Metal Detector (E-STORE, 2011)
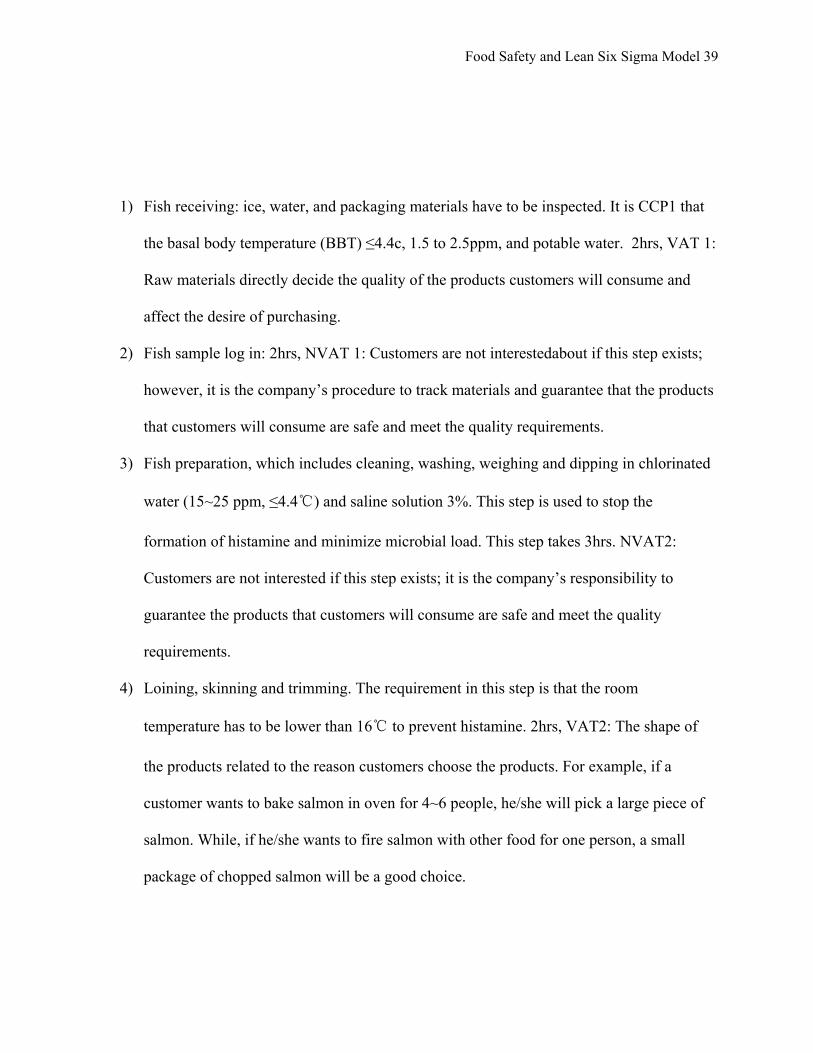
3. The safety modified procedures are listed as follows, and are classified as VAT and NVAT.
Table 3. Measure of the Modified Operations
NO. Operation Sort Time NO. Operation Sort Time 1 Fish receiving VAT 1 2hrs 8 Slicing, final
trimming VA 4 3hrs
2 Sample Log in NVA1 2hrs 9 Vacuum packing VA 5 2hrs 3 Fish
Preparation NVA 2 3hrs 10 Blast Freezing NVA
6 6hrs
4 Loining, skinning
VA 2 2hrs 11 Metal detection NVA 7 1hrs
5 Inject CO NVA 3 2hrs 12 Packing in box VA 6 2hrs 6 Packing NVA 4 1hrs 13 Metal detection 2 NVA 8 1hrs 7 Chilling NVA 5 24hrs 14 Frozen storage NVA 9 1 week
Food Safety and Lean Six Sigma Model 39
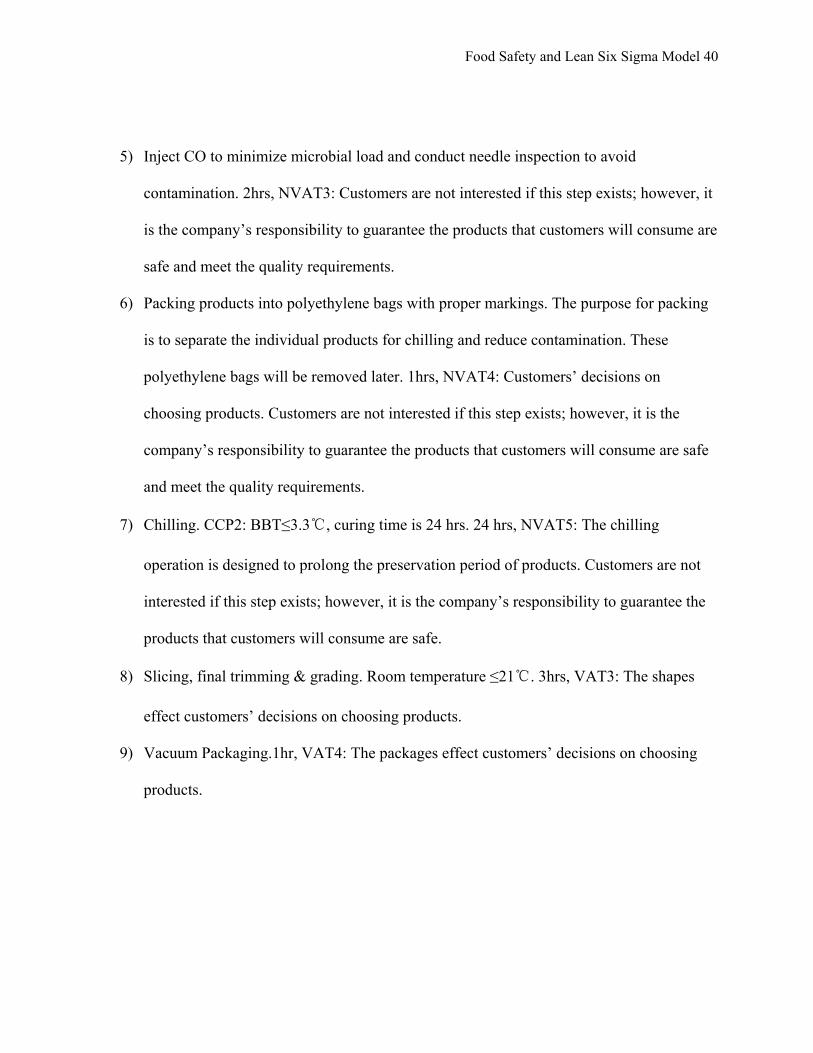
1) Fish receiving: ice, water, and packaging materials have to be inspected. It is CCP1 that
the basal body temperature (BBT) ≤4.4c, 1.5 to 2.5ppm, and potable water. 2hrs, VAT 1:
Raw materials directly decide the quality of the products customers will consume and
affect the desire of purchasing.
2) Fish sample log in: 2hrs, NVAT 1: Customers are not interestedabout if this step exists;
however, it is the company’s procedure to track materials and guarantee that the products
that customers will consume are safe and meet the quality requirements.
3) Fish preparation, which includes cleaning, washing, weighing and dipping in chlorinated
water (15~25 ppm, ≤4.4℃) and saline solution 3%. This step is used to stop the
formation of histamine and minimize microbial load. This step takes 3hrs. NVAT2:
Customers are not interested if this step exists; it is the company’s responsibility to
guarantee the products that customers will consume are safe and meet the quality
requirements.
4) Loining, skinning and trimming. The requirement in this step is that the room
temperature has to be lower than 16℃ to prevent histamine. 2hrs, VAT2: The shape of
the products related to the reason customers choose the products. For example, if a
customer wants to bake salmon in oven for 4~6 people, he/she will pick a large piece of
salmon. While, if he/she wants to fire salmon with other food for one person, a small
package of chopped salmon will be a good choice.
Food Safety and Lean Six Sigma Model 40
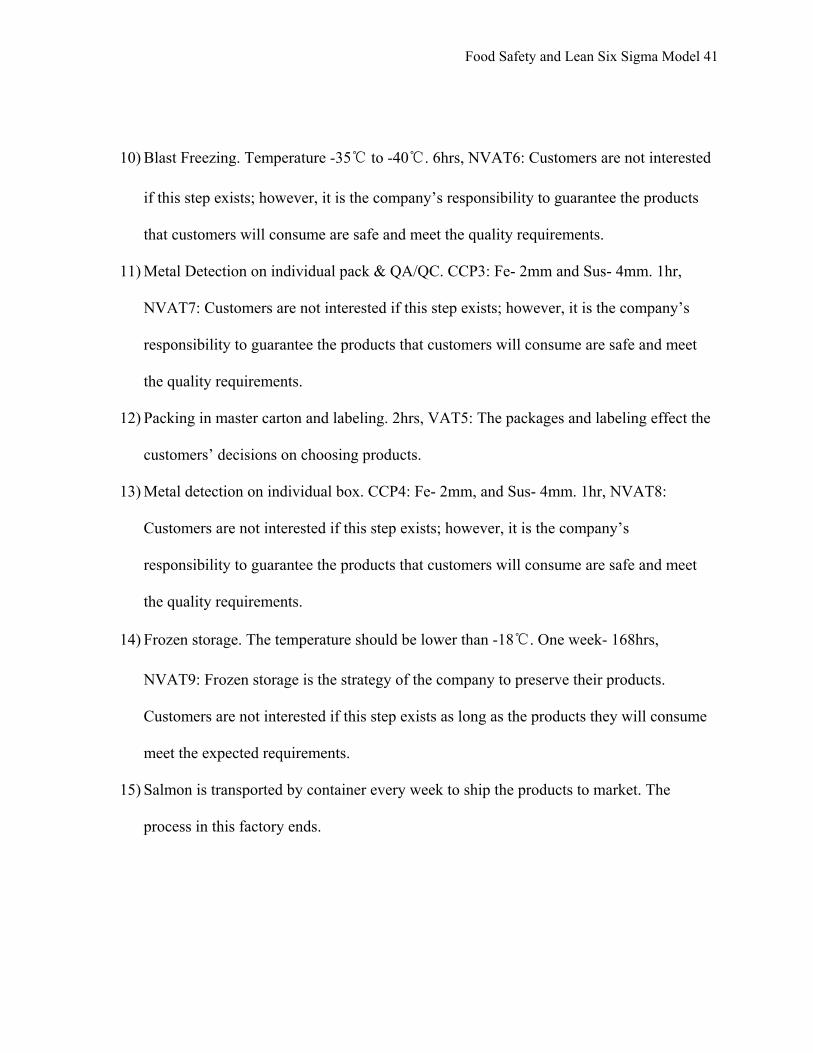
5) Inject CO to minimize microbial load and conduct needle inspection to avoid
contamination. 2hrs, NVAT3: Customers are not interested if this step exists; however, it
is the company’s responsibility to guarantee the products that customers will consume are
safe and meet the quality requirements.
6) Packing products into polyethylene bags with proper markings. The purpose for packing
is to separate the individual products for chilling and reduce contamination. These
polyethylene bags will be removed later. 1hrs, NVAT4: Customers’ decisions on
choosing products. Customers are not interested if this step exists; however, it is the
company’s responsibility to guarantee the products that customers will consume are safe
and meet the quality requirements.
7) Chilling. CCP2: BBT≤3.3℃, curing time is 24 hrs. 24 hrs, NVAT5: The chilling
operation is designed to prolong the preservation period of products. Customers are not
interested if this step exists; however, it is the company’s responsibility to guarantee the
products that customers will consume are safe.
8) Slicing, final trimming & grading. Room temperature ≤21℃. 3hrs, VAT3: The shapes
effect customers’ decisions on choosing products.
9) Vacuum Packaging.1hr, VAT4: The packages effect customers’ decisions on choosing
products.
Food Safety and Lean Six Sigma Model 41
10) Blast Freezing. Temperature -35℃ to -40℃. 6hrs, NVAT6: Customers are not interested
if this step exists; however, it is the company’s responsibility to guarantee the products
that customers will consume are safe and meet the quality requirements.
11) Metal Detection on individual pack & QA/QC. CCP3: Fe- 2mm and Sus- 4mm. 1hr,
NVAT7: Customers are not interested if this step exists; however, it is the company’s
responsibility to guarantee the products that customers will consume are safe and meet
the quality requirements.
12) Packing in master carton and labeling. 2hrs, VAT5: The packages and labeling effect the
customers’ decisions on choosing products.
13) Metal detection on individual box. CCP4: Fe- 2mm, and Sus- 4mm. 1hr, NVAT8:
Customers are not interested if this step exists; however, it is the company’s
responsibility to guarantee the products that customers will consume are safe and meet
the quality requirements.
14) Frozen storage. The temperature should be lower than -18℃. One week- 168hrs,
NVAT9: Frozen storage is the strategy of the company to preserve their products.
Customers are not interested if this step exists as long as the products they will consume
meet the expected requirements.
15) Salmon is transported by container every week to ship the products to market. The
process in this factory ends.
Food Safety and Lean Six Sigma Model 42
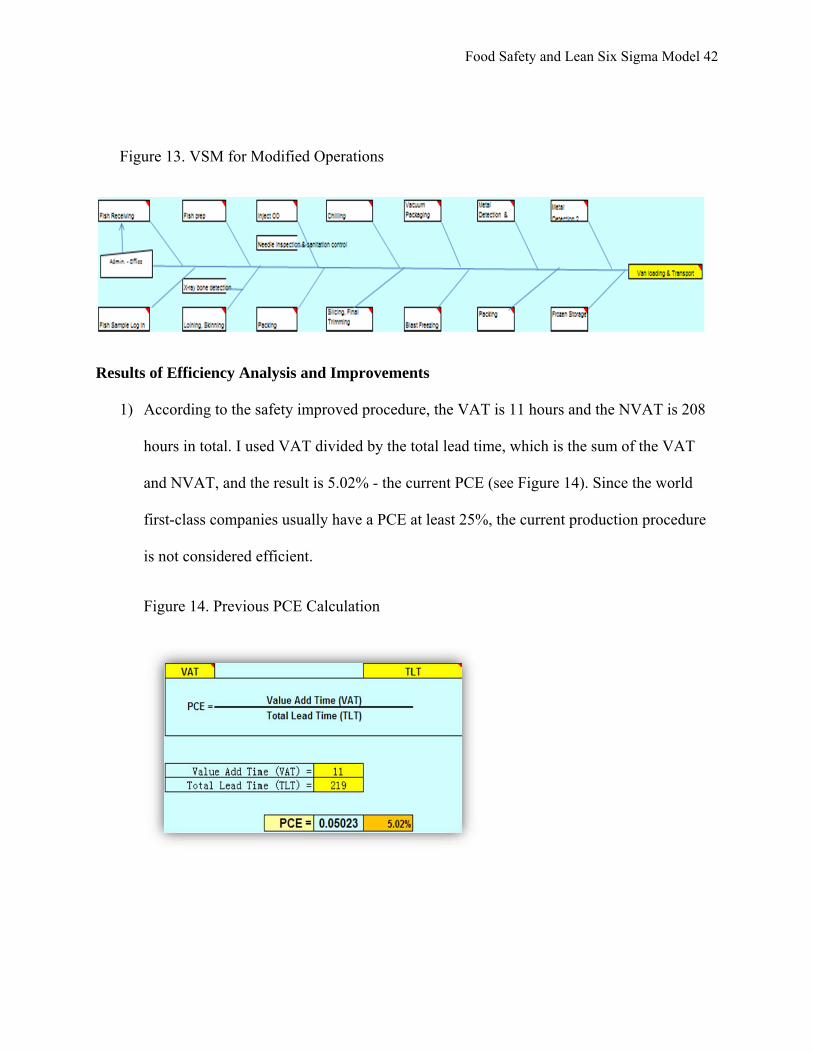
Figure 13. VSM for Modified Operations
Results of Efficiency Analysis and Improvements
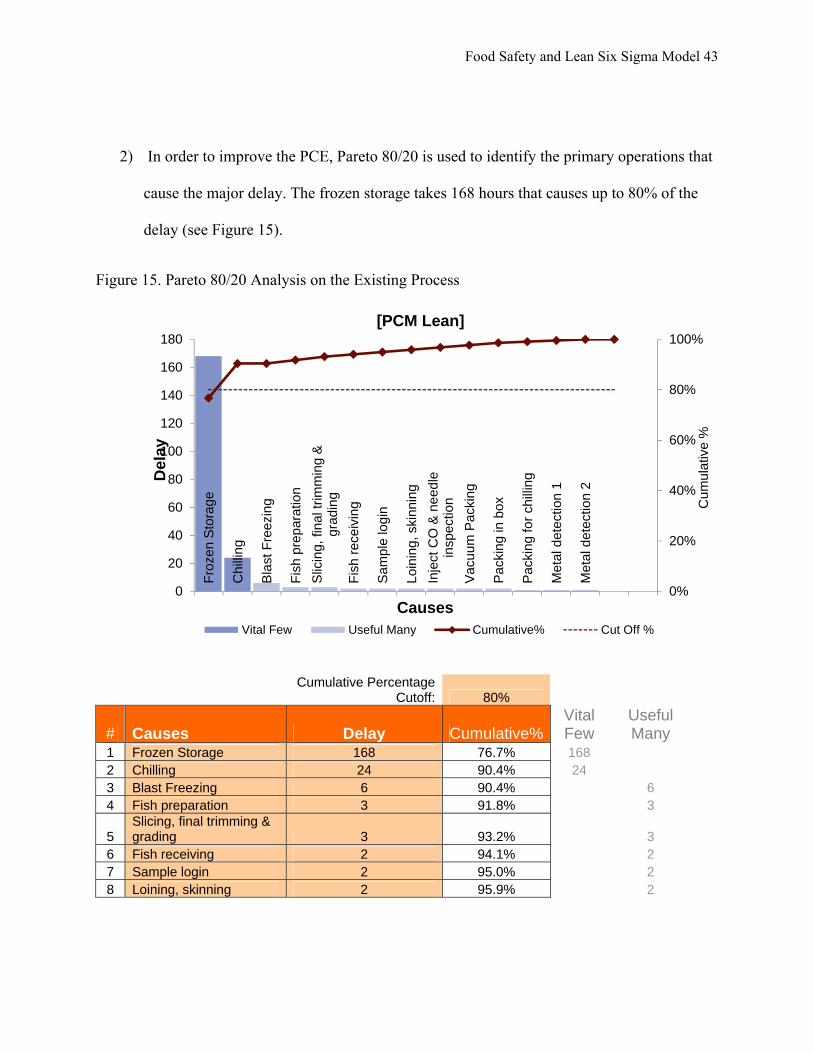
1) According to the safety improved procedure, the VAT is 11 hours and the NVAT is 208
hours in total. I used VAT divided by the total lead time, which is the sum of the VAT
and NVAT, and the result is 5.02% - the current PCE (see Figure 14). Since the world
first-class companies usually have a PCE at least 25%, the current production procedure
is not considered efficient.
Figure 14. Previous PCE Calculation
Food Safety and Lean Six Sigma Model 43
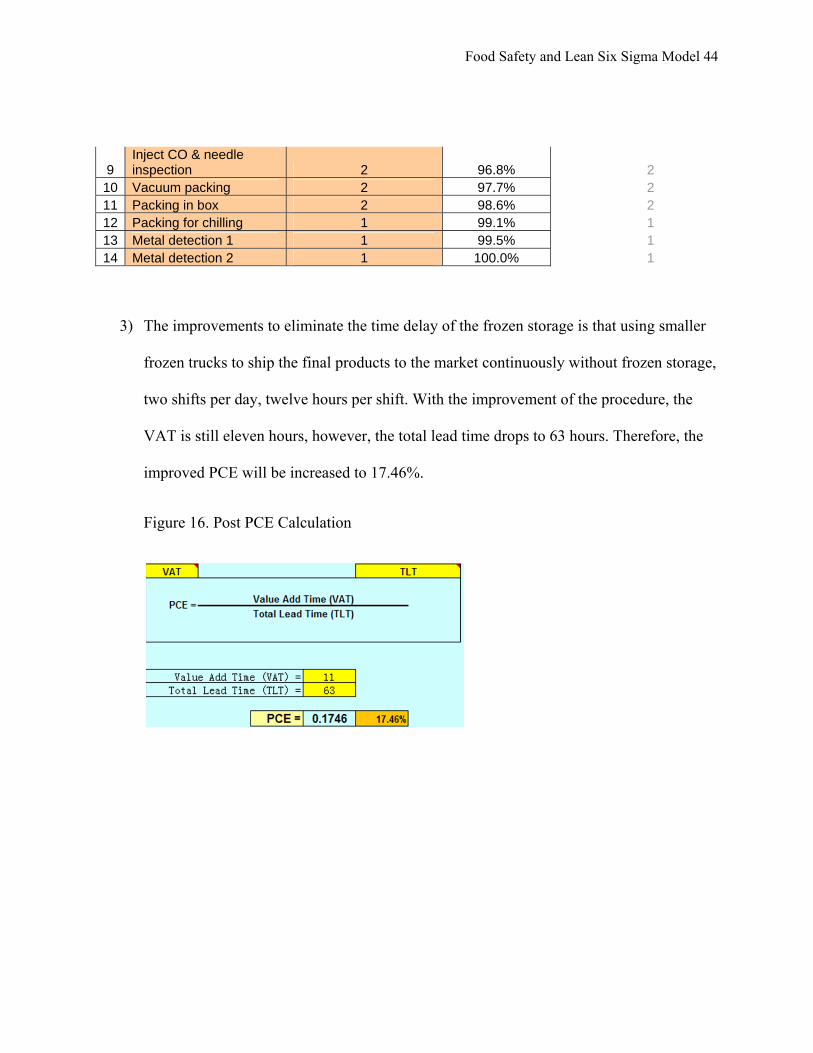
2) In order to improve the PCE, Pareto 80/20 is used to identify the primary operations that
cause the major delay. The frozen storage takes 168 hours that causes up to 80% of the
delay (see Figure 15).
Figure 15. Pareto 80/20 Analysis on the Existing Process
Cumulative Percentage Cutoff: 80%
# Causes Delay Cumulative%Vital Few
Useful Many
1 Frozen Storage 168 76.7% 168 2 Chilling 24 90.4% 24 3 Blast Freezing 6 90.4% 6 4 Fish preparation 3 91.8% 3
5 Slicing, final trimming & grading 3 93.2% 3
6 Fish receiving 2 94.1% 2 7 Sample login 2 95.0% 2 8 Loining, skinning 2 95.9% 2
Fro
zen
Sto
rage
Chi
lling
Bla
st F
reez
ing
Fis
h pr
epar
atio
n
Slic
ing,
fina
l trim
min
g &
gr
adin
g
Fis
h re
ceiv
ing
Sam
ple
logi
n
Loin
ing,
ski
nnin
g
Inje
ct C
O &
nee
dle
insp
ectio
n
Vac
uum
Pac
king
Pac
king
in b
ox
Pac
king
for
chill
ing
Met
al d
etec
tion
1
Met
al d
etec
tion
20%
20%
40%
60%
80%
100%
0
20
40
60
80
100
120
140
160
180
Cum
ulat
ive
%
Del
ay
Causes
[PCM Lean]
Vital Few Useful Many Cumulative% Cut Off % [42]
Food Safety and Lean Six Sigma Model 44
9 Inject CO & needle inspection 2 96.8% 2
10 Vacuum packing 2 97.7% 2 11 Packing in box 2 98.6% 2 12 Packing for chilling 1 99.1% 1 13 Metal detection 1 1 99.5% 1 14 Metal detection 2 1 100.0% 1
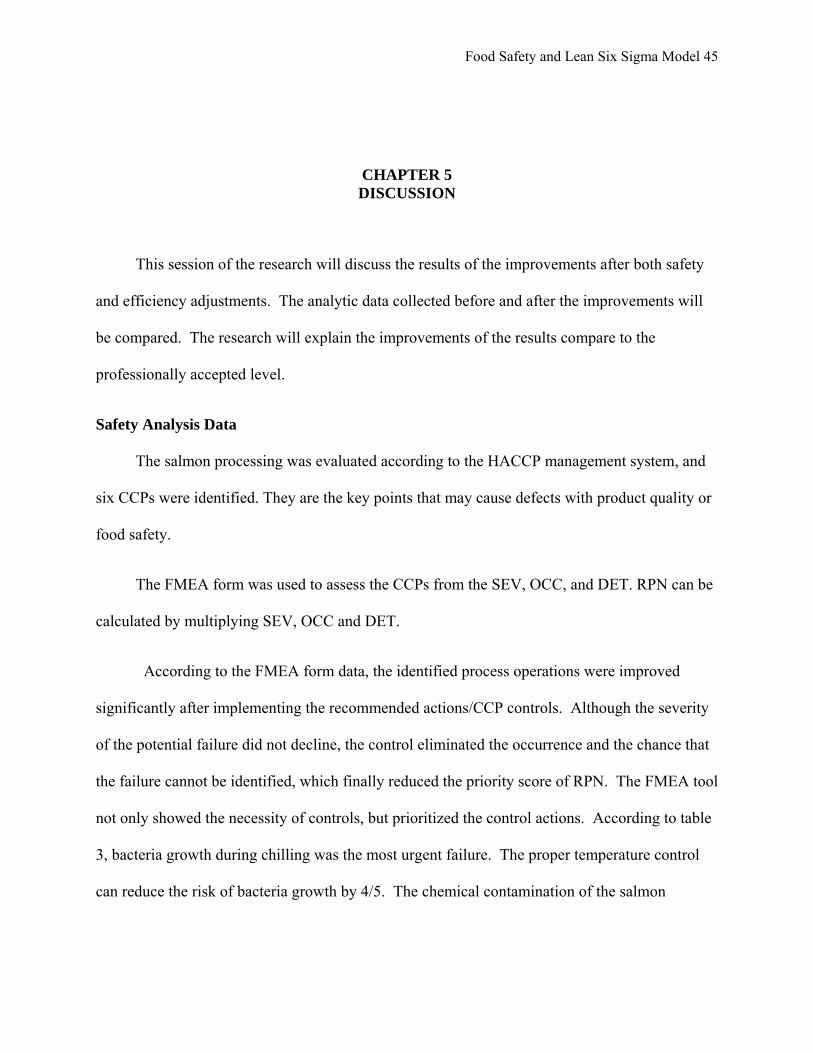
3) The improvements to eliminate the time delay of the frozen storage is that using smaller
frozen trucks to ship the final products to the market continuously without frozen storage,
two shifts per day, twelve hours per shift. With the improvement of the procedure, the
VAT is still eleven hours, however, the total lead time drops to 63 hours. Therefore, the
improved PCE will be increased to 17.46%.
Figure 16. Post PCE Calculation
Food Safety and Lean Six Sigma Model 45
CHAPTER 5 DISCUSSION
This session of the research will discuss the results of the improvements after both safety
and efficiency adjustments. The analytic data collected before and after the improvements will
be compared. The research will explain the improvements of the results compare to the
professionally accepted level.
Safety Analysis Data
The salmon processing was evaluated according to the HACCP management system, and
six CCPs were identified. They are the key points that may cause defects with product quality or
food safety.
The FMEA form was used to assess the CCPs from the SEV, OCC, and DET. RPN can be
calculated by multiplying SEV, OCC and DET.
According to the FMEA form data, the identified process operations were improved
significantly after implementing the recommended actions/CCP controls. Although the severity
of the potential failure did not decline, the control eliminated the occurrence and the chance that
the failure cannot be identified, which finally reduced the priority score of RPN. The FMEA tool
not only showed the necessity of controls, but prioritized the control actions. According to table
3, bacteria growth during chilling was the most urgent failure. The proper temperature control
can reduce the risk of bacteria growth by 4/5. The chemical contamination of the salmon
Food Safety and Lean Six Sigma Model 46
material was the second highest concern of the food poisoning. Fish sampling cannot reduce the
severity and the occurrence, but the ability of detection was obviously improved, which made the
threat drop to 1/4.
All the CCPs should be supervised strictly by the measures of the control limits if it is
available.
Efficiency Analysis Data
A continuous transportation solution of the final products should be incorporated into the
process instead of the once per week shipment. Although this improvement requires more
investment on transportation, it saves the expenses of a huge freezer and saves the costs to
maintain the freezer in the required temperature range.
After adopting the first efficiency-improvement actions, the PCE was increased to 17.46%.
Although the system PCE did not reach the world first-class level of 25%, it is a significant
improvement compared to 5.02%.
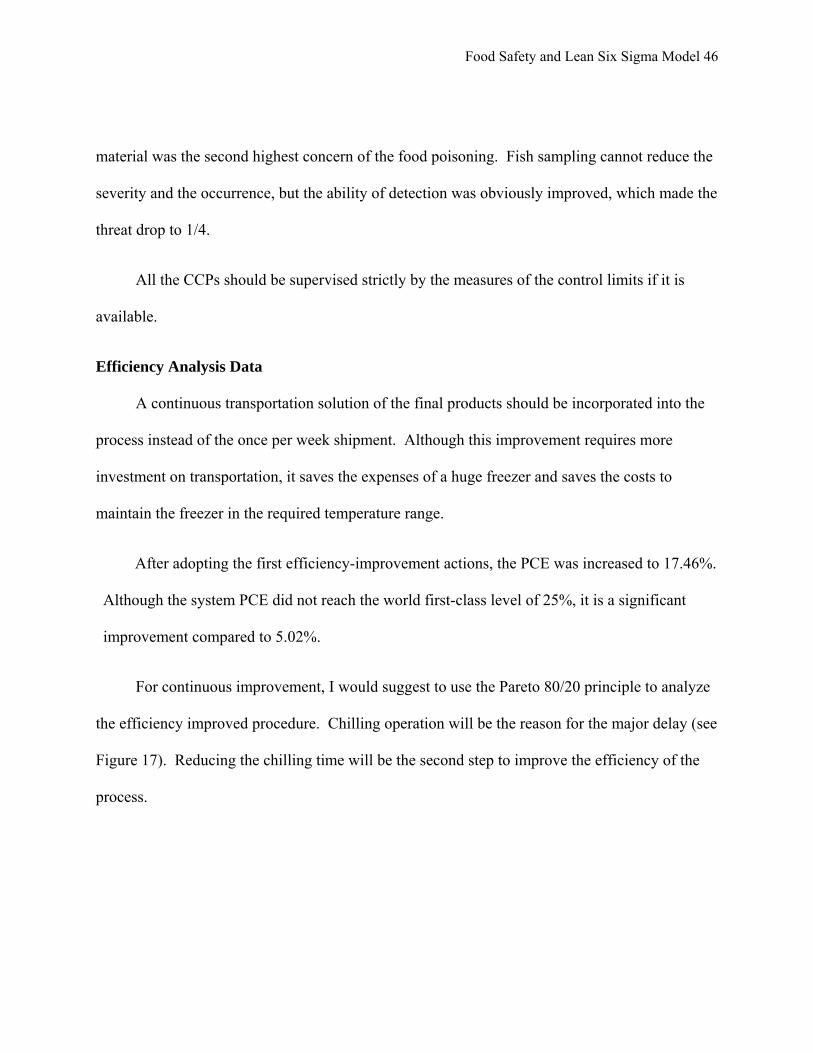
For continuous improvement, I would suggest to use the Pareto 80/20 principle to analyze
the efficiency improved procedure. Chilling operation will be the reason for the major delay (see
Figure 17). Reducing the chilling time will be the second step to improve the efficiency of the
process.
Food Safety and Lean Six Sigma Model 47
Figure 17. Pareto 80/20 Analysis on the Improved Process
In order to keep the benefits of the safety and the efficiency improvements, engineering
control and administration control should be applied at the same time. The engineering control
should make sure all the CCP controls are strictly enforced, such as the temperature control for
certain operations and the necessary equipment updated for accurate results. The administration
Fro
zen
Sto
rage
Chi
lling
Bla
st F
reez
ing
Fis
h S
ampl
e Lo
g In
Fis
h P
repe
ratio
n
Slic
ing,
fina
l tr
imm
ing
& g
radi
ng
Met
al D
etec
tion
1
Met
al D
etec
tion
2
0%
20%
40%
60%
80%
100%
0
5
10
15
20
25
30
Cum
ulat
ive
%
Del
ay
Causes
[PCM Lean]
Vital Few Useful Many Cumulative% Cut Off % [42]
Food Safety and Lean Six Sigma Model 48
control work with management closely to make sure the operation is effective, which includes
proper documentation, training and supervision.
In conclusion, Lean Six Sigma tools are applicable in the food industry; Lean Six Sigma
can be integrated with HACCP to improve food safety and minimize the risk of foodborne
illnesses; it can facilitate food companies to be competitive in the market by improving
productivity and quality of products, and by reducing unnecessary waste and lead time. In this
salmon processing case, the PCE of the process in the company was improved significantly and
the food product was made safer for customers.
According to what Michael George discussed in his book, Lean Six Sigma could
never help a company to achieve the goals they are expecting without the support of
management (George, L. M., 2002, p85). For long term success, a company needs to establish a
detailed Lean Six Sigma plan and incorporate this plan into the company’s strategies. Building
Lean Six Sigma and Safety Culture in a company and enhancing the awareness and participation
of each individual in the company will expedite the efficiency of the improvements and maintain
the achieved benefit.
Food Safety and Lean Six Sigma Model 49
REFERENCES
Crow, K. (2002). Failure Modes and Effects Analysis (FMEA). Retrieved March 20, 2011 from http://www.npd-solutions.com/fmea.html
Cutler, R. T. (2007). Food manufacturing and six sigma. TECHNOLOGY MANAGEMENT FOR DECISION-MAKERS, 2.0, 20-22.
Daniell, B. (2000). Introduction to food safety risk analysis. Unpublished manuscript. Department of Environmental Health , University of Washington, Seattle, Retrieved from http://depts.washington.edu/foodrisk/overview.html
Drew, F. (2011). E. coli ground beef recalls 2011. Food Poison Journal. Retrieved from http://www.foodpoisonjournal.com/foodborne-illness-outbreaks/e-coli-ground-beef-recalls-2011/
E-STORE. (Producer). (2011). Metal detector . [Print Photo]. Retrieved from http://www.p-wholesale.com/cn-pro/19/760to1/metal-detector-gj-ii-690663.html
George, L. M. (2002). Lean six sigma. (1st ed.). New York: McGraw-Hill.
Haglund, N. (2011, August 12). Two kids test positive for e. coli at lynnwood day care. Retrieved from http://www.heraldnet.com/article/20110812/NEWS01/708129837
Kovach, T. & Cho, R. (2011). Better processes make GOOD EATS: Food industry can benefit from lean Six Sigma principles. Industrial Engineer: IE, 43(1), 36-40. Retrieved from EBSCOhost.
Lean Enterprise Institute. (2009). A brief history of lean. Retrieved from http://www.lean.org/whatslean/History.cfm
Lixia, C. & Bo, M. (2010). Why Most Chinese Enterprises Fail in Deploying Lean Production. Asian Social Science, 6(3), 52-57. Retrieved from EBSCOhost.
Food Safety and Lean Six Sigma Model 50
Marel. (Producer). (2011). Sensorx system-fish. [Print Photo]. Retrieved from http://www.marel.com/systems-and-equipment/fish/x-ray/X-ray-Bone-Detection/SensorX-System-Fish/199/default.aspx
Mead, P. V. (2000). Food-Related Illness and Death in the United States. Journal of Environmental Health, 62(7), 9. Retrieved from EBSCOhost.
Motorola University. (2008). Motorola six sigma business improvement programs. Retrieved from http://www.motorola.com/web/Business/_Moto_University/_Documents/_Static_Files/Business_Improvement_Campaigns.pdf
Moore, M. (2007, November 07). Getting to the core – applying lean in the food industry. Retrieved from http://www.improvementandinnovation.com/features/article/getting-core-applying-lean-food-industry/
Roberts, A. C. (2001). The food safety information handbook. (1st ed.). Westport, CT: An imprint of Greenwood Publishing Group. Inc.
Six Sigma. (2011). What is six sigma? Retrieved from 1.http://www.isixsigma.com/index.php?option=com_k2&view=item&id=1463:what-is-six-sigma?&Itemid=155
Six Sigma Online. (2009, September 04). Lean six sigma - practical applications in fast food. Retrieved from http://www.sixsigmaonline.org/six-sigma-training-certification-information/articles/lean-six-sigma---practical-applications-in-fast-food-.html
Standard Kalite. (n.d.). HACCP history [Web log message]. Retrieved from http://www.standardkalite.com/haccp_iso22000_history.htm
United States Centers for Disease Control and Prevention. (2011). CDC 2011: Estimates: Findings. Retrieved March 15, 2011 from http://www.cdc.gov/foodborneburden/2011-foodborne-estimates.html
United States Department of Health and Human Services Public Health Service Food and Drug Administration. (1999). Annex 5: HACCP Guidelines. Retrieved March 15, 2011 from: http://www.hospitalityguild.com/downloads/HACCP_Guidelines_FDA.pdf
United States Environmental Protection Agency. (2011). The lean and environment toolkit. Retrieved from http://www.epa.gov/lean/environment/toolkits/environment/
Food Safety and Lean Six Sigma Model 51
United States Environmental Protection Agency, National Service Center for Environmental Publications (NSCEP). (2009). The environmental professional's guide to lean & six sigma (EPA-100-K-09-006). Retrieved from www.epa.gov/lean
United States Food and Drug Administration. (1997). Hazard analysis and critical control point principles and application guidelines. Retrieved from http://www.fda.gov/Food/FoodSafety/HazardAnalysisCriticalControlPointsHACCP/HACCPPrinciplesApplicationGuidelines/default.htm
United States Food and Drug Administration. (2011, Apr. 27). Hazard analysis & critical control points (HACCP) [Web log message]. Retrieved from http://www.fda.gov/food/foodsafety/hazardanalysiscriticalcontrolpointshaccp/default.htm
World Health Organization. (2011). Food safety. Retrieved from http://www.who.int/foodsafety/en/
World Health Organization. (2007). Food safety and foodborne illness. Retrieved from http://www.who.int/mediacentre/factsheets/fs237/en/