Embed Size (px)
Citation preview
Food prices, Food prices, BiofuelsBiofuels, and , and Climate ChangeClimate Change
Joachim von BraunJoachim von BraunInternational Food Policy Research InstituteInternational Food Policy Research Institute
February 2008February 2008
Joachim von Braun, IFPRI, February 2008
Overview Overview
1.1. The new world food equationThe new world food equation
2.2. Energy Energy -- biofuelsbiofuels -- food securityfood security
3.3. Climate change Climate change -- biomass biomass –– agriculture agriculture
4.4. ProPro--poor policy and program actionspoor policy and program actions
Joachim von Braun, IFPRI, February 2008
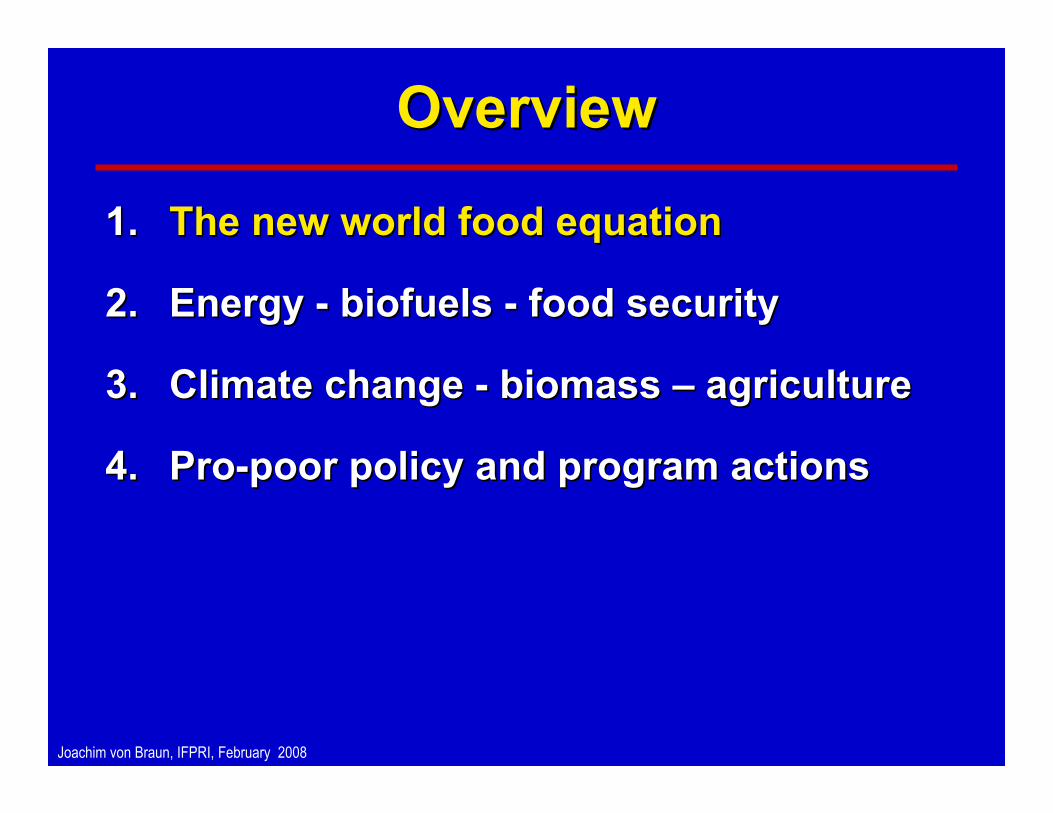
Cereal Price Cereal Price -- Index 1905 Index 1905 -- 20002000(All (All procesproces = 100 in 1960)= 100 in 1960)
0
50
100
150
200
250
300
1905 1915 1925 1935 1945 1955 1965 1975 1985 1995 2005
Wheat Maize Rice
Joachim von Braun, IFPRI, February 2008
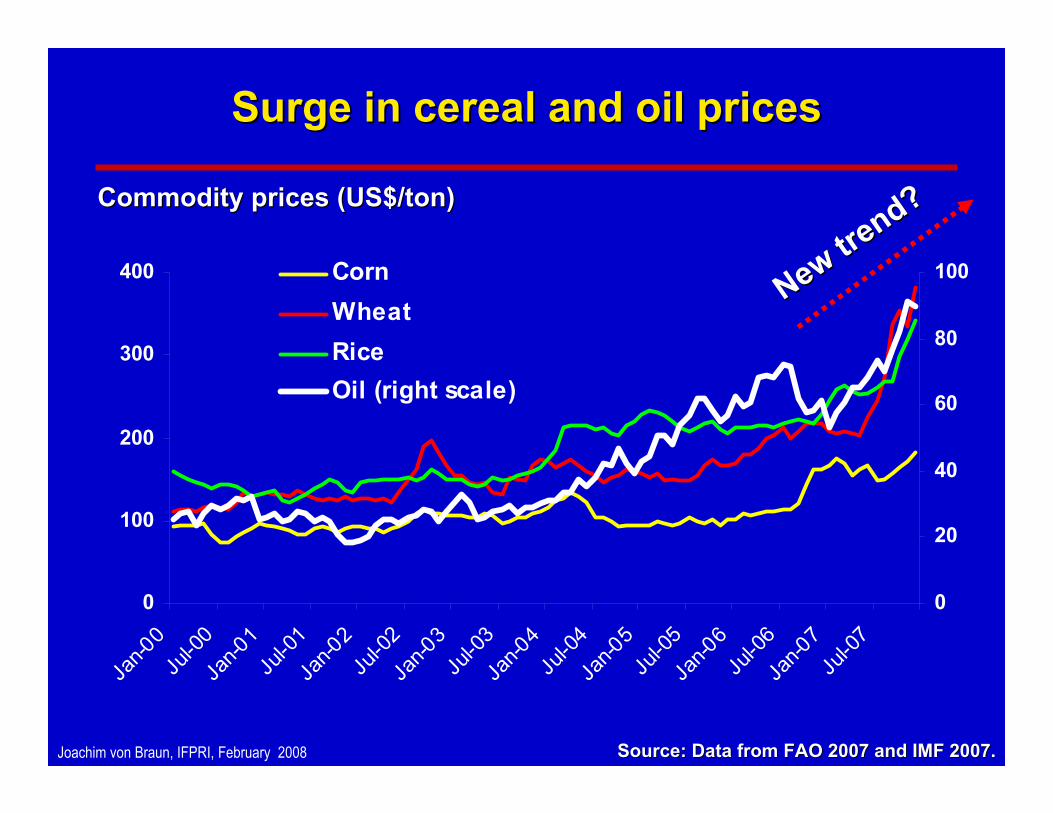
Surge in cereal and oil pricesSurge in cereal and oil prices
0
100
200
300
400
Jan-0
0Ju
l-00
Jan-0
1Ju
l-01
Jan-0
2Ju
l-02
Jan-0
3Ju
l-03
Jan-0
4Ju
l-04
Jan-0
5Ju
l-05
Jan-0
6Ju
l-06
Jan-0
7Ju
l-07
0
20
40
60
80
100CornWheatRiceOil (right scale)
Source: Data from FAO 2007 and IMF 2007Source: Data from FAO 2007 and IMF 2007.
Commodity prices (US$/ton)Commodity prices (US$/ton)
New trend?
New trend?
Joachim von Braun, IFPRI, February 2008
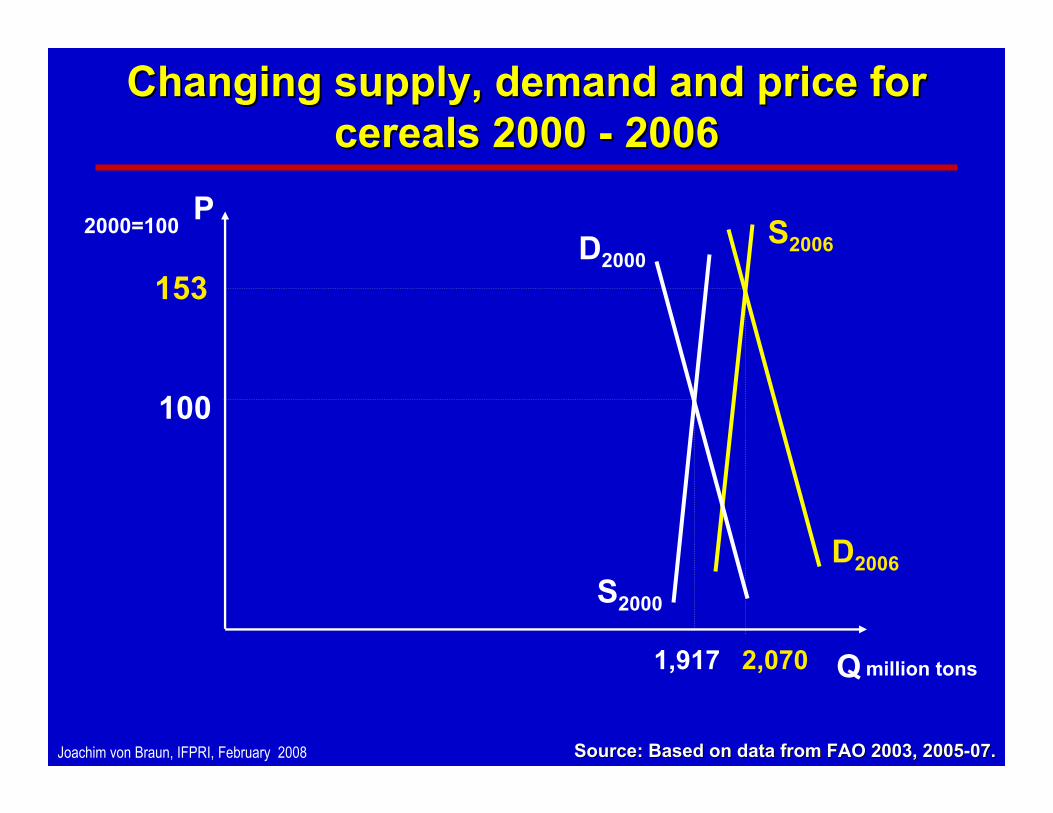
Changing supply, demand and price for Changing supply, demand and price for cereals 2000 cereals 2000 -- 20062006
100
D2000
S2000
D2006
S2006
153
P
2,070 million tons
2000=100
1,917 Q
Source: Based on data from FAO 2003, 2005Source: Based on data from FAO 2003, 2005--07.07.
Joachim von Braun, IFPRI, February 2008
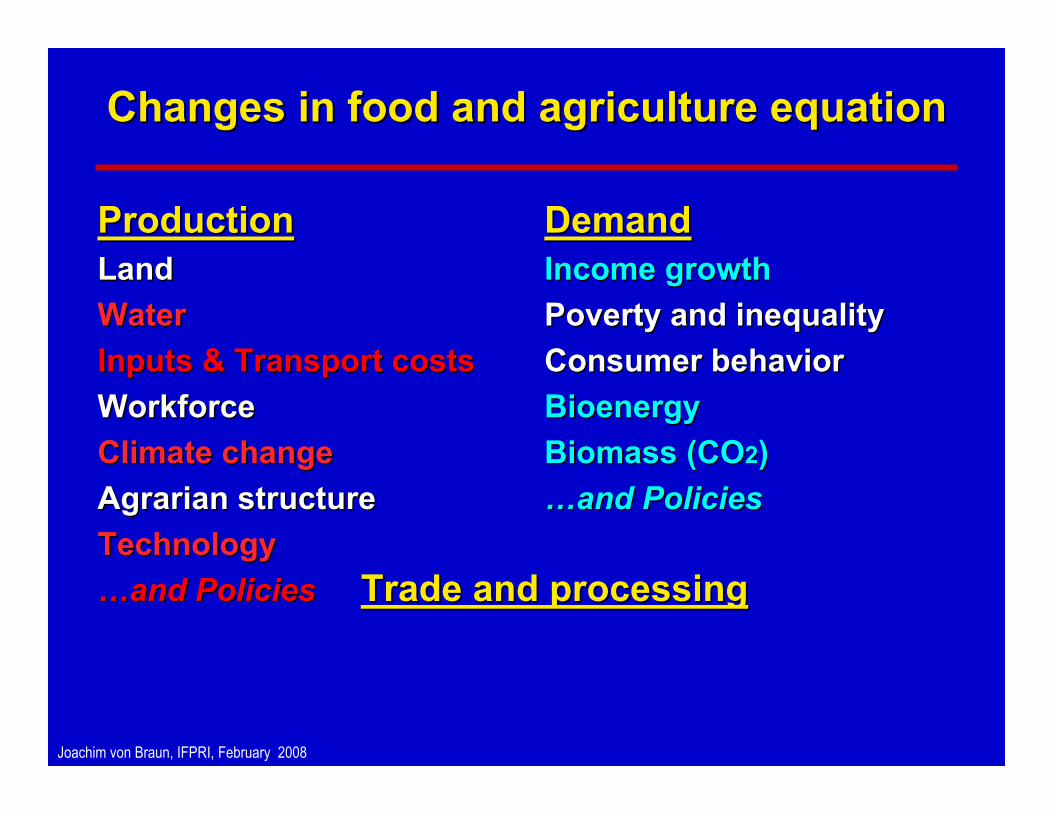
Changes in food and agriculture equationChanges in food and agriculture equation
ProductionProduction DemandDemand
Trade and processingTrade and processing
Joachim von Braun, IFPRI, February 2008
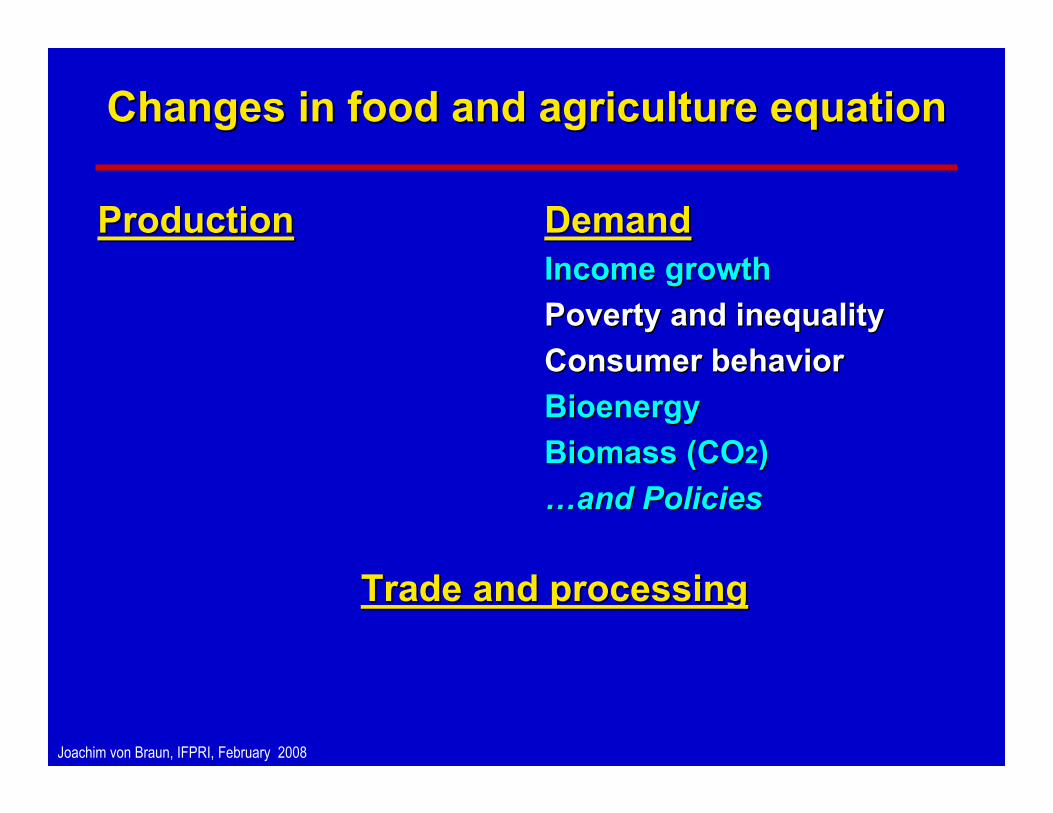
ProductionProduction DemandDemandIncome growthIncome growthPoverty and inequalityPoverty and inequalityConsumer behaviorConsumer behaviorBioenergyBioenergyBiomass (COBiomass (CO22))……and Policiesand Policies
Trade and processingTrade and processing
Changes in food and agriculture equationChanges in food and agriculture equation
Joachim von Braun, IFPRI, February 2008
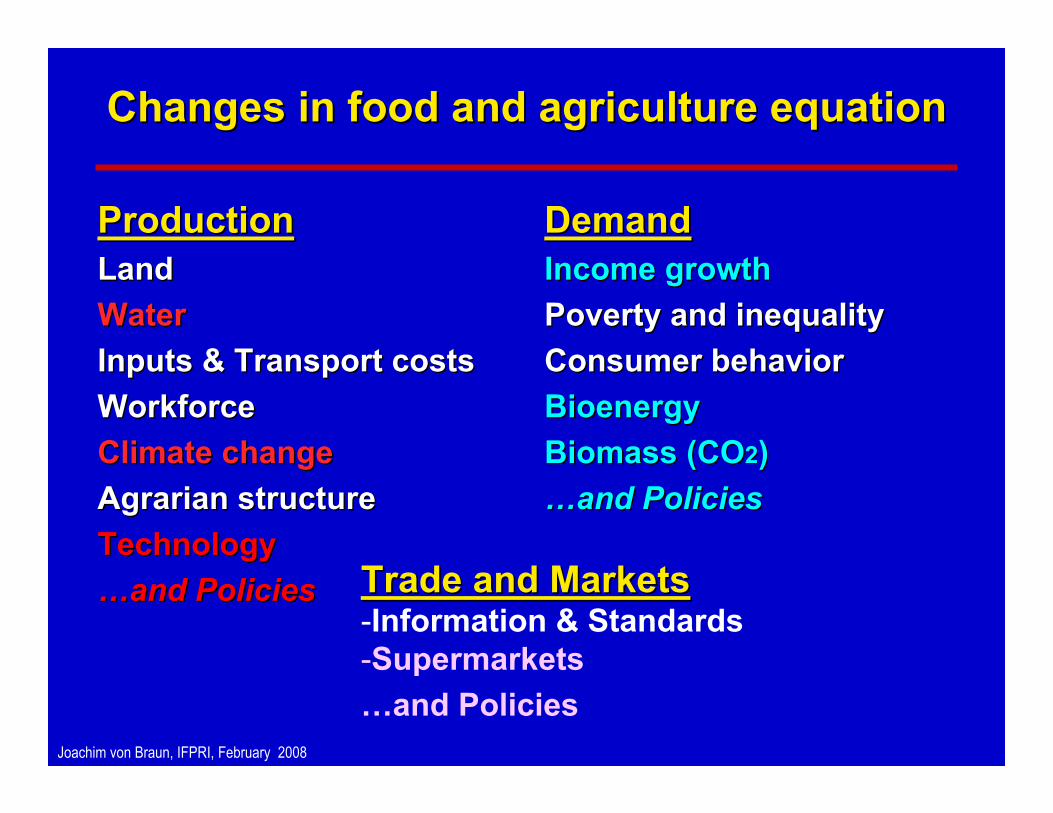
ProductionProductionLand Land WaterWaterInputs & Transport costs Inputs & Transport costs WorkforceWorkforceClimate changeClimate changeAgrarian structureAgrarian structureTechnologyTechnology……and Policiesand Policies
DemandDemandIncome growthIncome growthPoverty and inequalityPoverty and inequalityConsumer behaviorConsumer behaviorBioenergyBioenergyBiomass (COBiomass (CO22))……and Policiesand Policies
Trade and processingTrade and processing
Changes in food and agriculture equationChanges in food and agriculture equation
Joachim von Braun, IFPRI, February 2008
DemandDemandIncome growthIncome growthPoverty and inequalityPoverty and inequalityConsumer behaviorConsumer behaviorBioenergyBioenergyBiomass (COBiomass (CO22))……and Policiesand Policies
Trade and MarketsTrade and Markets-Information & Standards-Supermarkets …and Policies
ProductionProductionLand Land WaterWaterInputs & Transport costs Inputs & Transport costs WorkforceWorkforceClimate changeClimate changeAgrarian structureAgrarian structureTechnologyTechnology……and Policiesand Policies
Changes in food and agriculture equationChanges in food and agriculture equation
Joachim von Braun, IFPRI, February 2008
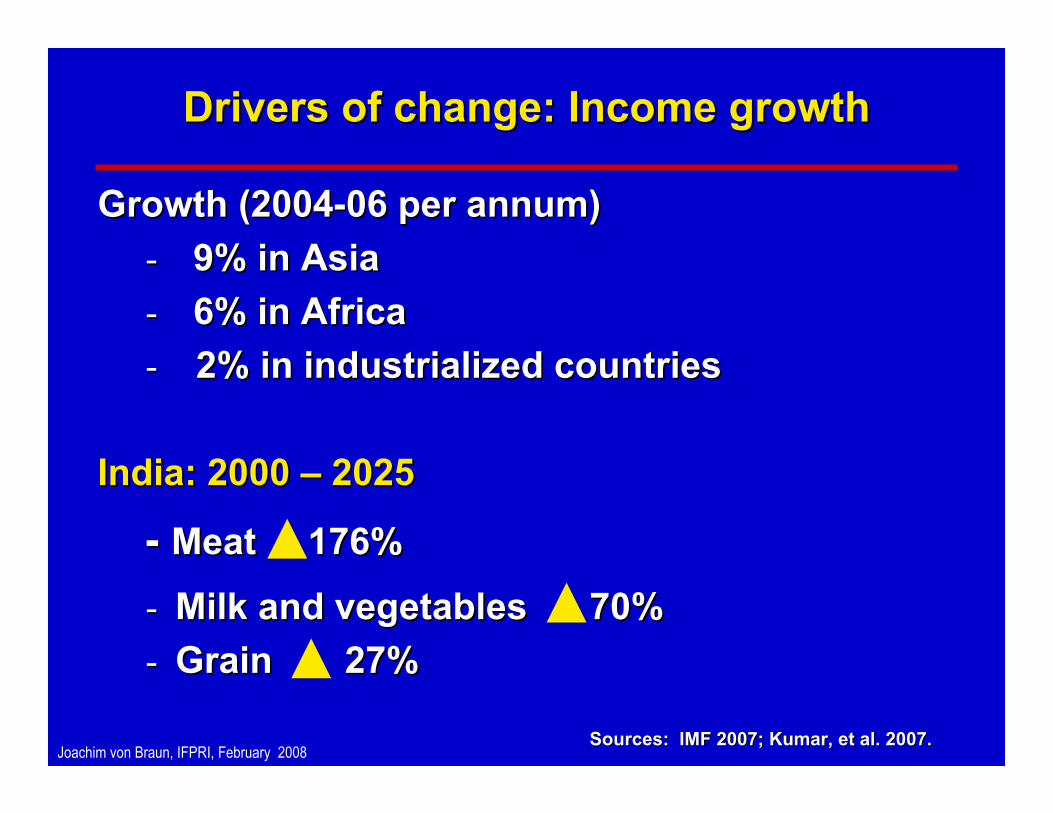
Drivers of change: Income growthDrivers of change: Income growth
Growth (2004Growth (2004--06 per annum)06 per annum)-- 9% in Asia9% in Asia-- 6% in Africa6% in Africa-- 2% in industrialized countries2% in industrialized countries
India: 2000 India: 2000 –– 20252025
-- Meat 176% Meat 176%
-- Milk and vegetables 70%Milk and vegetables 70%-- Grain 27%Grain 27%
Sources: IMF 2007; Kumar, et al. 2007.Sources: IMF 2007; Kumar, et al. 2007.
Joachim von Braun, IFPRI, February 2008
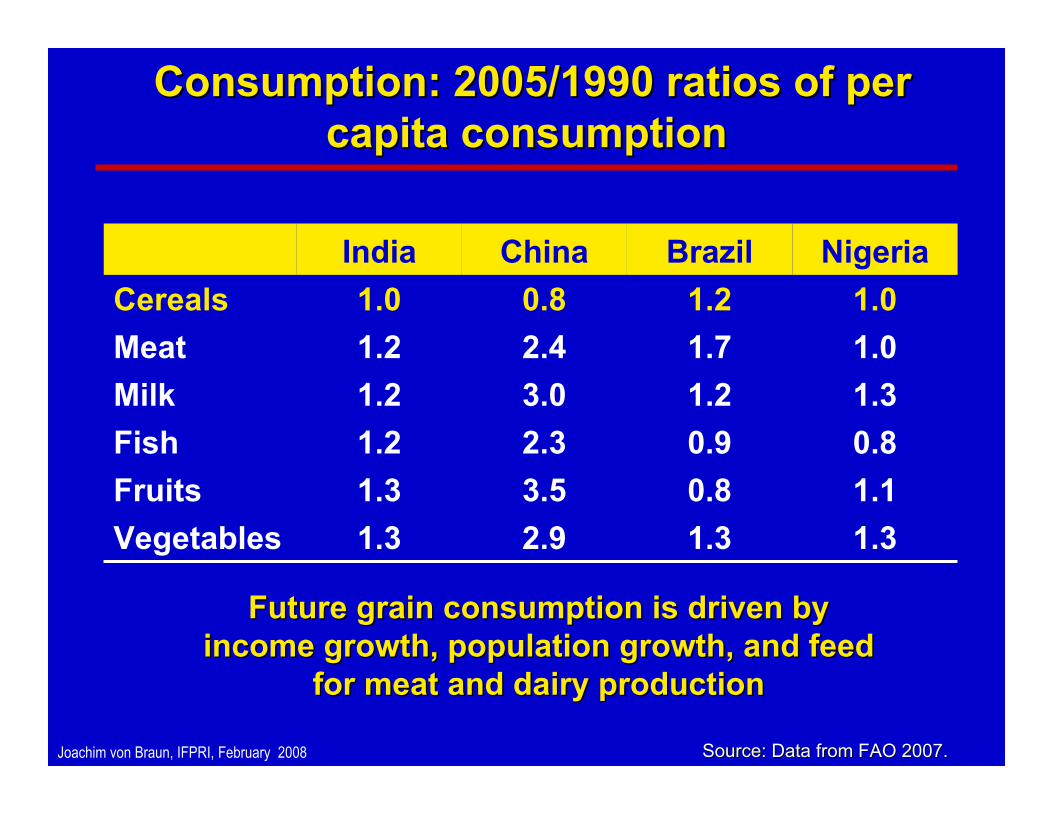
Consumption: 2005/1990 ratios of per Consumption: 2005/1990 ratios of per capita consumptioncapita consumption
1.30.80.91.21.71.2
Brazil
1.32.91.3Vegetables1.13.51.3Fruits0.82.31.2Fish1.33.01.2Milk1.02.41.2Meat1.00.81.0Cereals
NigeriaChinaIndia
Source: Data from FAO 2007.Source: Data from FAO 2007.
Future grain consumption is driven by Future grain consumption is driven by income growth, population growth, and feed income growth, population growth, and feed
for meat and dairy productionfor meat and dairy production
Joachim von Braun, IFPRI, February 2008
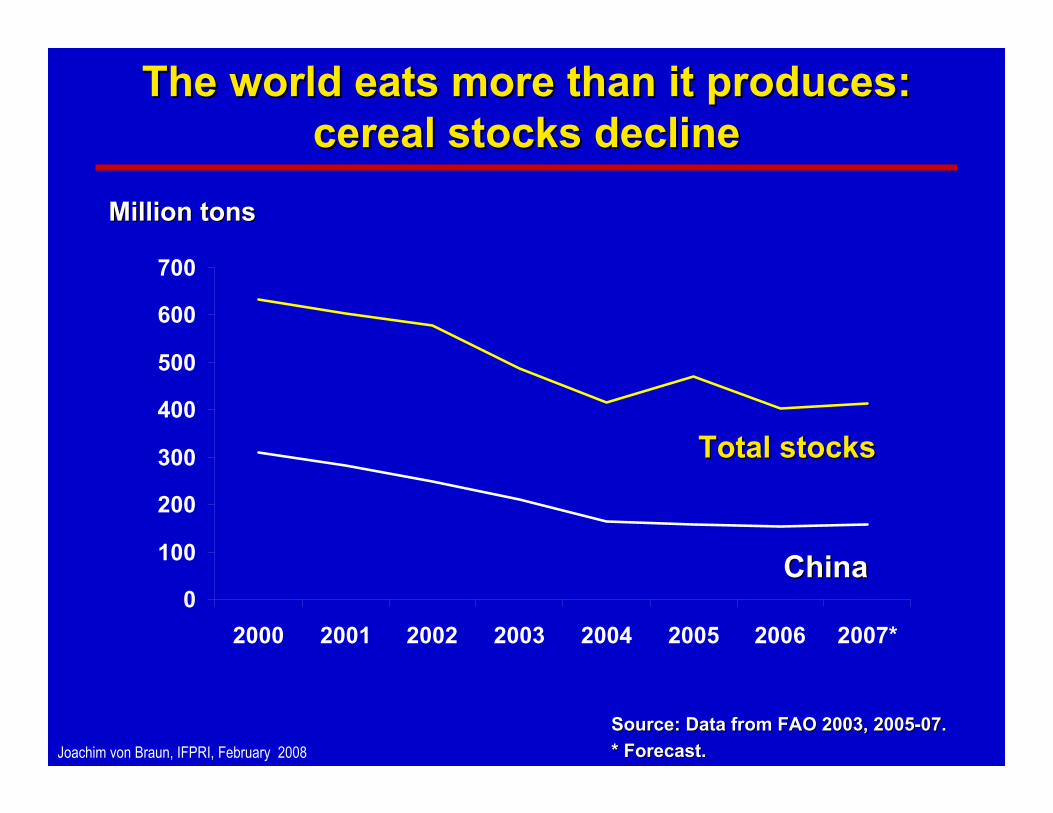
The world eats more than it produces: The world eats more than it produces: cereal stocks declinecereal stocks decline
0
100
200
300
400
500
600
700
2000 2001 2002 2003 2004 2005 2006 2007*
Source: Data from FAO 2003, 2005Source: Data from FAO 2003, 2005--07.07.* Forecast.* Forecast.
Million tonsMillion tons
Total stocksTotal stocks
ChinaChina
Joachim von Braun, IFPRI, February 2008
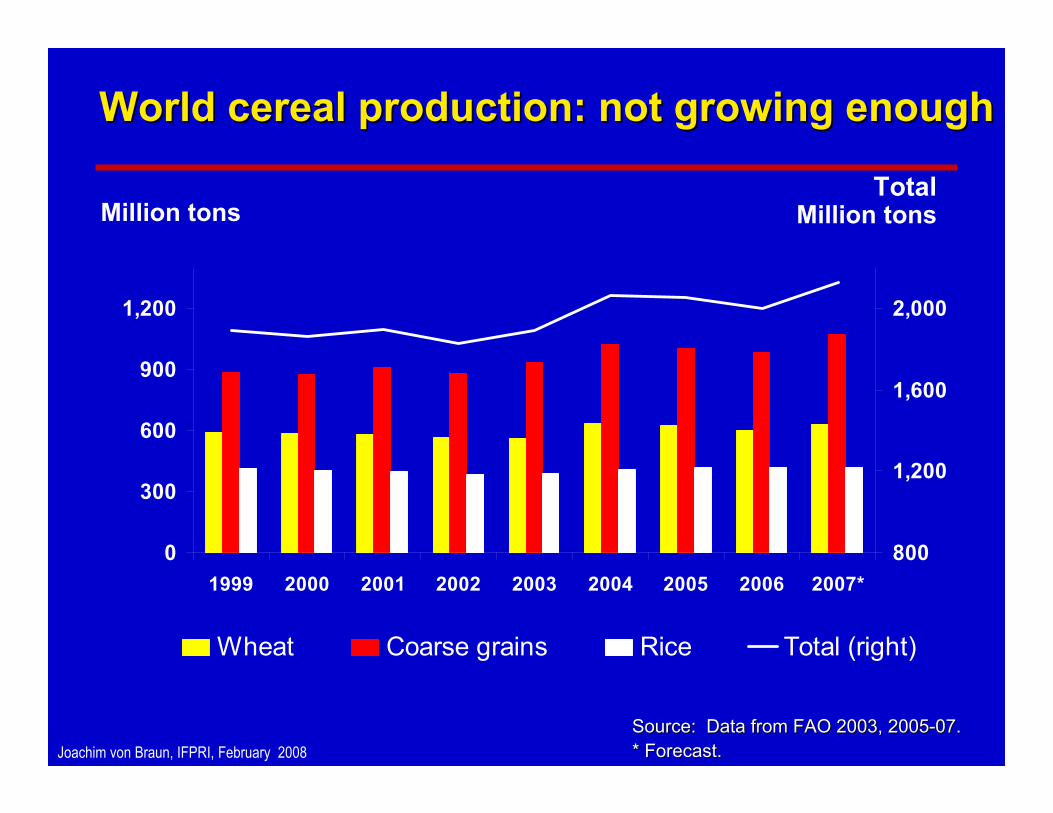
World cereal production: not growing enoughWorld cereal production: not growing enough
0
300
600
900
1,200
1999 2000 2001 2002 2003 2004 2005 2006 2007*800
1,200
1,600
2,000
Wheat Coarse grains Rice Total (right)
Source: Data from FAO 2003, 2005Source: Data from FAO 2003, 2005--07.07.* Forecast.* Forecast.
Million tonsTotal
Million tons
Joachim von Braun, IFPRI, February 2008
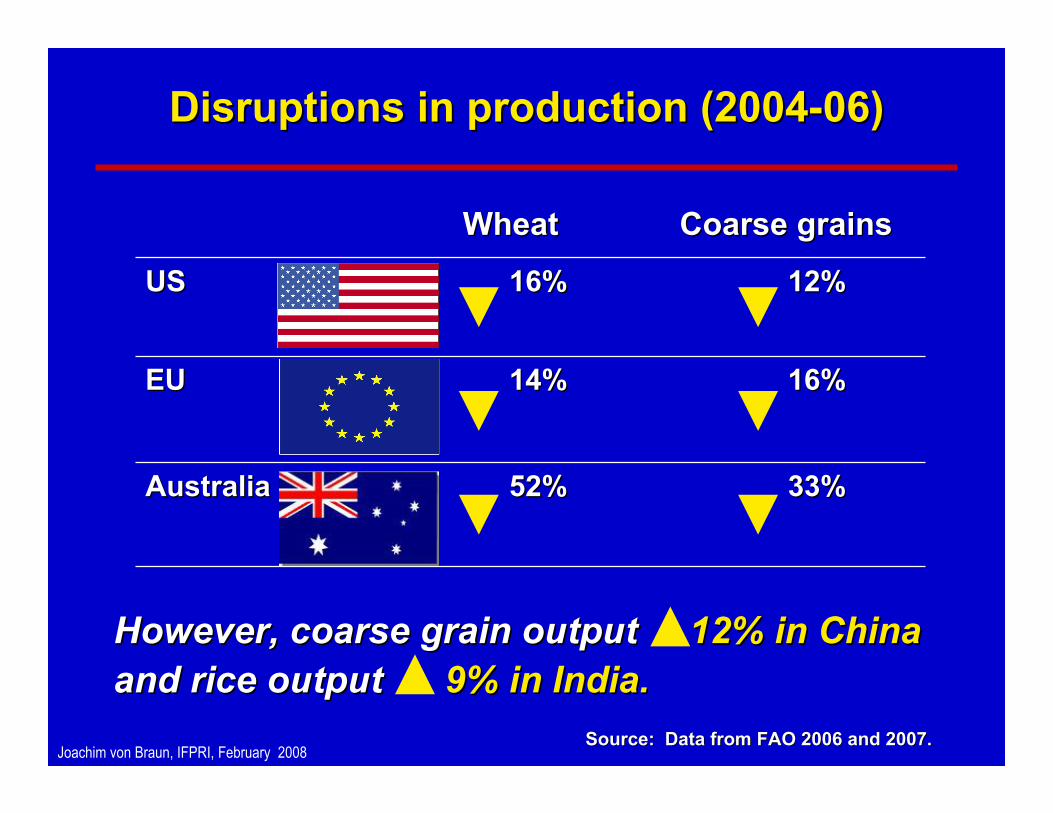
Disruptions in production (2004Disruptions in production (2004--06)06)
However, coarse grain outputHowever, coarse grain output 12% in China12% in Chinaand rice output and rice output 9% in India.9% in India.
16%16%14%14%EUEU
33%33%52%52%AustraliaAustralia
12%12%16%16%USUS
Coarse grainsCoarse grainsWheatWheat
Source: Data from FAO 2006 and 2007.Source: Data from FAO 2006 and 2007.
Joachim von Braun, IFPRI, February 2008
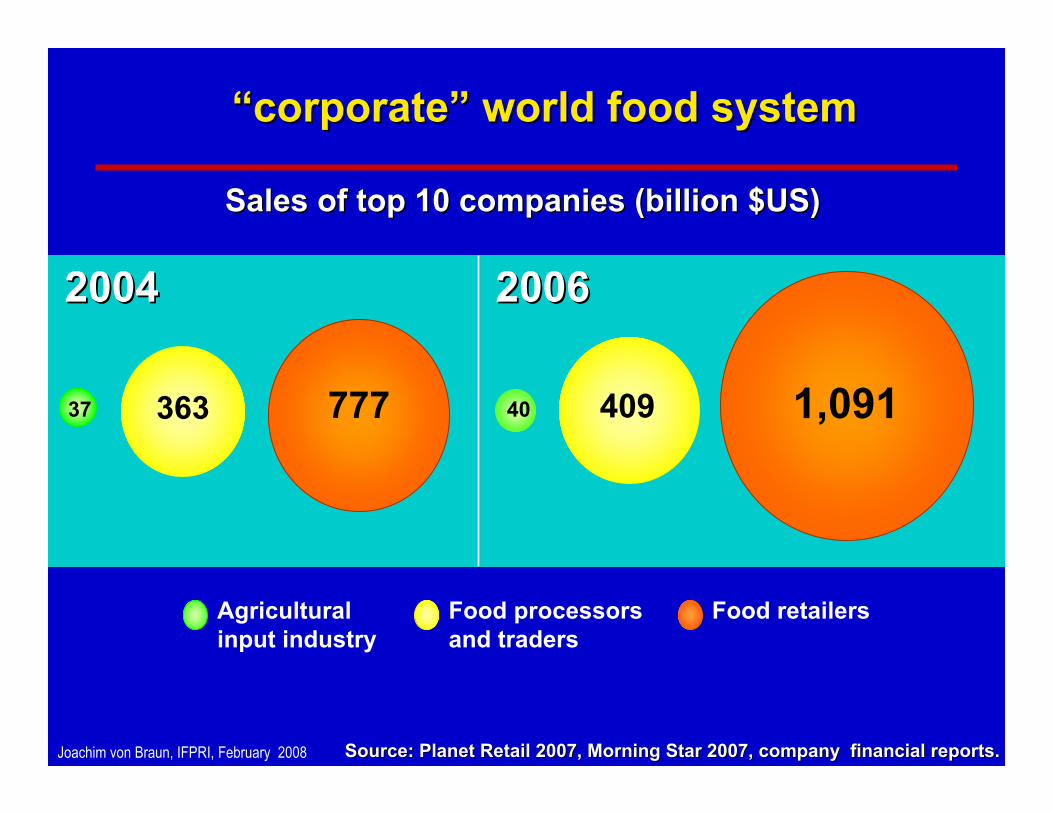
““corporatecorporate”” world food systemworld food system
Sales of top 10 companies (billion $US)Sales of top 10 companies (billion $US)
Source: Planet Retail 2007, Morning Star 2007, company financiaSource: Planet Retail 2007, Morning Star 2007, company financial reports.l reports.
20042004 20062006
Agricultural input industry
Food processors and traders
Food retailers
1,0914094077736337
Joachim von Braun, IFPRI, February 2008
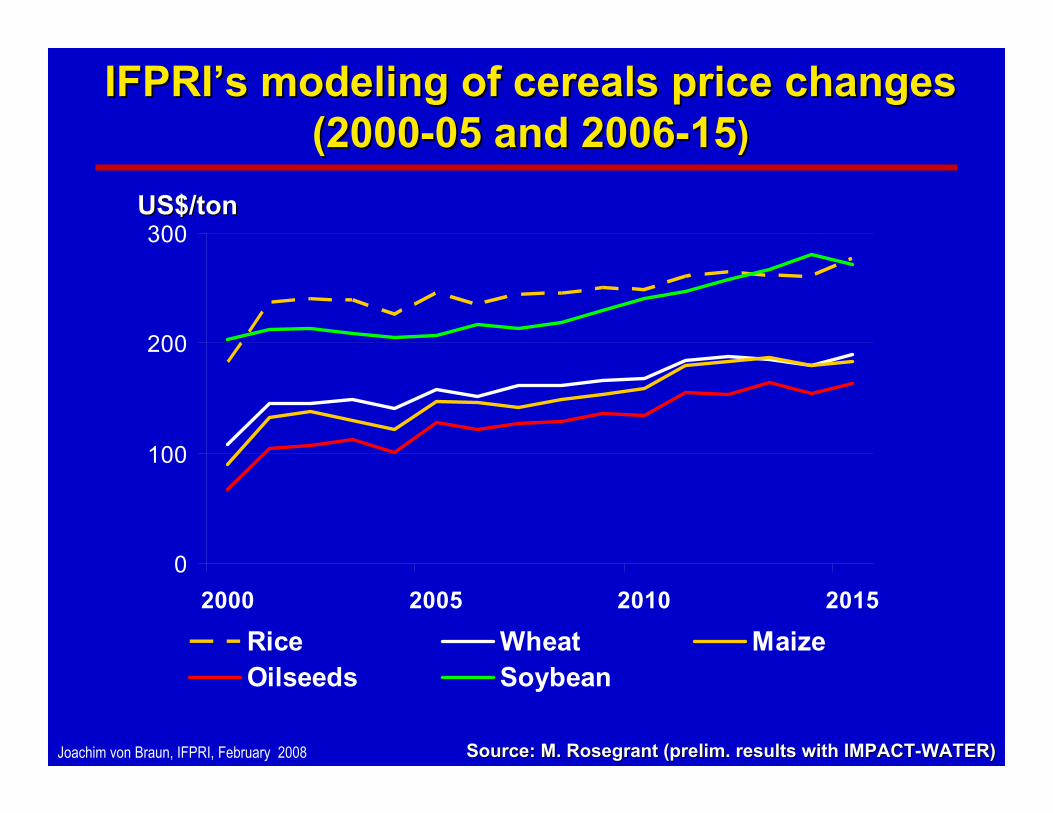
IFPRIIFPRI’’ss modeling of cereals price changes modeling of cereals price changes (2000(2000--05 and 200605 and 2006--1515))
Source: M. Rosegrant (prelim. results with IMPACTSource: M. Rosegrant (prelim. results with IMPACT--WATER) WATER)
0
100
200
300
2000 2005 2010 2015
Rice Wheat MaizeOilseeds Soybean
US$/ton US$/ton
Joachim von Braun, IFPRI, February 2008
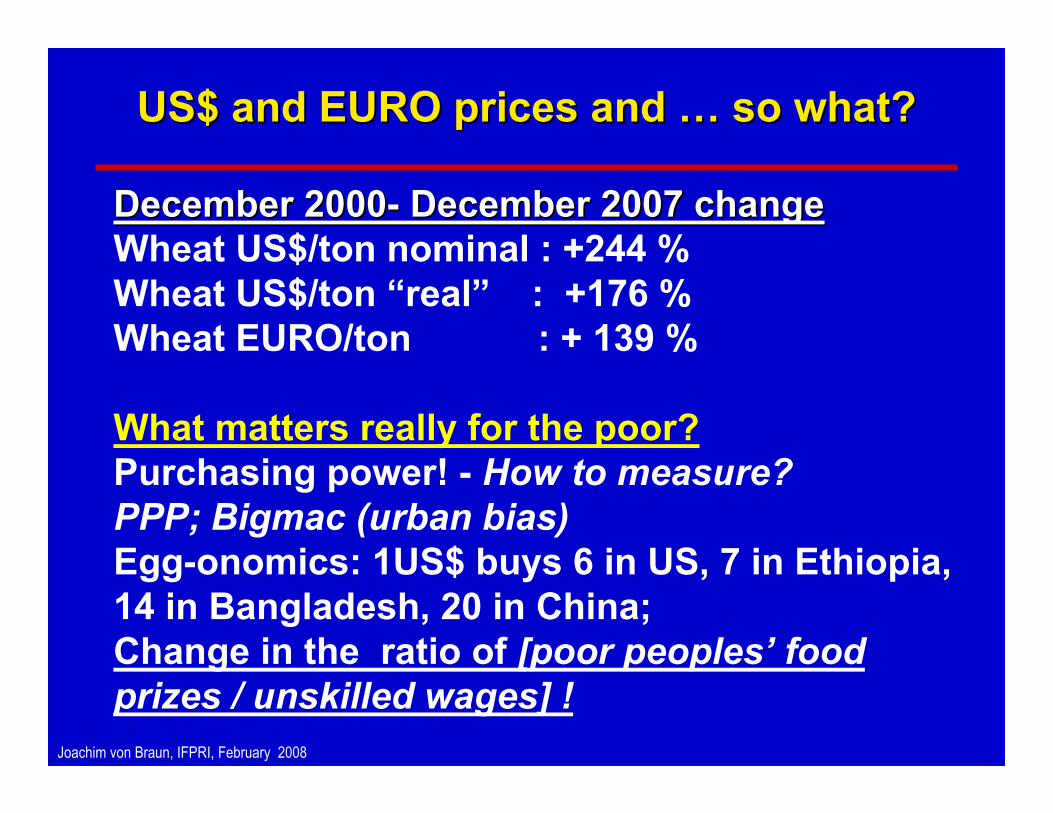
US$ and EURO prices and US$ and EURO prices and …… so what? so what?
December 2000December 2000-- December 2007 changeDecember 2007 changeWheat US$/ton nominal : +244 %Wheat US$/ton “real” : +176 %Wheat EURO/ton : + 139 %
What matters really for the poor?Purchasing power! - How to measure? PPP; Bigmac (urban bias)Egg-onomics: 1US$ buys 6 in US, 7 in Ethiopia, 14 in Bangladesh, 20 in China; Change in the ratio of [poor peoples’ food prizes / unskilled wages] !
Joachim von Braun, IFPRI, February 2008
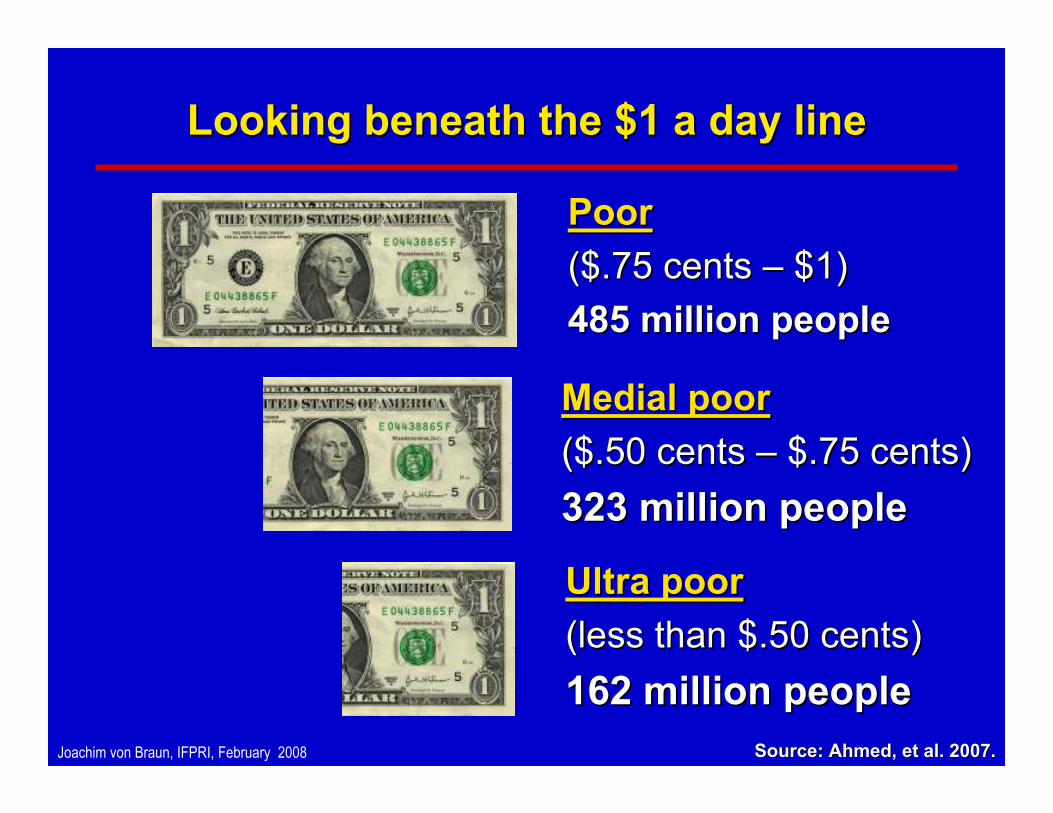
Looking beneath the $1 a day lineLooking beneath the $1 a day line
PoorPoor($.75 cents ($.75 cents –– $1)$1)485 million people485 million people
Medial poorMedial poor($.50 cents ($.50 cents –– $.75 cents)$.75 cents)323 million people323 million people
Ultra poorUltra poor((less than $.50 cents)less than $.50 cents)162 million people162 million people
Source: Ahmed, et al. 2007.Source: Ahmed, et al. 2007.
Joachim von Braun, IFPRI, February 2008
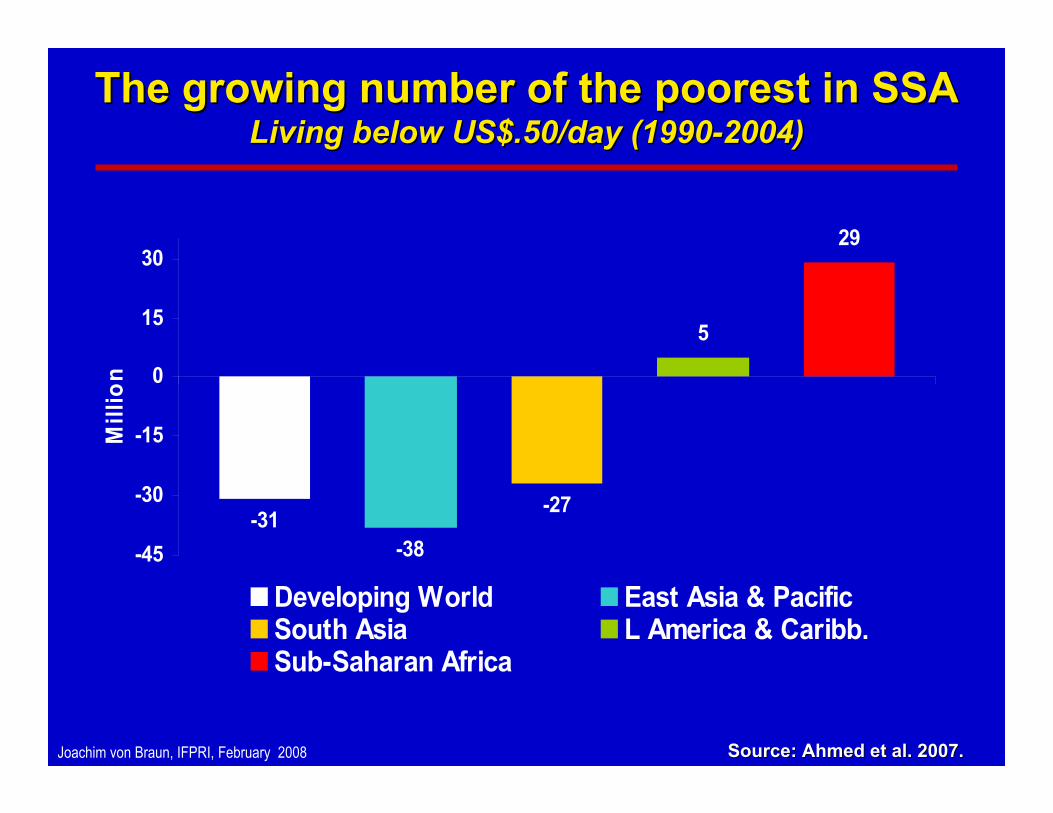
-31-38
-27
5
29
-45
-30
-15
0
15
30
Developing World East Asia & PacificSouth Asia L America & Caribb.Sub-Saharan Africa
Mill
ion
The growing number of the poorest in SSA The growing number of the poorest in SSA Living below US$.50/day (1990Living below US$.50/day (1990--2004)2004)
Source: Ahmed et al. 2007.Source: Ahmed et al. 2007.
Joachim von Braun, IFPRI, February 2008
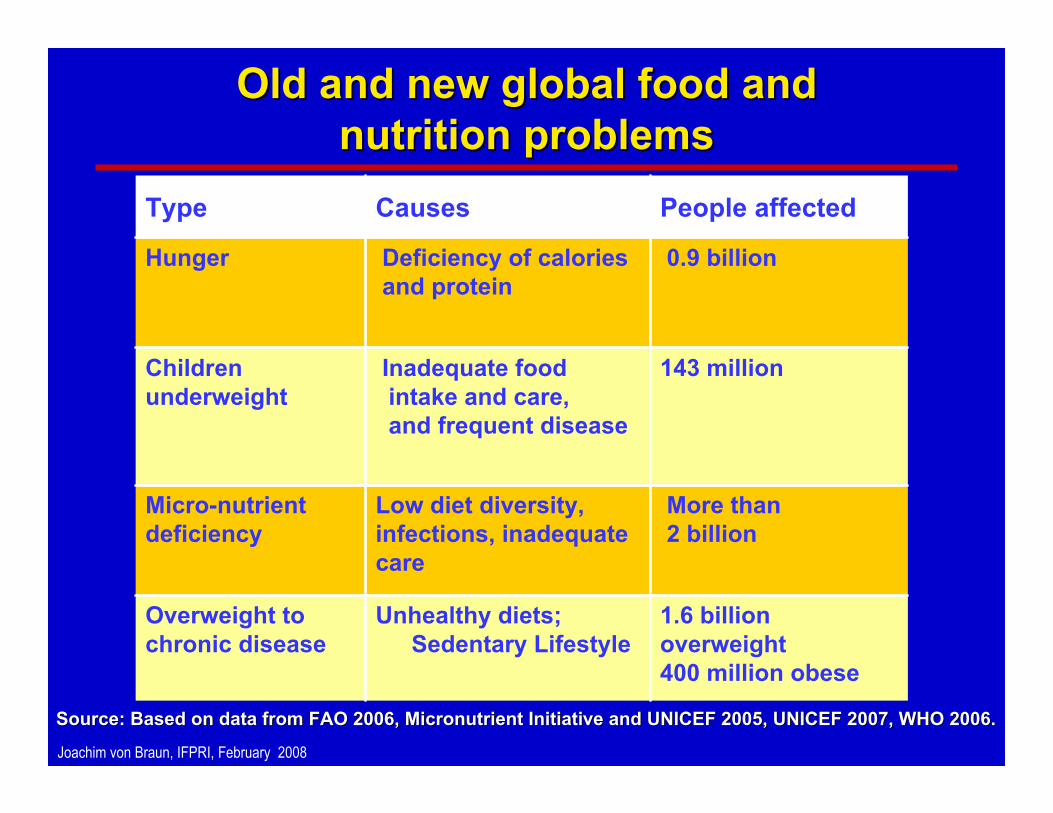
Old and new global food and Old and new global food and nutrition problemsnutrition problems
Source: Based on data from Source: Based on data from FAO 2006, Micronutrient Initiative and UNICEF 2005, UNICEF 2007,FAO 2006, Micronutrient Initiative and UNICEF 2005, UNICEF 2007, WHO 2006.WHO 2006.
1.6 billion overweight400 million obese
Unhealthy diets; Sedentary Lifestyle
Overweight to chronic disease
More than2 billion
Low diet diversity, infections, inadequate care
Micro-nutrient deficiency
143 millionInadequate food intake and care,and frequent disease
Children underweight
0.9 billionDeficiency of calories and protein
Hunger
People affected CausesType
Joachim von Braun, IFPRI, February 2008
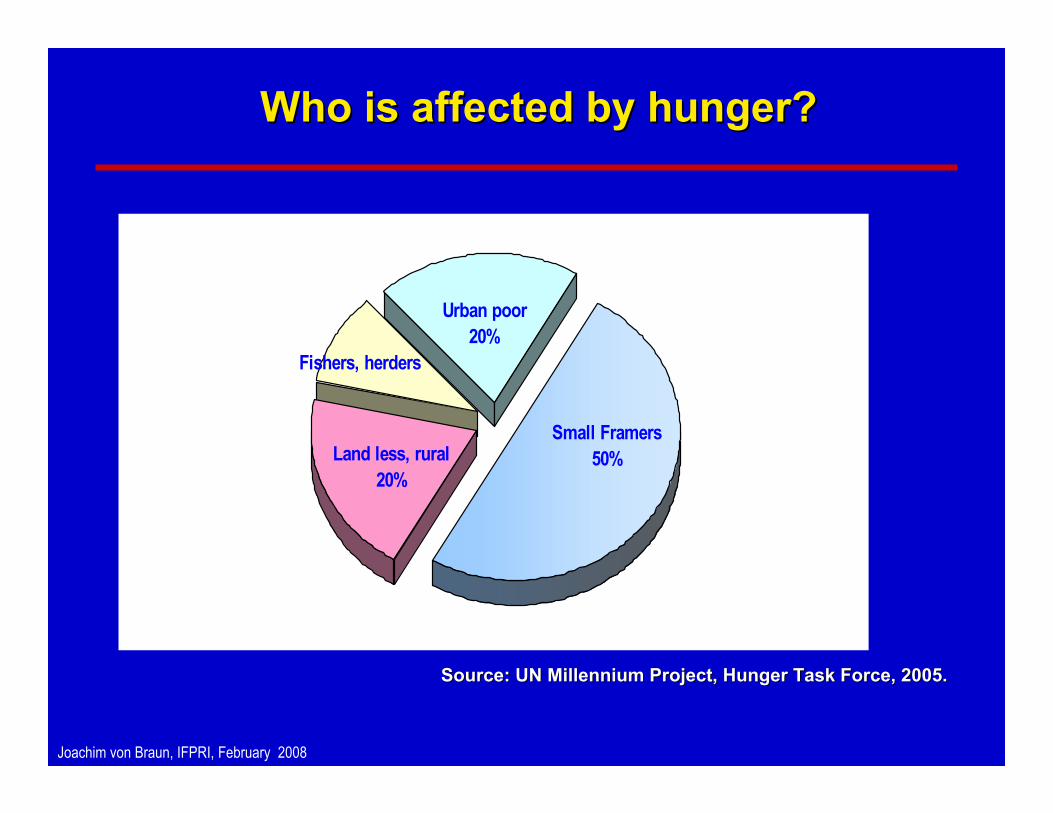
Who is affected by hunger? Who is affected by hunger?
Source: UN Millennium Project, Hunger Task Force, 2005.Source: UN Millennium Project, Hunger Task Force, 2005.
Land less, rural 20%
Urban poor20%
Small Framers50%
Fishers, herders
Joachim von Braun, IFPRI, February 2008
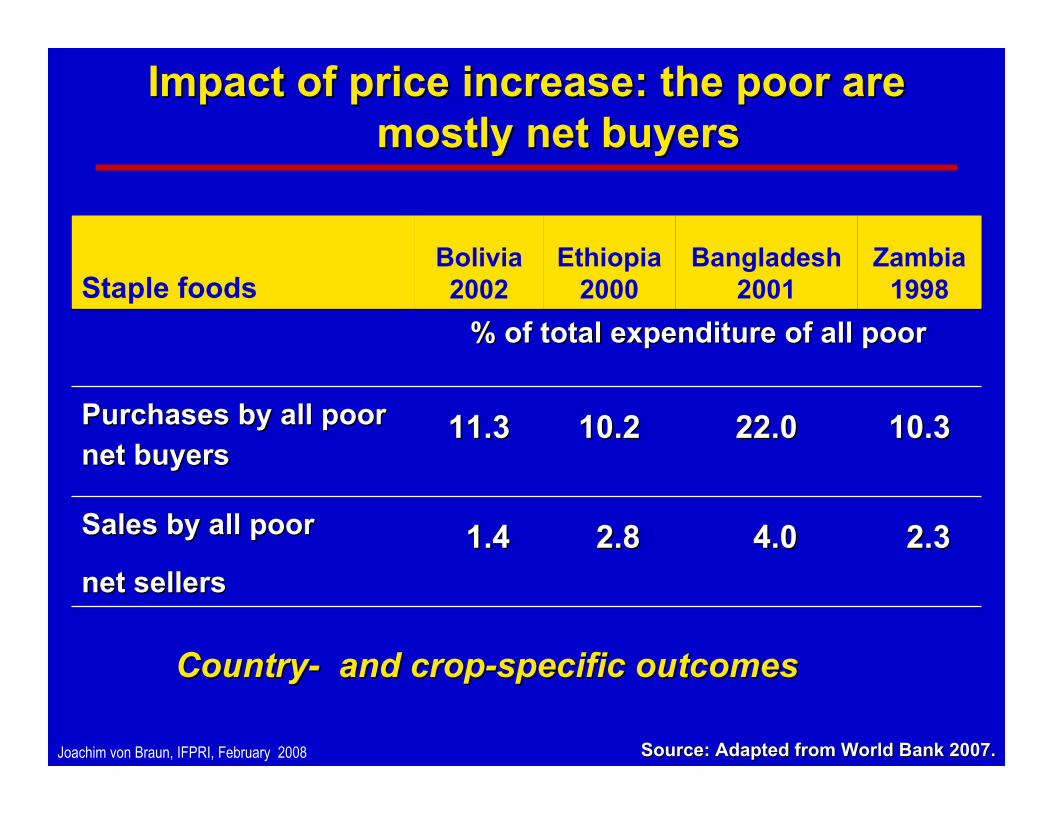
Impact of price increase: the poor are Impact of price increase: the poor are mostly net buyersmostly net buyers
Source: Adapted from World Bank 2007.Source: Adapted from World Bank 2007.
CountryCountry-- and cropand crop--specific outcomesspecific outcomes
% of total expenditure of all poor% of total expenditure of all poor
2.32.34.04.02.82.81.41.4Sales by all poor Sales by all poor
net sellersnet sellers
10.310.322.022.010.210.211.311.3Purchases by all poor Purchases by all poor net buyersnet buyers
Zambia1998
Bangladesh2001
Ethiopia2000
Bolivia2002Staple foods
Joachim von Braun, IFPRI, February 2008
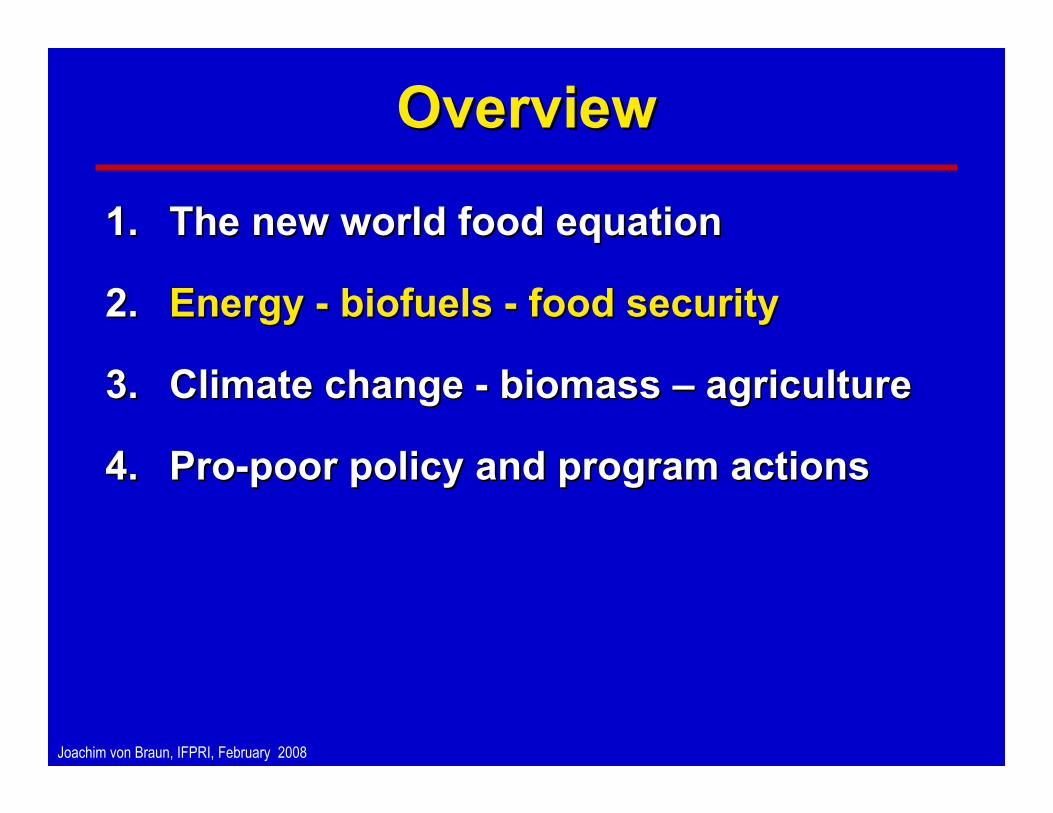
Overview Overview
1.1. The new world food equationThe new world food equation
2.2. Energy Energy -- biofuelsbiofuels -- food securityfood security
3.3. Climate change Climate change -- biomass biomass –– agriculture agriculture
4.4. ProPro--poor policy and program actionspoor policy and program actions
Joachim von Braun, IFPRI, February 2008
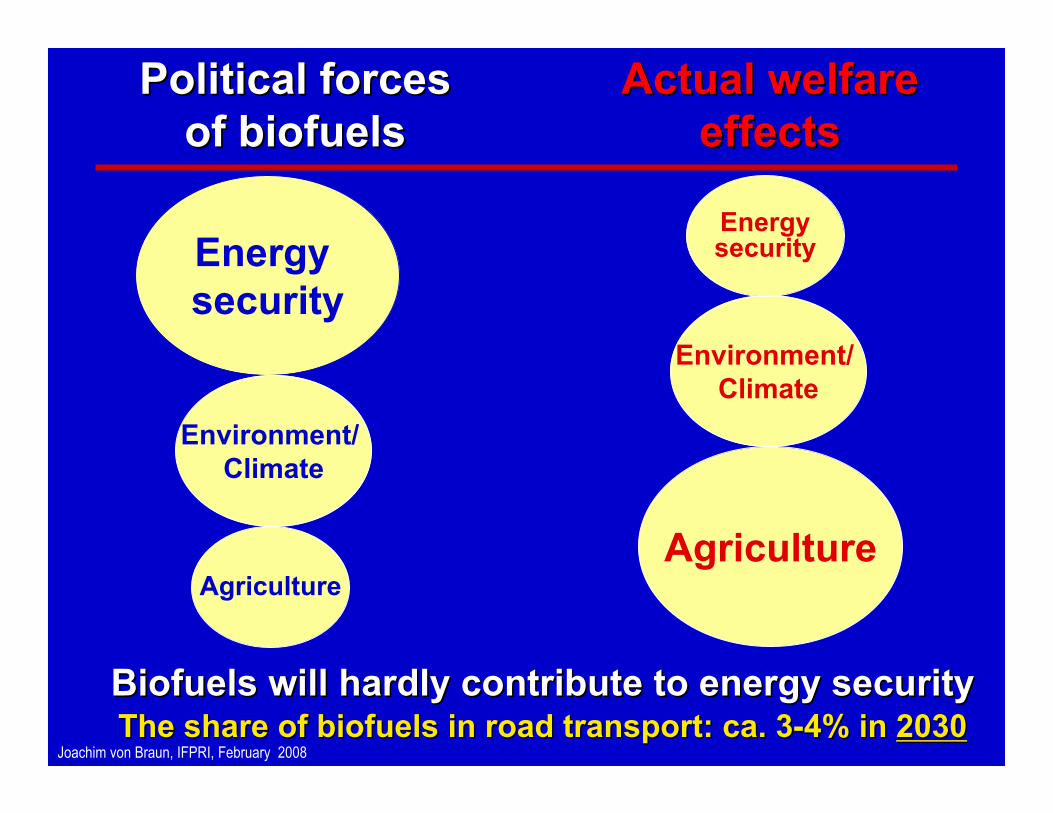
Political forces Political forces of biofuelsof biofuels
Energy security
Environment/ Climate
Agriculture
Actual welfare Actual welfare effectseffects
Biofuels will hardly contribute to energy securityBiofuels will hardly contribute to energy securityThe share of biofuels in road transport: ca. 3The share of biofuels in road transport: ca. 3--4% in 4% in 20302030
Agriculture
Environment/ Climate
Energysecurity
Joachim von Braun, IFPRI, February 2008
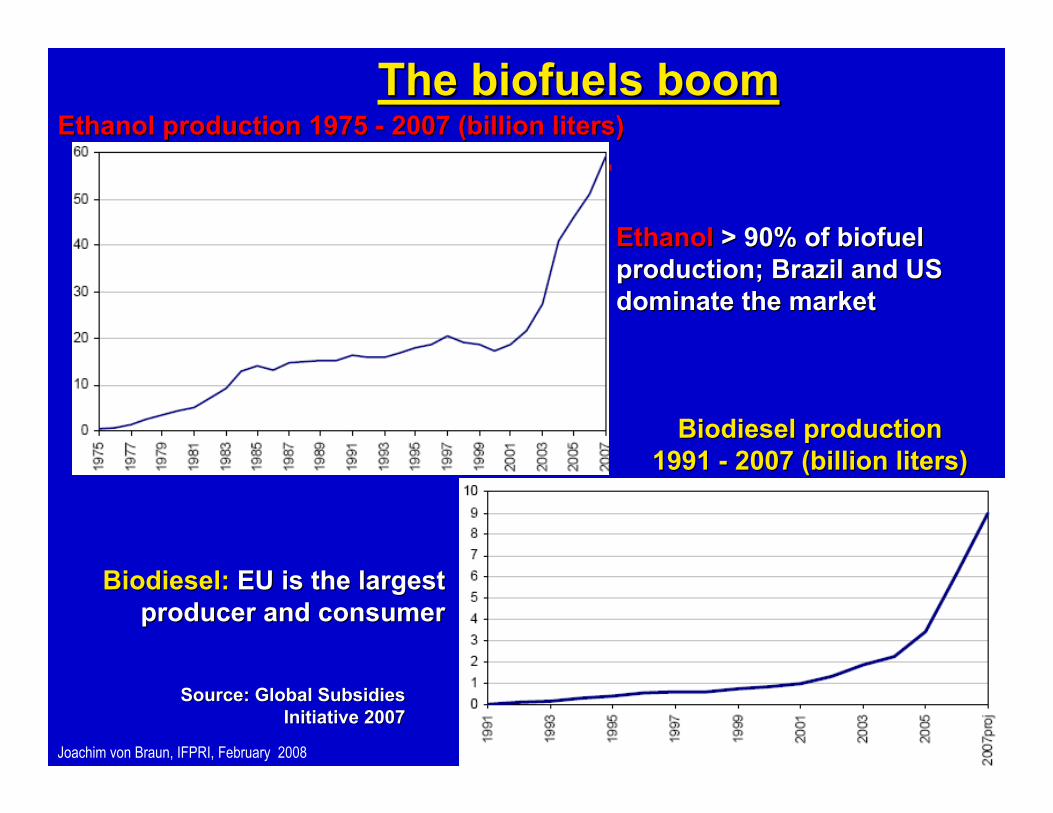
Source: Global Subsidies Source: Global Subsidies Initiative 2007Initiative 2007
The biofuels boomThe biofuels boomEthanol production 1975 Ethanol production 1975 -- 2007 (billion liters)2007 (billion liters)
BiodieselBiodiesel production production 1991 1991 -- 2007 (billion liters)2007 (billion liters)
EthanolEthanol > 90% of biofuel > 90% of biofuel production; Brazil and US production; Brazil and US dominate the marketdominate the market
Biodiesel:Biodiesel: EU is the largest EU is the largest producer and consumerproducer and consumer
Joachim von Braun, IFPRI, February 2008
BiofuelsBiofuels: fundamental change in world : fundamental change in world food price determination food price determination
Energy prices always affected agricultural Energy prices always affected agricultural prices through prices through inputsinputs, i.e. P of fertilizer, , i.e. P of fertilizer, pesticides, irrigation, transport pesticides, irrigation, transport
Now, energy prices also affect agricultural Now, energy prices also affect agricultural outputoutput prices strongly via opportunity costsprices strongly via opportunity costs
Large and elastic energy demand creates Large and elastic energy demand creates price price floors and price bandsfloors and price bands for agricultural for agricultural commoditiescommodities
Source: Schmidhuber 2007.Source: Schmidhuber 2007.
Joachim von Braun, IFPRI, February 2008
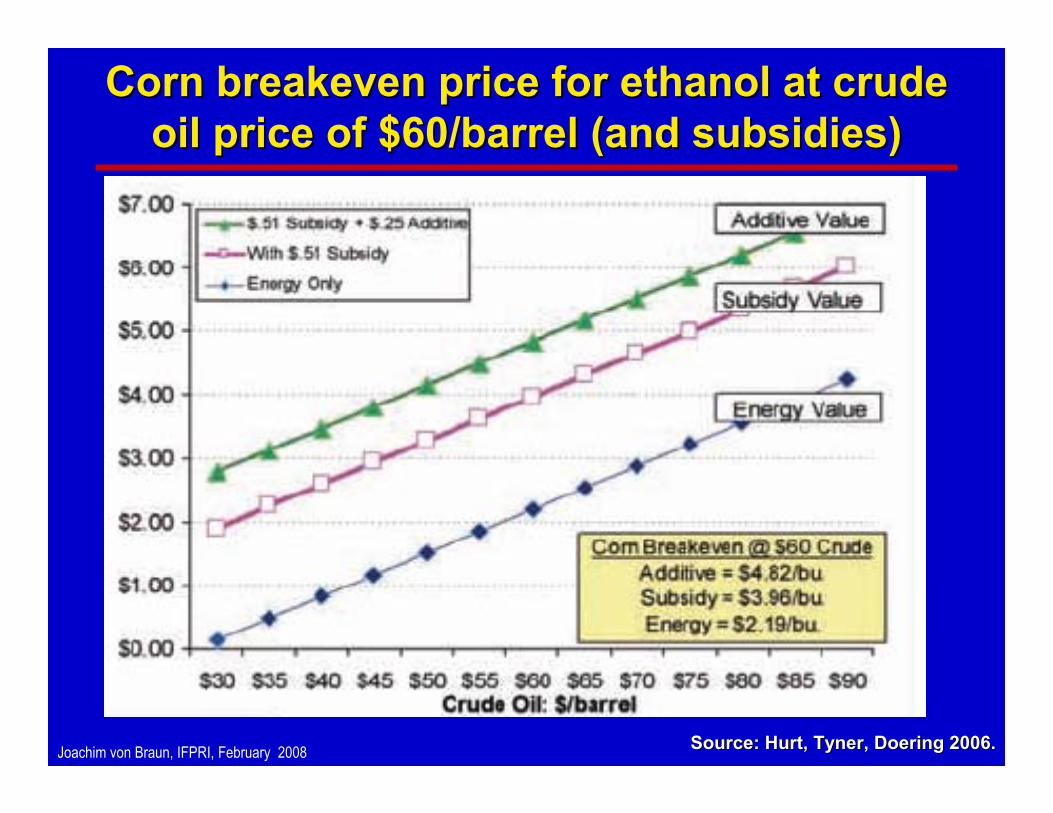
Corn breakeven price for ethanol at crude Corn breakeven price for ethanol at crude oil price of $60/barrel (and subsidies)oil price of $60/barrel (and subsidies)
Source: Hurt, Tyner, Doering 2006.Source: Hurt, Tyner, Doering 2006.
Joachim von Braun, IFPRI, February 2008
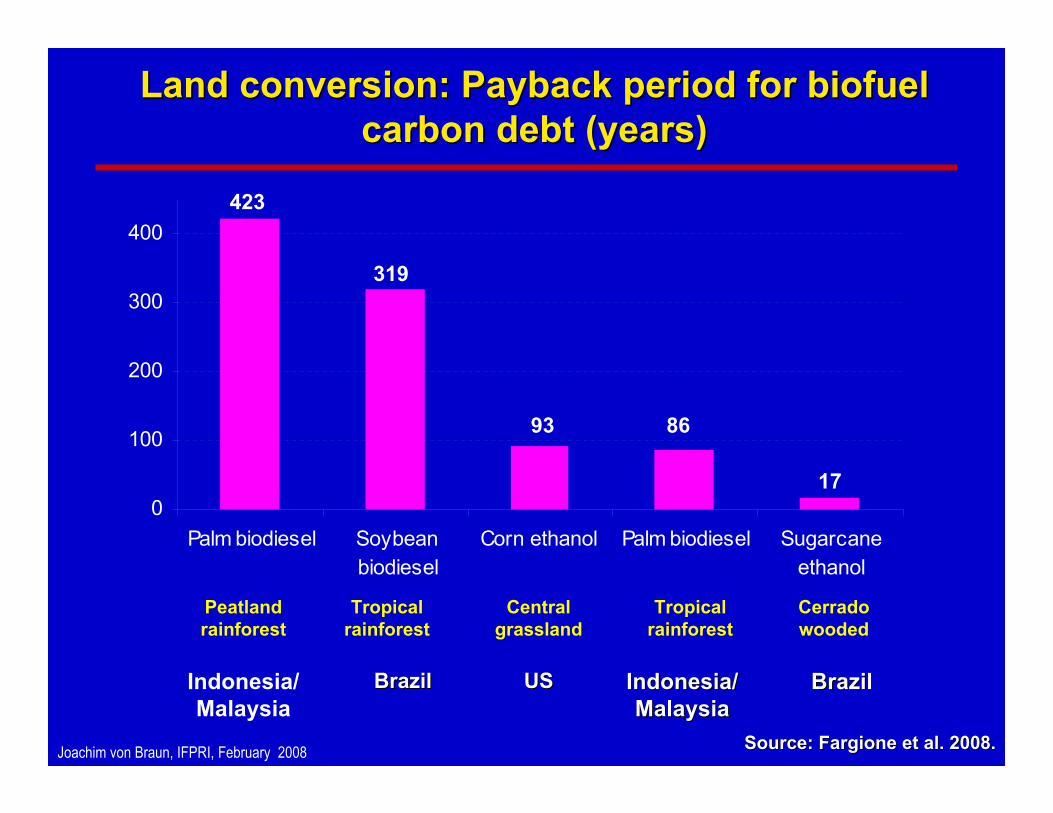
Land conversion: Payback period for biofuel Land conversion: Payback period for biofuel carbon debt (years)carbon debt (years)
0
100
200
300
400
Palm biodiesel Soybeanbiodiesel
Corn ethanol Palm biodiesel Sugarcaneethanol
Indonesia/Malaysia
BrazilBrazil USUS BrazilBrazilIndonesia/Indonesia/MalaysiaMalaysia
Peatlandrainforest
Tropical rainforest
Central grassland
Cerradowooded
Tropical rainforest
423
319
93 86
17
Source: Fargione et al. 2008.Source: Fargione et al. 2008.
Joachim von Braun, IFPRI, February 2008
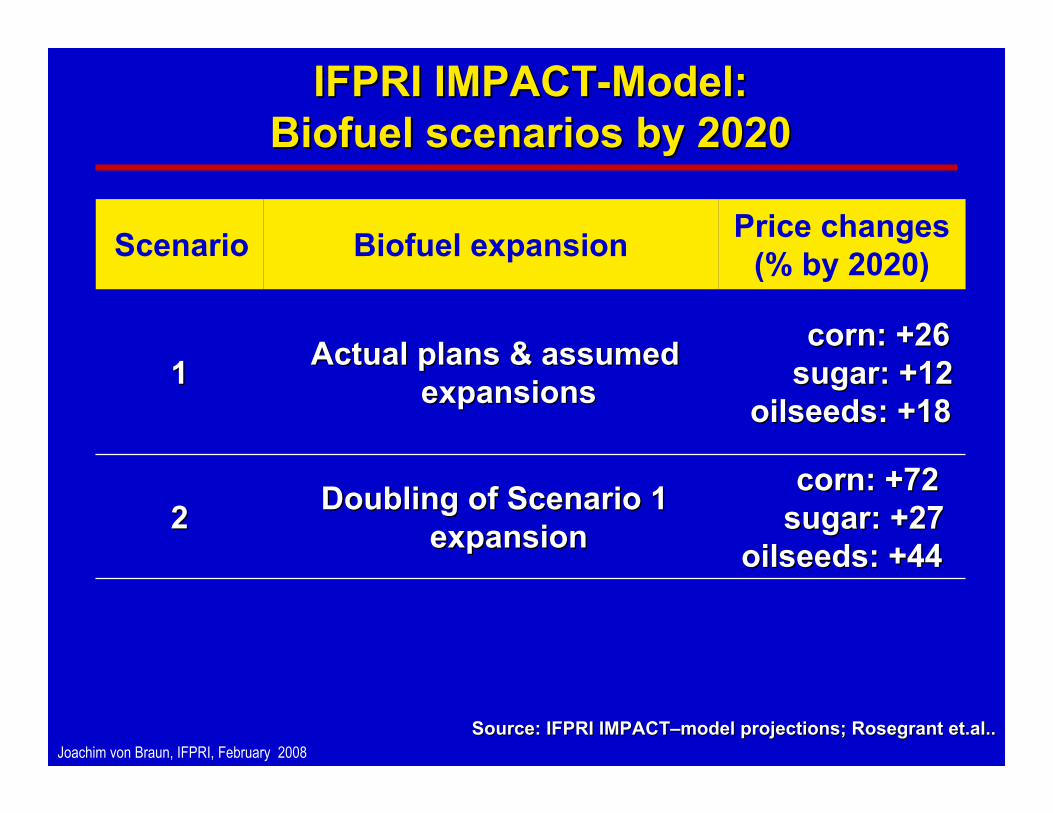
IFPRI IMPACTIFPRI IMPACT--Model: Model: BiofuelBiofuel scenarios by 2020scenarios by 2020
corn: +72corn: +72sugar: +27sugar: +27
oilseeds: +44oilseeds: +44
Doubling of Scenario 1 Doubling of Scenario 1 expansionexpansion22
corn: +26corn: +26sugar: +12sugar: +12
oilseeds: +18oilseeds: +18
Actual plans & assumed Actual plans & assumed expansionsexpansions11
Price changes(% by 2020)Biofuel expansionScenario
Source: IFPRI IMPACTSource: IFPRI IMPACT––model projections; model projections; RosegrantRosegrant et.alet.al.. ..
Joachim von Braun, IFPRI, February 2008
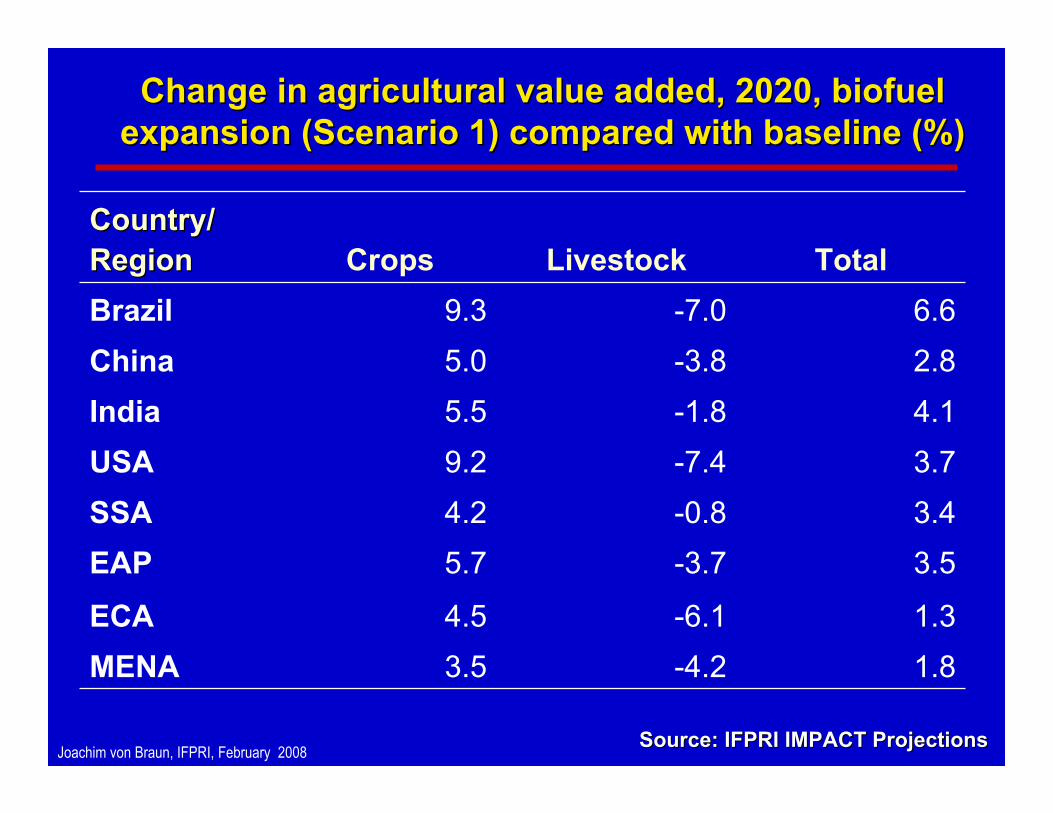
Change in agricultural value added, 2020, biofuel Change in agricultural value added, 2020, biofuel expansion (Scenario 1) compared with baseline (%)expansion (Scenario 1) compared with baseline (%)
Source: IFPRI IMPACT ProjectionsSource: IFPRI IMPACT Projections
1.8-4.23.5MENA1.3-6.14.5ECA
3.5-3.75.7EAP3.4-0.84.2SSA3.7-7.49.2USA4.1-1.85.5India2.8-3.85.0China6.6-7.09.3Brazil
TotalLivestockCropsCountry/Country/RegionRegion
Joachim von Braun, IFPRI, February 2008
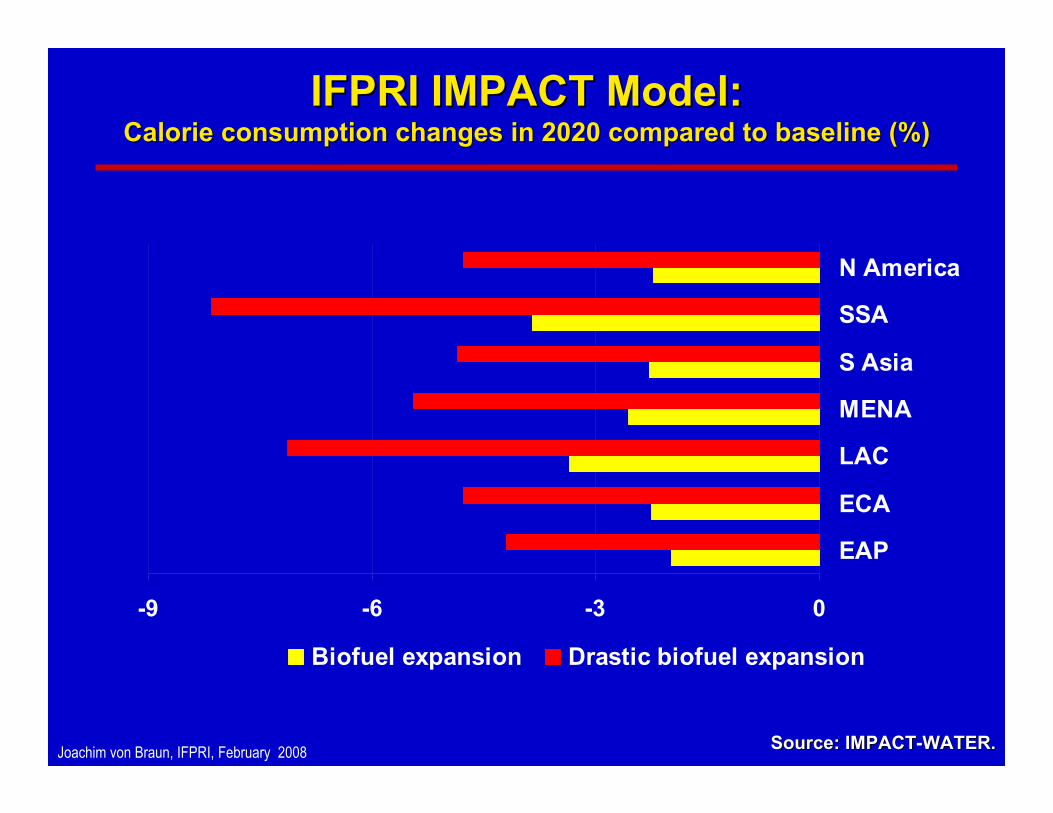
IFPRI IMPACT Model:IFPRI IMPACT Model:Calorie consumption changes in 2020 compared to baseline (%)Calorie consumption changes in 2020 compared to baseline (%)
Source: IMPACTSource: IMPACT--WATER.WATER.
-9 -6 -3 0
EAP
ECA
LAC
MENA
S Asia
SSA
N America
Biofuel expansion Drastic biofuel expansion
Joachim von Braun, IFPRI, February 2008
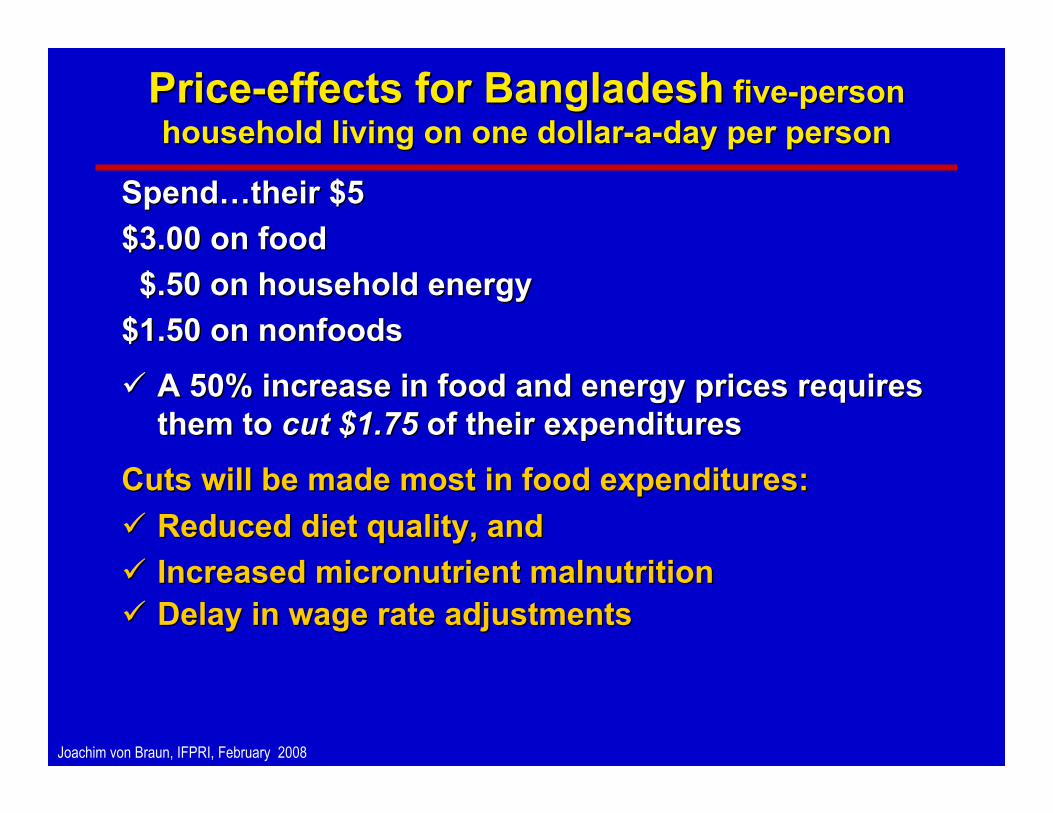
PricePrice--effects for Bangladesheffects for Bangladesh fivefive--person person household living on one dollarhousehold living on one dollar--aa--day per personday per person
SpendSpend……their $5their $5$3.00$3.00 on foodon food$.50 on household energy $.50 on household energy
$1.50 on$1.50 on nonfoodsnonfoods
A 50% increase in food and energy prices requires A 50% increase in food and energy prices requires them tothem to cut $1.75 cut $1.75 of their expendituresof their expenditures
Cuts will be made most in food expenditures: Cuts will be made most in food expenditures: Reduced diet quality, and Reduced diet quality, and Increased micronutrient malnutritionIncreased micronutrient malnutritionDelay in wage rate adjustmentsDelay in wage rate adjustments
Joachim von Braun, IFPRI, February 2008
Overview Overview
1.1. The new world food equationThe new world food equation
2.2. Energy Energy -- biofuelsbiofuels -- food securityfood security
3.3. Climate change Climate change -- biomass biomass –– agriculture agriculture
4.4. ProPro--poor policy and program actionspoor policy and program actions
Joachim von Braun, IFPRI, February 2008
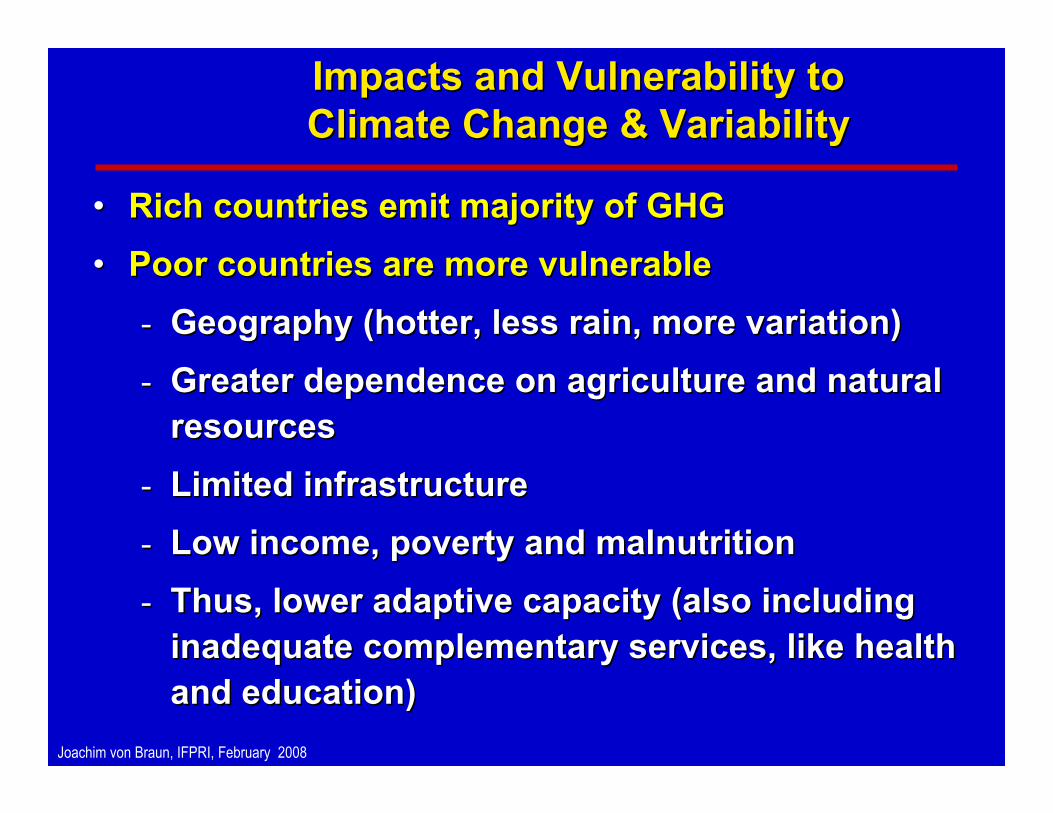
Impacts and Vulnerability to Impacts and Vulnerability to Climate Change & VariabilityClimate Change & Variability
•• Rich countries emit majority of GHG Rich countries emit majority of GHG •• Poor countries are more vulnerablePoor countries are more vulnerable-- Geography (hotter, less rain, more variation)Geography (hotter, less rain, more variation)-- Greater dependence on agriculture and natural Greater dependence on agriculture and natural
resourcesresources-- Limited infrastructureLimited infrastructure-- Low income, poverty and malnutritionLow income, poverty and malnutrition-- Thus, lower adaptive capacity (also including Thus, lower adaptive capacity (also including
inadequate complementary services, like health inadequate complementary services, like health and education)and education)
Joachim von Braun, IFPRI, February 2008
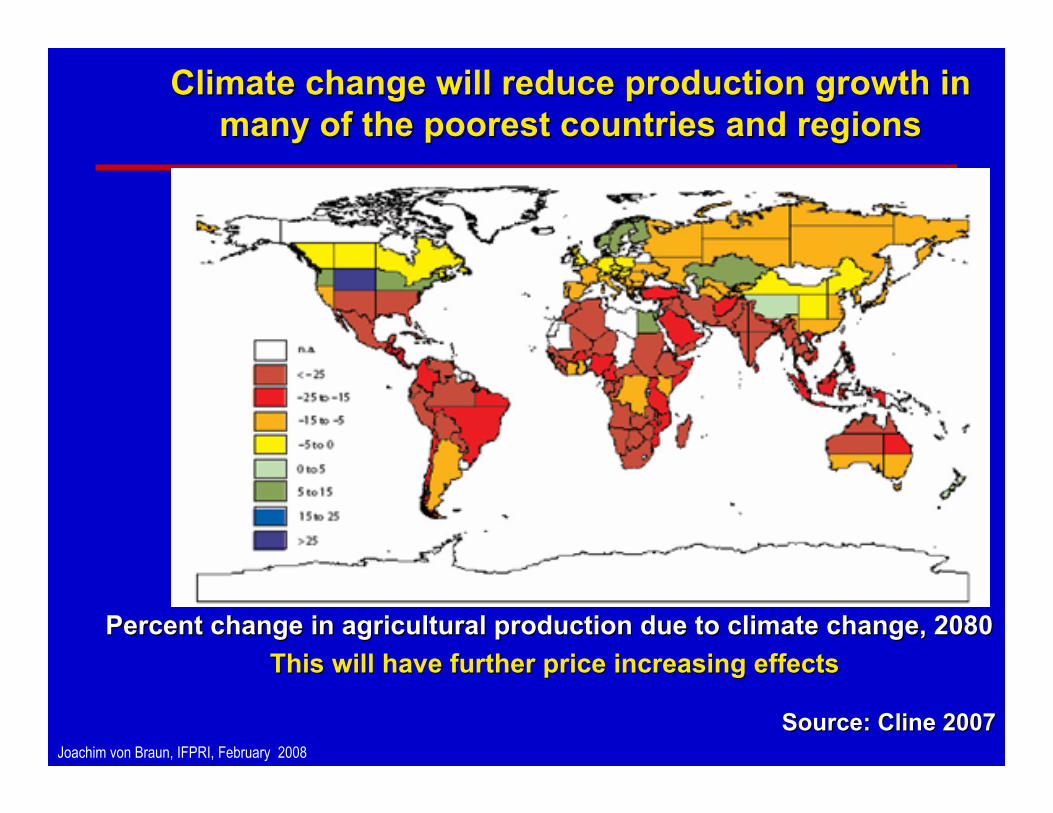
Climate change will reduce production growth in Climate change will reduce production growth in many of the poorest countries and regions many of the poorest countries and regions
Percent change in agricultural production due to climate change,Percent change in agricultural production due to climate change, 2080 2080 This will have further price increasing effectsThis will have further price increasing effects
Source: Cline 2007Source: Cline 2007
Joachim von Braun, IFPRI, February 2008
Much Adaptation is Extension of Much Adaptation is Extension of Good Development PolicyGood Development Policy
•• Promoting growth and diversificationPromoting growth and diversification•• Investing in research and development, Investing in research and development,
education and healtheducation and health•• Creating markets in water and Creating markets in water and
environmental servicesenvironmental services•• Improving international trade systemImproving international trade system•• Enhancing resilience to disasters and Enhancing resilience to disasters and
improving disaster managementimproving disaster management•• Promoting riskPromoting risk--sharing, including social sharing, including social
safety nets, weather insurancesafety nets, weather insurance
Joachim von Braun, IFPRI, February 2008
Effective Adaptation StrategiesEffective Adaptation Strategies
•• Must go beyond good development policy to Must go beyond good development policy to explicitly target the impacts of climate change, explicitly target the impacts of climate change, particularly on the poorparticularly on the poor
•• Market signals Market signals
-- essential factor in determining the necessary essential factor in determining the necessary responses to a changing environmentresponses to a changing environment
-- but involves potentially expensive time lags but involves potentially expensive time lags and overlooks equityand overlooks equity
Climate change adaptation must therefore be proactive, Climate change adaptation must therefore be proactive, not merely reactivenot merely reactive
Joachim von Braun, IFPRI, February 2008
Critical Step toward mitigation: PostCritical Step toward mitigation: Post--Kyoto Kyoto International Climate Change RegimeInternational Climate Change Regime
•• Emissions targets, rates of convergence, and Emissions targets, rates of convergence, and rates of growth in developingrates of growth in developing--country emissionscountry emissions
•• Level of emission allowances for developing Level of emission allowances for developing countriescountries
•• Level of caps by sector and industryLevel of caps by sector and industry•• Incentives for international carbon tradeIncentives for international carbon trade
All influence the regimeAll influence the regime’’s impacts on economic s impacts on economic growth, agriculture, food security, and poverty in growth, agriculture, food security, and poverty in developing countriesdeveloping countries
Joachim von Braun, IFPRI, February 2008
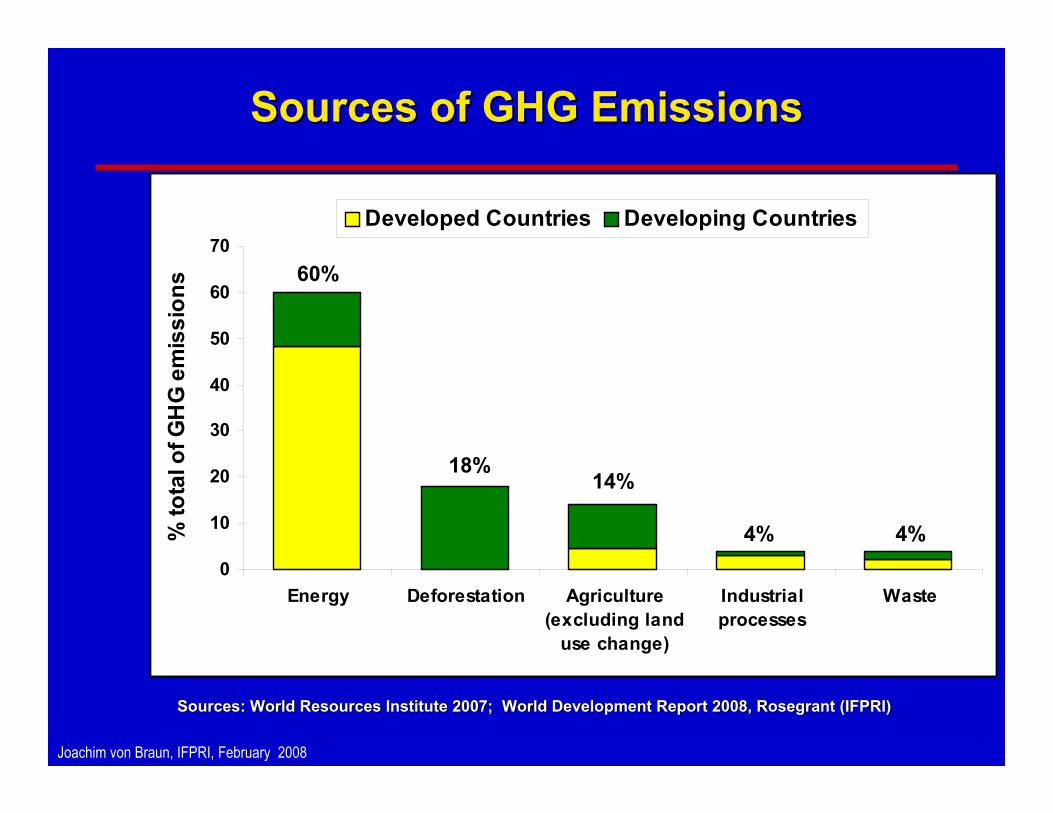
Sources of GHG EmissionsSources of GHG Emissions
Sources: World Resources Institute 2007; World Development RepoSources: World Resources Institute 2007; World Development Report 2008, rt 2008, RosegrantRosegrant (IFPRI)(IFPRI)
0
10
20
30
40
50
60
70
Energy Deforestation Agriculture(excluding land
use change)
Industrialprocesses
Waste
% to
tal o
f GH
G e
mis
sion
s
Developed Countries Developing Countries
60%
18%14%
4% 4%
Joachim von Braun, IFPRI, February 2008
ProPro--Poor Climate Mitigation PolicyPoor Climate Mitigation Policy
•• Climate change policy can generate income Climate change policy can generate income for small farmers and investment flows for for small farmers and investment flows for rural communitiesrural communities
•• Requires effective integration Requires effective integration from global governance of carbon trading,from global governance of carbon trading,to to sectoralsectoral and microand micro--level design of level design of markets and contracts, andmarkets and contracts, andinvestment in community managementinvestment in community management
Joachim von Braun, IFPRI, February 2008
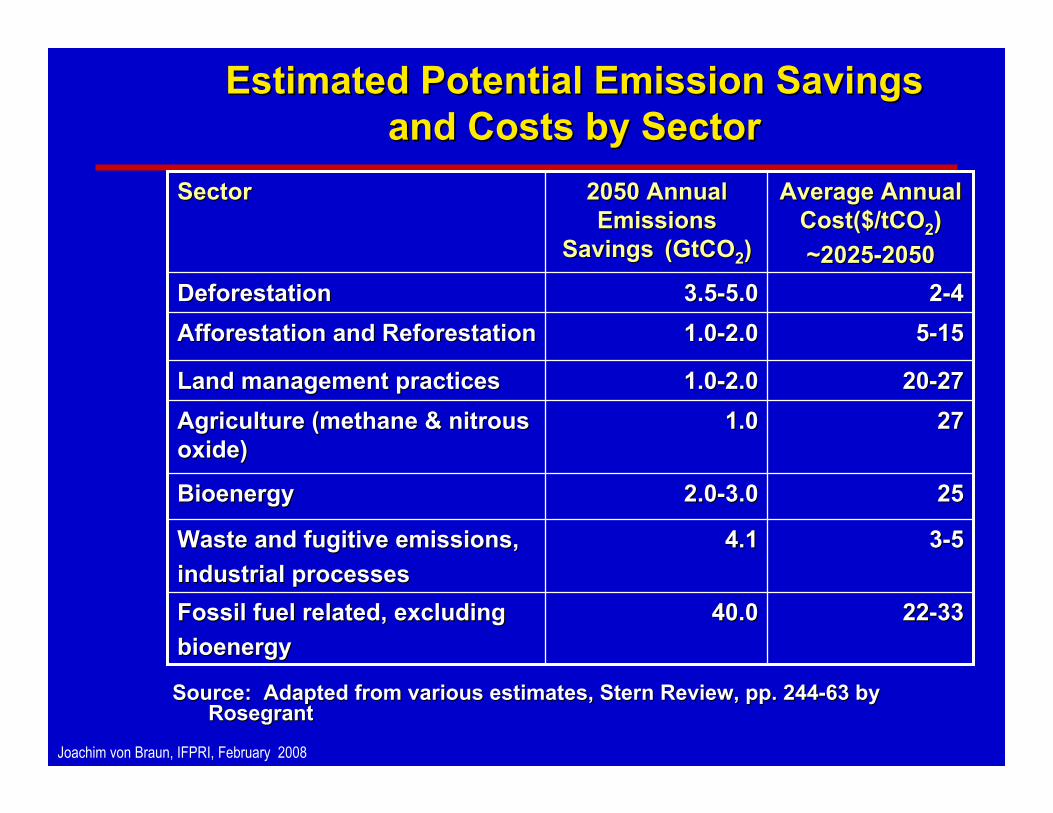
Estimated Potential Emission Savings Estimated Potential Emission Savings and Costs by Sector and Costs by Sector
2222--333340.040.0Fossil fuel related, excludingFossil fuel related, excludingbioenergybioenergy
33--554.14.1Waste and fugitive emissions,Waste and fugitive emissions,industrial processesindustrial processes
25252.02.0--3.03.0BioenergyBioenergy
27271.01.0Agriculture (methane & nitrous Agriculture (methane & nitrous oxide)oxide)
2020--27271.01.0--2.02.0Land management practicesLand management practices
55--15151.01.0--2.02.0AfforestationAfforestation and Reforestationand Reforestation22--443.53.5--5.05.0Deforestation Deforestation
Average Annual Average Annual Cost($/tCOCost($/tCO22))~2025~2025--20502050
2050 Annual 2050 Annual Emissions Emissions
SavingsSavings (GtCO(GtCO22))
SectorSector
Source: Adapted from various estimates, Stern Review, pp. 244Source: Adapted from various estimates, Stern Review, pp. 244--63 by 63 by RosegrantRosegrant
Joachim von Braun, IFPRI, February 2008
So far minimal carbon trades in So far minimal carbon trades in agriculture in developing countriesagriculture in developing countries
•• Only 3Only 3--4% of carbon trading is sourced 4% of carbon trading is sourced from agriculture, land use, land use from agriculture, land use, land use change, agroforestry and forestrychange, agroforestry and forestry
•• Only 3% of carbon trading is sourced Only 3% of carbon trading is sourced from Africafrom Africa
Joachim von Braun, IFPRI, February 2008
Overview Overview
1.1. The new world food equationThe new world food equation
2.2. Energy Energy -- biofuelsbiofuels -- food securityfood security
3.3. Climate change Climate change -- biomass biomass –– agriculture agriculture
4.4. ProPro--poor policy and program actionspoor policy and program actions
Joachim von Braun, IFPRI, February 2008
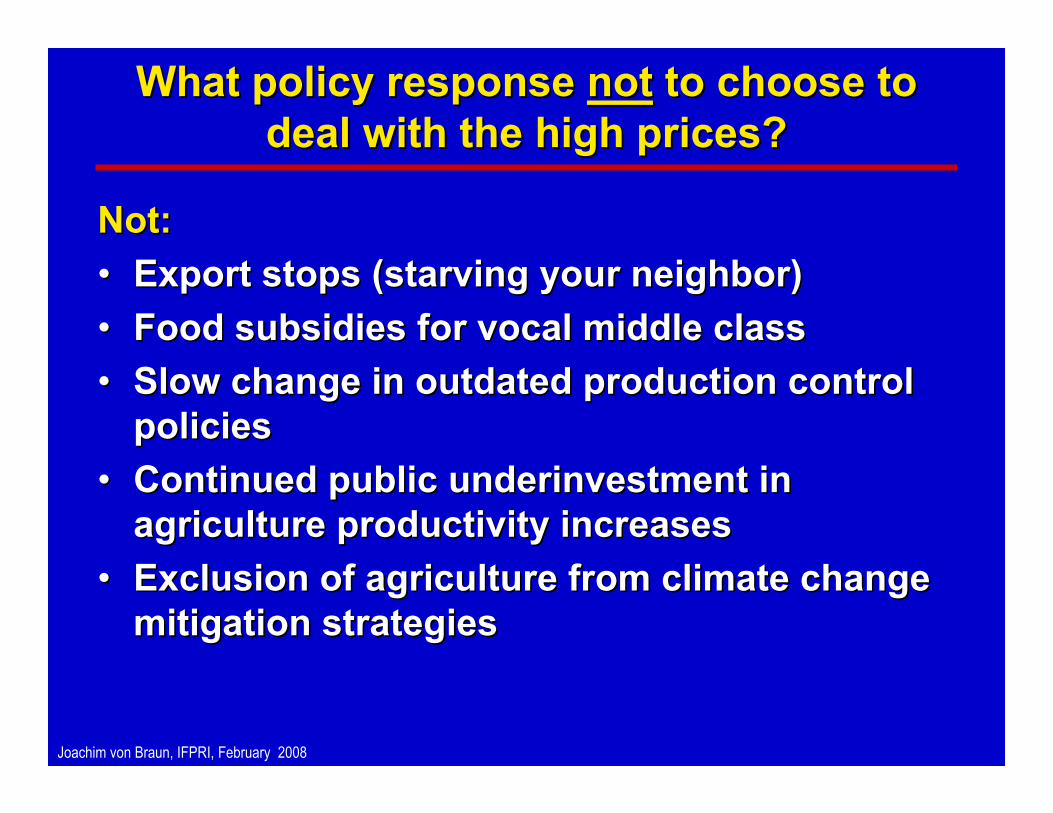
What policy response What policy response notnot to choose to to choose to deal with the high prices?deal with the high prices?
Not:Not:•• Export stops (starving your neighbor)Export stops (starving your neighbor)•• Food subsidies for vocal middle classFood subsidies for vocal middle class•• Slow change in outdated production control Slow change in outdated production control
policiespolicies•• Continued public underinvestment in Continued public underinvestment in
agriculture productivity increasesagriculture productivity increases•• Exclusion of agriculture from climate change Exclusion of agriculture from climate change
mitigation strategiesmitigation strategies
Joachim von Braun, IFPRI, February 2008
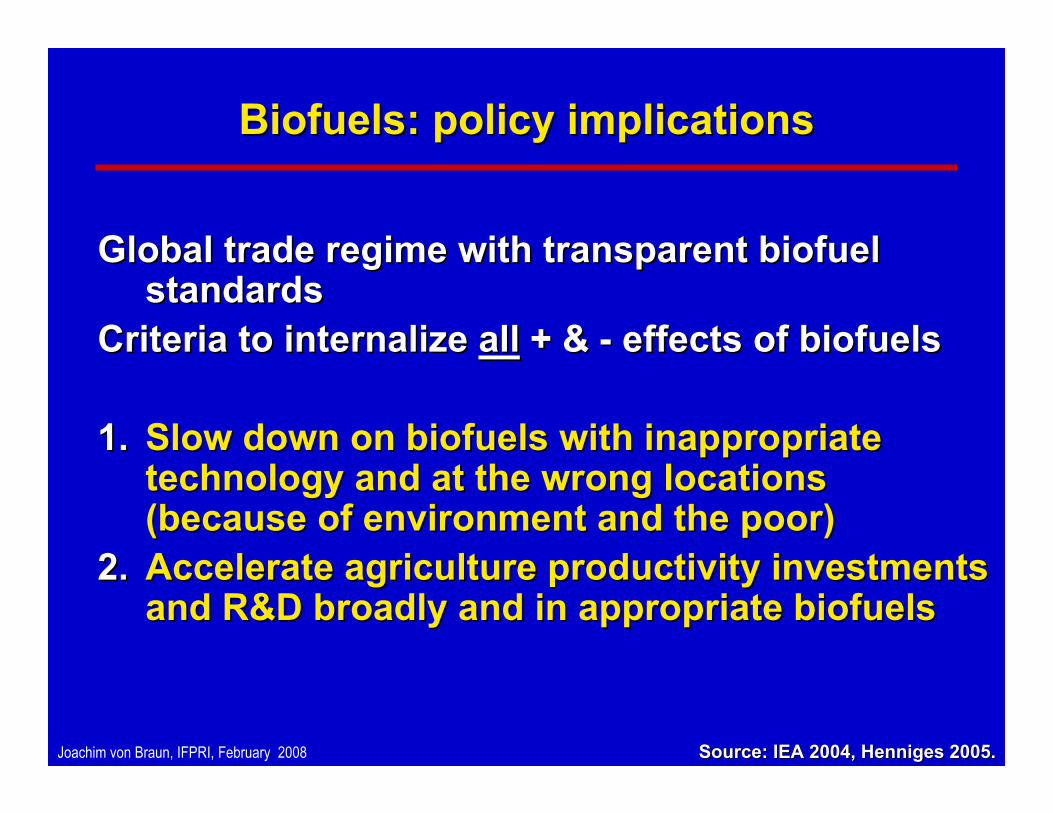
Biofuels: policy implicationsBiofuels: policy implications
Global trade regime with transparent biofuel Global trade regime with transparent biofuel standardsstandards
Criteria to internalize Criteria to internalize allall + & + & -- effects of effects of biofuelsbiofuels
1.1. Slow down on Slow down on biofuelsbiofuels with inappropriate with inappropriate technology and at the wrong locations technology and at the wrong locations (because of environment and the poor) (because of environment and the poor)
2.2. Accelerate agriculture productivity investments Accelerate agriculture productivity investments and R&D broadly and in appropriate and R&D broadly and in appropriate biofuelsbiofuels
Source: IEA 2004, Henniges 2005.Source: IEA 2004, Henniges 2005.
Joachim von Braun, IFPRI, February 2008
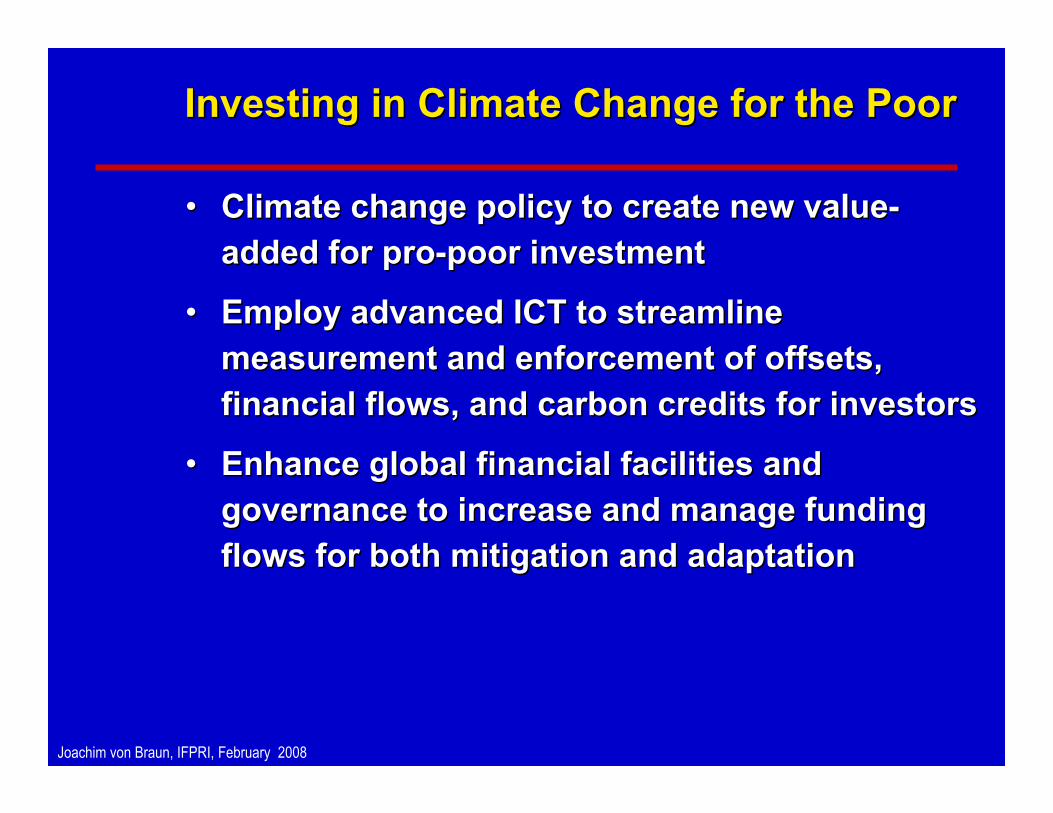
Investing in Climate Change for the Poor Investing in Climate Change for the Poor
•• Climate change policy to create new valueClimate change policy to create new value--added for proadded for pro--poor investmentpoor investment
•• Employ advanced ICT to streamline Employ advanced ICT to streamline measurement and enforcement of offsets, measurement and enforcement of offsets, financial flows, and carbon credits for investors financial flows, and carbon credits for investors
•• Enhance global financial facilities and Enhance global financial facilities and governance to increase and manage funding governance to increase and manage funding flows for both mitigation and adaptationflows for both mitigation and adaptation
Joachim von Braun, IFPRI, February 2008
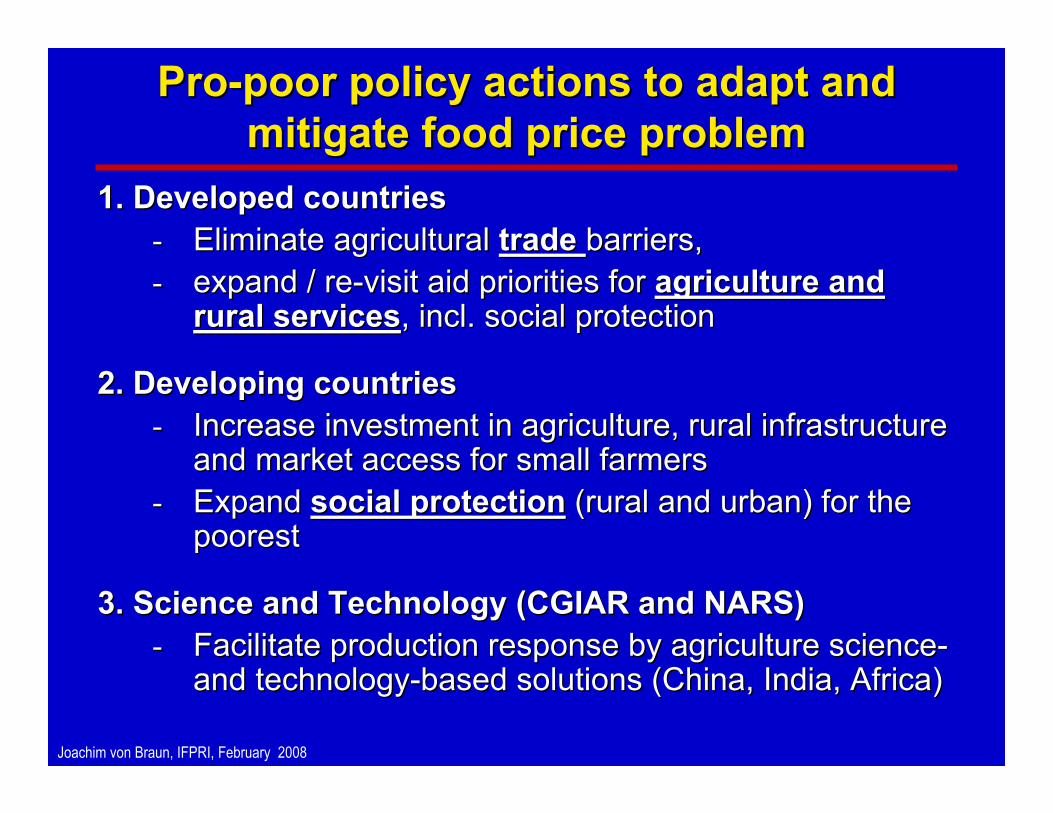
ProPro--poor policy actions to adapt and poor policy actions to adapt and mitigate food price problemmitigate food price problem
1. Developed countries1. Developed countries-- Eliminate agricultural Eliminate agricultural trade trade barriers, barriers, -- expand / reexpand / re--visit aid priorities for visit aid priorities for agriculture and agriculture and
rural servicesrural services, incl. social protection, incl. social protection
2. Developing countries 2. Developing countries -- Increase investment in agriculture, rural infrastructure Increase investment in agriculture, rural infrastructure
and market access for small farmers and market access for small farmers -- Expand Expand social protectionsocial protection (rural and urban) for the (rural and urban) for the
poorestpoorest
3. Science and Technology (CGIAR and NARS)3. Science and Technology (CGIAR and NARS)-- Facilitate production response by agriculture scienceFacilitate production response by agriculture science--
and technologyand technology--based solutions (China, India, Africa)based solutions (China, India, Africa)