Embed Size (px)
Citation preview
Wright State UniversityCORE ScholarMaster of Public Health Program StudentPublications Master of Public Health Program
6-23-2012
Food Deserts and Their Association with Obesityand Diabetes in OhioAlexis HolmesWright State University - Main Campus
Detra Thompson
Follow this and additional works at: https://corescholar.libraries.wright.edu/mph
Part of the Community Health and Preventive Medicine Commons
This Master's Culminating Experience is brought to you for free and open access by the Master of Public Health Program at CORE Scholar. It has beenaccepted for inclusion in Master of Public Health Program Student Publications by an authorized administrator of CORE Scholar. For moreinformation, please contact [email protected], [email protected].
Repository CitationHolmes, A., & Thompson, D. (2012). Food Deserts and Their Association with Obesity and Diabetes in Ohio. Wright State University,Dayton, Ohio.
FOOD DESERTS HEALTH EFFECTS IN OHIO
1
Food deserts and their association with obesity
and diabetes in Ohio
Wright State University
Alexis Holmes
Detra Thompson
6/23/2012

FOOD DESERTS HEALTH EFFECTS IN OHIO
2
Acknowledgements
We would like to thank Dr. Naila Khalil and Dr. William Spears for their continuous support.
Without their guidance, knowledge and experience, this project would not have been possible.
We would also like to thank our families for their encouragement throughout the duration of this
Culminating Experience.
FOOD DESERTS HEALTH EFFECTS IN OHIO
3
Table of Contents
Abstract ............................................................................................................................................4
Introduction ......................................................................................................................................5
Statement of Purpose .......................................................................................................................6
Literature Review.............................................................................................................................6
Research Questions ........................................................................................................................12
Methods..........................................................................................................................................12
Results ............................................................................................................................................17
Discussion/Conclusion ...................................................................................................................22
References ......................................................................................................................................26
Appendix A: List of Public Health Competencies Met .................................................................31
FOOD DESERTS HEALTH EFFECTS IN OHIO
4
Abstract
Objective- The purpose of this study was to explore the association of food access, and
availability, on prevalence of diabetes and obesity in Ohio census tracts designated as food
deserts.
Methods- County and census tract-level data were combined from the USDA Food Environment
Atlas and USDA Food Desert Locator respectively. Statistical analysis was conducted using
IBM Statistical Package for Social Sciences (SPSS). Non-normally distributed variables were
assessed using the Mann-Whitney nonparametric U-test and Spearman’s correlation coefficient.
Significance was considered at the p<0.05 level.
Results- The mean rate of obesity and diabetes in Ohio in food deserts are 29.5% and 10.7%,
when compared to Ohio (29.2%, 10.7%) rates, and US rates (35.7%, 8.3%), respectively. No
significant difference was found in the mean percentages of the population with diabetes in rural
versus urban communities. Rural communities were found to have a significantly higher rate of
obesity. Supercenters and convenience stores without gas were found to be directly related to the
incidence of diabetes in the overall observed population. Convenience stores with no gas, fast
food restaurants and recreational facilities were found to be negatively correlated to the
percentage of the population comprised of African Americans. Poverty had a strong influence in
the African American population. Low poverty communities were found to have nearly twice as
many farmers’ markets as communities with a high poverty level.
Conclusion- This study concludes that the accessibility of supermarkets and club stores were
correlated to the number of cases of obesity, as was the number of convenience stores with gas,
and farmers; markets. Future research should highlight the association of food deserts and
diabetes. Futures studies should also feature analysis of data collected on an individual level.
FOOD DESERTS HEALTH EFFECTS IN OHIO
5
Food deserts and their health effects in Ohio
Many Americans are aware of the recommended food intake guidelines in order to lead a
healthy life. However, not all are meeting the daily-recommended intake of fruits and vegetables,
and are far exceeding the recommended intake of fat, added sugars and sodium. This contributes
to several adverse health outcomes including obesity and numerous chronic diseases.
The American Dietetic Association, the National Institutes of Health, and many other
national organizations recommend a balanced diet based on the US Department of Agriculture's
Food Guide Pyramid (Story, Kaphingst, Robinson-O'Brien, & Glanz, 2008). Recently, the
USDA's food guide pyramid has been replaced with the concept of “My plate” to provide
Americans with a simpler, easier guide. All foods are placed in one of five categories: grains,
vegetables, fruits, dairy, and protein foods (with the exception of beans and peas, which are
considered both protein foods and vegetables) (USDA, 2011).
Chronic diseases are responsible for 7 out of 10 deaths in United States each year. In the
year 2005 alone the prevalence of chronic disease among Americans totaled 133 million (CDC,
2012). The most prevalent chronic diseases are cardiovascular disease, diabetes, and cancer. Poor
diet, lack of physical activity, tobacco use and excessive consumption of alcohol are all
modifiable behaviors that are known to contribute to the onset of these chronic illnesses (CDC,
2012). Poor eating habits contribute to the increased epidemics of obesity and chronic diseases,
more than individual factors like knowledge, skills or motivation (Story et al., 2008).
The concept of "food deserts" was first introduced in Scotland in the early 1990s to
explain disparities in food pricing. It is a term applied to areas with limited access to chain
grocery stores. A food desert is any area where it is difficult to obtain healthy food. Food deserts
are environments that are not conducive to health, presenting barriers that restrict access to
FOOD DESERTS HEALTH EFFECTS IN OHIO
6
healthy food. Barriers to be considered are lack of access to food retailers, availability of
nutritious foods, or affordability of foods. Currently, there are some sections of the population
that lack access to healthy food. For instance, people living in low-income and/or predominantly
black neighborhoods generally have less access to grocery stores and supermarkets (Zenk et al.,
2011). Food deserts are most prevalent in areas of low socio-economic minority communities
(Beaulac, Kristjansson, & Cummins, 2009).
Statement of Purpose
The purpose of this study is to explore the effect of foods deserts on prevalence of diabetes and
obesity and population characteristics in Ohio.
Literature Review
Healthy People 2010 aimed to reduce obesity in children and adolescents in the US by 5%.
(Department of Health and Human Services, 1990). However, between the years 2000 to 2008,
obesity increased 3% among 2-19 year olds (Ogden & Carroll, 2008). As response to this
increase in obesity, several initiatives were undertaken, including a $400 million healthy food
initiative (Department of Health and Human Services, 2000), the founding of White House
Childhood Obesity Task Force, (White House Task Force on Childhood Obesity, 2010, 2010)
and an updated strategic plan giving obesity prevention a priority in the Department of Health
and Human Services (Department of Health and Human Services, 2009).
One of the major current public health concerns is the increase prevalence in obesity and
preventable diet-related diseases (Ver Ploeg et al., 2009). As a result of this increase, $800
billion is spent annually in the US on health care costs (Schumacher, Nischan, & Simon, 2011).
The annual cost to US taxpayers in 2005 for obesity and diabetes alone was $115 billion and
$130 billion, respectively. In 2005, nearly1 of every 2 adults suffered from at least one chronic
FOOD DESERTS HEALTH EFFECTS IN OHIO
7
illness (Wu & Green, 2000). According to the CDC, 1 in every 3 adults is obese and almost 1 in
5 youth between the ages of 6 and 19 is obese (CDC, 2012). Moreover obesity is a major concern
for youth and adolescents, as they grow into obese adults (An & Sturm, 2012).
Food Deserts
While there is no universal definition for a food desert, in the United States, “food
deserts” are areas that have limited access to healthy, affordable food, are generally found in
urban and rural low-income neighborhoods. Congress wanted to find a way to measure how
many people have limited access to healthy food and who lived in those areas due to the Let’s
Move initiative; the initiative proposed the HFFI will increase the availability of food. The
Healthy Food Financing Initiative Working Group defines a food desert as a low-income census
tract where a substantial number or percentage of residents has low access to a supermarket or
large grocery store (Breneman & Ver Ploeg, 2009). Low access to a healthy food retail outlet in
urban areas is living more than 1 mile from a grocery store or large supermarket, or more than 10
miles away from a retail location if living in rural areas. The distance between the place of
residence and the nearest supermarket is measured as the distance between the center of a one-
kilometer square area and the nearest grocery store or supermarket. Once this distance has been
calculated for each separate area, the estimated number of people more than a mile away from a
grocery store or supermarket is collected to determine the census tract level. At least 33 percent
of the population, or a minimum of 500 people in the tract, must have low access to a
supermarket or grocery store to be identified as living in a food desert. It is estimates that a total
of 13.6 million people in these census tracts have low access to a supermarket or large grocery
store (Breneman & Ver Ploeg, 2009). These areas are less likely to include grocery stores, or
outlets from which people can obtain healthy, nutritious foods at affordable prices. The New
FOOD DESERTS HEALTH EFFECTS IN OHIO
8
Markets Tax Credit program defines low-income census tract as any tract where the rate of
poverty is at least 20 percent and the median family income for the tract does not exceed 80
percent of the statewide median family income for tracts located inside a metropolitan area, or 80
percent of the greater between statewide median family income and metropolitan median family
income if the tract is not located in a metropolitan area (Breneman & Ver Ploeg, 2009).
Food insecurity has been connected to obesity (Dinour, Bergen, & Yeh, 2007). This
relationship suggests that people living in food deserts are more likely to select foods that are
higher in caloric content but lower in nutritional value (Murphy, 2011). These unhealthy food
selections put this population at a higher risk of suffering from chronic illnesses like diabetes,
cardiovascular disease, and obesity (Murphy, 2011).
The Food and Trust Policy recently reported that 23 million Americans or more living in
food deserts and are at greater risk for obesity and obesity-related diseases (Steyn et al., 2007). In
urban environments, a growing understanding of the relationship between diet and health in the
recent years has led to increased analysis of the accessibility of competitively priced healthful
foods (Sparks, Bania, & Leete, 2011). In the United States 2.3 million households live more than
a mile from a supermarket and have no vehicle to access food. Households of an additional 3.4
million do not have access to a car and or live ½ mile to a mile away from the supermarket (Ver
Ploeg, 2009).
Lack of Access to Food Retailers
People living in areas with limited access generally rely on small grocery or convenience
stores that may not carry all the foods recommended for a healthy diet, or may offer them at
substantially higher prices (Ver Ploeg et al., 2009).
FOOD DESERTS HEALTH EFFECTS IN OHIO
9
Food access describes one’s ability to reach local food retail outlets by use of convenient
forms of transportation. Because full service markets may be further away, residents in these
areas are more likely to buy food from convenience stores that stock mainly cheap, processed
foods, usually high in fats and sugars (Bauer, 2004). Food retailers are discouraged from opening
chains in urban and low-income rural communities because of crime rates, transportation costs
and low return on investment (Bitler, 2009). Residents of food deserts have no choice but to
utilize private cars, travel several miles on foot, or use public modes of transportation to obtain
healthful foods (Bauer, 2004).
Nutrition
Nutrition is the provision of the materials in the form of food to support life. Fruit and vegetable
intake are important components of a healthy diet but are under-consumed especially among
low-income groups that already have high obesity prevalence rates (Jilcott, Keyserling,
Crawford, McGuirt, & Ammerman, 2011). According to the United States Department of
Agriculture’s 2011 MyPlate healthy eating initiative, there are 5 components of a healthful meal:
Grains, vegetables, fruits, dairy and protein foods. The initiative highlights a pie chart-like
diagram of the proportions of each group a balanced meal should be composed of. At least half
of the plate should be fruits and vegetables. The other half of a dinner plate should be made up of
grains and protein, with more emphasis on the grains. Dairy should be incorporated into the
meal, but it should not be a main course.
An and Sturm (2012) proposed two hypotheses to improve the diet quality and prevent
weight gain (1) improve access to grocery stores and supermarkets or (2) reducing exposure to
small food stores, fast food and convenience store. Convenience foods, including products such
as candy, sugary beverages, processed meats and cheeses, canned products, pre-cooked frozen
FOOD DESERTS HEALTH EFFECTS IN OHIO
10
meals and fast foods require little or no preparation before eating, and normally contain higher
amounts of sodium (Jeffrery, Baxter, McGuire, & Linde, 2006).
Health-threatening conditions like obesity and chronic illnesses like diabetes,
cardiovascular disease and cancer are attributed to an excess food intake or lack of exercise.
Cardiovascular disease has been linked to an omega 3 fats deficiency in diets. Omega-3 fatty
acids are most commonly found in marine and plant oils. These acids, also called n-3 fatty acids,
have many health benefits, and are considered essential fatty acids, because they cannot be
synthesized by the human body alone, but are vital for normal metabolism. Omega-3s are
essential for normal growth and development, and may play an important role in the prevention
and treatment of coronary artery disease, hypertension, diabetes, arthritis other inflammatory and
autoimmune disorders, and cancer (Simopoulos, 2011).
Availability of Nutritious Foods
Food availability describes access to healthy foods and beverages sold or served at retail
food outlets. The prevalence of food deserts in poorer neighborhoods is driven by lack of
consumer demand since the poor have less money to spend on healthy nutritious foods, which
tend to cost more than convenience foods (Bitler, 2009). Consequently, this disallows urban
residents the benefits of healthy foods at affordable prices (Yeh & Katz, 2006). The Healthy
People 2010 initiative emphasizes the importance of increasing consumption of healthy foods
because most Americans do not meet the dietary recommendations, however healthier foods are
not equally available to everyone (Department of Health and Human Services, 2005). Researcher
Mari Gallagher and associates pioneered a study that, instead of looking at areas that had been
designated food deserts, calculated the food balance, a ratio of fringe stores to mainstream food
venues. A community is said to be food balanced when large grocery stores are roughly the same
FOOD DESERTS HEALTH EFFECTS IN OHIO
11
distance as a fringe food venue, making both venues equally easy to get to. Gallagher’s study
found that fringe food in Chicago was far easier to access for areas with a high concentration of
single mothers and children (Mari Gallagher Research & Consulting Group, 2010).
Affordability of Food
Food affordability impacts low-income people. Instead of shopping for the healthiest
food they can get have to purchase affordable Purchasing food may compete with paying for
other necessities like housing, clothing and transportation (Ver Ploeg et al., 2009). Supermarkets
frequently have a wider variety of foods, at better prices than smaller stores, sometimes saving
consumers up to 75% of the cost, and providing better quality (Wilson, 1994).
Racial and Socioeconomic Disparity and Food Availability
There is strong evidence showing associations between socioeconomic status and
racial/ethnic disparities and diet (Kant, Graubraud, & Kumanyika, 2007). These disparities can
lead to disproportionate prevalence of obesity and diet-related disease (Department of Health and
Human Services, 2009). For example, African Americans have a higher risk of dying than
Caucasians in the US, which is 146% higher for stroke, 131% higher for heart disease, and 208%
higher for diabetes (National Center for Health Statistics, 2009). Research has shown that low-
income African American neighborhoods have fewer supermarkets and more liquor stores and
convenience stores than higher income Caucasian neighborhoods, respectively (Zenk et al.,
2011). Food security, defined as access by all people, at all times to enough food for an active,
healthy life (Nord, Colemen-Jensen, Andrews, & Carlson, 2010). An estimated 11.1% of
Americans have “low food security” and 4.1% have “very low food security” with African
Americans and Latinos estimated to have doubled the national rates (Nord, Andrews, & Carlson,
2007).
FOOD DESERTS HEALTH EFFECTS IN OHIO
12
Research Questions
In this study, we desire to answer the following questions:
1. Are the diabetes and obesity rates higher in census tracts or counties designated as food
deserts?
2. Are African Americans more susceptible to living in a food desert?
3. Is the number of grocery stores per capita directly related to the number of obese and
diabetics in a community?
4. Do areas with high poverty rates have less access to supermarkets or recreational
facilities?
Methods
Data Sources
The two sources used for this analysis were:
1) The Food Desert Locator Documentation
(www.ers.usda.gov/data/fooddesert/documentation.html)
2) The Food Environment Atlas
(www.ers.usda.gov/foodatlas/documentation.htm)
The Food Desert Locator
The Food Desert Locator is an online database that includes characteristics only for
census tracts that qualify as food deserts. It provides a spatial summary of food-desert census
tracts located throughout the U.S. It also provides population characteristics and offers data for
community planning or research purposes. The food desert locator initiative began in 2009, in an
effort to provide access to affordable and nutritious food.
FOOD DESERTS HEALTH EFFECTS IN OHIO
13
Food Desert definition: To qualify as a food desert tract, at least 33 percent of the tract’s
population or a minimum of 500 people in the tract must have low access to a supermarket or
large grocery store.
A food desert is defined by HFFI Working Group as a low-income census tract
where a number of residents have share low access to a large grocery store or
supermarket. The Treasury Department’s census tract must meet criteria to qualify
low-income.
Low-income census tract is any tract:
where at least 20 percent and the population has income below the USDA
poverty rate and,
in a metropolitan area the median family income does not exceed or 80 percent
of the statewide median family income for metropolitan census tracts.
in a non-metropolitan area 80 percent of the greater amount between statewide
median family income and metropolitan median family income.
Low access to a healthy food retail outlet is as living more than 1 mile from a grocery
store or large supermarket in urban areas, or more than 10 miles away from a retail
location if living in rural areas.
A census tract is considered rural when an area contains a population of less than
2,500 people, and all other tracts are considered urban.
The use of this criteria is based on the definition above there are in 6,529 food-
desert census tracts in the continental U.S. Approximately 75 percent of these food desert
tracts are urban, with the remaining 25 percent designated as rural. The Food Desert
Locator includes characteristics for the census tract that qualify as food deserts.
FOOD DESERTS HEALTH EFFECTS IN OHIO
14
The Food Environment Atlas
The Food Environment Atlas is an online database, which provides information regarding
diet quality and food choices at county level throughout the U.S. It provides an overview of
socio-demographic characteristics of a community and how it accesses healthy foods. The Atlas
includes factors such as store/restaurant proximity, food prices and nutrition assistance programs.
Also included are a few health status indicators, access to physical activity centers. In total this
database had 168 indicators related to food availability.
Data Variables
The descriptions of the variables use in his analysis are as follows:
FOOD DESERTS HEALTH EFFECTS IN OHIO
15
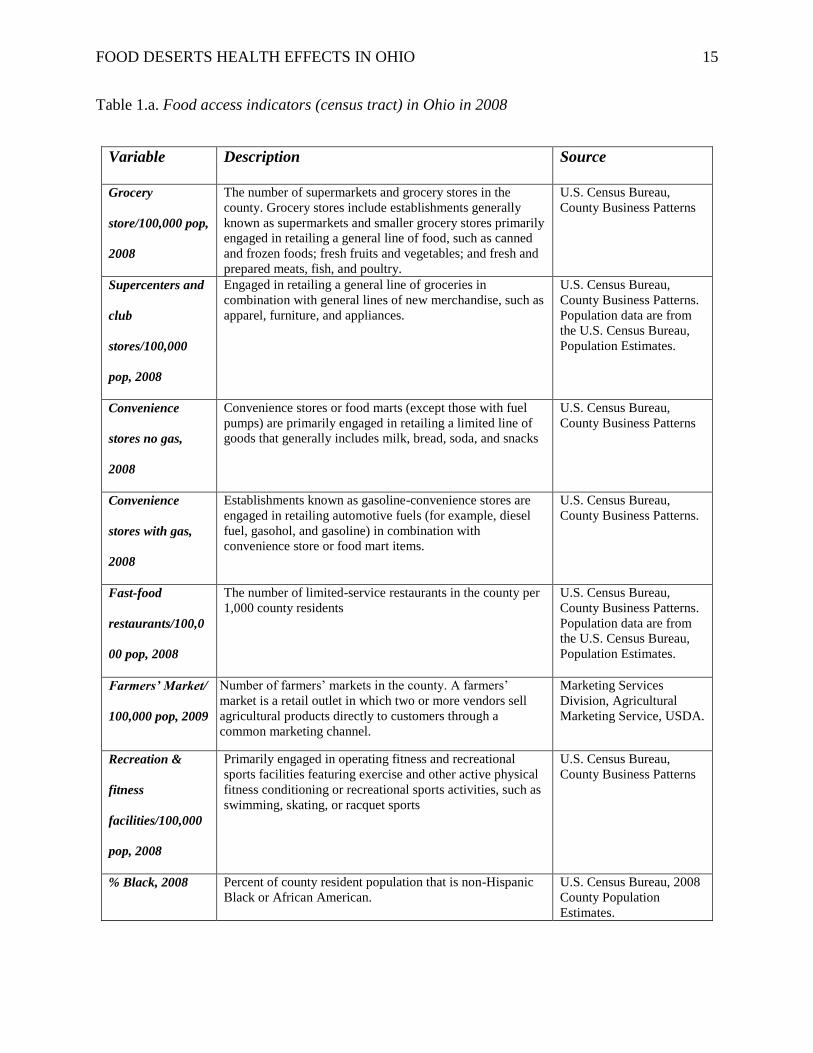
Table 1.a. Food access indicators (census tract) in Ohio in 2008
Variable Description Source
Grocery
store/100,000 pop,
2008
The number of supermarkets and grocery stores in the
county. Grocery stores include establishments generally
known as supermarkets and smaller grocery stores primarily
engaged in retailing a general line of food, such as canned
and frozen foods; fresh fruits and vegetables; and fresh and
prepared meats, fish, and poultry.
U.S. Census Bureau,
County Business Patterns
Supercenters and
club
stores/100,000
pop, 2008
Engaged in retailing a general line of groceries in
combination with general lines of new merchandise, such as
apparel, furniture, and appliances.
U.S. Census Bureau,
County Business Patterns.
Population data are from
the U.S. Census Bureau,
Population Estimates.
Convenience
stores no gas,
2008
Convenience stores or food marts (except those with fuel
pumps) are primarily engaged in retailing a limited line of
goods that generally includes milk, bread, soda, and snacks
U.S. Census Bureau,
County Business Patterns
Convenience
stores with gas,
2008
Establishments known as gasoline-convenience stores are
engaged in retailing automotive fuels (for example, diesel
fuel, gasohol, and gasoline) in combination with
convenience store or food mart items.
U.S. Census Bureau,
County Business Patterns.
Fast-food
restaurants/100,0
00 pop, 2008
The number of limited-service restaurants in the county per
1,000 county residents
U.S. Census Bureau,
County Business Patterns.
Population data are from
the U.S. Census Bureau,
Population Estimates.
Farmers’ Market/
100,000 pop, 2009
Number of farmers’ markets in the county. A farmers’
market is a retail outlet in which two or more vendors sell
agricultural products directly to customers through a
common marketing channel.
Marketing Services
Division, Agricultural
Marketing Service, USDA.
Recreation &
fitness
facilities/100,000
pop, 2008
Primarily engaged in operating fitness and recreational
sports facilities featuring exercise and other active physical
fitness conditioning or recreational sports activities, such as
swimming, skating, or racquet sports
U.S. Census Bureau,
County Business Patterns
% Black, 2008 Percent of county resident population that is non-Hispanic
Black or African American.
U.S. Census Bureau, 2008
County Population
Estimates.
FOOD DESERTS HEALTH EFFECTS IN OHIO
16
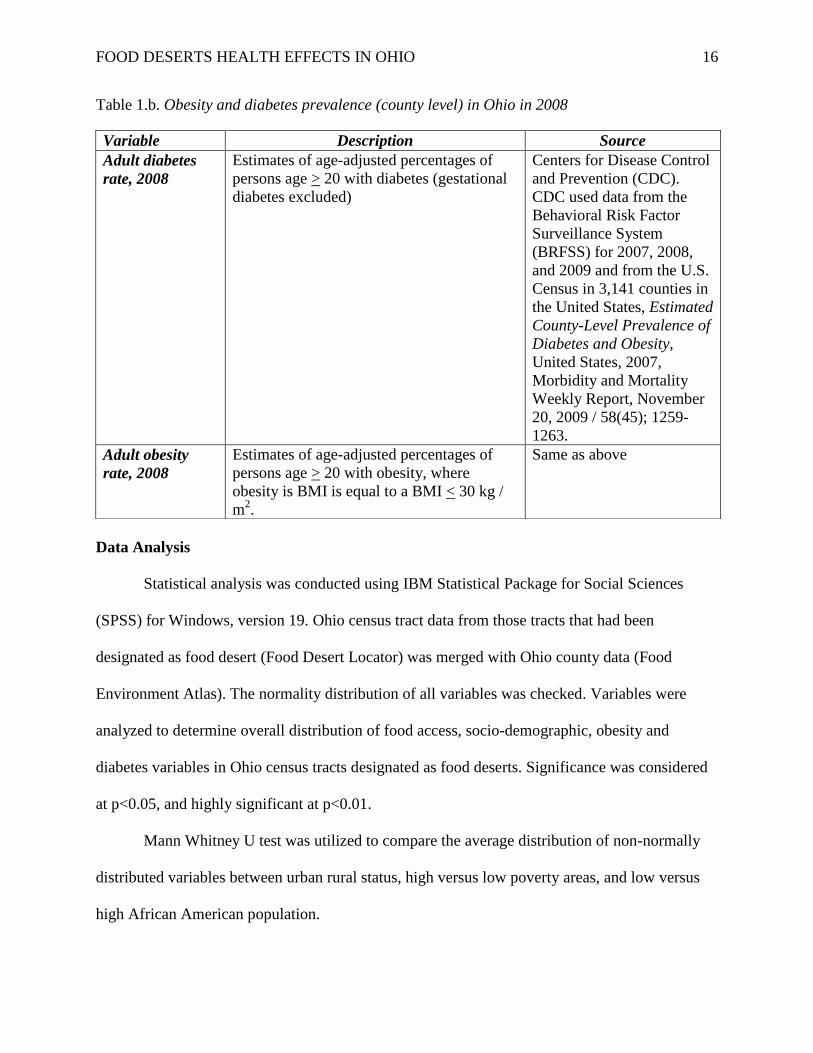
Table 1.b. Obesity and diabetes prevalence (county level) in Ohio in 2008
Data Analysis
Statistical analysis was conducted using IBM Statistical Package for Social Sciences
(SPSS) for Windows, version 19. Ohio census tract data from those tracts that had been
designated as food desert (Food Desert Locator) was merged with Ohio county data (Food
Environment Atlas). The normality distribution of all variables was checked. Variables were
analyzed to determine overall distribution of food access, socio-demographic, obesity and
diabetes variables in Ohio census tracts designated as food deserts. Significance was considered
at p<0.05, and highly significant at p<0.01.
Mann Whitney U test was utilized to compare the average distribution of non-normally
distributed variables between urban rural status, high versus low poverty areas, and low versus
high African American population.
Variable Description Source
Adult diabetes
rate, 2008
Estimates of age-adjusted percentages of
persons age > 20 with diabetes (gestational
diabetes excluded)
Centers for Disease Control
and Prevention (CDC).
CDC used data from the
Behavioral Risk Factor
Surveillance System
(BRFSS) for 2007, 2008,
and 2009 and from the U.S.
Census in 3,141 counties in
the United States, Estimated
County-Level Prevalence of
Diabetes and Obesity,
United States, 2007,
Morbidity and Mortality
Weekly Report, November
20, 2009 / 58(45); 1259-
1263.
Adult obesity
rate, 2008
Estimates of age-adjusted percentages of
persons age > 20 with obesity, where
obesity is BMI is equal to a BMI < 30 kg /
m2.
Same as above
FOOD DESERTS HEALTH EFFECTS IN OHIO
17
Spearman correlation analysis was conducted to determine association between food
access variables and health outcome (diabetes, obesity). The strength of association was
determined by effect size; Effect sizes were as follows:
<0.29 = low effect size
0.3 – 0.49 = moderate effect size
>0.5= strong effect size.
Results
There were a total of 287 Ohio census tracts designated as food deserts in this study, 14
rural, and 273 urban. Since most of the variables were non-normally distributed, values are
presented as medians and interquartile ranges (IQR). The percentage of obesity in these tracts
ranged from 27% to a high of 36%, with a median value of 30%. The prevalence of diabetes
ranged from 9% to 14%, with a median value of 11%. The median poverty rate was 15%,
ranging from 7% to as high as 30%. The median was used as cutpoint of 15% was used as a
separation point between low and high poverty rate levels. The percentage of the population
comprising of African Americans varied between census tracts, ranging from 0.4% to 29%, with
a median value of 14%.
The descriptive characteristics of the study variables are presented in Table 1. At the
p<0.05 level of significance, several variables displayed statistical differences in the median
values. There was a significant difference between the number of recreational facilities in rural
versus urban tracts. Significantly more fast food venues were found in urban tracts. There was no
significant difference in the number of grocery stores and number of super centers and/or club
stores, or farmers’ markets in the rural communities when compared to that of the urban
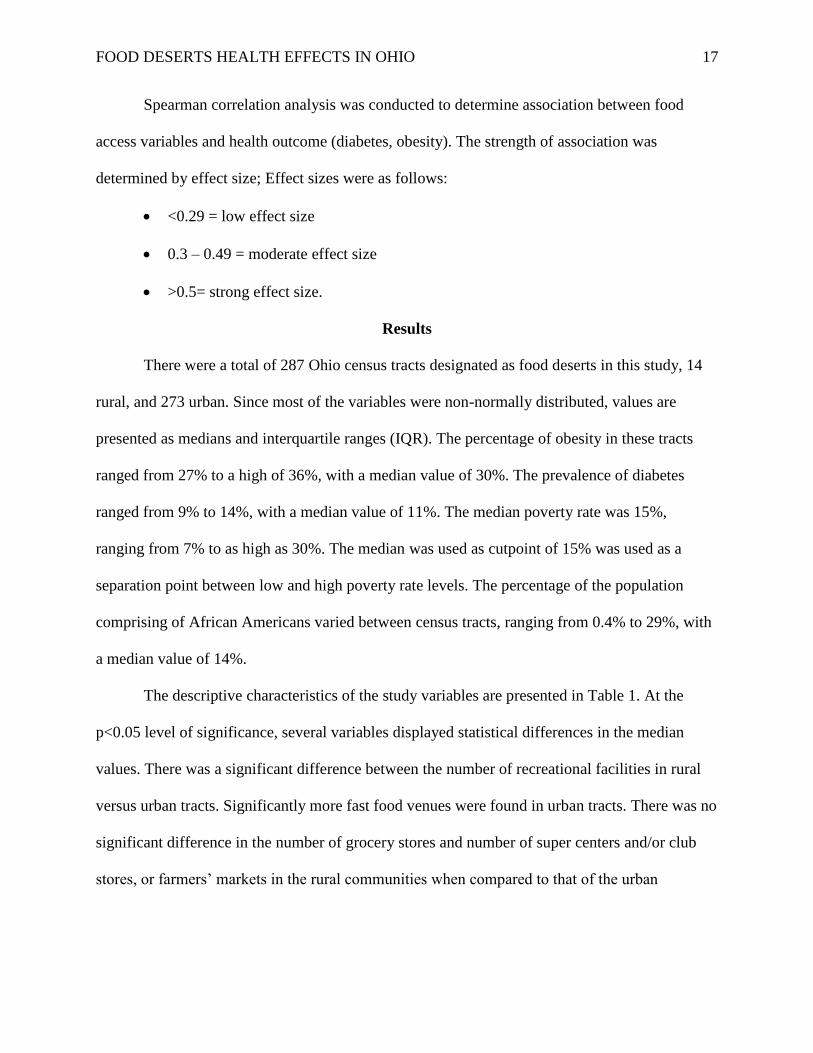
FOOD DESERTS HEALTH EFFECTS IN OHIO
18
communities. No significant difference was found in the diabetes rates, but obesity rates were
higher in rural tracts.
Table 2. Descriptive characteristic of study variables by community type
Characteristic Overall Rural Urban
N: 287 N:14 N:273
Median IQR* Median IQR Median IQR
P-
value**
Farmers’ market/100,000 pop 0.8 1.2 1.3 2.7 0.8 1.1 < .700
Recreational facility/100,000 pop 10.7 2.8 6.4 5.6 11.1 2.9 < .001
Grocery Stores /100,000 pop 18.3 5.8 18.7 3 18.3 6.2 0.901
Super Center + Club stores/100,000 pop 1.6 1.4 1.7 3.3 1.6 1.4 0.542
Convenience Stores- No Gas/100,000 pop 12.5 6 6.8 8.1 12.5 5.7 < .042
Convenience Stores w/ Gas/100,000 pop 28.4 3.8 39.9 10.7 28.4 3.7 < .001
Fast Food Restaurants /100,000 pop 63.8 16 44.6 24 63.8 13 < .001
Percent African American pop 13.9 13.5 2.5 3.3 15.6 12.6 < .001
Percentage of Diabetes 10.7 0.8 10.9 1.3 10.7 0.8 0.477
Percentage of Obesity 29.5 2.8 31.0 2.2 29.4 2.7 < .001
Poverty Rate 15 2.7 19.9 3.8 15 3.4 0.001
*IQR: Inter-quartile range
**Mann-Whitney U-Test
The availability of food stores and their correlation to obesity and diabetes, overall and
by urban, rural status are displayed in Table 3.a and Table 3.b.
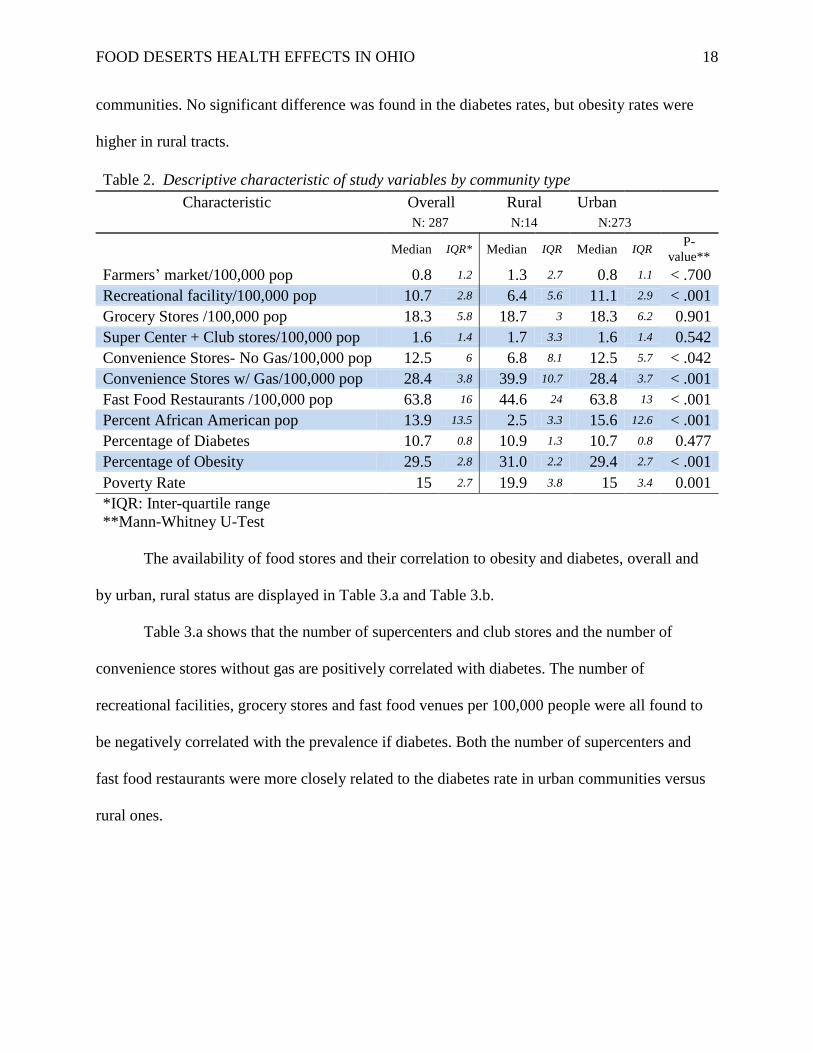
Table 3.a shows that the number of supercenters and club stores and the number of
convenience stores without gas are positively correlated with diabetes. The number of
recreational facilities, grocery stores and fast food venues per 100,000 people were all found to
be negatively correlated with the prevalence if diabetes. Both the number of supercenters and
fast food restaurants were more closely related to the diabetes rate in urban communities versus
rural ones.
FOOD DESERTS HEALTH EFFECTS IN OHIO
19
Table 3.a. Spearman Correlation for Diabetes Rates by Access and Availability of
Food Measures
Characteristic Overall Urban
Rural
Farmers’ market/100,000 pop 10.0 8.0 54.0
*
Recreational facility/100,000 pop -16.0 **
-17.0
12.0
Grocery Stores /1000 pop -12.0 * -11.0 -13.0
Super Center + Club stores/100,000 pop 25.0 **
24.0 **
17.0
Convenience Stores- No Gas 17.0 **
15.0 * 46.0
Convenience Stores w/ Gas 15.0 * 15.0
* -40.0
Fast Food Restaurants /100,000 pop -33.0 **
-36.0 **
11.0
Percent African American pop -11.0 -1.0
-8.0
Poverty Rate 15.0 * 15.0
* -20.0
*p<.05, **p<.01
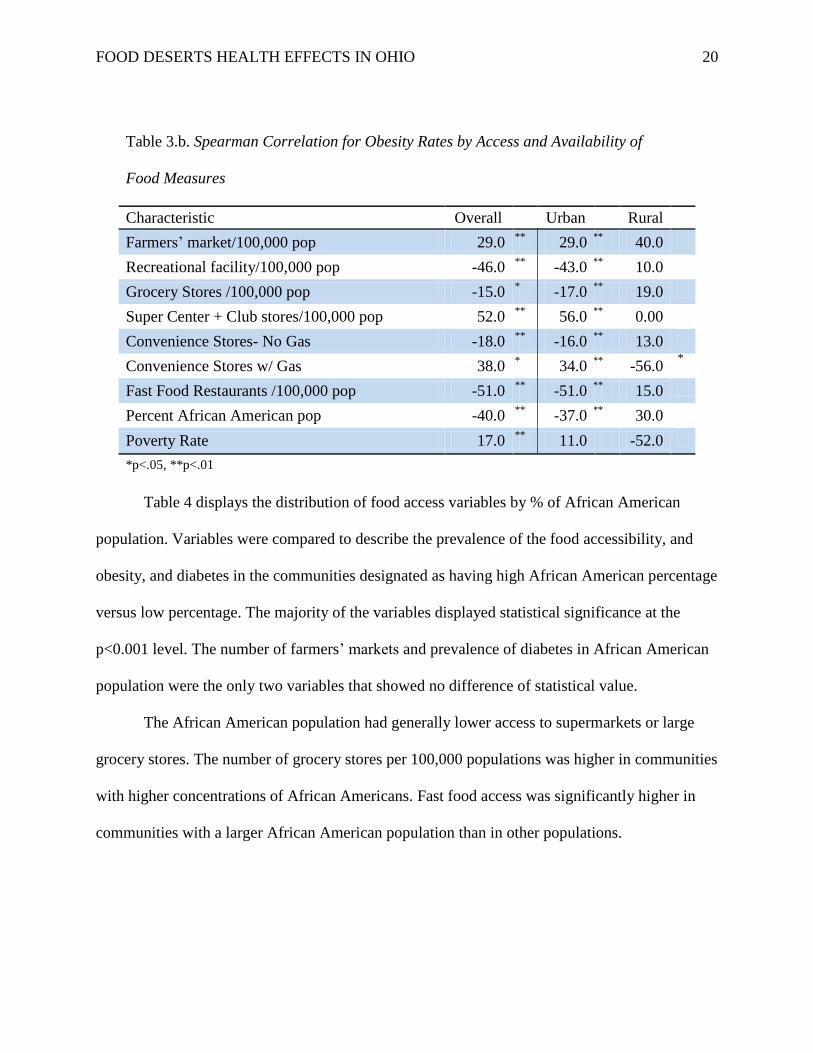
Table 3.b shows significant positive correlations between obesity and farmers’ markets,
supercenters and club stores, convenience stores carrying gas, and the tract’s poverty rate.
Negative correlations were made between obesity and recreational facilities, grocery stores,
convenience stores not offering gas, fast food restaurants, and the percentage of the population
comprised of African Americans. Statistically significant correlations were made between all of
our food access variables and obesity, except for the poverty rate. Among those correlations,
recreational facilities, grocery stores, convenience stores without gas, fast food restaurants, and
African American population were all negatively correlated with the rate of obesity. Concerning
urban census tracts, a relationship was cited between all food outcome variables and obesity
except the poverty rate. Farmers’ markets and supercenters were the only variables among them
that exhibited positive correlations.
FOOD DESERTS HEALTH EFFECTS IN OHIO
20
Table 3.b. Spearman Correlation for Obesity Rates by Access and Availability of
Food Measures
Characteristic Overall Urban Rural
Farmers’ market/100,000 pop 29.0 **
29.0 **
40.0
Recreational facility/100,000 pop -46.0 **
-43.0 **
10.0
Grocery Stores /100,000 pop -15.0 * -17.0
** 19.0
Super Center + Club stores/100,000 pop 52.0 **
56.0 **
0.00
Convenience Stores- No Gas -18.0 **
-16.0 **
13.0
Convenience Stores w/ Gas 38.0 * 34.0
** -56.0
*
Fast Food Restaurants /100,000 pop -51.0 **
-51.0 **
15.0
Percent African American pop -40.0 **
-37.0 **
30.0
Poverty Rate 17.0 **
11.0 -52.0
*p<.05, **p<.01
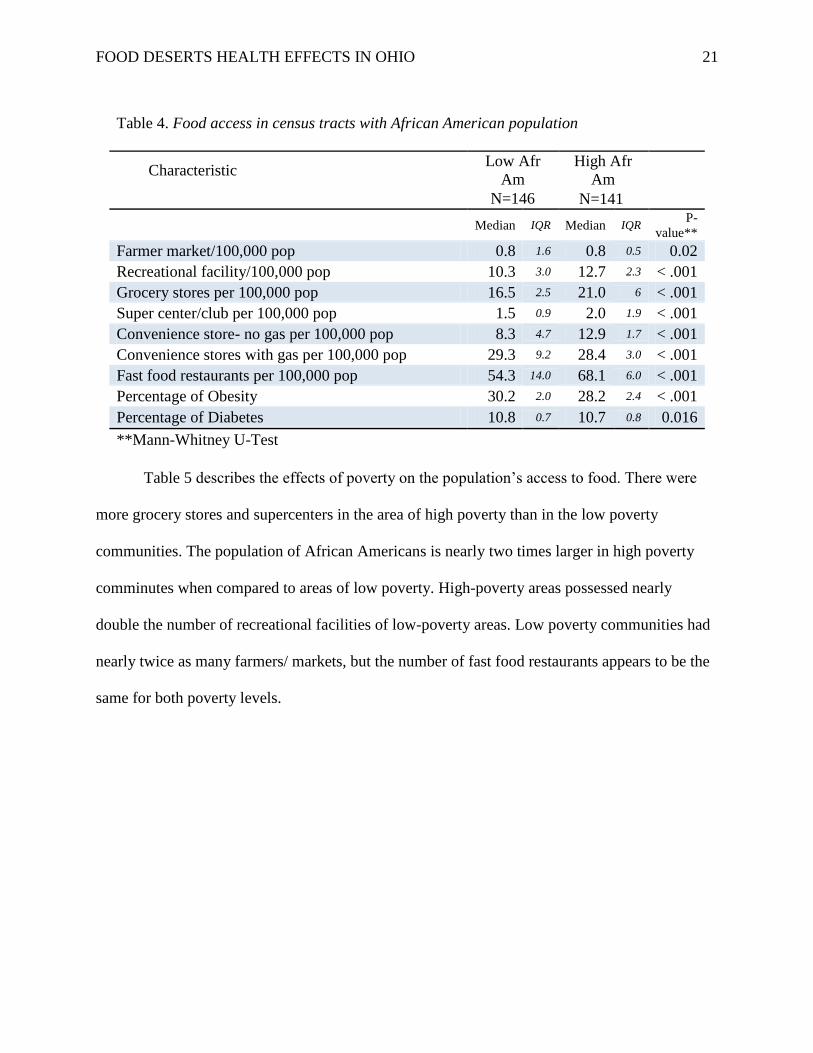
Table 4 displays the distribution of food access variables by % of African American
population. Variables were compared to describe the prevalence of the food accessibility, and
obesity, and diabetes in the communities designated as having high African American percentage
versus low percentage. The majority of the variables displayed statistical significance at the
p<0.001 level. The number of farmers’ markets and prevalence of diabetes in African American
population were the only two variables that showed no difference of statistical value.
The African American population had generally lower access to supermarkets or large
grocery stores. The number of grocery stores per 100,000 populations was higher in communities
with higher concentrations of African Americans. Fast food access was significantly higher in
communities with a larger African American population than in other populations.
FOOD DESERTS HEALTH EFFECTS IN OHIO
21
Table 4. Food access in census tracts with African American population
Characteristic Low Afr
Am
High Afr
Am
N=146 N=141
Median IQR Median IQR
P-
value**
Farmer market/100,000 pop 0.8 1.6 0.8 0.5 0.02
Recreational facility/100,000 pop 10.3 3.0 12.7 2.3 < .001
Grocery stores per 100,000 pop 16.5 2.5 21.0 6 < .001
Super center/club per 100,000 pop 1.5 0.9 2.0 1.9 < .001
Convenience store- no gas per 100,000 pop 8.3 4.7 12.9 1.7 < .001
Convenience stores with gas per 100,000 pop 29.3 9.2 28.4 3.0 < .001
Fast food restaurants per 100,000 pop 54.3 14.0 68.1 6.0 < .001
Percentage of Obesity 30.2 2.0 28.2 2.4 < .001
Percentage of Diabetes 10.8 0.7 10.7 0.8 0.016
**Mann-Whitney U-Test
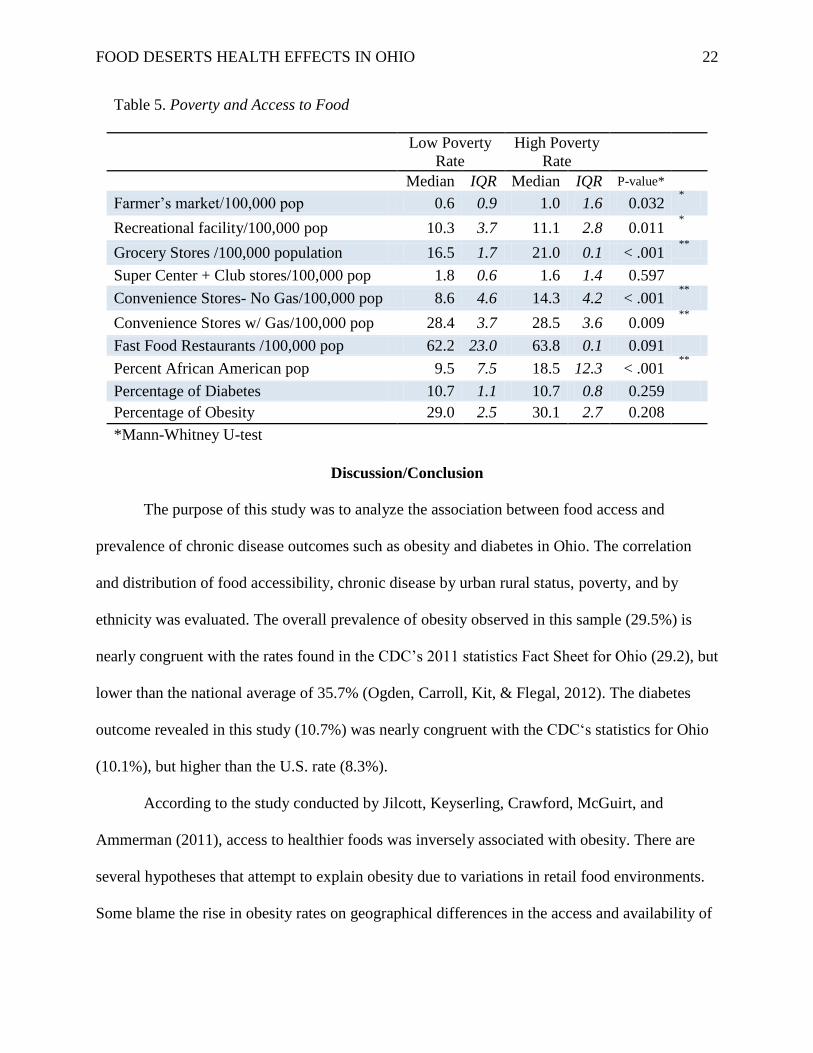
Table 5 describes the effects of poverty on the population’s access to food. There were
more grocery stores and supercenters in the area of high poverty than in the low poverty
communities. The population of African Americans is nearly two times larger in high poverty
comminutes when compared to areas of low poverty. High-poverty areas possessed nearly
double the number of recreational facilities of low-poverty areas. Low poverty communities had
nearly twice as many farmers/ markets, but the number of fast food restaurants appears to be the
same for both poverty levels.
FOOD DESERTS HEALTH EFFECTS IN OHIO
22
Table 5. Poverty and Access to Food
Low Poverty
Rate
High Poverty
Rate
Median IQR Median IQR P-value*
Farmer’s market/100,000 pop 0.6 0.9 1.0 1.6 0.032 *
Recreational facility/100,000 pop 10.3 3.7 11.1 2.8 0.011 *
Grocery Stores /100,000 population 16.5 1.7 21.0 0.1 < .001 **
Super Center + Club stores/100,000 pop 1.8 0.6 1.6 1.4 0.597
Convenience Stores- No Gas/100,000 pop 8.6 4.6 14.3 4.2 < .001 **
Convenience Stores w/ Gas/100,000 pop 28.4 3.7 28.5 3.6 0.009 **
Fast Food Restaurants /100,000 pop 62.2 23.0 63.8 0.1 0.091
Percent African American pop 9.5 7.5 18.5 12.3 < .001 **
Percentage of Diabetes 10.7 1.1 10.7 0.8 0.259
Percentage of Obesity 29.0 2.5 30.1 2.7 0.208
*Mann-Whitney U-test
Discussion/Conclusion
The purpose of this study was to analyze the association between food access and
prevalence of chronic disease outcomes such as obesity and diabetes in Ohio. The correlation
and distribution of food accessibility, chronic disease by urban rural status, poverty, and by
ethnicity was evaluated. The overall prevalence of obesity observed in this sample (29.5%) is
nearly congruent with the rates found in the CDC’s 2011 statistics Fact Sheet for Ohio (29.2), but
lower than the national average of 35.7% (Ogden, Carroll, Kit, & Flegal, 2012). The diabetes
outcome revealed in this study (10.7%) was nearly congruent with the CDC‘s statistics for Ohio
(10.1%), but higher than the U.S. rate (8.3%).
According to the study conducted by Jilcott, Keyserling, Crawford, McGuirt, and
Ammerman (2011), access to healthier foods was inversely associated with obesity. There are
several hypotheses that attempt to explain obesity due to variations in retail food environments.
Some blame the rise in obesity rates on geographical differences in the access and availability of
FOOD DESERTS HEALTH EFFECTS IN OHIO
23
foods, which results in disparities in the environment surrounding the retail food venues. This
observation is supported by the current study which showed that the accessibility of super centers
and club stores was correlated to prevalence of obesity, as was the number of convenience stores
with gas and farmers markets.
Studies conducted in the U.S. and Canada have shown that there exists neighborhood
differences in the price and availability of food, with healthier foods being generally more
expensive and less readily available in communities of lower SES (Morland, Wing, Diez-Roux,
& Poole, 2002). A study conducted by Horowitz, Colson, Herbert, and Lancaster (2004) reported
that only 18 percent of grocery stores in low SES neighborhoods stocked foods associated with
the recommended diet, as compared to 58 percent of grocery stores in high SES neighborhoods.
Neff, Palmer, Mckenzie, and Lawrence (2009) found price of food is a key factor for purchasing
decisions of consumers. Cost is significantly more important in low-income areas of non-white
households versus high income areas of white households (Basil, Maibach, Goldberg, & Snyder,
1998; Macintyre, 2007). Evidence proves that the higher the price of healthier foods the more it
contributes to poor diets in the low-income populations (Neff, Palmer, Mckenzie, & Lawrence,
2009). It was also found that in this study, access to grocery stores and recreational facilities was
not dependent on poverty level.
In the current study a significantly higher percentage of low-income population and a
higher percentage of African American population in Ohio had low access to a supermarket or
large grocery store. Counter-intuitively, it was noted that there were more grocery stores and
supercenters per 100,000 population in documented communities with high African American
populations. In their study in 2008, Ford and Dzewaltowski hypothesized that neighborhoods of
low SES with high concentrations of minorities have limited access to healthy foods, suggesting
FOOD DESERTS HEALTH EFFECTS IN OHIO
24
that they live in poor-quality retail food environments. Zenk et al. (2005) reported that socially
disadvantaged neighborhoods comprised primarily of African Americans were, on average, 1.1
miles further from nearest supermarket compared to predominately white neighborhoods within
the same socioeconomic classification. African Americans were more likely to live in a food
desert. A study by Moore and Diez Roux (2006) found that minority and racially mixed
neighborhoods, after controlling for population ratio, had more small grocery stores and fewer
supermarkets than white neighborhoods. Matthew Salois (2011) concluded in his study that a
one-percent increase in the percentage of black in a population increases the diabetes rate by
0.06%, and the obesity rate by 0.09%. Another study by Morland, Diez-Roux, and Wing (2006)
found that the greatest prevalence of overweight and obesity was found in communities with
combination of no supermarkets and one or more grocery stores and/or convenience stores. This
finding coincided with the findings of the current study, that the presence of convenience stores
was directly related to the number of diabetes cases.
In this study, a positive relationship was cited between the number of farmers’ markets
per capita and the diabetes rate in that area. Conversely, study by Salois (2011) concluded that
the density of farmers’ markets was found to be negatively related to the prevalence of diabetes,
and those additional farmers’ markets per 1,000 people was associated with 0.05% increase in
diabetes rate. He also found that every additional no gas convenience store per 1,000 people
increases the diabetes rate by 2.04%.
Limitations
Some limitations of this study should be noted. First, two different data sets were used in
analysis. County-level and census track-level data were merged, which could explain some of the
ambiguity within the findings. Second, because the data used in this study was not collected on
FOOD DESERTS HEALTH EFFECTS IN OHIO
25
an individual level, no generalizations concerning the population as a whole can be made. The
influence of the African-American population on the food access variables was not clear, perhaps
due to majority of African Americans residing in urban areas. There was uncertainty to conclude
if the findings were so because the community in question was urban, or because there was a
high African American population present. Another weakness in this study is that there are
several definitions of food desert, and without there being one unified definition, it is difficult to
make recommendations on how to remedy their prevalence. There were very few published
research studies regarding association between food deserts and diabetes with which to compare
the findings of this study.
Strengths
There were some strengths of this study. The data analyzed were the most recent which
was only made available online for public use during 2010. The concept of food deserts is
relatively new in public health field; we were able to explore its association with a number of
socio-demographic variables and its relationship with obesity and diabetes. The analysis
incorporated data from almost all counties in Ohio that were available in the Food Desert Atlas
which allowed us to present a possible snapshot of the effects of food deserts on health
outcomes.
FOOD DESERTS HEALTH EFFECTS IN OHIO
26
References
An, R. M., & Sturm, R. P. (2012). School and Residential Neighborhood Food Environment and
Diet Among California Youth. American Journal of Preventive Medicine, 42(2), 129-
135.
Basil, K. G., Maibach, E., Goldberg, J., & Snyder, D. (1998). Why Americans eat what they do:
taste, nutrition, cost, convenience, and weight conttol concerns as influences on food
comsumption. Journal of the American Dental Associations, 98, 1118-1126.
Bauer, K. (2004, January 20). Price and Availability Matter. The New York Times.
Beaulac, J., Kristjansson, E., & Cummins, S. (2009). A Systematic Review of Food
Deserts,1966-2007. Preventing Chronic Disease, 6(3), A105.
Bitler, M. H. (2009). An Economic View of Food Deserts in the United States. Understanding the
Economic Concepts and Characteristics of Food Access. Department of Agriculture-
Economic Research Service (USDA-ERS).
Breneman, V., & Ver Ploeg, M. (2009). U.S. Department of Agriculture Economic Research
Service. Retrieved from Food Desert Locator:
http://www.ers.usda.gov/data/fooddesert/documentation.html
CDC. (2012, 1 30). Food environments and obesity—neighbourhood or nation? Retrieved from
National Center for Chronic Disease Prevention and Health Promotio.
Committee Reports 2007 Farm Bill for Senate Consideration. (n.d.). Retrieved from
Hoosieragtoday.com.
Department of Health and Human Services. (1990). Healthy People 2000. Washington, D.C.:
U.S. Government Printing Office.
FOOD DESERTS HEALTH EFFECTS IN OHIO
27
Department of Health and Human Services. (2000). Healthy People 2010. Washington, D.C.:
U.S. Government Printing Office.
Department of Health and Human Services. (2005). 2005 Dietary Guidelines for Americans and
Healthy People.
Department of Health and Human Services. (2009). Healthy People 2010 Mid Course Review.
Department of Health and Human Services. (2009). Strategic Plan 2010-2015. Retrieved 2012,
from DHHS: www.hhs.gov/secretary/about/priorities/priorities.html
Dinour, L.M., Bergen, D., & Yeh, M. C. (2007). The Food insecurity-obesity paradox: a review
of the literature and the role food stamps may play. Journal of the American Dietetic
Association, 107(11), 1952-1961.
Horowitz, C. R., Colson, D. A., Herbert, P. L., & Lancaster, K. (2004). Barriers to buying
healthy foods for people with diabetes: evidence of environemntal disparities. Am J Pub
Health, 94(9), 1549-1554.
Jeffrery, R., Baxter, J., McGuire, M., & Linde, J. (2006). Correction: Are fast food restaurants an
environmental risk factor for obesity? International Journal of Behavioral Nutrition and
Physical Activity, 3, 35.
Jilcott, S. B., Keyserling, T. M., Crawford, T. P., McGuirt, J. T., & Ammerman, A. S. (2011,
April). Eamining Associations among Obesity and Per Capita Farmers' Markets, Grocery
Stores/Supermarkets, and Supercenters in US Counties. American Dietetic Association,
11(4), 567-572.
Kant, A. K., Graubraud, B. I., & Kumanyika, S. K. (2007). Trends in black-white differentials in
dietary intakes of US adults, 1971-2002. American Journal of Preventive Medicine,
32(4), 264-272.
FOOD DESERTS HEALTH EFFECTS IN OHIO
28
Macintyre, S. (2007). Deprivation amplification revisited; or is it always true that poorer places
have poorer access to resources for healthy diets and physical activity? International
Journal of Behavioral Nutrition and Physical Activity, 4, 32.
Mari Gallagher Research & Consulting Group. (2010). The Food Desert & Food Balance
Community Fact Sheet. Chicago: Mari Gallagher Research & Consulting Group.
Moore, L. V., & Diez Roux, A. D. (2006). Associations of neighborhood characteristics with the
location and type pf food stores. American Journal of Public Health, 96(2), 325-331.
Morland, K., Diez-Roux, A. V., & Wing, S. (2006). Supermarkets, other food stores, and
obesity: the atherosclerosis risk in communities study. American Journal of Preventive
Medicine, 30(4), 333-339.
Morland, K., Wing, S., Diez-Roux, A., & Poole, C. (2002). Neighbourhood characteristics
associated with the location of food stores and food service places. American Journal of
Preventive Medicine, 22(1), 23-29.
Murphy, B. (2011). Living in a Food Desert: How Lack of Access to Healthy Foods Can Affect
Public Health. Washington, DC: National Academies Press.
National Center for Health Statistics. (2009). Health, United States.
Neff, R. A., Palmer, A. M., Mckenzie, S. E., & Lawrence, R. S. (2009). Food Systems and
Public Health Disparities. Journal of Hunger & Environmental Nutrition, 4, 282-314.
Nord, M., Andrews, M., & Carlson, S. (2007). Household Food Security in the United States.
Economic Research Report No. (ERR-66).
Nord, M., Colemen-Jensen, A., Andrews, M., & Carlson, S. (2010). Household Food Security in
the United States, 2009. Economic Research Service; USDA.
FOOD DESERTS HEALTH EFFECTS IN OHIO
29
Ogden, C. L., Carroll, M. D., Kit, B. K., & Flegal, K. M. (2012). Prevalence of Obesity in the
United States 2009-2010. Hyattsville, MD: National Center for Health Statistics.
Ogden, C., & Carroll, M. (2008). Prevalence of Obesity Among Children and Adolescents:U.S.
Trends 1963-1965 through 2007-2008. Retrieved 2012, from CDC:
www.cdc.gov/nchs/data/hestat/obesity_child_07_08/obesity_child_07_08.pdf
Salois, M. J. (2011). Obesity and diabetes, the built environment, and the 'local' food economy in
the United States. Economy & Human Biology, 10(1), 35-42.
Schumacher, G., Nischan, M., & Simon, D. B. (2011). We Can Pay the Farmer or We Can Pay
the Hospital 2011. Good Food For All: Healthy Food Access and Affordability.
Simopoulos, A. P. (2011). Importance of the Omega-6/Omega-3 Balance in Health and Disease:
Evolutionary Aspect of Diet. In N. a. World Council on Genetics, Healthy Agriculture,
Healthy (pp. 102:10-21). Switzerland: Karger.
Sparks, A. L., Bania, N., & Leete, L. (2011). Comparative Approaches to Measuring Food Acces
in Urban Areas: The Case of Portland, Oregon. Urban Studies, 48(8) 1715-1737.
Steyn, N. M., Mann, J., Bennett, P. H., Temple, N., Zimmet, P., Tuomilehto, J., Lindstrom, J., &
Louheranta, A. (2007). Diet, Nutrition and the prevention of type 2 diabetes. Public
Health Nutrition, 7(1A), 147-165.
Story, M., Kaphingst, K. M., Robinson-O'Brien, R., & Glanz, K. (2008). Creating Healthy Food
and Eating Environments: Policy and Environmental Approachese. Annual Review of
Public Health, 29, 253-272.
USDA. (2012, 1). USDA. Retrieved 2012, from www.choosemyplate.gov.
Ver Ploeg, M., Breneman, V., Farrigan, T., Hamrick, K., Hopkins, D., Kaufman, P., et al. (2009).
Access to affordable and nutritious food: measuring and understanding food deserts and
FOOD DESERTS HEALTH EFFECTS IN OHIO
30
their consequences: Report to Congress. Retrieved November 16, 2009, from USDA
Publications: http://www.ers.usda.gov/Publications/AP/AP036/
White House Task Force on Childhood Obesity, 2010. (2010). Solving the problem of childhood
obesity within a generation- White House Task Force on Childhood Obesity report to the
President. Retrieved from www.letsmove.gov: www.letsmove.gov/white-house-task-
force-childhood-obesity-report-president
Wilson, L. A. (1994). Nutrition and food cost study. Alameda County Social Services Agency.
Wu, S. Y., & Green, A. (2000). Projection of chronic illness prevalence and cost inflation. RAND
Health.
Yeh, M.-C., & Katz, D. L. (2006). Food, Nutrition and Health of Urban Populaitons. In N.
Freeudenberg, S. Galea, & D. Vlahov, Cities And the Health of the Public (pp. 106-118).
Vanderbilt University Press.
Zenk, S. N., Odoms-Young, A. M., Dalla, C., Hardy, E., Watkins, A., Hoskins-Wroten, J., et al.
(2011). "You have to Hunt for the Fruits, the Vegetables": Environmental Barries and
Adaptive Strategies to Acquire Food in a Low-Income African American Neighborhood.
Health, Education and Behavior, 38(3) 282-292.
Zenk, S. N., Schulz, A. J., Israel, B. A., James, S. A., Bao, S., & Wilson, M. L. (2005).
Neighborhood racial composition, neighborhood poverty, and supermarket accessibility
in metropolitan Detroit. American Journal of Public Health, 95(4), 660-667.
FOOD DESERTS HEALTH EFFECTS IN OHIO
31
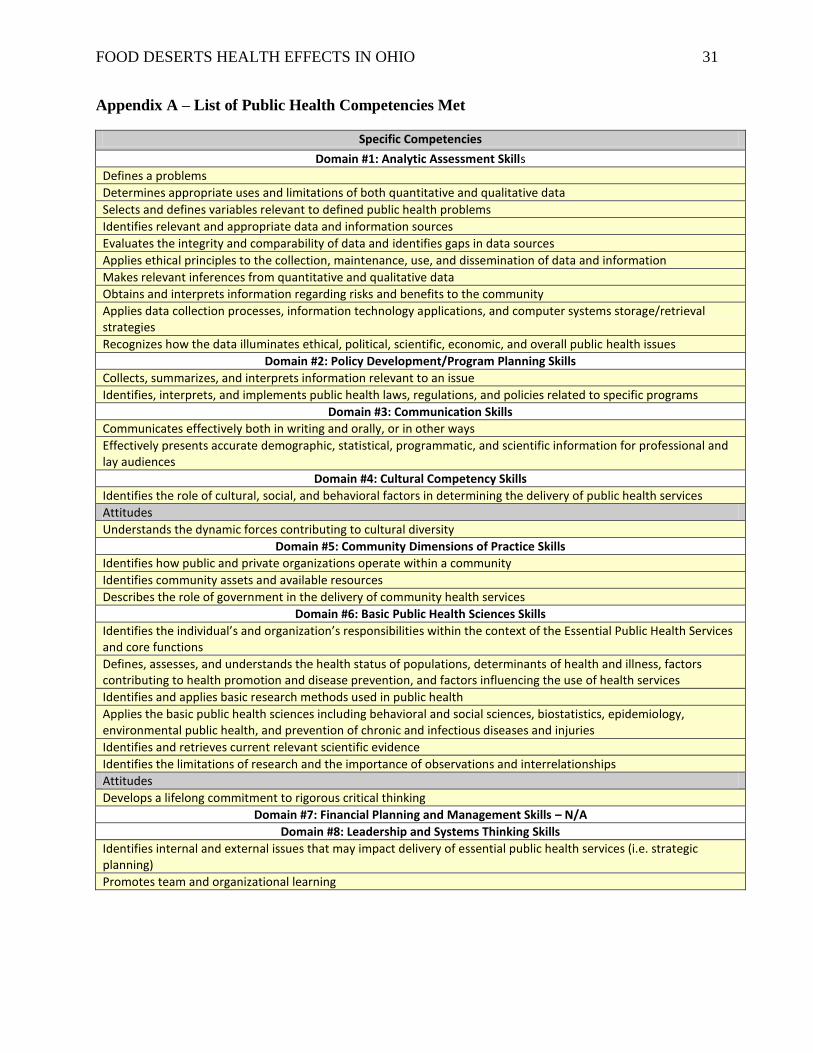
Appendix A – List of Public Health Competencies Met
Specific Competencies
Domain #1: Analytic Assessment Skills
Defines a problems
Determines appropriate uses and limitations of both quantitative and qualitative data
Selects and defines variables relevant to defined public health problems
Identifies relevant and appropriate data and information sources
Evaluates the integrity and comparability of data and identifies gaps in data sources
Applies ethical principles to the collection, maintenance, use, and dissemination of data and information
Makes relevant inferences from quantitative and qualitative data
Obtains and interprets information regarding risks and benefits to the community
Applies data collection processes, information technology applications, and computer systems storage/retrieval strategies
Recognizes how the data illuminates ethical, political, scientific, economic, and overall public health issues
Domain #2: Policy Development/Program Planning Skills
Collects, summarizes, and interprets information relevant to an issue
Identifies, interprets, and implements public health laws, regulations, and policies related to specific programs
Domain #3: Communication Skills
Communicates effectively both in writing and orally, or in other ways
Effectively presents accurate demographic, statistical, programmatic, and scientific information for professional and lay audiences
Domain #4: Cultural Competency Skills
Identifies the role of cultural, social, and behavioral factors in determining the delivery of public health services
Attitudes
Understands the dynamic forces contributing to cultural diversity
Domain #5: Community Dimensions of Practice Skills
Identifies how public and private organizations operate within a community
Identifies community assets and available resources
Describes the role of government in the delivery of community health services
Domain #6: Basic Public Health Sciences Skills
Identifies the individual’s and organization’s responsibilities within the context of the Essential Public Health Services and core functions
Defines, assesses, and understands the health status of populations, determinants of health and illness, factors contributing to health promotion and disease prevention, and factors influencing the use of health services
Identifies and applies basic research methods used in public health
Applies the basic public health sciences including behavioral and social sciences, biostatistics, epidemiology, environmental public health, and prevention of chronic and infectious diseases and injuries
Identifies and retrieves current relevant scientific evidence
Identifies the limitations of research and the importance of observations and interrelationships
Attitudes
Develops a lifelong commitment to rigorous critical thinking
Domain #7: Financial Planning and Management Skills – N/A
Domain #8: Leadership and Systems Thinking Skills
Identifies internal and external issues that may impact delivery of essential public health services (i.e. strategic planning)
Promotes team and organizational learning


![Obesity Diabetes and Complications[1]](https://img.pdfslide.us/doc/110x75/544958b7af7959a0538b47b6/obesity-diabetes-and-complications1.jpg)