Embed Size (px)
Citation preview

China Energy & Climate ProjectTSINGHUA - MIT
Food benefit and climate warming potential of nitrogen fertilizer uses in China*
Hanqin Tian, Chaoqun Lu, Jerry Melillo, Wei Ren, Yao Huang, Xiaofeng Xu, Mingliang Liu, Chi Zhang, Guangsheng Chen, Shufen Pan, Jiyuan Liu
and John Reilly
*Reprinted from Environmental Research Letters: 7(4): 044020 Copyright © 2012 with kind permission from IOP Publishing Ltd
Reprint 2012-27

The MIT Joint Program on the Science and Policy of Global Change combines cutting-edge scientific research with independent policy analysis to provide a solid foundation for the public and private decisions needed to mitigate and adapt to unavoidable global environmental changes. Being data-driven, the Program uses extensive Earth system and economic data and models to produce quantitative analysis and predictions of the risks of climate change and the challenges of limiting human influence on the environment—essential knowledge for the international dialogue toward a global response to climate change.
To this end, the Program brings together an interdisciplinary group from two established MIT research centers: the Center for Global Change Science (CGCS) and the Center for Energy and Environmental Policy Research (CEEPR). These two centers—along with collaborators from the Marine Biology Laboratory (MBL) at Woods Hole and short- and long-term visitors—provide the united vision needed to solve global challenges.
At the heart of much of the Program’s work lies MIT’s Integrated Global System Model. Through this integrated model, the Program seeks to: discover new interactions among natural and human climate system components; objectively assess uncertainty in economic and climate projections; critically and quantitatively analyze environmental management and policy proposals; understand complex connections among the many forces that will shape our future; and improve methods to model, monitor and verify greenhouse gas emissions and climatic impacts.
This reprint is one of a series intended to communicate research results and improve public understanding of global environment and energy challenges, thereby contributing to informed debate about climate change and the economic and social implications of policy alternatives.
Ronald G. Prinn and John M. Reilly,Program Co-Directors
For more information, contact the Program office:
MIT Joint Program on the Science and Policy of Global ChangePostal Address: Massachusetts Institute of Technology77 Massachusetts Avenue, E19-411Cambridge, MA 02139 (USA)Location: Building E19, Room 411400 Main Street, CambridgeAccess: Tel: (617) 253-7492Fax: (617) 253-9845Email: [email protected]: http://globalchange.mit.edu/
© International Monetary Fund. Reprinted with Permission. The views expressed in this paper belong solely to the authors. Nothing contained in this paper should be reported as repre-senting IMF Policy or the views of the IMF, its Executive Board, member governments, or an other entity mentioned herin.

IOP PUBLISHING ENVIRONMENTAL RESEARCH LETTERS
Environ. Res. Lett. 7 (2012) 044020 (8pp) doi:10.1088/1748-9326/7/4/044020
Food benefit and climate warmingpotential of nitrogen fertilizer uses inChinaHanqin Tian1,7, Chaoqun Lu1, Jerry Melillo2, Wei Ren1, Yao Huang3,Xiaofeng Xu1, Mingliang Liu1, Chi Zhang1,4, Guangsheng Chen1,Shufen Pan1, Jiyuan Liu5 and John Reilly6
1 International Center for Climate and Global Change Research, and School of Forestry and Wildlife
Sciences, Auburn University, Auburn, AL 36849, USA2 The Ecosystem Center, Marine Biological Laboratory, Woods Hole, MA 02543, USA3 Institute of Botany, Chinese Academy of Sciences, Beijing 100093, People’s Republic of China4 Xinjiang Institute of Ecology and Geography, Chinese Academy of Sciences, Urumqi 830011,
People’s Republic of China5 Institute of Geographical Sciences and Natural Resources Research, Chinese Academy of Sciences,
Beijing 100101, People’s Republic of China6 Joint Program on Science and Policy of Global Change, Massachusetts Institute of Technology,
77 Massachusetts Avenue, Cambridge, MA 02139, USA
E-mail: [email protected]
Received 24 July 2012
Accepted for publication 11 October 2012
Published 31 October 2012
Online at stacks.iop.org/ERL/7/044020
AbstractChemical nitrogen (N) fertilizer has long been used to help meet the increasing food demands
in China, the top N fertilizer consumer in the world. Growing concerns have been raised on
the impacts of N fertilizer uses on food security and climate change, which is lack of
quantification. Here we use a carbon–nitrogen (C–N) coupled ecosystem model, to quantify
the food benefit and climate consequence of agronomic N addition in China over the six
decades from 1949 to 2008. Results show that N fertilizer-induced crop yield and soil C
sequestration had reached their peaks, while nitrous oxide (N2O) emission continued rising as
N was added. Since the early 2000s, stimulation of excessive N fertilizer uses to global climate
warming through N2O emission was estimated to outweigh their climate benefit in increasing
CO2 uptake. The net warming effect of N fertilizer uses, mainly centered in the North China
Plain and the middle and lower reaches of Yangtze River Basin, with N2O emission
completely counteracting or even exceeding, by more than a factor of 2, the CO2 sink. If we
reduced the current N fertilizer level by 60% in ‘over-fertilized’ areas, N2O emission would
substantially decrease without significantly influencing crop yield and soil C sequestration.
Keywords: China, crop yield, CO2 uptake, N2O emission, nitrogen fertilizer
S Online supplementary data available from stacks.iop.org/ERL/7/044020/mmedia
Content from this work may be used under the terms
of the Creative Commons Attribution-NonCommercial-
ShareAlike 3.0 licence. Any further distribution of this work must maintain
attribution to the author(s) and the title of the work, journal citation and DOI.
7 Address for correspondence: School of Forestry and Wildlife Sciences,
Auburn University, 602 Duncan Drive, Auburn, AL 36849, USA.
1. Introduction
To meet increasing food demands for feeding 22% of the
world’s population, China has used chemical nitrogen (N)
fertilizer for more than 50 years as one of the most important
11748-9326/12/044020+08$33.00 c© 2012 IOP Publishing Ltd Printed in the UK

Environ. Res. Lett. 7 (2012) 044020 H Tian et al
agronomic practices to stimulate crop production (Huang et al2007, Galloway et al 2008, Vitousek et al 2009). During
2007–8, China ranked as the top consumer of N fertilizer,
accounting for 32% of global N consumption (Heffer 2009).
Per-hectare anthropogenic N additions in many fields of
China, especially for typical double-, triple-cropping systems,
surpassed those in the United States and Northern Europe (Ju
et al 2009, Vitousek et al 2009).
Numerous field-based studies have proved that excessive
N fertilizer application would reduce air and water quality,
rather than further stimulate crop yield (Tilman et al2002, Yan et al 2010, Sutton et al 2011). Besides,
N fertilization has the potential to affect the climate
system in two important ways. On the one hand, it can
stimulate carbon storage in soils associated with increased
plant production, and thereby reduce the atmosphere’s
carbon dioxide (CO2) content (Melillo et al 2010, Tian
et al 2011a). On the other hand, it can lead to the
increased production of nitrous oxide (N2O), a more potent
greenhouse gas (GHG) than CO2 (Liu and Greaver 2009,
Zaehle et al 2011). A recent study (Lu et al 2009)
showed that N fertilizer uses were estimated to sequester
5.96 Tg C yr−1 (1 Tg = 1012 g) in China’s cropland and
that the potential C sequestration rate may reach up to
12.1 Tg C yr−1, a significant ‘carbon benefit’. But some
scientists cast doubt on this ‘carbon benefit’, arguing a
complete analysis of the benefit must consider N2O emission
induced by N fertilizer application (Huang and Tang 2010,
Schlesinger 2010). The concurrent effects of N fertilizer
application on crop yield, soil C sequestration and biogenic
N2O emissions across the entire nation are not well studied.
The inherent complexity of this issue requires a systems
approach that is capable of addressing non-linear and
interactive ecosystem processes in agricultural land.
In this study, we simultaneously estimated changes in
the yields of major crops (maize, rice, spring wheat, winter
wheat, soybean, barley and others) and the net fluxes of CO2
and N2O induced by N fertilizer uses across China’s cropland
during 1949–2008, by using a C–N coupled, processes-based
ecosystem model, the Dynamic Land Ecosystem Model
(DLEM, Tian et al 2011a, 2011b). The model simulations
were driven by spatially-explicit data on N fertilizer uses
and other environmental factors such as climate, atmospheric
CO2, tropospheric O3, N deposition, land use and land cover
change. Besides the historical model simulation, we set up
several additional experiments to examine how crop yield,
soil C sequestration, and net balance of CO2 and N2O would
respond to four different levels of N fertilizer reduction.
2. Methods
2.1. Data and model
We developed historical gridded data sets to characterize
changes in N fertilizer application and other environmental
factors, including climate, atmospheric CO2 concentration,
O3 pollution, N deposition, land use and cover patterns, in
China’s terrestrial ecosystems with a spatial resolution of
10 km × 10 km during 1900–2008. Historical N fertilizer
application data were retrieved from the county-level census
data during 1981–2008 and the provincial tabular data during
1950–2008 shown in China Statistical Yearbook (National
Bureau of Statistics, NBS, www.stats.gov.cn/). We counted
30% of compound fertilizer as chemical N input. N fertilizer
applied on agricultural land averaged 21.11 g N m−2 yr−1
in 2008, increasing by 4 g N m−2 yr−1 per decade since
1950. The highest N fertilizer uses occurred in some areas
of the North China Plain for double-cropping systems and
lower reaches of the Yangtze River for triple-cropping systems
(figure 1). The detailed information on other input drivers can
be found in our published papers (Tian et al 2011a, 2011b,
Ren et al 2011, Lu et al 2012). These input drivers were
used to force the global C–N coupled ecosystem model, the
DLEM, to examine how N fertilizer uses in China’s cropland
have affected crop yield, soil C sequestration, and net fluxes
of two major greenhouse gases (CO2 and N2O) since 1949.
The DLEM model has been well calibrated and intensively
validated against various field observations from the Chinese
Ecological Research Network (CERN), and other long-term
N fertilization experiments (Tian et al 2011a, 2011b, Ren
et al 2011, Lu et al 2012). For this study, we adopted global
warming potential (GWP) to calculate the time-integrated
radiative forcing of 1 kg greenhouse gas emission relative
to that of 1 kg CO2 (Forster et al 2007). According to the
Fourth IPCC Report, N2O has a 298 times higher radiative
forcing than CO2 at a 100 yr time horizon. Our study focused
on the period 1949–2008, since chemical fertilizer uses were
assumed to be 0 in China before 1949 due to the lack of
long-term records.
2.2. Simulation experiments
We set up a series of model simulation experiments
to distinguish the impacts of N fertilizer application in
agricultural land: (1) all combined experiment, in which
all the driving factors change over the period 1900–2008.
(2) Combined without N fertilization change, with no
application of chemical N fertilizer while other factors change
throughout the study period. The difference between these two
experiments indicated the effects of N fertilizer application
and its interaction with other environmental changes.
In order to examine the modeled responses of crop
yield, soil organic carbon (SOC) storage change and GHG
balance to better N management practices, we conducted
sensitivity analysis by setting up five additional simulation
experiments driven by four N fertilizer reduction scenarios
and one control scenario (no N fertilizer application change
since 1900) spanning another 20 yr after 2008 to capture the
legacy effect of N fertilizer use. These sensitivity simulation
experiments did not include future climate scenarios. From
climate change perspectives, we firstly identified areas with
average N-induced GWP of CO2 and N2O larger than 0 during
2000–8 as ‘over-fertilized’ regions where the proportion of
CO2 sink offset by N2O emission exceeds 100%. Then
we assigned four levels of N fertilizer reduction in those
‘over-fertilized’ areas: 0% (baseline, N fertilizer use keeping
2

Environ. Res. Lett. 7 (2012) 044020 H Tian et al
Figure 1. Spatial distribution of N fertilizer uses in China’s agricultural land in 1990 (a) and 2008 (b).
constant at the current level, i.e., 2008), 20% (total amount
of N fertilizer applied is equivalent to the level of late
1990s), 40% (equivalent to the level of early 1990s) and 60%
(equivalent to the level of the late 1980s), while keeping N
input in the remaining areas constant at the current level.
Except N fertilizer application, other environmental forces
were kept unchanged since 2008. The differences between
the four N reduction experiments and control experiment
were calculated to show the responses of China’s cropland
to different gradients of N fertilizer reduction. We used
the N-induced changes relative to baseline simulation (0%
reduction) to analyze the sensitivity of key variables to
different gradients of N fertilizer reduction.
2.3. Evaluation of model performance
In this study, we validated model performance in simulating
responses of crop yield, soil C sequestration and N2O
emission against the estimates from census and multiple N
fertilization experiments (SBC 2000, Lu et al 2009, Gao et al2011). The detailed data source and validation results can be
found in the supplementary information (available at stacks.
iop.org/ERL/7/044020/mmedia). Overall, the DLEM model is
proved to perform well in simulating the dynamics in crop
yield, soil C storage and GHG balance in response to N
enrichment in China’s cropland.
2.4. Statistical analysis
By using SPSS 20, we performed a Durbin–Watson (DW)
test to examine whether serial correlation exists in N-induced
CO2 uptake and N2O emission during 2000–8. We found
negative serial correlation in N2O emission, but the DW
test is inconclusive for CO2 uptake. After eliminating serial
correlation through a Cochrane–Orcutt iterative procedure, we
conducted a T test to check if the absolute means of modified
CO2 uptake and N2O emission are statistically different from
each other regardless of their opposite direction. In order to
assess the uncertainty of model estimates, we compared the
modeled soil C sequestration and N2O emission induced by N
enrichment with field experiments. RMSD (root-mean-square
deviation) was adopted to indicate the difference between
the model estimate and observed values in groups of upland
crop and paddy fields. We then used CV (RMSD), the
RMSD normalized to the mean of multi-site observed values,
to calculate the weighted-average uncertainty of regional
estimates for N-induced CO2 uptake and N2O emission.
3. Results and discussion
3.1. N fertilizer-induced crop yield and soil organic Csequestration
As simulated by DLEM, crop yield and SOC were enhanced
by N fertilizer application at the annual rates of 1.8 Tg
C yr−1 and 1.3 Tg C yr−1, respectively, during the period
1949–90. Crop yield and SOC storage reached their peaks
in the early 2000s and 1990s, respectively. The N-induced
soil C sequestration rate even began to decline thereafter
(figure 2(a)). Although the N-induced crop yield slightly
increased from 93 Tg C yr−1 in the 1990s to 98 Tg C
yr−1 during the recent 9 yr (2000–8), we found that the
relative contribution of chemical N fertilizer uses to crop yield
was estimated to decrease from 53% to 49% over the past
two decades. It implied that the importance of chemical N
fertilizer in determining crop yield declined in recent years
due to overuses of N fertilizer and increased contributions
from other factors such as genetic improvement. Our findings
are supported by emerging lines of evidence (Zhu and Chen
2002, Guo et al 2010) that partial factor productivity from
fertilized N (PFPN, calculated as the crop yield per unit
nitrogen applied) declined in many fields of China in recent
years, although the amount of N added as chemical fertilizer
kept rising (supplementary figure S1 available at stacks.iop.
org/ERL/7/044020/mmedia), implying that N fertilizer has
been increasingly overused and N use efficiency in sustaining
3

Environ. Res. Lett. 7 (2012) 044020 H Tian et al
Figure 2. (a) Soil carbon sequestration, and crop yield induced by N fertilizer application in China’s cropland during 1949–2008.(b) Global warming potential (GWP, unit: Tg CO2 eq yr−1) of CO2 uptake and N2O emission induced by N fertilizer application in China’scropland during 1949–2008. Note: GWP of CO2 uptake is negative and surpassed N2O emission before 2002, whereas climate changemitigation potential estimated from an increased CO2 sink under N fertilizer application was totally offset by N2O in recent years.
China’s food security shrank. Experimental evidence also
shows that N added in intensive double-cropping systems of
China can be cut by 30–60% without significantly diminishing
crop yield, yet reducing N loss to the environment by more
than 50% (Ju et al 2009).
The accumulation rate of SOC due to anthropogenic N
input also slowed, averaging 32 Tg C yr−1 during 2000–8,
compared to 48 Tg C yr−1 estimated across China’s cropland
in the 1990s. The continuous rise in N fertilization rate might
not further stimulate C accumulation in agricultural soils
because crop productivity in response to N addition began
to decline in large areas of China, which resulted in less C
entering into the soil. In addition, long-term N fertilization
experiments revealed that the more labile soil carbon fraction,
including microbial and plant residues, is prone to being
decomposed rather than accumulating with more available N
(Neff et al 2002).
3.2. N fertilizer-induced GHG fluxes
Over the entire study period, N2O emissions continued to rise
as N fertilization rate increased. Direct N2O emissions from
N fertilizer uses in China was estimated to increase from 222
Gg N yr−1 (1 Gg = 109 g) in the 1990s to 369 Gg N yr−1
throughout the recent 9 years. On a national scale, the average
N2O emission factor grew from 1.0% of fertilizer applied in
the 1990s to 1.4% during 2000–8, indicating that the surplus
N was increasingly released, instead of being retained in the
agricultural ecosystem.
In terms of GWP, our simulations indicated that N fertil-
izer application acted as a small mitigator of climate warming
in the early part of the study period through an N-stimulated
CO2 sink. This sink began to be offset by N2O emissions
from the 1970s onwards. Since 2002, N fertilizer-induced
climate warming through N2O emissions has exceeded the
cooling effect due to CO2 storage in China’s croplands
(figure 2(b)). Over the past decade (2000–8), we found
that agronomic N-induced CO2 uptake (−117.3 ± 42.5 Tg
CO2 eq yr−1, mean ± RMSD) was statistically different (p <
0.05) from N2O emission (172.8 ± 43.0 Tg CO2 eq yr−1,
mean ± RMSD) even in their absolute magnitude. Up to
2008, the net GWP totaled 73 Tg CO2 eq yr−1, with N2O
emissions offsetting CO2 uptake by 166%. CO2 uptake and
N2O emission showed an even larger statistical difference
(p < 0.001) after removing serial correlations.
Climate consequences of N fertilizer application in
terms of GHG balance showed large spatial variability
(figure 3). The largest CO2 sink and N2O source both
occurred in the North China Plain and the middle and lower
reaches of Yangtze River Basin, where typical double- and
triple-cropping systems have been used and high-level N
fertilizer has been applied (figures 3(a)–(d)). Compared to the
1990s, the largest CO2 sink shown in the mid-mainland of
China began to diminish, while the maximum N2O source
continued to expand over the recent 9 years. Our study shows
that the net warming effect associated with N fertilizer uses
mainly centered in intensively managed crop systems, with
N2O emission completely counteracting or even exceeding,
4

Environ. Res. Lett. 7 (2012) 044020 H Tian et al
Figure 3. Global warming potential of (a), (b) CO2, and (c), (d) N2O, and (e), (f) offset ratio of N2O emission to CO2 sink induced by Nfertilizer application in China’s cropland during the 1990s (left panel) and the period 2000–8 (right panel).
by more than a factor of 2, the CO2 sink during the recent
9 years (color yellow to orange in figure 3(f)). Only a small
portion of China’s cropland still played a mitigating role for
the local and global climate system, with CO2 uptake largely
offset by the concurrently released N2O from soils (color blue
to green in figure 3(f)).
3.3. Sensitivity analysis of N fertilizer reductions
We assumed that N fertilizer uses in ‘over-fertilized’ areas of
China (defined as offset ratio larger than 100% in figure 3(f))
would be reduced by 0% (baseline, continue applying N
fertilizer in current rate), 20%, 40% and 60%, and used
these four N fertilizer reduction levels to extend the model
simulations for another 20 years. The ‘what-if’ experiments
are able to reveal the likely patterns of crop yield, soil C
storage and net GWP of CO2 and N2O fluxes in response to
different N management strategies. Amazingly, our simulation
showed that both crop yield and soil C sequestration induced
by N fertilizer uses would decrease, but not change much
with N fertilizer reductions compared to those driven by
current N fertilizer use rate. For example, 60% of N
reduction would lead to an N-induced crop yield decrease of
1.88 Tg C yr−1 or 2%, compared to the experiment continuing
fertilizer application at the current rate. However, direct
agricultural N2O emission would significantly decrease along
with less N fertilizer inputs (table 1). Compared to the
baseline, N-induced N2O emission would decrease by 99 Tg
CO2 eq yr−1, or 49.8%, with N fertilizer reduced by 60%
of the current level in ‘over-fertilized’ areas. We also found
that the amount of N leached out of the ecosystem largely
decreased with N fertilizer reductions while plant N uptake
remained with no significant changes. This implied that in
‘over-fertilized’ areas N fertilizer reduction as high as 60%
would substantially decrease the loss of excessive N, alleviate
air and water pollution, while not apparently suppressing crop
yield.
With N fertilizer reduced by 40%–60%, the modeled
CO2 uptake in China’s cropland showed a small decrease of
8.5%–15.8% compared to that driven by current fertilizer use
rate (table 1). However, N2O emission would largely decrease
as N fertilizer use reduces. For example, as simulated by
5
Environ. Res. Lett. 7 (2012) 044020 H Tian et al
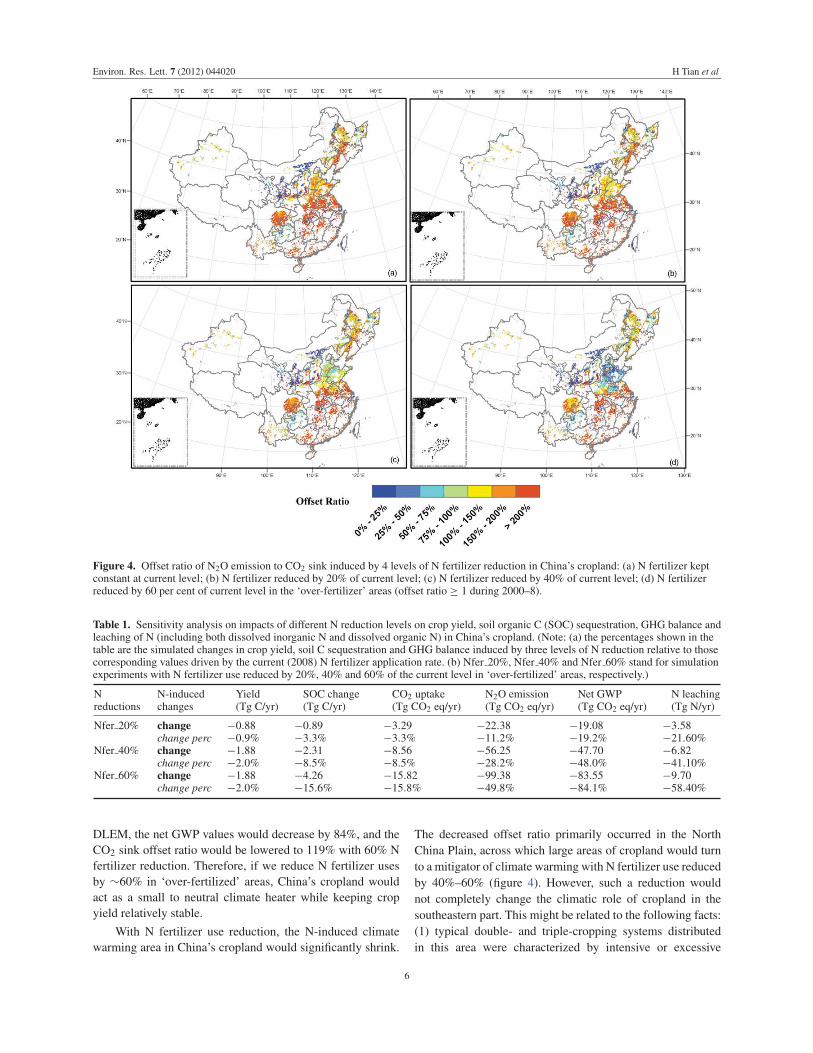
Figure 4. Offset ratio of N2O emission to CO2 sink induced by 4 levels of N fertilizer reduction in China’s cropland: (a) N fertilizer keptconstant at current level; (b) N fertilizer reduced by 20% of current level; (c) N fertilizer reduced by 40% of current level; (d) N fertilizerreduced by 60 per cent of current level in the ‘over-fertilizer’ areas (offset ratio ≥ 1 during 2000–8).
Table 1. Sensitivity analysis on impacts of different N reduction levels on crop yield, soil organic C (SOC) sequestration, GHG balance andleaching of N (including both dissolved inorganic N and dissolved organic N) in China’s cropland. (Note: (a) the percentages shown in thetable are the simulated changes in crop yield, soil C sequestration and GHG balance induced by three levels of N reduction relative to thosecorresponding values driven by the current (2008) N fertilizer application rate. (b) Nfer 20%, Nfer 40% and Nfer 60% stand for simulationexperiments with N fertilizer use reduced by 20%, 40% and 60% of the current level in ‘over-fertilized’ areas, respectively.)
Nreductions
N-inducedchanges
Yield(Tg C/yr)
SOC change(Tg C/yr)
CO2 uptake(Tg CO2 eq/yr)
N2O emission(Tg CO2 eq/yr)
Net GWP(Tg CO2 eq/yr)
N leaching(Tg N/yr)
Nfer 20% change −0.88 −0.89 −3.29 −22.38 −19.08 −3.58change perc −0.9% −3.3% −3.3% −11.2% −19.2% −21.60%
Nfer 40% change −1.88 −2.31 −8.56 −56.25 −47.70 −6.82change perc −2.0% −8.5% −8.5% −28.2% −48.0% −41.10%
Nfer 60% change −1.88 −4.26 −15.82 −99.38 −83.55 −9.70change perc −2.0% −15.6% −15.8% −49.8% −84.1% −58.40%
DLEM, the net GWP values would decrease by 84%, and the
CO2 sink offset ratio would be lowered to 119% with 60% N
fertilizer reduction. Therefore, if we reduce N fertilizer uses
by ∼60% in ‘over-fertilized’ areas, China’s cropland would
act as a small to neutral climate heater while keeping crop
yield relatively stable.
With N fertilizer use reduction, the N-induced climate
warming area in China’s cropland would significantly shrink.
The decreased offset ratio primarily occurred in the North
China Plain, across which large areas of cropland would turn
to a mitigator of climate warming with N fertilizer use reduced
by 40%–60% (figure 4). However, such a reduction would
not completely change the climatic role of cropland in the
southeastern part. This might be related to the following facts:
(1) typical double- and triple-cropping systems distributed
in this area were characterized by intensive or excessive
6

Environ. Res. Lett. 7 (2012) 044020 H Tian et al
agronomic N inputs; (2) other N sources such as higher N
deposition and mineralized N due to faster turnover in this
region provide a large amount of soil available N, which is the
major substrate of N2O production.
3.4. Uncertainty and research needs
While using a systems approach to simultaneously examine
N fertilizer impact on crop yield, soil C storage and GHG
balance, our estimated responses may have some uncertainties
for several reasons. First, we ignored growth limitations from
other nutrients such as potassium (K) and phosphorus (P),
and made the assumption of an optimized irrigation strategy
without water logging (Ren et al 2011) which might, to
a small degree, have led us to overestimate the responses
of crop yield to anthropogenic N additions. Second, we
included maize, rice, spring wheat, winter wheat, soybean,
barley and other crops in China to represent both upland
and paddy fields, and then assumed N fertilizer use per unit
harvest area of grain crops in each county was the same as
that of cash crops such as vegetable and fruits. The harvest
area of cash crops accounted for more than one fifth of
China’s arable and permanent crop area in 2005, with N
fertilizer consumption over 30% of the national total (Heffer
2009). This simplification might, on the one hand, cause our
underestimation on the decline of N-induced crop yield and
the increase of N2O emission, since cash crops tend to be more
fertilizer intensive, and less effective in using N than grain
crops. On the other hand, our simulation might overestimate
N2O emission, since implementation of a soil testing and
fertilizer recommendation (STFR) program in some areas
of China over 2001–8 was shown to reduce chemical N
fertilizer uses and consequently decrease N2O emission from
wheat, rice and maize crops (Sun and Huang 2012). Third,
our optimized water management (mid-season drainage)
assumption would partly overestimate N2O emission, as
dry–wet alteration in paddy fields was proved to stimulate
nitrification and denitrification processes, and therefore favor
N2O emission (Zou et al 2010). However, the resulting bias
would not radically change our major conclusion.This study does not consider CO2 emission from N
fertilizer production, transport and application (Huang and
Tang 2010, Schlesinger 2010). Indirect N2O emissions
derived from re-deposition of volatilized N and N leached
to downstream aquatic ecosystems (Zaehle et al 2011) are
excluded here. If considering these two components, the
stimulating effect of N fertilizer uses on climate warming
would be higher than that estimated in this study. In addition
to stimulating climate warming, excessive N fertilizer uses
contributed to increasing the potential N pollution and
eutrophication in downstream aquatic ecosystems (table 1).
Taking both atmospheric and aquatic environment costs into
account is urgently needed for assessing the impacts of
agronomic N input in future studies.
4. Conclusion
Past research efforts have led to a growing recognition that
N fertilizer is commonly overused in China’s agricultural
production and has widely caused environmental problems.
However, few studies have considered the climate conse-
quences of excessive N fertilizer application in China. From
our study we draw the following conclusions: (1) crop yield
in China was substantially boosted by chemical N fertilizer
uses over the past decades, but it was shown to barely
further increase with surplus N input in recent years; (2) SOC
accumulation induced by N added in cropland reached its peak
in the 1990s and has since declined ; (3) overuse of chemical
N fertilizer in China has led to an expanding warming effect,
with direct N2O emission offsetting the soil carbon sink by
166% in 2008; (4) the largest net sources of greenhouse gases
associated with agronomic N addition have occurred in the
North China Plain and in the middle and lower reaches of
the Yangtze River Basin, where intensively managed crop
systems are located; (5) if we reduce N fertilizer use by
60% in the ‘over-fertilized’ region, N-induced crop yield
and SOC sequestration would slightly decrease, but direct
N2O emission would substantially decrease, and China’s
cropland would act as a small to neutral climate heater while
keeping crop yield relatively stable; (6) The most apparent
mitigation of climate warming due to N fertilizer reduction
practices would occur in the North China Plain. Our research
suggests that enhancing N use efficiency instead of increasing
N inputs in the future would be more effective to sustain
China’s food security and cropland soil C sequestration, and
diminish the climate warming and water pollution aggravated
by anthropogenic N enrichment.
Acknowledgments
This study has been supported by NASA IDS Program
(NNG04GM39C), NASA LCLUC Program (NNX08AL73G),
and the National Basic Research Program of China
(2010CB950900) and (2010CB950604). We appreciate two
anonymous reviewers for their valuable suggestions in
improving this manuscript.
References
Forster P et al 2007 Changes in atmospheric constituents and inradiative forcing Climate Change 2007: The Physical ScienceBasis. Contribution of Working Group I to the FourthAssessment Report of the Intergovernmental Panel on ClimateChange ed S Solomon, D Qin, M Manning andZ Chen (Cambridge: Cambridge University Press) pp 129–234
Galloway J N et al 2008 The environmental reach of Asia Annu.Rev. Environ. Resour. 33 461–81
Gao B, Ju X, Zhang Q, Christle P and Zhang F 2011 New estimatesof direct N2O emissions from Chinese croplands from 1980 to2007 using localized emission factors Biogeosciences8 3011–24
Guo J H et al 2010 Significant acidification in major Chinesecroplands Science 327 1008–10
Heffer P 2009 Assessment of Fertilizer Use by Crop at the GlobalLevel 2006/07–2007/08 (Paris: International Fertilizer IndustryAssociation) (www.fertilizer.org)
Huang Y and Tang Y 2010 An estimate of greenhouse gas (N2O andCO2) mitigation potential under various scenarios of nitrogenuse efficiency in Chinese croplands Glob. Change Biol.16 2958–70
7
Environ. Res. Lett. 7 (2012) 044020 H Tian et al
Huang Y, Zhang W, Sun W and Zheng X 2007 Net primaryproduction of Chinese croplands from 1950 to 1999 Ecol.Appl. 17 692–701
Ju X T et al 2009 Reducing environmental risk by improving Nmanagement in intensive Chinese agricultural systems Proc.Natl Acad. Sci. USA 106 3041–6
Liu L and Greaver T L 2009 A review of nitrogen enrichment effectson three biogenic GHG: the CO2 sink may be largely offset bystimulated N2O and CH4 emission Ecol. Lett. 12 1103–17
Lu C Q et al 2012 Effects of nitrogen deposition on China’sterrestrial carbon uptake in the context of multi-factorenvironmental changes Ecol. Appl. 22 53–75
Lu F et al 2009 Soil carbon sequestrations by nitrogen fertilizerapplication, straw return and no-tillage in China’s croplandGlob. Change Biol. 15 281–305
Melillo J M, Kicklighter D W, Tian H Q and Butler S 2010Fertilizing change: carbon–nitrogen interactions and carbonstorage in land ecosystems Handbook of Climate Change andAgroecosystems: Impacts, Adaptation, and Mitigationed D Hillel and C Rosenzweig (London: Imperial CollegePress) pp 21–36
Neff J C et al 2002 Variable effects of nitrogen additions on thestability and turnover of organic carbon Nature 419 915–7
Ren W et al 2011 Spatial and temporal patterns of CO2 and CH4
fluxes in China’s croplands in response to multifactorenvironmental changes Tellus B 63 222–40
SBC (Statistics Bureau of China) 2000 Agricultural Database from1950 to 1999 (Beijing: China Statistics Press) (in Chinese)
Schlesinger W H 2010 On fertilizer-induced soil carbonsequestration in China’s croplands Glob. Change Biol.16 849–50
Sun W and Huang Y 2012 Synthetic fertilizer management forChina’s cereal crops has reduced N2O emissions since theearly 2000s Environ. Pollut. 160 24–7
Sutton M A et al 2011 Too much of a good thing Nature 472 159–61Tian H Q et al 2011a China’s terrestrial carbon balance:
Contributions from multiple global change factors Glob.Biogeochem. Cycles 25 GB1007
Tian H Q et al 2011b Net exchanges of CO2, CH4, and N2Obetween China’s terrestrial ecosystems and the atmosphere andtheir contributions to global climate warming J. Geophys. Res.116 G02011
Tilman D, Cassman K G, Matson P A, Naylor R andPolasky S 2002 Agricultural sustainability and intensiveproduction practices Nature 418 671–7
Vitousek P M et al 2009 Nutrient imbalance in agriculturedevelopment Science 324 1519–20
Yan W, Mayorga E, Li X, Seitzinger S P and Bouwman A F 2010Increasing anthropogenic nitrogen inputs and riverine DINexports from the Changjiang River basin under changinghuman pressures Glob. Biogeochem. Cycles 24 GB0A06
Zaehle S, Ciais P, Friend A D and Prieur V 2011 Carbon benefits ofanthropogenic reactive nitrogen offset by nitrous oxideemissions Nature Geosci. 4 601–5
Zhu Z L and Chen D L 2002 Nitrogen fertilizer use inChina—contribution to food production, impacts on theenvironment and best management strategies Nutri. CyclingAgroecosyst. 63 117–27
Zou J, Lu Y and Huang Y 2010 Estimates of synthetic fertilizerN-induced direct nitrous oxide emission from Chinesecroplands during 1980–2000 Environ. Pollut. 158 631–5
8

MIT JOINT PROGRAM ON THE SCIENCE AND POLICY OF GLOBAL CHANGE REPRINT SERIES Recent Issues
Joint Program Reprints are available free of charge (limited quantities). To order: please use contact information on inside of front cover.
2012-11 Using Land to Mitigate Climate Change: Hitting the Target, Recognizing the Trade-Offs, Reilly, J., J. Melillo, Y. Cai, D. Kicklighter, A. Gurgel, S. Paltsev, T. Cronin, A. Sokolov and A. Schlosser, Environmental Science & Technology, 46(11): 5672–5679 (2012)
2012-12 Development and application of earth system models, Prinn, R.G., Proceedings of the National Academy of Sciences, online first, www.pnas.org/cgi/doi/10.1073/pnas.1107470109 (2012)
2012-13 Emissions Pricing to Stabilize Global Climate, Bosetti, V., S. Paltsev, J. Reilly and C. Carraro, in Fiscal Policy to Mitigate Climate Change: A Guide for Policymakers. R. de Mooij, et al. (eds.), International Monetary Fund: Washington, D.C., pp. 49–67 (2012)
2012-14 The Impact of Border Carbon Adjustments Under Alternative Producer Responses, Winchester, N., American Journal of Agricultural Economics, 94(2): 354–359 (2012)
2012-15 Long-Range Atmospheric Transport of Polycyclic Aromatic Hydrocarbons: A Global 3-D Model Analysis Including Evaluation of Arctic Sources, Friedman, C.L. and N.E. Selin, Environmental Science & Technology, 46(17): 9501–9510 (2012)
2012-16 Marginal Abatement Costs and Marginal Welfare Costs for Greenhouse Gas Emissions Reductions: Results from the EPPA Model, Morris, J., S. Paltsev and J. Reilly, Environmental Modeling and Assessment, 17(4): 325–336 (2012)
2012-17 Economic Development under Climate Change, Arndt, C., P. Chinowsky, S. Robinson, K. Strzepek, F. Tarp an J. Thurlow, Review of Development Economics, 16(3): 369–377 (2012)
2012-18 Climate Change, Agriculture and Food Security in Tanzania, Arndt, C., W. Farmer, K. Strzepek and J. Thurlow, Review of Development Economics, 16(3): 378–393 (2012)
2012-19 Climate Change, Growth and Infrastructure Investment: The Case of Mozambique, Arndt, C., P. Chinowsky, K. Strzepek and J. Thurlow, Review of Development Economics, 16(3): 463–475 (2012)
2012-20 Power Ahead: Meeting Ethiopia’s Energy Needs Under a Changing Climate, Block, P. and K. Strzepek, Review of Development Economics, 16(3): 476–488 (2012)
2012-21 A Dynamic Eneral Equilibrium Analysis of Adaptation to Climate Change in Ethiopia, Robinson, S., D. Willenbockel and K. Strzepek, Review of Development Economics, 16(3): 489–502 (2012)
2012-22 Changing the Climate Sensitivity of an Atmospheric General Circulation Model through Cloud Radiative Adjustment, Sokolov, A. and E. Monier, J. Climate, 25(19): 6567–6584 (2012)
2012-23 Characterization of wind power resource in the United States, Gunturu, U.B. and C.A. Schlosser, Atmospheric Chemistry and Physics, 12: 9687–9702 (2012)
2012-24 The Canadian oil sands industry under carbon constraints, Chan, G., J.M. Reilly, S. Paltsev and Y.-H.H. Chen, Energy Policy, 50: 540–550 (2012)
2012-25 Influence of Air Quality Model Resolution on Uncertainty Associated with Health Impacts, Thompson, T.M. and N.E. Selin, Atmospheric Chemistry and Physics, 12: 9753–9762 (2012)
2012-26 The Impact of Climate Change on Crop Yields in Sub-Saharan Africa, Blanc, É., American Journal of Climate Change, 1(1): 1–13 (2012)
2012-27 Food Benefit and climate warming potential of nitrogen fertilizer uses in China, Tian, H., C. Lu, J. Melillo, W. Ren, Y. Huang, X. Xu, M. Liu, C. Zhang, G. Chen, S. Pan, J. Liu and J. Reilly, Environ. Res. Lett., 7(4): 044020 (2012)
For a complete list of titles see:http://globalchange.mit.edu/research/publications/reprints

MIT Joint Program
onThe Science and Policy of G
lobal ChangeM
assachusetts Institute of Technology77 M
assachusetts Avenue, E19-411Cam
bridge, MA
02139U
SA