Embed Size (px)
Citation preview

i
FOOD AND FEEDING HABITS OF MOZAMBIQUE TILAPIA Oreochromis
mossambicus (Peter, 1852) FROM HARDAP DAM, NAMIBIA
BY
JUVINARIES M. NYANDOTO
(200742183)
A research report in the Department of Fisheries and Aquatic Sciences submitted to the
Faculty of Agriculture and Natural Resources University of Namibia, in partial fulfillment
of the requirements for the award of the degree of Bachelor of Science in Fisheries and
Aquatic Sciences of the University of Namibia
SUPERVISOR
ESTERHUIZEN J. ALBERT
Department of Fisheries and Aquatic Sciences
University of Namibia,
Windhoek, Namibia.
November, 2010.

ii
ACKNOWLEDGEMENTS
My gratitude’s all those who assisted me directly or indirectly in preparing this work. Special
thanks go to my supervisor Mr. Esterhuizen Albert for his excellent supervision, patience and
constructive criticism, which moulded the study into its best.
I wish to express my sincere thanks to management of University of Namibia especially Faculty
of Agriculture and Natural Resources (Department of Fisheries and Aquatic Sciences) for grating
me a permission to conduct my research project in Hardap Dam.
NORAD through, Department of Fisheries and Aquatic Science, University of Namibia for has
great help me in financial and advice assistance throughout of my study.
To the Laboratory Technician, Mr. Akawa A. and Miss. Ekatjo L. I simply say keep the spirit up.
I appreciate your untiring support as we had to work even over weekend.
Special thanks should be extended to the Ministry of Fisheries and Marine Resources (Hardap
Dam) staff. Gratitude is also due to Mr. Benson. We felt at home at Hardap due to the hospitality
received from all members of staff. Thanks to you all a hundredfold.
Best compliments to Mr. Martin Tjipute, that day will always remain in our hearts, thanks for
saving our lives and for sparing time to read and make useful suggestions.
I thank God; the almighty who gave me good health, vision and wisdom throughout my study
period. His continuous blessing made this work successful.
Last but not least; I would like to extend my special thanks to my wife Efrazia, I say God richly
bless you for your patience, understanding and hard work they endured during my absence.

iii
DEDICATION
This work is dedicated to God who gives me life;
My mother, who has taught me that I can achieve anything in my life if I set mind to it;
My father who has taught me a love of nature;
My children Christopher and Elizabeth for missing me during this study.

iv
TABLE OF CONTENTS Page
ACKNOWLEDGEMENT……………………………………………………………………… ..i
DEDICATION…………………………………………………………………………………... ii
ABSTRACT…………………………………………………………………………………..… iv
1.0. INTRODUCTION ............................................................................................................................ 1
1.1. Habitat and Ecological tolerances ................................................................................................. 1
1.2. Social-Economic Importance ........................................................................................................ 2
1.3. Habitat and Ecological impacts..................................................................................................... 3
1.4. STUDY AREA (Hardap Dam).................................................................................................... 4
1.5. RESEARCH HYPOTHES ........................................................................................................... 5
2.0. MATERIALS AND METHODS ...................................................................................................... 6
2.1. Sample collection .......................................................................................................................... 6
2.2. Sample Preparation and Preservation ........................................................................................... 6
2.3. Laboratory analyses ...................................................................................................................... 9
2.4. Data Analysis .............................................................................................................................. 10
2.5. Food composition ........................................................................................................................ 10
2.6. Statistical analysis ....................................................................................................................... 11
3.0. RESULTS ....................................................................................................................................... 13
3.1. Copepods..................................................................................................................................... 15
3.2. Crustacea ..................................................................................................................................... 16
3.3. Blue green algae .......................................................................................................................... 16
3.4. Green algae ................................................................................................................................. 17
3.5. Diatoms ....................................................................................................................................... 18
3.6. Detritus ........................................................................................................................................ 19
4.0. DISCUSION ................................................................................................................................... 23
4.1. CONCLUSION ............................................................................................................................... 25
4.2. REFERENCES ............................................................................................................................... 26
4.3. APPENDENCES ............................................................................................................................ 35
v
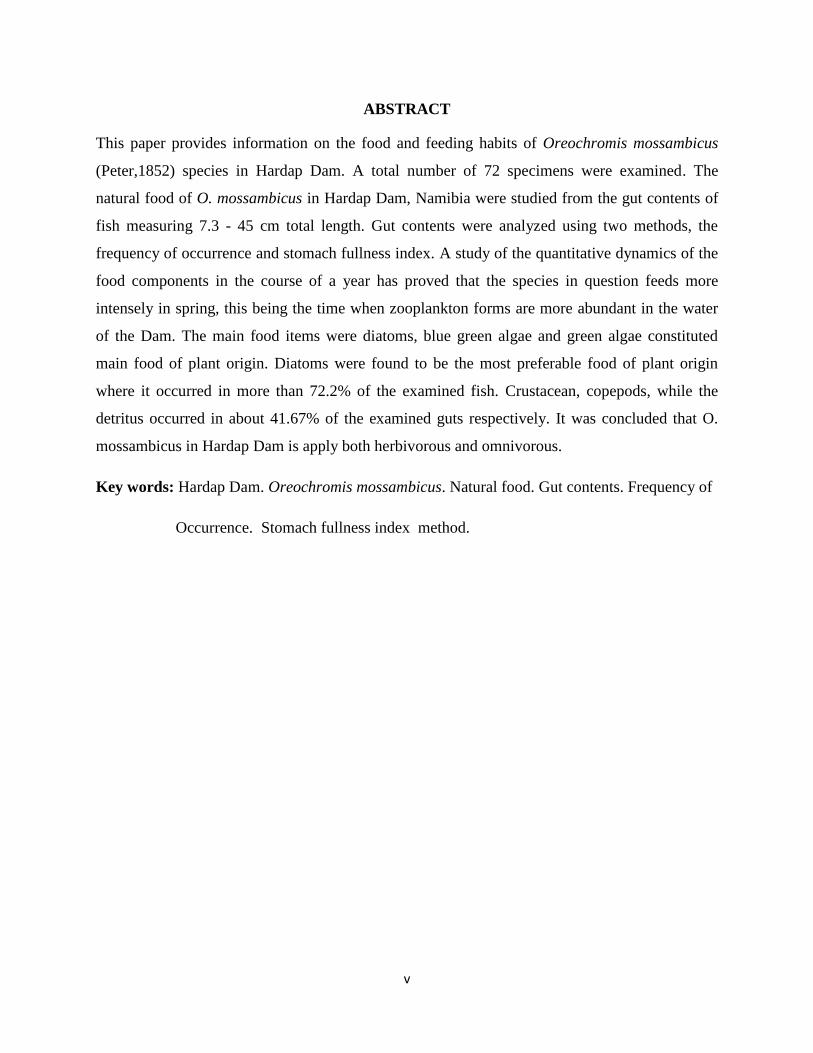
ABSTRACT
This paper provides information on the food and feeding habits of Oreochromis mossambicus
(Peter,1852) species in Hardap Dam. A total number of 72 specimens were examined. The
natural food of O. mossambicus in Hardap Dam, Namibia were studied from the gut contents of
fish measuring 7.3 - 45 cm total length. Gut contents were analyzed using two methods, the
frequency of occurrence and stomach fullness index. A study of the quantitative dynamics of the
food components in the course of a year has proved that the species in question feeds more
intensely in spring, this being the time when zooplankton forms are more abundant in the water
of the Dam. The main food items were diatoms, blue green algae and green algae constituted
main food of plant origin. Diatoms were found to be the most preferable food of plant origin
where it occurred in more than 72.2% of the examined fish. Crustacean, copepods, while the
detritus occurred in about 41.67% of the examined guts respectively. It was concluded that O.
mossambicus in Hardap Dam is apply both herbivorous and omnivorous.
Key words: Hardap Dam. Oreochromis mossambicus. Natural food. Gut contents. Frequency of
Occurrence. Stomach fullness index method.

1
1.0.INTRODUCTION
“Tilapia” is the generic name of a group of cichlids endemic to Africa. The group consists of
three aquaculturally important genera–including Oreochromis and Sarotherodon. Several
characteristics distinguish these three genera, but possibly the most critical relates to
reproductive behavior (Popma and Masser, 1999).
The Mozambique tilapia (Oreochromis mossambicus ) are native to Africa and occurs in the
coastal regions of eastern Africa (Skelton,1993). It has been introduced into at least 90 countries
some the countries are Swaziland, Malawi, Tanzania, Namibia, South Africa, Egypt and
Australia (western Australia and Queensland) and is important for food fish in many of those
countries (Maughan et al., 2007). Mozambique tilapia it was introduced in Namibia from the
western Cape in 1947, mainly for recreational angling purpose (Schrader, 1985).
1.1.Habitat and Ecological tolerances
Mozambique tilapia prefers to the environmental were the rivers flowing slow and streams and
still water habitats such as lakes and lagoons and in both fresh and brackish waters. A 'type'
habitat of the species is the lower Zambezi River, (eastern Africa, 18° 46'S) central Mozambique
(Maughan et al., 2007).
Mozambique tilapia is a remarkably hardy species and its success in exploiting new and diverse
habitats has been attributed, in part, to its tolerance of a wide range of environmental conditions
with enhance growth characteristics and environmental tolerances including to low temperature,
overcrowding stress and pathogens ( Behrends et al. 1990; Cnaani et al. 2000 and Cai et al.
2004).
Tilapia is a warm water, stenothermal species though potential habitat it can occupy is restricted
only by a limited tolerance of low temperature (Hickling 1963). Lower lethal temperatures
between 8 and 15°C have been reported (Smit et al. 1981; Philippart & Ruwet 1982). The
species has a thermal ‘zone of tolerance' between 15° and 37°C, and a limited tolerance of
temperatures between 39 and 40°C, with lethal temperatures at 41-42°C (Philippart & Ruwet

2
1982; Stauffer 1986). The species can also tolerate extremes of acidity and alkalinity, with low
oxygen and high and low pH values ranging between 3.7 and 10.3 (Krishna Murthy et al. 1981;
van Ginneken et al. 1997 and Leghari et al. 2004).
Lahser (1967) further reported that, O. mossambicus killed aquatic macrophytes while feeding on
periphyton such as diatoms, filamentous algae and cynobacteria. Leaves, stems and roots were
scraped or rasped to shreds; the plants were killed and consumed secondarily. Field observations
by Lahser showed that O. mossambicus eliminated several species of submerged and emergent
macrophytes, either by grazing or by uprooting plants.
Several studies have found that free bacteria and cynobacteria (Microcystic spp) to be a dominant
or frequent component in the herbivory to detritivory or between phytoplankitivory to
zooplanktivory) it is related to incidental feeding. When deposit feeding, fish may ingest a
mixture of sediment phytoplankton, detritus and small invertebrates, eg., copepods, virtually
indistinguishable to the diets of suspension feeders. O. mossambicus also undergoes ontogenetic
change in feeding with a shift from macrophage in fry and fingerlings (e.g., bacteria, diatoms,
microcrustacea, rotifers) to predominantly macrophage in adults (Vaas and Hofstede, 1952; Le
Roux, 1956; Bowen, 1976; Bowen & Allanson, 1982).
Mozambique tilapia has been reported from its native and introduced range as feeding on live
aquatic and submerged terrestrial plants, benthic algae, phytoplankton, periphyton (algae
attached to plants), zooplankton, and organic detritus (Hofstede & Botke, 1950; Pannikar &
Tampi, 1954; Man & Hodgkiss, 1977; Bowen, 1978, 79, 80a, 81; Aravindan, 1980; Dudgeon
1983; De Silva et al. 1984; De Silva, 1985; Dickman & Nanne, 1987; Blühdorn et al. 1990;
Milward and Webb, 1990; Webb, 1994; Kim et al. 2002).
1.2.Social-Economic Importance
According to Abdel-Aziz, and Gharib, (2007) recent studies on natural feeding of fish permit
to identify the trophic relationships present in aquatic ecosystems, identifying feeding
composition, structure and stability of food webs . In the same time, Oronsaye, & Nakpodia,

3
(2005); and Oso, Ayodele and Fagbuaro, (2006.) reported that the study of the food and feeding
habits of freshwater fish species is a subject of continuous research because it constituted the
basis for the development of a successful fisheries management programme on fish capture and
culture. Studies on diet composition are important in community ecology because the use of
resources by organisms has a major influence on population interactions within a community
(Mequilla, and Campos, 2007). Studies of species resources requirements have been used in
attempts to understand factors controlling the distribution and abundance of organisms (Ross,
1986). Data on different food items consumed by fish may eventually result in identification of
stable food preference and in creation of trophic models as a tool to understand complex
ecosystems as reported by Lopez-Peralta, & Arcila, (2002) and Bachok, Mansor and
Noordin, (2004).
Begum et al (2008), explained their food and feed habits and stated that food is the main source
of energy and plays an important role in determining the population levels, rate of growth and
condition of fishes. Food and feeding habits of fishes have a great significance in aquaculture
practice. It helps to select such species of fishes for culture which will utilize all the available
potential food of the water bodies without any competition with one another but will live in
association with other fishes (Begum et al, 2008).
1.3.Habitat and Ecological impacts
There are few reports that document the extent of impacts of predation by O. mossambicus on
other fish populations. Fuselier (2001) reported O. mossambicus feeding directly on fish eggs
and small endemic pupfish fish in a natural lake, contributing to population declines. Aravindan
(1980) also reported that O. mossambicus, in open riverine waters, supplemented its diet with
fish eggs and small fry.
The highly invasive Oreochromis mossambicus has been implicated in the decline or
disappearance of resident species from freshwater, estuarine and marine habitats in several
countries following its introduction (Maughan et al.,2007). It can have negative impacts on
aquatic communities through grazing or predation, interference competition (overcrowding) for
food and space, as a vector of disease-causing pathogens, or by activities which lead to changes
in the abiotic environment. For example, loss of water quality which may affect survivorship of

4
resident species. Lahser (1967), also observed increased turbidity in shallower margins due to
the activity of male fish clearing areas for courtship display pits that subsequently resulted in
further loss of photosynthetic production.
Cahoon, (1953); Noble et al. (1975); Forester and Lawrence, (1978) and Taylor et al,. (1984) all
have demonstrated that overcrowding by exotic fishes, including tilapias, such as Oreochromis
mossambicus, can have devastating effects on native species. Significant decreases in the size of
native fishes caught and overall contribution to fish production in several lakes and reservoirs in
India and Sri Lanka were reported, following the introduction of O. mossambicus (Natarajan,
1971; de Silva, 1988; Bhagat and Dwivedi, 1988).
Arthington and Blühdorn (1994) referred to an observations by Arthington and Milton that
analysis of fish diets from sub-tropical impoundments provided evidence that O. mossambicus
consumes small forage fish (rainbow fish and gudgeons) and that consumption of such fish and
aquatic invertebrates may be higher in water bodies with low primary productivity.
1.4.STUDY AREA (Hardap Dam)
The Hardap Dam was constructed in 1962 for irrigation purposes north of Mariental in the south
central part of Namibia. The Hardap Dam is primarily fed by the Great Fish River and has
capacity of 2500 ha (Hay et al., 1999). The Hardap Dam is the largest of its kind in Namibia with
a water surface area of about 25 sqkms (see plate 2). The Hardap is fed by the set in the Great
Fish River , the only river in the country’s interior that flows just about all year around, although
carrying very low quantities of water during dry season (Hay et al., 1999).

5
Fig. 1. The map of Hardap Dam, Namibia.
There is no published data available on feeding habits of O. mossambicus which represent the
major content of fish food available in large size of Hardap Dam. Therefore, this study aimed to
provide information about the main components of the diet of O. mossambicus in the Hardap
Dam Namibia for facilitating the sustainable aquaculture. To achieve this objective, the
following aims were formulated:
To identify feed component available in the Hardap Dam.
Establish possible existence for Preferences for certain feed types at different life stage.
To identify if feed components are restricted to water column, benthic only or entire water
spectrum.
1.5.RESEARCH HYPOTHES
H01: The are no significant feed components and feeding habits consumed by Oreochromis
mossambicus are restricted to water column on benthic only or entire water spectrum.

6
2.0.MATERIALS AND METHODS
2.1.Sample collection
The sample of Oreochromis mossambicus have been collected by using small boat fixing with
outboard engines and seine net. A total number of 72 fishes of different size, maturity and sex
groups were collected randomly from different places at Hardap Dam, during the period of
September to October, 2010, by using seine net 10mm mesh size and gill net 73mm, 93mm,
118mm, 150mm mesh size as indicated in figure 2, 3 and figure 4 indicate different areas where
samples was collected. Immediately after collection the fishes were preserved in a container with
water and were then are transferred to the laboratory, where the fishes were washed, cleaned and
their total length was measured in millimeters and weight in grams. All sample specimens were
dissected and their gut removed by the following method.
The abdominal cavity was opened by a longitudinal mid-ventral incision. The small intestine
was severed posterior to the pyloric valve, and the stomach freed by cutting through the muscular
esophagus (see figure 5).
2.2.Sample Preparation and Preservation
Immediately after gutting, the stomachs were removed from the fish and kept to the sampling
bottles were preserved in a 10% formalin solution to avoid post mortem digestion. A label
bearing the date, the locality, the method, and time of capture, the species name, name of
observer, and gears used was placed to the each sampling bottles.
Stomachs were weighed nearest 0.45 g were recorded. The samples were transferred from
laboratory of Ministry of Fisheries and Marine Resources (Hardap) to the University of Namibia
fisheries laboratory room for further analysis, (figure 5).

7
Fig.2. Indicate pulling seine net out of the water. Fig.3. Preparation for setting gillnet
.
Fig.4. Indicate sample are preserved into formalin. Fig.5.Researcher analyzing stomach contents.

8
Fig. 6: The map of Hardap Dam indicate the sites where sample are collected.
Fig.7. Indicate the method used to gut the fish.

9
Fig. 8. Indicate stomachs were dissected and the contents were emptied into a Petri-dish.
2.3.Laboratory analyses
In the laboratory, the stomachs were leached in fresh water for a period of 12 to 24 hours to
remove excess formalin. The stomachs were dissected and the contents were emptied into a
Petri-dish (figure 8).
All of the stomach contents were carefully removed on to Petri-dish by using forceps. The
contents were diluted into 40ml distilled water. The stomach contents of individuals fishes were
analyzed by using a light microscope and the bimonthly data were grouped by season. A drop of
the sample was taken from the bottle and put on a Haematocytometer with a volume of
0.00025mm3
where it was observed using a light microscope at different magnifications. The
numbers of individuals identified in the Haematocytometer were multiplied by 160 to correct
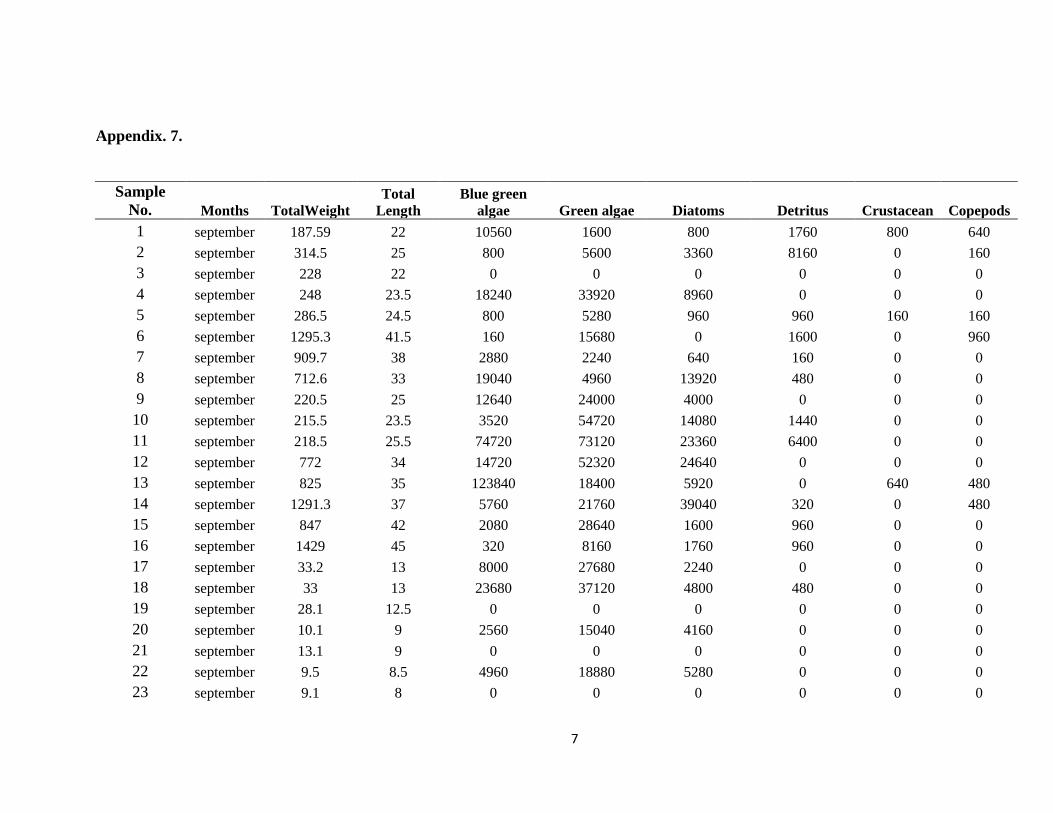
40ml dilution. The number of empty stomachs was also recorded. Field Guide to Zambian
Fishes, Planktons and Aquaculture (Utsugi and Mazingaliwa, 2002) were used to identify the
phytoplankton and zooplankton up to phylum level. The number of species or group of
organisms was recorded to the data sheet (Appendix 7). Microphotography of the species
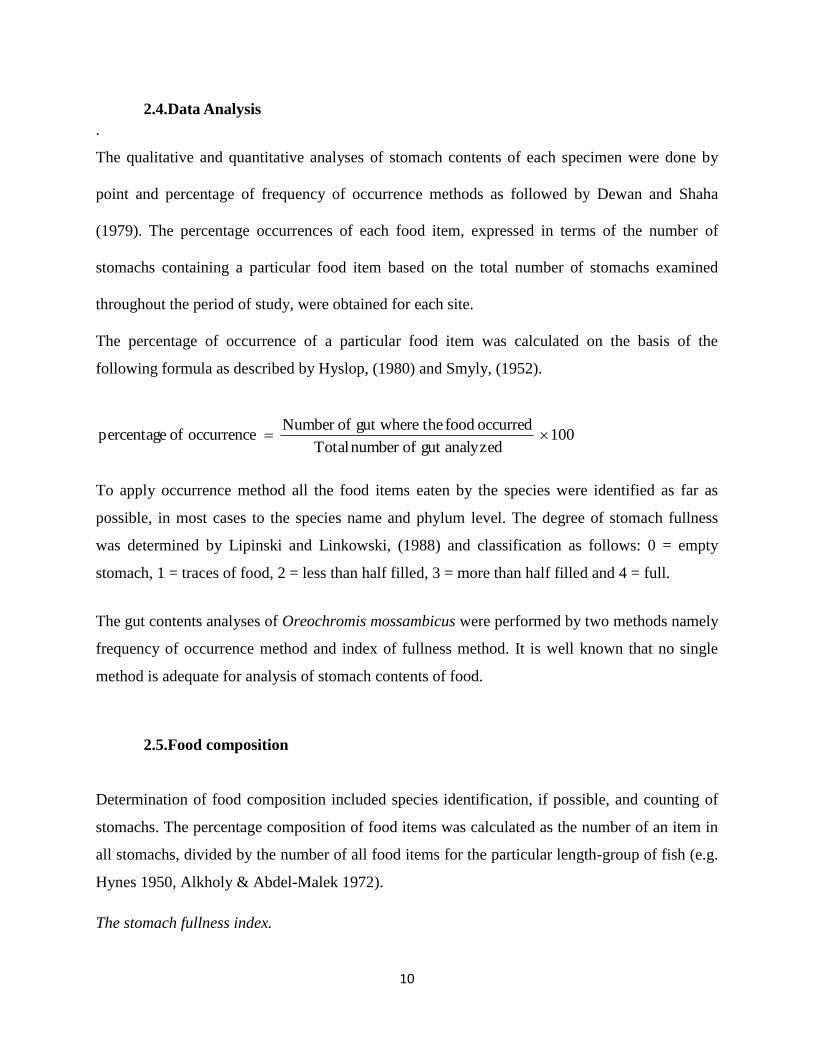
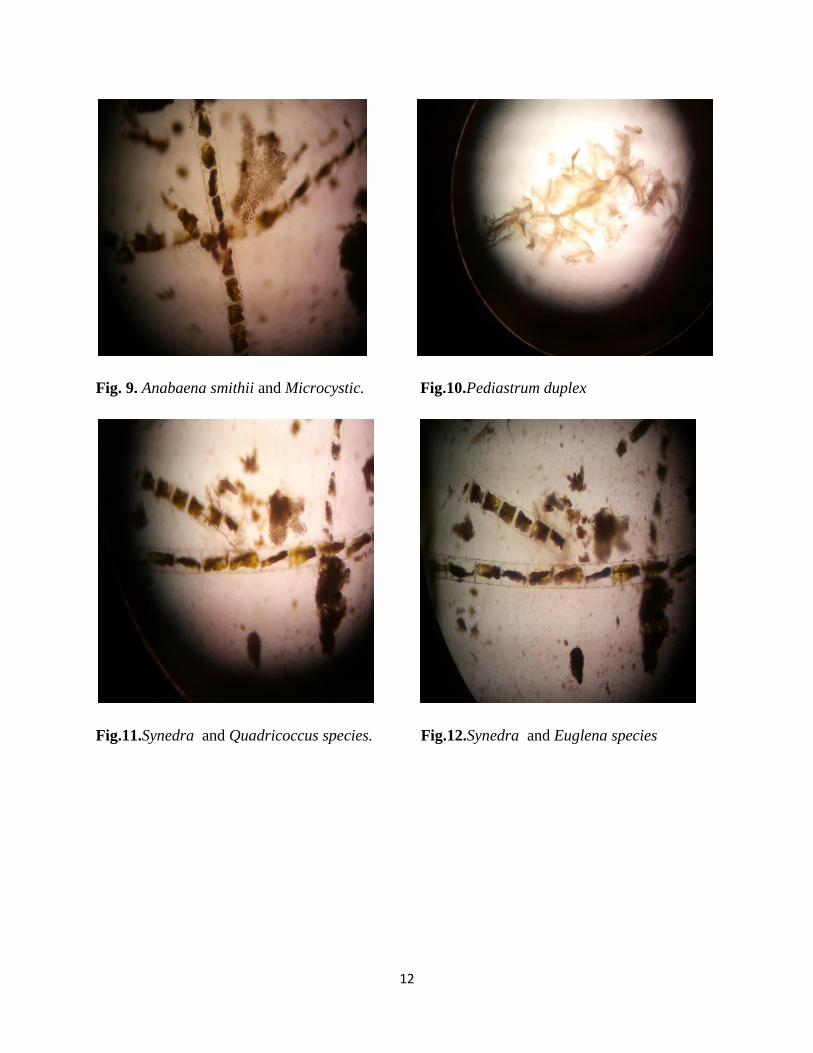
identified was taken for reference (figure 9,10,11 and 12 ).
10
2.4.Data Analysis
.
The qualitative and quantitative analyses of stomach contents of each specimen were done by
point and percentage of frequency of occurrence methods as followed by Dewan and Shaha
(1979). The percentage occurrences of each food item, expressed in terms of the number of
stomachs containing a particular food item based on the total number of stomachs examined
throughout the period of study, were obtained for each site.
The percentage of occurrence of a particular food item was calculated on the basis of the
following formula as described by Hyslop, (1980) and Smyly, (1952).
100 analyzedgut ofnumber Total
occurred food thegut where ofNumber occurrence of percentage
To apply occurrence method all the food items eaten by the species were identified as far as
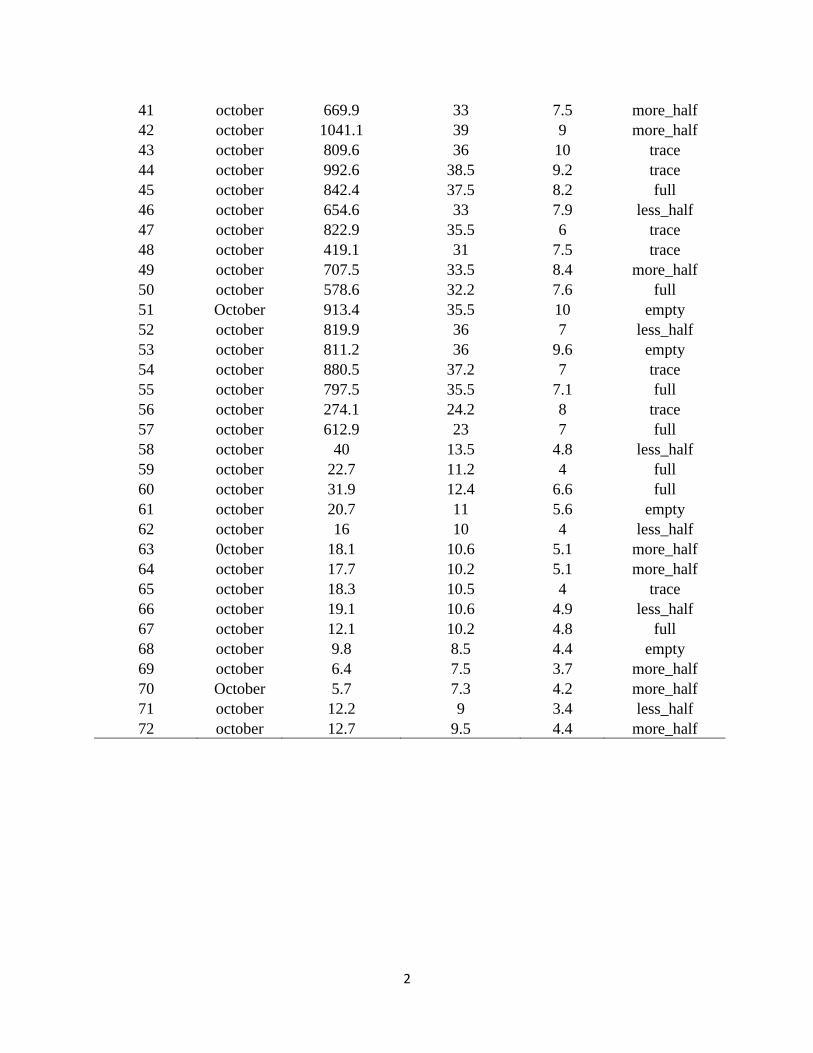
possible, in most cases to the species name and phylum level. The degree of stomach fullness
was determined by Lipinski and Linkowski, (1988) and classification as follows: 0 = empty
stomach, 1 = traces of food, 2 = less than half filled, 3 = more than half filled and 4 = full.
The gut contents analyses of Oreochromis mossambicus were performed by two methods namely
frequency of occurrence method and index of fullness method. It is well known that no single
method is adequate for analysis of stomach contents of food.
2.5.Food composition
Determination of food composition included species identification, if possible, and counting of
stomachs. The percentage composition of food items was calculated as the number of an item in
all stomachs, divided by the number of all food items for the particular length-group of fish (e.g.
Hynes 1950, Alkholy & Abdel-Malek 1972).
The stomach fullness index.

11
Stomach fullness index was calculated as follows:
100 (g)fish ofWeight
(g)stomach ofWeight (SI)Index Stomach
Since it is difficult to obtain weight or volume of minute food items separately, this index is used
on the basis of weight, for comparing feeding activities and diet overlap according to variation in
size class of fish or month.
2.6.Statistical analysis
The collected data are computed into Excel and import in STATISTICAL 9 software statistical
package for analysis. Data on stomach weight and total amount of food item found in stomach
were subjected to t-test for comparison of independent mean, following Snedecor and Cochran
(1982). Significance was assigned at P˂ 0.05 confidence level.
12
Fig. 9. Anabaena smithii and Microcystic. Fig.10.Pediastrum duplex
Fig.11.Synedra and Quadricoccus species. Fig.12.Synedra and Euglena species

13
3.0.RESULTS
Average size of all O.mossambicus ranged between 7.3 to 45 cm. The gut contents analysis of
fishes from each size showed that the fish feed on a variety food items. Main dietary organisms
identified from stomach analyzed included Crustacea (Cydrorus, Ceriodaphnia, Simocephalus,
and Moina); Copepods (Cyclops), Cynobacteria (Anabaena, Novacekii, Aeruginosa, Euglena,
Phacus, Trachelomonas, Distigma), diatoms (Synedra and cyclotella), Green algae (Carteria,
Closterium, Quadricoccus, Sphaerocystis, Dictyosphaerium, Chorella, Makinoella,
Micractinium, Coelastrum, Golenkinia, Sphaeroplea, Pediastrum duplex, Simplex and
Cosmarium); and others which include unidentified items.
All these food organisms were categorized into seven main food groups e.g. Crustacea,
Copepods, Cynobacteria, Diatoms, Green algae, Detritus and others (semi digested unidentifiable
parts of plants and detritus). Amongst these food groups, green algae was the most dominant
food item both by percentage of total points (0.5494) and percentage of occurrence (86.11%).The
next preferred food items were diatoms and cynobacteria (blue-green algae). But the percentage
occurrence of cynobacteria (73.61%) was found to be the most dominant, food group which was
closely followed by diatoms (72.22%), copepods (11.11%) and Crustacea which was account
about (8.3%). Examination of the diet of O. mossambicus showed that, there was low percentage
of detritus and sand particles occurred in its stomach, which compressed about (0.0650) total
points and percentage occurrence (41.67%) respectively.
Regarding percentage occurrence of different food items in the guts of O. mossambicus, ( Fig.1)
shows that a high percentage of occurrence of green algae were recorded during both sampling
period (0.5494 and 86.11%, respectively). Diatoms were represented mainly by Synedra spp
were recorded percentage of occurrence 72.22% respectively. Green algae were represented in
fish attainted its highest occurrence during research period and formed about (0.5494) total
points and 86.11%, respectively.

14
Figure.13.Monthly occurrence of food items of Oreochromis mossambicus in Hardap Dam by
percentage occurrence method.
According to the percentage occurrence methods, green algae, blue green algae and diatoms
formed the most important diet (86.11, 73.61 and 72.22%, respectively). Monthly variation of
different food items showed that, green algae formed the most important food items of plant
origin during the monthly as shown in Fig. 1.
Table 1 : Summary of overall mean of food items found in stomachs content.
Classes September October Minimum Maximum Mean
Green algae 21915 19954 1600 73120 20650
Blue-green algae 16480 4819.39 160 123840 9220
Diatoms 7923.81 2255.48 160 8960 3282
Copepods 480 240 160 960 420
Crustacean 533.33 160 160 800 346.7
Detritus 1828.57 18730 160 96000 10843
0 10 20 30 40 50 60 70 80 90
100
Per
cen
tag
es
Food items

15
3.1.Copepods
The abundance of copepod analyzed to the stomachs content in O. mossambicus were ranged
between 160 to 960 from September with mean of (480 ± 303.6) to October period (240 ±
113.1). Appendex No. 1 . The statical analysis shows that there are no significant decreases in
copeponds fed upon by O. mosaambicus (n = 8, P = 0.3354). The mean Copepods concetration
recorded was 420 during the sampling . This result indicate that there are positve correlation
between amount of copepods in the stomach and fish weight (r2 = 0.905), this due to copepods
become active,it made hard for smaller fish to feed them and only adult fish can manage to feed
copepods for higher amount.
Figure 14: Monthly variation of copepod examine to the stomach content Oreochromis
mossambicus in Hardap Dam.
R² = 0.9054
y = 104x - 146.67
-200
0
200
400
600
800
1000
1200
0 2 4 6 8 10
Org
an
ism
s co
un
ts
Fish weight (g)

16
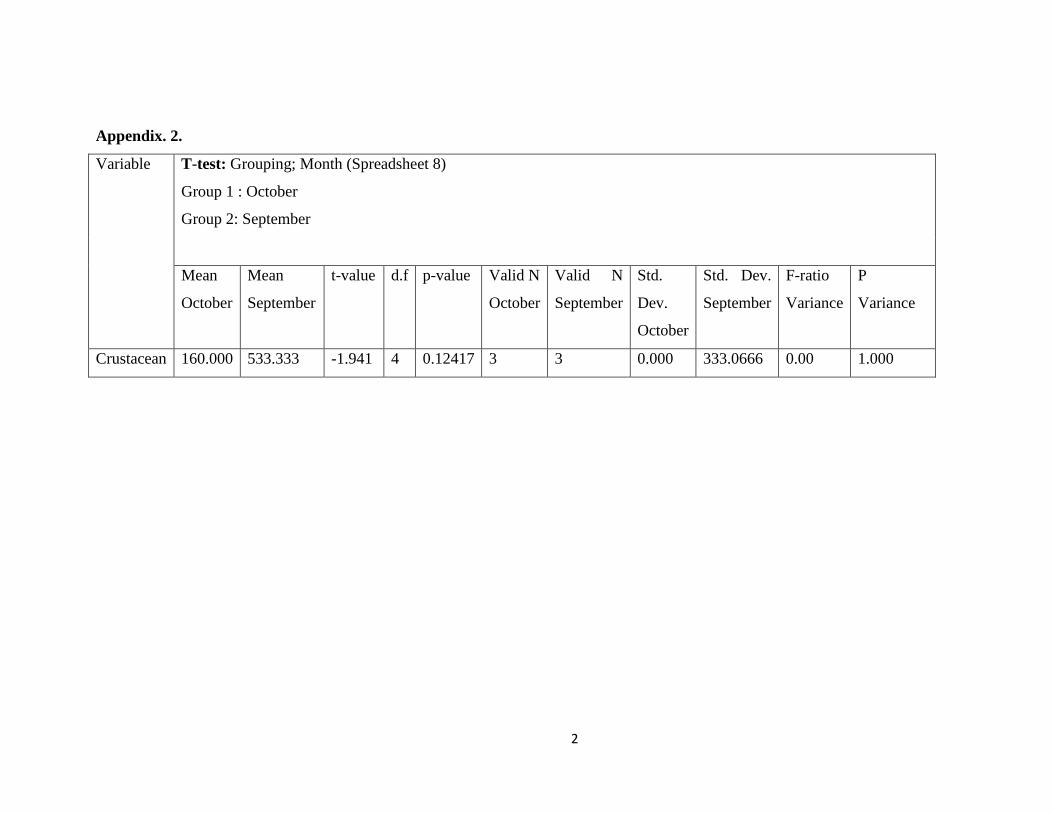
3.2.Crustacea
The abundance of crustacea analyzed to the stomachs content in O. mossambicus were ranged
between 160 to 800 from September with mean of (533.3 ± 333.0666) to October period (160
± 0.00). Appendex No. 2 . The statical analysis shows that there are no significant decreases in
copeponds fed upon by O. mosaambicus (n = 6, P = 0.124). The highest mean crustacea
concetration was recorded in September was 346.7 during the sampling. This result indicate that
there are negative correlation between amount of crustacea in the stomach and fish weight(r2 =
0.151) , this is due to small fish is prefering crustacea food and eating high amount than adult
fish, although it was found into adult fish.
Figure 15: Monthly variation of crustacea examine to the stomach content Oreochromis
mossambicus in Hardap Dam.
3.3.Blue green algae
The abundance of blue green algae analyzed to the stomachs content in O. mossambicus were
ranged between 160 to 12640 from September with mean of (16480 ± 30250.18) to October
y = -0.3675x + 574.27 R² = 0.1515
0
100
200
300
400
500
600
700
800
900
0 200 400 600 800 1000
Org
an
ism
s co
un
ts
Weight of fish (g)

17
period (4819.394 ± 4481.385). Appendex No. 3 . The statical analysis shows that there was
significant decreases in blue green algae fed upon by O. mosaambicus (n = 44, P = 0.0332). The
mean blue green algae concetration recorded was 9220 during the sampling. This result indicate
that there are negative correlation between amount of detritus in the stomach and fish weight (r2
= 0.019), this is due to small fish is prefering detritus food and eating high amount than adult
fish, although it was found into adult fish.
Figure 16: Monthly variation of Blue-green algae examine to the stomach content Oreochromis
mossambicus in Hardap Dam.
3.4.Green algae
The abundance of Green algae analyzed to the stomachs content in O. mossambicus were ranged
between 1600 to 34720 from September with mean of (21915 ± 18996.05) to October priod
(19954 ± 10163.47) Appendex No. 4 . T The statical analysis shows that there are no significant
decreases in green algae fed upon by O. mosaambicus (n = 56, P = 0.597). The mean green
algae concetration recorded was 20650 during the sampling. This result indicate that there are
slight negative correlation between amount of green algae in the stomach and fish weight (r2 =
y = -1.0795x + 4393.2 R² = 0.0198
0
2000
4000
6000
8000
10000
12000
14000
0 200 400 600 800 1000 1200 1400 1600
Org
an
ism
s co
un
ts
Weight of fish (g)

18
0.005), this is due to small fish is prefering green algae food and eating high amount than adult
fish where the consuption of green algae were decreased, although it was found into adult fish.
Figure 17: Monthly variation of Green algae examine to the stomach content Oreochromis
mossambicus in Hardap Dam.
3.5.Diatoms
The abundance of diatom analyzed to the stomachs content in O. mossambicus were ranged
between 160 to 8960 from September with mean of (7923.81± 9995.02) to October period
(2255.48 ± 2861.08). Appendex No. 5 . The statical analysis shows that there are was
significant decreases in diatom fed upon by O. mosaambicus (n = 46, P = 0.0043). The highest
mean diatom concetration was recorded in September was 7923.81 during the sampling . This
result indicate that there are positve correlation between amount of diatom in the stomach and
fish weight (r2 = 0.846), this is due to adult fish can fed higher amount diatom than the smaller
fish.
y = -1.4945x + 18169 R² = 0.005
0
5000
10000
15000
20000
25000
30000
35000
40000
0 200 400 600 800 1000 1200 1400 1600
Org
an
ism
s co
un
ts
Weight of fish (g)
19
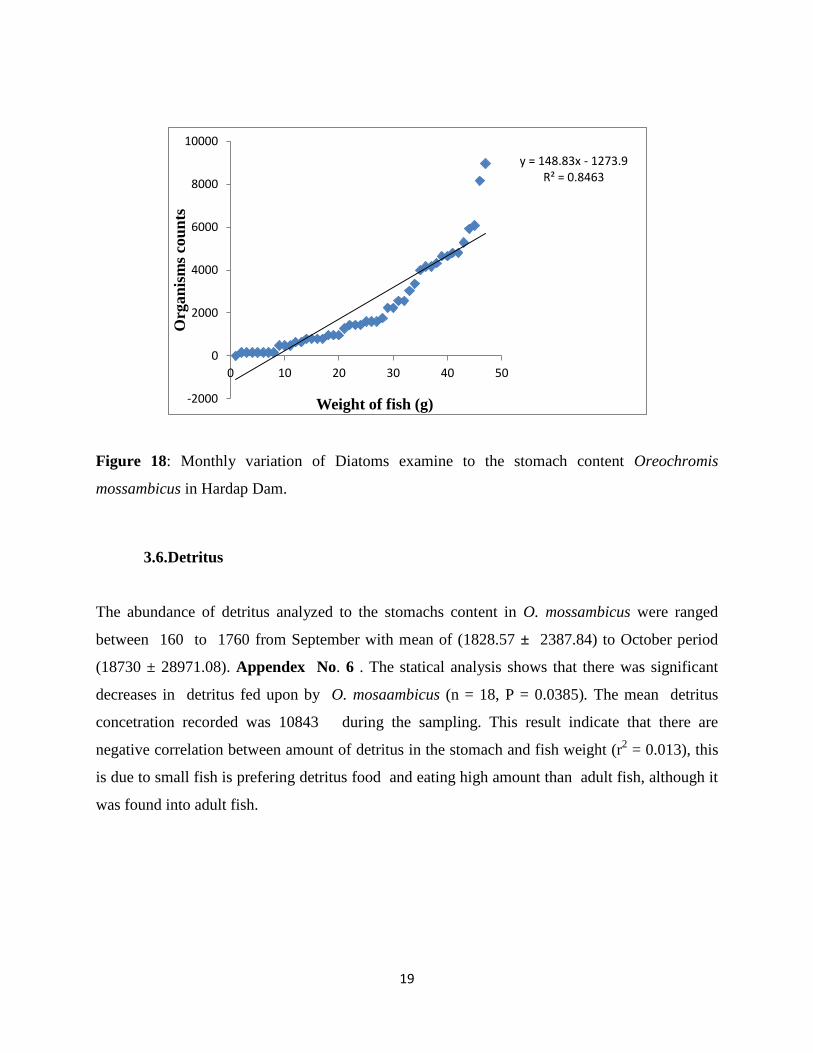
Figure 18: Monthly variation of Diatoms examine to the stomach content Oreochromis
mossambicus in Hardap Dam.
3.6.Detritus
The abundance of detritus analyzed to the stomachs content in O. mossambicus were ranged
between 160 to 1760 from September with mean of (1828.57 ± 2387.84) to October period
(18730 ± 28971.08). Appendex No. 6 . The statical analysis shows that there was significant
decreases in detritus fed upon by O. mosaambicus (n = 18, P = 0.0385). The mean detritus
concetration recorded was 10843 during the sampling. This result indicate that there are
negative correlation between amount of detritus in the stomach and fish weight (r2 = 0.013), this
is due to small fish is prefering detritus food and eating high amount than adult fish, although it
was found into adult fish.
y = 148.83x - 1273.9 R² = 0.8463
-2000
0
2000
4000
6000
8000
10000
0 10 20 30 40 50
Org
an
ism
s co
un
ts
Weight of fish (g)

20
Figure 19: Monthly variation of Detritus examine to the stomach content Oreochromis
mossambicus in Hardap Dam.
Animal derivatives were the preferable food of animal origin during September and October.
Generally, results of the two methods of analysis emphasized the importance of plant as a major
food resource in the stomach of Oreochromis mossambicus and foods of animal origin were
observed on some occasions and these were mainly copepods and animal derivatives.
Table 2: Mean variation in gut fullness of Oreochromis mossambicus in Hardap Dam.
State of gut September October
Full 1.68 6.86
More than half filled 2.67 22.83
Less than half filled 19.08 15.43
Trace of food 1.99 2.83
Empty 9.61 12.17
y = -0.1318x + 908.61 R² = 0.0137
0
200
400
600
800
1000
1200
1400
1600
1800
2000
0 500 1000 1500 2000
Org
an
ism
s co
un
ts
Weight of fish (g)

21
Regarding the monthly variation in the feeding intensity as an index of the stomach fullness, it
could be stated that the maximum number of empty stomachs was recorded during the period of
September and October ( mean 9.61 and 12.17, respectively) as shown in Table 1.
Table 3: Monthly variations in the amount of food taken by Oreochromis mossambicus in
Hardap Dam based on average index of fullness.
Items
Months No. of fish
examine
No. of stomach with
food
Empty stomach Av. Index of fullness
September 26 21 5 4.67
October 46 42 4 1.67
The monthly variations in the amount of food taken by O. mossambicus based on average index
of fullness in Table 3 showed that during the period of September the fish start minimize the
feeding rate, due to pre-spawning period. The result of the study of the monthly variation of
food and feeding patterns of fishes observed that during September period it is attained the
highest average of fullness (4.67) whereas the lowest was recorded during October was (1.67).

22
Table 4: Diet composition of Oreochromis mossambicus based on percentage of occurrence and
percentage of total points.
Food Groups
Items Crustacean Copepods Blue green algae Diatoms Green algae Detritus
No. of fish in which
occurred
6 8 53 52 62 30
Percentage of occurred 8.3% 11.11% 73.61% 72.22% 86.11% 41.67%
Percentage of total point 2.83% 3.79% 25.12% 24.65% 29.39% 14.22%
All the food groups showed considerable monthly variations in the diet composition of the fish
(Table: 4). Among all the food groups green algae was found to be the most dominant food item
by percentage of total points per fish in most of the months. Next to green algae, blue-green
algae, diatoms, detritus, Copepods, arthropods and Aschelminthes occupied the successive
position by percentage of total point per fish. Comparatively greater amount of green algae was
found to occur during September and October months whereas diatoms and blue-green algae was
found to be most dominant during September months in the gut contents of the fish. The food
groups such as copepods, arthropods and detritus were recorded mostly in the gut contents of
mature and some immature fishes.

23
4.0.DISCUSION
The monthly variation in the type and quantity of food consumed suggest that the diet of
Oreochromis mossambicus is related to food availability. Within this food availability, there are
indications of food selection. Since green algae and blue-green algae are abundant in the stomach
content during September and October sampling period.
The food items in the stomach of O. mossambicus suggest that they are euryphagous (i.e.
feeding on a wide range of organisms). It was also observed that O.mossambicus can be
categorized either as an omnivorous or herbivorous feeder as the diet covers a wide spectrum of
food ranging from various types of plankton to invertebrates and plants (Maughan et al.,2007).
The fish also exhibits an overlapping in food and feeding habits in order to avoid inter and intra
specific competition for available food.
The study of the tropic ecology is useful and fundamental to understand the functional role of the
fish within their ecosystems Gharib and Abdel-Aziz, (2007). Analysis of stomach contents of O.
mossambicus during the study showed the presence of three algal groups and diatoms was the
most preferable food of plant origin where it occurred in more than 73.61% of the examined
fish.
Investigation of Mohamed (2005), found that the phytoplankton assemblage of the freshwater
lakes consists of 138 species belonging to seven classes. Chlorophyceae, Bacillariophyceae and
Cyanophyceae represented the three main classes in lakes, diatoms was the second important
predominant phytoplankton group and it attained its maximum occurrence during winter season,
while the result from experiment was done in Hardap dam during September and October period
to determine food and feeding habit in O.mossambicus where the result indicate that green algae
was dominant with percentage occurrence 86.11% followed with blue-green algae percentage
occurrence 73.61% respectively.
Getabu, (1994), pointed out that the diatoms is the most important food item than any food items
in the gut of O.niloticus in Nyanza Gulf Lake Victoria. Copepods and crustacean were observed
as the prefer food of animal origin whereas, it contributed percentage of occurrence about

24
11.11% and 8.3% of the examined fish. According to Getachew and Fernando, (2004) pointed
out that animal foods were observed on the guts of O. niloticus on rare occasions and these were
mainly rotifers. So, analysis of stomach contents of O. mossambicus in this study showed good
relation with the ambient plankton, where all species found in the stomach of this fish were
previously recorded in the water of Hardap dam. Results of the two methods of analysis
emphasized the importance of live aquatic and submerged terrestrial plants, benthic algae,
phytoplankton, periphyton (algae attached to plants), zooplankton, and organic detritus as a
major food resource in the stomach of Mozambique tilapia, which agrees with (Hofstede &
Botke, 1950; Pannikar & Tampi, 1954; Man & Hodgkiss, 1977; Bowen., 1978, 79, 80a, 81;
Aravindan, 1980; Dudgeon, 1983; De Silva et al., 1984; De Silva, 1985; Dickman & Nanne,
1987; Blühdorn et al., 1990; Milward and Webb, 1990; Webb, 1994; Kim et al. 2002).
.
Examination of the diet composition of O. mossambicus species showed that there was high
total point percentage of green algae and blue-green algae occurred in its stomach during, both
September and October comprising percentage total point about 29.39 and 25.12%,
respectively. In live aquatic species showed that there were recorded total percentage of
copepods and crustacean occurred in stomach content during September and October comprising
percentage total point about (3.79 and 2.83% respectively ) followed by diatoms and detritus
where accounted about 24.65 and 14.22% respectively.
It is important to emphasize that the effect of seasonality should always be considered in the
studies on natural feeding of fish, because the temporal changes of biotic and abiotic factors
alters the structure of the food web along the year and as a consequence, the fish often shows
seasonal diet shifts (Wotton, 1992). During this study the maximum number of empty stomach
was recorded during September and October ( mean 9.61 and 12.17 respectively), this period of
poor feeding activity coincided with the spawning season of O. mossambicus in Hardap dam. So
these results may be interpreted in light of the abdominal cavity is fully occupied by the ripe
gonads and so stomachs were always empty during these season.
Furthermore Joadder, (2007) mentioned that the period of poor feeding activity is coincided
with the peak of spawning season because the abdominal cavity is fully occupied by the
voluminous ripe gonads and so the stomachs were always empty and small in size. The recorded

25
monthly variations in the mean weight of content in collected fish samples revealed that October
attained the highest mean weight of content(11.33 g) while the lowest value was observed during
September and it was recorded (5.56 g). These results coincide with that of variation in gut
fullness in this study. Changes in mean weight of stomach contents through the month or year
indicate differences in feeding intensity (Man and Hodgkiss, 1977). Oreochromis species was
found to be an omnivorous opportunistic-generalist benthophagic browser or surface grazer
(Vaas and Hofstede, 1952; Le Roux, 1956; Bowen, 1976; Bowen & Allanson, 1982; Lahser, 967
and FAO, 2004 ). The feeding habits in this study were similar to those reported by (Oso,
Ayodele and Fagbuaro, 2006) in a Tropical Reservoir, Nigeria on O. niloticus, O.mossambicus
and S. galilaeus (L.).
4.1.CONCLUSION
This study provides information on food and feeding habits of Mozambique tilapia (Oreochromis
mossambicus ) in Hardap dam. In conclusion, the results of this study indicated that the major
food or diet of O. mossambicus in Hardap dam were dominated by blue-green algae, detritus,
diatoms, copepods, green algae and crustacean and a changing feeding strategy in response to
prey availability in the environment. So the ability to exploit different varieties of food items
makes O. mossambicus to be classified as herbivorous or omnivorous. From the above findings
it can be concluded that the different food groups varied monthly in their abundance in the gut
contents of the fish where it showed some seasonal preference to certain food groups. The adult
fish preferred to feed copepods, diatoms, detritus, green algae and crustaceans where the
immature fish preferred to feed on crustacean, detritus, green algae and blue green algae.
The average index of fullness were found to be higher in September (4.67) than those the found
in October (1.67). Future work must investigate the presence of food and feeding habits in water
column fish species including time (day and night) and seasonally such as winter, spring and
summer period where it can give good result and indicate which group of food are most
preference.
26
4.2.REFERENCES
Abdel-Aziz, N.E. and S.M. Gharib, (2007). Food and feeding habits of round Sardinella
(Sardinella aurita) in El- Mex Bay, Alexandria, Egypt. Egyptian J. Aqu. Res., 33: 202-
221.
Alam, M.J., Begum, M., Islam, M.A. and Pal, H.K., (2006a). Induced spawning and fry
production nona tengra, Mystus gulio (Hamilton.). Progress. Agric., 17 (1): 235-238.
Alam, M.J., Begum, M., Islam, M.A. and Pal, H.K., (2006b). Spawning behavior and induced
breeding of an esturine cat fish, Mystus gulio (Ham.). Bangladesh J. Fish. Res., 10 (2):
101-109.
Alkholy, A.A. and. Abdel-Malek. S.A., (1972). Food and feeding habits of some Egyptian
fishes in Lake Qurun. Part 1: Tilapia zillii (Gerv.). A. according to localities. Bulletin of
the Institute of Oceanography and Fisheries, Cairo 2: 185-202.
Aravindan, C.V., (1980). Food selection and feeding habits of Tilapia mossambica Peters in
different ecological habitats. Proceedings of the Indian National Science Academy
B46(1): 54-57.
Arthington A.H. and Blühdorn D.R., (1994). Distribution, genetics, ecology and status of the
introduced cichlid, Oreochromis mossambicus, in Australia. Mitt. Internat. Verein.
Limnol.24: 53-62.
27
Bachok, Z., Mansor, M.I. and Noordin, R.M., (2004). Diet composition and food habits of
demersal and pelagic marine fishes from Terenggau waters, east coast of Peninsular,
Malaysia. Naga, 27: 41-47.
Begum, M., Alam, M. J., Islam, M. A. and Pal, H. K., (2008). On the food and feeding habit
of an estuarine catfish (Mystus gulio Hamilton) in the south-west coast of Bangladesh.
Univ. j. zool. Rajshahi Univ. Vol. 27, 2008 pp. 91-94.
Behrends L.L., Kingsley J.B. and Bulls M.J., (1990). Cold tolerance in maternal mouth
brooding tilapias: phenotypic variation among species and hybrids. Aquaculture 85: 271-
280.
Bowen, S.H., (1976). Mechanism for the digestion of detrital bacteria by the cichlid fish
Sarotherodon mossambicus (Peters). Nature, London 260: 137-138.
Bowen, S.H., (1978). Benthic diatom distribution and grazing by Sarotherodon mossambicus in
Lake Sibaya, South Africa. Ecological Monographs 8: 449-453.
Bowen, S.H., (1979). A nutritional constraint on detritivory in fishes: the stunted population of
Sarotherodon mossambicus in Lake Sibaya, South Africa. Ecological Monographs 49(1):
18-31.
Bowen, S.H., (1980). Detrital non-protein amino acids are the key to rapid growth of Tilapia in
Lake Valencia, Venezuela. Science 207(14): 1216-1218.
Bowen, S.H., (1981). Digestion and assimilation of periphytic detrital aggregate by Tilapia
mossambica. Transactions of the American Fisheries Society 110: 239-245.

28
Bowen, S.H. and Allanson, B.R., (1982). Behavioural and trophic plasticity of juvenile Tilapia
mossambica in utilization of the unstable littoral habitat. Environmental Biology of
Fishes 7(4): 357-362.
Bhagat, M.L. and Dwivedi, S.N., (1988). Impact of the exotic fish, Oreochromis mossambicus,
on the indigenous fishery of Powai Lake, Bombay. Journal of the Indian Fisheries
Association 18: 511-515.
Blühdorn D.R., Arthington, A.H., and Mather, P.B., (1990). The introduced cichlid
Oreochromis mossambicus in Australia: a review of distribution, population genetics,
ecology, management issues and research priorities. In: D.A. Pollard (ed) Introduced
and translocated fishes and their ecological effects. Bureau of Rural Resources
Proceedings No. 8. Australian Government Publishing Service, Canberra, 83–93.
Cai W., Li S. and Ma J., (2004). Diseases resistance of Nile tilapia (Orecohromis niloticus),
blue tilapia (O. aureus) and their hybrid (female Nile tilapia x male blue tilapia) to
Aeromonas sobria. Aquaculture 229(1-4): 79-87.
Cahoon, W.G., (1953). Commercial carp removal at Lake Mattamuskeet, North Carolina.
Journal of Wildlife Management 17(3): 212-217.
Cnaani A., Gall G.A.E. and Hulata G., ( 2000). Cold tolerance of tilapia species and hybrids.
Aquaculture International 8: 289-298.
Dewan, S. and Shaha, S.N., (1979). Food and feeding habits of Tilapia nilotica (L.)
(Perciformes: Cichlidae). Bangladesh J. Zool. 7 (2): 75-80.

29
De Silva, S.S., Perera, M.K. and Maitipe, P., (1984). The composition, nutritional status and
digestibility of the diets of Sarotherodon mossambicus from nine man-made lakes in Sri
Lanka . Environmental Biology of Fishes 5(3): 253-259.
De Silva, S.S., (1985). Body condition and nutritional ecology of Oreochromis mossambicus
(Pisces, Cichlidae) populations of man-made lakes in Sri Lanka. Journal of Fish Biology,
27 (5), 621-633.
De Silva, S.S., (1988). Reservoirs of Sri Lanka and their fisheries. FAO, Rome.
Dickman, M. and Nanne, H., (1987). Impact of tilapia grazing on plankton composition in
artificial ponds in Guanacaste, Province, Costa Rica. Journal of Freshwater Ecology
4(1): 93-100.
Dudgeon, D., (1983). The utilization of terrestrial plants as a food source by fish stock of a
gently sloping marginal zone in Plover Cove Reservoir, Hong Kong. Environmental
Biology of Fishes 8(1): 73-77.
Forester, T.S. and Lawrence, J.M., (1978). Effects of grass carp and carp on populations of
bluegill and largemouth bass in ponds. Transactions of the American Fisheries Society
107(1): 172-175.
Fuselier, L., (2001). Impacts of Oreochromis mossambicus (Perciformes: Cichlidae) upon
habitat segregation among cyprinodontids (Cyprinodontiformes) of a species flock in
Mexico. Revista de Biología Tropical 49(2): 647-656.
30
Getabu, A., (1994). A comparative study on the feeding habits of Oreochromis niloticus
(Linnaeus) in Nyanza Gulf Lake Victoria and sewage fish ponds. Proceedings of the
Second EEC Regional Seminar on Recent Trends of Research on Lake Victoria Fisheries,
Nairobi: ICIPE Sci., pp: 93-103.
Getachew, T. and Fernando, C.H. (2004). Food habits of an herbivorous fish (Oreochromis
niloticus Linn.) in Lake Awasa, Ethiopia. Hydrobiologia, 174: 195-200.
Hay, C.J., B.J. van Zyl, F.H. van der Bank, J.T. Ferreira and G.J. Steyn, (1999). The
distribution of freshwater fish in Namibia. Cimbebasia, 15:41-63.
Hickling C.F., (1963). The cultivation of tilapia. Scientific American 208: 143-152.
Hofstede, A.E. and Botke, F., (1950). Tilapia mossambica Peters as a factor in malaria control
in the vicinity of Djakarta. Landbouw 22: 453.
Hynes, H.B.N., (1950). The food of freshwater sticklebacks (Gas- terosteus aculeatus andm
Pygosteus pungitius) with a review of methods used in studies of food of fishes. J. Anim.
Ecol. 19: 36-58.
Hyslop,E.J., (1980). Stomach contents analysis. A review of methods and their application. J.
Fish Biol, 17: 411- 429.
31
Joadder, Md. A.R., (2007). Food and feeding habits of Gagata youssoufi (Rahman) from the
river Padma in Rajshahi. Univ. J. Zool., Rajshahi University, 25: 69- 71.
Kim, H.C., Lee, J.H., Yang, K.H. and Yu, H.S., (2002). Biological control of Anopheles
sinensis with native fish predators (Aplocheilus and Apphyocypris) and herbivorous fish,
Tilapia, in rice fields in Korea. Korean Journal of Entomology 32(4): 247-250.
Krishna Murthy V., Reddanna P. and Govindappa S., (1981). Hepatic carbohydrate
metabolism in Tilapia mossambica (Peters) acclimated to low environmental pH.
Canadian Journal of Zoology 59(3): 400-404.
Le Roux, P.J., (1956). Feeding habits of the young of four species of Tilapia. South African
Journal of Science 56: 33-37.
Leghari S.M., Khuhawar M.Y., Jahangir T.M. and Leghari A., (2004). Limnological study of
Khadeji Spring, Karachi, Sindh, Pakistan. Proceedings of Pakistan Congress of Zoology
24, 2004: 57-66.
Lipinski, M.R, and Linkowski, T.B., (1988). Food of the Squid Ommastrephes bartramii
(Lesueur, 1821) from the South-West Atlantic Ocean. South Africa Journal March
Science 6, 43–6.
Lopez-Peralta, R.H. and Arcila,C.A.T., (2002). Diet composition on fish species from the
southern continental shelf of Colombia. Naga, 25: 23-29.

32
Maughan, M. Webb, A., and Knott, M., (2007). Pest fish profiles Mozambique tilapia
Oreochromis mossambicus (Peters, 1852). Pest fish in North East Queensland. James
Cook University.
Man, H.S.H. and Hodgkiss, I.J., (1977). Studies on the ichthyofauna in Plover Cove Reservoir,
Hong Kong. Journal of Fish Biology 11(1): 1-13.
Man, H.S.H. and Hodgkiss, I.J., (1977). Studies on the ichthyo-fauna in Plover Cove Reservoir,
Hong Kong: feeding and food relation. Journal of Fish Biology 5: 707-736.
Mequilla, A.T. and Campos,W.L., (2007). Feeding relationships of dominant fish species in
Visayan Sea. Science Diliman, 19: 35-46.
Milward, N.E. and Webb A.C., (1990). The Status of the Introduced Tilapia Species
Oreochromis mossambicus in the Townsville Region: Distribution, Feeding and
Reproduction. A report to the Townsville City Council. Zoology Department, James Cook
University of North Queensland, Queensland.
Mohamed, A.M.H., (2005). Ecological studies on phytoplankton composition of newly formed
aquatic depressions at Abou-Zabal quarries region. M.Sc. Thesis. Faulty of Science Al-
Azhar University, Cairo, Egypt, pp: 213.
Natarajan, J., (1971).Workshop on ecology and fisheries of freshwater reservoirs. CFRI,
Barrackpore, Aug 1971: 30-31.
Noble, R.L., Germany, R.D. and Hall, C.R., (1975). Interactions of blue tilapia and largemouth
bass in a power plant cooling reservoir. Proceedings of the Annual Conference of the
Southeastern Association of Game and Fish Commissioners 29: 247-251.
Oronsaye, C.G. and Nakpodia F.A., ( 2005). A comparative study of the food and feeding
habits of Chrysichthys nigrodigitatus and Brycinus nurse in a tropical river. Pak. J. Sci.
Ind. Res., 48: 118-121.

33
Oso, J.A., Ayodele, I.A. and Fagbuaro, O., (2006). Food and feeding habits of Oreochromis
niloticus (L.) and Sarotherodon galilaeus (L.) in a Tropical Reservoir. World J. Zool., 1:
118-121.
Popma, T. and Masser, M., (1999). Tilapia life history and biology. Southern Regional
Aquaculture Center. SRAS Publication No. 283. pp 1-2.
Philippart, J.C. and Ruwet, J.C., (1982). Ecology and distribution of tilapias. In: Biology and
Culture of Tilapias (Pullin, R.S.V. and Lowe-McConnell, R.H., eds.). ICLARM, Manila,
Philippines, pp. 15-59.
Ross, S.T., (1986). Resources partitioning in fish assemblages: A review of field studies. Copeia,
2: 352-388.
Senguttuvan M. and Sivakumar A.A., (2002). Effect of air exposure on the blood parameters
of Oreochromis mossambicus (Peters). Himalayan Journal of Environment and Zoology
16(1-2): 15-21.
Schrader, H.J., (1985). Invasive alien fishes in south west Africa/Namibia. In: C.J Brown,
I.A.W.Macdonald and S.E. Brown (eds.), Invasive alien organisms in south west
Africa/Namibia. Pretoria, South Africa, South African National Scientific Programmes
Report,119:74 p.
Skelton P.H., (1993). A Complete Guide to the Freshwater Fishes of Southern Africa. Southern
Book Publishers. 325-330.
Smyly,W.J.P., (1952). Observation on food of fry of perch ( perca fluviatilis Linn.) in
windermere. Preceedings of the Zoological Society, 122: 407- 416.
Snedecor, G.W. and Cochran, W.G. (1982). Statistical methods, 6th
edition. Iowa State
Univ. Press, Ames, IA, USA, pp. 593.
34
Stauffer J.R. Jr., (1986). Effects of salinity on preferred and lethal temperatures of the
Mozambique tilapia, Oreochromis mossambicus (Peters). Water Resources Bulletin 22
(2) 205 – 208.
Taylor, J.N., Courtenay, Jr. W.R. and McCann, J.A., (1984). Known impacts of exotic fishes
in the continental United States. In: Distribution, Biology, and Management of Exotic
Fishes (Courtenay, Jr., W.R. and Stauffer, Jr., J.R., eds.). The John Hopkins University
Press, Baltimore, 322-373.
Utsugi, K. and Mazingaliwa, K., (2002).Field guide to Zambian Fishes, Planktons and
Aquaculture. Japan international cooperation agency (JICA) ,2002: 97-124pp.
Vaas K.F. and Hostede A.E., (1952). Studies on Tilapia mossambica Peters (ikan mudjair) in
Indonesia . Contributions of the Inland Fisheries Research Station, Djakarta, Bogor 1: 1-
68.
Webb A.C., (1994). Ecological aspects of the Mozambique mouthbrooder, Oreochromis
mossambicus, and other introduced cichlids in northern Queensland. MSC thesis,
Faculty of Biological Sciences, James Cook University, Townsville.
Wotton, R.J., (1992). Fish ecology. London: Chapman and Hall, pp: 212.

1
4.3.APPENDENCES
Appendex. 1.
Variable T-test: Grouping; Month (Spreadsheet 12)
Group 1 : October
Group 2: September
Mean
October
Mean
September
t-value d.f p-value Valid N
October
Valid N
September
Std. Dev.
October
Std. Dev.
September
F-ratio
Variance
P
Variance
Copepods 240.000 480.000 -1.04623 6 0.33576 2 6 113.1371 303.5787 7.20000 0.550672
2
Appendix. 2.
Variable T-test: Grouping; Month (Spreadsheet 8)
Group 1 : October
Group 2: September
Mean
October
Mean
September
t-value d.f p-value Valid N
October
Valid N
September
Std.
Dev.
October
Std. Dev.
September
F-ratio
Variance
P
Variance
Crustacean 160.000 533.333 -1.941 4 0.12417 3 3 0.000 333.0666 0.00 1.000

3
Appendix. 3.
Variable T-test: Grouping; Month (Spreadsheet 10)
Group 1 : October
Group 2: September
Mean
October
Mean
September
t-value d.f p-value Valid N
October
Valid N
September
Std. Dev.
October
Std. Dev.
September
F-ratio
Variance
P
Variance
Blue-green algae 4819.394 16480.00 -2.188 51 0.0332 33 20 4481.385 30250.18 45.56500 0.000

4
Appendix. 4.
Variable T-test: Grouping; Month (Spreadsheet 19)
Group 1 : October
Group 2: September
Mean
October
Mean
September
t-value d.f p-value Valid N
October
Valid N
September
Std. Dev.
October
Std. Dev.
September
F-ratio
Variance
P
Variance
Green algae 19954.00 21915.00 -0.531 60 0.597248 40 22 10163.47 18996.05 3.493350 0.000720

5
Appendix. 5.
Variable T-test: Grouping; Month (Spreadsheet 12)
Group 1 : October
Group 2: September
Mean
October
Mean
September
t-value d.f p-value Valid N
October
Valid N
September
Std. Dev.
October
Std. Dev.
September
F-ratio
Variance
P
Variance
Diatoms 2255.484 7923.810 -2.994 50 0.004272 31 21 2861.080 9995.022 12.20415 0.0000

6
Appendix. 6.
Variable T-test: Grouping; Month (Spreadsheet 12)
Group 1 : October
Group 2: September
Mean
October
Mean
September
t-value d.f p-value Valid N
October
Valid N
September
Std. Dev.
October
Std. Dev.
September
F-ratio
Variance
P
Variance
Detritus 18730.00 1828.571 2.171605 28 0.038512 16 14 28971.08 2387.837 147.2041 0.0000
7
Appendix. 7.
Sample
No. Months TotalWeight
Total
Length
Blue green
algae Green algae Diatoms Detritus Crustacean Copepods
1 september 187.59 22 10560 1600 800 1760 800 640
2 september 314.5 25 800 5600 3360 8160 0 160
3 september 228 22 0 0 0 0 0 0
4 september 248 23.5 18240 33920 8960 0 0 0
5 september 286.5 24.5 800 5280 960 960 160 160
6 september 1295.3 41.5 160 15680 0 1600 0 960
7 september 909.7 38 2880 2240 640 160 0 0
8 september 712.6 33 19040 4960 13920 480 0 0
9 september 220.5 25 12640 24000 4000 0 0 0
10 september 215.5 23.5 3520 54720 14080 1440 0 0
11 september 218.5 25.5 74720 73120 23360 6400 0 0
12 september 772 34 14720 52320 24640 0 0 0
13 september 825 35 123840 18400 5920 0 640 480
14 september 1291.3 37 5760 21760 39040 320 0 480
15 september 847 42 2080 28640 1600 960 0 0
16 september 1429 45 320 8160 1760 960 0 0
17 september 33.2 13 8000 27680 2240 0 0 0
18 september 33 13 23680 37120 4800 480 0 0
19 september 28.1 12.5 0 0 0 0 0 0
20 september 10.1 9 2560 15040 4160 0 0 0
21 september 13.1 9 0 0 0 0 0 0
22 september 9.5 8.5 4960 18880 5280 0 0 0
23 september 9.1 8 0 0 0 0 0 0

8
24 september 11.2 8.7 0 7520 960 0 0 0
25 september 13.4 9.5 320 22610 4640 1440 0 0
26 september 8.9 8 0 0 0 0 0 0
27 september 900.1 36 0 2880 1280 480 0 0
28 October 1025.9 39 5920 22240 4800 4800 0 0
29 October 1026.1 39 4640 32640 13280 0 0 0
30 October 972.9 37.8 800 19200 4320 0 0 0
31 October 624.6 32.5 0 11520 2560 0 0 0
32 October 688.4 33 2560 20800 1600 9600 0 0
33 October 607.6 37.5 9600 37760 8160 0 0 320
34 October 597.9 31 8960 21280 3040 0 0 0
35 October 1150.6 39.5 0 11840 4640 800 0 0
36 October 944.6 36.3 13440 27520 2240 0 160 0
37 October 662.9 33 160 12800 480 0 160 0
38 October 994.6 37 6080 8800 1440 0 0 0
39 October 734 34.5 0 5440 1440 0 0 0
40 October 709 34.5 0 11320 1440 160 0 0
41 October 669.9 33 0 0 0 0 0 0
42 October 1041.1 39 5120 33120 800 0 0 0
43 October 809.6 36 640 15040 1600 0 160 0
44 October 992.6 38.5 1120 8000 640 1440 0 0
45 October 842.4 37.5 7840 30400 800 0 0 0
46 October 654.6 33 16320 27840 2560 0 0 0
47 October 822.9 35.5 0 15360 800 0 0 0
48 October 419.1 31 800 5120 160 0 0 0
49 October 707.5 33.5 1120 15320 160 0 0 0
50 October 578.6 32.2 0 12160 160 48000 0 0
51 October 913.4 35.5 160 16000 160 6400 0 0
52 October 819.9 36 0 0 0 0 0 0

9
53 October 811.2 36 7520 34720 6080 320 0 0
54 October 880.5 37.2 0 0 0 0 0 0
55 October 797.5 35.5 1280 13120 160 64000 0 0
56 October 274.1 24.2 14240 52480 4160 48000 0 160
57 October 612.9 23 0 17280 160 640 0 0
58 October 40 13.5 320 32320 0 0 0 0
59 October 22.7 11.2 1920 6240 0 0 0 0
60 October 31.9 12.4 12000 16960 0 6880 0 0
61 October 20.7 11 8160 16160 0 0 0 0
62 October 16 10 0 0 0 0 0 0
63 October 18.1 10.6 640 13600 480 0 0 0
64 October 17.7 10.2 4800 14080 0 96000 0 0
65 October 18.3 10.5 800 18080 0 0 0 0
66 October 19.1 10.6 3200 15680 0 0 0 0
67 October 12.1 10.2 6240 29920 0 5920 0 0
68 October 9.8 8.5 4640 17760 160 0 0 0
69 October 6.4 7.5 0 0 0 0 0 0
70 October 5.7 7.3 960 28960 960 0 0 0
71 October 12.2 9 4480 27520 480 320 0 0
72 October 12.7 9.5 2560 21760 0 6400 0 0

1
Appendex. 8.
FishNumber month Total Weight Total Length StomacWeight
1 september 187.59 22 5.5 full
2 september 314.5 25 1.5 empty
3 september 228 22 1.5 empty
4 september 248 23.5 6.5 full
5 september 286.5 24.5 5.7 trace
6 september 1295.3 41.5 11.5 full
7 september 909.7 38 4 full
8 september 712.6 33 3.5 full
9 september 220.5 25 5 full
10 september 215.5 23.5 2.5 more_half
11 september 218.5 25.5 5 full
12 september 772 34 3 full
13 september 825 35 6 full
14 september 1291.3 37 6.5 more_half
15 september 847 42 1.5 empty
16 september 1429 45 1.5 empty
17 september 33.2 13 2.5 empty
18 september 33 13 1.5 more_half
19 september 28.1 12.5 2.5 empty
20 september 10.1 9 3.5 empty
21 september 13.1 9 2.5 less_half
22 september 9.5 8.5 1.5 empty
23 september 9.1 8 1 empty
24 september 11.2 8.7 0.5 more_half
25 september 13.4 9.5 0.5 full
26 september 8.9 8 1.5 empty
27 october 900.1 36 8.3 full
28 october 1025.9 39 9.6 full
29 october 1026.1 39 9.8 full
30 october 972.9 37.8 10.2 trace
31 october 624.6 32.5 5 trace
32 october 688.4 33 5.9 more_half
33 october 607.6 37.5 7 more_half
34 october 597.9 31 10.3 full
35 october 1150.6 39.5 7.9 trace
36 october 944.6 36.3 13 full
37 october 662.9 33 11.5 trace
38 october 994.6 37 9.4 full
39 october 734 34.5 9.4 trace
40 october 709 34.5 7.3 trace
2
41 october 669.9 33 7.5 more_half
42 october 1041.1 39 9 more_half
43 october 809.6 36 10 trace
44 october 992.6 38.5 9.2 trace
45 october 842.4 37.5 8.2 full
46 october 654.6 33 7.9 less_half
47 october 822.9 35.5 6 trace
48 october 419.1 31 7.5 trace
49 october 707.5 33.5 8.4 more_half
50 october 578.6 32.2 7.6 full
51 October 913.4 35.5 10 empty
52 october 819.9 36 7 less_half
53 october 811.2 36 9.6 empty
54 october 880.5 37.2 7 trace
55 october 797.5 35.5 7.1 full
56 october 274.1 24.2 8 trace
57 october 612.9 23 7 full
58 october 40 13.5 4.8 less_half
59 october 22.7 11.2 4 full
60 october 31.9 12.4 6.6 full
61 october 20.7 11 5.6 empty
62 october 16 10 4 less_half
63 0ctober 18.1 10.6 5.1 more_half
64 october 17.7 10.2 5.1 more_half
65 october 18.3 10.5 4 trace
66 october 19.1 10.6 4.9 less_half
67 october 12.1 10.2 4.8 full
68 october 9.8 8.5 4.4 empty
69 october 6.4 7.5 3.7 more_half
70 October 5.7 7.3 4.2 more_half
71 october 12.2 9 3.4 less_half
72 october 12.7 9.5 4.4 more_half

3