Embed Size (px)
Citation preview

Spring 2021FOOD & BEVERAGE M&A LANDSCAPE
INDUSTRY INSIGHTS

Food and Beverage M&A Landscape | Spring 2021
2
M&A Market OverviewFood and beverage M&A deal activity in the U.S. and Canada returned to pre-COVID
levels in the first quarter of 2021, with 327 deals closing over the trailing twelve-
month (TTM) period ending March 31, 2021. Transaction volumes in Q1 2021 were
on par with the previous year, with 94 deals closing over both periods. Q1 2021 also
tied Q1 2020 for the strongest first quarter deal count on record for the food and
beverage space.
The first quarter of 2021 saw several notable North American deals. In the U.S.,
Metropoulos & One Rock Capital Partners acquired Nestlé Waters North America Inc.
There were noteworthy cross border transactions in the quarter as well, including the
sale of Ya YA Foods Corporation, a Canadian beverage co-packing provider, to
Chicago-based private equity firm, Entrepreneurial Equity Partners, L.P. Duff &
Phelps acted as exclusive financial advisor to the shareholders of Ya YA. Please see
page 4 for more details.
The confectionary and snack space was very active in Q1 2021 with several large
strategic players consummating transactions. Hormel Foods (NYSE:HRL) agreed to
acquire the Nuts Business from Kraft Heinz Company, Mondelez International, Inc.
(NasdaqGS:MDLZ) acquired Hu Master Holdings, LLC and Sun-Maid Growers of
California, Inc. agreed to acquire Plum Organics from Campbell Soup Company
(NYSE:CPB).
M&A activity in the food and beverage sector over the TTM period ending March 31,
2021 is still predominately driven by strategic buyers (including companies primarily
owned by private equity investors), with strategic transactions representing 82% of
total deal value. Of the 327 deals closed over TTM Q1 2021, 265 (81%) were
completed by privately owned buyers.
On the pandemic front, COVID-19 vaccination programs continue to roll out across
North America, giving consumers, buyers and investors increasing visibility of a
return to normalcy. With U.S. vaccination rates faring particularly well, battered
sectors like restaurants, hospitality and tourism are cautiously opening back up,
providing a welcome demand boost to food and beverage businesses that supply
those end markets. These improving trends support a strong outlook for M&A activity
for the remainder of 2021, particularly when combined with robust cash on the
balance sheets of strategic buyers and SPACs, private equity funds with ample
capital and attractive borrowing costs from financial institutions.
Sources: Capital IQ as of March 31, 2021Note: M&A deal count is defined by a list of subsectors viewed as the best representation of the industry.
M&A Market Overview2
Recent North American M&A Activity by Subsector
5
Public Company Trading Multiples
11
About Our Food and Beverage Corporate Finance Practice
17
Food and Beverage M&A Landscape | Spring 2021
T A B L E O F C O N T E N T S
Select Recent Transactions4

Food and Beverage M&A Landscape | Spring 2021
3
Strategic
82%
Financial
18%
Private
81%
Public
19%
Strategic vs. Financial
Buyer
Note: Includes food and beverage sector deals where the target was based in North America Source: S&P Global Market Intelligence. Transactions with more than 50% of the company acquired are included in the analysis.
Number of Closed Deals (as of March 31, 2021)
By Number of Closed Deals (for the year ending March 31, 2021)
Public vs. Private Buyer
M&A Market Overview, Continued
57
45
63
7873
54
63
73
62
77
60
7480
6165
99
80 78
68
8794
56
8592 94
Q1 Q2 Q3 Q4 Q1 Q2 Q3 Q4 Q1 Q2 Q3 Q4 Q1 Q2 Q3 Q4 Q1 Q2 Q3 Q4 Q1 Q2 Q3 Q4 Q1
2015 2016 2017 2018 2019 2020 2021
Food and Beverage M&A Landscape | Spring 2021
4
Select Recent Transactions1
1 Deals in the U.S. and Canada, closed or announced over Q1 2021, selected based on subjectively being representative of recent market activity, excluding bankruptcy sales. Sources: S&P Global Market Intelligence, Mergermarket, company press releases and various news sources (e.g., Newswire, PR Newswire, GlobeNewswire)Note: All trademarks, trade names, or logos referenced herein are the property of their respective owners.
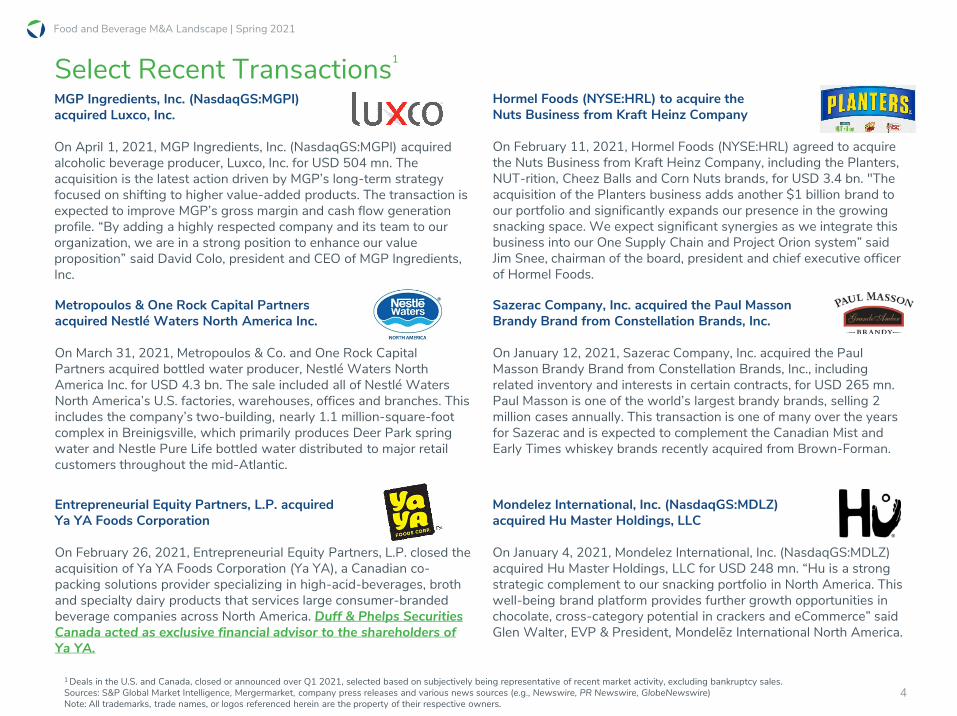
Sazerac Company, Inc. acquired the Paul Masson Brandy Brand from Constellation Brands, Inc.
On January 12, 2021, Sazerac Company, Inc. acquired the Paul Masson Brandy Brand from Constellation Brands, Inc., including related inventory and interests in certain contracts, for USD 265 mn. Paul Masson is one of the world’s largest brandy brands, selling 2 million cases annually. This transaction is one of many over the years for Sazerac and is expected to complement the Canadian Mist and Early Times whiskey brands recently acquired from Brown-Forman.
Entrepreneurial Equity Partners, L.P. acquiredYa YA Foods Corporation
On February 26, 2021, Entrepreneurial Equity Partners, L.P. closed the acquisition of Ya YA Foods Corporation (Ya YA), a Canadian co-packing solutions provider specializing in high-acid-beverages, broth and specialty dairy products that services large consumer-branded beverage companies across North America. Duff & Phelps Securities Canada acted as exclusive financial advisor to the shareholders of Ya YA.
Hormel Foods (NYSE:HRL) to acquire theNuts Business from Kraft Heinz Company
On February 11, 2021, Hormel Foods (NYSE:HRL) agreed to acquire the Nuts Business from Kraft Heinz Company, including the Planters, NUT-rition, Cheez Balls and Corn Nuts brands, for USD 3.4 bn. "The acquisition of the Planters business adds another $1 billion brand to our portfolio and significantly expands our presence in the growing snacking space. We expect significant synergies as we integrate this business into our One Supply Chain and Project Orion system” said Jim Snee, chairman of the board, president and chief executive officer of Hormel Foods.
Metropoulos & One Rock Capital Partners acquired Nestlé Waters North America Inc.
On March 31, 2021, Metropoulos & Co. and One Rock Capital Partners acquired bottled water producer, Nestlé Waters North America Inc. for USD 4.3 bn. The sale included all of Nestlé Waters North America’s U.S. factories, warehouses, offices and branches. This includes the company’s two-building, nearly 1.1 million-square-foot complex in Breinigsville, which primarily produces Deer Park spring water and Nestle Pure Life bottled water distributed to major retail customers throughout the mid-Atlantic.
MGP Ingredients, Inc. (NasdaqGS:MGPI) acquired Luxco, Inc.
On April 1, 2021, MGP Ingredients, Inc. (NasdaqGS:MGPI) acquired alcoholic beverage producer, Luxco, Inc. for USD 504 mn. The acquisition is the latest action driven by MGP’s long-term strategy focused on shifting to higher value-added products. The transaction is expected to improve MGP’s gross margin and cash flow generation profile. “By adding a highly respected company and its team to our organization, we are in a strong position to enhance our value proposition” said David Colo, president and CEO of MGP Ingredients, Inc.
Mondelez International, Inc. (NasdaqGS:MDLZ)acquired Hu Master Holdings, LLC
On January 4, 2021, Mondelez International, Inc. (NasdaqGS:MDLZ) acquired Hu Master Holdings, LLC for USD 248 mn. “Hu is a strong strategic complement to our snacking portfolio in North America. This well-being brand platform provides further growth opportunities in chocolate, cross-category potential in crackers and eCommerce” said Glen Walter, EVP & President, Mondelēz International North America.

Food and Beverage M&A Landscape | Spring 2021
5
Recent North American M&A Activity by Subsector
Food and Beverage Subsector Definitions Deals by Subsector (TTM as of March 31, 2021)
Fo
od
Bevera
ges
Source: Capital IQ as of March 31, 2021. Note: M&A deal count is defined by a list of subsectors viewed as the best representation of the industry.
Bakery:Production and distribution of baked goods
Better-For-You:Differentiated food products with health benefits
Confectionery/Snacks:Chocolate, candy, nuts and other convenient snack foods
General:Conglomerates and general food businesses
Dairy: Production and distribution of dairy or dairy by-products, such as cheese or yogurt
Ingredients:Goods used in the production of other food-related items
Produce:Fresh produce or other agricultural products
Protein Producers:Meat and seafood producers and distributors
Specialty-Pet:Pet food producers, distributors and retailers
Non-Alcoholic Beverages:Beverages that do not contain alcohol
Alcoholic Beverages:Wine, beer and spirits
General
15%Dairy
3%
Better-For-
You
6%
Specialty-Pet
3%
Protein
Producers
9%
Confectionery/
Snacks…
Produce
14% Ingredients
8%
Bakery
6%
Non-Alcoholic
Beverages
10%
Alcoholic
Beverages
16%

Food and Beverage M&A Landscape | Spring 2021
6
Confectionery/Snacks
Announced March 5, 2021 February 10, 2021 February 8, 2021 January 4, 2021
Nuts Business of The Kraft
Heinz CompanyLYF Food Technologies Inc. Sprout Foods, Inc.
Certain Assets of Vitner's
brandHu Master Holdings, LLC
US CA US US US
Nuts Business of The Kraft
Heinz Company comprises
multiple production facilities
manufacturing nutrition
products, cheez balls,
cheez curls and corn nuts
branded products.
LYF Food Technologies
Inc. produces chocolate,
confectionary, and baked
and health food edibles.
Sprout Foods, Inc.
manufactures and sells
organic food for babies,
toddlers, and people of
various ages.
Certain Assets of Vitner's
brand comprises
intellectual property,
including snack food
trademark Vitner’s, and
direct-store-delivery
distribution assets.
Hu Master Holdings, LLC
manufactures and sells
chocolate products.
Hormel Foods Corporation The Valens Company Inc.Neptune Wellness
Solutions Inc.Utz Quality Foods, LLC Mondelez International, Inc.
EV: USD 3,350.0
LTM Rev.: USD 1,100.0
EV/Rev.: 3.0x
EV: USD 37.5
EV: USD 57.1
LTM Rev.: USD 28.0
EV/Rev.: 2.0x
EV: USD 25.0
LTM Rev.: USD 25.0
LTM EBITDA: USD 3.4
EV/Rev.: 1.0x
EV/EBITDA: 7.4x
EBITDA Margin: 13.6%
EV: USD 248.4
($ USD in millions)
Date Closed
Target
Target Location
Target Business
Description
Acquirer
Financial Metrics(Where Disclosed)
Recent North American M&A Activity1
1 Includes majority acquisitions and mergers with disclosed financial details. Excludes bankruptcy sales. Source: S&P Global Market Intelligence as of March 31, 2021
Food and Beverage M&A Landscape | Spring 2021
7
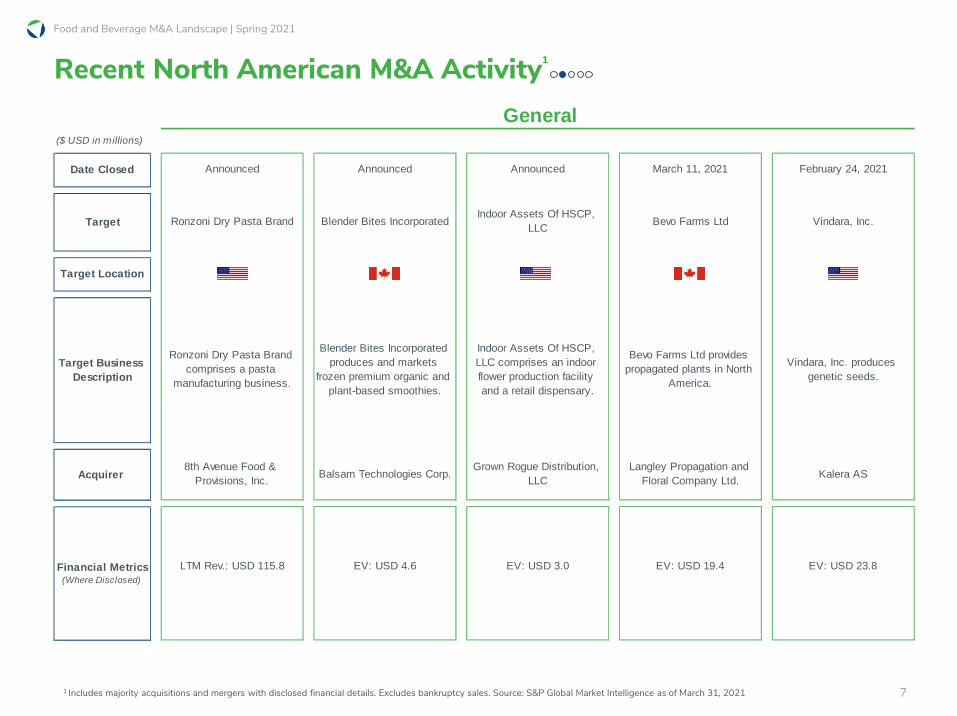
General
Announced Announced Announced March 11, 2021 February 24, 2021
Ronzoni Dry Pasta Brand Blender Bites IncorporatedIndoor Assets Of HSCP,
LLCBevo Farms Ltd Vindara, Inc.
US CA US CA US
Ronzoni Dry Pasta Brand
comprises a pasta
manufacturing business.
Blender Bites Incorporated
produces and markets
frozen premium organic and
plant-based smoothies.
Indoor Assets Of HSCP,
LLC comprises an indoor
flower production facility
and a retail dispensary.
Bevo Farms Ltd provides
propagated plants in North
America.
Vindara, Inc. produces
genetic seeds.
8th Avenue Food &
Provisions, Inc.Balsam Technologies Corp.
Grown Rogue Distribution,
LLC
Langley Propagation and
Floral Company Ltd.Kalera AS
LTM Rev.: USD 115.8 EV: USD 4.6 EV: USD 3.0 EV: USD 19.4 EV: USD 23.8
Recent North American M&A Activity1
1 Includes majority acquisitions and mergers with disclosed financial details. Excludes bankruptcy sales. Source: S&P Global Market Intelligence as of March 31, 2021
($ USD in millions)
Date Closed
Target
Target Location
Target Business
Description
Acquirer
Financial Metrics(Where Disclosed)

Food and Beverage M&A Landscape | Spring 2021
8
General
January 19, 2021
YamChops
CA
YamChops operates as a
plant-based butcher shop.
Plant & Co. Brands Ltd.
EV: USD 0.8
Better-For-You
March 31, 2021 March 12, 2021
Be Good Plant Based
Foods Ltd.PlantFuel, Inc.
CA US
Be Good Plant Based
Foods Ltd. manufactures
plant based food products.
PlantFuel, Inc.
manufactures plant-based
protein products for athletes
to build muscles.
NHS Industries Ltd. Sire Bioscience Inc.
EV: USD 2.3 EV: USD 9.7
Dairy
March 4, 2021 February 24, 2021
The Future of Cheese Corp. The Cultured Nut Inc.
CA CA
The Future of Cheese Corp.
produces plant-based
cheese products.
The Cultured Nut Inc.
produces plant-based
cheese.
Organic Garage Ltd.The Very Good Food
Company Inc.
EV: USD 6.1 EV: USD 2.3
Recent North American M&A Activity1
1 Includes majority acquisitions and mergers with disclosed financial details. Excludes bankruptcy sales. Source: S&P Global Market Intelligence as of March 31, 2021
($ USD in millions)
Date Closed
Target
Target Location
Target Business
Description
Acquirer
Financial Metrics(Where Disclosed)

Food and Beverage M&A Landscape | Spring 2021
9
Alcoholic Beverages
April 8, 2021 April 1, 2021
Vermont Hard Cider
Company, LLCLuxco, Inc.
US US
Vermont Hard Cider
Company, LLC produces
and sells hard ciders in the
United States.
Luxco, Inc. produces,
bottles, imports, and
markets specialty alcoholic
beverage products.
Northeast Drinks Group LLC MGP Ingredients, Inc.
EV: USD 20.0
EV: USD 503.6
LTM Rev.: USD 202.0
LTM EBITDA: USD 28.0
EV/Rev.: 2.5x
EV/EBITDA: 18.0x
EBITDA Margin: 13.9%
Non-Alcoholic Beverages
March 31, 2021 March 5, 2021
Nestlé Waters North
America Inc.Essentia Water, LLC
US US
Nestlé Waters North
America Inc. produces and
sells bottled water in the
United States and Canada.
Essentia Water, LLC
manufactures, packages,
and markets bottled
alkaline and electrolyzed
water.
One Rock Capital Partners,
LLC; Metropoulos & Co.Nestlé USA, Inc.
EV: USD 4,300.0 LTM Rev.: USD 192.0
Specialty-Pet
January 31, 2021
Nirvana Group, LLC
US
Nirvana Group, LLC
produces and distributes
natural pet wellness
products under the brand
name of BudaPets.
PureK Holdings Corp.
EV: USD 3.0
Recent North American M&A Activity1
1 Includes majority acquisitions and mergers with disclosed financial details. Excludes bankruptcy sales. Source: S&P Global Market Intelligence as of March 31, 2021
($ USD in millions)
Date Closed
Target
Target Location
Target Business
Description
Acquirer
Financial Metrics(Where Disclosed)

Food and Beverage M&A Landscape | Spring 2021
10
Protein
Announced February 15, 2021
Aquaculture Assets of
Hydrenesis
Aquaculture, LLC
GBS Partners, Inc.
US US
Aquaculture Assets of
Hydrenesis
Aquaculture, LLC
comprises
recirculating
aquaculture systems
(RAS) technology
used in shrimp
production.
GBS Partners, Inc., doing
business as Boulder
Sausage Company,
produces and supplies
sausage products in
Colorado.
NaturalShrimp
IncorporatedMBH Corporation PLC
EV: USD 12.5
EV: USD 3.6
LTM Rev.: USD 4.8
EV/Rev.: 0.7x
Produce
March 1, 2021
Controlled Environment
Agriculture (CEA) Facility in
Morehead
US
Controlled Environment
Agriculture (CEA) Facility in
Morehead comprises a
facility used for the indoor
farming of various fruits and
vegetables.
AppHarvest, Inc.
EV: USD 125.0
Recent North American M&A Activity1
1 Includes majority acquisitions and mergers with disclosed financial details. Excludes bankruptcy sales. Source: S&P Global Market Intelligence as of March 31, 2021
($ USD in millions)
Date Closed
Target
Target Location
Target Business
Description
Acquirer
Financial Metrics(Where Disclosed)

Food and Beverage M&A Landscape | Spring 2021
11
11.1x 11.1x 11.6x10.3x 10.3x
18.2x
20.2x
17.7x18.9x
19.9x
15.9x14.3x
16.3x 16.4x 15.3x
13.0x
11.0x11.9x
10.6x11.0x
19.9x
17.2x15.7x 15.3x 14.8x
12.6x 11.4x11.0x 10.3x 9.9x
8.5x
Bett
er-
For-
You
No
n-A
lcoho
licB
evera
ge
s
Ingre
die
nts
Co
nfe
ctio
nery
/S
na
cks
Alc
oholic
Bevera
ge
s
Pro
du
ce
Da
iry
Ge
ne
ral
Bakery
Spe
cialty-P
et
Pro
tein
Pro
du
cers
Note: Sector constituents based on selected comparable companies; certain periods exclude outliers based on Duff & Phelps analysis; EBITDA does not reflect adjustments for extraordinary itemsEV = enterprise value = market capitalization + total debt + preferred equity – cash and short-term investments. TTM = trailing 12 months. Source: S&P Global Market Intelligence
Public Company Trading Multiples
Median
5-year median
EV/TTM EBITDA Median Multiples – Food and Beverage Subsectors as of March 31, 2021
11.1x
18.9x
15.9x
11.0x
EV/TTM EBITDA Median Multiples by Subsector as of March 31, 2021
GeneralBakery Better-For-YouConfectionery/
Snacks
12.6x

Food and Beverage M&A Landscape | Spring 2021
12
11.8x
9.7x8.9x
7.3x
9.9x
16.7x
14.2x
16.4x 16.6x 17.2x15.7x
13.2x
22.5x
27.1x
14.8x
16.4x
14.7x14.2x
12.1x11.4x
14.5x
11.9x
15.6x
14.5x
15.7x 15.3x14.5x
16.2x
11.0x
12.6x
10.4x11.4x
14.3x
7.8x8.5x
EV/TTM EBITDA Median Multiples – Food and Beverage Subsectors as of March 31, 2021
Public Company Trading Multiples
Dairy Ingredients Protein Producers
14.2x 14.5x 14.5x
10.4x
9.7x
16.6x 15.7x
Specialty-Pet Non-Alcoholic Beverages Alcoholic Beverages
Produce
Note: Sector constituents based on selected comparable companies; certain periods exclude outliers based on Duff & Phelps analysis; EBITDA does not reflect adjustments for extraordinary itemsEV = enterprise value = market capitalization + total debt + preferred equity – cash and short-term investments. TTM = trailing 12 months. Source: S&P Global Market Intelligence
5-year median

Food and Beverage M&A Landscape | Spring 2021
13
*Specialty-Pet companies were excluded due to insufficient data1 The values above represent high, median and low data points for each category as of March 31, 2021.
Source: S&P Global Market Intelligence
Enterprise Value/TTM EBITDA (by sector)1 – Range and Median (as of March 31, 2021)*
Select Public Company Operating and Trading Statistics
5-Year Revenue Growth Rate (CAGR)1 – Range and Median (as of March 31, 2021)*
10.4%
-4.9%
3.4%
22.3%
6.2%
11.0% 10.0% 9.3%11.1%
22.0%
3.1%
-6.0%
-1.1%
3.6%1.6% 1.3%
3.0%5.0% 5.9%
10.6%
3.0%
-7.2%
-2.7%
0.4%
-3.0%-1.0%
0.7%
-6.3% -5.7%
1.6%
12.4x
29.0x
21.7x 20.9x
13.5x
34.6x
28.2x
19.2x
27.0x29.4x
10.3x
19.9x
15.3x
11.0x 11.4x
15.7x12.6x
8.5x
17.2x14.8x
8.3x
18.1x
11.2x9.0x 9.2x
7.4x3.2x
5.0x
11.3x8.6x

Food and Beverage M&A Landscape | Spring 2021
14
Public Company Trading Statistics
Source: S&P Global Market Intelligence as of March 31, 2021. Companies selected based on being most representative of their specific industry group.
Glossary
CAGR: Compound annual growth rate
EBITDA: Earnings before interest, taxes, depreciation and amortization. EBITDA does not reflect adjustments for extraordinary items.
Enterprise Value: Market capitalization + total debt + preferred equity + minority interest – cash and short-term investments
TTM: Trailing 12 months
(USD in millions, except per share data)
31-Mar-21 % of Operating Metrics (TTM) Enterprise Value as a Multiple of
Stock 52-Wk Market Enterprise Revenue EBITDA Ret. on Net Debt/ Revenue EBITDA
Company HQ Price High Cap. Value Revenue CAGR, 5-Yr. Margin Assets Assets EBITDA TTM 2021E 2022E TTM 2021E 2022E
Bakery
George Weston Limited CA 88.47 98% 13,460 32,646 42,933 3.1% 9.1% 37,730 3.8% 4.0x 0.8x 0.8x 0.7x 8.3x 7.3x 6.9x
Flowers Foods, Inc. U.S. 23.80 95% 5,038 6,054 4,388 3.0% 13.4% 3,323 7.0% 2.1x 1.4x 1.4x 1.4x 10.3x 13.0x 12.6x
Hostess Brands, Inc. U.S. 14.34 89% 1,873 2,840 1,017 10.4% 22.6% 3,365 3.3% 4.4x 2.8x 2.7x 2.6x 12.4x 11.0x 10.6x
Median 95% 5,038 6,054 4,388 3.1% 13.4% 3,365 3.8% 4.0x 1.4x 1.4x 1.4x 10.3x 11.0x 10.6x
Mean 94% 6,790 13,847 16,112 5.5% 15.0% 14,806 4.7% 3.5x 1.6x 1.6x 1.6x 10.3x 10.5x 10.0x
Better-For-You
The Hain Celestial Group, Inc. U.S. 43.60 95% 4,356 4,698 2,092 -4.9% 11.8% 2,266 4.9% 1.5x 2.2x 2.3x 2.3x 19.1x 18.8x 16.9x
BellRing Brands, Inc. U.S. 23.61 89% 933 3,943 1,027 NA 19.3% 681 15.6% 3.3x 3.8x 3.6x 3.2x 19.9x 18.5x 16.6x
The Simply Good Foods Company U.S. 30.42 86% 2,913 3,420 899 NA 19.1% 2,022 4.6% 3.0x 3.8x 3.6x 3.4x 20.0x 18.9x 17.6x
SunOpta Inc. CA 14.77 86% 1,530 1,759 789 -7.2% 7.7% 586 1.2% 2.4x 2.2x 2.1x 2.0x 29.0x 26.8x 22.8x
Whole Earth Brands, Inc. U.S. 13.04 87% 501 679 275 NA 13.6% 597 2.0% 5.4x 2.5x 1.4x 1.2x 18.1x 8.1x 6.9x
Median 87% 1,530 3,420 899 -6.0% 13.6% 681 4.6% 3.0x 2.5x 2.3x 2.3x 19.9x 18.8x 16.9x
Mean 89% 2,047 2,900 1,017 -6.0% 14.3% 1,230 5.7% 3.1x 2.9x 2.6x 2.4x 21.2x 18.2x 16.2x
Confectionery/Snacks
Mondelez International, Inc. U.S. 58.53 97% 82,240 100,142 26,581 -2.2% 24.6% 67,810 4.1% 3.2x 3.8x 3.6x 3.4x 15.3x 16.9x 16.1x
The Hershey Company U.S. 158.16 98% 32,765 36,446 8,150 2.0% 26.3% 9,132 13.1% 1.8x 4.5x 4.3x 4.2x 17.0x 16.6x 15.9x
Post Holdings, Inc. U.S. 105.72 97% 6,805 13,285 5,700 3.4% 18.6% 12,140 3.5% 6.2x 2.3x 2.3x 2.2x 12.5x 11.3x 10.5x
Utz Brands, Inc. U.S. 24.79 93% 1,896 3,585 964 NA 8.9% 2,584 1.5% 9.0x 3.7x 3.1x 3.0x NA 19.2x 17.1x
J & J Snack Foods Corp. U.S. 157.03 93% 2,980 2,755 964 -0.5% 6.5% 1,065 -0.1% NA 2.9x 2.6x 2.5x NA 28.3x 18.3x
Tootsie Roll Industries, Inc. U.S. 33.13 58% 2,250 1,963 471 -2.7% 19.2% 985 4.6% NA 4.2x NA NA 21.7x NA NA
John B. Sanfilippo & Son, Inc. U.S. 90.37 97% 1,036 1,066 860 -1.7% 11.0% 398 11.8% 0.3x 1.2x 1.2x 1.2x 11.2x NA NA
Median 97% 2,980 3,585 964 -1.1% 18.6% 2,584 4.1% 3.2x 3.7x 2.9x 2.7x 15.3x 16.9x 16.1x
Mean 90% 18,568 22,749 6,241 -0.3% 16.4% 13,445 5.5% 4.1x 3.2x 2.9x 2.7x 15.6x 18.4x 15.6x
General
The Kraft Heinz Company U.S. 40.00 97% 48,925 74,800 26,185 7.4% 31.9% 99,830 3.7% 3.8x 2.9x 3.0x 3.1x 9.0x 12.2x 12.4x
General Mills, Inc. U.S. 61.32 93% 37,403 49,394 18,626 1.9% 23.0% 32,649 7.1% 2.7x 2.7x 2.8x 2.8x 11.5x 13.2x 13.6x
Kellogg Company U.S. 63.30 87% 21,544 29,772 13,770 0.4% 17.8% 17,996 6.5% 3.3x 2.2x 2.2x 2.2x 12.1x 13.1x 12.8x
Conagra Brands, Inc. U.S. 37.60 96% 18,046 27,920 11,733 3.8% 22.7% 22,105 6.1% 3.7x 2.4x 2.5x 2.6x 10.5x 11.7x 12.1x
Campbell Soup Company U.S. 50.27 93% 15,232 20,547 8,965 2.3% 22.6% 12,498 7.3% 3.1x 2.3x 2.4x 2.5x 10.2x 11.6x 11.8x
The J. M. Smucker Company U.S. 126.53 96% 13,705 18,204 8,175 1.9% 24.8% 16,429 5.6% 2.3x 2.2x 2.3x 2.4x 9.0x 10.5x 11.3x
TreeHouse Foods, Inc. U.S. 52.24 94% 2,921 5,047 4,350 6.3% 12.8% 5,486 3.5% 4.3x 1.2x 1.1x 1.1x 9.1x 9.5x 9.3x
Premium Brands Holdings Corporation CA 95.19 99% 4,150 4,918 3,162 22.3% 7.4% 2,752 3.5% 3.5x 1.6x 1.3x 1.2x 20.9x 14.1x 12.4x
Lancaster Colony Corporation U.S. 175.36 93% 4,831 4,633 1,366 3.3% 16.5% 1,054 10.6% NA 3.4x 3.3x 3.2x 20.5x 19.0x 17.4x
B&G Foods, Inc. U.S. 31.06 65% 2,010 4,327 1,968 15.3% 18.9% 3,768 5.2% 6.5x 2.2x 2.1x 2.1x 11.7x 11.3x 11.2x
Median 94% 14,468 19,376 8,570 3.6% 20.7% 14,464 5.9% 3.5x 2.3x 2.4x 2.4x 11.0x 12.0x 12.2x
Mean 91% 16,877 23,956 9,830 6.5% 19.8% 21,457 5.9% 3.7x 2.3x 2.3x 2.3x 12.4x 12.6x 12.4x

Food and Beverage M&A Landscape | Spring 2021
15
(USD in millions, except per share data)
31-Mar-21 % of Operating Metrics (TTM) Enterprise Value as a Multiple of
Stock 52-Wk Market Enterprise Revenue EBITDA Ret. on Net Debt/ Revenue EBITDA
Company HQ Price High Cap. Value Revenue CAGR, 5-Yr. Margin Assets Assets EBITDA TTM 2021E 2022E TTM 2021E 2022E
Protein Producers
Tyson Foods, Inc. U.S. 74.30 95% 27,100 36,194 42,830 1.5% 11.5% 35,458 6.7% 1.8x 0.8x 0.8x 0.8x 7.4x 8.2x 7.8x
Hormel Foods Corporation U.S. 47.78 90% 25,808 25,346 9,685 1.1% 14.3% 9,958 7.8% NA 2.6x 2.5x 2.4x 18.3x 18.3x 17.0x
Beyond Meat, Inc. U.S. 130.12 59% 8,199 8,071 407 NA -3.7% 468 -4.3% 6.5x 19.8x 13.8x 9.0x NM NA NA
Pilgrim's Pride Corporation U.S. 23.79 92% 5,797 7,831 12,092 6.7% 7.7% 7,474 3.7% 2.6x 0.6x 0.6x 0.6x 8.5x 7.5x 6.7x
Seaboard Corporation U.S. 3,689.99 94% 4,283 4,254 7,126 5.0% 7.8% 6,399 2.3% NA 0.6x NA NA 7.6x NA NA
Maple Leaf Foods Inc. CA 22.78 93% 2,807 3,525 3,378 5.5% 9.9% 3,030 4.2% 2.3x 1.0x 1.0x 0.9x 10.5x 9.8x 8.4x
Sanderson Farms, Inc. U.S. 155.78 93% 3,479 3,520 3,650 5.9% 19.3% 1,902 3.3% 0.2x 1.0x 0.8x 0.8x 5.0x 8.9x 7.8x
Cal-Maine Foods, Inc. U.S. 38.42 82% 1,877 1,699 1,453 -6.3% 9.0% 1,231 3.5% NA 1.2x 1.2x 1.1x 13.0x 18.1x 12.9x
High Liner Foods Incorporated CA 10.68 95% 357 630 827 -3.7% 10.0% 777 4.8% 3.5x 0.8x 0.7x 0.7x 7.6x 6.9x 6.3x
Bridgford Foods Corporation U.S. 15.50 66% 141 163 206 9.3% 4.1% 157 1.2% 2.6x 0.8x NA NA 19.2x NA NA
Median 93% 3,881 3,890 3,514 5.0% 9.5% 2,466 3.6% 2.6x 0.9x 0.9x 0.9x 8.5x 8.9x 7.8x
Mean 86% 7,985 9,123 8,165 2.8% 9.0% 6,685 3.3% 2.8x 2.9x 2.7x 2.1x 10.8x 11.1x 9.5x
Specialty-Pet
Freshpet, Inc. U.S. 158.81 92% 6,851 6,792 319 22.4% 8.4% 434.39 0.7% NA 21.3x 15.7x 12.0x NA NA NA
Central Garden & Pet Company U.S. 58.01 92% 3,200 3,244 2,805 10.5% 11.7% 2,446 6.2% 1.1x 1.2x 1.0x 1.0x 9.9x 11.2x 10.5x
Median 92% 5,026 5,018 1,562 16.4% 10.0% 1,440 3.4% 1.1x 11.2x 8.4x 6.5x 9.9x 11.2x 10.5x
Mean 92% 5,026 5,018 1,562 16.4% 10.0% 1,440 3.4% 1.1x 11.2x 8.4x 6.5x 9.9x 11.2x 10.5x
Non-Alcoholic Beverages
The Coca-Cola Company U.S. 52.71 96% 227,233 262,635 33,433 -5.3% 38.4% 87,296 7.2% 2.9x 7.9x 7.1x 6.7x 20.5x 21.2x 19.5x
PepsiCo, Inc. U.S. 141.45 95% 195,432 231,598 71,311 2.6% 18.9% 91,224 7.8% 2.9x 3.2x 3.1x 2.9x 17.2x 16.2x 15.0x
Keurig Dr Pepper Inc. U.S. 34.37 97% 48,368 62,620 11,618 NA 31.5% 49,779 3.6% 4.0x 5.4x 5.2x 5.0x 17.1x 15.3x 14.5x
Monster Beverage Corporation U.S. 91.09 96% 48,108 46,068 4,599 11.1% 37.0% 6,203 18.0% NA 10.0x 8.8x 8.0x 27.0x 24.0x 21.8x
National Beverage Corp. U.S. 48.91 50% 4,563 4,446 1,074 9.2% 23.8% 497 25.6% NA 4.1x 4.1x 3.9x 17.4x 18.0x 17.6x
Primo Water Corporation U.S. 16.27 90% 2,617 4,174 1,954 10.5% 18.9% 3,605 2.0% 4.9x 2.1x 2.0x 1.9x 11.3x 11.0x 10.4x
Farmer Bros. Co. U.S. 10.44 90% 186 293 412 -5.3% 5.7% 356 -2.3% 6.4x 0.7x 0.7x 0.6x 12.5x 15.4x 9.6x
Median 95% 48,108 46,068 4,599 5.9% 23.8% 6,203 7.2% 4.0x 4.1x 4.1x 3.9x 17.2x 16.2x 15.0x
Mean 88% 75,215 87,405 17,771 3.8% 24.9% 34,137 8.8% 4.2x 4.8x 4.4x 4.2x 17.6x 17.3x 15.5x
Alcoholic Beverages
Constellation Brands, Inc. U.S. 228.00 94% 44,098 55,280 8,615 5.6% 43.3% 27,105 6.8% 3.2x 6.4x 6.5x 6.1x 14.8x 17.3x 15.6x
Brown-Forman Corporation U.S. 68.97 83% 33,016 33,672 3,358 1.6% 34.2% 6,495 11.1% 1.4x 10.0x 9.9x 9.2x 29.4x 29.1x 26.3x
Molson Coors Beverage Company U.S. 51.15 91% 11,095 19,187 9,654 22.0% 23.2% 27,331 3.0% 3.6x 2.0x 1.9x 1.9x 8.6x 9.1x 8.8x
The Boston Beer Company, Inc. U.S. 1,206.28 96% 14,690 14,563 1,951 15.5% 20.0% 1,464 14.8% NA 7.5x 5.7x 4.5x NA 28.3x 20.5x
Median 93% 23,853 26,430 5,986 10.6% 28.7% 16,800 9.0% 3.2x 6.9x 6.1x 5.3x 14.8x 22.8x 18.1x
Mean 91% 25,725 30,675 5,894 11.2% 30.2% 15,599 8.9% 2.7x 6.5x 6.0x 5.4x 17.6x 20.9x 17.8x
Public Company Trading Statistics
Source: S&P Global Market Intelligence as of March 31, 2021. Companies selected based on being most representative of their specific industry group.
Glossary
CAGR: Compound annual growth rate
EBITDA: Earnings before interest, taxes, depreciation and amortization. EBITDA does not reflect adjustments for extraordinary items.
Enterprise Value: Market capitalization + total debt + preferred equity + minority interest – cash and short-term investments
TTM: Trailing 12 months
Food and Beverage M&A Landscape | Spring 2021
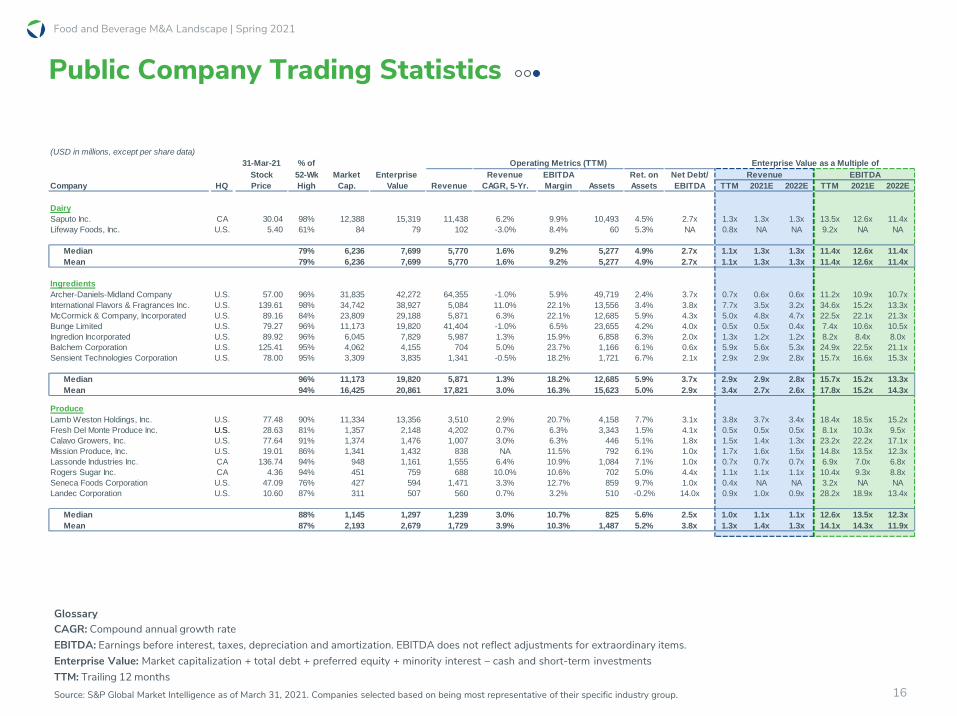
16
Public Company Trading Statistics
Source: S&P Global Market Intelligence as of March 31, 2021. Companies selected based on being most representative of their specific industry group.
Glossary
CAGR: Compound annual growth rate
EBITDA: Earnings before interest, taxes, depreciation and amortization. EBITDA does not reflect adjustments for extraordinary items.
Enterprise Value: Market capitalization + total debt + preferred equity + minority interest – cash and short-term investments
TTM: Trailing 12 months
(USD in millions, except per share data)
31-Mar-21 % of Operating Metrics (TTM) Enterprise Value as a Multiple of
Stock 52-Wk Market Enterprise Revenue EBITDA Ret. on Net Debt/ Revenue EBITDA
Company HQ Price High Cap. Value Revenue CAGR, 5-Yr. Margin Assets Assets EBITDA TTM 2021E 2022E TTM 2021E 2022E
Dairy
Saputo Inc. CA 30.04 98% 12,388 15,319 11,438 6.2% 9.9% 10,493 4.5% 2.7x 1.3x 1.3x 1.3x 13.5x 12.6x 11.4x
Lifeway Foods, Inc. U.S. 5.40 61% 84 79 102 -3.0% 8.4% 60 5.3% NA 0.8x NA NA 9.2x NA NA
Median 79% 6,236 7,699 5,770 1.6% 9.2% 5,277 4.9% 2.7x 1.1x 1.3x 1.3x 11.4x 12.6x 11.4x
Mean 79% 6,236 7,699 5,770 1.6% 9.2% 5,277 4.9% 2.7x 1.1x 1.3x 1.3x 11.4x 12.6x 11.4x
Ingredients
Archer-Daniels-Midland Company U.S. 57.00 96% 31,835 42,272 64,355 -1.0% 5.9% 49,719 2.4% 3.7x 0.7x 0.6x 0.6x 11.2x 10.9x 10.7x
International Flavors & Fragrances Inc. U.S. 139.61 98% 34,742 38,927 5,084 11.0% 22.1% 13,556 3.4% 3.8x 7.7x 3.5x 3.2x 34.6x 15.2x 13.3x
McCormick & Company, Incorporated U.S. 89.16 84% 23,809 29,188 5,871 6.3% 22.1% 12,685 5.9% 4.3x 5.0x 4.8x 4.7x 22.5x 22.1x 21.3x
Bunge Limited U.S. 79.27 96% 11,173 19,820 41,404 -1.0% 6.5% 23,655 4.2% 4.0x 0.5x 0.5x 0.4x 7.4x 10.6x 10.5x
Ingredion Incorporated U.S. 89.92 96% 6,045 7,829 5,987 1.3% 15.9% 6,858 6.3% 2.0x 1.3x 1.2x 1.2x 8.2x 8.4x 8.0x
Balchem Corporation U.S. 125.41 95% 4,062 4,155 704 5.0% 23.7% 1,166 6.1% 0.6x 5.9x 5.6x 5.3x 24.9x 22.5x 21.1x
Sensient Technologies Corporation U.S. 78.00 95% 3,309 3,835 1,341 -0.5% 18.2% 1,721 6.7% 2.1x 2.9x 2.9x 2.8x 15.7x 16.6x 15.3x
Median 96% 11,173 19,820 5,871 1.3% 18.2% 12,685 5.9% 3.7x 2.9x 2.9x 2.8x 15.7x 15.2x 13.3x
Mean 94% 16,425 20,861 17,821 3.0% 16.3% 15,623 5.0% 2.9x 3.4x 2.7x 2.6x 17.8x 15.2x 14.3x
Produce
Lamb Weston Holdings, Inc. U.S. 77.48 90% 11,334 13,356 3,510 2.9% 20.7% 4,158 7.7% 3.1x 3.8x 3.7x 3.4x 18.4x 18.5x 15.2x
Fresh Del Monte Produce Inc. U.S. 28.63 81% 1,357 2,148 4,202 0.7% 6.3% 3,343 1.5% 4.1x 0.5x 0.5x 0.5x 8.1x 10.3x 9.5x
Calavo Growers, Inc. U.S. 77.64 91% 1,374 1,476 1,007 3.0% 6.3% 446 5.1% 1.8x 1.5x 1.4x 1.3x 23.2x 22.2x 17.1x
Mission Produce, Inc. U.S. 19.01 86% 1,341 1,432 838 NA 11.5% 792 6.1% 1.0x 1.7x 1.6x 1.5x 14.8x 13.5x 12.3x
Lassonde Industries Inc. CA 136.74 94% 948 1,161 1,555 6.4% 10.9% 1,084 7.1% 1.0x 0.7x 0.7x 0.7x 6.9x 7.0x 6.8x
Rogers Sugar Inc. CA 4.36 94% 451 759 688 10.0% 10.6% 702 5.0% 4.4x 1.1x 1.1x 1.1x 10.4x 9.3x 8.8x
Seneca Foods Corporation U.S. 47.09 76% 427 594 1,471 3.3% 12.7% 859 9.7% 1.0x 0.4x NA NA 3.2x NA NA
Landec Corporation U.S. 10.60 87% 311 507 560 0.7% 3.2% 510 -0.2% 14.0x 0.9x 1.0x 0.9x 28.2x 18.9x 13.4x
Median 88% 1,145 1,297 1,239 3.0% 10.7% 825 5.6% 2.5x 1.0x 1.1x 1.1x 12.6x 13.5x 12.3x
Mean 87% 2,193 2,679 1,729 3.9% 10.3% 1,487 5.2% 3.8x 1.3x 1.4x 1.3x 14.1x 14.3x 11.9x

Food and Beverage M&A Landscape | Spring 2021
17
About Our Food and Beverage Corporate Finance Practice
Duff & Phelps’ Consumer group is among the most active middle-market advisors, providing sell-side, buy-side and capital raising services for clients worldwide. With expertise in consumer, food and beverage, restaurant and retail sectors, our professionals have executed more than 100 industry transactions over the past 10 years.
Proven Execution
100+ Consumer M&A and Capital Raise transactions over the past 10 years
Deep Sector Expertise
Category focus drives thought leadership and builds invaluable relationships with buyers and investors alike
Customized Approach
Successful track record of premium value transactions driven by hands-on execution and creativity
Experienced Team
More than 30 bankers dedicated exclusively to the Consumer sector within North America
Global Platform
Nearly 5,000 professionals in 30 countries and territories with an extensive presence in North America, Europe and Asia
#5 Middle-Market M&A Advisor over the past 10 years2
400+ M&A transactions over the past five years
#1 For total number of U.S. and global Fairness Opinions over the past 10 years1
1,950+ fairness and solvency opinions for $4.8 trillion in deal value since 2005
650+ private equity groups proactively covered by our Financial Sponsors Group
1,730+ private equity groups contacted under engagement mandates in 2017
45+ private equity coverage officers across North America
Sources:1 Thomson Financial Securities Data (U.S. deals $10M < $150M, including deals without a disclosed value). Full years 2011 through 2020.2 Thomson Reuters cumulative data from 2011-2020

Food and Beverage M&A Landscape | Spring 2021
18
Sell-Side AdvisorSell-Side Advisor Buy-Side Advisor Sell-Side AdvisorSell-Side Advisor
Sell-Side AdvisorFinancial AdvisorSell-Side Advisor
has been acquired by
Sell-Side Advisor
Sell-Side AdvisorFinancial Advisor
Financial advisor to Hub Group, Inc.
Sell-Side Advisor Sell-Side Advisor
Select Duff & Phelps Food and Beverage Experience
Sell-Side Advisor
has been acquired by
Sell-Side Advisor
has secured senior debt financing from a consortium of lenders
has been acquired by has been acquired by has been acquired by
a portfolio company of
has been acquired by
has been acquired by has been acquired by
has been acquired by
portfolio companies of
has acquired has been acquired by
a division of
has been acquired by
Note: All trademarks, trade names, or logos referenced herein are the property of their respective owners.
a portfolio company of
has been acquired by
Sell-Side Advisor
has been acquired by

Food and Beverage M&A Landscape | Spring 2021
19
Sell-Side AdvisorSell-Side Advisor Sell-Side Advisor Sell-Side AdvisorSell-Side Advisor
Sell-Side AdvisorSell-Side Advisor Sell-Side Advisor
Sell-Side AdvisorSell-Side Advisor Financial AdvisorSell-Side Advisor Sell-Side Advisor
Sell-Side Advisor
Sell-Side Advisor
Note: All trademarks, trade names, or logos referenced herein are the property of their respective owners.
has been acquired by has been acquired by has been acquired by has been acquired by
has sold its Houston-area operations to
has been acquired by
has merged with
a portfolio company of
has been acquired by has been acquired by
has been acquired by has been acquired by has been acquired by has been acquired by
has been acquired by
Select Duff & Phelps Food and Beverage Experience
Sell-Side Advisor
a portfolio company of
has been acquired by

Food and Beverage M&A Landscape | Spring 2021
20
Contact Us
Bob Bartell, CFAGlobal Head of Corporate Finance Chicago +1 312-697-4654 [email protected]
Jon PrattManaging Director, Consumer, Food,Restaurant and Retail Corporate FinanceBoston+1 [email protected]
Joshua BennGlobal Head of Consumer, Food, Restaurant and Retail Corporate FinanceNew York +1 [email protected]
Farzad MukhiManaging Director, Consumer, Food, Restaurant and Retail Corporate Finance Los Angeles+1 [email protected]
Dr. Howard E. JohnsonHead of Canadian M&A and Canada Market LeaderToronto+1 [email protected]
Devin KennealyDirector, Canadian M&A Advisory Toronto+1 [email protected]
© 2021 Kroll, LLC. All rights reserved.
About Duff & Phelps, A Kroll BusinessFor nearly 100 years, Duff & Phelps has helped clients make confident decisions in the areas of valuation, real estate, taxation and transfer pricing, disputes, M&A advisory and other corporate transactions. For more information, visit www.duffandphelps.com.
About KrollKroll is the world’s premier provider of services and digital products related to governance, risk and transparency. We work with clients across diverse sectors in the areas of valuation, expert services, investigations, cyber security, corporate finance, restructuring, claims administration, data analytics and regulatory compliance. Our firm has nearly 5,000 professionals in 30 countries and territories around the world. For more information, visit www.kroll.com.
M&A advisory, capital raising and secondary market advisory services in the United States are provided by Duff & Phelps Securities, LLC. Member FINRA/SIPC. Pagemill Partners is a Division of Duff & Phelps Securities, LLC. M&A advisory, capital raising and secondary market advisory services in the United Kingdom are provided by Duff & Phelps Securities Ltd. (DPSL), which is authorized and regulated by the Financial Conduct Authority. Valuation Advisory Services in India are provided by Duff & Phelps India Private Limited under a category 1 merchant banker license issued by the Securities and Exchange Board of India.
The material in this report is for information purposes only and is not intended to be relied upon as financial, accounting, tax, legal or other professional advice. This report does not constitute, andshould not be construed as soliciting or offering any investment or other transaction, identifying securities for you to purchase or offer to purchase, or recommending the acquisition or disposition of any investment. Duff & Phelps does not guarantee the accuracy or reliability of any data provided from third party resources. Although we endeavor to provide accurate information from third party sources, there can be no guarantee that such information is accurate as of the date it is received or that it will continue to be accurate in the future.