Embed Size (px)
Citation preview

www.harriswilliams.de
Harris Williams & Co. Ltd is a private limited company incorporated under English law having its registered office at 5th Floor, 6 St. Andrew Street, London EC4A 3AE, UK, registered withthe Registrar of Companies for England and Wales under company number 7078852. Directors: Mr. Christopher Williams, Mr. Ned Valentine, Mr. Paul Poggi and Mr. Thierry Monjauze,authorised and regulated by the Financial Conduct Authority.
Harris Williams & Co. Ltd Niederlassung Frankfurt (German branch) is registered in the Commercial Register (Handelsregister) of the Local Court (Amtsgericht) of Frankfurt am Main,Germany, under registration number HRB 96687, having its business address at Bockenheimer Landstrasse 33-35, 60325 Frankfurt am Main, Germany. Permanent Representative(Ständiger Vertreter) of the Branch Niederlassung: Mr. Jeffery H. Perkins.
FOOD AND BEVERAGEINDUSTRY UPDATE │ MAY 2015
PAGE |
www.harriswilliams.de
WHAT WE’RE SEEING
CONTENTS INDUSTRY VITAL SIGNS EQUITY MARKET OVERVIEW M&A MARKET OVERVIEW DEBT MARKET OVERVIEW RECENT M&A ACTIVITY PUBLIC COMPARABLES EARNINGS CALENDAR
GROUP OVERVIEWHarris Williams & Co. is a leading advisor to the food and beverage market. Our significant experience covers a broad range of end markets, industries, and business models. This particular report focuses on trends and metrics in the following areas: Agribusiness Baked and Prepared Goods Beverages Branded and Private Label Dairy Distribution Ingredients Meat and Protein Natural and Organic Processing Produce Restaurant and Retail Snacks
CONTACTSGlenn GurtcheffManaging [email protected]+1 (612) 359-2702Tim AlexanderManaging [email protected]+1 (612) 359-2716Ryan [email protected]+1 (415) 217-3409Brant [email protected]+1 (612) 359-2709Ryan FreemanVice [email protected]+1 (612) 359-2703Matt WhebbeVice [email protected]+1 (612) 359-2727Andy WarczakVice [email protected]+1 (612) 359-2714
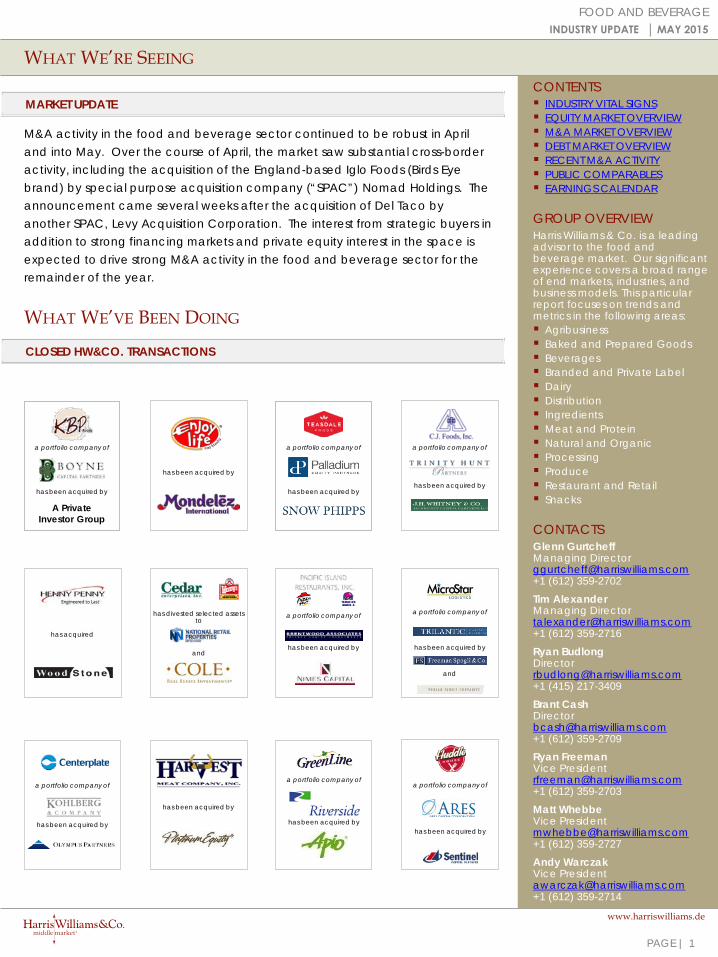
MARKET UPDATE
M&A activity in the food and beverage sector continued to be robust in April and into May. Over the course of April, the market saw substantial cross-border activity, including the acquisition of the England-based Iglo Foods (Birds Eye brand) by special purpose acquisition company (“SPAC”) Nomad Holdings. The announcement came several weeks after the acquisition of Del Taco by another SPAC, Levy Acquisition Corporation. The interest from strategic buyers in addition to strong financing markets and private equity interest in the space is expected to drive strong M&A activity in the food and beverage sector for the remainder of the year.
FOOD AND BEVERAGE INDUSTRY UPDATE │ MAY 2015
CLOSED HW&CO. TRANSACTIONS
WHAT WE’VE BEEN DOING
has divested selected assets to
and
a portfolio company of
has been acquired by
a portfolio company of
has been acquired by
and
a portfolio company of
has been acquired by
has been acquired by
a portfolio company of
has been acquired by
a portfolio company of
has been acquired by
has acquired
a portfolio company of
has been acquired byhas been acquired by
a portfolio company of
has been acquired by
has been acquired by
a portfolio company of
A Private Investor Group
1

PAGE |
WHAT WE’RE READING
FOOD AND BEVERAGEINDUSTRY UPDATE │ MAY 2015
VITAL SIGNS
COMMODITY PRICE INDICES1
PROTEIN PRICE INDICES2,3
40
90
140
Apr-11 Oct-11 Apr-12 Oct-12 Apr-13 Oct-13 Apr-14 Oct-14 Apr-15
Com
mod
ity P
rice
Inde
x
Corn Soybeans Wheat Crude Oil
90
100
110
120
130
140
150
Apr-11 Oct-11 Apr-12 Oct-12 Apr-13 Oct-13 Apr-14 Oct-14 Apr-15
Prot
ein
Pric
e In
dex
Beef Pork Poultry
Beef:33.4%
Poultry:7.7%
Pork:6.9%
Soybeans:(28.4%)
Wheat:(29.5%)
Corn:(40.8%)
Crude Oil:(47.2%)
The North American gluten-free market is expected to grow at a CAGR of 12.0% from 2014 to 2019, reaching $4.4billion in sales by 2019. The diagnosis of Celiac disease has steadily increased, with a reported one in 100 peoplehaving the disease. Gluten-free products are most prevalent in developed countries, with the U.S. and Germanyserving as the first and second largest markets, respectively.
Access to the full article here.
NORTH AMERICA GLUTEN-FREE FOOD MARKET IS EXPECTED TO REACH $4.4 BILLION BY 2019
Collective sales at fast casual restaurants within Technomic’s top 500 restaurant chains grew 12.8% to reach $30 billionin 2014, exceeding the 11.7% CAGR achieved over the last five years. Growth is expected to continue as the fastcasual concepts extend into other on-trend categories, like pizza, sushi, and barbeque.
Access to the full article here.
FAST CASUAL FUELS TECHNOMIC TOP 500 GROWTH ONCE AGAIN
Successful cost-cutting initiatives at Heinz and plans for the new Kraft Heinz combination are putting pressure on majorfood companies to optimize their cost structures and enhance their margins. These initiatives are particularly importantgiven the industry’s relatively slow growth. Throughout earnings season, cost reduction has been a frequent topic ofconversation throughout the Q&A portion of earnings calls.
Access to the full article here.
FOOD COMPANIES FACE QUESTIONS ON COST-CUTTING
2

PAGE |
80
100
120
140
Apr-11 Oct-11 Apr-12 Oct-12 Apr-13 Oct-13 Apr-14 Oct-14 Apr-15
Sale
s Ind
ex
Restaurant Grocery
VITAL SIGNS
FOOD AND BEVERAGEINDUSTRY UPDATE │ MAY 2015
RESTAURANT AND GROCERY STORE SALES INDICES4
CONSUMER FOOD PRICE INDEX INFLATION2
PUBLIC EQUITY MARKET OVERVIEW
KEY TRADING STATISTICS5
Restaurant:24.8%
Grocery:6.0%
-0.5
1.0
2.5
4.0
5.5
Mar-11 Sep-11 Mar-12 Sep-12 Mar-13 Sep-13 Mar-14 Sep-14 Mar-15
Infla
tion
(%)
Net Debt /
Industry and Segment 3 Month 1 Year 3 Month 1 Year Fwd PE LTM PE EV/EBITDA EBITDA
Protein Processing 9.5% 42.5% (3.7%) (13.7%) 12.7x 16.1x 7.4x 2.7xFruit and Vegetable 9.9% 16.3% 2.3% 7.4% 19.1x 34.1x 14.2x 1.2xIngredients / Flavors 3.6% 16.3% 1.9% 8.1% 21.1x 23.6x 14.7x 1.8xAgribusiness (1.8%) 2.0% 5.4% (6.7%) 14.0x 16.8x 8.8x 1.4xBranded Processed Foods 2.6% 3.6% 4.9% 10.1% 21.4x 25.0x 14.8x 2.8xPrivate Label Foods (7.6%) (0.5%) (9.2%) 36.2% 20.6x 42.1x 15.8x 6.4xNatural / Organic Foods (4.5%) 11.7% 6.7% 2.8% 31.5x 57.3x 18.9x 3.2xBaked Goods / Snack Foods 3.5% 0.4% (0.1%) 8.3% 24.2x 28.1x 13.0x 2.7xDairy (0.7%) 2.8% (8.2%) 17.5% 20.9x 24.6x 11.5x 2.2xNon-Alcoholic Beverages (0.2%) 18.9% 0.1% 15.6% 21.6x 25.0x 13.4x 1.8xAlcoholic Beverages 3.4% 3.7% 2.2% 21.6% 21.5x 27.6x 14.6x 3.1xFood Retail 0.2% 4.9% (1.8%) 15.7% 20.2x 23.5x 8.0x 1.7xGrocery Distribution (10.2%) 26.9% (15.1%) 9.5% 18.8x 20.6x 8.1x 2.5xFoodserv ice (12.1%) (0.9%) (8.4%) 1.5% 23.5x 29.8x 10.1x 3.6xQuick Serv ice Restaurant 3.7% 43.1% 3.6% 20.2% 30.1x 36.9x 14.8x 2.0xFast Casual 1.5% 20.6% (3.8%) 4.1% 38.3x 39.2x 18.4x 0.8xDifferentiated Casual (6.0%) 10.5% (11.2%) (3.9%) 28.1x 33.6x 11.7x 0.2xCasual Dining Restaurant (5.3%) 15.4% (8.7%) 2.8% 22.2x 31.0x 9.7x 2.1xFine Dining 2.7% (0.9%) (9.1%) (13.4%) 18.9x 22.9x 10.1x NMPizza 10.0% 56.3% (0.3%) 22.4% 30.7x 37.1x 17.2x 3.7xBeverage / Snack Retail 1.2% 27.5% 10.0% 12.4% 28.9x 30.2x 18.9x 2.9xFamily Restaurant 1.1% 18.6% (9.6%) 25.5% 25.6x 24.6x 12.7x 2.6x
Overall Median 1.3% 10.2% (0.7%) 10.1% 22.1x 27.5x 12.9x 2.3x
Con
sum
er a
nd R
etai
l
Stock Price % Change EV/EBITDA % Change Current Valuation Stats
Food
and
Bev
erag
eIn
puts
3

PAGE |
Close Date Filing Date Issuer Ticker Transaction TypeGross Proceeds
($mm) Use of Funds05/05/15 09/08/14 Pinnacle Foods Inc PF Follow-On $204.8 Secondary
04/29/15 05/20/13 B&G Foods Inc BGS Follow-On $128.5 General Corp. Purp.
04/13/15 04/13/15 Diamond Estate Wines DWS Follow-On $1.9 General Corp. Purp.
04/02/15 04/02/15 Scor International Foods Inc - IPO $5.0 Working CapitalOper Fund / Cash Res
03/25/15 03/25/15 Premium Brands Holding Corp PBH Convertible $48.0 Reduce IndebtednessFuture Acquisitions
03/16/15 03/16/15 Wayne Farms Inc - IPO $100.0 Reduce IndebtednessWorking Capital
03/09/15 09/08/14 Pinnacle Foods Inc PF Follow-On $532.1 Secondary Pay Fees & Expenses
02/25/15 11/27/14 Naturally Splendid Entrp Ltd NSP Follow-On $1.5 Working CapitalProperty Development
02/10/15 12/04/14 Captiva Verde Industries Ltd VEG.H Follow-On $0.1 General Corp. Purp.
01/28/15 03/10/14 Post Holdings Inc POST Follow-On $355.1 Acquisition Fin.
01/28/15 01/28/15 Atlantica Seafoods Co Inc N/A IPO $3.8 Prod Dev / R&D, General Corp. Purp., Working Capital
01/23/15 01/16/15 Avidus Management Group Inc AVD Follow-On $0.5 General Corp. Purp. & Working Capital
01/22/15 01/22/15 Feronia Inc FRN Convertible $7.2 Working Capital
PUBLIC EQUITY MARKET OVERVIEW
FOOD AND BEVERAGEINDUSTRY UPDATE │ MAY 2015
PUBLIC COMPANY SECTOR PERFORMANCE5 (ONE YEAR CHANGE IN STOCK PRICE)
RECENT EQUITY OFFERINGS6
Fine DiningFoodserv ice
Priv ate Label FoodsBaked Goods / Snack Foods
AgribusinessDairy
Branded Processed FoodsAlcoholic Bev erages
Food RetailDifferentiated Casual
Natural / Organic FoodsS&P
Casual Dining RestaurantIngredients / Flav orsFruit and Vegetable
Family RestaurantNon-Alcoholic Bev erages
Fast CasualGrocery DistributionBev erage / Snack Retail
Protein ProcessingQuick Serv ice Restaurant
Pizza
-17.5% -5.0% 7.5% 20.0% 32.5% 45.0% 57.5%Inputs Food and Beverage Consumer and Retail
4

PAGE |
Price at As a % of Market Cash & Enterprise P/E($ in millions, except per share data) Ticker 5/11/15 52-wk High Cap Debt Equiv. Value (EV) Revenue EBITDA 1 Year 3 Years Gross EBITDA Multiple Revenue EBITDA Revenue EBITDA
Food and BeverageBranded Processed FoodsAssociated British Foods plc ABF $44.85 87.4% $35,286 $1,675 $437 $36,524 $20,062 $2,399 (9.2%) 2.9% 24.0% 12.0% 40.3x 1.82x 15.2x 1.72x 14.9xB&G Foods Inc. BGS 29.76 85.9% $1,725 $1,032 $24 $2,733 $867 $183 15.3% 15.0% 29.4% 21.1% 37.7x 3.15x 14.9x 3.12x 13.6xCampbell Soup Company CPB 45.80 94.8% 14,280 3,931 201 18,010 8,311 1,488 2.2% 2.6% 33.9% 17.9% 19.0x 2.17x 12.1x 2.20x 11.7xConAgra Foods, Inc. CAG 37.37 97.3% 15,959 8,370 137 24,192 17,546 2,311 6.7% 10.1% 19.8% 13.2% NM 1.38x 10.5x 1.52x 11.3xGeneral Mills, Inc. GIS 56.07 97.1% 33,423 10,291 784 42,930 17,615 3,153 (2.3%) 2.8% 33.8% 17.9% 24.2x 2.44x 13.6x 2.39x 12.0xHormel Foods Corporation HRL 55.80 94.6% 14,711 250 527 14,434 9,469 1,092 6.7% 5.7% 17.1% 11.5% 24.3x 1.52x 13.2x 1.46x 12.2xKellogg Company K 63.78 91.3% 22,514 7,730 349 29,895 14,394 1,663 (1.9%) 3.1% 34.6% 11.6% 50.5x 2.08x 18.0x 2.17x 11.9xKraft Foods Group, Inc. KRFT 86.20 94.4% 51,025 10,032 1,178 59,879 18,195 2,266 0.7% (0.9%) 25.9% 12.5% 53.7x 3.29x 26.4x 3.29x 16.0xMcCormick & Company, Incorporated MKC 76.91 97.7% 9,854 1,323 87 11,090 4,260 688 1.9% 3.7% 40.6% 16.1% 23.5x 2.60x 16.1x 2.57x 15.1xMondelez International, Inc. MDLZ 39.33 99.4% 63,975 18,811 1,902 80,884 33,365 5,087 (5.2%) 1.5% 37.0% 15.2% 28.4x 2.42x 15.9x 2.62x 14.9xNestlé S.A. NESN 77.85 94.4% 246,723 21,838 9,027 259,534 92,479 17,547 (10.8%) 1.1% 48.2% 19.0% 16.1x 2.81x 14.8x 2.64x 14.0xPost Holdings, Inc. POST 51.29 98.2% 2,813 3,965 579 6,199 3,803 473 NM 58.5% 24.5% 12.4% NM 1.63x 13.1x 1.24x 9.3xThe Hain Celestial Group, Inc. HAIN 60.25 90.8% 6,128 879 100 6,907 2,574 299 26.6% 25.6% 23.6% 11.6% 46.9x 2.68x 23.1x 2.38x 16.8xThe Hershey Company HSY 93.93 84.4% 20,575 2,460 405 22,630 7,488 1,666 4.1% 6.2% 45.0% 22.3% 25.0x 3.02x 13.6x 2.87x 12.5xThe J. M. Smucker Company SJM 116.27 97.8% 13,879 2,180 112 15,947 5,480 1,168 (4.1%) 0.8% 36.2% 21.3% 21.4x 2.91x 13.7x 2.13x 10.2x
Mean 2.2% 9.2% 31.6% 15.7% 31.6x 2.40x 15.6x 2.29x 13.1xMedian 1.3% 3.1% 33.8% 15.2% 25.0x 2.44x 14.8x 2.38x 12.5x
Private Label FoodsSeneca Foods Corp. SENE.A 28.73 88.0% 320 303 23 600 1,302 31 (1.5%) 1.6% 6.0% 2.4% 51.7x 0.46x 19.5x NA NATreehouse Foods, Inc. THS 72.72 78.3% 3,118 1,399 63 4,454 3,110 368 31.1% 14.3% 20.6% 11.8% 32.5x 1.43x 12.1x 1.29x 10.5x
Mean 14.8% 8.0% 13.3% 7.1% 42.1x 0.95x 15.8x 1.29x 10.5xMedian 14.8% 8.0% 13.3% 7.1% 42.1x 0.95x 15.8x 1.29x 10.5x
Natural / Organic FoodsBoulder Brands, Inc. BDBD 9.59 62.0% 588 299 21 866 523 59 9.5% 21.2% 37.2% 11.3% NM 1.66x 14.7x 1.54x 10.4xSunOpta Inc. TSX:SOY 10.11 75.4% 685 132 10 806 1,243 66 9.0% 6.8% 11.5% 5.3% NM 0.65x 12.2x 0.62x 10.4xThe Hain Celestial Group, Inc. HAIN 60.25 90.8% 6,128 879 100 6,907 2,574 299 26.6% 25.6% 23.6% 11.6% 46.9x 2.68x 23.1x 2.38x 16.8xThe WhiteWave Foods Company WWAV 45.83 96.4% 8,026 1,559 31 9,553 3,518 401 27.3% 18.9% 33.8% 11.4% 57.3x 2.72x 23.9x 2.46x 18.9x
Mean 18.1% 18.1% 26.5% 9.9% 52.1x 1.9x 18.5x 1.7x 14.1xMedian 18.0% 20.1% 28.7% 11.3% 52.1x 2.2x 18.9x 2.0x 13.6x
Baked Goods / Snack FoodsARYZTA AG SWX:ARYN $66.17 69.7% $5,835 $3,279 $985 $8,128 $5,753 $839 (6.1%) 4.1% 27.9% 14.6% 43.4x 1.41x 9.7x 1.63x 10.3xDiamond Foods, Inc. DMND 27.60 81.9% 868 649 49 1,468 886 89 5.5% (4.2%) 24.3% 10.1% NM 1.66x 16.5x 1.60x 12.2xFlowers Foods, Inc. FLO 22.86 96.8% 4,802 779 8 5,573 3,749 428 0.4% 10.6% 48.0% 11.4% 27.9x 1.49x 13.0x 1.47x 12.2xGeorge Weston Limited WN 83.57 94.5% 10,689 12,080 2,077 20,692 37,923 2,192 20.0% 6.0% 25.5% 5.8% NM 0.55x 9.4x 0.54x 6.4xGolden Enterprises Inc. GLDC 4.05 83.4% 46 10 1 55 133 7 (2.8%) (0.5%) 49.3% 5.2% 26.3x 0.41x 8.0x NA NAGrupo Bimbo, S.A.B. de C.V. BIMBO A 2.72 92.9% 12,809 4,390 148 17,051 12,819 1,475 (5.0%) 4.2% 53.0% 11.5% 48.8x 1.33x 11.6x 1.22x 11.0xInventure Foods, Inc. SNAK 9.48 67.2% 185 85 1 269 296 8 26.1% 19.7% 12.8% 2.8% NM 0.91x 32.7x 0.91x 11.8xJ&J Snack Foods Corp. JJSF 107.39 92.9% 2,007 2 89 1,920 948 146 7.3% 6.4% 31.1% 15.4% 28.1x 2.02x 13.2x 1.96x 12.3xJohn B Sanfilippo & Son Inc. JBSS 50.02 92.1% 557 117 2 672 868 63 15.2% 7.4% 15.1% 7.2% 20.4x 0.77x 10.7x 0.75x NALancaster Colony Corporation LANC 89.28 91.3% 2,442 0 161 2,281 1,086 168 5.7% (0.8%) 23.1% 15.5% 25.2x 2.10x 13.5x 2.01x NASnyder's-Lance, Inc. LNCE 29.64 90.0% 2,089 445 12 2,522 1,650 171 (7.1%) 0.2% 35.5% 10.4% 35.3x 1.53x 14.7x 1.46x 12.4x
Mean 5.4% 4.8% 31.4% 10.0% 31.9x 1.3x 13.9x 1.4x 11.1xMedian 5.5% 4.2% 27.9% 10.4% 28.0x 1.4x 13.0x 1.5x 12.0x
Last Twelve Months (LTM) EV / LTM EV / 2015ERevenue Growth LTM Margins
PUBLIC COMPARABLES5
FOOD AND BEVERAGEINDUSTRY UPDATE │ MAY 2015
5

PAGE |
Price at As a % of Market Cash & Enterprise P/E($ in millions, except per share data) Ticker 5/11/15 52-wk High Cap Debt Equiv. Value (EV) Revenue EBITDA 1 Year 3 Years Gross EBITDA Multiple Revenue EBITDA Revenue EBITDA
DairyBongrain SA ENXTPA:BH $67.04 92.5% $940 $1,168 $589 $1,519 $5,576 $254 (8.1%) 2.5% 31.7% 4.6% 22.1x 0.27x 6.0x 0.29x 4.8xDanone BN 70.16 92.9% $42,228 $13,487 $3,870 $51,845 $25,593 $4,015 (12.7%) 0.7% 47.7% 15.7% 33.5x 2.03x 12.9x 2.04x 12.3xDean Foods Company DF 17.33 87.8% 1,635 853 30 2,458 9,213 244 1.6% (5.6%) 18.8% 2.6% NM 0.27x 10.1x 0.30x 7.2xEmmi AG SWX:EMMN 334.87 80.1% 1,791 625 318 2,098 3,427 288 (7.5%) 5.6% 33.2% 8.4% 21.2x 0.61x 7.3x 0.60x 7.2xGlanbia plc GL9 19.09 95.1% 5,646 746 133 6,259 3,053 279 (5.8%) (4.1%) 30.2% 9.1% 34.7x 2.05x 22.4x 1.93x 18.5xLifeway Foods Inc. LWAY 19.53 87.3% 319 9 6 322 119 8 22.0% 19.4% 26.4% 6.5% NM 2.71x NM 2.39x 21.1xParmalat SpA BIT:PLT 2.72 95.2% 4,979 161 1,503 3,636 6,738 524 (8.9%) 4.8% 19.4% 7.8% 22.2x 0.54x 6.9x 0.52x 6.5xSaputo Inc. TSX:SAP 29.27 94.2% 11,488 1,719 41 13,167 9,179 956 10.8% 11.6% 10.4% 10.4% 24.6x 1.43x 13.8x 1.47x 13.2x
Mean (1.1%) 4.4% 27.2% 8.1% 26.4x 1.24x 11.3x 1.19x 11.4xMedian (6.7%) 3.7% 28.3% 8.1% 23.4x 1.02x 10.1x 1.03x 9.8x
Non-Alcoholic BeveragesA.G.Barr p.l.c. LSE:BAG $9.81 90.0% $1,132 $23 $38 $1,117 $392 $73 (6.5%) 3.9% 47.3% 18.6% 24.3x 2.85x 15.3x 2.61x 13.5xCott Corporation BCB 9.50 91.8% 886 1,778 35 2,629 2,338 209 13.3% 0.2% 18.0% 9.0% NM 1.12x 12.6x 0.86x 7.5xDr Pepper Snapple Group, Inc. DPS 76.37 93.8% 14,642 2,632 101 17,173 6,174 1,402 2.6% 1.3% 58.9% 22.7% 21.3x 2.78x 12.2x 2.75x 11.5xKeurig Green Mountain, Inc. GMCR 100.87 63.5% 15,531 536 98 15,969 4,731 1,184 5.1% 10.9% 38.4% 25.0% 28.1x 3.38x 13.5x 3.14x 13.1xLassonde Industries Inc. LAS.A 113.65 95.2% 794 317 0 1,111 1,005 105 6.7% 5.2% 26.4% 10.4% 20.9x 1.11x 10.6x NA NAMonster Beverage Corporation MNST 134.01 92.6% 22,802 0 1,010 21,792 2,556 835 11.2% 12.4% 55.6% 32.7% NM 8.53x 26.1x 7.29x 21.5xNational Beverage Corp. FIZZ 21.94 80.3% 1,017 15 40 992 646 84 0.1% 1.6% 33.9% 12.9% 21.1x 1.54x 11.9x 1.49x NAPepsico, Inc. PEP 96.35 95.6% 142,218 30,365 8,495 164,088 66,277 12,308 (0.3%) (0.4%) 53.9% 18.6% 22.4x 2.48x 13.3x 2.57x 13.0xStarbucks Corporation SBUX 49.50 95.0% 74,230 2,092 1,850 74,472 17,701 3,891 13.2% 12.0% 30.8% 22.0% 29.2x 4.21x 19.1x 3.68x 15.6xThe Coca-Cola Company KO 40.94 91.0% 178,445 42,681 20,057 201,069 46,133 12,868 (0.6%) (0.7%) 61.2% 27.9% 25.7x 4.36x 15.6x 4.46x 16.0x
Mean 4.5% 4.6% 42.4% 20.0% 24.1x 3.23x 15.0x 3.20x 14.0xMedian 3.8% 2.7% 42.8% 20.3% 23.4x 2.82x 13.4x 2.75x 13.3x
Alcoholic BeveragesAnheuser-Busch InBev SA/NV ENXTBR:ABI $122.07 92.1% $195,739 $51,122 $8,658 $238,203 $46,911 $18,111 5.1% 6.0% 60.2% 38.6% 18.6x 5.08x 13.2x 5.06x 12.6xBrown-Forman Corporation BF.B 92.92 94.8% 19,751 1,006 250 20,507 3,084 1,024 4.1% 4.1% 69.7% 33.2% 29.5x 6.65x 20.0x 4.89x 18.7xCarlsberg A/S CPSE:CARL B 95.34 100.0% 14,755 6,587 393 20,948 10,484 2,065 (11.7%) (1.9%) 49.3% 19.7% 22.2x 2.00x 10.1x 2.14x 10.6xConstellation Brands Inc. STZ 117.22 96.1% 22,624 7,353 113 29,863 6,028 1,787 23.8% 31.4% 43.8% 29.7% 28.1x 4.95x 16.7x 4.70x 14.9xDiageo plc DGE 27.80 86.8% 69,631 17,709 1,250 86,090 15,937 4,967 (14.6%) (0.0%) 58.5% 31.2% 23.0x 5.40x 17.3x 5.01x 15.0xHeineken NV ENXTAM:HEIA 79.52 93.6% 45,722 13,121 824 58,019 21,477 4,609 (18.8%) 4.0% 38.9% 21.5% 27.1x 2.70x 12.6x 2.55x 11.0xKirin Holdings Company, Limited TSE:2503 14.04 98.3% 12,815 7,170 465 19,520 18,189 2,161 (17.2%) 7.5% 43.1% 11.9% 44.5x 1.07x 9.0x 1.06x 8.8xPernod-Ricard SA RI 123.18 93.8% 32,519 11,719 703 43,535 9,679 2,716 (14.7%) (2.7%) 62.1% 28.1% 30.2x 4.50x 16.0x 4.40x 14.9xSABMiller plc LSE:SAB 56.03 93.2% 90,188 16,581 3,015 103,754 16,967 5,839 (0.9%) 2.1% 70.8% 34.4% 26.0x 6.12x 17.8x 6.24x 16.1xSapporo Holdings Ltd. TSE:2501 3.87 84.1% 1,507 2,077 77 3,506 4,293 335 (15.2%) 2.5% 0.0% 7.8% 35.9x 0.82x 10.5x 0.78x 9.9x
Mean (6.0%) 5.3% 49.7% 25.6% 28.5x 3.93x 14.3x 3.68x 13.3xMedian (13.2%) 3.2% 53.9% 28.9% 27.6x 4.73x 14.6x 4.55x 13.7x
InputsProtein ProcessingCal-Maine Foods, Inc. CALM $49.45 100.0% $2,397 $53 $238 $2,212 $1,545 $261 10.7% 12.7% 24.4% 16.9% 16.3x 1.43x 8.5x 1.23x 8.2xJBS S.A. BOVESPA:JBSS3 5.44 99.3% 15,983 15,079 5,610 25,452 45,323 3,888 15.2% 11.0% 15.5% 8.6% 23.4x 0.56x 6.5x 0.48x 6.0xSanderson Farms, Inc. SAFM 84.01 80.9% 1,947 20 173 1,794 2,857 505 6.9% 11.4% 20.7% 17.7% 6.8x 0.63x 3.6x 0.61x 3.9xSeaboard Corp. SEB 3,488.80 75.2% 4,085 123 646 3,563 6,446 479 (1.9%) 3.9% 10.0% 7.4% 11.7x 0.55x 7.4x NA NATyson Foods, Inc. TSN 41.37 94.0% 16,786 7,674 225 24,235 40,583 2,501 14.6% 7.0% 8.3% 6.2% 16.1x 0.60x 9.7x 0.58x 7.4x
Mean 9.1% 9.2% 15.8% 11.3% 14.9x 0.75x 7.1x 0.73x 6.4xMedian 10.7% 11.0% 15.5% 8.6% 16.1x 0.60x 7.4x 0.60x 6.7x
Last Twelve Months (LTM) EV / LTMRevenue Growth LTM Margins EV / 2015E
PUBLIC COMPARABLES5
FOOD AND BEVERAGEINDUSTRY UPDATE │ MAY 2015
6

PAGE |
Price at As a % of Market Cash & Enterprise P/E($ in millions, except per share data) Ticker 5/11/15 52-wk High Cap Debt Equiv. Value (EV) Revenue EBITDA 1 Year 3 Years Gross EBITDA Multiple Revenue EBITDA Revenue EBITDA
Fruit and VegetableCalavo Growers Inc. CVGW $50.51 94.3% $875 $60 $5 $930 $809 $47 12.4% 13.8% 9.5% 5.8% NM 1.15x 19.7x 0.98x 16.0xFresh Del Monte Produce Inc. FDP 37.58 91.3% 1,970 342 29 2,283 3,954 258 5.5% 4.0% 9.1% 6.5% 16.5x 0.58x 8.9x NA NASeneca Foods Corp. SENE.A 28.73 88.0% 320 303 23 600 1,302 31 (1.5%) 1.6% 6.0% 2.4% NM 0.46x 19.5x NA NATotal Produce plc ISE:T7O 1.24 95.5% 412 161 140 432 3,228 75 (11.1%) 2.8% 13.7% 2.3% 12.7x 0.13x 5.7x 0.14x 5.9x
Mean 1.3% 5.6% 9.6% 4.3% 14.6x 0.58x 13.4x 0.56x 10.9xMedian 2.0% 3.4% 9.3% 4.1% 14.6x 0.52x 14.2x 0.56x 10.9x
Ingredients / FlavorsGivaudan SA SWX:GIVN $1,865.62 89.4% $17,137 $1,215 $479 $17,873 $4,433 $909 (9.6%) 1.9% 46.0% 20.5% 28.8x 4.03x 19.7x 3.85x 16.3xIngredion Incorporated INGR $81.21 93.1% $5,788 $2,230 $609 $7,409 $5,641 $828 (7.5%) (3.8%) 20.4% 14.7% 16.5x 1.31x 9.0x 1.24x 8.3xInternational Flavors & Fragrances Inc. IFF 119.30 96.9% 9,633 942 479 10,096 3,089 688 4.6% 3.5% 44.4% 22.3% 23.6x 3.27x 14.7x 3.27x 13.9xKerry Group plc ISE:KRZ 70.99 91.9% 12,485 1,917 352 14,049 6,968 876 (13.3%) 0.4% 44.5% 12.6% 23.3x 2.02x 16.0x 2.11x 15.6xSensient Technologies Corporation SXT 65.68 93.7% 3,069 504 18 3,555 1,427 270 (2.5%) (0.5%) 33.9% 19.0% 28.8x 2.49x 13.1x 2.54x 12.6xSymrise AG XTRA:SY1 64.46 93.8% 8,368 1,479 221 9,626 2,491 527 (1.9%) 5.3% 42.6% 21.2% 36.9x 3.86x 18.3x 3.28x 14.8xTate & Lyle plc TATE 9.39 81.0% 4,359 1,291 527 5,123 4,592 608 (5.5%) 0.5% 26.2% 13.2% 15.4x 1.12x 8.4x 1.24x 9.4x
Mean (5.1%) 1.0% 36.8% 17.6% 24.8x 2.59x 14.2x 2.51x 13.0xMedian (5.5%) 0.5% 42.6% 19.0% 23.6x 2.49x 14.7x 2.54x 13.9x
AgribusinessArcher-Daniels-Midland Company ADM $51.60 95.7% $32,011 $6,441 $1,296 $37,156 $78,011 $4,074 (12.1%) (4.4%) 6.7% 5.2% 13.5x 0.48x 9.1x 0.46x 9.2xBunge Limited BG 89.95 96.5% 12,917 4,220 870 16,267 54,506 1,997 (9.2%) (1.4%) 5.6% 3.7% 19.1x 0.30x 8.1x 0.31x 7.4xCF Industries Holdings, Inc. CF 308.39 98.1% 14,516 4,593 1,779 17,329 4,564 1,967 (13.4%) (10.9%) 38.4% 43.1% 16.8x 3.80x 8.8x 3.90x 7.5xDarling Ingredients Inc. DAR 14.28 66.7% 2,359 2,152 109 4,403 3,956 508 119.5% 30.1% 22.3% 12.9% 36.6x 1.11x 8.7x 1.18x 8.8xMonsanto Company MON 118.00 91.6% 56,180 8,311 2,716 61,775 14,947 4,298 (3.1%) 4.6% 53.8% 28.8% 25.4x 4.13x 14.4x 3.84x 12.0xThe Andersons, Inc. ANDE 42.39 60.6% 1,210 654 54 1,809 4,487 146 (15.9%) (1.6%) 9.0% 3.2% 13.4x 0.40x 12.4x 0.41x 8.9xThe Mosaic Company MOS 45.00 83.6% 16,431 3,827 2,517 17,740 9,209 2,319 17.4% (6.2%) 21.5% 25.2% 15.3x 1.93x 7.6x 1.78x 7.1x
Mean 11.9% 1.5% 22.5% 17.4% 20.0x 1.74x 9.9x 1.70x 8.7xMedian (9.2%) (1.6%) 21.5% 12.9% 16.8x 1.11x 8.8x 1.18x 8.8x
Consumer and RetailFood RetailCostco Wholesale Corporation COST $144.27 92.0% 63,475 5,030 7,453 61,052 115,637 4,547 7.2% 7.4% 12.8% 3.9% 28.2x 0.53x 13.4x 0.50x 12.6xEstablishments Delhaize Freres DELB 92.46 92.5% 9,489 2,862 1,529 10,822 23,802 1,341 (15.8%) (5.4%) 24.1% 5.6% NM 0.45x 8.1x 0.40x 6.3xFairway Group Holdings Corp. FWM 4.48 57.4% 195 258 40 413 799 (4) 5.9% 25.8% 31.4% NM NM 0.52x NM 0.51x 10.8xIngles Markets, Incorporated IMKT.A 49.68 91.0% 1,007 929 9 1,926 3,823 240 1.2% 1.9% 23.0% 6.3% 17.5x 0.50x 8.0x 0.50x NAJ. Sainsbury plc LSE:SBRY 4.39 80.7% 8,418 4,246 1,895 10,769 35,064 1,854 (11.9%) (0.2%) 6.4% 5.3% NM 0.31x 5.8x 0.29x 5.7xKoninklijke Ahold N.V. ENXTAM:AH 20.28 91.4% 16,588 3,892 2,277 18,204 39,903 2,528 (11.2%) 0.5% 26.5% 6.3% 20.7x 0.46x 7.2x 0.44x 6.9xNatural Grocers by Vitamin Cottage NGVC 24.13 68.9% 543 25 7 561 573 47 19.6% 24.5% 29.0% 8.2% 35.0x 0.98x 12.0x 0.81x 10.9xRoundy's, Inc. RNDY 4.86 79.5% 239 643 59 824 3,855 117 15.0% 0.1% 26.3% 3.0% NM 0.21x 7.0x 0.20x 6.9xSprouts Farmers Market, Inc. SFM 27.82 72.4% 4,266 380 178 4,467 3,102 265 19.9% 81.7% 29.6% 8.5% 38.6x 1.44x 16.9x 1.19x 13.7xSUPERVALU Inc. SVU 9.02 75.2% 2,361 2,728 114 4,975 17,820 777 3.9% 0.8% 14.9% 4.4% 20.0x 0.28x 6.4x 0.27x 6.2xTesco PLC LSE:TSCO 3.62 72.5% 29,210 19,558 3,309 45,459 96,229 2,708 (9.1%) (1.7%) 3.5% 2.8% NM 0.47x 16.8x 0.47x 10.2xThe Kroger Co. KR 71.84 92.4% 35,281 11,656 268 46,669 108,465 5,163 10.3% 6.3% 21.8% 4.8% 20.9x 0.43x 9.0x 0.42x 8.5xThe Pantry, Inc. PTRY 0.00 #DIV/0! 0 930 123 807 6,635 261 (4.0%) (3.7%) 13.0% 3.9% NA 0.12x 3.1x 0.11x 3.2xVillage Super Market Inc. VLGE.A 32.73 94.7% 460 46 95 411 1,560 62 5.0% 4.5% 27.1% 4.0% 23.5x 0.26x 6.6x 0.26x NAWeis Markets, Inc. WMK 43.73 84.2% 1,176 0 98 1,079 2,802 148 3.9% 0.6% 27.2% 5.3% 22.0x 0.38x 7.3x NA NAWhole Foods Market, Inc. WFM 42.73 74.2% 15,414 63 776 14,701 14,952 1,392 10.0% 11.4% 35.5% 9.3% 25.8x 0.98x 10.6x 0.89x 9.7x
Mean 3.1% 9.6% 22.0% 5.4% 25.2x 0.52x 9.2x 0.49x 8.6xMedian 4.5% 1.3% 25.2% 5.3% 22.7x 0.46x 8.0x 0.44x 8.5x
LTM Margins EV / 2015ELast Twelve Months (LTM) Revenue Growth EV / LTM
PUBLIC COMPARABLES5
FOOD AND BEVERAGEINDUSTRY UPDATE │ MAY 2015
7

PAGE |
Price at As a % of Market Cash & Enterprise P/E($ in millions, except per share data) Ticker 5/11/15 52-wk High Cap Debt Equiv. Value (EV) Revenue EBITDA 1 Year 3 Years Gross EBITDA Multiple Revenue EBITDA Revenue EBITDA
Grocery DistributionAMCON Distributing Co. DIT $78.50 88.9% $48 $36 $0 $84 $872 $12 5.4% 4.1% 8.8% 1.4% 10.6x 0.10x 6.8x NA NACore-Mark Holding Company, Inc. CORE 53.87 75.3% 1,244 39 17 1,266 8,310 109 5.9% 8.6% 7.1% 1.3% 27.4x 0.15x 11.7x 0.11x 9.7xSpartanNash Company SPTN 32.41 99.0% 1,226 570 6 1,790 7,916 222 128.6% 45.1% 14.6% 2.8% 20.6x 0.23x 8.1x 0.23x 7.4xSUPERVALU Inc. SVU 9.02 75.2% 2,361 2,728 114 4,975 17,820 777 3.9% 0.8% 14.9% 4.4% 20.0x 0.28x 6.4x 0.27x 6.2xUnited Natural Foods, Inc. UNFI 66.93 79.8% 3,352 555 27 3,879 7,555 280 17.0% 15.8% 16.0% 3.7% 25.7x 0.51x 13.9x 0.45x 11.4x
Mean 32.2% 14.9% 12.3% 2.7% 20.9x 0.25x 9.4x 0.27x 8.7xMedian 5.9% 8.6% 14.6% 2.8% 20.6x 0.23x 8.1x 0.25x 8.6x
FoodserviceColabor Group Inc. TSX:GCL $0.98 27.5% $26 $151 $0 $178 $1,159 $23 (8.9%) (5.5%) 2.1% 2.0% NM 0.15x 7.6x 0.14x 6.9xSysco Corporation SYY 36.49 88.0% 21,666 7,669 5,085 24,251 48,566 2,395 6.0% 5.2% 17.5% 4.9% 25.0x 0.50x 10.1x 0.48x 9.9xThe Chefs' Warehouse, Inc. CHEF 19.68 81.7% 517 144 2 659 848 40 17.6% 26.9% 24.8% 4.7% 34.5x 0.78x 16.6x 0.62x 9.6x
Mean 4.9% 8.8% 14.8% 3.9% 29.8x 0.48x 11.4x 0.41x 8.8xMedian 6.0% 5.2% 17.5% 4.7% 29.8x 0.50x 10.1x 0.48x 9.6x
Quick Service RestaurantJack in the Box Inc. JACK 92.15 92.2% 3,508 559 9 4,058 1,503 274 1.1% 1.1% 26.4% 18.2% 38.0x 2.70x 14.8x 2.60x 13.8xMcDonald's Corp. MCD 97.51 94.0% 93,465 14,292 1,635 106,122 26,700 9,311 (5.3%) (0.9%) 38.0% 34.9% 21.9x 3.97x 11.4x 4.28x 11.8xPopeyes Louisiana Kitchen, Inc. PLKI 57.23 86.1% 1,337 110 8 1,438 236 75 14.4% 15.3% 65.2% 31.7% 35.8x 6.11x 19.3x 5.34x 16.9xRestaurant Brands International Inc. QSR 40.83 89.3% 19,236 9,281 1,022 27,495 1,888 605 78.2% (7.1%) 55.8% 32.1% NM 14.56x 45.4x 6.58x 16.6xSonic Corp. SONC 30.47 83.0% 1,584 507 27 2,064 582 153 7.4% 2.1% 54.1% 26.3% 31.4x 3.55x 13.5x 3.35x 12.2xThe Wendy's Company WEN 11.10 96.5% 4,073 1,448 267 5,254 2,004 389 (16.7%) (6.4%) 33.6% 19.4% 41.4x 2.62x 13.5x 3.14x 13.2xYum! Brands, Inc. YUM 89.74 95.3% 38,804 3,387 675 41,516 13,177 2,709 (0.7%) 0.6% 25.7% 20.6% 39.8x 3.15x 15.3x 2.91x 13.3x
Mean 11.2% 0.7% 42.7% 26.2% 34.7x 5.24x 19.0x 4.03x 14.0xMedian 1.1% 0.6% 38.0% 26.3% 36.9x 3.55x 14.8x 3.35x 13.3x
Fast CasualChipotle Mexican Grill, Inc. CMG $635.67 87.3% 19,678 0 891 18,788 4,293 898 26.6% 21.4% 38.1% 20.9% 41.4x 4.38x 20.9x 3.83x 17.9xEl Pollo Loco Holdings, Inc. LOCO 27.84 66.8% 1,042 166 11 1,196 345 60 9.6% NA 25.9% 17.3% 22.5x 3.47x 20.1x 3.20x 18.1xFiesta Restaurant Group, Inc. FRGI 52.28 75.8% 1,384 73 4 1,454 630 87 17.3% 36.0% 25.6% 13.8% 37.1x 2.31x 16.8x 2.03x 13.8xThe Habit Restaurants, Inc. HABT 37.20 84.2% 489 2 49 442 191 19 17.3% 36.0% 21.5% 10.1% NM 2.31x 22.8x 1.83x 17.4xNoodles & Company NDLS 16.21 45.3% 511 22 2 532 420 46 17.3% 36.0% 19.6% 10.9% NM 1.27x 11.7x 1.10x 10.5xPanera Bread Company PNRA 182.87 98.1% 4,904 100 202 4,802 2,572 393 17.3% 36.0% 33.5% 15.3% 29.0x 1.87x 12.2x 1.77x 11.8xPotbelly Corporation PBPB 14.19 83.9% 426 1 63 364 339 32 17.3% 36.0% 30.4% 9.4% NM 1.07x 11.4x 0.95x 9.9xZoe's Kitchen, Inc. ZOES 33.47 87.1% 646 24 29 641 172 6 47.6% NA 20.2% 3.4% NM 3.73x 110.1x 2.91x 36.1x
Mean 21.3% 33.6% 26.8% 12.6% 32.5x 2.55x 28.3x 2.20x 16.9xMedian 17.3% 36.0% 25.8% 12.3% 33.1x 2.31x 18.4x 1.93x 15.6x
Differentiated CasualBJ's Restaurants, Inc. BJRI $47.79 86.2% $1,253 $39 $26 $1,266 $865 $102 9.1% 10.3% 18.4% 11.8% 40.9x 1.46x 12.4x 1.33x 10.7xBuffalo Wild Wings Inc. BWLD 156.53 79.9% 2,973 0 114 2,860 1,589 244 19.5% 23.0% 23.7% 15.3% 31.4x 1.80x 11.7x 1.53x 9.7xChuy's Holdings, Inc. CHUY 25.81 70.3% 425 9 7 427 256 28 19.8% 22.6% 18.3% 10.8% 35.8x 1.67x 15.4x 1.45x 12.9xIgnite Restaurant Group, Inc. IRG 4.63 29.5% 121 162 32 251 836 26 17.3% 36.0% 29.7% 3.2% NM 0.30x 9.5x 0.48x 8.0xThe Cheesecake Factory Incorporated CAKE 50.47 91.5% 2,358 102 39 2,420 2,013 237 6.2% 4.3% 42.6% 11.8% 24.1x 1.20x 10.2x 1.12x 9.4x
Mean 14.4% 19.3% 26.6% 10.6% 33.1x 1.29x 11.9x 1.18x 10.1xMedian 17.3% 22.6% 23.7% 11.8% 33.6x 1.46x 11.7x 1.33x 9.7x
Last Twelve Months (LTM) Revenue Growth LTM Margins EV / LTM EV / 2015E
PUBLIC COMPARABLES5
FOOD AND BEVERAGEINDUSTRY UPDATE │ MAY 2015
8
PAGE |
Price at As a % of Market Cash & Enterprise P/E($ in millions, except per share data) Ticker 5/11/15 52-wk High Cap Debt Equiv. Value (EV) Revenue EBITDA 1 Year 3 Years Gross EBITDA Multiple Revenue EBITDA Revenue EBITDA
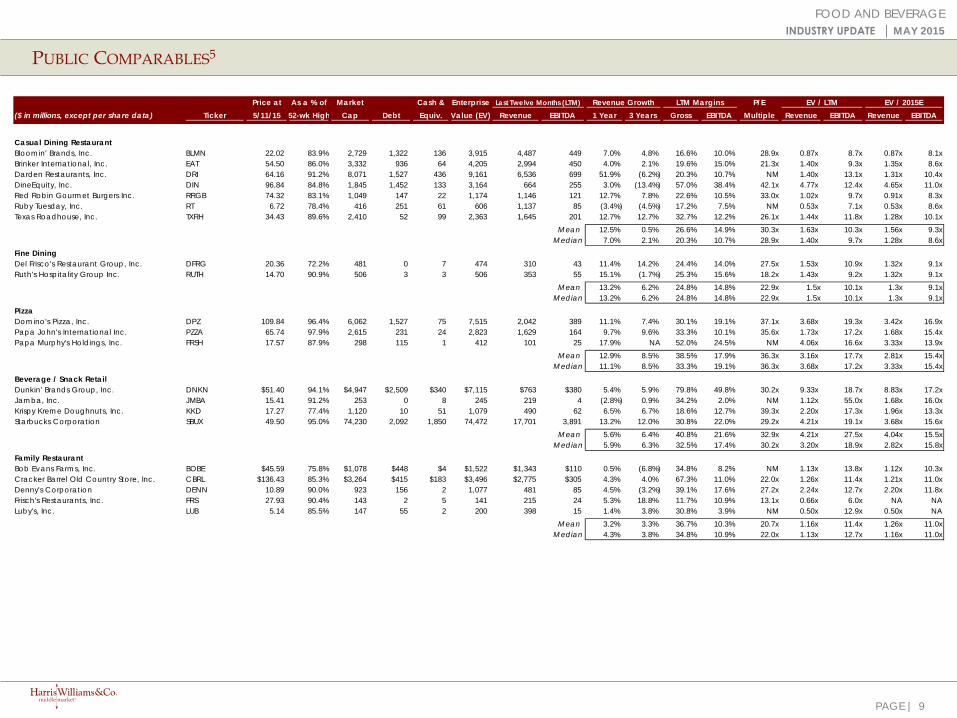
Casual Dining RestaurantBloomin' Brands, Inc. BLMN 22.02 83.9% 2,729 1,322 136 3,915 4,487 449 7.0% 4.8% 16.6% 10.0% 28.9x 0.87x 8.7x 0.87x 8.1xBrinker International, Inc. EAT 54.50 86.0% 3,332 936 64 4,205 2,994 450 4.0% 2.1% 19.6% 15.0% 21.3x 1.40x 9.3x 1.35x 8.6xDarden Restaurants, Inc. DRI 64.16 91.2% 8,071 1,527 436 9,161 6,536 699 51.9% (6.2%) 20.3% 10.7% NM 1.40x 13.1x 1.31x 10.4xDineEquity, Inc. DIN 96.84 84.8% 1,845 1,452 133 3,164 664 255 3.0% (13.4%) 57.0% 38.4% 42.1x 4.77x 12.4x 4.65x 11.0xRed Robin Gourmet Burgers Inc. RRGB 74.32 83.1% 1,049 147 22 1,174 1,146 121 12.7% 7.8% 22.6% 10.5% 33.0x 1.02x 9.7x 0.91x 8.3xRuby Tuesday, Inc. RT 6.72 78.4% 416 251 61 606 1,137 85 (3.4%) (4.5%) 17.2% 7.5% NM 0.53x 7.1x 0.53x 8.6xTexas Roadhouse, Inc. TXRH 34.43 89.6% 2,410 52 99 2,363 1,645 201 12.7% 12.7% 32.7% 12.2% 26.1x 1.44x 11.8x 1.28x 10.1x
Mean 12.5% 0.5% 26.6% 14.9% 30.3x 1.63x 10.3x 1.56x 9.3xMedian 7.0% 2.1% 20.3% 10.7% 28.9x 1.40x 9.7x 1.28x 8.6x
Fine DiningDel Frisco's Restaurant Group, Inc. DFRG 20.36 72.2% 481 0 7 474 310 43 11.4% 14.2% 24.4% 14.0% 27.5x 1.53x 10.9x 1.32x 9.1xRuth's Hospitality Group Inc. RUTH 14.70 90.9% 506 3 3 506 353 55 15.1% (1.7%) 25.3% 15.6% 18.2x 1.43x 9.2x 1.32x 9.1x
Mean 13.2% 6.2% 24.8% 14.8% 22.9x 1.5x 10.1x 1.3x 9.1xMedian 13.2% 6.2% 24.8% 14.8% 22.9x 1.5x 10.1x 1.3x 9.1x
PizzaDomino's Pizza, Inc. DPZ 109.84 96.4% 6,062 1,527 75 7,515 2,042 389 11.1% 7.4% 30.1% 19.1% 37.1x 3.68x 19.3x 3.42x 16.9xPapa John's International Inc. PZZA 65.74 97.9% 2,615 231 24 2,823 1,629 164 9.7% 9.6% 33.3% 10.1% 35.6x 1.73x 17.2x 1.68x 15.4xPapa Murphy's Holdings, Inc. FRSH 17.57 87.9% 298 115 1 412 101 25 17.9% NA 52.0% 24.5% NM 4.06x 16.6x 3.33x 13.9x
Mean 12.9% 8.5% 38.5% 17.9% 36.3x 3.16x 17.7x 2.81x 15.4xMedian 11.1% 8.5% 33.3% 19.1% 36.3x 3.68x 17.2x 3.33x 15.4x
Beverage / Snack RetailDunkin' Brands Group, Inc. DNKN $51.40 94.1% $4,947 $2,509 $340 $7,115 $763 $380 5.4% 5.9% 79.8% 49.8% 30.2x 9.33x 18.7x 8.83x 17.2xJamba, Inc. JMBA 15.41 91.2% 253 0 8 245 219 4 (2.8%) 0.9% 34.2% 2.0% NM 1.12x 55.0x 1.68x 16.0xKrispy Kreme Doughnuts, Inc. KKD 17.27 77.4% 1,120 10 51 1,079 490 62 6.5% 6.7% 18.6% 12.7% 39.3x 2.20x 17.3x 1.96x 13.3xStarbucks Corporation SBUX 49.50 95.0% 74,230 2,092 1,850 74,472 17,701 3,891 13.2% 12.0% 30.8% 22.0% 29.2x 4.21x 19.1x 3.68x 15.6x
Mean 5.6% 6.4% 40.8% 21.6% 32.9x 4.21x 27.5x 4.04x 15.5xMedian 5.9% 6.3% 32.5% 17.4% 30.2x 3.20x 18.9x 2.82x 15.8x
Family RestaurantBob Evans Farms, Inc. BOBE $45.59 75.8% $1,078 $448 $4 $1,522 $1,343 $110 0.5% (6.8%) 34.8% 8.2% NM 1.13x 13.8x 1.12x 10.3xCracker Barrel Old Country Store, Inc. CBRL $136.43 85.3% $3,264 $415 $183 $3,496 $2,775 $305 4.3% 4.0% 67.3% 11.0% 22.0x 1.26x 11.4x 1.21x 11.0xDenny's Corporation DENN 10.89 90.0% 923 156 2 1,077 481 85 4.5% (3.2%) 39.1% 17.6% 27.2x 2.24x 12.7x 2.20x 11.8xFrisch's Restaurants, Inc. FRS 27.93 90.4% 143 2 5 141 215 24 5.3% 18.8% 11.7% 10.9% 13.1x 0.66x 6.0x NA NALuby's, Inc. LUB 5.14 85.5% 147 55 2 200 398 15 1.4% 3.8% 30.8% 3.9% NM 0.50x 12.9x 0.50x NA
Mean 3.2% 3.3% 36.7% 10.3% 20.7x 1.16x 11.4x 1.26x 11.0xMedian 4.3% 3.8% 34.8% 10.9% 22.0x 1.13x 12.7x 1.16x 11.0x
Last Twelve Months (LTM) Revenue Growth LTM Margins EV / LTM EV / 2015E
PUBLIC COMPARABLES5
FOOD AND BEVERAGEINDUSTRY UPDATE │ MAY 2015
9

PAGE |
PUBLIC EQUITY MARKET OVERVIEW
FOOD AND BEVERAGEINDUSTRY UPDATE │ MAY 2015
FOOD AND BEVERAGE INDUSTRY STOCK PERFORMANCE5
Highlighted Food and Beverage M&A Transactions
M&A MARKET OVERVIEW
75
85
95
105
115
125
135
Jul-14 Sep-14 Nov-14 Jan-15 Mar-15 May-15
Restaurant Protein Processing/Dairy Natural/Organic Beverage Private Label Food Manufacturing S&P 500
CONAGRA BUYS BLAKE’S ALL NATURAL FOODS
Blake’s produces natural and organic packaged food products, including chicken pot pies, macaroni and cheese, casseroles, and other entrees.
The acquisition will expand ConAgra’s offerings in the freezer case and help drive accelerated sales growth.
The acquisition is only ConAgra’s third since its takeover of Ralcorp in 2013, which has proved to be harder to integrate than expected.
Enterprise Value: N/ARevenue Multiple: N/AEBITDA Multiple: N/AAnnounced: 05/12/2015
19.2%
18.8%
14.5%
11.0%
9.0%
5.1%
TRICOR PACIFIC ACQUIRES GOLD STANDARD BAKING FROM ARBOR INVESTMENTS
Gold Standard Baking produces thaw-and-serve baked goods, such as croissants, danishes, breads, rolls and muffins.
Gold Standard sells its products through the retail, foodservice, and c-store channels.
The sale represents an exit for Arbor Private Investment Company, who originally invested in Gold Standard in 2008.
Enterprise Value: N/ARevenue Multiple: N/AEBITDA Multiple: N/AAnnounced: 05/01/2015
ALLTECH BUYS RIDLEY
Ridley manufactures and markets a range of animal nutrition products, including formulated feeds, premixes, feed supplements, and other products.
The offer value of $33.57 per share represents an approximately 20% premium to the share price a day before the announcement.
The transaction will allow Alltech to provide better service to livestock and poultry producers.
Enterprise Value: $423mmRevenue Multiple: 0.7xEBITDA Multiple: 8.1xAnnounced: 04/23/2015
10

PAGE |
M&A MARKET OVERVIEW
FOOD AND BEVERAGEINDUSTRY UPDATE │ MAY 2015
Food and Beverage M&A Trends5
MEDIAN FOOD & BEV. TRANSACTION MULTIPLES
PRIVATE EQUITY INVESTMENTS & EXITS
Latest Deals and Announced Private Equity Activity5
LAST 10 DEALS ANNOUNCED
ANNOUNCED FOOD & BEV. TRANSACTIONS
Announced Target Buyer 5/11/2015 Wight Salads Group, Ltd. APS Salads Ltd5/6/2015 Aalbæk Specialiteter A/S Atria Oyj (HLSE:ATRAV)5/6/2015 Johnstone's Just Desserts Ltd. Finsbury Food Group plc (AIM:FIF)5/6/2015 Novotel Edinburgh Park Dhiafat ina Hotels5/6/2015 Aamicola Crystal Clear Blue Summit Waters, LLC5/6/2015 Sunrise Farms, Inc. Charles River Laboratories 5/5/2015 Balconi Industria Dolciaria S.p.A. Valeo Foods Group Limited5/5/2015 Norman Collett Limited Fruit Growers Alliance Ltd.5/4/2015 SAS Gastronome Luché Casino, Guichard-Perrachon Société 5/4/2015 Earlville Farm Iroquois Valley Farms LLC
9.9x
8.8x 8.3x 8.0x
11.3x
9.2x 9.7x 9.3x
0.00x
0.25x
0.50x
0.75x
1.00x
1.25x
1.50x
1.75x
2.00x
0.0x
2.0x
4.0x
6.0x
8.0x
10.0x
12.0x
14.0x
16.0x
2008 2009 2010 2011 2012 2013 2014 YTD2015
EV / LTM Sales M
ultipleEV /
LTM
EBI
TDA
Mul
tiple
EV / LTM EBITDA EV / LTM Sales
$110.2
$9.3
$67.2
$8.2
$24.0
$55.7
$120.7
$71.2
0
50
100
150
200
250
300
350
$0
$20
$40
$60
$80
$100
$120
$140
2008 2009 2010 2011 2012 2013 2014 YTD2015
Num
ber of Transactions
Aggr
egat
e D
eal V
alue
($
inbi
llion
s)
Aggregate Deal Value # of deals
27
46
2114
3225 26
3831
2327 26 27
17
34
18
3643
48
15
0
10
20
30
40
50
60
2006 2007 2008 2009 2010 2011 2012 2013 2014 2015 YTD
Num
ber o
f Tra
nsac
tions
Number of Investments Number of Exits
11

PAGE |
Effective Date Borrower Name Description Tranche Amount Type Rating Spread
04/30/15 PT Royal Industries Indonesia Prepared feeds USD 270,000,000 Term Loan N/A 44004/30/15 PT Royal Industries Indonesia Prepared feeds USD 230,000,000 Revolver/Line >= 1 Yr. N/A 41505/08/15 PT Wisesa Inspirasi Nusantara Edible oils USD 110,000,000 Murabaha N/A 14504/09/15 Pacific Andes Food (HK) Edible fats and oils USD 80,000,000 Term Loan N/A N/A03/31/15 Cosmos Foods Co Ltd Food preparations JPY 905,000,000 Revolver/Line >= 1 Yr. N/A 47503/31/15 Dean Foods Co Wines, brandy, and brandy spirits USD 450,000,000 Revolver/Line >= 1 Yr. N/A N/A03/31/15 Fuji Oil Co Ltd Candy & other products JPY 15,000,000,000 Revolver/Line >= 1 Yr. N/A 50003/31/15 Post Holdings Distilled and blended liquors USD 700,000,000 Term Loan B N/A 26003/30/15 ITO EN Ltd Candy & other products USD 64,000,000 Term Loan N/A N/A03/30/15 ITO EN Ltd Cigarettes USD 95,000,000 Term Loan N/A 2003/30/15 Kikkoman Corp Flavoring extracts and syrups JPY 20,000,000,000 Revolver/Line >= 1 Yr. N/A N/A03/30/15 Lotte Co Ltd Cereal breakfast foods JPY 120,000,000,000 Revolver/Line >= 1 Yr. N/A N/A03/30/15 Nisshin Oillio Group Ltd Edible fats and oils JPY 10,000,000,000 Revolver/Line >= 1 Yr. N/A N/A03/28/15 Shimanoka Co Ltd Candy & other confectionery JPY 800,000,000 Revolver/Line >= 1 Yr. N/A N/A03/28/15 Zest Cook Co Ltd Bread, cake, and related products JPY 2,030,000,000 Term Loan N/A N/A
L + 0
L + 200
L + 400
L + 600
L + 800
L + 1000
Ave
rage
Spre
ad O
ver L
IBO
R
AVERAGE SPREAD ON FOOD & BEVERAGE LOANS
DEBT MARKET OVERVIEW
FOOD AND BEVERAGEINDUSTRY UPDATE │ MAY 2015
Food and Beverage Loan Activity7
AVERAGE SECONDARY SPREADS
Recent Debt Offerings8
CREDIT STATISTICS
QUARTERLY LOAN VOLUME
$0
$2
$4
$6
$8
$10
$12
$14
$16
1Q09 1Q10 1Q11 1Q12 1Q13 1Q14 1Q15
Loan
Vol
ume
by Q
uart
er
($ in
billi
ons)
Institutional Pro Rata
L + 0
L + 100
L + 200
L + 300
L + 400
L + 500
L + 600
2008 2009 2010 2011 2012 2013 2014
Ave
rage
Spre
ad O
ver L
IBO
R
Revolving Credit / Term Loan A Weighted-Average Institutional
0.0x
2.0x
4.0x
6.0x
Debt/EBITDA
Senior Debt/EBITDA
EBITDA/Cash Interest
EBITDA - Capex/Cash Interest
EBITD
A M
ultip
le
2010 2011 2012 2013 2014
12

PAGE |
Enterprise Enterprise Value Private Equity Geographic
Announced Target Seller Buyer
($mm) Sales EBITDA EBIT Involvement Location
5/11/2015 Wight Salads Group, Ltd. Vitacress Salads Ltd APS Salads Ltd - - - - EU5/6/2015 Aalbæk Specialiteter A/S - Atria Oyj (HLSE:ATRAV) - - - - EU5/6/2015 Johnstone's Just Desserts Ltd. - Finsbury Food Group plc (AIM:FIF) - - - - EU5/6/2015 Novotel Edinburgh Park Algonquin SA Dhiafat ina Hotels - - - - Cross Border5/6/2015 Aamicola Crystal Clear - Blue Summit Waters, LLC - - - - N.A.5/6/2015 Sunrise Farms, Inc. Elanco Animal Health, Inc. Charles River Laboratories - - - - N.A.5/5/2015 Balconi Industria Dolciaria S.p.A. Clessidra SGR S.p.A. Valeo Foods Group Limited - - - - EU5/5/2015 Norman Collett Limited - Fruit Growers Alliance Ltd. - - - - Cross Border5/4/2015 SAS Gastronome Luché Gastronome Casino, Guichard-Perrachon Société - - - - EU5/4/2015 Earlville Farm - Iroquois Valley Farms LLC - - - - N.A.5/4/2015 Mart ínez Loriente S.A. Mercadona, S.A. Torrent Fimer SL - - - - EU5/4/2015 Presteve Foods Limited - Tricor Pacific Founders Capital Inc. - - - - N.A.5/3/2015 Parity Bars Ltd - Enjoy Pubs Ltd. - - - - EU5/2/2015 Animal Health International, Inc. Leonard Green & Partners, L.P. Patterson Companies, Inc. $1,100.0 0.7x 16.2x - N.A.5/1/2015 Gold Standard Baking, Inc. Arbor Private Investment Company Tricor Pacific Capital, Inc. - - - - N.A.5/1/2015 Hiller Incorporated - The Kroger Co. of Michigan - - - - N.A.4/30/2015 Insight Beverages, Inc. - Kerry Group plc (ISE:KRZ) - - - - Cross Border4/30/2015 Let 's Yo!, LLC - U-Swirl International, Inc. - - - - N.A.4/30/2015 Bott le Green Ltd. DCC plc (LSE:DCC) Kingsland Drinks Limited - - - - EU4/29/2015 Napier Brown Foods Limited Real Good Food plc (AIM:RGD) Tereos Part icipations S.A.S $52.6 - - - EU4/29/2015 Fiesta Mart, Inc. The Grocers Supply Co., Inc. Acon Investments, L.L.C. - - - - N.A.4/28/2015 Biscuiterie Jules Destrooper N.V. Griesson - de Beukelaer GT & CO - - - - EU4/28/2015 Cimandis Ltd. SandpiperCI Limited BFS Group Limited - - - - EU4/27/2015 Tannis Trading, Inc. - Sysco Canada, Inc. - - - - N.A.4/27/2015 Conservas Garavilla, S.A.U. MCH Private Equity, S.L. Bolton Group International S.r.l. - - - - EU4/27/2015 ZF Italien-Importe GmbH - Theo Rüther GmbH & Co. KG - - - - EU4/27/2015 ESG Kräuter GmbH - Fuchs Gewürze GmbH - - - - EU4/24/2015 Bad Daddy's International, LLC FS-BDI Holdings Good Times Restaurants Inc. $21.0 - - - N.A.4/22/2015 Ridley Inc. (TSX:RCL) Fairfax Financial Holdings Limited Alltech, Inc. $423.3 0.7x 8.1x 9.4x N.A.4/22/2015 Prospect Enterprises, Inc., Most Seafood Assets Prospect Enterprises, Inc. Santa Monica Seafood Company - - - - N.A.4/21/2015 Paqui, LLC - SkinnyPop Popcorn LLC - - - - N.A.4/20/2015 Iglo Foods Holdings Limited Permira Advisers Ltd. Nomad Holdings Limited $2,808.0 1.8x 8.2x - Cross Border4/20/2015 The Moving Venue Caterers Ltd - Smart (Group) Ltd. - - - - EU4/15/2015 Gabbotts Farm (Retail) Ltd Cribbin Family Butchers Crawshaw Group plc (AIM:CRAW) $5.8 0.4x 4.9x - EU4/15/2015 Nordic Service Partners Holding AB (OM:NSP B) European Digital Partners Danske Koncept Restauranter $45.6 0.5x 6.3x 17.5x EU4/14/2015 Prefered Brands International, Inc. ASG-OMNI LLC Kagome Co. Ltd. (TSE:2811) $114.6 - - - Cross Border4/13/2015 Henry H. Ottens Manufacturing Co. - International Flavors & Fragrances - - - - N.A.4/10/2015 Greenyard Foods NV - Univeg and Peatinvest - - - - EU4/10/2015 Naked Wines WIV Wein International AG Majest ic Wine Warehouses Ltd. $102.5 0.9x - - EU4/10/2015 Baker Boys, LLC Amoroso's Baking Co Inc. Ginsburg Bakery Inc. - - - - N.A.
10.0x
11.0x
12.0x
13.0x
14.0x
15.0x
16.0x
Apr
-14
Ma
y-14
Jun-
14
Jul-1
4
Aug
-14
Sep
-14
Oct
-14
Nov
-14
Dec
-14
Jan-
15
Feb
-15
Ma
r-15
Apr
-15
Med
ian
Tradi
ng M
ultip
le
Food Products, Processing, and Ingredients Retail and Restaurants
2536
2234 36
46 47
2533
49
3442
53 52 4839
3346 47 52
70
89
58 57
82
5
2
3
47
5 7
136
7
75
4 79
610
13 87
10
6
105
20
0
20
40
60
80
100
120
Q10
9Q
209
Q30
9Q
409
Q11
0Q
210
Q31
0Q
410
Q11
1Q
211
Q31
1Q
411
Q11
2Q
212
Q31
2Q
412
Q11
3Q
213
Q31
3Q
413
Q11
4Q
214
Q31
4Q
414
Q11
5
Num
be
r o
f Tra
nsa
ctio
nsSt rategic Acquirer Private Equity Acquirer
M&A OVERVIEW
FOOD AND BEVERAGEINDUSTRY UPDATE │ MAY 2015
QUARTERLY M&A ACTIVITY
Median LTM Trading Multiples & Quarterly Food & Beverage M&A5
Recent Food and Beverage M&A5
MEDIAN LTM TRADING MULTIPLES
13

PAGE |
Enterprise Enterprise Value Private Equity EuropeanAnnounced Target Seller Buyer
($mm) Sales EBITDA EBIT Involvement Transaction
4/9/2015 Condor Snack Company - UTZ Quality Foods, Inc. - - - - N.A.4/8/2015 H.C. Schmieding Produce Company - Woerner Holdings, Inc. - - - - N.A.4/8/2015 Tresch Organisat ion S.A. - Les Grands Chais De France SA - - - - EU4/7/2015 Caldic B.V., Herbs & Business Caldic B.V. Intertaste BV - - - - EU4/7/2015 Harris Teeter, Inc. - The Kroger Co. (NYSE:KR) - - - - N.A.4/6/2015 Kencraft, Inc. Dynamic Confections, Inc. BBX Sweet Holdings, LLC - - - - N.A.4/6/2015 Bruce Foods, Hot Sauce Business Bruce Foods Corporat ion Southeastern Mills, Inc. - - - - N.A.4/2/2015 Laceys Farmacy Inc. - Wilbur-Ellis Company Inc. - - - - N.A.4/1/2015 Illegal Burger LLC - Nexus Energy Services, Inc. - - - - N.A.4/1/2015 B&R Liquid Adventure, LLC - American Brewing Company, Inc. $1.7 - - - N.A.4/1/2015 Jamba Juice Company, Inc., 100 Units Jamba Juice Company, Inc. Vitaligent, LLC $36.0 - - - N.A.3/31/2015 BT's Burgerjoint Management, LLC - American Roadside Burgers, Inc. $2.4 0.7x - - N.A.3/31/2015 Carroll Cuisine Ltd. ARYZTA AG (SWX:ARYN) Carlyle Cardinal Ireland - - - - Cross Border3/31/2015 Sea Farm Ionian S.A. - Nireus Aquaculture SA (ATSE:NIR) - - - - EU3/30/2015 Sicilian Sun Limited, LLC - Firma Holdings Corp. (OTCPK:FRMA) $3.6 - - - N.A.3/30/2015 AOR N.V. - Archer-Daniels-Midland - - - - Cross Border3/30/2015 Rocca Limited Lombra Limited The Fulham Shore PLC (AIM:FUL) $49.5 5.8x 27.9x - EU3/30/2015 Soframa SAS - DGF SAS - - - - EU3/27/2015 Azteca Foods Europe and AFIFT Azteca Azteca Foods, Inc.; Fat Taco, S.L. Gruma International Foods $48.3 - - - EU3/27/2015 Angel's Share Brands LLC - Bacardi Limited - - - - Cross Border3/27/2015 Gehl Foods, Inc. - Wind Point Partners - - - - N.A.3/27/2015 Perrin Brewing Company, LLC - Oskar Blues Brewing Company - - - - N.A.3/25/2015 Hickory Springs Bott ling, Inc. - Silver Springs Bott led Water Company $16.3 - - - N.A.3/24/2015 Kraft Foods Group, Inc. (NasdaqGS:KRFT) - H.J. Heinz Holding Corporat ion $53,739.0 3.0x 14.9x 16.6x N.A.3/24/2015 Ad van Geloven BV Carson Private Capital TowerBrook Capital Partners L.P. - - - - Cross Border3/24/2015 J Vineyards & Winery LLC - E. & J. Gallo Winery, Inc. - - - - N.A.3/20/2015 Lemon-X, Corp. Comvest Partners Juice Tyme, Inc. - - - - N.A.3/19/2015 SaumonFrance Cherbourg S.A. - Aquaponic Management Project - - - - EU3/19/2015 Nibnibs Ltd. - Haywood & Padgett Ltd. - - - - EU3/17/2015 Catalina Restaurant Group Inc. Zensho America Corporat ion Food Management Partners, Inc. - - - - N.A.3/16/2015 TAIGA International NV - Frutarom Belgium NV $2.9 0.6x - - EU3/16/2015 Senoble SA, Spanish And Slovak Activit ies Senoble SA Schreiber Foods Inc. - - - - Cross Border3/16/2015 Fresca's Mexican Grill and JoJo's Pizza Kitchen - American Restaurant Holdings, - - - - N.A.3/13/2015 Flatout, Inc. North Cast le Partners, LLC Lancaster Colony Corporat ion $92.0 2.0x 9.2x - N.A.3/12/2015 Del Taco Holdings, Inc. Leonard Green & Partners Levy Acquisit ion Corp. $558.0 1.4x 9.5x - N.A.3/11/2015 Vantage Seafood, LLC - Keyport LLC - - - - N.A.3/11/2015 Sager Creek Vegetable Company, Inc. Sankaty Advisors, LLC Del Monte Foods, Inc. $75.0 0.3x - - N.A.3/11/2015 Adelie Foods Group Ltd India Hospitality Corp. H.I.G. Europe - - - - EU3/9/2015 American Beverage Corporat ion Wessanen U.S.A., Inc. Harvest Hill Beverage Company $55.0 0.5x 6.0x - N.A.3/9/2015 Brand Aromatics, Inc. - McCormick & Company $63.0 2.3x 10.0x - N.A.3/9/2015 Mixum AB - PicaDeli - - - - EU3/9/2015 Farmhaus Produkt ions Stockheim Air Catering, Inc. Hardy Remagen GmbH & Co. KG - - - - EU3/9/2015 Hauser & Cie AG, Neumühle Töss - The Kornspitz Company - - - - EU3/7/2015 Romano's Macaroni Grill Ignite Restaurant Group, Inc. Redrock Partners, LLC $8.0 - - - N.A.3/6/2015 Florigo Industry B.V. - TNA Australia Pty Limited - - - - Cross Border3/6/2015 AN, s.coop - UNICA Group - - - - EU3/5/2015 Conditorei Coppenrath & Wiese - Dr. August Oetker KG - - - - EU3/5/2015 Starr Culinary Delights Inc. - Weston Foods (Canada) Inc. - - - - N.A.3/5/2015 Perheleipurit Oy - Leipomo Salonen Oy - - - - EU3/4/2015 Empire Kosher Poultry, Inc. Palisades Associates, Inc. The Hain Celest ial Group - - - - N.A.3/3/2015 South West Seeds Ltd. - Agrovista UK Limited - - - - EU3/3/2015 Shot Spirits Corporat ion - My Big Coin Pay, Inc. - - - - N.A.3/3/2015 The Lafragette & Legier Group Vintners Inc. Quintessent ial Brands S.A. - - - - EU3/2/2015 Citrusource, LLC Orange County Citrus SunOpta Grains and Foods Inc. $13.3 0.4x - - N.A.3/2/2015 Brandywine Ingredient and Glide LLC Del Campo Baking Co., Inc. Research Products Company, Inc. - - - - N.A.2/28/2015 Industrias Alimentarias de Navarra, S.A.U Viscofan SA (CATS:VIS) Portobello Capital Gest ión $59.8 - - - EU2/28/2015 Ritual Wellness, Inc. - Project Juice LLC - - - - N.A.2/27/2015 Mont Marçal Vinicola S.A. - Bardinet S.A. $9.9 1.3x - - EU2/27/2015 United Dutch Breweries B.V. Egeria BV GIMV NV (ENXTBR:GIMB) - - - - EU2/26/2015 Tomalgae C.V.B.A - Benchmark Holdings plc (AIM:BMK) - - - - EU2/26/2015 Palacios Alimentación, S.A.U Talde Gest ión, S.G.E.C.R. The Carlyle Group - - - - Cross Border2/24/2015 Tican A/S - Leverandørselskabet - - - - EU2/23/2015 Twisters, Inc. - VKC Delights Inc. - - - - N.A.2/23/2015 Larsen Danish Seafood Larsen Danish Seafood A/S P/f Christ ian I Grot inum - - - - EU2/22/2015 Henson Foods Ltd. - Bidvest Fresh Limited - - - - EU
M&A OVERVIEW
FOOD AND BEVERAGEINDUSTRY UPDATE │ MAY 2015
Recent Food and Beverage M&A5
14

PAGE |
May 2015Date Company
5/19/2015 Greencore Group plc (LSE:GNC)5/19/2015 Wal-Mart Stores Inc. (NYSE:WMT)5/19/2015 Red Robin Gourmet Burgers Inc. (NasdaqGS:RRGB)5/20/2015 Britvic Plc (LSE:BVIC)5/20/2015 Hormel Foods Corporation (NYSE:HRL)5/21/2015 Suedzucker AG (DB:SZU)5/22/2015 Campbell Soup Company (NYSE:CPB)5/28/2015 Flowers Foods, Inc. (NYSE:FLO)5/28/2015 Strauss Group Ltd. (TASE:STRS)5/28/2015 Tate & Lyle plc (LSE:TATE)
June 2015Date Company
6/4/2015 The J. M. Smucker Company (NYSE:SJM)6/18/2015 The Kroger Co. (NYSE:KR)6/30/2015 ConAgra Foods, Inc. (NYSE:CAG)
July 2015Date Company
7/9/2015 Suedzucker AG (DB:SZU)7/14/2015 Yum! Brands, Inc. (NYSE:YUM)7/16/2015 Domino's Pizza, Inc. (NYSE:DPZ)7/22/2015 The Cheesecake Factory Incorporated (NasdaqGS:CAKE)7/23/2015 Nutreco N.V. (ENXTAM:NUO)7/23/2015 Ruby Tuesday, Inc. (NYSE:RT)7/23/2015 Unilever NV (ENXTAM:UNA)7/23/2015 Starbucks Corporation (NasdaqGS:SBUX)7/24/2015 Danone (ENXTPA:BN)7/24/2015 Koninklijke Wessanen N.V. (ENXTAM:WES)7/30/2015 Anheuser-Busch InBev SA/NV (ENXTBR:ABI)7/30/2015 Diageo plc (LSE:DGE)
FOOD AND BEVERAGE EARNINGS RELEASE CALENDAR
FOOD AND BEVERAGEINDUSTRY UPDATE │ MAY 2015
Earnings Release Calendar5
15

Energy & Power
IndustrialsHealthcare & Life Sciences
Transportation & Logistics
Aerospace, Defense & Government
Services
Business Services
Building Products & Materials
Technology, Media & Telecom
Specialty Distribution
Consumer
PAGE |
HARRIS WILLIAMS & CO. OFFICE LOCATIONS
UNITED STATES EUROPE
BostonTwo International Place24th FloorBoston, Massachusetts 02110Phone: +1 (617) 482-7501Fax: +1 (617) 482-7503
Cleveland1900 East 9th Street20th FloorCleveland, Ohio 44114Phone: +1 (216) 689-2400Fax: +1 (216) 689-2401
Minneapolis222 South 9th StreetSuite 3350Minneapolis, Minnesota 55402Phone: +1 (612) 359-2700Fax: +1 (612) 359-2701
Philadelphia1600 Market Street21st FloorPhiladelphia, Pennsylvania 19103Phone: +1 (267) 675-5900Fax: +1 (267) 675-5901
Richmond (U.S. Headquarters)1001 Haxall Point9th FloorRichmond, Virginia 23219Phone: +1 (804) 648-0072Fax: +1 (804) 648-0073
San Francisco575 Market Street31st FloorSan Francisco, California 94105, USAPhone: +1 (415) 288-4260Fax: +1 (415) 288-4269
FrankfurtBockenheimer Landstrasse 33-3560325 FrankfurtGermanyPhone: +49 069 3650638 00Fax: +49 069 3650638 01
London63 Brook StreetLondon W1K 4HS, EnglandPhone: +44 (0) 20 7518 8900Fax: +44 (0) 20 7526 2187
NETWORK OFFICES
BeijingHong KongMumbai
New DelhiShanghai
Consumer
Harris Williams & Co. has a broad range of industry expertise, which creates powerful opportunities.Our clients benefit from our deep-sector experience, integrated industry intelligence andcollaboration across the firm, and our commitment to learning what makes them unique. For moreinformation, visit our website at www.harriswilliams.de
OUR FIRM
FOOD AND BEVERAGE INDUSTRY UPDATE │ MAY 2015
16

PAGE |
HARRIS WILLIAMS & CO.
1. IMF
2. U.S. Bureau of Labor Statistics
3. Unweighted Average
4. U.S. Census Bureau
5. Capital IQ
6. Thomson Financial
7. S&P
8. Reuters
SOURCES
FOOD AND BEVERAGEINDUSTRY UPDATE │ MAY 2015
Harris Williams & Co. (www.harriswilliams.com and www.harriswilliams.de) is a preeminent middle market investment bank focused on the advisory needs of clients worldwide. The firm has deep industry knowledge, global transaction expertise, and an unwavering commitment to excellence. Harris Williams & Co. provides sell-side and acquisition advisory, restructuring advisory, board advisory, private placements, and capital markets advisory services.
Harris Williams & Co. Ltd is a private limited company incorporated under English law having its registered office at 5th Floor, 6 St. Andrew Street, London EC4A 3AE, UK, registered with the Registrar of Companies for England and Wales under company number 7078852. Directors: Mr. Christopher Williams, Mr. Ned Valentine, Mr. Paul Poggi and Mr. Thierry Monjauze, authorised and regulated by the Financial Conduct Authority.
Harris Williams & Co. Ltd Niederlassung Frankfurt (German branch) is registered in the Commercial Register (Handelsregister) of the Local Court (Amtsgericht) of Frankfurt am Main, Germany, under registration number HRB 96687, having its business address at Bockenheimer Landstrasse 33-35, 60325 Frankfurt am Main, Germany. Permanent Representative (Ständiger Vertreter) of the Branch Niederlassung: Mr. Jeffery H. Perkins.
THIS REPORT MAY CONTAIN REFERENCES TO REGISTERED TRADEMARKS, SERVICE MARKS AND COPYRIGHTS OWNED BY THIRD-PARTY INFORMATION PROVIDERS. NONE OF THE THIRD-PARTY INFORMATION PROVIDERS IS ENDORSING THE OFFERING OF, AND SHALL NOT IN ANY WAY BE DEEMED AN ISSUER OR UNDERWRITER OF, THE SECURITIES, FINANCIAL INSTRUMENTS OR OTHER INVESTMENTS DISCUSSED IN THIS REPORT, AND SHALL NOT HAVE ANY LIABILITY OR RESPONSIBILITY FOR ANY STATEMENTS MADE IN THE REPORT OR FOR ANY FINANCIAL STATEMENTS, FINANCIAL PROJECTIONS OR OTHER FINANCIAL INFORMATION CONTAINED OR ATTACHED AS AN EXHIBIT TO THE REPORT. FOR MORE INFORMATION ABOUT THE MATERIALS PROVIDED BY SUCH THIRD PARTIES, PLEASE CONTACT US AT THE ABOVE ADDRESSES OR NUMBERS.
The information and views contained in this report were prepared by Harris Williams & Co. (“Harris Williams”). It is not a research report, as such term is defined by applicable law and regulations, and is provided for informational purposes only. It is not to be construed as an offer to buy or sell or a solicitation of an offer to buy or sell any financial instruments or to participate in any particular trading strategy. The information contained herein is believed by Harris Williams to be reliable, but Harris Williams makes no representation as to the accuracy or completeness of such information. Harris Williams and/or its affiliates may be market makers or specialists in, act as advisers or lenders to, have positions in and effect transactions in securities of companies mentioned herein and also may provide, may have provided, or may seek to provide investment banking services for those companies. In addition, Harris Williams and/or its affiliates or their respective officers, directors and employees may hold long or short positions in the securities, options thereon or other related financial products of companies discussed herein. Opinions, estimates and projections in this report constitute Harris Williams’ judgment and are subject to change without notice. The financial instruments discussed in this report may not be suitable for all investors, and investors must make their own investment decisions using their own independent advisors as they believe necessary and based upon their specific financial situations and investment objectives. Also, past performance is not necessarily indicative of future results. No part of this material may be copied or duplicated in any form or by any means, or redistributed, without Harris Williams’ prior written consent.
Copyright© 2015 Harris Williams & Co., all rights reserved.
DISCLOSURES
17