Embed Size (px)
Citation preview

RIRDCInnovation for rural Australia
Global Competitiveness R&D Program
Food Aid and Agricultural Trade Reform
Food Aid and Agricultural Trade Reform
by David Harris
August 2007
RIRDC Publication No 07/136 RIRDC Project No DAH-3A
ii
© 2007 Rural Industries Research and Development Corporation. All rights reserved. ISBN 1 74151 532 7 ISSN 1440-6845 Food Aid and Agricultural Trade Reform Publication No. 07/136 Project No. DAH-3A The information contained in this publication is intended for general use to assist public knowledge and discussion and to help improve the development of sustainable regions. You must not rely on any information contained in this publication without taking specialist advice relevant to your particular circumstances.
While reasonable care has been taken in preparing this publication to ensure that information is true and correct, the Commonwealth of Australia gives no assurance as to the accuracy of any information in this publication.
The Commonwealth of Australia, the Rural Industries Research and Development Corporation (RIRDC), the authors or contributors expressly disclaim, to the maximum extent permitted by law, all responsibility and liability to any person, arising directly or indirectly from any act or omission, or for any consequences of any such act or omission, made in reliance on the contents of this publication, whether or not caused by any negligence on the part of the Commonwealth of Australia, RIRDC, the authors or contributors..
The Commonwealth of Australia does not necessarily endorse the views in this publication.
This publication is copyright. Apart from any use as permitted under the Copyright Act 1968, all other rights are reserved. However, wide dissemination is encouraged. Requests and inquiries concerning reproduction and rights should be addressed to the RIRDC Publications Manager on phone 02 6271 4165.
Researcher Contact Details Mr David Harris D. N. Harris & Associates 8 Irvine Street Glen Iris Victoria 3146 Phone: 03 9889 9879 Email: [email protected]
In submitting this report, the researcher has agreed to RIRDC publishing this material in its edited form. RIRDC Contact Details Rural Industries Research and Development Corporation Level 2, 15 National Circuit BARTON ACT 2600 PO Box 4776 KINGSTON ACT 2604 Phone: 02 6271 4100 Fax: 02 6271 4199 Email: [email protected] Web: http://www.rirdc.gov.au Published in August 2007
iii
Foreword The provision of food aid has been a contentious issue for many years. The concept was developed in the 1950s as a way for developed economies to dispose of surplus food production. Over time it has become associated with issues such as food security and malnutrition. While these are important issues there are long standing concerns that some donor countries use food aid as a form of export assistance to provide indirect price support in domestic commodity markets. In many respects the provision of food aid is equivalent to the use of targeted subsidised exports. It can have distortionary effects on world trade and disrupt industry developments in recipient countries. But the issue is not straight forward. It is complicated by the welfare considerations in humanitarian relief efforts. Food aid to prevent the loss of human life in emergency situations is a perfectly reasonable response. The objective of this research was to investigate the food aid activities of the major developed markets and examine issues related to the impact on global commodity markets, the effect on industry developments in Less Developed Countries and the implications for WTO trade reform. Discussions on the modalities for the WTO Doha trade negotiations have included an exchange of views on the need to impose disciplines on the use of food aid. Several issues have been raised about the market distortion effects of the way some donor countries are providing food aid. This project investigated concerns about the potential for food aid to circumvent future constraints on export subsidies. It also examined the trade distorting effects of food aid in the context of industry support measures in donor countries. This report will be of benefit to Government and industry representatives involved in the WTO negotiations on modalities for international disciplines on food aid.
The evidence suggests fluctuations in food aid have often involved surplus disposals by donor countries. The continued unrestricted use of food aid could weaken the benefits of WTO trade liberalisation measures that may be negotiated in other areas. A substantial amount of food aid is provided in ways that has market distortion effects on the rural industries of recipient countries. It has unintended consequences in the form of lower prices and lower farm incomes which disrupts industry development. This occurs when the aid becomes an alternative source of food supplies in the commercial market place and distorts market price signals. Food aid can also have trade distorting affects. It is mostly directed into food deficit countries and there are often commercial imports already contributing to the nation’s locally produced food supplies. If the aid becomes an alternative source of supply it reduces the demand for commercial imports and local production.
WTO disciplines on the use of food aid will need to ensure humanitarian relief for legitimate emergencies is still provided. But to minimise the market distorting effects of non-emergency food aid, a WTO agreement will need to specify a set of principles for declaring an emergency situation. In particular negotiators should also argue for the elimination of monetised food aid and aid provided as concessional loans. Food aid for non-emergency purposes should be replaced with untied cash assistance or untied distributed food aid with effective targeting conditions
This report is an addition to RIRDC’s diverse range of over 1600 research publications. Most of our publications are available for viewing, downloading or purchasing online through our website: • downloads at www.rirdc.gov.au/fullreports/index.html • purchases at www.rirdc.gov.au/eshop Peter O’Brien Managing Director Rural Industries Research and Development Corporation
iv
Acknowledgements The author has been involved in economic research on the effects of trade related policy reforms on rural industries for many years. He has an extensive background in quantitative analysis of the impact of trade restrictions on global commodity markets. His professional experience was developed during periods of employment at the Australian Bureau of Agricultural and Resource Economics (ABARE), the Centre for International Economics (CIE), Bonlac Foods Ltd and the OECD Secretariat in Paris. The author has recently completed a study on industry adjustment to trade related policy reform in Australian agriculture. He has also prepared a report on the technical issues affecting world trade in agricultural products that focused on the non-tariff barriers incorporated in tariff-quota administration. Both studies were funded by RIRDC and were undertaken to highlight some key issues for the Doha Round of WTO trade negotiations. This study looks at another contentious issue in the negotiations. The focus of this report was influenced by the comments and advice of several individuals at the start of the project. James Molan from AWB Ltd, Chris Phillips from Dairy Australia, Ray Trewin from the Australian Centre for International Agricultural Research (ACIAR), Ian Shaw from the Australian Bureau of Agriculture and Resource Economics (ABARE), Bruce Bowen from the Department of Agriculture, Fisheries and Forestry (DAFF), Ben Fargher from the National Farmer Federation (NFF) and Geoffrey Fox from the Australian Agency for International Development (AusAID) helped to shaped the direction of the research. Their contributions were greatly appreciated. Ian Shaw and Shirshore Hagi Hirad from ABARE prepared the quantitative analysis of the impact of US wheat aid on the global wheat trade. They provided useful advice on the design of the simulation experiment and modifications to the ABARE grains model. Further information on the structure of the model and the simulations results can be obtained from ABARE. Financial support for the project was provided by the Rural Industries Research and Development Corporation, and Dairy Australia. The assistance is gratefully acknowledged. The support, encouragement and advice of Jeff Davis (ACIAR) and Ian Shaw (ABARE) were greatly appreciated.

v
Contents Foreword ........................................................................................................................... iii Acknowledgements ......................................................................................................... iv Executive summary ........................................................................................................ vii 1. Introduction ................................................................................................................. 1
Food aid as a form of export assistance ............................................................... 1 Project objective ................................................................................................... 2
2. An overview of global food aid ............................................................................... 5
The different types of food aid ............................................................................. 5 Recent changes in non-emergency food aid ......................................................... 7 Commodities supplied as food aid ....................................................................... 9 Major donors of food aid ...................................................................................... 12 Recipients of food aid ........................................................................................... 16
3. Food aid and market support ................................................................................... 21
Food aid and trade related market support policies .............................................. 21 Food aid and subsidised exports ........................................................................... 22 US wheat aid ........................................................................................................ 24 Japan rice aid ........................................................................................................ 27 US SMP aid .......................................................................................................... 30
4. Food aid and market distortions .............................................................................. 35
The distortionary affect on international trade ..................................................... 35 The distortionary affect in recipient countries ..................................................... 37 The global distribution of food aid ...................................................................... 38 US food aid programs ........................................................................................... 39 US distribution of wheat and SMP food aid ......................................................... 41 The impact of US wheat aid on world trade ......................................................... 47
5. Concluding comments ................................................................................................ 51
Recipient country concerns about food aid .......................................................... 51 Trade concerns about food aid ............................................................................. 55
References .......................................................................................................................... 59 Appendix A: Major destinations of US wheat and SMP food aid ........................ 63 Appendix B: Market conditions for US wheat and SMP food aid ...................... 65 Appendix C: Simulating the effects of US wheat aid on world trade ................. 69

vi
Charts – main text A Global food aid deliveries ................................................................................... 5 B Cereal food aid by the major donors .................................................................. 15 C Regional destinations of cereal food aid ............................................................ 18 D Regional destinations of non-cereal food aid .................................................... 18 E US Government wheat stocks and food aid ....................................................... 24 F Rice stocks in Japan .......................................................................................... 28 G US opening stocks of SMP ................................................................................ 30 H External disposals of SMP from US Government stocks .................................. 31 I Composition of US external disposals of SMP .................................................. 31 J Recent external disposals of US SMP ............................................................... 33 K Trade impacts of eliminating US non-emergency wheat aid ............................ 49 L Tied monetised food aid versus financial aid .................................................... 52 Charts – appendixes M Schematic representation of the AGM .............................................................. 66 Tables – main text 1 Categories of food aid ....................................................................................... 6 2 Global food aid in cereal products .................................................................... 10 3 World wheat production, price and closing stocks ............................................ 11 4 Global food aid in non-cereal products ............................................................. 12 5 World SMP price and closing government stocks ............................................. 13 6 Major donors of food aid .................................................................................... 14 7 Comparing changes in US and EU aid flows ..................................................... 16 8 Regional destinations of global food aid ............................................................ 17 9 Trade related market support for selected food aid products ............................. 21 10 Subsidised exports and food aid by the major developed economies ................ 23 11 US wheat market developments ......................................................................... 25 12 US wheat exports and shipments of food aid ..................................................... 26 13 Japanese rice aid and trade related market support ............................................ 29 14 US food aid and SMP market support ................................................................ 32 15 Regional distribution of wheat, rice and dairy food aid ..................................... 38 16 US programmed shipments of selected food aid ................................................ 41 17 US monetisation of non-emergency wheat aid ................................................... 44 18 US monetisation of non-emergency SMP aid .................................................... 46 19 Impact of US non-emergency food aid on the world wheat market .................. 48 Tables – appendixes 20 Major destinations of US wheat aid ................................................................... 59 21 Major destinations of US SMP aid ..................................................................... 60 22 Commercial activity in the major destinations for US wheat aid ....................... 61 23 Commercial activity in the major destinations for US SMP aid ...................... 63 24 Model representations of world grain and oilseed imports ................................ 66 25 Indicative estimate of US emergency wheat aid ................................................ 67 26 Simulation results for eliminating US non-emergency wheat aid ...................... 68
vii
Executive summary What the report is about The provision of food aid is a long standing contentious issue that raises questions about market distortions and welfare assistance. Emergency aid is an ethical and appropriate response to humanitarian disaster, but other forms of aid can have trade distorting effects, including adverse impacts on producers in recipient countries. From a welfare perspective it is seen as a humanitarian response to human suffering from food shortages. A substantial amount of food aid is provided in ways that has market distortion effects on the rural industries of recipient countries. It has unintended consequences in the form of lower prices and lower farm incomes which disrupts industry development. This occurs when the aid becomes an alternative source of food supplies in the commercial market place and distorts market signals. In many low income developing countries the rural sector is generally dominated by small scale, semi-subsistence farmers. They consume much of what they produce and rely on limited off-farm sales to meet their non-food needs. Food aid that is sold or distributed in non-targeted ways in the local market will penalise farmers and work against efforts to alleviate rural poverty. Food aid can also have trade distorting affects. It is mostly directed into food deficit countries and there are often commercial imports already contributing to the nation’s food supplies. If the aid becomes an alternative source of supply it reduces the demand for commercial imports. The key issue is the extent of these market distortion affects. Some aid has minimal market distortion affects. Emergency relief for an unexpected, severe disruption to food supplies is a good example. Short term assistance to prevent the loss of human life is a reasonable response by donor countries. But there are legitimate concerns about the market distortion affects caused by non-emergency food aid. This includes aid classified as emergency relief but ends up as a substitute for commercial purchases.
Who is the report targeted at? The Doha Round of WTO trade negotiations are expected to introduce further constraints on the use of export subsidies. It could even reach agreement on the elimination of this form of assistance. If an agreement is reached the use of alternative export assistance measures such as food aid could affect the prospects for an improvement in global trading conditions. Discussions on the negotiation modalities have included an exchange of views on the need to impose disciplines on the use of food aid. This report highlights several issues which have been raised about the provision of food aid. It was prepared as a contribution to government representations on the development of international disciplines on food aid.
Background There are three types of food aid:
• Emergency food aid is targeted assistance to relieve human suffering when natural disasters or unusual events disrupt normal food supplies. It is usually distributed free of charge and generally has limited market distorting impacts.
• Project food aid is for development projects that address longer term deficiencies in food supplies.
viii
• Program food aid is to help disadvantaged countries alleviate balance of payments difficulties or budget constraints.
Both of the latter two types of food aid can have market distorting effects especially when it’s sold so the proceeds can be used for other purposes. In the past the global supply of food aid has fluctuated because some donors have used it as a surplus disposal mechanism. For some commodities the fluctuations have not been a reaction to the needs of recipient countries. It has reflected developments in the domestic markets of some donor countries and the use of food aid as an export assistance measure. The use of food aid in this way has not changed with the implementation of the UR Agreement on Agriculture. In 1999 there was a substantial increase in the global supply of food aid. Total food aid deliveries rose by almost 80% to 15.1 million tonnes. This was the biggest annual change in food aid for some time. Emergency food aid increased by 60% to 4.8 million tonnes but most of the growth was in program food aid – it increased by 175% to 7.8 million tonnes. Since 1999 there has been a substantial decline in the provision of non-emergency food aid. Most of the reduction has been in program food aid. By 2005 it had declined to 0.9 million tonnes. Emergency relief has become the dominant form of food aid and it currently accounts for more than 60% of global aid deliveries. Cereal products account for more than 80% of the world’s food aid. About half the cereal aid is wheat and the remainder is rice and coarse grains. In 1999 wheat aid increased by 5.3 million tonnes. It remained at relatively high levels in the following two years but has subsequently declined. The supply of rice aid has followed a similar pattern. There was a large increase in 1998 when aid volumes almost doubled to 1.4 million tonnes. It remained at relatively high levels in subsequent years with a further period of growth evident in 2002 and 2003. The fluctuations in wheat and rice aid were largely driven by the effects of industry support policies in some donor countries. For example, the high levels of wheat aid in the 1999-2001 period coincided with global trading conditions of low prices and high government stocks. In recent years the reduced levels of aid have coincided with low stocks and high prices. Dairy products are another commodity where the changes in aid flows have been driven by the effects of industry support policies in some major donor countries. During the 1999-2000 period there was a substantial increase in dairy product food aid. It remained at relatively high levels for several years before declining in 2005. Food aid supplied as dairy products is mostly composed of skim milk powder (SMP). The increased aid flows in the 1999-2000 period coincided with global trading conditions of low prices and rising public stocks in the US and EU. High public stocks of SMP from price support activities were a continuing feature of both markets in subsequent years:
• changes in SMP aid were driven by market conditions in the donor countries rather than a response to the needs of recipient countries.
The US is the world’s largest supplier of food aid. In 2005 the US accounted for almost half of the global supply of food aid and the EU contributed around 18%. Japan and Canada were smaller though significant providers of food aid. The dramatic rise in food aid in 1999 was largely driven by increased cereal aid from the US and the EU:
• in 1999 US food aid increased 140% and EU aid increased by 90%; • US cereal aid increased by 5 million tonnes and EU aid increased by 1.6 million tonnes.

ix
The expansion in US cereal aid was not a one-off event. In the four years from 1999 to 2002 US cereal aid was double the amount provided over the preceding four years. The increase is apparent when compared with the 15% reduction in EU aid flows in the same period. It reflects US efforts to promote extra external outflows of wheat at a time when domestic market conditions were under pressure. To some extent Japan also contributed to the growth in cereal aid. In 1998 Japan’s cereal aid increased by 0.8 million tonnes and in 2001 it increased by 0.5 million tonnes. It reflected Japanese efforts to promote external outflows of rice to relieve the domestic market pressures of surplus production. The higher levels of non-cereal aid in the 1999-2002 period were mostly supplied by the US. US non-cereal aid was 80% higher in the 1999-2002 period in comparison to the previous four year period. Dairy products contributed to the increase as the US promoted extra outflows of SMP to support domestic returns. US SMP aid increased substantially in the late 1990’s and remained at relatively high levels for several years.
Aims/Objectives The objective of this report is to examine the concerns about the use of food aid as a form of export assistance. It is a worthwhile exercise in light of moves to incorporate some controls on the use of food aid in the Doha trade negotiations. The aim is to review global developments in food aid since the UR Agreement on Agriculture was implemented in 1995:
• a particular focus of the review is to examine the trade distorting effects of food aid in the context of industry support measures in donor countries.
Methods used This study will focus on claims that food aid is equivalent to targeted export subsidies. In particular it will examine the use of food aid in the context of WTO agricultural trade reforms. The uncontrolled use of food aid has the potential to weaken the benefits of trade related liberalisation measures that may be achieved in other areas of the Doha WTO negotiations. The scope of the analysis will be constrained by the availability of information on the quantity and distribution of food aid for individual products. It focuses on wheat, rice and SMP as examples of the way food aid is distributed in global commodity markets. The major developed economies supply most of the global food aid and in some cases these products gain significant levels of assistance from government support policies.
The report provides an overview of global food aid in terms of products, the major donors and the distribution of aid. The main source of information is the World Food Program (WFP) supplemented by reports prepared by the WTO and the Food and Agricultural Organisation (FAO). The US is the world’s largest supplier of food aid and has several aid programs. The study briefly examines the procurement and distribution conditions of the US programs to highlight the different ways food aid is dispersed in recipient countries.
Results/Key findings One of the trade related concerns about the use of food aid is the objectives of donor countries. A needs based approach to the provision of aid would see a targeted flow of commodities that matched up with the consumption preferences of the final recipients. But the evidence suggests fluctuations in food aid have often involved surplus disposals by the donor countries. Most of the aid involves cereal products such as wheat, rice and coarse grains. During periods of low grain prices and/or high stocks the level of food aid has increased. When prices are high and/or stocks
x
are limited the volume of aid has declined. This approach to the use of food aid has not altered since the UR Agreement on Agriculture was implemented. For some donors the provision of food aid has more to do with promoting extra external outflows of products when the need arises. It is apparent that some donors use food aid as a form of indirect price support at times of high supplies on the domestic market. For some commodities fluctuations in food aid are directly linked to production surpluses created by industry support policies in donor countries. Examples of the use of food aid by particular donors were examined for three commodities – wheat and SMP from the US and rice from Japan. In each case the increased food aid was not driven by some pressing needs in the recipient countries. It was based on a need to:
• support market returns; and/or • dispose of surplus output that affected the sustainability of support policies.
For example, surplus output at a time of highly competitive export conditions was a catalyst for increased US wheat aid in the late 1990s. It helped to relieve some of the pressure on market returns created by direct assistance to the wheat industry. Japanese rice aid shows a clear link to the supply situation in the domestic market. In selected years food aid was increased to help reduce public stocks of rice. The supply pressures were created by market access opportunities from the UR Agreement on Agriculture, a lack of alternative export assistance measures and high levels of support for the domestic industry. US SMP aid is also clearly linked to market support activities. It was used with subsidised exports to dispose of surplus output created by the domestic price support scheme. Food aid has been a form of export assistance for SMP for many years. It was used to relieve the supply pressures that developed when WTO restrictions on subsidised exports were fully utilised in the late 1990s. In each case the donors took advantage of the lack of WTO restrictions on the use of food aid. The aim of the Doha trade negotiations is to reduce trade distortions caused by subsidised exports, domestic support and market access restrictions. If food aid continues to be used in this way it will reduce the pressure for supply adjustments in supported industries that will flow from WTO trade reforms:
• there is a need for WTO disciplines on the use of food aid because of the potential to weaken the benefits of trade liberalisation measures in other areas.
In recent times aid provided for emergency relief has expanded. It increased substantially in 1999 and has remained at relatively high levels ever since. There are concerns about the legitimacy of some of this aid and how donors classify their aid transactions. The definition of what constitutes emergency relief is a relatively loose concept. There is no internationally accepted definition of emergency situations and aid donors are free to interpret the concept as they wish. The emphasis on emergency aid looks unusual because previously it has fluctuated around lower levels. It appears to be driven by the high levels of US food aid since 1999 – food aid from the EU, Canada and Australia declined over this period. Non-emergency food aid was an issue in the preliminary discussions on export assistance policies for the Doha trade talks. This may have encouraged some donors to classify more of their aid as emergency relief:
• WTO disciplines on the use of food aid will be ineffective if the declaration process for an emergency is not tightly defined and independently assessed.
Recent trends in US wheat aid provide a useful example. Disaggregating US wheat aid into emergency and non-emergency assistance was not possible. But about 75% of the wheat aid is channelled through a program called PL480 Title 2. This program is used for emergency relief efforts and aid shipments have been increasing in recent years. It suggests there may have been a conscious decision to favour this program at the expense of others.

xi
In recent times the US has had a policy of reducing concessional food aid sales and donations for surplus disposal purposes. Wheat provided under programs that offer these types of aid has fallen. Favourable market conditions have limited US domestic concerns about this policy. But political pressure to use food aid for surplus disposals will re-emerge if market conditions deteriorate.
Implications for relevant stakeholders Circumstances can arise where food and other form of assistance are necessary on welfare grounds. Short term emergencies caused by natural or man-made disasters can severely disrupt normal food supplies. There may also be occasions where individuals need temporary assistance because they don’t have the cash or farming resources to meet their basic food needs. Food aid would seem a logical response to help people with an apparent food consumption deficiency. But a lot of food aid is provided in ways that has market distortion effects in the recipient countries. Only short term aid for real emergencies will have minimal distortion affects that can be ignored on humanitarian grounds:
• market distortions are created with monetised food aid and with donated aid that becomes a replacement for commercial purchases;
• monetised aid is donated food that is sold in the recipient country to raise funds for other aid development activities.
It is often claimed that monetisation of food aid helps disadvantaged people by making food more affordable through the increased commercial availability. But using food aid to lower market prices is a crude, highly distortionary policy response. Monetised food aid is not a targeted form of assistance. All consumers, including the wealthy, gain a benefit from the lower prices – those in most need may still be unable to buy food even at lower prices. Monetisation is also justified by the activities that are funded by the proceeds. This could be a targeted food distribution program or technical projects to improve farm performance and/or remove constraints on rural development. These are worthy objectives from a foreign aid perspective but the obvious question is why cash assistance is not used in the first place. Monetisation is an inefficient, high cost way of providing development assistance. Direct funding with cash assistance is more efficient. It eliminates the costs of administration, procurement, shipping, handling and distribution of food aid. More funds would be available for projects that promote agricultural development in the recipient country. Technical assistance to encourage the growth and development of rural industries is the key to sustainable reductions in malnutrition and hunger. It is also a critical factor in alleviating rural poverty along with global trade reforms and infrastructure investment. In general food aid is a distortionary form of assistance that works against the achievement of these objectives. The price received for commercial sales plays an important role in the transition from semi-subsistence agriculture to a more commercial approach. It drives the incentive for change and farm performance improvements. Monetisation and distributed aid that reduces the demand for local output will stifle this incentive. It undermines efforts to improve food security by reducing farm returns. Food security would be enhanced by improving the productive capacity of domestic farmers. This can be encouraged by directly funding projects aimed at productivity improvements and gains in farm performance. Selling food aid and lowering domestic prices is a disincentive to expand farm output. If targeted food aid is necessary the best approach is to provide cash for food purchases from a convenient source of supply. It is a more flexible form of assistance and allows the aid to be matched

xii
up with the dietary preferences of recipients. It can lead to more timely distributions by avoiding logistical delays that often arise with tied food aid. In general much of the world’s food aid will have some sort of trade distorting affect because it is directed into food deficit countries. It is an alternative source of food supplies and in most cases commercial imports are already helping to address the deficit. A review of two US food aid commodities – wheat and SMP – showed a lot of the aid was directed to countries where commercial imports were already contributing to the nation’s food supplies. Aid distributed to people in need can have a trade displacement effect if it ‘leaks’ into the market place or it’s used as a replacement for commercial purchases. The effectiveness of the targeting conditions is a key consideration. To be non-distorting the food aid needs to be fully consumed by those who have no capacity to purchase an equivalent amount of food. Monetised aid that is sold in competition with commercially priced imports and/or domestic output has a direct distortionary affect. Recent developments in US wheat and SMP food aid were examined to illustrate how this food is distributed in the recipient countries. In both cases the aid was mostly directed into countries where a commercial trade was established. USDA announcements for the programs they administered show most of the aid was monetised which is the most distortionary form of food aid assistance for recipient countries.
Recommendations Donors will take advantage of the absence of WTO disciplines on the use of food aid if there are domestic market pressures created by surplus output. The Doha negotiations are aiming to reduce the trade distortions caused by other trade related support policies. WTO disciplines on the use of food aid are necessary because of the potential to weaken the benefits of trade liberalisation in other areas. A WTO agreement will need to ensure humanitarian relief for legitimate emergencies is still provided. It will also need to allow for effectively targeted, short term assistance to people suffering from severe food consumption deficits. The disciplines should apply to all distributors of food aid – donor country governments, NGOs and international organisations. To minimise the market distorting effects of food aid the following reforms are necessary:
• Specification of a set of principles for declaring an emergency situation. • Nomination of an international organisation to make declarations of emergency situations • Estimation of the emergency relief needs and monitor the effectiveness of aid distribution. • Limitation of the total amount of emergency aid to the estimated relief needs and require all
donors to have their emergency aid approved by the organisation. • Elimination of food aid provided as concessional loans or include it as a component of
current WTO constraints on subsidised exports where they exist. • Elimination of monetised food aid and replace it with untied cash assistance for
development projects or untied distributed food aid with effective targeting conditions. • Limitations placed on the distribution of non-emergency food aid to target groups that meet
eligibility conditions which reflect the objective of minimising market distortion effects. • Requirement for nominated international organisation to assess and approve non-emergency
food aid and to monitor the impact on market conditions in the recipient countries. • Requirement of donors to notify the organisation of all non-emergency food aid and cash
assistance for the purchase of extra food supplies. • Elimination of non-emergency food aid for commodities that benefit from industry support
policies.
1
1. Introduction The WTO Agreement on Agriculture was an important outcome of the Uruguay Round (UR) of multilateral trade negotiations. The Agreement introduced rules on market access, domestic support and export measures. These rules were adopted to reduce the distortions in world trade caused by high levels of government support for agricultural commodities. Throughout the 1980s agricultural commodity markets were characterised by low prices for traded products. In many countries import protection and assistance for domestic producers encouraged higher output. To relieve the pressure on domestic prices and stock holdings, export subsidies were used to transfer some of the surplus output onto the world market. One the major benefits of the WTO Agreement was the introduction of commitments to limit the use of export subsidies. Expenditure and volume caps were imposed and progressively reduced over the implementation period – 6 years for developed economies and 10 years for developing economies. While the export subsidy constraints were an important step forward other export assistance measures were left unconstrained. Concessional credit and food aid are alternative ways of promoting exports and relieving the pressure on highly supported domestic markets. Since the Agreement was implemented some countries have raised new concerns about the use of these alternative measures. For some commodities export credits and food aid can reduce the effectiveness of export subsidy constraints and have a distortionary effect on world trade.
Food aid as a form of export assistance The Doha Round of WTO trade negotiations are expected to introduce further constraints on the use of export subsidies. It could even reach agreement on the elimination of this form of assistance. If an agreement is reached the use of these alternative export assistance measures will affect the prospects for improved global trading conditions. Discussions on the negotiation modalities have included an exchange of views on the need to impose disciplines on the use of alternative export measures. Food aid is a potential outlet for surplus output that could have the same trade distortion effect as an explicit export subsidy. Products donated free of charge or sold on highly concessional terms are equivalent to offering a large subsidy on exports to particular destinations. Several issues have been raised about the provision of food aid. There are concerns it may be used to circumvent future constraints on export subsidies. This could be achieved by expanding food aid programs. A further area of concern is that it could be used for ad-hoc donations to relieve pricing pressures in periods of over supply or a build-up in government stocks. There are also concerns about the way food aid has been used in the past – before and after the UR Agreement on Agriculture was implemented. Issues raised include:
• food aid increased after the export subsidy constraints were introduced; • some countries ‘disguise’ subsidised exports as food aid; • food aid has displaced commercial import sales; • the sale of food aid has reduced farm incomes in recipient countries by lowering internal
market prices; and • food aid is undermining efforts to improve food security in recipient countries.
In general the concerns about food aid tend to focus on distribution rather than procurement. For example, the US provides food aid through sales under concessional credit terms and as donations that

2
can be sold in the recipient country. But an issue that is often over-looked is the ‘tied’ procurement of food aid commodities where there are links to market support policies in the donor country:
• most food aid is ‘tied aid’ sourced from the domestic industries of donor countries. An investigation of the use of food aid as an export assistance measure has to consider the welfare and equity considerations of humanitarian relief efforts. Unexpected disruptions to food supplies will arise from time to time in emergency situations. Food aid for situations that could lead to the loss of human life is generally accepted as a legitimate form of assistance driven by social welfare considerations. The issue of export assistance is generally raised in the context of non-emergency aid. But there is an overriding concern that food aid is simply being used to relieve pricing pressures caused by surplus output in donor countries. The effect on global market conditions is much the same as the effect of subsidised exports. Trade distorting effects occur through reduced commercial sales and lower prices, production and farm incomes in price responsive exporting countries:
• a particular concern is that some donor countries are transferring the production and price instability of their market support systems onto other countries.
The impact of food aid on commodity markets in recipient countries is the other major source of concern. Like subsidised exports, food aid is often targeted at particular markets. If the recipient country is linked to world trade, the food aid may adversely affect local industries:
• commercially priced imports from other suppliers could decline; • the demand for domestic output may be reduced causing the industry to either contract or
divert product into alternative market outlets. The targets for food aid are usually developing countries where rural poverty is an issue. The aid may be used to assist those in poverty or facing emergency situations. But the release or sale of food aid on the local market can be detrimental to the financial position of farmers supplying the same or a substitute product. The destabilising effect on market prices can disrupt industry development and the prospects for rural poverty alleviation. Rural industry development is an important aspect of raising living standard in developing countries. The transition from semi-subsistence agriculture to commercially focused farming is regarded as the best way to reduce rural poverty. It raises some important questions about the way assistance for food consumption is dispersed in the recipient country:
• can food donations be distributed to those in need without affecting the poverty alleviation goals of other assistance programs?
• is financial assistance for food purchases a preferable approach to use?
Project objective The objective of this report is to examine the major concerns about the use of food aid as a form of export assistance. It is a worthwhile exercise in light of moves to incorporate some controls on the use of food aid in the Doha trade negotiations. The aim is to review global developments in food aid since the UR Agreement on Agriculture was implemented in 1995:
• a particular focus of the review is to examine the trade distorting effects of food aid in the context of industry support measures in donor countries.
The objective of the Doha WTO negotiations on agriculture is to gain agreements that will liberalise trade. There is a focus on reducing distortions in world trade through:
• the elimination of export subsidies;

3
• increasing market access opportunities; and • reductions in domestic support that leads to trade related production distortions.
The elimination of export subsidies is important because it stops the displacement effect of an export assistance measure. But most importantly it removes a safety valve for the production enhancing effects of domestic support policies in the major developed economies. Ad-hoc disposals of public stocks that were accumulated to support industry returns has been a major distortion in world trade for some commodities. Food aid is generally considered to be a way for the developed economies to dispose of production surpluses (FAO 2005a). This study will focus on claims that food aid is equivalent to targeted export subsidies. In particular it will examine the use of food aid in the context of WTO agricultural trade reforms. The unrestricted use of food aid has the potential to weaken trade related liberalisation measures in other areas:
• disciplines on export subsidies; • reductions in the trade distorting effects of domestic support; and • market access gains in highly protected industries.
The scope of the analysis will be constrained by the availability of information on the quantity and distribution of food aid for individual products. The key question is the use of food aid as a form of export assistance. In the period since the UR Agreement on Agriculture was implemented this issue has been raised in the context of:
• the extensive use of cereal food aid such as wheat, rice and coarse grains; and • the ad-hoc provision of US skim milk powder (SMP) as food aid.
An economic analysis of all food aid products is beyond the scope of this study. Instead the report will focus on wheat, rice and SMP as examples of the way food aid is distributed in global commodity markets. The major developed economies supply most of the global food aid and in some cases these products gain significant levels of assistance from government support policies. Understanding the operational aspects of food aid programs is important for judging if it has an effect equivalent to subsidised exports. The US is the world’s largest supplier of food aid and has several aid programs. The study briefly examines the procurement and distribution conditions of the US programs to highlight the different ways food aid is dispersed in recipient countries. The report will provide an overview of global food aid in terms of products, the major donors and the distribution of aid. The main source of information is the World Food Program (WFP) supplemented by reports prepared by the WTO and the Food and Agricultural Organisation (FAO). Time series data from the WFP is used because it provides cross country comparisons and allows for distinctions in the types of aid.

4
5
2. An overview of global food aid The standard reason for providing food aid is to relieve human suffering from malnutrition or food shortages in recipient countries. It is not the only way to address these issues but many perceive it to be a generous and obvious way to help disadvantaged people. The perceived need for food aid is reinforced by regular public presentations from the FAO, the WFP and non-government organisations (NGOs) on food market developments in developing countries. Short term emergencies such as natural disasters, armed conflicts or crop failures often require the immediate provision of food aid for humanitarian reasons. There can also be situations of persistent food shortages caused by economic or physical constraints. In most cases the problem is concentrated on particular groups of disadvantaged people who are reportedly unable to secure enough food to meet their basic nutritional requirements. Food aid does play a vital humanitarian role in meeting the requirements for sustaining human life in emergency situations. But a large amount of food aid is provided for other reasons including perceived shortages in the supply of basic commodities. There are long standing concerns about the distortionary effect of food aid on world trade and industry development in the recipient countries. In examining these issues we need to establish an overall picture of the world’s food aid activities.
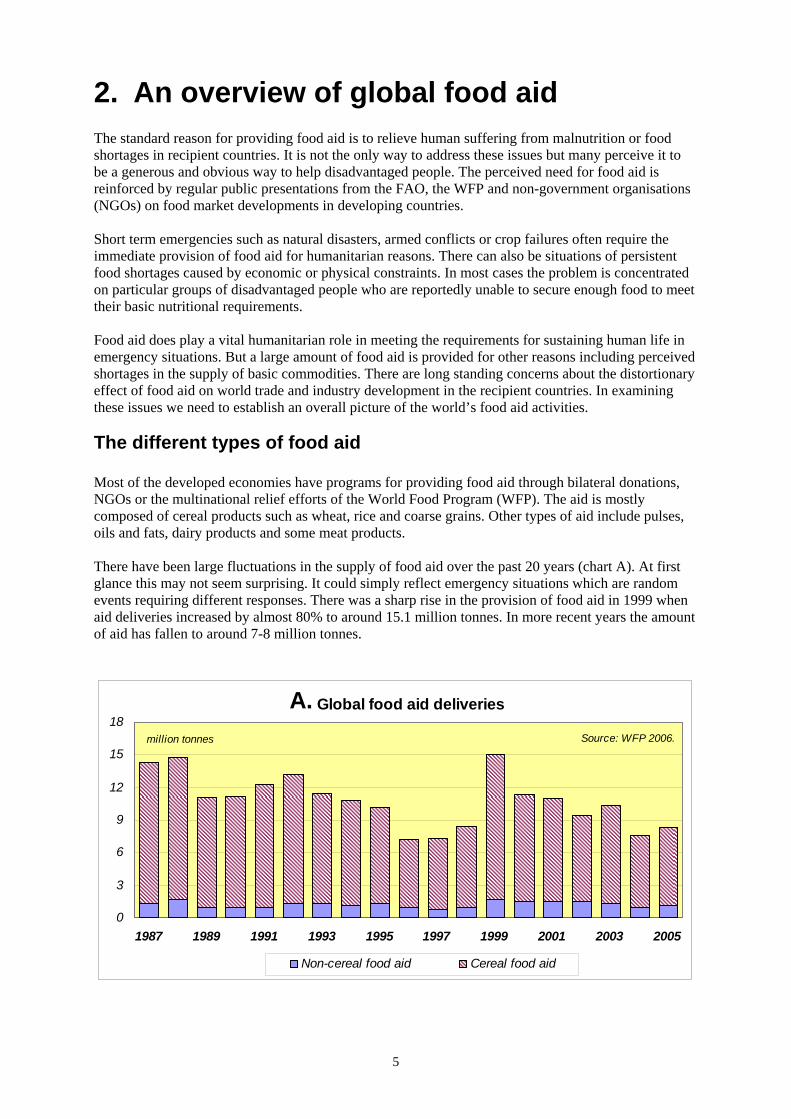
The different types of food aid Most of the developed economies have programs for providing food aid through bilateral donations, NGOs or the multinational relief efforts of the World Food Program (WFP). The aid is mostly composed of cereal products such as wheat, rice and coarse grains. Other types of aid include pulses, oils and fats, dairy products and some meat products. There have been large fluctuations in the supply of food aid over the past 20 years (chart A). At first glance this may not seem surprising. It could simply reflect emergency situations which are random events requiring different responses. There was a sharp rise in the provision of food aid in 1999 when aid deliveries increased by almost 80% to around 15.1 million tonnes. In more recent years the amount of aid has fallen to around 7-8 million tonnes.
A. Global food aid deliveries
0
3
6
9
12
15
18
1987 1989 1991 1993 1995 1997 1999 2001 2003 2005
Source: WFP 2006.million tonnes
Non-cereal food aid Cereal food aid
6
1. Categories of food aid #
Total
'000 tonnes % share '000 tonnes % share '000 tonnes % share '000 tonnes
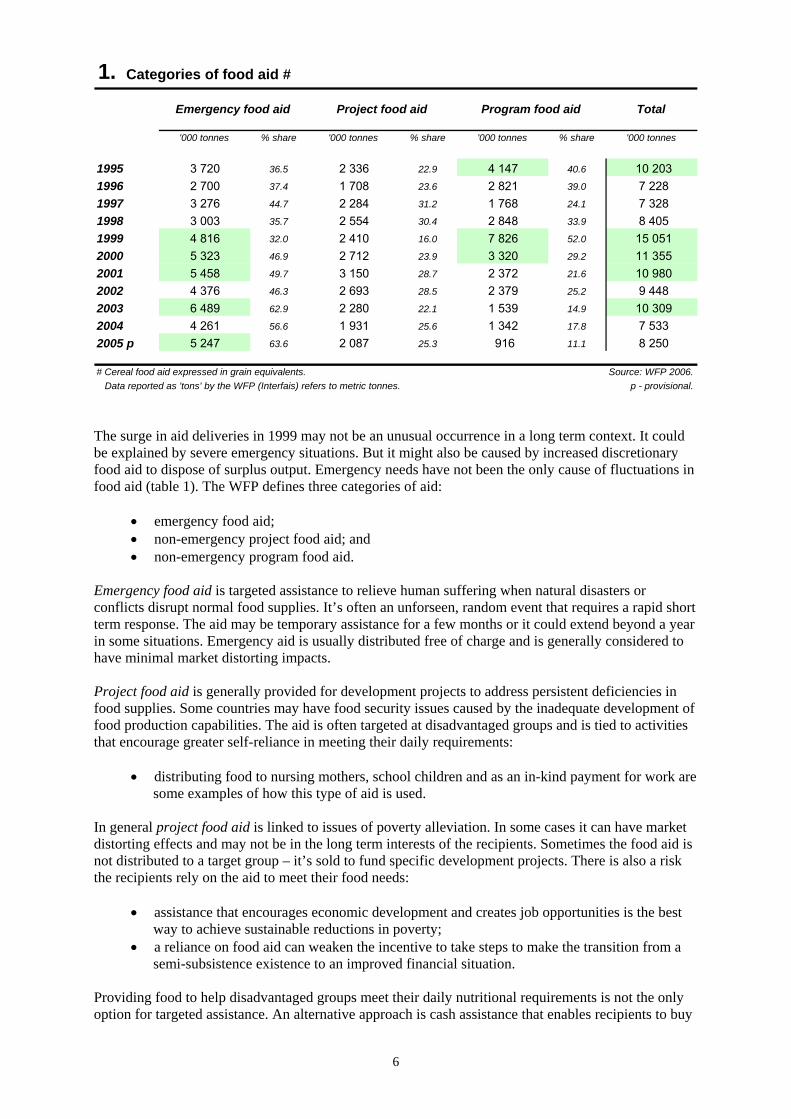
1995 3 720 36.5 2 336 22.9 4 147 40.6 10 2031996 2 700 37.4 1 708 23.6 2 821 39.0 7 2281997 3 276 44.7 2 284 31.2 1 768 24.1 7 3281998 3 003 35.7 2 554 30.4 2 848 33.9 8 4051999 4 816 32.0 2 410 16.0 7 826 52.0 15 0512000 5 323 46.9 2 712 23.9 3 320 29.2 11 3552001 5 458 49.7 3 150 28.7 2 372 21.6 10 9802002 4 376 46.3 2 693 28.5 2 379 25.2 9 4482003 6 489 62.9 2 280 22.1 1 539 14.9 10 3092004 4 261 56.6 1 931 25.6 1 342 17.8 7 5332005 p 5 247 63.6 2 087 25.3 916 11.1 8 250
# Cereal food aid expressed in grain equivalents. Source: WFP 2006. Data reported as 'tons' by the WFP (Interfais) refers to metric tonnes. p - provisional.
Emergency food aid Project food aid Program food aid
The surge in aid deliveries in 1999 may not be an unusual occurrence in a long term context. It could be explained by severe emergency situations. But it might also be caused by increased discretionary food aid to dispose of surplus output. Emergency needs have not been the only cause of fluctuations in food aid (table 1). The WFP defines three categories of aid:
• emergency food aid; • non-emergency project food aid; and • non-emergency program food aid.
Emergency food aid is targeted assistance to relieve human suffering when natural disasters or conflicts disrupt normal food supplies. It’s often an unforseen, random event that requires a rapid short term response. The aid may be temporary assistance for a few months or it could extend beyond a year in some situations. Emergency aid is usually distributed free of charge and is generally considered to have minimal market distorting impacts. Project food aid is generally provided for development projects to address persistent deficiencies in food supplies. Some countries may have food security issues caused by the inadequate development of food production capabilities. The aid is often targeted at disadvantaged groups and is tied to activities that encourage greater self-reliance in meeting their daily requirements:
• distributing food to nursing mothers, school children and as an in-kind payment for work are some examples of how this type of aid is used.
In general project food aid is linked to issues of poverty alleviation. In some cases it can have market distorting effects and may not be in the long term interests of the recipients. Sometimes the food aid is not distributed to a target group – it’s sold to fund specific development projects. There is also a risk the recipients rely on the aid to meet their food needs:
• assistance that encourages economic development and creates job opportunities is the best way to achieve sustainable reductions in poverty;
• a reliance on food aid can weaken the incentive to take steps to make the transition from a semi-subsistence existence to an improved financial situation.
Providing food to help disadvantaged groups meet their daily nutritional requirements is not the only option for targeted assistance. An alternative approach is cash assistance that enables recipients to buy

7
more food. Selling food aid in the recipient country reduces the demand for local produce. This can have displacement effect that leads to lower prices for farmers and undermines the efforts of other aid measures to reduce rural poverty. Program food aid is provided to disadvantaged countries to help alleviate balance of payments difficulties or budget constraints. It’s generally provided to recipient country governments and is sold to raise revenue. The aid is not targeted at a particular group and it is considered the most distorting form of food aid. Selling program food aid on the local market has the same market distorting effects as the sale of project food aid to fund development projects. The process is called ‘monetisation’ and it disrupts the efforts of farmers to improve their financial position. If the proceeds are used for other aid activities it raises the question of why cash aid was not provided in the first place:
• program food aid provided on an ad-hoc basis creates instability in the local market that can be detrimental for longer term industry development.
Recent changes in non-emergency food aid Emergency assistance currently accounts for more than 60% of global aid deliveries (table 1). Project food aid contributes around 25% and the remainder is provided as program food aid. In recent times the respective contributions have changed significantly and questions have been raised about the way donor countries are classifying their aid transactions. In 1999 total food aid deliveries were 15.1 million tonnes, an increase of almost 80% on the previous year. Emergency aid was higher but most of the increase was due to a big rise in program food aid. The increase in both categories of aid suggests the food aid was used as an export assistance measure by some donor countries:
• in 1999 emergency food aid increased by about 60% to 4.8 million tonnes; • program food aid was 7.8 million tonnes, an increase of 175%.
One of the reasons for the large increase in program food aid was the financial crisis that emerged in the Russian Federation in the late 1990s. Russia experienced balance of payment difficulties and the US provided a large food aid package (USDA 1999). It is an example of how some food aid has the same distortionary effects as other export assistance measures. The aid was provided on a government-to-government basis and it involved the sale of several commodities on concessionary terms (AFFA 1998). The sale conditions included a repayment period of up to 20 years with a 5 year grace period. Interest was charged at a rate of 2% that was well below commercial rates at that time. The package included:
• 1,300 kt of cereal products including 200 kt of wheat and100 kt of rice; • 30 kt of skim milk powder (SMP); and • 170 kt of meat products.
To raise revenue and reduce the balance of payment difficulties the food aid was monetised. There would have been market distortion affects in Russia because for each commodity the food aid increased the total supply in the commercial market place. There would have been downward pressure on the prices of domestic output because the ‘subsidised’ imports were a highly substitutable alternative source of supply. The aid was effectively a one-off, subsidised export sale. It cost less than commercially priced imports and it would have had some trade distorting effects. Russia was an importer of the commodities in the aid package. The monetised aid would have reduced the demand for commercially priced imports:

8
• the displacement effect increases the availability of commercial exports for other markets and puts downward pressure on world prices.
This displacement effect is equivalent to the impact of an export subsidy. The availability of either subsidised imports or food aid does not necessarily generate extra consumption equal to size of the subsidised trade flow. A subsidy lowers the price paid by importers and purchasing preferences will change if there is no pricing adjustment for commercial imports:
• unsubsidised imports decline which limits the consumption expansion effect; • the ‘subsidy’ could increase the overall level of imports if the pricing adjustment on
domestic output is passed on to the final consumer; • but the effect is often limited as the overall demand for food commodities is generally not
highly responsive to changes in price. When the food aid was sold on the Russian market, it would have reduced farm returns for some commodities. The extent of the impact would depend on the existence of policy support arrangements. If there were no price support arrangements, the monetised aid would have reduced returns and discouraged domestic production:
• the resulting short term market disruption highlights the way ad-hoc program food aid can increase price instability in the recipient country.
From the perspective of the donor country, this type of aid can help to strengthen domestic prices or relieve supply pressures generated by market support arrangements. For example, the US had support policies in place for products such as wheat and SMP. In the late 1990s, US market conditions for both products were under some pressure:
• wheat stocks were rising and had reached 25.7 million tonnes at the start of 1999-00 season, the highest stock levels since the mid-1980s;
• wheat prices had declined to a ten year low of around US$93 per tonne; • export subsidy constraints on SMP were fully utilised in 1999-00 and Government stock
holdings were rapidly growing. Since 1999 there has been a substantial reduction in the global supply on non-emergency food aid. Project food aid has declined but most of the reduction has been in program food aid. It declined from 7.8 million tonnes in 1999 to 0.9 million tonnes in 2005. Over the same time period emergency food aid has increased:
• emergency food aid is now the major component of global food aid supplies (table 1). The decline in non-emergency aid could reflect a classification issue. Some donors may be assigning more of their food aid to the emergency relief category. The basis for declaring aid as emergency relief needs further investigation. Traditionally it has referred to the disruptions in food supplies that occur in disaster situations. But it appears the interpretation has become broader than this and is not limited to these sorts of situations:
• emergency aid is sometimes assigned to situations of emerging food deficiencies; • definitional rules will be an important issue for the Doha trade negotiations if effective
disciplines are to be imposed on the use of food aid. A framework for negotiating disciplines on food aid in the Doha Round of trade negotiations was established in August 2004. The agreed objective was to prevent food aid from displacing commercial trade (WTO 2006c). But there was also a commitment to:
• maintain an adequate level of food aid; • take into account the interests of food aid recipients; and

9
• ensure the disciplines do not unintentionally restrict food aid provided for emergency situations.
The third of these commitments is a critical aspect of the negotiations. If emergency aid is to be treated differently from non-emergency aid a set of unambiguous, definitional rules will be required. It will also require an appropriate international organisation to assess and declare that an emergency situation exists and then to monitor the aid flows. The disciplines will be ineffective if the declaration process is not tightly defined and independently assessed.
Commodities supplied as food aid Food aid for disadvantaged people may seem reasonable from a social and equity perspective. But the economic impact on industry developments in the recipient country must be considered. Food aid that is sold or released into the domestic market of a recipient country is an expansion in supply of a highly substitutable product. The suggestion that local market prices will be unaffected is not consistent with basic economic principles. There are ‘legitimate’ emergencies where food aid will have a minimal distortion affect on the local market. Short term targeted aid for a severe food shortage caused by a flood or a drought will probably have little impact on commercial trade. This will be the case if there is no ‘leakage’ of food aid into the commercial market place from recipients converting their aid into cash:
• people with no cash reserves to purchase food will probably consume the aid and there will be no displacement affect on commercial sales of domestic output.
In most other situations food aid will have a distortion affect in the recipient country. Several factors influence the extent to which food aid will affect commercial outcomes. The products supplied are a key consideration. Other factors include the duration of assistance, targeting mechanisms, the leakage of distributed aid and monetisation sales in the commercial market. The other issue that needs to be considered is the impact on foreign trade. There may be displacement effects on commercial imports that will have spill over effects on world trade and commodity prices. The availability of low priced or donated food aid will affect the demand for imports. If the aid is a substitute for commercially priced imports, the effect is equivalent to a country specific export subsidy by the donor country. The distortionary effect of food aid on global commodity markets and the recipient countries will vary according to the types of products involved. The effect on recipient countries will depend on domestic market conditions for local produce that can substitute for the food aid:
• substitution relationships are important because food aid is not always composed of products that traditionally form the basis of the national diet.
The major donors mostly provide ‘tied’ food aid drawn from their domestic agricultural output. It is often claimed the aid has more to do with the disposal of surplus supplies (FAO 2005a). This claim is hard to refute if the aid comes from a highly supported industry. It means food aid does not necessarily take account of consumption preferences in recipient countries.

10
2. Global food aid in cereal products #
'000 tonnes '000 tonnes '000 tonnes '000 tonnes '000 tonnes change
1995 5 347 1 898 1 158 463 8 865 ..
1996 3 763 1 374 766 353 6 256 -2 609
1997 3 779 1 531 736 446 6 491 235
1998 3 992 1 494 1 435 455 7 377 885
1999 9 335 2 427 1 132 477 13 371 5 994
2000 5 824 2 291 1 228 472 9 815 -3 556
2001 5 548 2 084 1 363 461 9 456 - 359
2002 4 332 1 731 1 418 479 7 961 -1 496
2003 5 034 1 973 1 457 513 8 977 1 016
2004 3 249 1 733 1 134 466 6 583 -2 394
2005 p 3 613 1 732 1 223 523 7 091 508
# Cereal food aid expressed in grain equivalents. Source: WFP 2006. Data reported as 'tons' by the WFP (Interfais) refers to metric tonnes. p - provisional.
TotalWheat Coarse grains OtherRice
The composition of food aid is determined by product availability and market developments in the donor countries because it is mostly composed of tied aid. But this does not preclude the aid from affecting market outcomes in the recipient country:
• the aid can still have a substitution effect on the demand for imports and domestic output of the product that is traditionally preferred;
• the alternative approach of providing financial assistance to purchase food products that suit consumer preferences is not widely utilised.
It is worthwhile examining recent trends in the main commodities used as food aid. Over the past 15 years cereal products have accounted for over 80% of global food aid. This is not surprising as the dietary intake of most recipient countries is based on commodities like wheat or rice. Fluctuations in global food aid reflect changes in the amount of cereal aid. Non-cereal aid also fluctuates but the contribution to the supply of food aid is much smaller:
• cereal food aid increased by 6 million tonnes in 1999 – a rise of more than 80%; • non-cereal aid increased by 0.7 million tonnes – a rise of 63%; • the 1999 levels of aid were the highest for some time – 13.4 million tonnes of cereals and
1.7 million tonnes of non-cereal products. Wheat has consistently been the largest component of cereal food aid. In recent times it has accounted for about half of the cereal aid (table 2). Coarse grains and rice were the other major items of cereal aid with contributions of around 24% and 17% respectively. Over the past 10 years changes in the amount of wheat and coarse grain aid have followed a similar pattern. There was a large increase in 1999 followed by relatively high levels of aid in the following two years. Since that time the aid flows have declined. The change in the supply of rice food aid has followed a different pattern. After two years of relatively low levels of aid, there was a substantial increase in 1998. The amount of aid almost doubled to 1.4 million tonnes. In subsequent years the flow of aid remained at relatively high levels further growth evident in the 2001-2003 period.
11
3. World wheat production, price and closing stocks #
Stocks-to-use
Crop year million tonnes change million tonnes change % $US/t % change
1995-96 538 .. 155 .. 28.6 207 ..
1996-97 583 45 164 9 29.1 160 -23
1997-98 610 27 197 33 34.2 126 -21
1998-99 590 -20 208 11 36.0 112 -12
1999-00 586 -4 209 1 35.9 116 4
2000-01 582 -4 207 -2 35.5 129 11
2001-02 581 0 202 -4 34.6 150 17
2002-03 568 -13 166 -36 27.5 149 -1
2003-04 555 -13 132 -34 22.7 158 6
2004-05 p 629 74 150 18 24.6 155 -2
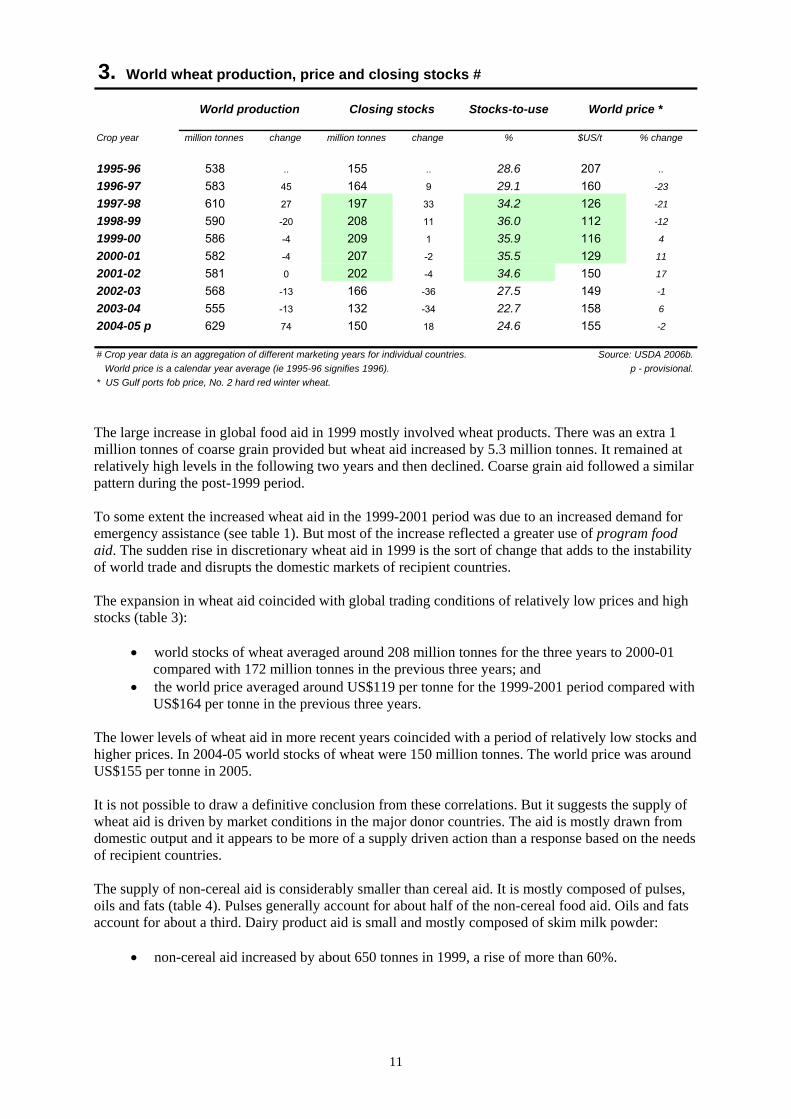
# Crop year data is an aggregation of different marketing years for individual countries. Source: USDA 2006b. World price is a calendar year average (ie 1995-96 signifies 1996). p - provisional.* US Gulf ports fob price, No. 2 hard red winter wheat.
Closing stocks World price *World production
The large increase in global food aid in 1999 mostly involved wheat products. There was an extra 1 million tonnes of coarse grain provided but wheat aid increased by 5.3 million tonnes. It remained at relatively high levels in the following two years and then declined. Coarse grain aid followed a similar pattern during the post-1999 period. To some extent the increased wheat aid in the 1999-2001 period was due to an increased demand for emergency assistance (see table 1). But most of the increase reflected a greater use of program food aid. The sudden rise in discretionary wheat aid in 1999 is the sort of change that adds to the instability of world trade and disrupts the domestic markets of recipient countries. The expansion in wheat aid coincided with global trading conditions of relatively low prices and high stocks (table 3):
• world stocks of wheat averaged around 208 million tonnes for the three years to 2000-01 compared with 172 million tonnes in the previous three years; and
• the world price averaged around US$119 per tonne for the 1999-2001 period compared with US$164 per tonne in the previous three years.
The lower levels of wheat aid in more recent years coincided with a period of relatively low stocks and higher prices. In 2004-05 world stocks of wheat were 150 million tonnes. The world price was around US$155 per tonne in 2005. It is not possible to draw a definitive conclusion from these correlations. But it suggests the supply of wheat aid is driven by market conditions in the major donor countries. The aid is mostly drawn from domestic output and it appears to be more of a supply driven action than a response based on the needs of recipient countries. The supply of non-cereal aid is considerably smaller than cereal aid. It is mostly composed of pulses, oils and fats (table 4). Pulses generally account for about half of the non-cereal food aid. Oils and fats account for about a third. Dairy product aid is small and mostly composed of skim milk powder:
• non-cereal aid increased by about 650 tonnes in 1999, a rise of more than 60%.
12
4. Global food aid in non-cereal products #
'000 tonnes '000 tonnes '000 tonnes '000 tonnes '000 tonnes change
1995 72 323 793 150 1 338 ..
1996 37 301 514 121 972 - 366
1997 18 319 365 135 836 - 136
1998 26 359 567 76 1 028 192
1999 53 326 975 326 1 680 652
2000 99 434 821 186 1 540 - 140
2001 53 522 788 161 1 524 - 16
2002 56 479 834 117 1 487 - 37
2003 63 464 687 118 1 332 - 156
2004 63 319 472 96 950 - 382
2005 p 14 414 543 188 1 159 208
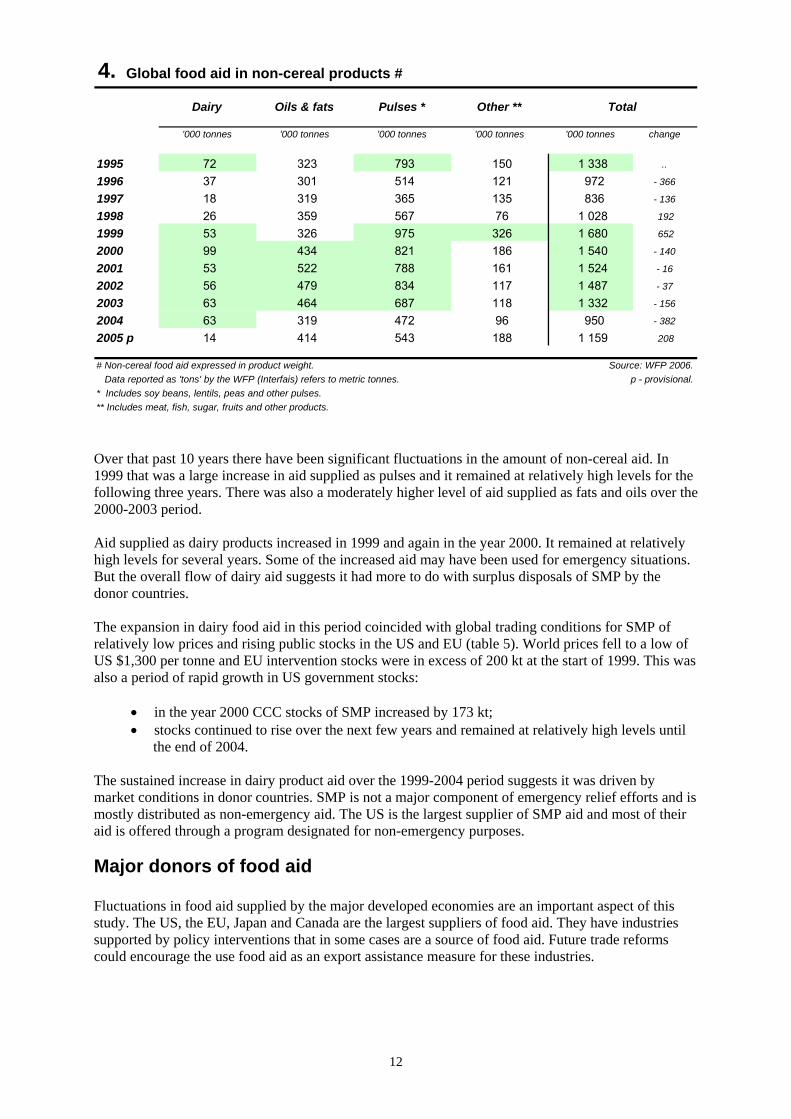
# Non-cereal food aid expressed in product weight. Source: WFP 2006. Data reported as 'tons' by the WFP (Interfais) refers to metric tonnes. p - provisional.* Includes soy beans, lentils, peas and other pulses.** Includes meat, fish, sugar, fruits and other products.
TotalDairy Oils & fats Other **Pulses *
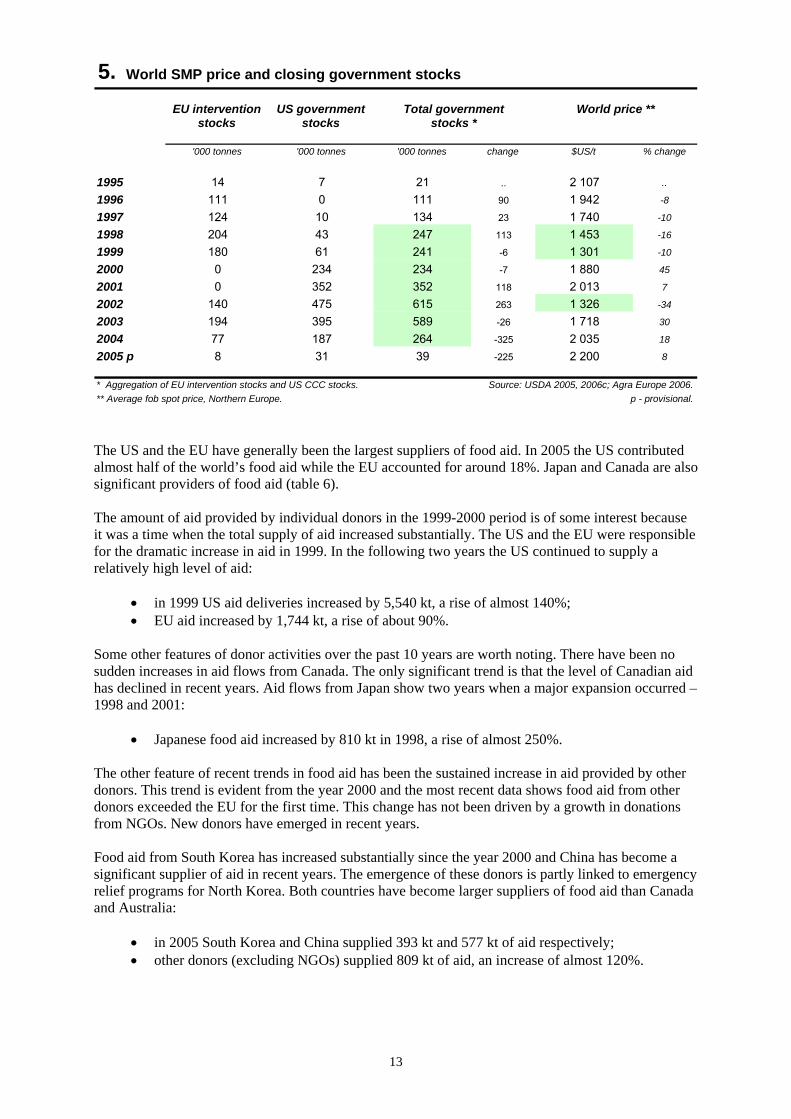
Over that past 10 years there have been significant fluctuations in the amount of non-cereal aid. In 1999 that was a large increase in aid supplied as pulses and it remained at relatively high levels for the following three years. There was also a moderately higher level of aid supplied as fats and oils over the 2000-2003 period. Aid supplied as dairy products increased in 1999 and again in the year 2000. It remained at relatively high levels for several years. Some of the increased aid may have been used for emergency situations. But the overall flow of dairy aid suggests it had more to do with surplus disposals of SMP by the donor countries. The expansion in dairy food aid in this period coincided with global trading conditions for SMP of relatively low prices and rising public stocks in the US and EU (table 5). World prices fell to a low of US $1,300 per tonne and EU intervention stocks were in excess of 200 kt at the start of 1999. This was also a period of rapid growth in US government stocks:
• in the year 2000 CCC stocks of SMP increased by 173 kt; • stocks continued to rise over the next few years and remained at relatively high levels until
the end of 2004. The sustained increase in dairy product aid over the 1999-2004 period suggests it was driven by market conditions in donor countries. SMP is not a major component of emergency relief efforts and is mostly distributed as non-emergency aid. The US is the largest supplier of SMP aid and most of their aid is offered through a program designated for non-emergency purposes.
Major donors of food aid Fluctuations in food aid supplied by the major developed economies are an important aspect of this study. The US, the EU, Japan and Canada are the largest suppliers of food aid. They have industries supported by policy interventions that in some cases are a source of food aid. Future trade reforms could encourage the use food aid as an export assistance measure for these industries.
13
5. World SMP price and closing government stocks
EU intervention US government
'000 tonnes '000 tonnes '000 tonnes change $US/t % change
1995 14 7 21 .. 2 107 ..
1996 111 0 111 90 1 942 -8
1997 124 10 134 23 1 740 -10
1998 204 43 247 113 1 453 -16
1999 180 61 241 -6 1 301 -10
2000 0 234 234 -7 1 880 45
2001 0 352 352 118 2 013 7
2002 140 475 615 263 1 326 -34
2003 194 395 589 -26 1 718 30
2004 77 187 264 -325 2 035 18
2005 p 8 31 39 -225 2 200 8
* Aggregation of EU intervention stocks and US CCC stocks. Source: USDA 2005, 2006c; Agra Europe 2006.** Average fob spot price, Northern Europe. p - provisional.
stocks *Total government World price **
stocksstocks
The US and the EU have generally been the largest suppliers of food aid. In 2005 the US contributed almost half of the world’s food aid while the EU accounted for around 18%. Japan and Canada are also significant providers of food aid (table 6). The amount of aid provided by individual donors in the 1999-2000 period is of some interest because it was a time when the total supply of aid increased substantially. The US and the EU were responsible for the dramatic increase in aid in 1999. In the following two years the US continued to supply a relatively high level of aid:
• in 1999 US aid deliveries increased by 5,540 kt, a rise of almost 140%; • EU aid increased by 1,744 kt, a rise of about 90%.
Some other features of donor activities over the past 10 years are worth noting. There have been no sudden increases in aid flows from Canada. The only significant trend is that the level of Canadian aid has declined in recent years. Aid flows from Japan show two years when a major expansion occurred – 1998 and 2001:
• Japanese food aid increased by 810 kt in 1998, a rise of almost 250%. The other feature of recent trends in food aid has been the sustained increase in aid provided by other donors. This trend is evident from the year 2000 and the most recent data shows food aid from other donors exceeded the EU for the first time. This change has not been driven by a growth in donations from NGOs. New donors have emerged in recent years. Food aid from South Korea has increased substantially since the year 2000 and China has become a significant supplier of aid in recent years. The emergence of these donors is partly linked to emergency relief programs for North Korea. Both countries have become larger suppliers of food aid than Canada and Australia:
• in 2005 South Korea and China supplied 393 kt and 577 kt of aid respectively; • other donors (excluding NGOs) supplied 809 kt of aid, an increase of almost 120%.
14
6. Major donors of food aid
'000 tonnes '000 tonnes '000 tonnes '000 tonnes '000 tonnes '000 tonnes
Cereal products *1995 3 422 3 626 874 443 178 3221996 2 637 2 316 445 303 114 4411997 2 721 1 995 322 503 351 6001998 3 339 1 734 1 117 365 284 5381999 8 356 3 342 416 427 185 6442000 5 922 1 871 476 277 258 1 0112001 5 320 1 842 930 261 157 9462002 4 870 1 197 298 153 283 1 1602003 4 745 2 008 447 217 103 1 4572004 3 509 1 303 497 164 152 9592005 p 3 440 1 193 384 202 139 1 733
Non-cereal products **1995 794 434 8 57 5 401996 531 285 12 79 3 621997 429 264 7 31 1 1051998 671 220 23 40 5 691999 1 193 356 25 18 2 862000 1 007 337 61 31 2 1012001 1 093 310 15 17 1 882002 1 071 218 26 19 1 1532003 810 306 35 51 5 1252004 570 248 25 30 9 692005 p 587 271 19 73 12 197
Total food aid1995 4 216 4 059 882 500 183 3621996 3 167 2 601 457 382 118 5031997 3 150 2 258 329 534 352 7051998 4 010 1 954 1 139 405 289 6071999 9 550 3 698 440 446 187 7312000 6 929 2 208 538 308 260 1 1132001 6 413 2 152 945 278 159 1 0342002 5 940 1 416 323 172 283 1 3132003 5 555 2 313 482 268 108 1 5832004 4 079 1 551 522 194 162 1 0282005 p 4 026 1 464 403 275 151 1 929
^ Donations by NGOs included in other donors. Source: WFP 2006.* Cereal food aid expressed in grain equivalents. p - provisional.** Includes dairy, oils & fats, pulses, meat, fish, sugar, fruits and other products.
US EU-18 Japan Canada Other ^Australia
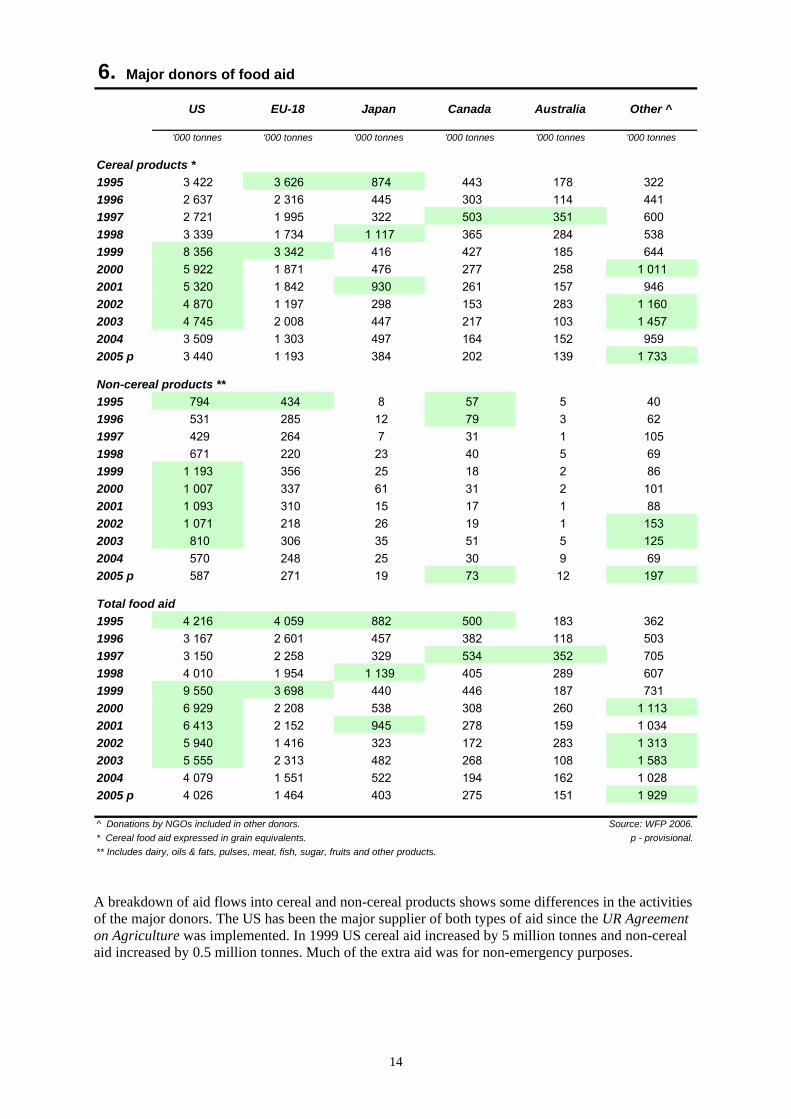
A breakdown of aid flows into cereal and non-cereal products shows some differences in the activities of the major donors. The US has been the major supplier of both types of aid since the UR Agreement on Agriculture was implemented. In 1999 US cereal aid increased by 5 million tonnes and non-cereal aid increased by 0.5 million tonnes. Much of the extra aid was for non-emergency purposes.

15
B. Cereal food aid by the major donors
0
3
6
9
12
15
1995 1996 1997 1998 1999 2000 2001 2002 2003 2004 2005
Source: WFP 2006.million tonnes
US EU-18 Other donors
The US was the major contributor to the expansion in global cereal aid in 1999 (chart B). The EU contributed an additional 1.5 million tonnes of aid and contributions from other donors declined by 0.6 million tonnes. US and EU cereal aid declined in the following year but the US continued to supply large amounts of aid until 2003:
• the US accounted for 63% of cereal aid in 1999 compared with 39% in 1995; • the EU share declined from 41% in 1995 to 25% in 1999; • by 2005 the US share was 49% and the EU share had declined to 17%.
Most of the aid provided by Canada and Japan is composed of cereal products. In general the annual variation in Canadian cereal aid has been limited in comparison to other donors. Aid supplied by Japan has been more variable with increases of 0.8 million tonnes in 1998 and 0.5 million tonnes in 2001:
• in 1998 Japan’s share of total cereal aid increased to around 15%. Cereal products also dominate the food aid from other donors such as South Korea and China. In recent times cereal aid from other sources has shown some variability. A 0.4 million tonne rise in Chinese aid in 2005 highlights the expanding presence of non-traditional donors:
• in 1999 other donors accounted for about 5% of cereal aid; • by 2005 the share had increased to 24%.
The US was the major contributor to the higher levels of non-cereal aid in the 1999-2003 period. The EU is the other major supplier of non-cereal aid and there were no unusually large increases in aid since 1995. There was a small rise in EU aid in 1999 but the change was much smaller than the increase in US aid flows:
• the US share of non-cereal aid increased from 59% in 1995 to 71% in 1999; • by 2005 the US share was around 50%.
The main feature of donor activities over the past 10 years is the expansion in US cereal and non-cereal aid since 1998. The expansion was not a one-off event. It coincided with global trading conditions for some products that included high stocks and relatively low prices.
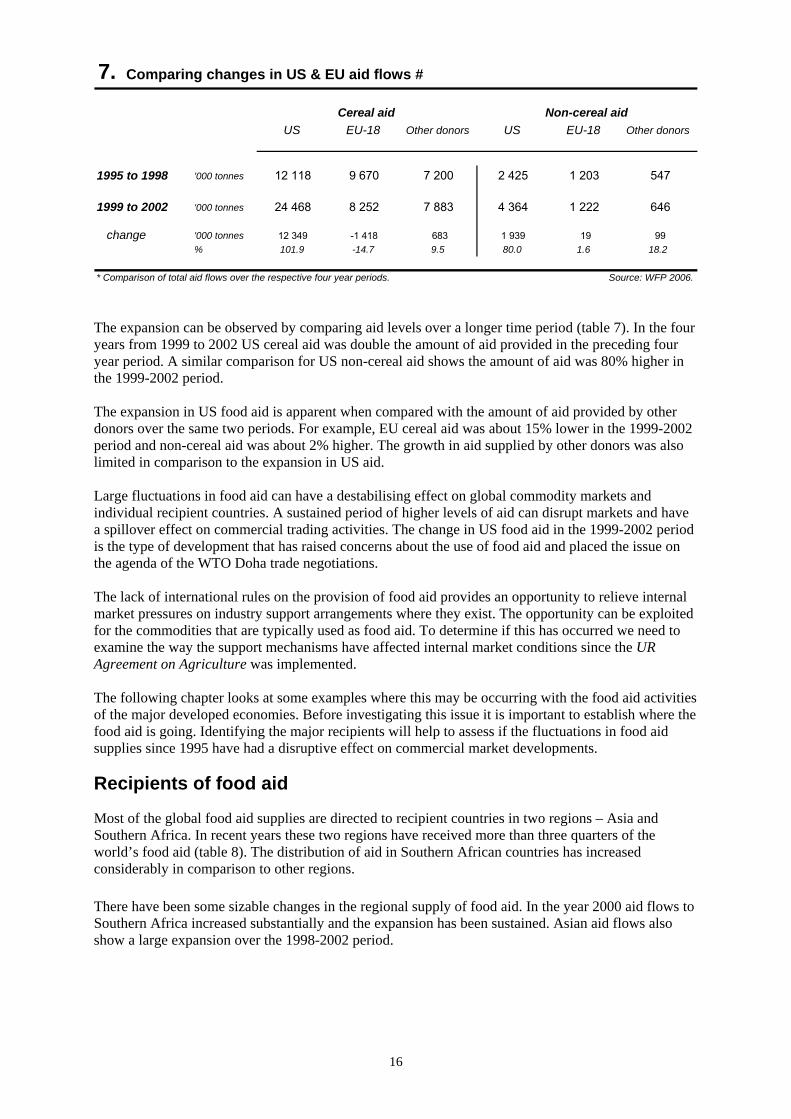
16
7. Comparing changes in US & EU aid flows #
US EU-18 Other donors US EU-18 Other donors
1995 to 1998 '000 tonnes 12 118 9 670 7 200 2 425 1 203 547
1999 to 2002 '000 tonnes 24 468 8 252 7 883 4 364 1 222 646
change '000 tonnes 12 349 -1 418 683 1 939 19 99% 101.9 -14.7 9.5 80.0 1.6 18.2
* Comparison of total aid flows over the respective four year periods. Source: WFP 2006.
Non-cereal aidCereal aid
The expansion can be observed by comparing aid levels over a longer time period (table 7). In the four years from 1999 to 2002 US cereal aid was double the amount of aid provided in the preceding four year period. A similar comparison for US non-cereal aid shows the amount of aid was 80% higher in the 1999-2002 period. The expansion in US food aid is apparent when compared with the amount of aid provided by other donors over the same two periods. For example, EU cereal aid was about 15% lower in the 1999-2002 period and non-cereal aid was about 2% higher. The growth in aid supplied by other donors was also limited in comparison to the expansion in US aid. Large fluctuations in food aid can have a destabilising effect on global commodity markets and individual recipient countries. A sustained period of higher levels of aid can disrupt markets and have a spillover effect on commercial trading activities. The change in US food aid in the 1999-2002 period is the type of development that has raised concerns about the use of food aid and placed the issue on the agenda of the WTO Doha trade negotiations. The lack of international rules on the provision of food aid provides an opportunity to relieve internal market pressures on industry support arrangements where they exist. The opportunity can be exploited for the commodities that are typically used as food aid. To determine if this has occurred we need to examine the way the support mechanisms have affected internal market conditions since the UR Agreement on Agriculture was implemented. The following chapter looks at some examples where this may be occurring with the food aid activities of the major developed economies. Before investigating this issue it is important to establish where the food aid is going. Identifying the major recipients will help to assess if the fluctuations in food aid supplies since 1995 have had a disruptive effect on commercial market developments.
Recipients of food aid
Most of the global food aid supplies are directed to recipient countries in two regions – Asia and Southern Africa. In recent years these two regions have received more than three quarters of the world’s food aid (table 8). The distribution of aid in Southern African countries has increased considerably in comparison to other regions. There have been some sizable changes in the regional supply of food aid. In the year 2000 aid flows to Southern Africa increased substantially and the expansion has been sustained. Asian aid flows also show a large expansion over the 1998-2002 period.

17
8. Regional destinations of global food aid #
'000 tonnes '000 tonnes '000 tonnes '000 tonnes '000 tonnes
Emergency aid1995 na na na na na
1996 1 606 175 569 338 121997 1 303 152 686 1 120 151998 1 515 101 407 942 381999 1 638 96 775 2 049 2572000 2 852 135 694 1 551 912001 2 374 249 684 2 035 1152002 1 886 191 341 1 899 602003 4 127 1 198 205 918 412004 2 879 273 162 895 522005 p 3 516 150 106 1 409 66
Non-emergency aid *1995 na na na na na
1996 964 393 743 1 674 7551997 1 126 220 377 1 695 6331998 1 262 269 460 2 456 9541999 1 158 393 4 679 3 048 9582000 1 159 936 1 578 1 622 7372001 1 319 649 627 2 053 8742002 1 036 504 607 1 780 1 1452003 1 234 214 507 1 462 4022004 901 349 292 1 193 5382005 p 1 096 144 213 977 573
Total food aid1995 3 299 625 2 955 2 384 9401996 2 570 568 1 312 2 012 7671997 2 429 373 1 063 2 815 6481998 2 777 370 867 3 399 9921999 2 796 490 5 454 5 097 1 2152000 4 012 1 070 2 272 3 173 8282001 3 693 898 1 311 4 088 9902002 2 922 696 948 3 679 1 2042003 5 361 1 412 713 2 380 4432004 3 780 622 454 2 088 5902005 p 4 612 294 319 2 386 639
# Includes cereal food aid expressed in grain equivalents. Source: WFP 2006.* Aggregation of program food aid and project food aid p - provisional.
LatinAfrica North Africa & CIS America
Southern Middle East & Eastern Europe Asia
The 1999-2003 period was a time of increased food aid deliveries. The expansion in aid was mostly directed into three regions. There was a large increase in aid to Eastern Europe and the CIS in 1999. Shipments increased from 0.9 million tonnes to 5.5 million tonnes and then declined in subsequent years. The Asian and Southern African regions also received larger quantities of aid in this period.
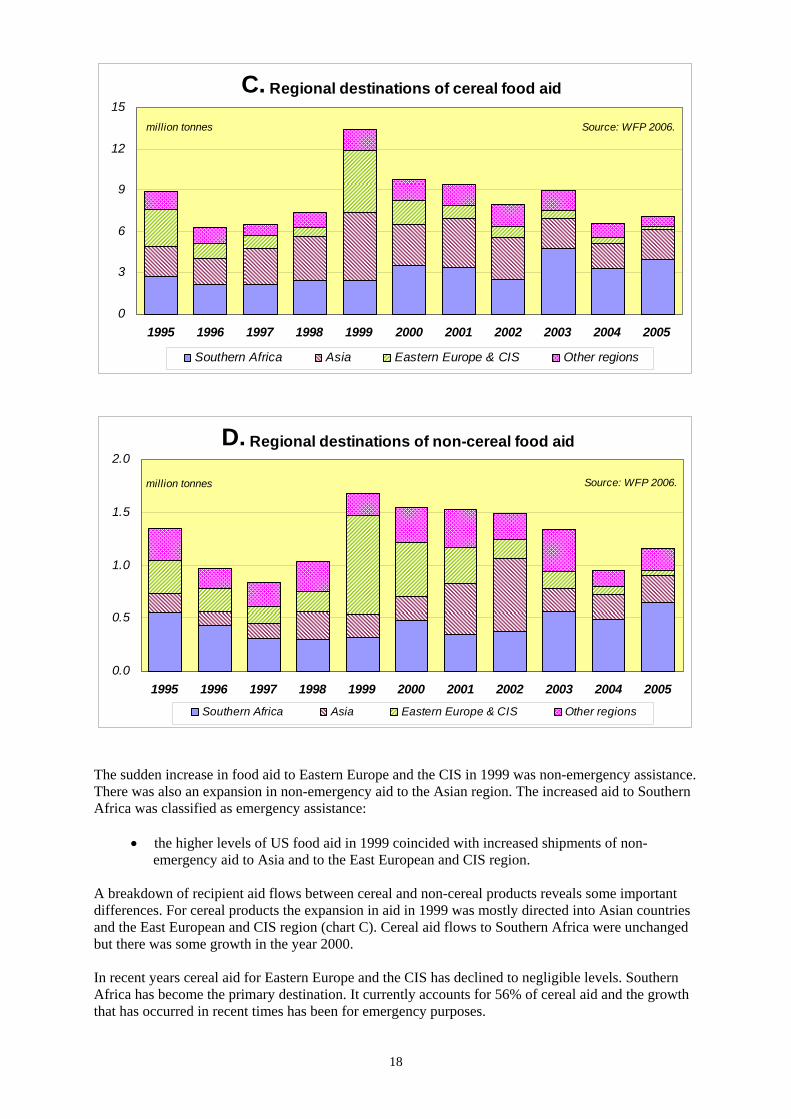
18
C. Regional destinations of cereal food aid
0
3
6
9
12
15
1995 1996 1997 1998 1999 2000 2001 2002 2003 2004 2005
Source: WFP 2006.million tonnes
Southern Africa Asia Eastern Europe & CIS Other regions
D. Regional destinations of non-cereal food aid
0.0
0.5
1.0
1.5
2.0
1995 1996 1997 1998 1999 2000 2001 2002 2003 2004 2005
Source: WFP 2006.million tonnes
Southern Africa Asia Eastern Europe & CIS Other regions
The sudden increase in food aid to Eastern Europe and the CIS in 1999 was non-emergency assistance. There was also an expansion in non-emergency aid to the Asian region. The increased aid to Southern Africa was classified as emergency assistance:
• the higher levels of US food aid in 1999 coincided with increased shipments of non-emergency aid to Asia and to the East European and CIS region.
A breakdown of recipient aid flows between cereal and non-cereal products reveals some important differences. For cereal products the expansion in aid in 1999 was mostly directed into Asian countries and the East European and CIS region (chart C). Cereal aid flows to Southern Africa were unchanged but there was some growth in the year 2000. In recent years cereal aid for Eastern Europe and the CIS has declined to negligible levels. Southern Africa has become the primary destination. It currently accounts for 56% of cereal aid and the growth that has occurred in recent times has been for emergency purposes.

19
For non-cereal products there have been some sizeable changes in regional aid flows (chart D). The initial expansion in non-cereal aid in 1999 was directed to the East European and CIS region. There was very little change in deliveries to Southern African and Asian destinations. In the 2000-2002 period non-cereal aid for the East European and CIS region declined. But there was an expansion in shipments to Asia and other regions. The Asian region accounted for 46% of the global supply of non-cereal aid in 2002. In more recent times Southern Africa has become the largest destination for non-cereal aid:
• it received for more than half of the global supply of non-cereal food aid in 2005. There are two points worth noting from this review of food aid recipients. The large increase in non-emergency aid that occurred in the 1999-2000 period was directed to Asia and the East European and CIS regions. The second point is the increased aid flows to Southern Africa that has occurred in recent years. The expansion in food aid to Southern Africa has been designated as emergency assistance. It again raises the question of how donor countries classify their aid transactions. It also raises questions about the potential market distortion effects from some of the emergency aid:
• in the 2003-2005 period three quarters of the aid directed to Southern Africa has been for emergency assistance.
Emergency aid is generally interpreted as a term that describes assistance for severe food shortages caused by unexpected events. A common interpretation would be short term aid over a few months for a man-made or natural disaster. It would probably also include aid over several months for a longer term event such as a widespread crop failure. A wider interpretation of emergency situations to include non-discrete events such as lengthy periods of poor seasonal conditions is a contentious issue. This type of situation could be used to justify the provision of emergency food aid over several years. But it will have implications for commercial trade and longer term development of the domestic industry:
• this type of situation would normally lead to reduced production, higher prices for domestic producers and increased demand for imports;
• if emergency aid is not effectively targeted it can distort these market signals which would encourage higher domestic output in subsequent seasons.
The definition of an ‘inadequate food supply’ situation is a subjective judgement. Short term food aid for situations that threaten the loss of human life has a limited distortion effect on market outcomes. If emergency aid is being used for less dramatic events such as an emerging deficiency in food supplies it is likely to have a greater distortionary effect.
• the sustained high level of emergency aid for Southern Africa in recent years could reflect a shift in towards addressing issues of food security and periods of reduced food supplies;
• it highlights a need for the Doha trade negotiations to address definitional issues, the process for assessing emergency situations and the monitoring of aid flows.

20

21
3. Food aid and market support There is a widespread view that food aid has more to do with the disposal of surplus output than addressing needs of recipient countries. Fluctuations in non-emergency aid are used as evidence that it is a form of export assistance to relieve domestic pricing pressures in periods of over supply. But concerns about the use of food aid are also relevant to some components of emergency aid. In many respects the provision of food aid is equivalent to use of export subsidies. The size of the subsidy varies from 100% for donations through to smaller amounts if the aid is provided on concessionary credit terms. There are no WTO rules constraining the use of food aid and there are concerns about the potential to circumvent future constraints on export subsidies. One of the gains from export subsidy restrictions is to reduce the trade distorting effects of industry support arrangements. The major developed economies have support policies for some commodities. From time to time they generate production surpluses. Excess output has been sold on to the world market with the assistance of export subsidies. Food aid is another way to relieve internal market pressures on these arrangements where they exist. The opportunity can be exploited for commodities that are typically used as food aid. In the past there increased supplies of food aid have coincided with high stock levels and low prices for products that have industry support arrangements. Some of the increased output generated by these policies has been used for food aid.
Food aid and trade related market support policies Claims about the misuse of food aid are linked to the way domestic support policies affect market conditions in the major developed economies. Three products typically supplied as food aid are wheat, rice and SMP. Trade policies that support returns for these products are a relevant issue in the use of food aid. Tariff-quota (TQ) import restrictions and export subsidy programs were in place in several markets when the supply of food aid expanded during the 1999-2001 period (table 9). 9. Trade related market support for selected food aid products #
US EU Japan Canada
Wheat Supplied as food aidSubsidised exports not used not used
TQ imports
Rice Supplied as food aidSubsidised exports not used
TQ imports
SMP Supplied as food aid **Subsidised exportsTQ imports prohibitive tariff
# Reflects the use of trade policy measures over the three years 1999 to 2001. Source: WTO Notifications.* Canadian shipments of coarse grain food aid were insignificant in the 1999-2001 period.** EU shipments of SMP food aid were insignificant except in the 1999-00 marketing year. WTO notifications show the EU had export subsidy programs operating for both wheat and rice at this time. The issue of using food aid to circumvent export subsidy constraints depends on the utilisation

22
rate. During this period the EU fully utilised their export subsidy limits for rice but the situation was different for wheat exports:
• EU export subsidy constraints for wheat was fully utilised in the 1999-00 marketing year but the utilisation rate was around 83% in 1998-99 and 71% in 2000-01.
The other major donors did not subsidise exports of rice and wheat during this period. Japan has no WTO allowances for subsidised exports. Canada and the US have allowances but they were not utilised. There was no pressure from binding export subsidy constraints for either country to use food aid as an alternative form of export assistance. But it raises the question of how donor countries define food aid. TQ import restrictions are relevant because of the potential to use food aid as a compensating out-flow of product. A TQ is generally associated with a highly protected market. The aim of the UR Agreement on Agriculture was to provide greater opportunities for imports to gain market share in the importing country. But as imports put downward pressure on the prices of domestic output it can encourage a greater use of food aid to provide some indirect price support. This is especially relevant in situations where there is no allowance for subsidised exports or there are WTO constraints that are fully utilised. The EU and Japan have TQ access for rice and wheat. Japan’s TQ access for rice and wheat was fully utilised during the 1999-2001 period. The TQ access for EU rice imports was also fully utilised during this period. Trade policies are also relevant for skim milk powder aid. The US, EU and Canada had export subsidy programs for SMP during the 1999-2001 period. Japan had no WTO allowance for subsidised exports and did not supply SMP for food aid. Canada’s export subsidy constraint was fully utilised but it did not provide any SMP as food aid. WTO notifications show the US fully utilised their export subsidy constraints on SMP during this period. They also show the US provided significant quantities of SMP food aid around this time. The EU made full use of their export subsidy constraint in the 1999-00 marketing year and provided a sizeable quantity of food aid. In 1998-99 and 2000-01 EU export subsidy constraints were under-utilised and very little SMP was provided as food aid:
• in some years subsidised SMP exports exceeded the annual constraint level as the US and the EU utilised their unused allowances from previous years.
The EU and US have TQ access for SMP imports. In both cases the TQ access was under-utilised during the 1999-2001 period but significant quantities of imports entered the respective markets. In general the WTO notifications suggest SMP food aid from the US and the EU was linked to the way trade policies were affecting internal market conditions.
Food aid and subsidised exports If the provision of food aid is equivalent to use of export subsidies it is important to consider the extent of the potential trade distortion. A comparison of food aid and subsidised exports by the major developed economies puts the issue in perspective. Subsided wheat exports are much larger than the volume of wheat aid (table 10). But the key point is food aid increases the amount of wheat supplied to the world market on non-commercial terms:
• food aid lowers the world price of wheat when it displaces commercial sales.
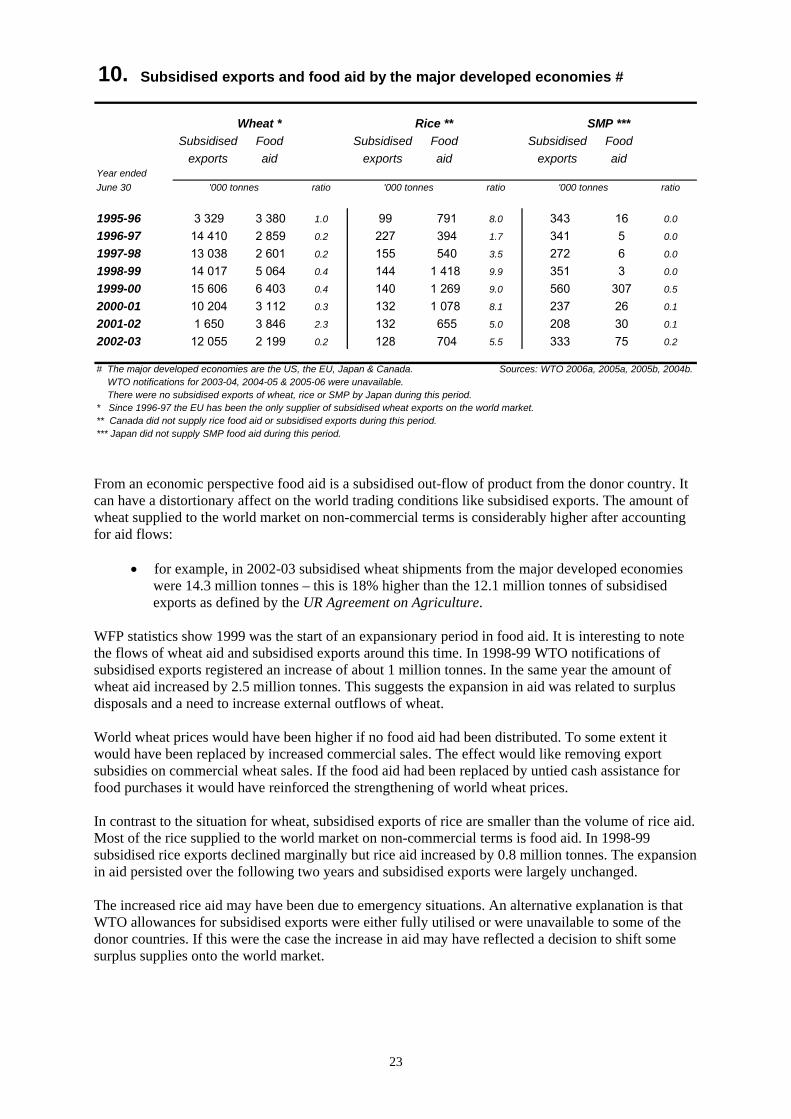
23
10. Subsidised exports and food aid by the major developed economies #
Subsidised Food Subsidised Food Subsidised Foodexports aid exports aid exports aid
Year endedJune 30 ratio ratio ratio
1995-96 3 329 3 380 1.0 99 791 8.0 343 16 0.0
1996-97 14 410 2 859 0.2 227 394 1.7 341 5 0.0
1997-98 13 038 2 601 0.2 155 540 3.5 272 6 0.0
1998-99 14 017 5 064 0.4 144 1 418 9.9 351 3 0.0
1999-00 15 606 6 403 0.4 140 1 269 9.0 560 307 0.5
2000-01 10 204 3 112 0.3 132 1 078 8.1 237 26 0.1
2001-02 1 650 3 846 2.3 132 655 5.0 208 30 0.1
2002-03 12 055 2 199 0.2 128 704 5.5 333 75 0.2
# The major developed economies are the US, the EU, Japan & Canada. Sources: WTO 2006a, 2005a, 2005b, 2004b. WTO notifications for 2003-04, 2004-05 & 2005-06 were unavailable. There were no subsidised exports of wheat, rice or SMP by Japan during this period.* Since 1996-97 the EU has been the only supplier of subsidised wheat exports on the world market.** Canada did not supply rice food aid or subsidised exports during this period.*** Japan did not supply SMP food aid during this period.
Wheat * Rice ** SMP ***
'000 tonnes '000 tonnes '000 tonnes
From an economic perspective food aid is a subsidised out-flow of product from the donor country. It can have a distortionary affect on the world trading conditions like subsidised exports. The amount of wheat supplied to the world market on non-commercial terms is considerably higher after accounting for aid flows:
• for example, in 2002-03 subsidised wheat shipments from the major developed economies were 14.3 million tonnes – this is 18% higher than the 12.1 million tonnes of subsidised exports as defined by the UR Agreement on Agriculture.
WFP statistics show 1999 was the start of an expansionary period in food aid. It is interesting to note the flows of wheat aid and subsidised exports around this time. In 1998-99 WTO notifications of subsidised exports registered an increase of about 1 million tonnes. In the same year the amount of wheat aid increased by 2.5 million tonnes. This suggests the expansion in aid was related to surplus disposals and a need to increase external outflows of wheat. World wheat prices would have been higher if no food aid had been distributed. To some extent it would have been replaced by increased commercial sales. The effect would like removing export subsidies on commercial wheat sales. If the food aid had been replaced by untied cash assistance for food purchases it would have reinforced the strengthening of world wheat prices. In contrast to the situation for wheat, subsidised exports of rice are smaller than the volume of rice aid. Most of the rice supplied to the world market on non-commercial terms is food aid. In 1998-99 subsidised rice exports declined marginally but rice aid increased by 0.8 million tonnes. The expansion in aid persisted over the following two years and subsidised exports were largely unchanged. The increased rice aid may have been due to emergency situations. An alternative explanation is that WTO allowances for subsidised exports were either fully utilised or were unavailable to some of the donor countries. If this were the case the increase in aid may have reflected a decision to shift some surplus supplies onto the world market.
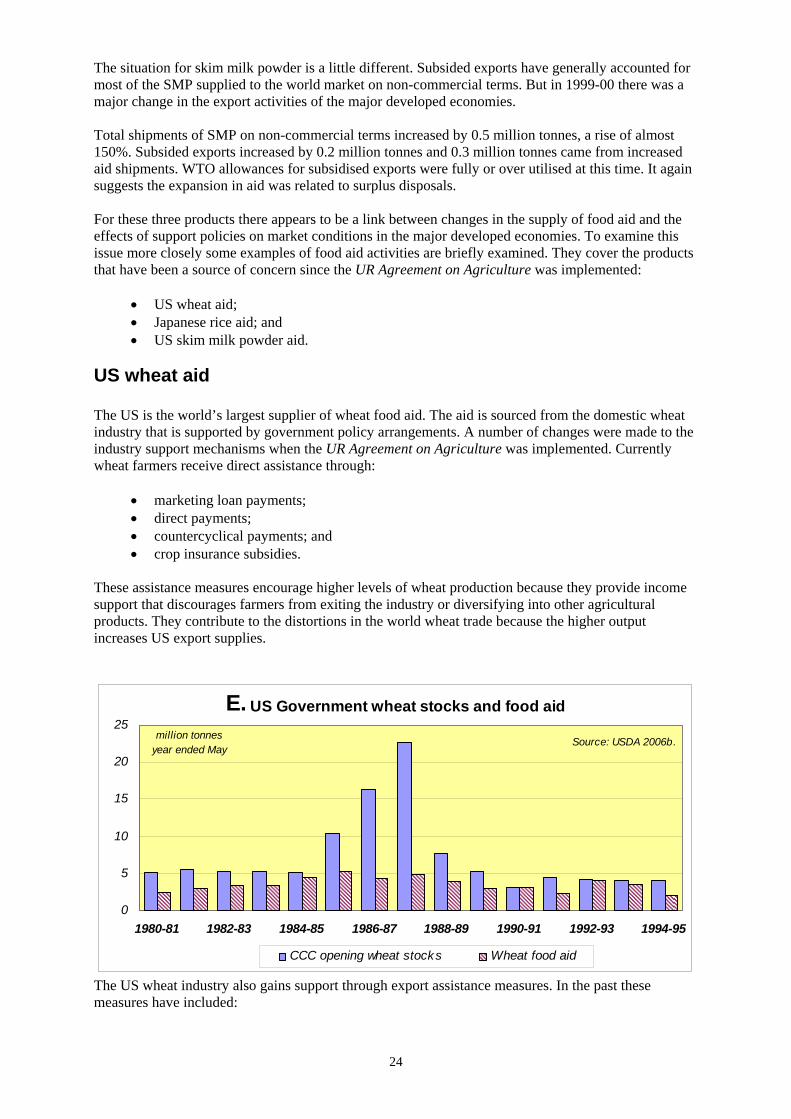
24
The situation for skim milk powder is a little different. Subsided exports have generally accounted for most of the SMP supplied to the world market on non-commercial terms. But in 1999-00 there was a major change in the export activities of the major developed economies. Total shipments of SMP on non-commercial terms increased by 0.5 million tonnes, a rise of almost 150%. Subsided exports increased by 0.2 million tonnes and 0.3 million tonnes came from increased aid shipments. WTO allowances for subsidised exports were fully or over utilised at this time. It again suggests the expansion in aid was related to surplus disposals. For these three products there appears to be a link between changes in the supply of food aid and the effects of support policies on market conditions in the major developed economies. To examine this issue more closely some examples of food aid activities are briefly examined. They cover the products that have been a source of concern since the UR Agreement on Agriculture was implemented:
• US wheat aid; • Japanese rice aid; and • US skim milk powder aid.
US wheat aid The US is the world’s largest supplier of wheat food aid. The aid is sourced from the domestic wheat industry that is supported by government policy arrangements. A number of changes were made to the industry support mechanisms when the UR Agreement on Agriculture was implemented. Currently wheat farmers receive direct assistance through:
• marketing loan payments; • direct payments; • countercyclical payments; and • crop insurance subsidies.
These assistance measures encourage higher levels of wheat production because they provide income support that discourages farmers from exiting the industry or diversifying into other agricultural products. They contribute to the distortions in the world wheat trade because the higher output increases US export supplies.
E. US Government wheat stocks and food aid
0
5
10
15
20
25
1980-81 1982-83 1984-85 1986-87 1988-89 1990-91 1992-93 1994-95
Source: USDA 2006b.million tonnesyear ended May
CCC opening wheat stocks Wheat food aid
The US wheat industry also gains support through export assistance measures. In the past these measures have included:

25
• export subsidies; • export credits; and • food aid programs.
Two forms of government interventions have particular relevance for the issue of wheat food aid - Government purchases of domestic output and subsidised exports. The US used these interventions to help support domestic wheat prices before the UR Agreement on Agriculture was implemented. From the mid 1980s they were an important aspect of market support. At certain times government purchases resulted in large stocks of wheat. They were held by the Commodity Credit Corporation (CCC). At the same time a substantial amount of US wheat exports received subsidies through the Export Enhancement Program (EEP):
• in 1987-88 CCC stocks of wheat reached a peak of 22.6 million tonnes; • around 60% of US wheat exports received EEP assistance.
During this time the US distributed large amounts of wheat food aid onto the world market. Much of the aid was drawn from CCC stocks. There was an obvious link between the amount of wheat aid and the market support activities. Wheat food aid expanded during periods when CCC accumulated large stocks holdings (chart E). The industry assistance measures were restructured in the mid 1990s when the UR Agreement on Agriculture was implemented. EEP sales of wheat were discontinued and CCC purchasing activities were substantially reduced. Initially there was a significant reduction in the amount of wheat aid as prices strengthened and wheat stocks declined. The US has not used its WTO allowance for subsidised wheat exports. But it has continued to provide assistance through export credits and food aid programs. Developments in the 1998-2000 period clearly show wheat aid increased when market returns were under pressure (table 11). 11. US wheat market developments
Stocks touse ratio
Crop yearended 31 May m tonnes change m tonnes change m tonnes change % $US/t % change
1995-96 1.5 .. 3.9 .. 13.8 .. 15.8 175 ..
1996-97 1.2 -0.4 3.2 -0.7 10.2 -3.6 19.3 157 -10.2
1997-98 1.7 0.6 2.5 -0.7 12.1 1.8 31.4 125 -20.6
1998-99 5.3 3.6 2.6 0.0 19.7 7.6 39.0 98 -21.3
1999-00 3.4 -1.9 3.5 0.9 25.7 6.1 39.8 93 -5.2
2000-01 3.1 -0.3 2.8 -0.7 25.8 0.1 36.6 99 6.6
2001-02 2.0 -1.1 2.6 -0.2 23.8 -2.0 36.1 103 4.3
2002-03 2.1 0.0 2.7 0.1 21.1 -2.7 25.0 136 31.6
2003-04 1.6 -0.5 1.8 -0.9 13.4 -7.8 23.2 130 -4.5
2004-05 2.1 0.5 1.7 -0.1 14.9 1.5 24.2 125 -4.2
* Food aid is fiscal year ended 30 September. Source: USDA 2006b.** Average farm price for all types of wheat.
CCC TotalFood aid * Farm price **Opening stocks
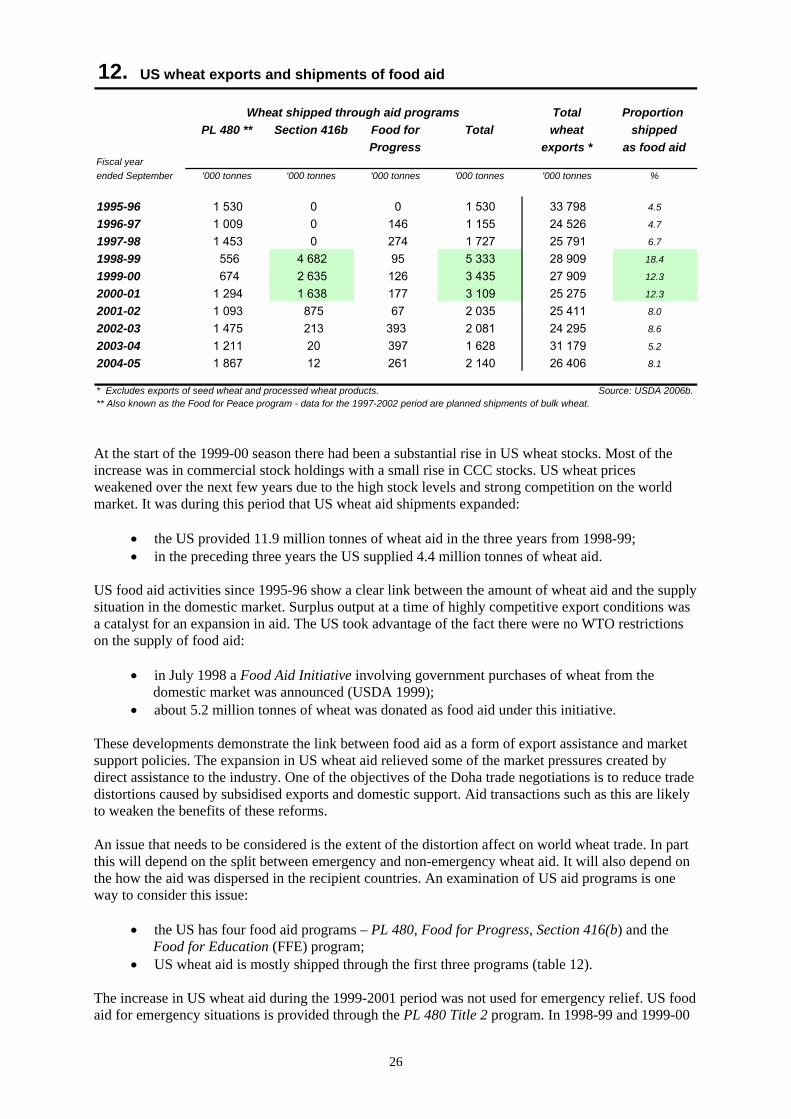
26
12. US wheat exports and shipments of food aid
Total Proportion PL 480 ** Section 416b Food for Total wheat shipped
Progress exports * as food aidFiscal yearended September '000 tonnes '000 tonnes '000 tonnes '000 tonnes '000 tonnes %
1995-96 1 530 0 0 1 530 33 798 4.5
1996-97 1 009 0 146 1 155 24 526 4.7
1997-98 1 453 0 274 1 727 25 791 6.7
1998-99 556 4 682 95 5 333 28 909 18.4
1999-00 674 2 635 126 3 435 27 909 12.3
2000-01 1 294 1 638 177 3 109 25 275 12.3
2001-02 1 093 875 67 2 035 25 411 8.0
2002-03 1 475 213 393 2 081 24 295 8.6
2003-04 1 211 20 397 1 628 31 179 5.2
2004-05 1 867 12 261 2 140 26 406 8.1
* Excludes exports of seed wheat and processed wheat products. Source: USDA 2006b.** Also known as the Food for Peace program - data for the 1997-2002 period are planned shipments of bulk wheat.
Wheat shipped through aid programs
At the start of the 1999-00 season there had been a substantial rise in US wheat stocks. Most of the increase was in commercial stock holdings with a small rise in CCC stocks. US wheat prices weakened over the next few years due to the high stock levels and strong competition on the world market. It was during this period that US wheat aid shipments expanded:
• the US provided 11.9 million tonnes of wheat aid in the three years from 1998-99; • in the preceding three years the US supplied 4.4 million tonnes of wheat aid.
US food aid activities since 1995-96 show a clear link between the amount of wheat aid and the supply situation in the domestic market. Surplus output at a time of highly competitive export conditions was a catalyst for an expansion in aid. The US took advantage of the fact there were no WTO restrictions on the supply of food aid:
• in July 1998 a Food Aid Initiative involving government purchases of wheat from the domestic market was announced (USDA 1999);
• about 5.2 million tonnes of wheat was donated as food aid under this initiative. These developments demonstrate the link between food aid as a form of export assistance and market support policies. The expansion in US wheat aid relieved some of the market pressures created by direct assistance to the industry. One of the objectives of the Doha trade negotiations is to reduce trade distortions caused by subsidised exports and domestic support. Aid transactions such as this are likely to weaken the benefits of these reforms. An issue that needs to be considered is the extent of the distortion affect on world wheat trade. In part this will depend on the split between emergency and non-emergency wheat aid. It will also depend on the how the aid was dispersed in the recipient countries. An examination of US aid programs is one way to consider this issue:
• the US has four food aid programs – PL 480, Food for Progress, Section 416(b) and the Food for Education (FFE) program;
• US wheat aid is mostly shipped through the first three programs (table 12). The increase in US wheat aid during the 1999-2001 period was not used for emergency relief. US food aid for emergency situations is provided through the PL 480 Title 2 program. In 1998-99 and 1999-00

27
the amount of wheat aid channelled through the PL 480 programs declined from earlier years. This means the expansion in wheat aid during this time was used for non-emergency purposes:
• shipments through the Food for Progress program also declined during this period; • the expansion in US wheat aid was channelled through the Section 416(b) program – there
had been no wheat aid shipments through this program in the preceding three years. About 75% of the US wheat aid was provided through the Section 416(b) program during this period. This program authorises donations of surplus commodities acquired by the CCC (USDA 2006d). It is important to note that the program allows donations to be sold in the recipient country and the proceeds used for development activities:
• Section 416(b) donations are made through agreements with foreign governments, NGOs and inter-governmental organisations such as the WFP.
Donations of wheat through Section 416(b) are provided free of charge. In effect they are a highly subsidised external outflow of wheat from the US market. For the recipient countries the acceptance of Section 416(b) wheat aid is equivalent to receiving imports supported by a generous country specific export subsidy program. It would have reduced the demand for commercial wheat imports in some recipient countries and may have been a displacement effect on a pre-existing trade:
• in some cases the distortionary effect on market signals may have prevented the emergence of a commercial import trade.
The extra wheat donated through the Section 416(b) program can only be loosely described as ‘aid’. There was no sudden need for extra wheat aid to relieve human suffering from malnutrition or food shortages - there was very little Section 416(b) wheat aid before and after the 1999-2001 period. The program is used to donate surplus commodities and CCC acquisitions are generally based on market support activities. So the wheat aid donated under the 1998 Food Aid Initiative was a surplus disposal to relieve market pressures that were created by US support policies.
Japan rice aid Japan is one of the world’s largest suppliers of rice food aid. The aid is sourced from the domestic industry which gains substantial assistance from government support polices. For many years rice farmers received a guaranteed price that was maintained by the buying and selling activities of a government authority – the MAFF Food Agency. The high level of support generated surplus output despite the availability of a program to encourage the diversion of rice land into other crops. After the UR Agreement on Agriculture was implemented the support arrangements were adjusted. The rice diversion program continued but the guaranteed price system was replaced by an income stabilisation program (Fukuda, Dyck & Stout 2003). Farmers receive a payment based on part of the difference between the market price and a specified standard price. Falling consumption and declining prices put pressure on the industry support arrangements. The buying and selling activities of the Food Agency had ceased in 1996. But the Government continued to play a role in purchasing rice to support market prices. In part this was related to a requirement for emergency stocks to cover unusual events like a crop failure:
• government stocks have regularly exceeded their target level which is currently set at 1 million tonnes (chart F).

28
F. Rice stocks in Japan
0.0
1.0
2.0
3.0
4.0
1995 1996 1997 1998 1999 2000 2001 2002 2003 2004 2005
Source: USDA 2006a.million tonnes
Public stocks, imported rice Public stocks, domestic rice Commercial stocks
In the late 1990s most of Japan’s rice stocks were government owned. To avoid disrupting the domestic market the Government found alternative ways to reduce their stocks. This included selling rice for stock feed and increased food aid. The reduction in stocks coincided with two years of unusually large shipments of rice aid in JFY 1998 and 2000 (table 13). The pressure to reduce government stocks through food aid was directly linked to the industry support policies. To support market prices the Government had to purchase rice and reduce supplies on the domestic market. The industry assistance generated surpluses despite the financial incentives to participate in the rice diversion program. Japan’s use of food aid to dispose of rice surpluses is also linked to trade policy. The industry used to be isolated from the world market. But the UR Agreement on Agriculture required the introduction of TQ access for rice imports. The Food Agency had monopoly purchasing rights on TQ imports. Imports outside the TQ are effectively prohibited by very high tariffs:
• TQ access for rice expanded from 379 kt in JFY 1995-96 to 682 kt in 2000-01; • the TQ increased the supply of rice at a time the Government had been purchasing domestic
output to support market returns. In recent years imports have become a major component of government rice stocks. There is a Cabinet Resolution that states imported rice must not disrupt the supply and demand of domestically produced rice (USDA 2006e). Some imports reach the market for table rice through the SBS importing system. But most of the imports end up as government stocks (chart F). The options for reducing the stocks of imported rice are limited. Some has been sold for stock feed and some has been released for processed products such as rice flour. The only other option is to establish an external outflow of product to compensate for rice imported under the TQ. Japan does not have a WTO allowance for subsidised rice exports. Food aid has been the only option for generating an external outflow to relieve the supply pressures. Some imports have been used as food aid but the sourcing of the aid is not especially important. The key point is that food aid has been used as stock disposal mechanism to relieve the pressure on the industry support arrangements.
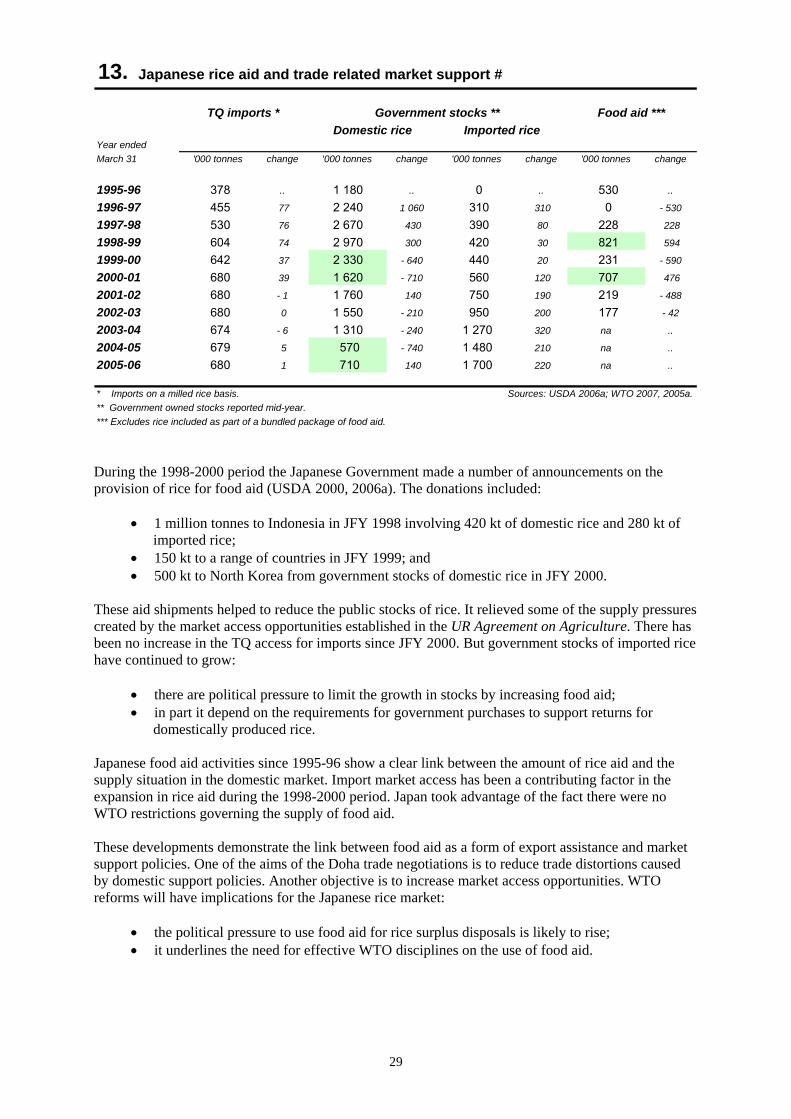
29
13. Japanese rice aid and trade related market support #
Year endedMarch 31 '000 tonnes change '000 tonnes change '000 tonnes change '000 tonnes change
1995-96 378 .. 1 180 .. 0 .. 530 ..
1996-97 455 77 2 240 1 060 310 310 0 - 530
1997-98 530 76 2 670 430 390 80 228 228
1998-99 604 74 2 970 300 420 30 821 594
1999-00 642 37 2 330 - 640 440 20 231 - 590
2000-01 680 39 1 620 - 710 560 120 707 476
2001-02 680 - 1 1 760 140 750 190 219 - 488
2002-03 680 0 1 550 - 210 950 200 177 - 42
2003-04 674 - 6 1 310 - 240 1 270 320 na ..
2004-05 679 5 570 - 740 1 480 210 na ..
2005-06 680 1 710 140 1 700 220 na ..
* Imports on a milled rice basis. Sources: USDA 2006a; WTO 2007, 2005a.** Government owned stocks reported mid-year.*** Excludes rice included as part of a bundled package of food aid.
Domestic rice Imported riceFood aid ***TQ imports * Government stocks **
During the 1998-2000 period the Japanese Government made a number of announcements on the provision of rice for food aid (USDA 2000, 2006a). The donations included:
• 1 million tonnes to Indonesia in JFY 1998 involving 420 kt of domestic rice and 280 kt of imported rice;
• 150 kt to a range of countries in JFY 1999; and • 500 kt to North Korea from government stocks of domestic rice in JFY 2000.
These aid shipments helped to reduce the public stocks of rice. It relieved some of the supply pressures created by the market access opportunities established in the UR Agreement on Agriculture. There has been no increase in the TQ access for imports since JFY 2000. But government stocks of imported rice have continued to grow:
• there are political pressure to limit the growth in stocks by increasing food aid; • in part it depend on the requirements for government purchases to support returns for
domestically produced rice. Japanese food aid activities since 1995-96 show a clear link between the amount of rice aid and the supply situation in the domestic market. Import market access has been a contributing factor in the expansion in rice aid during the 1998-2000 period. Japan took advantage of the fact there were no WTO restrictions governing the supply of food aid. These developments demonstrate the link between food aid as a form of export assistance and market support policies. One of the aims of the Doha trade negotiations is to reduce trade distortions caused by domestic support policies. Another objective is to increase market access opportunities. WTO reforms will have implications for the Japanese rice market:
• the political pressure to use food aid for rice surplus disposals is likely to rise; • it underlines the need for effective WTO disciplines on the use of food aid.
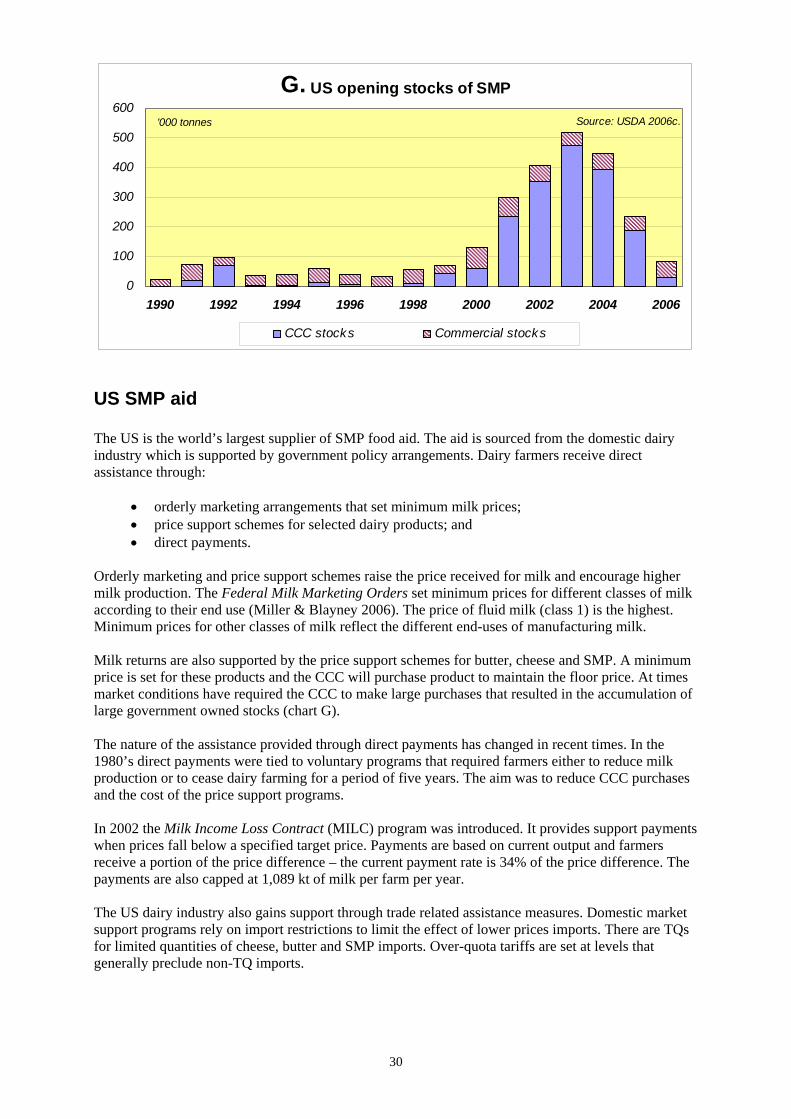
30
G. US opening stocks of SMP
0
100
200
300
400
500
600
1990 1992 1994 1996 1998 2000 2002 2004 2006
Source: USDA 2006c.'000 tonnes
CCC stocks Commercial stocks
US SMP aid The US is the world’s largest supplier of SMP food aid. The aid is sourced from the domestic dairy industry which is supported by government policy arrangements. Dairy farmers receive direct assistance through:
• orderly marketing arrangements that set minimum milk prices; • price support schemes for selected dairy products; and • direct payments.
Orderly marketing and price support schemes raise the price received for milk and encourage higher milk production. The Federal Milk Marketing Orders set minimum prices for different classes of milk according to their end use (Miller & Blayney 2006). The price of fluid milk (class 1) is the highest. Minimum prices for other classes of milk reflect the different end-uses of manufacturing milk. Milk returns are also supported by the price support schemes for butter, cheese and SMP. A minimum price is set for these products and the CCC will purchase product to maintain the floor price. At times market conditions have required the CCC to make large purchases that resulted in the accumulation of large government owned stocks (chart G). The nature of the assistance provided through direct payments has changed in recent times. In the 1980’s direct payments were tied to voluntary programs that required farmers either to reduce milk production or to cease dairy farming for a period of five years. The aim was to reduce CCC purchases and the cost of the price support programs. In 2002 the Milk Income Loss Contract (MILC) program was introduced. It provides support payments when prices fall below a specified target price. Payments are based on current output and farmers receive a portion of the price difference – the current payment rate is 34% of the price difference. The payments are also capped at 1,089 kt of milk per farm per year. The US dairy industry also gains support through trade related assistance measures. Domestic market support programs rely on import restrictions to limit the effect of lower prices imports. There are TQs for limited quantities of cheese, butter and SMP imports. Over-quota tariffs are set at levels that generally preclude non-TQ imports.

31
H. External disposals of SMP from US Government stocks
0
400
800
1 200
1 600
1981-82 1983-84 1985-86 1987-88 1989-90 1991-92
Source: USDA 1993.'000 tonnes
year ended Sept.
CCC opening SMP stocks SMP food aid & subsidised exports
I. Composition of US external disposals of SMP
0
100
200
300
400
500
1981-82 1983-84 1985-86 1987-88 1989-90 1991-92
Source: USDA 1993'000 tonnesyear ended Sept.
Food aid DEIP & CCC export sales
US dairy product TQs are very small in comparison to total industry output. The TQs are close to fully utilised in most years because of the differential between world prices and US domestic prices. TQ access for SMP is currently set at 5.3 kt. It has very little influence on US market outcomes because it represents less than 2% of total domestic consumption. The US dairy industry also has export assistance measures that support external outflows of product during periods of surplus output. These measures include export subsidies and food aid programs. Both measures are an integral part of the industry support arrangements and have particular relevance for the issue of SMP food aid. They are linked to the Government purchases of domestic output to maintain the SMP floor price:
• the export assistance measures were important elements of the milk price support system before the UR Agreement on Agriculture were implemented;
• they provided a means for disposing of surplus output (chart H).

32
14. US food aid and SMP market support #
Year endedJune 30 '000 tonnes change '000 tonnes change '000 tonnes change '000 tonnes change
1995-96 64 .. 5 .. 10 .. 3 ..
1996-97 70 6 2 - 3 1 - 9 0 - 3
1997-98 96 26 61 58 0 - 1 0 0
1998-99 130 34 72 12 31 31 0 0
1999-00 101 - 28 193 121 52 21 261 261
2000-01 68 - 33 212 19 166 114 24 - 236
2001-02 68 0 253 41 353 187 30 6
2002-03 68 0 294 41 482 128 75 45
2003-04 ^ 63 - 5 189 - 105 550 68 81 7
2004-05 ^ 0 - 63 38 - 151 285 - 265 37 - 44
2005-06 ^ na .. na .. 59 - 226 14 - 23
# TQ access for SMP expanded to 5.3 kt in calendar year 2000. Sources: WTO 2004b; USDA 2006c, 2006h.* Subsidised exports in 1997-98, 1998-99 & 1999-00 included unused export subsidy constraints from previous years.** Excludes subsidised exports under the Dairy Export Incentive Program.*** Opening government owned stocks of SMP, 1 July.^ Food aid are estimates based on fiscal year data from USDA quarterly food aid reports. Subsidised exports are estimates based on fiscal year data from USDA quarterly reports on export assistance measures.
Food aidGovernmentSubsidised Price supportpurchases ** stocks ***exports *
Food aid has been a surplus disposal mechanism in the SMP support arrangements for some time. It has been used in conjunction with subsidised exports to relieve the pressure of a build-up in CCC stocks. Some of the stocks are sold for animal feed and some are used for domestic donations to schools, institutions and charities. But the primary disposal mechanisms have been external outflows through food aid and subsidised exports. For much of the 1980s the CCC purchased large quantities of SMP to support the minimum price. External disposals increased when the CCC was carrying large stocks (chart H). Food aid accounted for most of the external disposals. In the five years to 1985-85 about three-quarters of the external outflow was food aid (chart I). Some SMP was sold by the CCC as subsidised exports. In mid 1985 the Dairy Export Incentive Program (DEIP) was introduced to provide subsidies for commercial export sales. Since that time subsidised exports have became a more important surplus disposal mechanism. SMP food aid and subsidised exports declined to negligible levels in the late 1980s when the CCC stockpile was eliminated. The small rise in external disposals in 1987-88 was related to CCC market support purchases in that year. This clearly demonstrates the link between the market support activities and the use of food aid and subsidised exports to dispose of surplus output:
• US SMP food aid is not driven by the needs of recipient countries; • it is used to dispose of surpluses created by market support arrangements.
Both disposal mechanisms remained important aspects of the milk price support system after the UR Agreement on Agriculture was implemented. From around 1999-00 the CCC began to purchase large quantities of SMP to support the market price (table 14). CCC stocks rapidly increased and external disposals of surplus output were a critical aspect of the market support system at that time.

33
J. Recent external disposals of US SMP
0
100
200
300
400
1995-96 1997-98 1999-00 2001-02 2003-04
Source: WTO 2004b.'000 tonnesyear ended June
Subsidised exports Food aid
Before 1999-00 DEIP exports had provided a sufficient external outflow of product to support market returns. Export subsidy constraints had been imposed by the UR Agreement on Agriculture. Initially the constraints were not fully binding. But from 1997-98 they were fully utilised and the un-used portion of the constraints from earlier years were used to allow subsidised exports to exceed their annual commitments. There were negligible levels of SMP food aid provided in the mid 1990s. From 1999-00 the CCC market support purchases and limits on subsidised exports required disposals through food aid to be reintroduced:
• in 1999-00 there was a very large expansion in SMP food aid with the removal of 261 kt from the domestic market.
This sudden increase in food aid limited the build-up in stocks that would have followed the high level of CCC purchases in that year. From 2000-01 the WTO allowance on subsidised exports was fixed at 68 kt per year. It was fully utilised for the next few years and there was a substantial build-up in CCC stocks. During this period food aid was an important external outlet for reducing the pressure of surplus output on market returns (chart J). Throughout this period adjustments were made in the SMP support price in an effort to reduce the need for CCC purchases. The support price was progressively reduced from US$2,247 per tonne in 1998-99 to US$1,764 per tonne in 2003-04. Despite these adjustments CCC stocks continued to rise and reached a peak of 550 kt in 2003-04. In 2002-03 and 2003-04 the US provided substantial quantities of SMP food aid. These aid shipments helped to relieve some of pressure of rising government stocks of SMP. But the situation was not resolved until a strengthening in the world price for SMP removed the need for intervention purchases. From around mid-2004 the US was able to export SMP without the assistance of DEIP subsidies:
• the CCC stockpile of SMP has declined in recent years as intervention purchases were not required to support the market price;
• there has been less pressure to use food aid as a surplus disposal mechanism; • but food aid has been one of the avenues to gradually reducing the public stocks of SMP.
These developments demonstrate the link between food aid as a form of export assistance and the SMP market support arrangements. US export subsidies are a surplus disposal mechanism (Miller &
34
Blayney 2006). Food aid is used for the same purpose. The US has taken advantage of the fact there are no WTO restrictions governing the supply of food aid. One of the objectives of the Doha trade negotiations is to reduce the trade distortions caused by domestic support policies. Eliminating export subsidies will end one of the trade distorting effects of situations like US support programs for the dairy industry. It is also critical for gaining effective reductions in the amount of domestic support:
• developments in the US market for SMP show the importance of constraints on subsidised exports – support prices were adjusted to reduce the pressure for intervention purchases;
• food aid is an alternative form of export assistance that will weaken the trade liberalisation measures in other areas.
At some point in the future the world SMP price will fall below the US support price and DEIP exports will resume. Tighter constraints on subsidised exports will limit the capacity for external disposals. CCC purchases may be necessary and a build-up in stocks will again raise the political pressure to use food aid for surplus disposals. The recent evidence shows the US has used food aid to circumvent the restrictions on SMP export subsidies. This is likely to happen again in the future if there are no adjustments in the level of price support. It highlights the need for effective disciplines on the use of food aid in the Doha WTO trade negotiations.
35
4. Food aid and market distortions Food aid announcements by the major donors typically include statements about meeting the needs of recipient countries. There are emergency situations where short term aid is clearly based on need and is necessary for humanitarian reasons. But most food aid is for situations where there is no immediate threat to human life. In these cases it is common to see the aid justified on the basis of issues such as deficiencies in food supplies, helping vulnerable groups in poverty, poor nutrition or food security concerns. Claims that providing non-emergency food aid is based on the needs of the recipient country are questionable and often disputed. There may be a need for assistance but increasing the supply of food at the expense of commercial activities is generally not what is needed from an economic development perspective. In fact a lot of the world’s food aid has coincided with the needs of some major donors to dispose of surplus output:
• some commodities surpluses are created by industry support policies; • disposals through food aid are a convenient way of reducing the domestic market instability
without breaching existing international trade rules. Large amounts of food aid are directed into countries that are deemed to have a need for food at the time the surplus was created. It is not clear how these needy situations are determined and there is no effort to assess how the aid affects commercial activities. It is also apparent that the number of needy situations seems to decline when the surplus is reduced:
• when the surplus disposal issue is created by support policies, food aid becomes an implicit component of industry support arrangements in the donor country.
Food aid is a trade related policy concern for many countries. It is a concern in the context of international discussions to reduce agricultural support and liberalise trade in the WTO negotiations. The central issue with food aid is the market distortion effects outside the donor country. The distortionary affects are:
• the impact on global trade for commercially priced products; and • the effect on the domestic industry in the recipient countries.
The distortionary affect on international trade Agricultural exporters from non-donor countries claim food aid reduces the demand for commercially priced imports by the recipient country. Some concerns relate to trade flows in the same product and some relate to trade in a substitute product. The distortion affect is that commercial imports are displaced and diverted to alternative markets. It leads to lower returns because of increased supplies on the world market. The effect is considered the same as a country specific export subsidy because much of the aid is either sold or distributed in ways that can affect market outcomes. Consumer prices decline and it reduces the demand for imports from other sources. Like subsidised exports, food aid can disrupt pre-existing commercial trading relationships. But the distortion affect can’t be assessed in the context of past commercial trade:
• the demand for imports is determined by dynamic economic behaviour that could involve the emergence of trade where there were no previous imports.
Measuring the trade distorting affects of food aid is difficult but the evidence suggests there is an impact (FAO 2005b). Surplus disposals through food aid have not been constrained by effective

36
disciplines to limit the trade distorting effects. Aid transactions are often justified by a concept called ‘additionality’. It is used to claim there are no trade distorting effects if the food aid creates new consumption that would not have otherwise occurred. This concept was created by the FAO Consultative Sub-Committee on Surplus Disposal (CSSD) which is an international forum for monitoring food aid transactions. The CSSD was established as a consultative forum to minimise the distortionary affects of food aid. It was set up in 1954 but it has no legal powers to impose disciplines on aid transactions. The CSSD uses the Principles on Surplus Disposal to make recommendations on aid notifications by member countries (FAO 2005b). It does not assess all food aid transactions and there is no requirement for donors to notify the CSSD of all their food aid activities. In essence a transaction is deemed to be acceptable by the CSSD if it results in extra consumption in the recipient country and does not displace normal commercial imports. The test for additionality is the Usual Marketing Requirement (UMR) which is negotiated between the donor country and the recipient country. It reflects the ‘normal’ commercial imports of the recipient country and it is generally calculated as the average annual level of imports in the preceding five years. The UMR is a benchmark minimum for commercial imports in addition to the food aid. The concept is used to support claims there will be no displacement of commercial trade if the UMR is achieved by the recipient country. But in effect it is a non-binding agreement for imports to reach a specified level with no monitoring or enforcement conditions. This process of proving the food aid will create extra consumption has become a test for the acceptability of an aid transaction. But the economic basis for using the concept as a measure of the market distortion affect is weak. Historical imports are not a measure of the demand for commercial imports at the time the aid is provided. Even if it is achieved it doesn’t mean the extra consumption was achieved in non-distorting way. The question of whether the extra consumption is ‘real’ and non-distorting is hard to assess. It can only occur under the highly restrictive conditions. Export subsidies and food aid are subsidised transactions that lead to higher consumption in the recipient countries. But extra current period consumption can still occur in the absence of the subsidised sales and to some extent there will be a stronger demand for commercial imports from other sources. The key issue is the extent of the trade distortion effect. Food aid for legitimate short term emergencies will generally have minimal trade distorting effects. Non-emergency aid distributed to a particular community group will have a trade displacement effect if it ‘leaks’ into the market place. Monetised food aid that is sold in competition with commercially priced imports will have a direct distortionary affect:
• monetised food aid is equivalent to subsidised exports. Over time the concept of ‘additionality’ has become a common way to justify the provision of non-emergency food aid. It is often used to justify transactions that occur outside the CSSD notification process. It has allowed some donors to claim the disposal of surpluses generated by industry support policies have had no market distortion affects:
• if all subsidised export transactions were banned the surpluses created by other support measurers would remain in the donor countries;
• it would lead to higher prices on the world market.
37
The distortionary affect in recipient countries The other concern with food aid is the affect on domestic industries in recipient countries. The distortion affect is that the increased supply will reduce the demand for local produce and lower returns. This can affect future production decisions and have food security implications. It could also affect the success of other aid programs aimed at rural poverty reductions. The impact on rural poverty and longer term industry development is an important issue. Semi-subsistence farmers that sell some output to generate an income will be adversely affected. Ad-hoc food aid adds to the market instability caused by variations in seasonal conditions and world prices. Measuring the domestic distortionary affect of food aid is difficult and often constrained by data issues. A lack of definitive research has allowed the concept of ‘additionality’ to be implicitly used as a justification for aid. A benchmark measure like the UMR is not used to prove the extra consumption is non-distorting for domestic output:
• aid transactions are deemed acceptable if it leads to lower prices and extra consumption. Some donors point out the benefits of increased supplies and lower prices for improving the diet and health of the population in low-income countries. Non-emergency aid that is sold or distributed in competition with domestic output will provide a benefit for all consumers in the recipient country. Subsidised exports provide a similar benefit. But claims that the aid is non-distorting fail to acknowledge the effect on the domestic industry:
• some farmers may choose to maintain their output and accept a lower income; • others may respond by reducing output and diversifying into other products.
Food aid is generally regarded as a welfare assistance measure. But the need to provide this assistance to the entire population is questionable in most situations. Targeted distribution of food aid is a way of helping those in need and limiting the distortionary effects in recipient countries. If the recipients have very little capacity to purchase the food they receive as aid, there will be minimal distortionary affects on the domestic market. Aid that is sold in the market place will clearly have a distortionary affect. Prices of domestic output that substitute for the aid will fall because of the increased supply. The effect is the same as the impact of subsidised exports. Proceeds from the sale of the aid are often used for other aid activities. But the logical question to ask is why cash aid was not provided in the first place – it suggests the aid was provided as a surplus disposal by the donor. The process of monetisation can also have a trade distorting effect if the aid is sold by the recipients in third markets to raise funds for other purposes. This can occur with program food aid that is provided for balance of payments difficulties or budget constraints. The distortionary affect of targeted distributions of non-emergency aid to a particular group of people is not clear-cut. But there is little doubt that selling food aid to raise revenue for other purposes will affect market outcomes in the recipient country. Extra consumption may be created but it is achieved at the expense of lower returns for local farmers, discouraging domestic output and/or reducing the demand for imports:
• WTO limits on export subsidies were negotiated to reduce trade related distortions from the disposal of surpluses generated by industry support policies;
• monetised food aid from the surpluses will have the same effect on import demand and industry development – similar disciplines should apply to monetised aid.
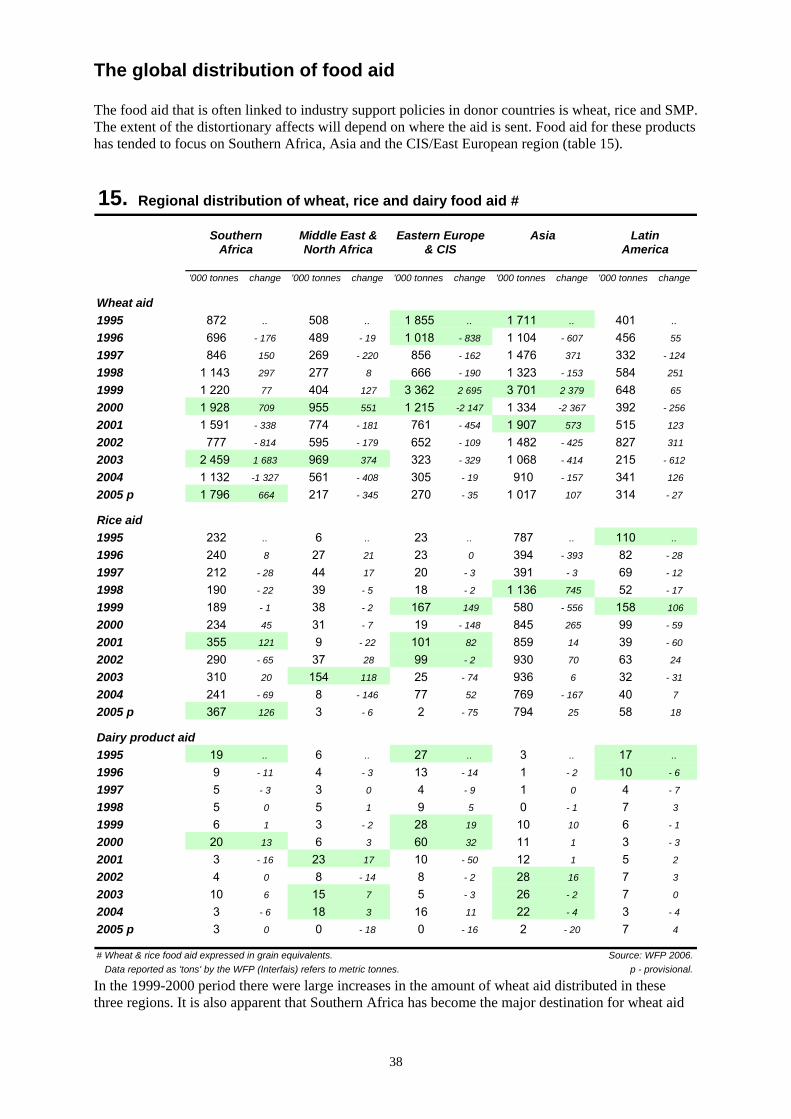
38
The global distribution of food aid The food aid that is often linked to industry support policies in donor countries is wheat, rice and SMP. The extent of the distortionary affects will depend on where the aid is sent. Food aid for these products has tended to focus on Southern Africa, Asia and the CIS/East European region (table 15). 15. Regional distribution of wheat, rice and dairy food aid #
'000 tonnes change '000 tonnes change '000 tonnes change '000 tonnes change '000 tonnes change
Wheat aid1995 872 .. 508 .. 1 855 .. 1 711 .. 401 ..
1996 696 - 176 489 - 19 1 018 - 838 1 104 - 607 456 55
1997 846 150 269 - 220 856 - 162 1 476 371 332 - 124
1998 1 143 297 277 8 666 - 190 1 323 - 153 584 251
1999 1 220 77 404 127 3 362 2 695 3 701 2 379 648 65
2000 1 928 709 955 551 1 215 -2 147 1 334 -2 367 392 - 256
2001 1 591 - 338 774 - 181 761 - 454 1 907 573 515 123
2002 777 - 814 595 - 179 652 - 109 1 482 - 425 827 311
2003 2 459 1 683 969 374 323 - 329 1 068 - 414 215 - 612
2004 1 132 -1 327 561 - 408 305 - 19 910 - 157 341 126
2005 p 1 796 664 217 - 345 270 - 35 1 017 107 314 - 27
Rice aid1995 232 .. 6 .. 23 .. 787 .. 110 ..
1996 240 8 27 21 23 0 394 - 393 82 - 28
1997 212 - 28 44 17 20 - 3 391 - 3 69 - 12
1998 190 - 22 39 - 5 18 - 2 1 136 745 52 - 17
1999 189 - 1 38 - 2 167 149 580 - 556 158 106
2000 234 45 31 - 7 19 - 148 845 265 99 - 59
2001 355 121 9 - 22 101 82 859 14 39 - 60
2002 290 - 65 37 28 99 - 2 930 70 63 24
2003 310 20 154 118 25 - 74 936 6 32 - 31
2004 241 - 69 8 - 146 77 52 769 - 167 40 7
2005 p 367 126 3 - 6 2 - 75 794 25 58 18
Dairy product aid1995 19 .. 6 .. 27 .. 3 .. 17 ..
1996 9 - 11 4 - 3 13 - 14 1 - 2 10 - 6
1997 5 - 3 3 0 4 - 9 1 0 4 - 7
1998 5 0 5 1 9 5 0 - 1 7 3
1999 6 1 3 - 2 28 19 10 10 6 - 1
2000 20 13 6 3 60 32 11 1 3 - 3
2001 3 - 16 23 17 10 - 50 12 1 5 2
2002 4 0 8 - 14 8 - 2 28 16 7 3
2003 10 6 15 7 5 - 3 26 - 2 7 0
2004 3 - 6 18 3 16 11 22 - 4 3 - 4
2005 p 3 0 0 - 18 0 - 16 2 - 20 7 4
# Wheat & rice food aid expressed in grain equivalents. Source: WFP 2006. Data reported as 'tons' by the WFP (Interfais) refers to metric tonnes. p - provisional.
& CISSouthern
AfricaMiddle East &North Africa
Eastern Europe Asia LatinAmerica
In the 1999-2000 period there were large increases in the amount of wheat aid distributed in these three regions. It is also apparent that Southern Africa has become the major destination for wheat aid

39
in recent years. There was a large increase in rice aid to the Asian region in 1998 and a number of other one-off annual expansions in other regions. Dairy product aid to the CIS/Eastern Europe region increased significantly in the year 2000. It is beyond the scope of this study to measure the distortionary affects of food aid. That would require an analysis of market conditions in some of the major recipient countries for the products of interest. An alternative way to look at the issue is to examine the aid activities of the United States. The US is the largest provider of food aid. The mechanisms they use to supply their aid will provide some guidance on how it can affect market outcomes.
US food aid programs Operational aspects of US food aid programs are an important consideration. It will indicate how the aid is dispensed and if it could have a distortionary effect on world trade and/or the domestic markets in the recipient countries. The US has four programs with operational responsibilities split between two government agencies:
• PL480; • Section 416(b); • Food for Progress (FFP); and • the McGovern-Dole Food for Education and Child Nutrition (FFE).
PL 480 is known as the Food for Peace program and has three components (USDA 2006d). The Title 1 component provides finance for the sale of food commodities to the governments of developing countries and to NGOs. This means the aid is a grant ‘tied’ to the purchase of US commodities at market prices on concessional terms:
• credit is provided for up to 30 years at low interest rates; • there is a grace period of up to 5 years before repayments have to commence; • financing for PL 480 Title I aid is provided by the CCC.
PL 480 Title I food aid is provided to countries experiencing foreign exchange shortages and has difficulty meeting their food requirements through commercial channels. Aid agreements are negotiated and in some cases they require the Government of the recipient country to maintain ‘normal’ imports based on the UMR concept. The agreements are to ensure the aid will not unduly disrupt world market prices and ‘normal’ commercial trade. Resale or re-export of the aid is prohibited. In some cases there may be a limit on exports of similar commodities by the recipient country. But it is not clear how these agreements are monitored and enforced. This raises questions about the effectiveness of these agreements in minimising the trade distorting effect of Title 1 aid. The aim of Title 1 food aid is to support concessional sales that promote exports of US agricultural commodities. The US Department of Agriculture (USDA) administers the program through the Foreign Agriculture Service (FAS). Country eligibility appears to be based on subjective assessments of the difficulty in meeting their food requirements through commercial channels:
• one of the factors used in Title 1 assessments is the potential for the country to become a commercial market for the US;
• PL 480 Title 1 aid is equivalent to subsidised export sales or commercial sales support by export credits.
PL 480 Title 2 aid involves food donations for emergency situations and for development assistance. The aid is given free of charge to NGOs and international organisations such as the WFP for distribution in recipient countries. Government-to-Government aid can also be authorised in some emergency situations.

40
Commodities donated under the Title 2 component come from CCC stocks of surplus output that was purchased for market support activities. If there are insufficient stocks donations can be commercially purchased through an open bidding system. PL 480 Title 2 aid is administered by the US Agency for International Development (USAID) who is responsible for managing the US response to emergency situations. The Title 3 component of PL 480 is the Food for Development program. It provides food aid to the least developed countries to support economic development. The aid is provided on a Government-to-Government basis and is donated free of charge. The program is administered by USAID and has not been active in recent years. PL 480 food aid can be sold in the recipient country and the proceeds used for other activities. Monetisation is negotiated as a condition of the aid agreement. In practice this is unlikely to occur with Title 2 emergency aid. But it is common practice with concessional sales under Title 1 aid. In general the non-emergency PL 480 aid will have a market distorting affect if it directed into countries with an established import trade and/or domestic production. The Section 416(b) program authorises donations of surplus commodities acquired by the CCC. Donations are made through agreements with foreign governments, NGOs and intergovernmental organisations such as the WFP. The program is administered by the USDA through the FAS and the availability of commodity donations will depend on CCC stocks and acquisitions. Section 416(b) allows aid donations to be sold in the recipient country and the proceeds used for other activities. Monetisation is determined as part of a negotiated agreement with the recipient country. There is a requirement that the aid will not disrupt commercial sales but it is not clear how this is assessed or enforced:
• monetised Section 416(b) aid can have market distorting affects in countries with existing commercial activities.
The Food for Progress (FFP) program allows for donations or credit sales of commodities to countries that support democracy and have made commitments to introduce of expand free enterprise. It is an independently authorised program but it can be funded through PL 480 Title 1 or Section 416(b). The CCC will purchase commodities for donations through this program if required. FFP aid can be provided through the recipient country Governments, NGOs or international organisations such as the WFP. The basis for assessing country eligibility is not clear. The aid may be sold in the recipient country to generate revenue for other aid activities. Monetisation is negotiated in the aid agreements and again there is potential for market distorting affects. The McGovern-Dole Food for Education and Child Nutrition (FFE) program provides food donations, financial assistance and technical advice to support education and food security for children in poor countries. Food is donated for school feeding and child nutrition projects. Funding is provided through the CCC and Congressional appropriations. FFE aid is provided through the agreements with foreign Government, NGOs or international organisations such as the WFP. The aid may be sold on local market to generate revenue to support relevant aid projects. The option for monetisation indicates the program could also potentially have market distorting effects in some situations.

41
US distribution of wheat and SMP food aid The US is the only donor with specific legislation to authorise food aid activities. It provides some information for judging the potential for market distortion effects. This will be largely determined by the aid destinations and how it is disbursed when it arrives. These issues were examined by reviewing recent aid activities for two products linked to industry support policies – wheat and SMP. There are differences in the way the US aid programs operate. PL480 Title 1 aid is a concessionary sale at market prices. Aid for emergency relief is handled through the PL480 Title 2 program while Section 416(b) aid is essentially used for the disposal of CCC surpluses generated by market support. The Food for Progress program includes both donations and concessionary sales. In recent times most of the wheat aid has been channelled through PL480 Title 2 (table 16). It was not possible to determine the split between emergency relief and development activities. There was also insufficient information to make a judgement about the nature of the ‘emergencies’ that involved the provision of what aid. 16. US programmed shipments of selected food aid #
PL480 PL480 Section 416(b) Food for Progress Total ^Title 2 aid * other aid aid ** aid ***
Fiscal yearended September '000 tonnes % '000 tonnes % '000 tonnes % '000 tonnes % '000 tonnes
Wheat ^^2000-01 1 113 31.7 310 8.8 1 636 46.5 231 6.6 3 5162001-02 990 43.5 216 9.5 816 35.8 102 4.5 2 2772002-03 1 519 65.9 135 5.8 179 7.8 430 18.7 2 3042003-04 1 143 64.7 171 9.7 0 0.0 427 24.2 1 7662004-05 1 881 83.9 63 2.8 0 0.0 279 12.4 2 2432005-06 939 75.3 92 7.3 0 0.0 214 17.2 1 247
SMP2000-01 0 0.3 0 0.0 12 49.5 8 33.9 232001-02 0 0.0 0 0.0 39 76.4 9 17.7 512002-03 1 0.9 0 0.0 71 94.9 3 4.1 752003-04 0 0.0 0 0.0 81 99.9 0 0.0 812004-05 0 0.0 0 0.0 37 98.1 1 1.3 372005-06 0 0.0 0 0.0 12 84.1 2 10.9 14
Corn soy milk2000-01 2 21.1 0 0.0 2 16.0 0 1.3 92001-02 2 13.8 0 0.0 10 71.5 0 0.0 152002-03 0 .. 0 .. 0 .. 0 .. 02003-04 0 .. 0 .. 0 .. 0 .. 02004-05 0 .. 0 .. 4 100.0 0 .. 42005-06 0 .. 0 .. 0 .. 0 .. 0
# Includes direct aid shipments by the US Government and aid provided through the WFP. Source: USDA 2006h.* Title 2 aid is for emergency and development assistance.** Excludes aid for the Global Food for Education (GFE) initiative in 2001 & 2002.*** Includes Food for Progress aid funded under PL480 Title 1.^ Includes Food for Education program aid and 416(b) aid for the GFE initiative in 2001 & 2002.^^ Includes wheat flour. Annual Food Assistance reports from USAID suggest a substantial amount of Title 2 wheat aid was used for development activities (USAID 2004). This aid was either monetised or distributed in ways
42
that could have a market distortion effect. PL480 Title 1 aid was fully monetised and USDA reports suggest that most of the Section 416(b) wheat donations were also monetised. The Section 416(b) program has not been used for wheat aid in recent times because favourable market conditions have not required any CCC acquisitions. Wheat aid provided through the Food for Progress program has fluctuated and concessionary sales through PL480 Title 1 have been relatively small. In part this reflects a policy shift by the US Administration to reduce the amount of aid provided as sales supported by concessional loans (USGAO 2002):
• the policy change was a response to concerns that this type of food aid created disincentives for agricultural and economic reforms in recipient countries;
• it suggests there are concerns about encouraging a dependency on food aid that would support claims about commercial displacement.
The small amount of PL480 Title 1 wheat aid could also reflect the favourable market conditions in recent years. There has been no pressure for external outflows of wheat through concessional loans for food aid. But political pressure to use the program more actively could arise during times when surplus disposals are seen to be necessary to provide indirect price support. In contrast to the situation for wheat most of the SMP food aid was channelled through the Section 416(b) program. Very little SMP aid has been provided through the Food for Progress and the PL480 programs. The Section 416(b) SMP aid was sourced from CCC stocks and acquisitions. It reflected market support activities in the late 1990s and early 2000s. Use of the Section 416(b) program means there is a high probability the SMP food aid has had market distortionary effects. USDA reports suggest that most of the Section 416(b) SMP aid is monetised and it is distributed in countries where an established commercial trade is evident. USAID does not appear to use SMP for development activities in the PL480 Title 2 program. It is also not a priority product for emergency assistance. In recent years the global supply of emergency food aid has increased and the US has provided large amounts of wheat for this purpose. Despite this apparent increase in demand for emergency assistance the US has not provided SMP for emergency relief activities. The demand for SMP food aid is unlikely to be as strong as the demand for wheat food aid. Milk is not a big part of the diet in many recipient countries. This may be the reason for the lack of aid shipments through the PL480 Title 1 program. There may be very little demand for SMP food aid that is offered as a sale under concessionary loan terms:
• it may not be an effective way to dispose of surplus supplies of SMP; • the DEIP program is available for subsidised exports which is equivalent to the outcomes of
the PL480 Title 1 program. WTO allowances for subsidised SMP exports were fully utilised in the 2000-2003 period. Yet there were no PL480 Title 1 concessionary sales at that time. Instead the US relied on Section 416(b) donations to help reduce the SMP surplus created by market support activities. Some of the SMP surplus was used as an ingredient for corn-soy milk (CSM). In early 2001 the USDA announced the availability of more than 300 kt of SMP for food aid. Some was used to manufacture CSM that was used by USAID in the PL480 Title 2 program (USAID 2003). Some CSM was also used for donations through the Section 416(b) program. The potential for US wheat and SMP food aid to have market distorting effects will depend on the destinations and distribution methods of the aid. If the aid was directed into countries with established commercial trading activities there may be an impact. The key question is how much of the aid was sold, released or ‘leaked’ into the commercial market place.
43
In recent times the major markets for US wheat aid have been Ethiopia and Eritrea in the Southern African region, Afghanistan and Bangladesh in the Asian region and Jordan in the Middle East. Several other countries have also been significant recipients of US wheat aid (see appendix A). Many could be classed as markets with an existing commercial trade. An indicator of the amount of monetised non-emergency aid can be found in FAS announcements of food aid authorisations (table 17). These announcements will not coincide with actual fiscal year shipments of US wheat aid. They reflect program allocations and the physical aid flows can spill over into subsequent years. The FAS announcements were categorised according to the intended use of the wheat aid. They do not cover all the major destinations because of the large amount of aid provided through PL480 Title 2. This program is administered by USAID and is not part of the FAS authorisation process. The data shows that most of the USDA wheat aid is sold in the recipient country with the proceeds used for other assistance projects. As monetised aid directly affects market conditions there is a high probability it has had widespread market distortion effects on imports and/or domestic output:
• there were few cases where the USDA wheat aid was non-monetised. PL480 Title 2 food aid for development activities can also be sold in the recipient country. In the year 2000 an estimated 30% of Title 2 aid was monetised (USDA 2002). This included aid for emergency and non-emergency purposes. In more recent times some Title 2 wheat aid has been monetised and some has been distributed for non-emergency needs. It also seems likely that some of the emergency aid has been distributed in situations where leakage or displacement has occurred. Therefore it seems that most US wheat aid has been directed into the markets of recipient countries in ways that compete with imports and domestic production. All of the major destinations for US wheat aid have established commercial activities in wheat. Most of the recipient countries have a domestic wheat industry and many are significant commercial importers. There is evidence of a displacement effect on commercial wheat imports in many of the major destinations for US wheat aid (see appendix B). This can be seen by comparing aid levels and total imports in 2000-01 and 2001-02 with trade outcomes over recent years. In general when US aid volumes have declined, imports have increased. Other factors may have contributed to the rise in imports but this pattern is evident across a range of destinations:
• Bangladesh, Indonesia, Sri Lanka, Eritrea, Ghana, Mozambique, Ecuador, Honduras, Peru, Jordan, Yemen and Georgia show this pattern to varying degrees;
• this development can’t be attributed to price changes – in recent times world wheat prices have been substantially higher in comparison to prices in 2000-01;
• the rise in imports indicates there is a capacity for commercial wheat purchases to meet the food needs that were met by larger volumes of US aid.
In many cases the amount of US wheat aid is substantial when assessed against total import levels and domestic output. As most of the aid was sold in the recipient country it is difficult to accept it would not have had some distortion effects on commercial developments. Major food aid destinations such as Eritrea, Ethiopia, Mozambique and Jordan are some examples where this has occurred.
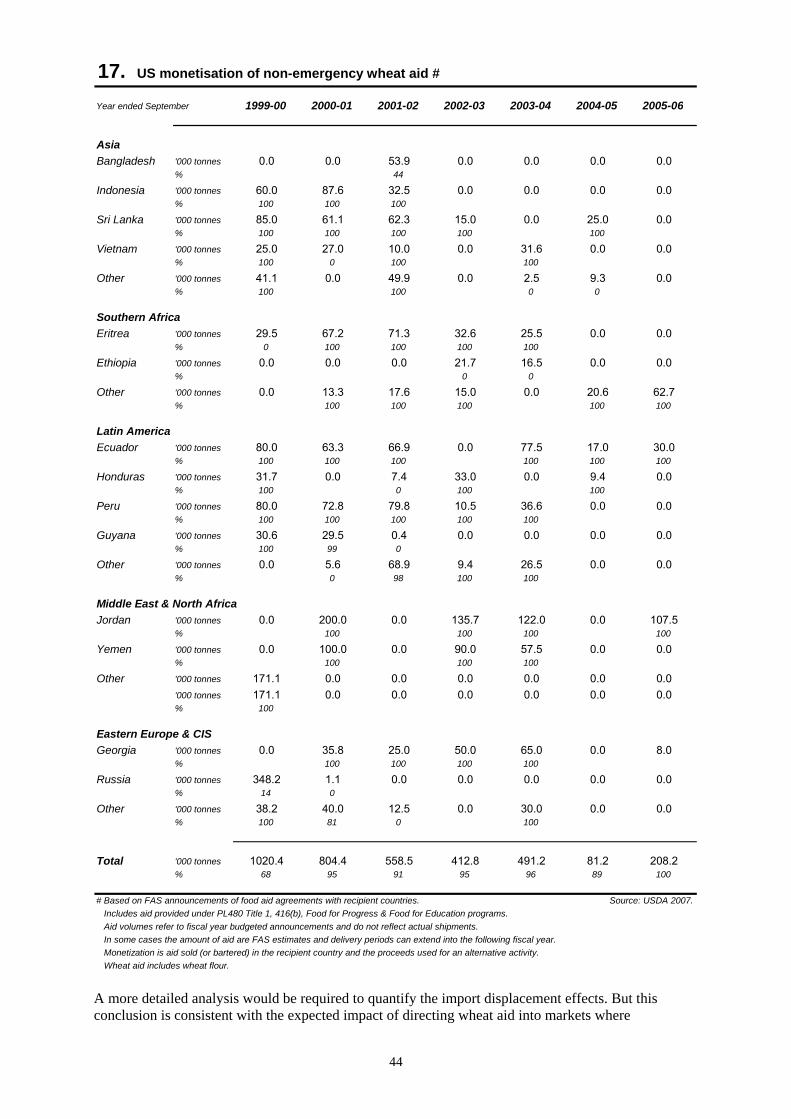
44
17. US monetisation of non-emergency wheat aid #
Year ended September 1999-00 2000-01 2001-02 2002-03 2003-04 2004-05 2005-06
AsiaBangladesh '000 tonnes 0.0 0.0 53.9 0.0 0.0 0.0 0.0
% 44
Indonesia '000 tonnes 60.0 87.6 32.5 0.0 0.0 0.0 0.0% 100 100 100
Sri Lanka '000 tonnes 85.0 61.1 62.3 15.0 0.0 25.0 0.0% 100 100 100 100 100
Vietnam '000 tonnes 25.0 27.0 10.0 0.0 31.6 0.0 0.0% 100 0 100 100
Other '000 tonnes 41.1 0.0 49.9 0.0 2.5 9.3 0.0% 100 100 0 0
Southern AfricaEritrea '000 tonnes 29.5 67.2 71.3 32.6 25.5 0.0 0.0
% 0 100 100 100 100
Ethiopia '000 tonnes 0.0 0.0 0.0 21.7 16.5 0.0 0.0% 0 0
Other '000 tonnes 0.0 13.3 17.6 15.0 0.0 20.6 62.7% 100 100 100 100 100
Latin AmericaEcuador '000 tonnes 80.0 63.3 66.9 0.0 77.5 17.0 30.0
% 100 100 100 100 100 100
Honduras '000 tonnes 31.7 0.0 7.4 33.0 0.0 9.4 0.0% 100 0 100 100
Peru '000 tonnes 80.0 72.8 79.8 10.5 36.6 0.0 0.0% 100 100 100 100 100
Guyana '000 tonnes 30.6 29.5 0.4 0.0 0.0 0.0 0.0% 100 99 0
Other '000 tonnes 0.0 5.6 68.9 9.4 26.5 0.0 0.0% 0 98 100 100
Middle East & North AfricaJordan '000 tonnes 0.0 200.0 0.0 135.7 122.0 0.0 107.5
% 100 100 100 100
Yemen '000 tonnes 0.0 100.0 0.0 90.0 57.5 0.0 0.0% 100 100 100
Other '000 tonnes 171.1 0.0 0.0 0.0 0.0 0.0 0.0'000 tonnes 171.1 0.0 0.0 0.0 0.0 0.0 0.0% 100
Eastern Europe & CISGeorgia '000 tonnes 0.0 35.8 25.0 50.0 65.0 0.0 8.0
% 100 100 100 100
Russia '000 tonnes 348.2 1.1 0.0 0.0 0.0 0.0 0.0% 14 0
Other '000 tonnes 38.2 40.0 12.5 0.0 30.0 0.0 0.0% 100 81 0 100
Total '000 tonnes 1020.4 804.4 558.5 412.8 491.2 81.2 208.2% 68 95 91 95 96 89 100
# Based on FAS announcements of food aid agreements with recipient countries. Source: USDA 2007. Includes aid provided under PL480 Title 1, 416(b), Food for Progress & Food for Education programs. Aid volumes refer to fiscal year budgeted announcements and do not reflect actual shipments. In some cases the amount of aid are FAS estimates and delivery periods can extend into the following fiscal year. Monetization is aid sold (or bartered) in the recipient country and the proceeds used for an alternative activity. Wheat aid includes wheat flour. A more detailed analysis would be required to quantify the import displacement effects. But this conclusion is consistent with the expected impact of directing wheat aid into markets where

45
commercial activities are established. It is also verifies concerns about US food aid programs that have been raised by others (Oxfam International 2005). Commercial exporters often raise concerns about the effects of particular US aid transactions on the demand for imports. The sudden availability of a large quantity of wheat aid can be highly disruptive for commercial sales. These concerns are not limited to exporters in other supplying countries. In some cases they are shared by commercial interests in the United States (USDA 2001). The distortionary effect of US wheat aid in the recipient countries is more difficult to judge from the available information. But if commercial imports are affected by monetising wheat aid then the local industry must be affected as well. Most of the recipients have a domestic wheat industry. Commercial imports, monetised food aid and domestic production are all competitors in the same market place. Monetised wheat aid is not much different from a subsidised export sale. The aid is provided to a distributing agency. The recipients have a quantity of wheat that must be sold in the local market. Their objective is to sell the wheat as soon as possible and realise the proceeds for other purposes. There is very little incentive to consider the effects on market returns or farmer incomes. Recipient agencies that intend to monetise donations of US wheat aid are likely to be ‘weak sellers’ in the local market. The increased availability of wheat will itself put downward pressure on market prices. At the same time there is no incentive to hold stocks and maximise the price received for the aid. As pricing information is often limited or unreliable, the wheat aid sales are likely to occur at below market prices:
• the effect is like a subsidised export – increased supplies and the availability of imports at
subsidised prices will weaken local market prices; • monetisation reduces the demand for commercially priced imports and domestic output.
This applies to monetised wheat aid from PL480 Title 2, Section 416(b) and the Food for Progress programs. Wheat aid supplied through the PL480 Title 1 program is an exception. It is monetised aid because it is a concessional sale through a long term loan. The recipient agency is unlikely to be a weak seller but the impact will mimic the domestic market effects of subsidised exports. The situation with SMP aid is a little different. The amount of US aid is considerably smaller than the volume of wheat aid. It is distributed in small, ad-hoc quantities across a range of markets. The market distortion effect is essentially focused on competition with commercial imports. There are very few processing facilities for milk powders in developing countries:
• US SMP food aid may have an impact on the domestic markets of recipient countries if it is used a substitute for fresh milk supplies.
In recent times the major destinations for US SMP aid have been Indonesia and North Korea in the Asian region, Guatemala in Latin America, Yemen in the Middle East and Kazakhstan in the East European and CIS region. Very little SMP aid is directed to Southern Africa but several other countries have been recipients of US SMP aid (see appendix A). A number of destinations could be classed as markets with an existing commercial trade. FAS announcements on SMP food aid were categorised according to the intended use by the aid recipient. It covers most of the major destinations because very little aid is provided through the PL480 Title 2 program. The announcements show most of the USDA SMP aid is monetised and the proceeds used for other assistance projects (table 18).
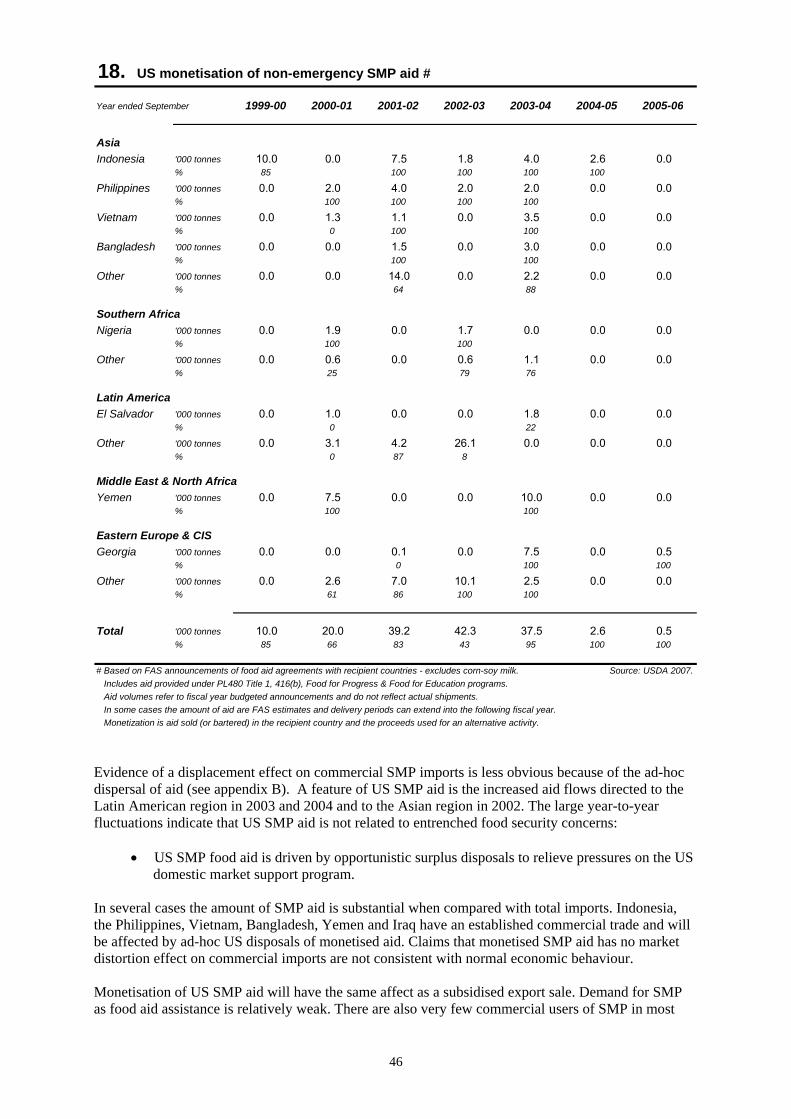
46
18. US monetisation of non-emergency SMP aid #
Year ended September 1999-00 2000-01 2001-02 2002-03 2003-04 2004-05 2005-06
AsiaIndonesia '000 tonnes 10.0 0.0 7.5 1.8 4.0 2.6 0.0
% 85 100 100 100 100
Philippines '000 tonnes 0.0 2.0 4.0 2.0 2.0 0.0 0.0% 100 100 100 100
Vietnam '000 tonnes 0.0 1.3 1.1 0.0 3.5 0.0 0.0% 0 100 100
Bangladesh '000 tonnes 0.0 0.0 1.5 0.0 3.0 0.0 0.0% 100 100
Other '000 tonnes 0.0 0.0 14.0 0.0 2.2 0.0 0.0% 64 88
Southern AfricaNigeria '000 tonnes 0.0 1.9 0.0 1.7 0.0 0.0 0.0
% 100 100
Other '000 tonnes 0.0 0.6 0.0 0.6 1.1 0.0 0.0% 25 79 76
Latin AmericaEl Salvador '000 tonnes 0.0 1.0 0.0 0.0 1.8 0.0 0.0
% 0 22
Other '000 tonnes 0.0 3.1 4.2 26.1 0.0 0.0 0.0% 0 87 8
Middle East & North AfricaYemen '000 tonnes 0.0 7.5 0.0 0.0 10.0 0.0 0.0
% 100 100
Eastern Europe & CISGeorgia '000 tonnes 0.0 0.0 0.1 0.0 7.5 0.0 0.5
% 0 100 100
Other '000 tonnes 0.0 2.6 7.0 10.1 2.5 0.0 0.0% 61 86 100 100
Total '000 tonnes 10.0 20.0 39.2 42.3 37.5 2.6 0.5% 85 66 83 43 95 100 100
# Based on FAS announcements of food aid agreements with recipient countries - excludes corn-soy milk. Source: USDA 2007. Includes aid provided under PL480 Title 1, 416(b), Food for Progress & Food for Education programs. Aid volumes refer to fiscal year budgeted announcements and do not reflect actual shipments. In some cases the amount of aid are FAS estimates and delivery periods can extend into the following fiscal year. Monetization is aid sold (or bartered) in the recipient country and the proceeds used for an alternative activity. Evidence of a displacement effect on commercial SMP imports is less obvious because of the ad-hoc dispersal of aid (see appendix B). A feature of US SMP aid is the increased aid flows directed to the Latin American region in 2003 and 2004 and to the Asian region in 2002. The large year-to-year fluctuations indicate that US SMP aid is not related to entrenched food security concerns:
• US SMP food aid is driven by opportunistic surplus disposals to relieve pressures on the US domestic market support program.
In several cases the amount of SMP aid is substantial when compared with total imports. Indonesia, the Philippines, Vietnam, Bangladesh, Yemen and Iraq have an established commercial trade and will be affected by ad-hoc US disposals of monetised aid. Claims that monetised SMP aid has no market distortion effect on commercial imports are not consistent with normal economic behaviour. Monetisation of US SMP aid will have the same affect as a subsidised export sale. Demand for SMP as food aid assistance is relatively weak. There are also very few commercial users of SMP in most

47
recipient countries. So the recipient agencies are likely to be weak sellers in the local market because their objective is to obtain funds for other aid related activities:
• if there is no incentive to maximise the price received, transactions are likely to occur at less than the landed world market price.
If there is an objective to assist vulnerable groups it is more cost effective to replace the SMP aid with monetary aid. It would eliminate the displacement effect on commercial imports. For countries that have a domestic dairy industry it would also eliminate any disruptions to farm milk returns that can affect longer term industry development.
The impact of US wheat aid on world trade It is beyond the scope of this study to quantify the effects of food aid on global commodity markets. It would require a model of world commodity markets that separated bilateral trade flows between commercial sales and food aid. The data requirements would be substantial because the analysis would need to cover market behaviour for a range of commodities in a wide variety of countries. An alternative approach is to estimate the distortion affects for a single commodity. This would at least provide a basis for verifying that market displacement effects occur and give an indicative estimate of the size of the impact. But to obtain a reasonably robust estimate the analysis would need to identify the major aid recipients:
• the impact in recipient countries will depend on the price responsiveness of market behaviour and industry policy arrangements;
• individual representations of market behaviour would be necessary to account for differences in these factors.
A detailed simulation analysis based on this approach was not possible due to data and model limitations. But it was possible to prepare a modified simulation exercise that illustrated the sorts of distortion effects that can occur. The aim of the analysis was to show the aggregate impact of eliminating non-emergency food aid on world trade. The simulation analysis used US wheat aid as an example. It was selected because wheat is a major component of global food aid and the US offered the most information for designing a suitable experiment. The analysis was prepared by the Australian Bureau of Agriculture and Resource Economics (ABARE) using a model of world grain markets (see appendix C). The ABARE Grains Model (AGM) was used to simulate the elimination of non-emergency wheat aid for a particular year. The exercise was limited to 2000-01 for illustration purposes. It was selected because it coincided with a period when the US was supplying a substantial amount of wheat aid onto world markets. The main issue for the simulation experiment was the separation of US wheat aid between emergency and non-emergency purposes. The simulation exercise required an estimate of US non-emergency wheat aid in 2000-01. This would include monetised wheat aid and aid distributed in ways that can have market substitution affects. It should also include aid classified as emergency relief that is used by the recipients as a replacement for commercial purchases:
• some emergency aid may have been provided for supply deficiencies that were not caused by unusual events such as natural disasters, armed conflicts, etc.

48
19. Impact of US non-emergency food aid on the world wheat market #
Market conditions Simulated market change % changein 2000-01 conditions
US commercial exports '000 tonnes 25 767 27 297 1 530 5.9
US food aid * '000 tonnes 3 109 152 -2 957 -95.1
- emergency wheat aid '000 tonnes 152 152 .. ..
- other wheat aid '000 tonnes 2 957 0 -2 957 100.0
US production '000 tonnes 60 501 60 232 - 269 -0.4
US consumption '000 tonnes 36 170 37 339 1 169 3.2
US domestic price US$/tonne 97 91 - 7 -6.8
World exports '000 tonnes 96 930 99 254 2 324 2.4
World wheat price US$/tonne 127 128 2 1.3
# Estimated impact based on eliminating all non-emergency wheat aid in FY 2001. Source: ABARE.* For simulation purposes emergency aid was defined as PL480 Title 2 wheat aid distributed through the WFP. Wheat aid volumes were obtained from Foreign Agricultural Service reports (USDA 2006h). Excludes wheat flour. A precise estimate of emergency wheat aid is difficult to develop because of data limitations. It was not possible to split the PL480 Title 2 wheat aid into the emergency and development assistance components. USAID reports do not disaggregate Title 2 aid by commodity. Even if this were possible it is difficult to make judgements about the legitimacy of the emergency situations without a thorough investigation of the reasons for each aid transaction. For the purposes of the simulation exercise it was assumed that wheat aid for ‘legitimate’ emergencies was equivalent to the PL480 Title 2 aid distributed through the WFP. The remaining Title 2 aid was assumed to be for other purposes. Some of this aid may have been distributions for ‘real’ emergencies. But equally some of the WFP distributed aid was for development assistance or situations that were not legitimate emergencies:
• in 2000-01 the WFP distributed 152 kt of the PL480 Title 2 wheat aid; • this represented about 5% of total wheat aid; • it was used as an indicative estimate of the wheat aid used in ‘real’ emergencies involving
unexpected, severe disruptions in food supplies. The analysis involved a comparison of actual 2000-01 market outcomes with a simulation of market outcomes that limited wheat food aid to 152 kt. In other words the alternative view involved a 2,957 kt exogenous reduction in US wheat aid. The difference between the two perspectives provides estimates of the market distortion effects of non-emergency wheat aid on world wheat markets. The simulations results reflect the additional US wheat supplies available for commercial export. Increased domestic availability reduces the US wheat price which improves the export competitiveness of US commercial sales (table 19). US prices are 7% lower and commercial exports are 6% higher. The removal of about 3 million tonnes of wheat aid from the world market strengthens the world price. Additional commercial exports are drawn from other supplying countries through reduced domestic consumption and a limited supply response. Australia, Canada, Argentina and the EU gain a benefit from higher prices and increased export sales (chart K). The overall net impact is a marginally higher world price and a world wheat trade that is about 2% higher.
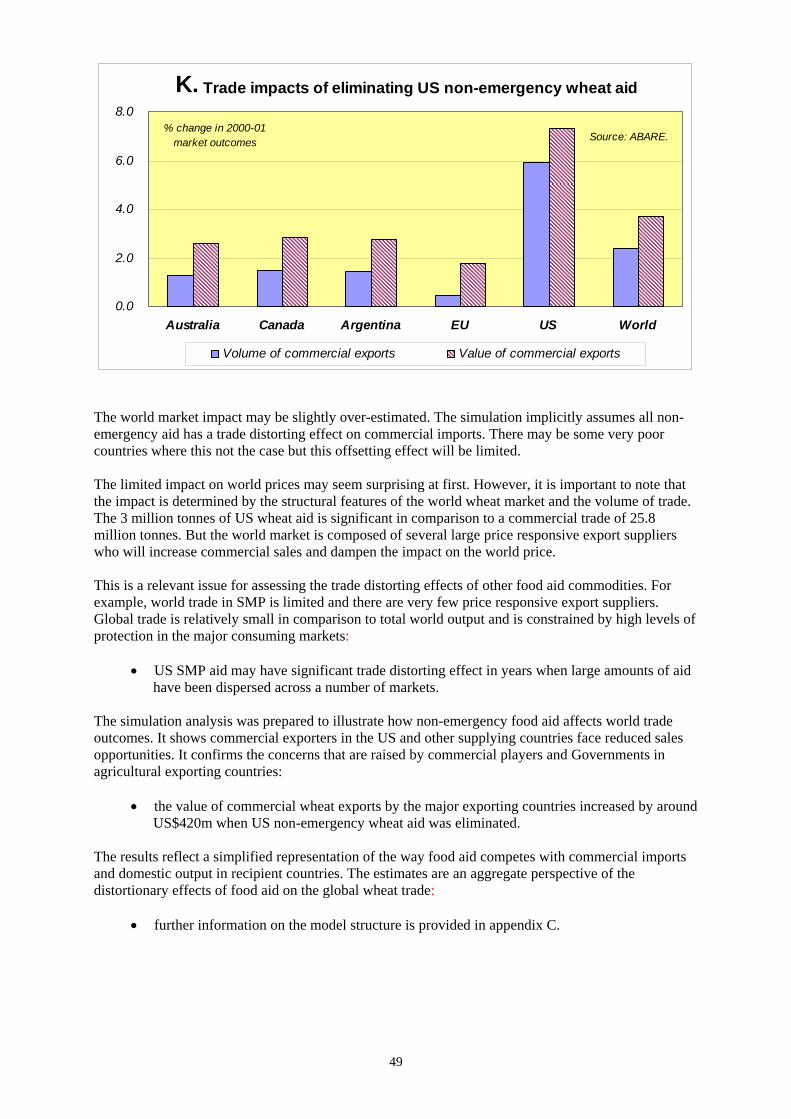
49
K. Trade impacts of eliminating US non-emergency wheat aid
0.0
2.0
4.0
6.0
8.0
Australia Canada Argentina EU US World
Source: ABARE.% change in 2000-01
market outcomes
Volume of commercial exports Value of commercial exports
The world market impact may be slightly over-estimated. The simulation implicitly assumes all non-emergency aid has a trade distorting effect on commercial imports. There may be some very poor countries where this not the case but this offsetting effect will be limited. The limited impact on world prices may seem surprising at first. However, it is important to note that the impact is determined by the structural features of the world wheat market and the volume of trade. The 3 million tonnes of US wheat aid is significant in comparison to a commercial trade of 25.8 million tonnes. But the world market is composed of several large price responsive export suppliers who will increase commercial sales and dampen the impact on the world price. This is a relevant issue for assessing the trade distorting effects of other food aid commodities. For example, world trade in SMP is limited and there are very few price responsive export suppliers. Global trade is relatively small in comparison to total world output and is constrained by high levels of protection in the major consuming markets:
• US SMP aid may have significant trade distorting effect in years when large amounts of aid have been dispersed across a number of markets.
The simulation analysis was prepared to illustrate how non-emergency food aid affects world trade outcomes. It shows commercial exporters in the US and other supplying countries face reduced sales opportunities. It confirms the concerns that are raised by commercial players and Governments in agricultural exporting countries:
• the value of commercial wheat exports by the major exporting countries increased by around US$420m when US non-emergency wheat aid was eliminated.
The results reflect a simplified representation of the way food aid competes with commercial imports and domestic output in recipient countries. The estimates are an aggregate perspective of the distortionary effects of food aid on the global wheat trade:
• further information on the model structure is provided in appendix C.

50

51
5. Concluding comments Food aid is a long standing contentious issue that raises questions about market distortions and the welfare considerations of humanitarian assistance. Some people view it from a welfare perspective. It is seen as a humanitarian response to relieve human suffering from food shortages or malnutrition. Wealthy countries have a moral obligation to donate food to people in disadvantaged situations. But this view ignores the economic impact on market conditions in recipient countries and world trade. Food aid is a substitute for commercial imports. It reduces the demand for those imports and displaces product onto the world market. It also has unintended consequences for rural communities in the recipient countries that can have significant welfare implications:
• in low income developing countries the rural sector is dominated by small scale, semi-subsistence farmers with a limited capacity to generate a cash income;
• food aid that is sold or distributed in non-targeted ways in the local market will penalise poor farmers and work against efforts to alleviate rural poverty.
Recipient country concerns about food aid Circumstances can arise where food and other forms of assistance are necessary on welfare grounds. Short term emergencies caused by natural or man-made disasters can severely disrupt normal food supplies. There may be occasions where individuals need temporary assistance because they don’t have the cash or farming resources to meet their basic food needs. These sorts of situations may require a prompt short term response to avoid a loss human life. Food aid would seem to be a logical response to help people who appear to have a food consumption deficiency. However, a lot of food aid is provided in ways that have market distortion effects on the rural industries of recipient countries. It has unintended consequences in lower prices and lower farm incomes which disrupts long term industry development. It occurs when the aid becomes an alternative source of food supplies in the commercial market place and distorts market signals. This happens with monetised food aid. It happens with donated aid that is distributed in ways where it becomes a replacement for commercial purchases. It also happens with some of the aid designated as emergency relief. Only short term aid for ‘real’ emergencies will have minimal distortion affects that can be ignored on humanitarian grounds. Helping disadvantaged people improve their diet is a reasonable welfare objective for donor countries. It is often claimed that monetisation achieves this objective by making food more affordable through the increased commercial availability. But using food aid to lower market prices is a crude, highly distortionary policy response. Monetised food aid is not a targeted form of assistance:
• all consumers, including the wealthy, gain a benefit from the lower prices; • there is no certainty that those in most need will have sufficient income to purchase extra
food even at lower prices; • targeted assistance requires eligibility conditions that exclude those who can afford to pay –
cash assistance for food purchases would be the best response. Sometimes monetised food aid is justified by the objectives of the activities that will be funded by the proceeds. This may involve a targeted food aid distribution program. It may involve technical projects to improve farm performance or remove constraints on rural development. These are worthy objectives from a foreign aid perspective but the finding approach is distortionary and inefficient.
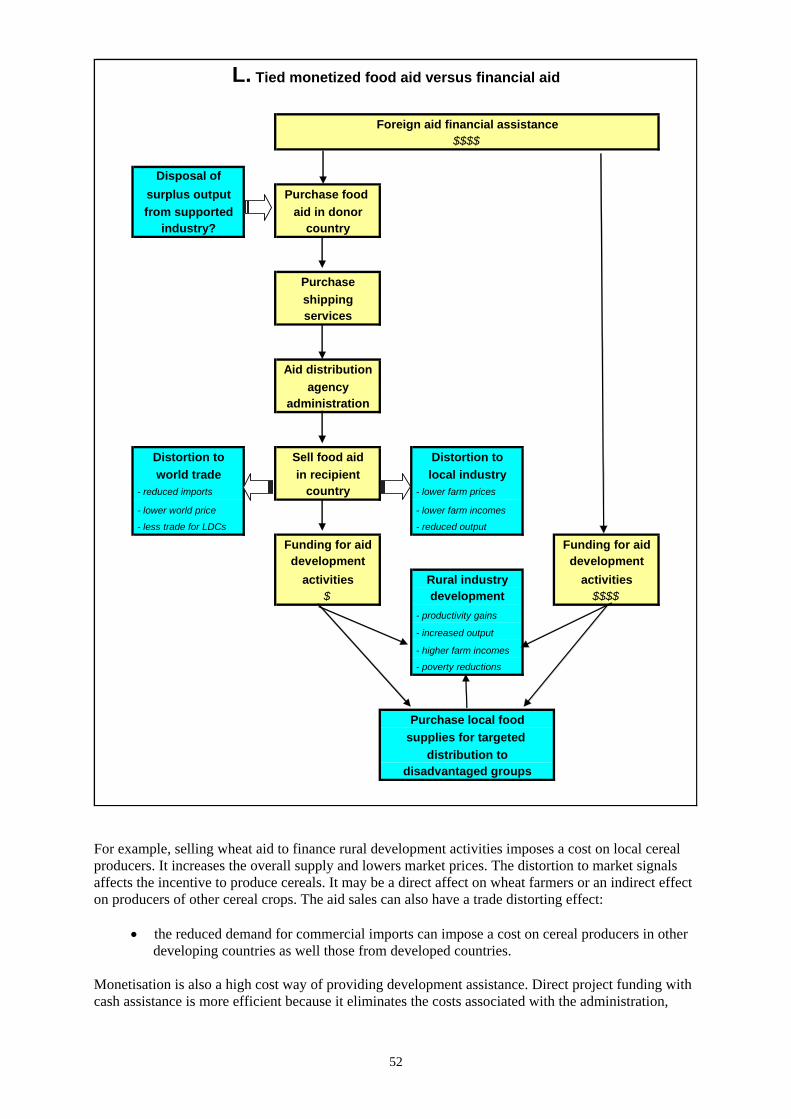
52
Foreign aid financial assistance$$$$
Disposal ofsurplus output Purchase food from supported aid in donor
industry? country
Purchaseshippingservices
Aid distributionagency
administration
Distortion to Sell food aid Distortion toworld trade in recipient local industry
- reduced imports country - lower farm prices
- lower world price - lower farm incomes
- less trade for LDCs - reduced output
Funding for aid Funding for aiddevelopment development
activities Rural industry activities$ development $$$$
- productivity gains
- increased output
- higher farm incomes
- poverty reductions
Purchase local foodsupplies for targeted
distribution todisadvantaged groups
L. Tied monetized food aid versus financial aid
For example, selling wheat aid to finance rural development activities imposes a cost on local cereal producers. It increases the overall supply and lowers market prices. The distortion to market signals affects the incentive to produce cereals. It may be a direct affect on wheat farmers or an indirect effect on producers of other cereal crops. The aid sales can also have a trade distorting effect:
• the reduced demand for commercial imports can impose a cost on cereal producers in other developing countries as well those from developed countries.
Monetisation is also a high cost way of providing development assistance. Direct project funding with cash assistance is more efficient because it eliminates the costs associated with the administration,
53
procurement, shipping, handling and distribution of wheat aid. More funds would be available for projects that promote agricultural development in the recipient countries (chart L). The extent of the negative welfare affects of non-emergency food aid for rural communities will depend on a number of factors. These include:
• the amount of food aid relative to commercial output; • the effectiveness of targeting conditions for distributed aid; • the financial situation of the targeted recipients; • the amount of formal or informal aid monetisation by either the final recipients or aid
agencies in recipient country; and • the magnitude of year-to-year fluctuations in the provision of food aid.
Technical assistance to encourage growth and development of rural industries is the key to sustainable reductions in malnutrition and hunger. It is also a critical factor in alleviating rural poverty along with global trade reforms and infrastructure investment. In general food aid is a distortionary form of assistance that works against the achievement of these objectives. The price received for commercial sales plays an important role in the transition from semi-subsistence agriculture to a more commercial approach. It drives the incentive for change and farm performance improvements. Monetisation and distributed aid that reduces the demand for local output will stifle this incentive:
• it undermines efforts to improve food security by reducing farm returns; • in some situations it could encourage a dependency on food aid.
Wheat aid is a good example. There is a conflict between the overall aim of promoting food security and selling wheat aid in competition with local producers. Food security is a long term issue associated with sustainable growth in wheat production. Food aid is a short term assistance measure that often involves a temporary increase in wheat supplies. Food security would be enhanced by improving the productive capacity of domestic wheat farmers. This can be encouraged by directly funding technical projects aimed at productivity improvements and gains in farm performance. The key drivers in adopting project results and expanding production is effective extension efforts and higher market returns:
• selling wheat aid is a disincentive to expand wheat production; • increased domestic output through the efforts of technical aid projects will also lead to lower
prices but farmers will benefit from higher incomes. If targeted food aid is necessary the best approach is to provide cash for food purchases from a convenient source of supply. It is a more flexible form of assistance and it allows the aid to be matched up with the dietary preferences of recipients. It can lead to more timely distributions by avoiding logistical delays that can sometimes arise with tied food aid. In procuring the food aid the cash would be better spent in the recipient country. In effect the cash would be used to purchase and redistribute some of the available food supplies to those in need. This would eliminate the market distortion effects that can arise from distributing tied food aid:
• food aid provided as cash donations would raise returns, increase farm incomes and strengthen the incentive to increase production.
If there are insufficient supplies in the recipient country the aid should be purchased from the most convenient source of supply. This may be from other developing countries which would have beneficial effects for other farmers at a similar stage of development. The assistance should not be tied to purchases or physical transfers from the donor country.
54
In recent times the amount of aid provided for emergency purposes has expanded. It increased substantially in 1999 and has remained at relatively high levels ever since. There are concerns about the legitimacy of some of this aid. Wealthy countries have a moral obligation to help people facing sudden disruptions in food supplies. But the definition of what constitutes emergency relief is a relatively lose concept. There is no internationally accepted definition of what constitutes an emergency situation and aid donors are free to interpret the concept as they wish. A commonly accepted view is that it refers to a severe food shortage caused by unusual events such as natural disasters, armed conflicts, etc. The circumstances often involve a localised, short term deficiency in food supplies. The definitional issue is important because there is a need to identify the emergency aid that has minimal market distorting effects on imports and domestic production. It would provide a basis for identifying the aid transactions that should be subjected to WTO disciplines. Legitimate, short term emergency aid should be exempt from any quantitative disciplines. But it must be tightly defined to prevent the exemption from being abused:
• other types of food aid should be subjected to quantitative disciplines because to varying degrees they will have a market distortion affect;
• some aid currently deemed to be emergency relief could fall into this category. The provision of emergency food aid for supply deficiencies caused by seasonal conditions and economic or physical constraints is a contentious issue. The notion of supply shortages is a subjective, descriptive judgement about market conditions. Prices will adjust to reflect changes in supply and demand if market forces are not constrained by policy interventions. In these situations un-targeted food aid will have a direct impact on commercial trade:
• these sorts of supply deficiencies typically lead to higher domestic prices which encourages future production growth and higher imports;
• food aid will distort these price signals and provide a non-targeted benefit to all consumers, including wealthy people, at the expense of farmers;
• if people in extreme poverty can’t purchase all of their basic food needs they should directly receive targeted financial assistance to overcome their food intake deficit.
There may be a need for short term humanitarian relief in some of these situations. But it should be subjected to close scrutiny. The food aid should be limited to those who are severely affected to minimise the market distortion effects. It should be subject to WTO disciplines to ensure the targeting conditions are effective. A process for monitoring the impact on market conditions is also required. The increased emphasis on emergency aid looks unusual because previously it has fluctuated around lower levels. It appears to be driven by the high levels of US food aid since 1999 – aid from the EU, Canada and Australia declined during this period. Non-emergency aid was an emerging issue in the Doha discussions on export assistance policies. This may have encouraged some donors to classify more of their aid as emergency relief. Recent trends in US wheat aid provide a useful example. PL480 Title 2 wheat aid currently accounts for about 75% of total wheat aid. It increased from 1,113 kt in 2000-01 to 1,881 kt in 2004-05 and then declined. PL480 Title 2 aid is not solely used for emergency situations. But the data suggests there might have been a conscious decision to favour this program at the expense of others. US policy on the provision of food aid has changed in recent years. They are reducing the use of concessional food aid sales to promote US exports. They are also reducing the role of surplus disposals in food aid programs (USGAO 2002). Implementation of this policy has reduced the amount of wheat aid distributed through the PL480 Title 1 and Section 416(b) programs.

55
Favourable conditions in the wheat market have limited domestic concerns about this change in policy. But the ultimate effect may simply be an increase in the amount of PL480 Title 2 wheat aid that is classified as emergency relief. Political pressures to use food aid for surplus disposals will re-emerge if market conditions deteriorate. So it is important to establish a definition of emergency relief though the WTO and introduce effective disciplines on the use of food aid.
Trade concerns about food aid It is generally accepted that food aid has a trade distorting affect (FAO 2005a). A lot of food aid is distributed in ways that reduces the demand for commercially priced imports in the recipient country. In some cases commercial imports are displaced onto other markets and world prices are reduced. In other cases the food aid disrupts the opportunity for a commercial trade to become established. But there are some situations where the trade distorting affects will be limited. Food aid for legitimate short term emergency relief will generally have minimal trade distorting effects. In some cases food aid is directed into countries where there is no opportunity for commercial imports because of the prevailing price level. There may also be situations where food aid is given to people that don’t have the capacity to make extra food purchases from either imported or domestic sources. There are difficulties in measuring the extent of the import displacement effects of food aid. It depends on a number of factors including:
• the amount of food aid and the level of commercial imports; • the substitutability of food aid commodities with commercial imports; • the degree of formal or informal monetisation in markets where imports are an alternative
source of food supplies; • the effectiveness of targeting conditions for distributed aid; and • the degree to which distributed aid becomes a replacement for food purchases.
In general much of the world’s food aid will have some sort of trade distorting affect because it is directed into food deficit countries. It is an alternative source of food supplies and in most cases commercial imports are helping to address the deficit. For the two US food aid products that were examined – wheat and SMP – a lot of aid was sent to countries where commercial imports were already contributing to the nation’s food supplies. Aid distributed to people in need can have a trade displacement effect if it ‘leaks’ into the market place or it’s used as a replacement for commercial purchases. The effectiveness of the targeting conditions is a key consideration. To be non-distorting the food aid needs to be fully consumed by those who have no capacity to make extra food purchases. Monetised aid that is sold in competition with commercially priced imports has a direct distortionary affect. It is equivalent to the disbursement of subsidised exports from the donor country in that it reduces the demand for imports from other sources:
• food aid provided through a concessional loan is an implicit form export assistance and should be viewed the same as export subsidies and export credits;
• the PL480 Title 1 program used by the US has a market development objective and should be treated as subsidised exports in line with existing WTO constraints.
Recent developments in US wheat and SMP food aid were examined to illustrate how it is distributed in the major recipient countries. The US is the world’s largest supplier of food aid and at times these commodities have been a source of concern for commercial exporters. For both commodities the food aid was mostly directed into countries where a commercial import trade was established. There is little doubt that a lot of the aid had some trade distorting effects. USDA

56
announcements indicate that most of the non-emergency aid was monetised. The aid dispersed by USAID may have been less distortionary although it is important to note that:
• the PL480 Title 2 program was hardly used for SMP food aid; • PL480 Title 2 wheat aid included development assistance – some of this aid would have
been monetised; and • there are questions about the ‘legitimacy’ of some of the emergency relief – some wheat
may have been distributed in situations that had a trade distorting effect. The other trade related concern about the use of food aid is the objectives of donor countries. Many people see food aid as a form of adjustment assistance to help disadvantaged people. A needs based approach to the provision of aid would see a targeted flow of products to particular countries that matched up with the food consumption preferences of the final recipients. However, the historical evidence shows large fluctuations in food aid that have been mainly driven by surplus disposals from donor countries. Most of the aid involves cereal products such as wheat, rice and coarse grains. During periods of low grain prices and/or high stocks the level of food aid has increased. When prices are high and/or stocks are limited the volume of aid has declined. This approach to the use of food aid has not altered since the UR Agreement on Agriculture was implemented. For some donors the use of food aid has more to do with export market development. It is also apparent that some donors have continued to use food aid as a form of indirect price support at certain times:
• for some commodities the fluctuations in the supply of food aid is directly linked to market support programs and industry support policies in donor countries;
• it is seen to be an additional external outflow of product at times of excess supplies on the domestic market.
Examples of the use of food aid by particular donors were examined for three commodities – wheat and SMP from the United States and rice from Japan. In each case the increased provision of food aid was associated with the pressure of surpluses generated by industry support policies. The aid was not driven some pressing needs in the recipient countries. It was based on:
• a need to support market returns; and/or • a need to dispose of surplus output that was affecting the sustainability of the support
mechanisms. For example, surplus output at a time of highly competitive export conditions was a catalyst for expanding US wheat aid in the late 1990s. It helped to relieve some of the internal market pressures created by direct assistance to the wheat industry. Japanese rice aid also shows a clear link to domestic supply pressures. In selected years rice food aid was increased to help reduce the large public stocks of rice. The supply pressures were created by market access opportunities established in the UR Agreement on Agriculture and the lack of alternative export assistance measures – Japan did not have a WTO allowance for subsidised rice exports. US SMP aid is clearly linked to domestic market support activities. It is used in conjunction with subsidised exports to dispose of surplus output created by the SMP price support program. The food aid has been used a form of export assistance for SMP for many years. It was used to relieve supply pressures that developed when the WTO restrictions on subsidised SMP exports were fully utilised in the late 1990s. In each example the donors have taken advantage of the fact there were no WTO restrictions on the use of food aid. The major objectives of the Doha trade negotiations are to reduce trade distortions caused by subsidised exports, domestic support and market access restrictions. If food aid continues to
57
be used in this way it will reduce the pressure for supply adjustments in supported industries that are expected to flow from WTO trade reforms:
• there is a need for WTO disciplines on the use of food aid because of the potential to weaken the benefits of trade liberalisation measures in other areas.
Monetised aid is not much different from a subsidised export sale. The aid is donated to a distributing agency in the recipient country. They will aim to sell the food aid as soon as possible in order to realise the proceeds for other purposes. In comparison to sellers of commercial imports the incentive to maximise market returns is weaker:
• the disposal of monetised aid is similar to selling imports that were purchased with the assistance of a large subsidy;
• the availability of lower cost imports puts downward pressure on market prices and reduces the demand for commercially priced imports.
The Doha trade negotiations provide an opportunity to introduce some disciplines on the use of food aid. The disciplines should apply to all distributors of food aid – donor country governments, NGOs and international organisations. A WTO agreement will need to make sure humanitarian relief for legitimate emergencies is still provided. It will also need to allow for effectively targeted, short term assistance to people suffering from severe food consumption deficits. To minimise the market distorting effects of food aid the following reforms are necessary:
• Specification of a set of principles for declaring an emergency situation. • Nomination of an international organisation to make declarations of emergency situations • Estimation of the emergency relief needs and monitor the effectiveness of aid distribution. • Limitation of the total amount of emergency aid to the estimated relief needs and require all
donors to have their emergency aid approved by the organisation. • Elimination of food aid provided as concessional loans or include it as a component of
current WTO constraints on subsidised exports where they exist. • Elimination of monetised food aid and replace it with untied cash assistance for
development projects or untied distributed food aid with effective targeting conditions. • Limitations placed on the distribution of non-emergency food aid to target groups that meet
eligibility conditions which reflect the objective of minimising market distortion effects. • Requirement for nominated international organisation to assess and approve non-emergency
food aid and to monitor the impact on market conditions in the recipient countries. • Requirement of donors to notify the organisation of all non-emergency food aid and cash
assistance for the purchase of extra food supplies. • Elimination of non-emergency food aid for commodities that benefit from industry support
policies.

58
59
References AFFA (Agriculture, Fisheries and Forestry Australia) 1998, CSSD notification by the United States –Russian food aid, Private communication of CSSD notification, 14 December, Canberra. Agra Europe 2006, Preserved Milk, Report No. 266 (and previous issues), December, Tunbridge Wells UK. Childs, J. and Blayney, D. 2006, Rice Backgrounder, USDA Electronic Outlook Report, RCS-2006-01, Washington DC. FAO (Food and Agriculture Organisation) 2005a, Food Aid in the Context of International and Domestic Markets and the Doha Round, FAO Trade Policy Brief No. 8, Rome. ––– 2005b, Food Aid in the Context of International and Domestic Markets and the Doha Round, FAO Trade Policy Technical Notes No. 8, Rome. Oxfam International 2005, Food Aid or Hidden Dumping, Oxfam Briefing Paper No. 71, March. Fukuda, H., Dyck, J. and Stout, J. 2003, Rice Sector Policies in Japan, USDA Electronic Outlook Report, RCS-0303-01, Washington DC. Miller, J. and Blayney, D. 2006, Dairy Backgrounder, USDA Electronic Outlook Report, LDP-M-145-01, Washington DC. Podbury, T., Roberts, I., Apelu, T. and Buetre, B. 2001, Agricultural Export Measures in WTO Negotiations, ABARE Research Report 01.12 and RIRDC Publication No. 01/134, Canberra. Roberts, I. 1997, Australia and the Next Multilateral Trade Negotiations for Agriculture, ABARE Research Report 97.6, Canberra. USAID (United States Agency for International Development) 2003, Humanitarian Assistance Food for Peace: Non-Fat Dry Milk Cable, Food for Peace Non-Emergency Program References, www.usaid.gov/our_work/humanitarian_assistance/ffp, viewed 30 January 2004. ––– 2004, US International Food Assistance Report 2002, Annual report prepared by USAID (and previous reports), February, Washington, DC. USDA (United States Department of Agriculture) 1993, 1992-93 Dairy Price Support Program, Agricultural Stabilisation and Conservation Service (ASCS) Commodity Fact Sheet, June, Washington, DC. ––– 1999, Agricultural Export Assistance Update: Quarterly Report FY 1999 Summary, Foreign Agriculture Service Summary Report, www.fas.usda.gov/excredits/quarterly/1999, viewed 25 July 2006. ––– 2000, Japan Grain and Feed – Japan’s Surplus Rice Situation, MAFF’s Latest Policy Measures, Foreign Agriculture Service GAIN Report No. JA0105, 22 September, Washington, DC. ––– 2001, Report to Congress on Food Aid Monetisation, Report prepared by the Foreign Agriculture Service of the USDA, 10 August, Washington, DC. ––– 2003, Japan Grain and Feed – Japan’s Proposed Rice Reforms, Foreign Agriculture Service GAIN Report No. JA3012, 20 February, Washington, DC.
60
––– 2005, Dairy: World markets and Trade, Foreign Agriculture Service Report No. FD 2-05 (and previous reports), December, Washington, DC. ––– 2006a, Japan Grain and Feed - Annual Report 2006, Foreign Agriculture Service GAIN Report No. JA6012 (and previous annual reports on Japan grain and feed), 2 March, Washington, DC. ––– 2006b, Wheat Situation and Outlook Yearbook, Economic Research Service Report No. WHS-2006, May, Washington, DC. ––– 2006c, Livestock Dairy & Poultry Outlook, Economic Research Service Report No. LDP-M-150 (and previous reports), December, Washington, DC. ––– 2006d, Food Aid, Foreign Agriculture Service Fact Sheet, March, Washington, DC. ––– 2006e, Japan Grain and Feed – MAFF Needs to Reduce Stocks of Imported Rice, Board of Audit Says, Foreign Agriculture Service GAIN Report No. JA6060, 2 November, Washington, DC. ––– 2006f, Dairy Export Incentive Program, Foreign Agriculture Service Fact Sheet, March, Washington, DC. ––– 2006g, PSD Online Database, Foreign Agriculture Service database on production, supply and distribution of agricultural products, www.fas.usda.gov/psdonline/psdQuery, viewed 15 December 2006. ––– 2006h, Export Assistance, Food Aid and Market Development Programs: Summary of Program Activity FY 2006, Foreign Agriculture Service Online Report (and previous reports), www.fas.usda.gov/excredits/foodaid/reports, viewed 15 April 2007. ––– 2007, FASonline News Releases, Foreign Agriculture Service news releases on export assistance programs, www.fas.usda.gov/scriptsw/PressRelease/pressrel_dout, viewed 20 February 2007. USGAO (United States General Accounting Office) 2002, Food Aid: Experience of US Programs Suggests Opportunities for Improvement, Statement by the GAO in testimony before a subcommittee of the US Senate Committee on Government Affairs, GAO Report No. GAO-02-801T, June, Washington, DC. WFP (World Food Program) 2004, WFP in Statistics 2004, June, Rome. ––– 2005, World Food Program Annual Report 2004, Rome. ––– 2006, Food Aid Monitor – June 2006, www.wfp.org/interfais, viewed 25 July 2006. WTO (World Trade Organisation) 1998, Committee on Agriculture: Review of Food Aid Levels, Document no. G/AG/W/36, 3 November, Geneva. ––– 2004a, Committee on Agriculture Notification from the European Communities: Imports under Tariff Quotas, Document no. G/AG/N/EEC/48 (and previous notifications on tariff quota commitments), 27 February, Geneva. ––– 2004b, Committee on Agriculture Notification from the United States of America: Export Subsidy Commitments, Document no. G/AG/N/USA/53 (and previous notifications on export subsidy commitments), 2 June, Geneva. ––– 2005a, Committee on Agriculture Notification from Japan: Export Subsidy Commitments, Document no. G/AG/N/JPN/106 (and previous notifications on export subsidy commitments), 14 January, Geneva.
61
––– 2005b, Committee on Agriculture Notification from the European Communities: Export Subsidy Commitments, Document no. G/AG/N/EEC/52 (and previous notifications on export subsidy commitments), 16 February, Geneva. ––– 2005c, Committee on Agriculture Notification from the United States of America: Imports under Tariff Quotas, Document no. G/AG/N/USA/54 (and previous notifications on tariff quota commitments), 17 February, Geneva. ––– 2006a, Committee on Agriculture Notification from Canada: Export Subsidy Commitments, Document no. G/AG/N/CAN/55 (and previous notifications on export subsidy commitments), 6 January, Geneva. ––– 2006b, Committee on Agriculture Notification from Canada: Imports under Tariff Quotas, Document no. G/AG/N/CAN/63 (and previous notifications on tariff quota commitments), 20 October, Geneva. ––– 2006c, Chairperson’s Revised Reference Paper on Food Aid, Discussion paper prepared on the 10th of May 2006 by the Chairman of the Committee on Agriculture Special Session – Export Competition, www.wto.org, viewed 15 November 2006. ––– 2007, Committee on Agriculture Notification from Japan: Imports under Tariff Quotas, Document no. G/AG/N/JPN/123 (and previous notifications on tariff quota commitments), 13 February, Geneva.

62
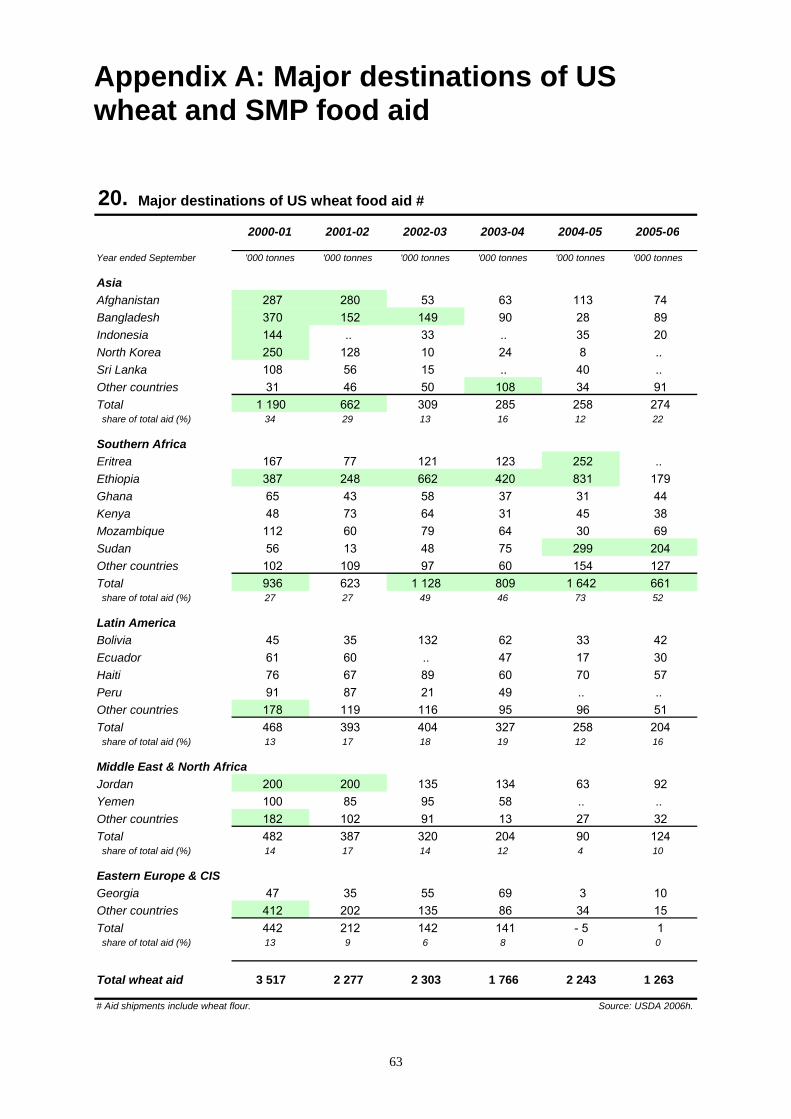
63
Appendix A: Major destinations of US wheat and SMP food aid 20. Major destinations of US wheat food aid #
2000-01 2001-02 2002-03 2003-04 2004-05 2005-06
Year ended September '000 tonnes '000 tonnes '000 tonnes '000 tonnes '000 tonnes '000 tonnes
AsiaAfghanistan 287 280 53 63 113 74Bangladesh 370 152 149 90 28 89Indonesia 144 .. 33 .. 35 20North Korea 250 128 10 24 8 ..Sri Lanka 108 56 15 .. 40 ..Other countries 31 46 50 108 34 91Total 1 190 662 309 285 258 274 share of total aid (%) 34 29 13 16 12 22
Southern AfricaEritrea 167 77 121 123 252 ..Ethiopia 387 248 662 420 831 179Ghana 65 43 58 37 31 44Kenya 48 73 64 31 45 38Mozambique 112 60 79 64 30 69Sudan 56 13 48 75 299 204Other countries 102 109 97 60 154 127Total 936 623 1 128 809 1 642 661 share of total aid (%) 27 27 49 46 73 52
Latin AmericaBolivia 45 35 132 62 33 42Ecuador 61 60 .. 47 17 30Haiti 76 67 89 60 70 57Peru 91 87 21 49 .. ..Other countries 178 119 116 95 96 51Total 468 393 404 327 258 204 share of total aid (%) 13 17 18 19 12 16
Middle East & North AfricaJordan 200 200 135 134 63 92Yemen 100 85 95 58 .. ..Other countries 182 102 91 13 27 32Total 482 387 320 204 90 124 share of total aid (%) 14 17 14 12 4 10
Eastern Europe & CISGeorgia 47 35 55 69 3 10Other countries 412 202 135 86 34 15Total 442 212 142 141 - 5 1 share of total aid (%) 13 9 6 8 0 0
Total wheat aid 3 517 2 277 2 303 1 766 2 243 1 263
# Aid shipments include wheat flour. Source: USDA 2006h.

64
21. Major destinations of US SMP food aid #
2000-01 2001-02 2002-03 2003-04 2004-05 2005-06
Year ended September '000 tonnes '000 tonnes '000 tonnes '000 tonnes '000 tonnes '000 tonnes
AsiaAfghanistan .. 5 7 .. .. ..Indonesia .. 9 2 10 5 ..Pakistan .. 4 .. 5 1 ..Philippines 2 4 4 .. 3 ..North Korea .. 5 9 4 .. ..Vietnam 1 1 1 4 .. ..Other countries .. 6 .. 1 2 5Total 3 34 22 23 11 5 share of total aid (%) 14 66 30 28 29 33
Southern AfricaNigeria 2 .. 2 .. .. ..Other countries 1 0 1 1 1 ..Total 3 0 3 1 1 0 share of total aid (%) 12 1 4 1 1 0
Latin AmericaEl Salvador 1 .. 1 7 0 1Dominican Republic .. 1 2 3 .. ..Guatemala 0 .. 7 9 0 1Guyana 0 0 2 2 .. ..Haiti .. .. 5 5 .. ..Honduras .. 0 2 2 .. ..Jamaica 1 .. 5 5 .. 1Nicaragua 1 .. 3 2 .. ..Other countries 1 3 4 1 9 ..Total 5 4 30 36 9 2 share of total aid (%) 23 8 40 44 24 17
Middle East & North AfricaIraq .. .. 10 .. .. ..Yemen 8 8 .. 10 .. ..Other countries .. .. 1 1 .. ..Total 8 8 11 11 0 0 share of total aid (%) 32 16 14 13 0 0
Eastern Europe & CISGeorgia .. 0 .. 4 3 2Kazakhstan .. .. .. 7 14 6Other countries 4 5 8 1 1 ..Total 4 5 8 12 17 7 share of total aid (%) 19 9 11 14 46 51
Total SMP aid 23 51 75 81 37 14
# Excludes SMP used as an ingredient in corn soy milk (CSM) preparations. Source: USDA 2006h.
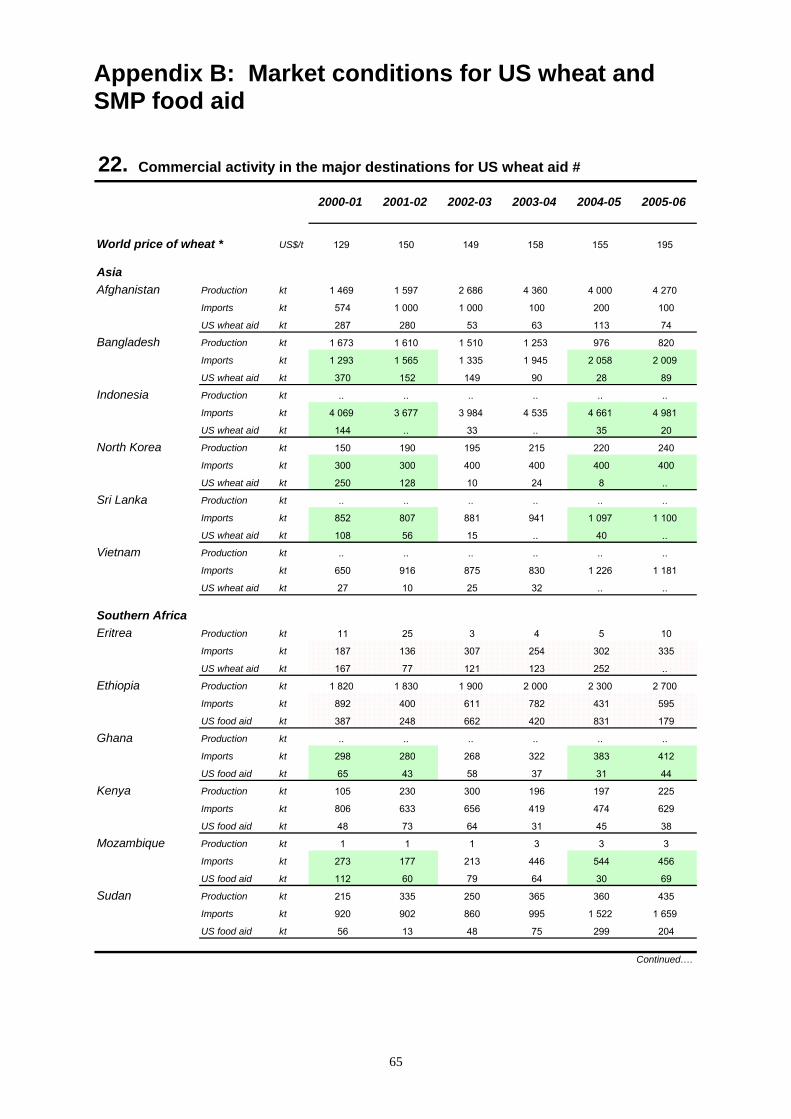
65
Appendix B: Market conditions for US wheat and SMP food aid 22. Commercial activity in the major destinations for US wheat aid #
2000-01 2001-02 2002-03 2003-04 2004-05 2005-06
World price of wheat * US$/t 129 150 149 158 155 195
AsiaAfghanistan Production kt 1 469 1 597 2 686 4 360 4 000 4 270
Imports kt 574 1 000 1 000 100 200 100
US wheat aid kt 287 280 53 63 113 74
Bangladesh Production kt 1 673 1 610 1 510 1 253 976 820
Imports kt 1 293 1 565 1 335 1 945 2 058 2 009
US wheat aid kt 370 152 149 90 28 89
Indonesia Production kt .. .. .. .. .. ..
Imports kt 4 069 3 677 3 984 4 535 4 661 4 981
US wheat aid kt 144 .. 33 .. 35 20
North Korea Production kt 150 190 195 215 220 240
Imports kt 300 300 400 400 400 400
US wheat aid kt 250 128 10 24 8 ..
Sri Lanka Production kt .. .. .. .. .. ..
Imports kt 852 807 881 941 1 097 1 100
US wheat aid kt 108 56 15 .. 40 ..
Vietnam Production kt .. .. .. .. .. ..
Imports kt 650 916 875 830 1 226 1 181
US wheat aid kt 27 10 25 32 .. ..
Southern AfricaEritrea Production kt 11 25 3 4 5 10
Imports kt 187 136 307 254 302 335
US wheat aid kt 167 77 121 123 252 ..
Ethiopia Production kt 1 820 1 830 1 900 2 000 2 300 2 700
Imports kt 892 400 611 782 431 595
US food aid kt 387 248 662 420 831 179
Ghana Production kt .. .. .. .. .. ..
Imports kt 298 280 268 322 383 412
US food aid kt 65 43 58 37 31 44
Kenya Production kt 105 230 300 196 197 225
Imports kt 806 633 656 419 474 629
US food aid kt 48 73 64 31 45 38
Mozambique Production kt 1 1 1 3 3 3
Imports kt 273 177 213 446 544 456
US food aid kt 112 60 79 64 30 69
Sudan Production kt 215 335 250 365 360 435
Imports kt 920 902 860 995 1 522 1 659
US food aid kt 56 13 48 75 299 204
Continued….

66
22. Commercial activity in major destinations for US wheat aid (continued) #
2000-01 2001-02 2002-03 2003-04 2004-05 2005-06
World price of wheat US$/t 129 150 149 158 155 195
Latin AmericaBolivia Production kt 113 119 113 100 117 117
Imports kt 485 462 356 271 376 329
US food aid kt 45 35 132 62 33 42
Ecuador Production kt 15 12 13 12 10 6
Imports kt 490 431 347 514 416 527
US food aid kt 61 60 .. 47 17 30
Haiti Production kt .. .. .. .. .. ..
Imports kt 222 239 258 262 261 251
US food aid kt 76 67 89 60 70 57
Honduras Production kt .. .. .. .. .. ..
Imports kt 260 170 165 199 212 211
US food aid kt 18 25 48 15 42 24
Peru Production kt 187 194 187 189 159 174
Imports kt 1 451 1 421 1 157 1 488 1 449 1 656
US food aid kt 91 87 21 49 .. ..
Guyana Production kt .. .. .. .. .. ..
Imports kt 55 45 41 49 48 48
US food aid kt 28 25 .. 23 .. ..
Middle East & North AfricaJordan Production kt 29 24 70 15 50 55
Imports kt 650 752 1 147 595 718 999
US food aid kt 200 200 135 134 63 92
Yemen Production kt 141 153 132 124 125 125
Imports kt 2 117 1 761 1 772 1 635 1 853 2 143
US food aid kt 100 85 95 58 .. ..
Eastern Europe & CISGeorgia Production kt 90 300 200 225 185 190
Imports kt 343 481 426 441 845 870
US food aid kt 47 35 55 69 3 10
Russia Production kt 34 450 46 900 50 550 34 100 45 400 47 700
Imports kt 1 604 629 1 045 1 026 1 197 1 282
US food aid kt 32 .. 9 9 3 3
# Food aid is reported for the year ended September. Sources: USDA 2006b, 2006g, 2006h. Production and imports reported on a crop year basis. Food aid and imports include wheat flour.
* US Gulf ports fob price, No. 2 hard red winter wheat, calendar year average (ie 2005-06 signifies 2006).

67
23. Commercial activity in the major destinations for US SMP aid #
2001 2002 2003 2004 2005 2006
World price of SMP * US$/t 2 013 1 326 1 718 2 035 2 200 2 395
AsiaAfghanistan Imports kt 1 7 7 2 1 na
US SMP aid kt .. 5 7 .. .. ..
Indonesia Imports kt 98 110 120 125 135 140
US SMP aid kt .. 9 2 10 5 ..
Pakistan Imports kt 1 3 6 6 5 na
US SMP aid kt .. 4 .. 5 1 ..
Philippines Imports kt 89 100 110 120 87 90
US SMP aid kt 2 4 4 .. 3 ..
North Korea Imports kt 1 5 9 5 2 na
US SMP aid kt .. 5 9 4 .. ..
Vietnam Imports kt 19 27 30 37 39 na
US SMP aid kt 1 1 1 4 .. ..
Bangladesh Imports kt 11 23 16 30 13 na
US SMP aid kt .. 1 0 0 2 4
Southern AfricaNigeria Imports kt 14 14 22 16 19 na
US SMP aid kt 2 .. 2 .. .. ..
Latin AmericaEl Salvador Imports kt 1 3 2 1 2 na
US SMP aid kt 1 .. 1 7 0 1
Dominican Rep Imports kt 4 6 3 5 3 na
US SMP aid kt .. 1 2 3 .. ..
Guatemala Imports kt 2 1 2 1 3 na
US SMP aid kt 0 .. 7 9 0 1
Guyana Imports kt 1 1 1 2 1 na
US SMP aid kt 0 0 2 2 .. ..
Haiti Imports kt 1 0 0 4 0 na
US SMP aid kt .. .. 5 5 .. ..
Honduras Imports kt 2 1 2 2 1 na
US SMP aid kt .. 0 2 2 .. ..
Jamaica Imports kt 7 5 4 5 4 na
US SMP aid kt 1 .. 5 5 .. 1
Nicaragua Imports kt 1 0 2 2 0 na
US SMP aid kt 1 .. 3 2 .. ..
Middle East & North AfricaIraq Imports kt 13 18 31 4 12 na
US SMP aid kt .. .. 10 .. .. ..
Yemen Imports kt 26 31 37 17 12 na
US SMP aid kt 8 8 .. 10 .. ..
Eastern Europe & CISGeorgia Imports kt 0 0 1 13 4 na
US SMP aid kt .. 0 .. 4 3 2
Kazakhstan Imports kt 2 3 9 2 16 na
US SMP aid kt .. .. .. 7 14 6
# Imports reported for the year ended December. Sources: USDA 2005, 2006g, 2006h; FAO 2007. Food aid is reported for the year ended September and exclude SMP used in corn soy milk (CSM) preparations. * Average fob spot price, Northern Europe.

68
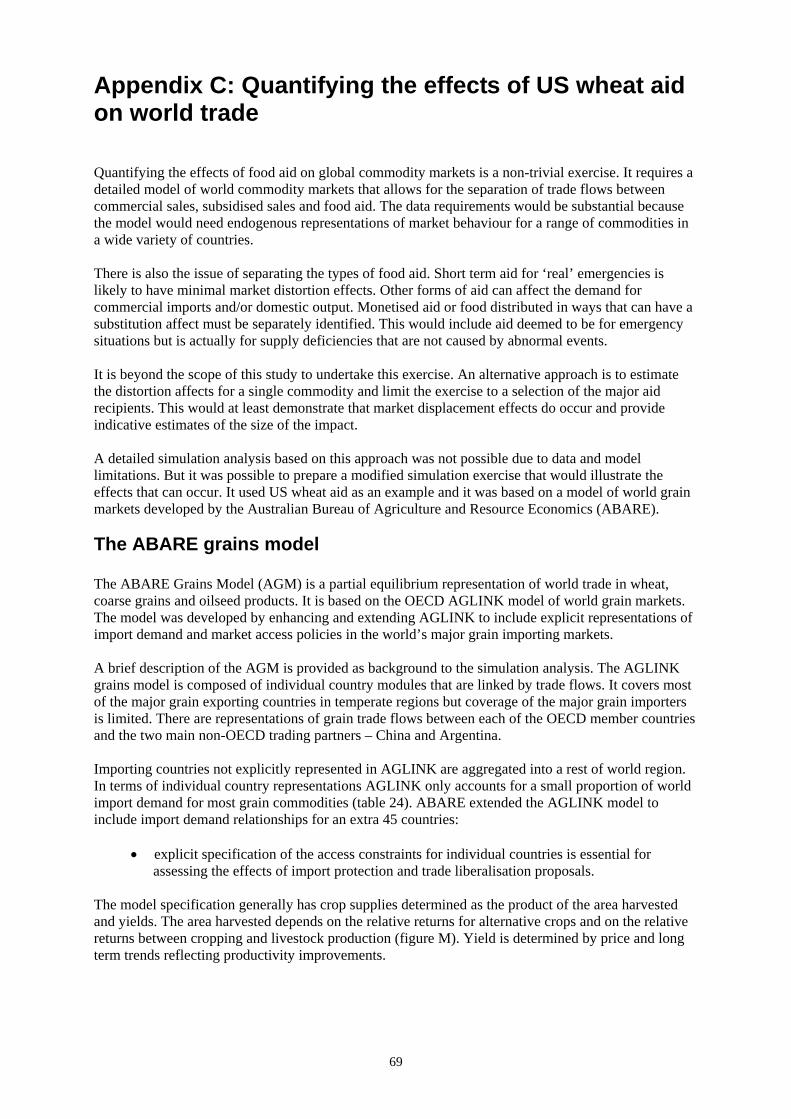
69
Appendix C: Quantifying the effects of US wheat aid on world trade Quantifying the effects of food aid on global commodity markets is a non-trivial exercise. It requires a detailed model of world commodity markets that allows for the separation of trade flows between commercial sales, subsidised sales and food aid. The data requirements would be substantial because the model would need endogenous representations of market behaviour for a range of commodities in a wide variety of countries. There is also the issue of separating the types of food aid. Short term aid for ‘real’ emergencies is likely to have minimal market distortion effects. Other forms of aid can affect the demand for commercial imports and/or domestic output. Monetised aid or food distributed in ways that can have a substitution affect must be separately identified. This would include aid deemed to be for emergency situations but is actually for supply deficiencies that are not caused by abnormal events. It is beyond the scope of this study to undertake this exercise. An alternative approach is to estimate the distortion affects for a single commodity and limit the exercise to a selection of the major aid recipients. This would at least demonstrate that market displacement effects do occur and provide indicative estimates of the size of the impact. A detailed simulation analysis based on this approach was not possible due to data and model limitations. But it was possible to prepare a modified simulation exercise that would illustrate the effects that can occur. It used US wheat aid as an example and it was based on a model of world grain markets developed by the Australian Bureau of Agriculture and Resource Economics (ABARE).
The ABARE grains model The ABARE Grains Model (AGM) is a partial equilibrium representation of world trade in wheat, coarse grains and oilseed products. It is based on the OECD AGLINK model of world grain markets. The model was developed by enhancing and extending AGLINK to include explicit representations of import demand and market access policies in the world’s major grain importing markets. A brief description of the AGM is provided as background to the simulation analysis. The AGLINK grains model is composed of individual country modules that are linked by trade flows. It covers most of the major grain exporting countries in temperate regions but coverage of the major grain importers is limited. There are representations of grain trade flows between each of the OECD member countries and the two main non-OECD trading partners – China and Argentina. Importing countries not explicitly represented in AGLINK are aggregated into a rest of world region. In terms of individual country representations AGLINK only accounts for a small proportion of world import demand for most grain commodities (table 24). ABARE extended the AGLINK model to include import demand relationships for an extra 45 countries:
• explicit specification of the access constraints for individual countries is essential for assessing the effects of import protection and trade liberalisation proposals.
The model specification generally has crop supplies determined as the product of the area harvested and yields. The area harvested depends on the relative returns for alternative crops and on the relative returns between cropping and livestock production (figure M). Yield is determined by price and long term trends reflecting productivity improvements.

70
24. Model representations of world grain and oilseed imports #
AGLINK grains model ABARE grains model
% %
Wheat 25 88Coarse grains 55 93Oilseeds 79 99Oilseed meal 68 93Oilseed oil 21 74Palm oil 30 83
# Based on trade data for 2000-01. Source: ABARE.
Proportion of imports specified as separate country modules
The demand for grain is determined as the sum of human consumption and livestock feed use. Food grain demand depends on the price of the product and the price of substitutes. Demand for feed grain depends on livestock production and the price of other substitute feeds. In most cases the demand for oilseeds is derived from the demand for two processed products – oilseed meal and oilseed oil. Import demand relationships assume that consumers and processors can differentiate between imports and domestic output. It also assumes they can substitute between alternative sources of supply. The model has separate demand for imports and domestically produced grain products. This includes an explicit representation of tariff-quota import restrictions:
• model specifications and elasticity assumptions can be obtained from ABARE.
M. Schematic representation of the AGM
Food
Feed
Area
Yield
Demand SupplyPrice
Price of substitutes
Incomes Crop returns Livestock returns
Price of substitutes
LivestockProductivity
Food
Feed
Food
Feed
Area
Yield
Demand SupplyPriceDemand SupplyPriceDemand SupplyPrice
Price of substitutes
Incomes
Price of substitutes
Incomes Crop returns Livestock returns
Price of substitutes
Livestock
Price of substitutes
LivestockProductivity

71
25. Indicative estimate of US emergency wheat aid #
PL480 Title 2 Other Total Total Shipped as Shipped aswheat aid through wheat wheat wheat food aid emergency
the WFP aid aid exports food aid *Year endedSeptember '000 tonnes '000 tonnes '000 tonnes '000 tonnes % %
2000-01 152 2 957 3 109 25 275 12.3 0.6
# Food aid excludes wheat flour. Source: USDA 2006b, 2006h.* Assumes PL480 Title 2 aid distributed by the WFP is an indicator of aid for 'real' emergency situations.
Simulating the impact of US wheat aid The aim of the simulation experiment was to assess the impact of US wheat aid on the world wheat trade. The assessment was based on the elimination of all non-emergency wheat aid in 2000-01. The analysis involved comparing actual 2000-01 market outcomes with simulated market outcomes for the alternative scenario of US wheat aid:
• the alternative scenario assumed US wheat aid was exogenously fixed at 152 kt; • this is an estimate of emergency wheat aid deliveries in 2000-01; • it means US wheat aid was reduced by 2,957 kt.
Official statistics on the actual level of emergency wheat aid were not available. Emergency relief is administered by USAID through the PL480 Title 2 program. USAID reports did not disaggregate the Title 2 aid into the emergency and development assistance components for individual commodities. For the purposes of the simulation exercise it was assumed that wheat aid for ‘legitimate’ emergencies was equivalent to the PL480 Title 2 aid distributed through the WFP (table 25). The remaining Title 2 aid was assumed to be for other purposes. This should only be regarded as an indicative estimate as there are counterbalancing reasons why the estimate could be higher or lower:
• some of the US wheat aid distributed through the WFP could have been used for aid development activities; and
• some of the remaining PL480 Title 2 wheat aid may have been directly distributed by the United States as emergency relief.
The total amount of PL480 Title 2 wheat aid was 985 kt in 2000-01. This means 833 kt was directly distributed by the United States. Given the size of the aid flow it seems more likely that the estimate used in the simulation experiment has under-estimated the actual level of emergency wheat aid. If this is the case the simulation results will have over-estimated the impact of eliminating non-emergency wheat aid in 2000-01. To conduct the simulation experiment the US module of the AGM had to be modified. US wheat exports were separated into commercial exports and food aid shipments. An export supply equation for US commercial wheat exports was added to the model. The world wheat price determination process remained unchanged from the original model specification. It is determined by equating the aggregate excess demand and supply for wheat:
• the US domestic wheat price is determined by equating aggregate demand for US wheat with total supply.
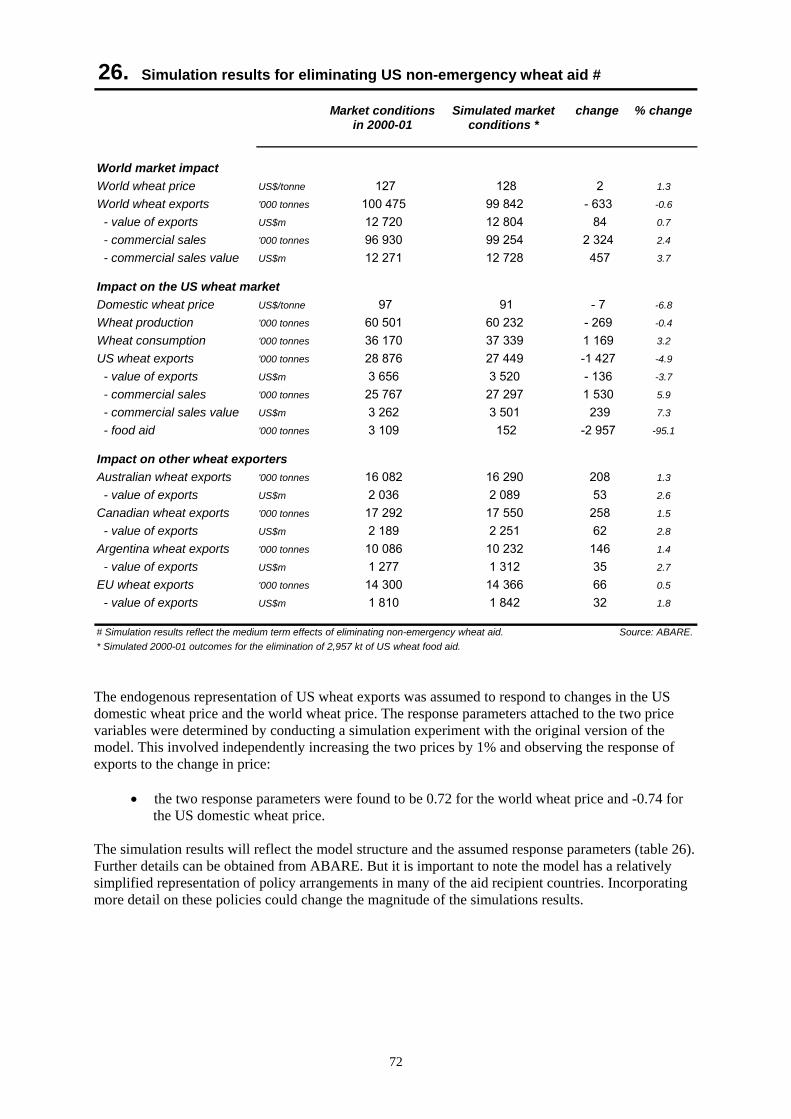
72
26. Simulation results for eliminating US non-emergency wheat aid #
Market conditions Simulated market change % changein 2000-01 conditions *
World market impactWorld wheat price US$/tonne 127 128 2 1.3
World wheat exports '000 tonnes 100 475 99 842 - 633 -0.6
- value of exports US$m 12 720 12 804 84 0.7
- commercial sales '000 tonnes 96 930 99 254 2 324 2.4
- commercial sales value US$m 12 271 12 728 457 3.7
Impact on the US wheat marketDomestic wheat price US$/tonne 97 91 - 7 -6.8
Wheat production '000 tonnes 60 501 60 232 - 269 -0.4
Wheat consumption '000 tonnes 36 170 37 339 1 169 3.2
US wheat exports '000 tonnes 28 876 27 449 -1 427 -4.9
- value of exports US$m 3 656 3 520 - 136 -3.7
- commercial sales '000 tonnes 25 767 27 297 1 530 5.9
- commercial sales value US$m 3 262 3 501 239 7.3
- food aid '000 tonnes 3 109 152 -2 957 -95.1
Impact on other wheat exportersAustralian wheat exports '000 tonnes 16 082 16 290 208 1.3
- value of exports US$m 2 036 2 089 53 2.6
Canadian wheat exports '000 tonnes 17 292 17 550 258 1.5
- value of exports US$m 2 189 2 251 62 2.8
Argentina wheat exports '000 tonnes 10 086 10 232 146 1.4
- value of exports US$m 1 277 1 312 35 2.7
EU wheat exports '000 tonnes 14 300 14 366 66 0.5
- value of exports US$m 1 810 1 842 32 1.8
# Simulation results reflect the medium term effects of eliminating non-emergency wheat aid. Source: ABARE.* Simulated 2000-01 outcomes for the elimination of 2,957 kt of US wheat food aid. The endogenous representation of US wheat exports was assumed to respond to changes in the US domestic wheat price and the world wheat price. The response parameters attached to the two price variables were determined by conducting a simulation experiment with the original version of the model. This involved independently increasing the two prices by 1% and observing the response of exports to the change in price:
• the two response parameters were found to be 0.72 for the world wheat price and -0.74 for the US domestic wheat price.
The simulation results will reflect the model structure and the assumed response parameters (table 26). Further details can be obtained from ABARE. But it is important to note the model has a relatively simplified representation of policy arrangements in many of the aid recipient countries. Incorporating more detail on these policies could change the magnitude of the simulations results.

Photos: Left– African mahogany timber thread stool (by Frank Weisner). Right – African Mahogany - Chess Table (by Paragon Furniture).Front cover – clear f inished African mahogany timber, highlighting typical featuresPhotos: Left– African mahogany timber thread stool (by Frank Weisner). Right – African Mahogany - Chess Table (by Paragon Furniture).Photos: Left– African mahogany timber thread stool (by Frank Weisner). Right – African Mahogany - Chess Table (by Paragon Furniture).Front cover – clear f inished African mahogany timber, highlighting typical featuresFront cover – clear f inished African mahogany timber, highlighting typical features
RIRDCRIRDCInnovation for rural AustraliaInnovation for rural AustraliaRIRDCRIRDCRIRDCRIRDC
Food Aid and Agricultural Trade Reform
Contact RIRDC:Level 2
15 National CircuitBarton ACT 2600
PO Box 4776Kingston ACT 2604
Ph: 02 6271 4100Fax: 02 6271 4199
Email: [email protected]: www.rirdc.gov.au
This publication can be viewed at our website—www.rirdc.gov.au. All RIRDC books can be purchased from:
www.rirdc.gov.au/eshop
by David Harris & AssociatesRIRDC Publication No. 07/136
There are three types of food aid:• Emergency food aid—appropriately targeted assistance
to relieve human suffering when natural disasters or unusual events disrupt normal food supplies
• Project food aid—development projects that address longer term deficiencies in food supplies
• Program food aid—to help disadvantaged countries alleviate balance of payments difficulties or budget constraints
Food aid to prevent the loss of human life in emergency situations is a perfectly reasonable response. However, food aid is a long standing contentious issue that raises questions about market distortions and the welfare considerations of humanitarian assistance.
This study examines the economic impact food aid has on market conditions in recipient countries and world trade. Food aid can be a substitute for commercial imports, reducing the demand for those imports and displacing products onto the world market. It has unintended consequences for rural communities in recipient countries that can have significant welfare implications.
This report is part of RIRDC’s Global Competitiveness R&D Program which aims to identify impediments to the development of a globally competitive Australian agricultural sector and supports research investments on options and strategies for removing these impediments.
Most of our research reports can be downloaded for free or purchased from our website: www.rirdc.gov.au.