Embed Size (px)
Citation preview
Minutes of the Federal Open Market Committee April 26–27, 2011
A joint meeting of the Federal Open Market Commit-tee and the Board of Governors of the Federal Reserve System was held in the offices of the Board of Gover-nors in Washington, D.C., on Tuesday, April 26, 2011, at 10:30 a.m. and continued on Wednesday, April 27, 2011, at 8:30 a.m. PRESENT:
Ben Bernanke, Chairman William C. Dudley, Vice Chairman Elizabeth Duke Charles L. Evans Richard W. Fisher Narayana Kocherlakota Charles I. Plosser Sarah Bloom Raskin Daniel K. Tarullo Janet L. Yellen Christine Cumming, Jeffrey M. Lacker, Dennis P.
Lockhart, Sandra Pianalto, and John C. Wil-liams, Alternate Members of the Federal Open Market Committee
James Bullard, Thomas M. Hoenig, and Eric Ro-
sengren, Presidents of the Federal Reserve Banks of St. Louis, Kansas City, and Boston, respectively
William B. English, Secretary and Economist Deborah J. Danker, Deputy Secretary Matthew M. Luecke, Assistant Secretary David W. Skidmore, Assistant Secretary Michelle A. Smith, Assistant Secretary Scott G. Alvarez, General Counsel Thomas C. Baxter, Deputy General Counsel Nathan Sheets, Economist David J. Stockton, Economist James A. Clouse, Thomas A. Connors, Steven B.
Kamin, Loretta J. Mester, David Reifschneider, Harvey Rosenblum, David W. Wilcox, and Kei-Mu Yi, Associate Economists
Brian Sack, Manager, System Open Market Ac-
count
Jennifer J. Johnson, Secretary of the Board, Office of the Secretary, Board of Governors
Patrick M. Parkinson, Director, Division of Bank-
ing Supervision and Regulation, Board of Governors
Nellie Liang, Director, Office of Financial Stability
Policy and Research, Board of Governors Robert deV. Frierson, Deputy Secretary, Office of
the Secretary, Board of Governors William Nelson, Deputy Director, Division of
Monetary Affairs, Board of Governors Linda Robertson, Assistant to the Board, Office of
Board Members, Board of Governors Charles S. Struckmeyer, Deputy Staff Director, Of-
fice of the Staff Director, Board of Governors Lawrence Slifman and William Wascher, Senior
Associate Directors, Division of Research and Statistics, Board of Governors
Andrew T. Levin, Senior Adviser, Office of Board
Members, Board of Governors Joyce K. Zickler, Visiting Senior Adviser, Division
of Monetary Affairs, Board of Governors Michael G. Palumbo, Associate Director, Division
of Research and Statistics, Board of Gover-nors; Trevor A. Reeve,¹ Associate Director, Division of International Finance, Board of Governors
Fabio M. Natalucci, Assistant Director, Division of
Monetary Affairs, Board of Governors David H. Small, Project Manager, Division of
Monetary Affairs, Board of Governors _______________________ ¹ Attended Tuesday’s session only.
Page 1_____________________________________________________________________________________________
Jeremy B. Rudd, Senior Economist, Division of Research and Statistics, Board of Governors
James M. Lyon, First Vice President, Federal Re-
serve Bank of Minneapolis Jamie J. McAndrews and Mark S. Sniderman, Ex-
ecutive Vice Presidents, Federal Reserve Banks of New York and Cleveland, respectively
David Altig, Alan D. Barkema, Richard P. Dzina,
David Marshall, Christopher J. Waller, and John A. Weinberg, Senior Vice Presidents, Federal Reserve Banks of Atlanta, Kansas City, New York, Chicago, St. Louis, and Richmond, respectively
John Fernald and Giovanni Olivei, Vice Presidents,
Federal Reserve Banks of San Francisco and Boston, respectively
Developments in Financial Markets and the Fed-eral Reserve’s Balance Sheet The Manager of the System Open Market Account (SOMA) reported on developments in domestic and foreign financial markets during the period since the Federal Open Market Committee (FOMC) met on March 15, 2011. He also reported on System open market operations, including the continuing reinvest-ment into longer-term Treasury securities of principal payments received on the SOMA’s holdings of agency debt and agency-guaranteed mortgage-backed securities (MBS) as well as the ongoing purchases of additional Treasury securities first authorized in November 2010. Since November, purchases by the Open Market Desk of the Federal Reserve Bank of New York had in-creased the SOMA’s holdings by $422 billion. The Manager reported on the U.S. authorities’ participation in the coordinated foreign exchange intervention an-nounced by the Group of Seven (G-7) finance minis-ters and central bank governors on March 17, 2011. By unanimous votes, the Committee ratified the Desk’s domestic and foreign exchange market transactions over the intermeeting period.
By unanimous vote, the Committee agreed to extend the reciprocal currency (swap) arrangements with the Bank of Canada and the Banco de México for an addi-tional year beginning in mid-December 2011; these arrangements are associated with the Federal Reserve’s participation in the North American Framework
Agreement of 1994. The arrangement with the Bank of Canada is in the amount of $2 billion equivalent, and the arrangement with the Banco de México is in the amount of $3 billion equivalent. The vote to renew the System’s participation in these swap arrangements was taken at this meeting because of a provision in the ar-rangements that requires each party to provide six months’ prior notice of an intention to terminate its participation.
The staff next gave a presentation on strategies for normalizing the stance and conduct of monetary policy over time as the economy strengthens. Normalizing the stance of policy would entail the withdrawal of the current extraordinary degree of accommodation at the appropriate time, while normalizing the conduct of policy would involve draining the large volume of reserve bal-ances in the banking system and shrinking the overall size of the balance sheet, as well as returning the SOMA to its historical composition of essentially only Treasury securities. The presentation noted a few key issues that the Committee would need to address in deciding on its approach to normalization. The first key issue was the extent to which the Committee would want to tighten policy, at the appropriate time, by in-creasing short-term interest rates, by decreasing its holdings of longer-term securities, or both. Because the two policies would restrain economic activity by tightening financial conditions, they could be combined in various ways to achieve similar outcomes. For ex-ample, in principle, the Committee could accomplish essentially the same degree of monetary tightening by selling assets sooner and faster but raising the target for the federal funds rate later and more slowly, or by sell-ing assets later and more slowly but increasing the fed-eral funds rate target sooner and faster. The SOMA portfolio could be reduced by selling securities outright, by ceasing the reinvestment of principal payments on its securities holdings, or both. A second key issue was the extent to which the Committee might choose to vary the pace of any asset sales it undertakes in re-sponse to economic and financial conditions. If it chose to make the pace of sales quite responsive to conditions, the FOMC would be able to actively use two policy instruments—asset sales and the federal funds rate target—to pursue its economic objectives, which could increase the scope and flexibility for ad-justing financial conditions. In contrast, sales at a pace that varied less with changes in economic and financial conditions and was preannounced and largely prede-termined would leave the federal funds rate target as the Committee’s primary active policy instrument,
Page 2 Federal Open Market Committee_____________________________________________________________________________________________
which could result in policy that is more straightfor-ward for the Committee to calibrate and to communi-cate. Finally, the staff presentation noted that the Committee would need to decide if and when to use the tools that it has developed to temporarily reduce reserve balances—reverse repurchase agreements and term deposits—in order to tighten the correspondence between any changes in the interest rate the Federal Reserve pays on excess reserves and the changes in the federal funds rate.
Meeting participants agreed on several principles that would guide the Committee’s strategy for normalizing monetary policy. First, with regard to the normaliza-tion of the stance of monetary policy, the pace and se-quencing of the policy steps would be driven by the Committee’s monetary policy objectives for maximum employment and price stability. Participants noted that the Committee’s decision to discuss the appropriate strategy for normalizing the stance of policy at the cur-rent meeting did not mean that the move toward such normalization would necessarily begin soon. Second, to normalize the conduct of monetary policy, it was agreed that the size of the SOMA’s securities portfolio would be reduced over the intermediate term to a level consistent with the implementation of monetary policy through the management of the federal funds rate ra-ther than through variation in the size or composition of the Federal Reserve’s balance sheet. Third, over the intermediate term, the exit strategy would involve re-turning the SOMA to holding essentially only Treasury securities in order to minimize the extent to which the Federal Reserve portfolio might affect the allocation of credit across sectors of the economy. Such a shift was seen as requiring sales of agency securities at some point. And fourth, asset sales would be implemented within a framework that had been communicated to the public in advance, and at a pace that potentially could be adjusted in response to changes in economic or fi-nancial conditions.
In addition, nearly all participants indicated that the first step toward normalization should be ceasing to reinvest payments of principal on agency securities and, simultaneously or soon after, ceasing to reinvest prin-cipal payments on Treasury securities. Most partici-pants viewed halting reinvestments as a way to begin to gradually reduce the size of the balance sheet. It was noted, however, that ending reinvestments would con-stitute a modest step toward policy tightening, implying that that decision should be made in the context of the economic outlook and the Committee’s policy objec-tives. In addition, changes in the statement language
regarding forward policy guidance would need to ac-company the normalization process.
Participants expressed a range of views on some as-pects of a normalization strategy. Most participants indicated that once asset sales became appropriate, such sales should be put on a largely predetermined and preannounced path; however, many of those par-ticipants noted that the pace of sales could nonetheless be adjusted in response to material changes in the eco-nomic outlook. Several other participants preferred instead that the pace of sales be a key policy tool and be varied actively in response to changes in the out-look. A majority of participants preferred that sales of agency securities come after the first increase in the FOMC’s target for short-term interest rates, and many of those participants also expressed a preference that the sales proceed relatively gradually, returning the SOMA’s composition to all Treasury securities over perhaps five years. Participants noted that, for any giv-en degree of policy tightening, more-gradual sales that commenced later in the normalization process would allow for an earlier increase of the federal funds rate target from its effective lower bound than would be the case if asset sales commenced earlier and at a more rap-id pace. As a result, the Committee would later have the option of easing policy with an interest rate cut if economic conditions then warranted. An earlier in-crease in the federal funds rate was also mentioned as helpful to limit the potential for the very low level of that rate to encourage financial imbalances. A few par-ticipants expressed a preference that sales begin before any increase in the federal funds rate target, and a few other participants indicated that sales and increases in the federal funds rate target should commence at the same time. The participants who favored earlier sales also generally indicated a preference for relatively rapid sales, with some suggesting that agency securities in the SOMA be reduced to zero over as little as one or two years. Such an approach was viewed as allowing for a faster return to a normal policy environment, potential-ly reducing any upside risks to inflation stemming from outsized reserve balances, and more quickly eliminating any effects of SOMA holdings of agency securities on the allocation of credit.
Most participants saw changes in the target for the fed-eral funds rate as the preferred active tool for tighten-ing monetary policy when appropriate. A number of participants noted that it would be advisable to begin using the temporary reserves-draining tools in advance of an increase in the Committee’s federal funds rate target, in part because doing so would put the Federal
Minutes of the Meeting of April 26-27, 2011 Page 3_____________________________________________________________________________________________
Reserve in a better position to assess the effectiveness of the draining tools and judge the size of draining op-erations that might be required to support changes in the interest on excess reserves (IOER) rate in imple-menting a desired increase in short-term rates. A num-ber of participants also noted that they would be pre-pared to sell securities sooner if the temporary reserves- draining operations and the end of the reinvestment of principal payments were not sufficient to support a fairly tight link between increases in the IOER rate and increases in short-term market interest rates.
In the discussion of normalization, some participants also noted their preferences about the longer-run framework for monetary policy implementation. Most of these participants indicated that they preferred that monetary policy eventually operate through a corridor-type system in which the federal funds rate trades in the middle of a range, with the IOER rate as the floor and the discount rate as the ceiling of the range, as opposed to a floor-type system in which a relatively high level of reserve balances keeps the federal funds rate near the IOER rate. A couple of participants noted that any normalization strategy would likely involve an elevated balance sheet with the federal funds rate target near the IOER rate—as in floor-type systems—for some time, and therefore the Committee would accumulate expe-rience during the process of normalizing policy that would allow it to make a more informed choice regard-ing the longer-term framework at a later date.
The Committee agreed that more discussion of these issues was needed, and no decisions regarding the Committee’s strategy for normalizing policy were made at this meeting.
Staff Review of the Economic Situation The information reviewed at the April 26–27 meeting indicated, on balance, that economic activity expanded at a moderate pace in recent months, and labor market conditions continued to improve gradually. Headline consumer price inflation was boosted by large increases in food and energy prices, but measures of underlying inflation were still subdued and longer-run inflation expectations remained stable.
Private nonfarm payroll employment increased again in March, and the gains in hiring for the first quarter as a whole were somewhat above the pace seen in the fourth quarter. A number of indicators of job open-ings and hiring plans improved in February and March. Although initial claims for unemployment insurance were flat, on net, from early March through the middle of April, they remained lower than earlier in the year.
The unemployment rate edged down further to 8.8 percent in March, while the labor force participa-tion rate was unchanged. However, both long-duration unemployment and the share of workers employed part time for economic reasons were still very high.
Industrial production in the manufacturing sector ex-panded at a robust pace in February and March. The manufacturing capacity utilization rate moved up fur-ther, though it continued to be a good bit lower than its longer-run average. Most forward-looking indicators of industrial activity, such as the new orders indexes in the national and regional manufacturing surveys, re-mained at levels consistent with solid gains in produc-tion in the near term. However, motor vehicle assem-blies were expected to step down in the second quarter from their level in March, reflecting emerging shortages of specialized components imported from Japan.
The rise in consumer spending appeared to have slowed to a moderate rate in the first quarter from the stronger pace posted in the fourth quarter of last year. Total real personal consumption expenditures picked up in February after being about unchanged in January. Nominal retail sales, excluding purchases at motor ve-hicles and parts outlets, posted a sizable gain in March, but sales of new light motor vehicles declined some-what. Real disposable income edged down in February following an increase in January that reflected the tem-porary reduction in payroll taxes. In addition, consum-er sentiment declined noticeably in March and re-mained relatively downbeat in early April.
Activity in the housing market remained very weak, as the large overhang of foreclosed and distressed proper-ties continued to restrain new construction. Starts and permits of new single-family homes inched down, on net, in February and March, and they have been essen-tially flat since around the middle of last year. Demand for housing also continued to be depressed. Sales of new and existing homes moved lower, on net, in Feb-ruary and March, while measures of home prices slid further in February.
Real business investment in equipment and software (E&S) appeared to have increased more robustly in the first quarter than in the fourth quarter of last year. Nominal shipments of nondefense capital goods rose in February and March, and businesses’ purchases of new vehicles trended higher. New orders of nonde-fense capital goods continued to run ahead of ship-ments in February and March, and this expanding backlog of unfilled orders pointed to further increases in shipments in subsequent months. In addition, sur-
Page 4 Federal Open Market Committee_____________________________________________________________________________________________
vey measures of business conditions and sentiment in recent months were consistent with continued robust gains in E&S spending. In contrast, business outlays for nonresidential construction remained extremely weak in February, restrained by high vacancy rates, low prices for office and commercial properties, and tight credit conditions for commercial real estate lending.
Real nonfarm inventory investment appeared to have moved up to a moderate pace in the first quarter after slowing sharply in the preceding quarter. Motor ve-hicle inventories were drawn down more slowly in the first quarter than in the fourth quarter, while data through February suggested that the pace of stock-building outside of motor vehicles had picked up a bit. Book-value inventory-to-sales ratios in February were in line with their pre-recession norms, and survey data in March provided little evidence that businesses per-ceived that their inventories were too high.
The available data on government spending indicated that real federal purchases fell in the first quarter, led by a reduction in defense outlays. Real expenditures by state and local governments also appeared to have de-clined, as outlays for construction projects decreased further in February to a level well below that in the fourth quarter, and state and local employment contin-ued to contract in March.
The U.S. international trade deficit narrowed slightly in February after widening sharply in January. Following a solid increase in January, exports fell back some in February, with declines widespread across categories. Imports also declined in February after posting large gains in January. On average, the trade deficit in Janu-ary and February was wider than in the fourth quarter.
Overall U.S. consumer price inflation moved up further in February and March, as increases in the prices of energy and food commodities continued to be passed through to the retail level. More recently, survey data through the middle of April pointed to additional in-creases in retail gasoline prices, while increases in the prices of food commodities appeared to have mod-erated somewhat. Excluding food and energy, core consumer price inflation remained relatively subdued. Although core consumer price inflation over the first three months of the year stepped up somewhat, the 12-month change in the core consumer price index through March was essentially the same as it was a year earlier. Near-term inflation expectations from the Thomson Reuters/University of Michigan Surveys of Consumers remained elevated in early April. But longer-term inflation expectations moved down in early
April—reversing their uptick in March—and stayed within the range that has prevailed over the past several years.
Available measures of labor compensation suggested that wage increases continued to be restrained by the presence of a large margin of slack in the labor market. Average hourly earnings for all employees were flat in March, and their average rate of increase over the pre-ceding 12 months remained low.
The pace of recovery abroad appeared to have strengthened earlier this year, but the disaster in Japan raised uncertainties about foreign activity in the near term. In the euro area, production expanded at a solid pace, though indicators of consumer spending weakened. While measures of economic activity in Germany posted strong gains, economic conditions in Greece and Portugal deteriorated further. The damage caused by the earthquake and tsunami in Japan ap-peared to be sharply curtailing Japanese economic ac-tivity and posed concerns about disruptions to supply chains and production in other economies. Emerging market economies (EMEs) continued to expand rapid-ly. Rising prices of oil and other commodities boosted inflation in foreign economies. However, core inflation remained subdued in most of the advanced foreign economies, and inflation in the EMEs seemed to have declined as food price inflation slowed.
Staff Review of the Financial Situation The decisions by the FOMC at its March meeting to continue its asset purchase program and to maintain the 0 to ¼ percent target range for the federal funds rate were in line with market expectations; nonetheless, the accompanying statement prompted a modest rise in nominal yields, as market participants reportedly per-ceived a somewhat more optimistic tone in the Com-mittee’s economic outlook, as well as heightened con-cern about inflation risks. Over the intermeeting pe-riod, yields on nominal Treasury securities changed little, on net, amid swings in investors’ assessments of global risks. Short-term funding rates, including the effective federal funds rate, shifted down several basis points in early April following a change in the Federal Deposit Insurance Corporation’s deposit insurance assessment system. On net, the expected path of the federal funds rate over the next two years was little changed over the intermeeting period.
Measures of inflation compensation over the next 5 years based on nominal and inflation-protected Treasury securities increased slightly, on net, over the intermeeting period, partly reflecting the ongoing rise in
Minutes of the Meeting of April 26-27, 2011 Page 5_____________________________________________________________________________________________
commodity prices. Staff models suggested that the modest increase in inflation compensation 5 to 10 years ahead was mostly attributable to increases in liquidity and inflation-risk premiums rather than higher ex-pected inflation.
Over the intermeeting period, yields on corporate bonds were generally little changed, on net, and spreads of investment- and speculative-grade corporate bonds relative to comparable-maturity Treasury securities nar-rowed slightly. Average secondary-market prices for syndicated leveraged loans moved up further. Howev-er, conditions in the municipal bond market remained somewhat strained.
Broad U.S. stock price indexes rose, on net, over the intermeeting period, as initial reports of better-than-expected first-quarter earnings lifted stock prices in late April. Option-implied volatility on the S&P 500 index was moderately lower, on net, ending the intermeeting period at the low end of its recent range.
Net debt financing by nonfinancial corporations re-mained robust in March. Net issuance of investment- and speculative-grade bonds by nonfinancial corpora-tions continued to be strong, and outstanding amounts of commercial and industrial (C&I) loans and nonfi-nancial commercial paper increased noticeably. Gross public equity issuance by nonfinancial firms was robust in March, and indicators of the credit quality of nonfi-nancial firms improved further.
Commercial mortgage markets showed some signs of stabilization. Delinquency rates for commercial real estate loans appeared to have leveled off in recent months. Issuance of commercial mortgage-backed securities picked up in the first quarter, although com-mercial real estate loans at banks continued to run off. In commercial real estate markets, property sales re-mained tepid, and prices stayed at depressed levels.
Rates on conforming fixed-rate residential mortgages rose modestly during the intermeeting period, and their spreads relative to 10-year Treasury yields narrowed slightly. Mortgage refinancing activity remained near its lowest level in more than two years. The Treasury De-partment’s announcement in late March that it would begin selling its holdings of agency MBS at a gradual pace had little lasting effect on MBS spreads. The Fed-eral Reserve began competitive sales of the non-agency residential MBS held by Maiden Lane II LLC; initial sales met with strong demand, but market prices of non-agency residential MBS were reportedly little changed overall. The rates of serious delinquencies for
subprime and prime mortgages were nearly unchanged but remained at elevated levels. However, the rate of new delinquencies on prime mortgages declined fur-ther.
Conditions in consumer credit markets continued to improve gradually. Total consumer credit growth picked up in February, as a gain in nonrevolving credit more than offset a further contraction in revolving cre-dit. Delinquency and charge-off rates for credit card debt moved down in recent months and approached pre-crisis levels. Issuance of consumer asset-backed securities remained steady in the first quarter of the year.
Bank credit was about unchanged in March after de-clining, on average, in January and February. Core loans—the sum of C&I, real estate, and consumer loans—continued to contract, while holdings of securi-ties increased moderately. The Senior Loan Officer Opinion Survey on Bank Lending Practices conducted in April indicated that, on net, bank lending standards and terms had eased somewhat further during the first quarter of the year and demand for C&I loans, com-mercial mortgages, and auto loans had increased, while demand for residential mortgages continued to decline.
M2 expanded at a moderate pace in March. Liquid deposits, the largest component of M2, advanced at a solid pace likely reflecting very low opportunity costs of holding such deposits. Currency advanced signifi-cantly, supported by robust foreign demand for U.S. bank notes.
Foreign sovereign bond yields generally were little changed and equity prices rose, on net, over the inter-meeting period, although equity prices in Japan re-mained below their pre-earthquake levels despite the record amounts of liquidity injected by the Bank of Japan and the expansion of its asset purchase program. The European Central Bank raised its main policy rate 25 basis points to 1¼ percent during the intermeeting period, and markets appeared to have priced in addi-tional rate increases over the rest of the year. The Bank of England and the Bank of Canada left their policy rates unchanged, but quotes from futures markets con-tinued to suggest that both central banks would raise rates later this year. China’s monetary authority further increased banks’ lending rates and deposit rates and continued to tighten reserve requirements; monetary policy in a number of other EMEs was also tightened over the intermeeting period.
Page 6 Federal Open Market Committee_____________________________________________________________________________________________
The broad nominal index of the U.S. dollar declined more than 2 percent over the intermeeting period, though the dollar appreciated, on net, against the Japa-nese yen. The yen strengthened to an all-time high against the dollar after the earthquake in Japan, but this move was more than reversed when the G-7 countries intervened to sell yen.
In early April, the Portuguese government requested financial support from the European Union and the International Monetary Fund, but market participants reportedly remained concerned about whether the Por-tuguese government would reach agreement on an as-sociated fiscal consolidation plan. Later in the inter-meeting period, yields on Greece’s and other peripheral European countries’ sovereign debt jumped, reflecting heightened market focus on a possible restructuring of Greek sovereign debt.
Staff Economic Outlook With the recent data on spending somewhat weaker, on balance, than the staff had expected at the time of the March FOMC meeting, the staff revised down its pro-jection for the rate of increase in real gross domestic product (GDP) over the first half of 2011. The effects from the disaster in Japan were also anticipated to tem-porarily hold down real GDP growth in the near term. Over the medium term, the staff’s outlook for the pace of economic growth was broadly similar to its previous forecast: As in the March projection, the staff expected real GDP to increase at a moderate rate through 2012, with the ongoing recovery in activity receiving contin-ued support from accommodative monetary policy, increasing credit availability, and further improvements in household and business confidence. The average pace of GDP growth was expected to be sufficient to gradually reduce the unemployment rate over the pro-jection period, though the jobless rate was anticipated to remain elevated at the end of 2012.
Recent increases in consumer food and energy prices, together with the small uptick in core consumer price inflation, led the staff to raise its near-term projection for consumer price inflation. However, inflation was expected to recede over the medium term, as food and energy prices were anticipated to decelerate. As in pre-vious forecasts, the staff expected core consumer price inflation to remain subdued over the projection period, reflecting stable longer-term inflation expectations and persistent slack in labor and product markets.
Participants’ Views on Current Conditions and the Economic Outlook In conjunction with this FOMC meeting, all meeting participants—the five members of the Board of Gov-ernors and the presidents of the 12 Federal Reserve Banks—provided projections of output growth, the unemployment rate, and inflation for each year from 2011 through 2013 and over the longer run. Longer-run projections represent each participant’s assessment of the rate to which each variable would be expected to converge, over time, under appropriate monetary policy and in the absence of further shocks. Participants’ forecasts are described in the Summary of Economic Projections, which is attached as an addendum to these minutes.
In discussing intermeeting developments and their im-plications for the economic outlook, participants agreed that the information received since their pre-vious meeting was broadly consistent with continuation of a moderate economic recovery, despite an unex-pected slowing in the pace of economic growth in the first quarter. While construction activity remained anemic, measures of consumer spending and business investment continued to expand and labor market con-ditions continued to improve gradually. Participants viewed the weakness in first-quarter economic growth as likely to be largely transitory, influenced by unusually severe weather, increases in energy and other commod-ity prices, and lower-than-expected defense spending. As a result, they saw economic growth picking up later this year.
Participants’ forecasts for economic growth for 2012 and 2013 were largely unchanged from their January projections and continued to indicate expectations that the recovery will strengthen somewhat over time. Nonetheless, the pickup in the pace of the economic expansion was expected to be limited, reflecting the effects of high energy prices, modest changes in hous-ing wealth, subdued real income gains, and fiscal con-traction at the federal, state, and local levels. Partici-pants continued to project the unemployment rate to decline gradually over the forecast period but to remain elevated compared with their assessments of its longer-run level. Participants revised up their projections for total inflation in 2011, reflecting recent increases in energy and other commodity prices, but they generally anticipated that the recent increase in inflation would be transitory as commodity prices stabilize and inflation expectations remain anchored. However, they all agreed on the importance of closely monitoring devel-opments regarding inflation and inflation expectations.
Minutes of the Meeting of April 26-27, 2011 Page 7_____________________________________________________________________________________________
Participants’ judgment that the recovery was continuing at a moderate pace reflected both the incoming eco-nomic indicators and information received from busi-ness contacts. Growth in consumer spending remained moderate despite the effects of higher gasoline and food prices, which appeared to have largely offset the increase in disposable income from the payroll tax cut. Participants noted that these higher prices had weighed on consumer sentiment about near-term economic conditions but that underlying fundamentals for con-tinued moderate growth in spending remained in place. These underlying factors included continued improve-ment in household balance sheets, easing credit condi-tions, and strengthening labor markets.
Activity in the industrial sector also expanded further. Industrial production posted solid gains, and, while the most recent readings from some of the regional manu-facturing surveys showed small declines, in some cases these were from near-record highs. Manufacturers re-mained upbeat, although automakers were reporting some difficulties in obtaining parts normally produced in Japan, which might weigh on motor vehicle produc-tion in the current quarter. Investment in equipment and software was fairly robust. In contrast, the housing sector remained distressed, with house prices flat to down and a large overhang of vacant properties re-straining new construction, although reports indicated that sales volumes and traffic were higher in a few areas. Activity in the commercial real estate sector con-tinued to be weak.
Several participants indicated that, in contrast to the somewhat weaker recent economic data, their business contacts were more positive about the economy’s prospects, which supported the participants’ view that the recent weakness was likely to prove temporary. They acknowledged, however, that sentiment can change quickly; indeed, one participant noted that his contacts had recently turned more pessimistic, and sev-eral participants indicated that their business contacts expressed concern about the effects of higher com-modity prices on their own costs and on the purchasing power of households.
Participants judged that overall conditions in labor markets had continued to improve, albeit gradually. The unemployment rate had decreased further and pay-roll employment had risen again in March. Some par-ticipants reported that more of their business contacts have plans to increase their payrolls later this year. A few participants noted that firms may be poised to ac-celerate their pace of hiring because they have ex-
hausted potential productivity gains, but others indi-cated that some firms may be putting hiring plans on hold until they are more certain of the future trend in materials and other input costs. Signs of rising wage pressures were reportedly limited to a few skilled job categories for which workers are in short supply, while, in general, increases in wages have been subdued. Par-ticipants discussed whether the significant drop in the unemployment rate might be overstating the degree of improvement in labor markets because many of the unemployed have dropped out of the labor force or have accepted jobs that are less desirable than their former jobs.
Financial market conditions continued to improve over the intermeeting period. Equity prices had risen, on balance, since the previous meeting, reflecting an im-proved outlook for earnings, and were up more sub-stantially since the start of the year. Bankers again re-ported improvements in credit quality, with the volume of nonperforming assets declining at larger banks and leveling off at smaller banks. In general, loan demand remained weak. However, bank lending to medium-sized and larger companies increased, and lending to small businesses picked up slightly. Banks reported an easing of lending terms on C&I loans, usually prompt-ed by increased competition in the face of still-weak loan demand. Consumer credit conditions also eased somewhat from the tight conditions seen during the recession. However, demand for consumer credit oth-er than auto loans reportedly changed little. A few par-ticipants expressed concern that the easing of credit conditions was creating incentives for increased lev-erage and risk-taking in some areas, such as leveraged syndicated loans and loans to finance land acquisition, and that this trend, if it became widespread and exces-sive, could pose a risk to financial stability.
Participants discussed the recent rise in inflation, which had been driven largely by significant increases in ener-gy and, to a somewhat lesser extent, other commodity prices. These commodity price increases, in turn, re-flected robust global demand and geopolitical devel-opments that had reduced supply. One participant suggested that excess liquidity might be leading to speculation in commodity markets, possibly putting upward pressure on prices. Many participants reported that an increasing number of business contacts ex-pressed concerns about rising cost pressures and were intending, or already attempting, to pass on at least a portion of these higher costs to their customers in or-der to protect profit margins. This development was also reflected in the rising indexes of prices paid and
Page 8 Federal Open Market Committee_____________________________________________________________________________________________
received in several regional manufacturing surveys. Some participants noted that higher commodity prices were negatively affecting both business and consumer sentiment. Core inflation and other indicators of un-derlying inflation over the medium term had increased modestly in recent months, but their levels remained subdued.
Participants generally anticipated that the higher level of overall inflation would be transitory. This outlook was based partly on a projected leveling-off of com-modity prices and the belief that longer-run inflation expectations would remain stable. Some participants noted that pressures on labor costs continued to be muted; if such circumstances continued, a large, persis-tent rise in inflation would be unusual. Measures of near-term inflation expectations had risen along with the recent rise in overall inflation. While some indica-tors of longer-term expectations had increased, others were little changed or down, on net, since March. Many participants had become more concerned about the upside risks to the inflation outlook, including the possibilities that oil prices might continue to rise, that there might be greater pass-through of higher com-modity costs into broader price measures, and that ele-vated overall inflation caused by higher energy and oth-er commodity prices could lead to a rise in longer-term inflation expectations. Participants agreed that moni-toring inflation trends and inflation expectations closely was important in determining whether action would be needed to prevent a more lasting pickup in the rate of general price inflation, which would be costly to re-verse. Maintaining well-anchored inflation expectations would depend on the credibility of the Committee’s commitment to deliver on the price stability part of its mandate. A few participants suggested that clearer communication about the Committee’s inflation out-look, such as explaining the measures it uses to gauge medium-term trends in general price inflation and an-nouncing an explicit numerical inflation objective, would be helpful in this regard.
While rising energy prices posed an upside risk to the inflation forecast, they also posed a downside risk to economic growth. Although most participants contin-ued to see the risks to their outlooks for economic growth as being broadly balanced, a number now judged those risks to be tilted to the downside. These downside risks included a larger-than-expected drag on household and business spending from higher energy prices, continued fiscal strains in Europe, larger-than-anticipated effects from supply disruptions in the af-termath of the disaster in Japan, continuing fiscal ad-
justments at all levels of government in the United States, financial disruptions that would be associated with a failure to increase the federal debt limit, and the possibility that the economic weakness in the first quar-ter was signaling less underlying momentum going for-ward. However, participants also noted that the rapid decline in the unemployment rate over the past several months suggested the possibility of stronger-than-anticipated economic growth over coming quarters.
In their discussion of monetary policy, some partici-pants expressed the view that in the context of in-creased inflation risks and roughly balanced risks to economic growth, the Committee would need to be prepared to begin taking steps toward less-accommodative policy. A few of these participants thought that economic conditions might warrant action to raise the federal funds rate target or to sell assets in the SOMA portfolio later this year, but noted that even with such steps, monetary policy would remain ac-commodative for some time to come. However, some participants indicated that underlying inflation re-mained subdued; that longer-term inflation expecta-tions were likely to remain anchored, partly because modest changes in labor costs would constrain inflation trends; and that given the downside risks to economic growth, an early exit could unnecessarily damp the on-going economic recovery.
Committee Policy Action Committee members agreed that no changes to the Committee’s asset purchase program or to its target range for the federal funds rate were warranted at this meeting. The information received over the intermeet-ing period indicated that the economic recovery was proceeding at a moderate pace, albeit somewhat slower than had been anticipated earlier in the year. Overall conditions in the labor market were gradually improv-ing, and the unemployment rate continued to decline, although it remained elevated relative to levels that the Committee judged to be consistent, over the longer run, with its statutory mandate of maximum employ-ment and price stability. Significant increases in energy and other commodity prices had boosted overall infla-tion, but members expected this increase to be transito-ry and to unwind when commodity price increases abated. Notwithstanding recent modest increases, indi-cators of medium-term inflation remained subdued and somewhat below the levels seen as consistent with the dual mandate as indicated by the Committee’s longer-run inflation projections. Near-term inflation expecta-tions had increased with energy prices and overall infla-tion. Recent movements in measures of longer-term
Minutes of the Meeting of April 26-27, 2011 Page 9_____________________________________________________________________________________________
inflation expectations were discussed. While some measures of longer-term inflation expectations had ris-en, others were little changed or down, on net, since March, and members agreed that longer-term inflation expectations had remained stable. Given this economic outlook, the Committee agreed to continue to expand its holdings of longer-term Treasury securities as an-nounced in November in order to promote a stronger pace of economic recovery and to help ensure that in-flation, over time, is at levels consistent with the Com-mittee’s mandate. Specifically, the Committee main-tained its existing policy of reinvesting principal pay-ments from its securities holdings and affirmed that it will complete purchases of $600 billion of longer-term Treasury securities by the end of the current quarter. A few members remained uncertain about the benefits of the asset purchase program but, with the program near-ly completed, judged that making changes to the pro-gram at this time was not appropriate. The Committee continued to anticipate that economic conditions, in-cluding low rates of resource utilization, subdued infla-tion trends, and stable inflation expectations, were like-ly to warrant exceptionally low levels for the federal funds rate for an extended period. That said, a few members viewed the increase in inflation risks as sug-gesting that economic conditions might well evolve in a way that would warrant the Committee taking steps toward less-accommodative policy sooner than current-ly anticipated.
Members agreed that the Committee will regularly re-view the size and composition of its securities holdings in light of incoming information and that they are pre-pared to adjust those holdings as needed to best foster maximum employment and price stability. Some members pointed out that there would need to be a significant change in the economic outlook, or the risks to that outlook, before another program of asset pur-chases would be warranted; in their view, absent such changes, the benefits of additional purchases would be unlikely to outweigh the costs.
In the statement to be released following the meeting, members decided to indicate that the economic recov-ery was proceeding at a moderate pace and that overall conditions in the labor market were gradually improv-ing. The Committee also decided to summarize its cur-rent thinking about inflation pressures and to empha-size that it will closely monitor the evolution of infla-tion and inflation expectations. Members anticipated that the Chairman, who would deliver his first post-meeting press briefing later that afternoon, would pro-
vide additional context for the Committee’s policy de-cisions.
At the conclusion of the discussion, the Committee voted to authorize and direct the Federal Reserve Bank of New York, until it was instructed otherwise, to ex-ecute transactions in the System Account in accordance with the following domestic policy directive:
“The Federal Open Market Committee seeks monetary and financial conditions that will fos-ter price stability and promote sustainable growth in output. To further its long-run ob-jectives, the Committee seeks conditions in re-serve markets consistent with federal funds trading in a range from 0 to ¼ percent. The Committee directs the Desk to execute pur-chases of longer-term Treasury securities in order to increase the total face value of domes-tic securities held in the System Open Market Account to approximately $2.6 trillion by the end of June 2011. The Committee also directs the Desk to reinvest principal payments from agency debt and agency mortgage-backed se-curities in longer-term Treasury securities. The System Open Market Account Manager and the Secretary will keep the Committee in-formed of ongoing developments regarding the System’s balance sheet that could affect the attainment over time of the Committee’s ob-jectives of maximum employment and price stability.”
The vote encompassed approval of the statement be-low to be released at 12:30 p.m.:
“Information received since the Federal Open Market Committee met in March indicates that the economic recovery is proceeding at a mod-erate pace and overall conditions in the labor market are improving gradually. Household spending and business investment in equip-ment and software continue to expand. How-ever, investment in nonresidential structures is still weak, and the housing sector continues to be depressed. Commodity prices have risen significantly since last summer, and concerns about global supplies of crude oil have contri-buted to a further increase in oil prices since the Committee met in March. Inflation has picked up in recent months, but longer-term inflation expectations have remained stable and measures of underlying inflation are still subdued.
Page 10 Federal Open Market Committee_____________________________________________________________________________________________
Consistent with its statutory mandate, the Committee seeks to foster maximum employ-ment and price stability. The unemployment rate remains elevated, and measures of under-lying inflation continue to be somewhat low, relative to levels that the Committee judges to be consistent, over the longer run, with its dual mandate. Increases in the prices of energy and other commodities have pushed up inflation in recent months. The Committee expects these effects to be transitory, but it will pay close at-tention to the evolution of inflation and infla-tion expectations. The Committee continues to anticipate a gradual return to higher levels of resource utilization in a context of price stabili-ty.
To promote a stronger pace of economic re-covery and to help ensure that inflation, over time, is at levels consistent with its mandate, the Committee decided today to continue ex-panding its holdings of securities as announced in November. In particular, the Committee is maintaining its existing policy of reinvesting principal payments from its securities holdings and will complete purchases of $600 billion of longer-term Treasury securities by the end of the current quarter. The Committee will regu-larly review the size and composition of its se-curities holdings in light of incoming informa-tion and is prepared to adjust those holdings as needed to best foster maximum employment and price stability.
The Committee will maintain the target range for the federal funds rate at 0 to ¼ percent and continues to anticipate that economic condi
tions, including low rates of resource utiliza-tion, subdued inflation trends, and stable infla-tion expectations, are likely to warrant excep-tionally low levels for the federal funds rate for an extended period.
The Committee will continue to monitor the economic outlook and financial developments and will employ its policy tools as necessary to support the economic recovery and to help en-sure that inflation, over time, is at levels con-sistent with its mandate.”
Voting for this action: Ben Bernanke, William C. Dudley, Elizabeth Duke, Charles L. Evans, Richard W. Fisher, Narayana Kocherlakota, Charles I. Plosser, Sarah Bloom Raskin, Daniel K. Tarullo, and Janet L. Yellen.
Voting against this action: None.
It was agreed that the next meeting of the Committee would be held on Tuesday–Wednesday, June 21–22, 2011. The meeting adjourned at 10:15 a.m. on April 27, 2011.
Notation Vote By notation vote completed on April 4, 2011, the Committee unanimously approved the minutes of the FOMC meeting held on March 15, 2011.
_____________________________ William B. English
Secretary
Minutes of the Meeting of April 26-27, 2011 Page 11_____________________________________________________________________________________________
Summary of Economic Projections
In conjunction with the April 26–27, 2011, Federal Open Market Committee (FOMC) meeting, the mem-bers of the Board of Governors and the presidents of the Federal Reserve Banks, all of whom participate in the deliberations of the FOMC, submitted projections for growth of real output, the unemployment rate, and inflation for the years 2011 to 2013 and over the longer run. The projections were based on information avail-able through the end of the meeting and on each par-ticipant’s assumptions about factors likely to affect economic outcomes, including his or her assessment of appropriate monetary policy. “Appropriate monetary policy” is defined as the future path of policy that each participant deems most likely to foster outcomes for economic activity and inflation that best satisfy his or her interpretation of the Federal Reserve’s dual objec-tives of maximum employment and stable prices. Longer-run projections represent each participant’s assessment of the rate to which each variable would be expected to converge over time under appropriate monetary policy and in the absence of further shocks.
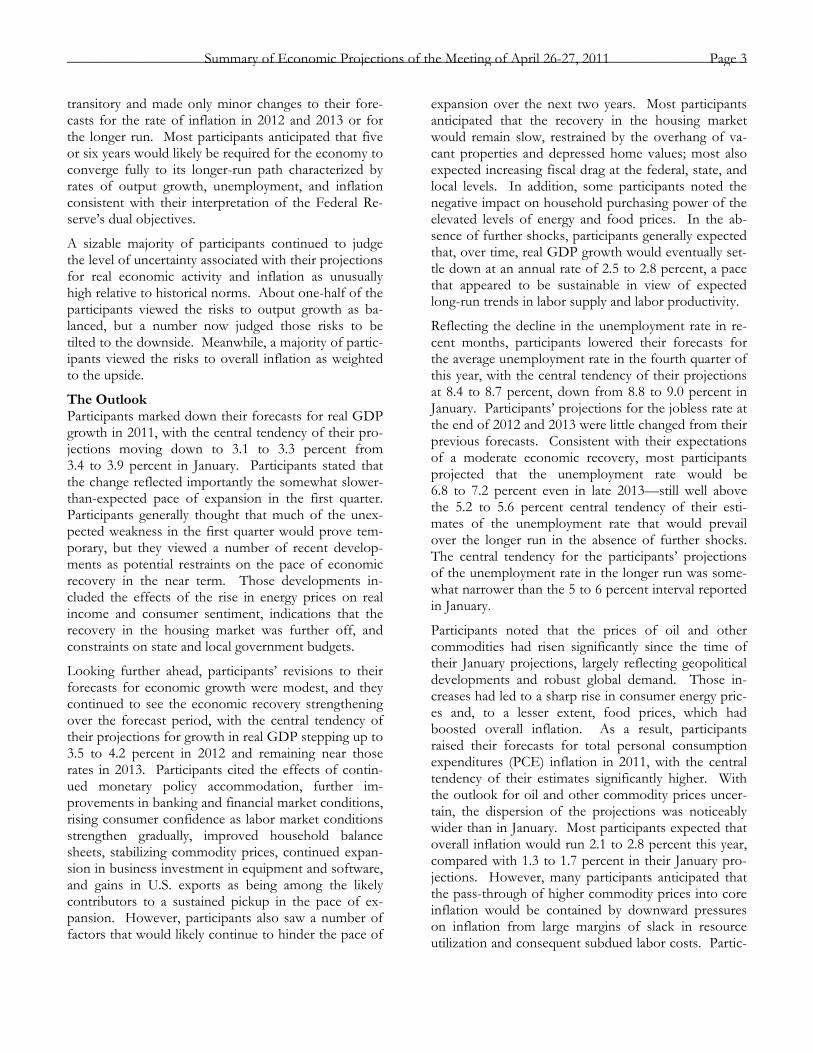
As depicted in figure 1, FOMC participants expected the economic recovery to continue at a moderate pace, with growth of real gross domestic product (GDP) picking up modestly this year (relative to 2010) and strengthening further in 2012 and a bit more in 2013. With the pace of economic growth exceeding their estimates of the longer-run sustainable rate of increases
in real GDP, the unemployment rate is projected to gradually trend lower over this projection period. However, participants anticipated that, at the end of 2013, the unemployment rate would still be well above their estimates of the longer-run unemployment rate. Most participants expected that overall inflation would move up this year, but they projected this increase to be temporary, with overall inflation moving back in line with core inflation in 2012 and 2013 and remaining at or below rates they see as consistent, over the longer run, with the Committee’s dual mandate of maximum employment and price stability. Participants generally saw core inflation gradually edging higher over the next two years from its current relatively low level.
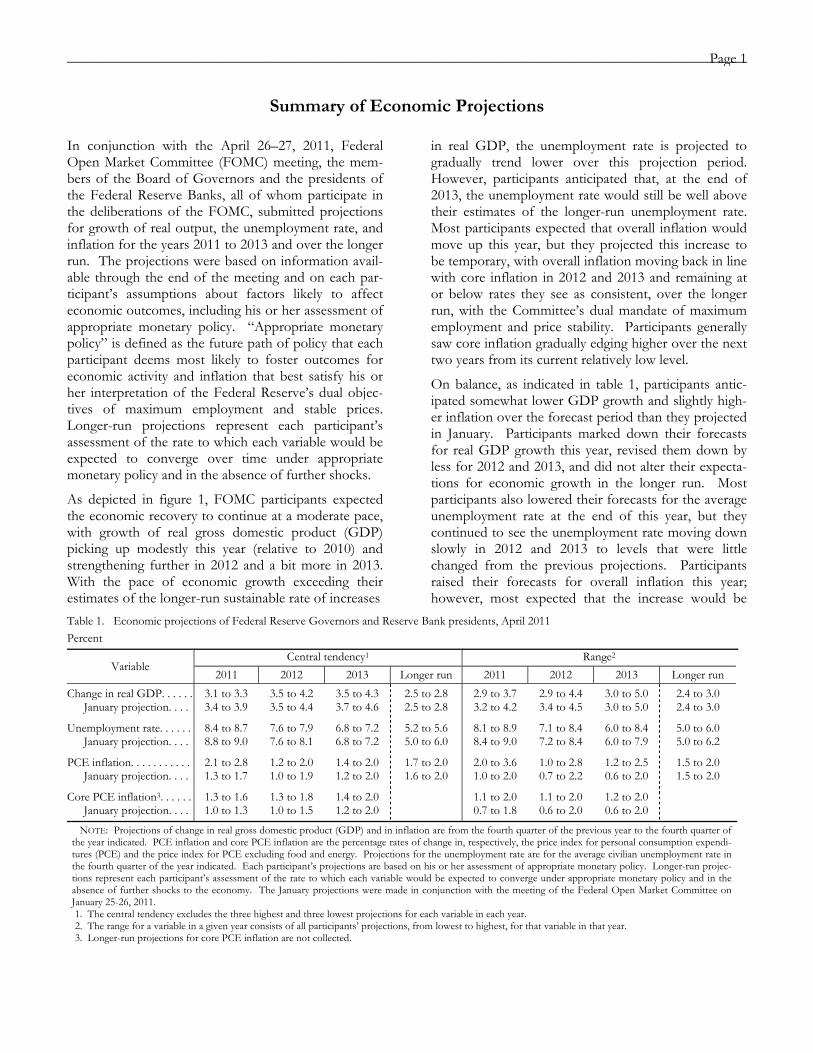
On balance, as indicated in table 1, participants antic-ipated somewhat lower GDP growth and slightly high-er inflation over the forecast period than they projected in January. Participants marked down their forecasts for real GDP growth this year, revised them down by less for 2012 and 2013, and did not alter their expecta-tions for economic growth in the longer run. Most participants also lowered their forecasts for the average unemployment rate at the end of this year, but they continued to see the unemployment rate moving down slowly in 2012 and 2013 to levels that were little changed from the previous projections. Participants raised their forecasts for overall inflation this year; however, most expected that the increase would be
Table 1. Economic projections of Federal Reserve Governors and Reserve Bank presidents, April 2011
Percent
Variable Central tendency1 Range2
2011 2012 2013 Longer run 2011 2012 2013 Longer run
Change in real GDP. . . . . . 3.1 to 3.3 3.5 to 4.2 3.5 to 4.3 2.5 to 2.8 2.9 to 3.7 2.9 to 4.4 3.0 to 5.0 2.4 to 3.0 January projection. . . . 3.4 to 3.9 3.5 to 4.4 3.7 to 4.6 2.5 to 2.8 3.2 to 4.2 3.4 to 4.5 3.0 to 5.0 2.4 to 3.0
Unemployment rate. . . . . . 8.4 to 8.7 7.6 to 7.9 6.8 to 7.2 5.2 to 5.6 8.1 to 8.9 7.1 to 8.4 6.0 to 8.4 5.0 to 6.0 January projection. . . . 8.8 to 9.0 7.6 to 8.1 6.8 to 7.2 5.0 to 6.0 8.4 to 9.0 7.2 to 8.4 6.0 to 7.9 5.0 to 6.2
PCE inflation. . . . . . . . . . . 2.1 to 2.8 1.2 to 2.0 1.4 to 2.0 1.7 to 2.0 2.0 to 3.6 1.0 to 2.8 1.2 to 2.5 1.5 to 2.0 January projection. . . . 1.3 to 1.7 1.0 to 1.9 1.2 to 2.0 1.6 to 2.0 1.0 to 2.0 0.7 to 2.2 0.6 to 2.0 1.5 to 2.0
Core PCE inflation3. . . . . . 1.3 to 1.6 1.3 to 1.8 1.4 to 2.0 1.1 to 2.0 1.1 to 2.0 1.2 to 2.0 January projection. . . . 1.0 to 1.3 1.0 to 1.5 1.2 to 2.0 0.7 to 1.8 0.6 to 2.0 0.6 to 2.0
NOTE: Projections of change in real gross domestic product (GDP) and in inflation are from the fourth quarter of the previous year to the fourth quarter of the year indicated. PCE inflation and core PCE inflation are the percentage rates of change in, respectively, the price index for personal consumption expendi-tures (PCE) and the price index for PCE excluding food and energy. Projections for the unemployment rate are for the average civilian unemployment rate in the fourth quarter of the year indicated. Each participant’s projections are based on his or her assessment of appropriate monetary policy. Longer-run projec-tions represent each participant’s assessment of the rate to which each variable would be expected to converge under appropriate monetary policy and in the absence of further shocks to the economy. The January projections were made in conjunction with the meeting of the Federal Open Market Committee on January 25-26, 2011.
1. The central tendency excludes the three highest and three lowest projections for each variable in each year. 2. The range for a variable in a given year consists of all participants’ projections, from lowest to highest, for that variable in that year. 3. Longer-run projections for core PCE inflation are not collected.
Page 1_____________________________________________________________________________________________

2
1
+_0
1
2
3
4
5
Percent
Figure 1. Central tendencies and ranges of economic projections, 2011–13 and over the longer run
Change in real GDP
Range of projections
Actual
2006 2007 2008 2009 2010 2011 2012 2013 Longerrun
Central tendency of projections
5
6
7
8
9
10
Percent
Unemployment rate
2006 2007 2008 2009 2010 2011 2012 2013 Longerrun
1
2
3
Percent
PCE inflation
2006 2007 2008 2009 2010 2011 2012 2013 Longerrun
1
2
3
Percent
Core PCE inflation
2006 2007 2008 2009 2010 2011 2012 2013
NOTE: Definitions of variables are in the notes to table 1. The data for the actual values of the variables are annual.
Page 2 Federal Open Market Committee_____________________________________________________________________________________________
transitory and made only minor changes to their fore-casts for the rate of inflation in 2012 and 2013 or for the longer run. Most participants anticipated that five or six years would likely be required for the economy to converge fully to its longer-run path characterized by rates of output growth, unemployment, and inflation consistent with their interpretation of the Federal Re-serve’s dual objectives.
A sizable majority of participants continued to judge the level of uncertainty associated with their projections for real economic activity and inflation as unusually high relative to historical norms. About one-half of the participants viewed the risks to output growth as ba-lanced, but a number now judged those risks to be tilted to the downside. Meanwhile, a majority of partic-ipants viewed the risks to overall inflation as weighted to the upside.
The Outlook Participants marked down their forecasts for real GDP growth in 2011, with the central tendency of their pro-jections moving down to 3.1 to 3.3 percent from 3.4 to 3.9 percent in January. Participants stated that the change reflected importantly the somewhat slower-than-expected pace of expansion in the first quarter. Participants generally thought that much of the unex-pected weakness in the first quarter would prove tem-porary, but they viewed a number of recent develop-ments as potential restraints on the pace of economic recovery in the near term. Those developments in-cluded the effects of the rise in energy prices on real income and consumer sentiment, indications that the recovery in the housing market was further off, and constraints on state and local government budgets.
Looking further ahead, participants’ revisions to their forecasts for economic growth were modest, and they continued to see the economic recovery strengthening over the forecast period, with the central tendency of their projections for growth in real GDP stepping up to 3.5 to 4.2 percent in 2012 and remaining near those rates in 2013. Participants cited the effects of contin-ued monetary policy accommodation, further im-provements in banking and financial market conditions, rising consumer confidence as labor market conditions strengthen gradually, improved household balance sheets, stabilizing commodity prices, continued expan-sion in business investment in equipment and software, and gains in U.S. exports as being among the likely contributors to a sustained pickup in the pace of ex-pansion. However, participants also saw a number of factors that would likely continue to hinder the pace of
expansion over the next two years. Most participants anticipated that the recovery in the housing market would remain slow, restrained by the overhang of va-cant properties and depressed home values; most also expected increasing fiscal drag at the federal, state, and local levels. In addition, some participants noted the negative impact on household purchasing power of the elevated levels of energy and food prices. In the ab-sence of further shocks, participants generally expected that, over time, real GDP growth would eventually set-tle down at an annual rate of 2.5 to 2.8 percent, a pace that appeared to be sustainable in view of expected long-run trends in labor supply and labor productivity.
Reflecting the decline in the unemployment rate in re-cent months, participants lowered their forecasts for the average unemployment rate in the fourth quarter of this year, with the central tendency of their projections at 8.4 to 8.7 percent, down from 8.8 to 9.0 percent in January. Participants’ projections for the jobless rate at the end of 2012 and 2013 were little changed from their previous forecasts. Consistent with their expectations of a moderate economic recovery, most participants projected that the unemployment rate would be 6.8 to 7.2 percent even in late 2013—still well above the 5.2 to 5.6 percent central tendency of their esti-mates of the unemployment rate that would prevail over the longer run in the absence of further shocks. The central tendency for the participants’ projections of the unemployment rate in the longer run was some-what narrower than the 5 to 6 percent interval reported in January.
Participants noted that the prices of oil and other commodities had risen significantly since the time of their January projections, largely reflecting geopolitical developments and robust global demand. Those in-creases had led to a sharp rise in consumer energy pric-es and, to a lesser extent, food prices, which had boosted overall inflation. As a result, participants raised their forecasts for total personal consumption expenditures (PCE) inflation in 2011, with the central tendency of their estimates significantly higher. With the outlook for oil and other commodity prices uncer-tain, the dispersion of the projections was noticeably wider than in January. Most participants expected that overall inflation would run 2.1 to 2.8 percent this year, compared with 1.3 to 1.7 percent in their January pro-jections. However, many participants anticipated that the pass-through of higher commodity prices into core inflation would be contained by downward pressures on inflation from large margins of slack in resource utilization and consequent subdued labor costs. Partic-
Summary of Economic Projections of the Meeting of April 26-27, 2011 Page 3_____________________________________________________________________________________________
ipants indicated that well-anchored inflation expecta-tions, combined with the appropriate stance of mone-tary policy, should help keep inflation in check. As a result, participants anticipated that the increase in total PCE inflation would be temporary, with the central tendency of their estimates moving down to 1.2 to 2.0 percent in 2012 and 1.4 to 2.0 percent in 2013—at or below the 1.7 to 2.0 percent central ten-dency for their estimates of the longer-run, mandate-consistent rate of inflation. Nonetheless, the central tendencies of participants’ projections for core PCE inflation for this year and next year shifted up a bit to 1.3 to 1.6 percent in 2011 and 1.3 to 1.8 percent in 2012. The central tendency of the core PCE inflation projections in 2013 was 1.4 to 2.0 percent, little changed from the January SEP.
Uncertainty and Risks A sizable majority of participants continued to judge that the levels of uncertainty associated with their pro-jections for economic activity and inflation were greater than the average levels that had prevailed over the past 20 years.1 They pointed to a number of factors contri-buting to their assessments of the uncertainty that they attached to their projections, including structural dislo-cations in the labor market, the outlook for fiscal poli-cy, the future path of energy and other commodity prices, the global economic outlook, and the effects of unconventional monetary policy.
About one-half of the participants continued to view the risks to their outlooks for economic growth as ba-lanced, but a number of participants now judged that those risks had become tilted to the downside. The most frequently mentioned downside risks to GDP growth included the possibility of further increases in energy and other commodity prices, a tighter-than-anticipated stance of fiscal policy in the United States, an even weaker-than-expected housing sector adversely affecting consumer spending and the health of financial institutions, and possible spillovers from the fiscal strains in Europe. A few participants saw the risks to growth as tilted to the upside; it was noted that the cy-clical rebound in economic activity might prove strong-er than anticipated. The risks surrounding partici- 1 Table 2 provides estimates of forecast uncertainty for the change in real GDP, the unemployment rate, and total con-sumer price inflation over the period from 1991 to 2010. At the end of this summary, the box “Forecast Uncertainty” discusses the sources and interpretation of uncertainty in the economic forecasts and explains the approach used to assess the uncertainty and risks attending the participants’ projec-tions.
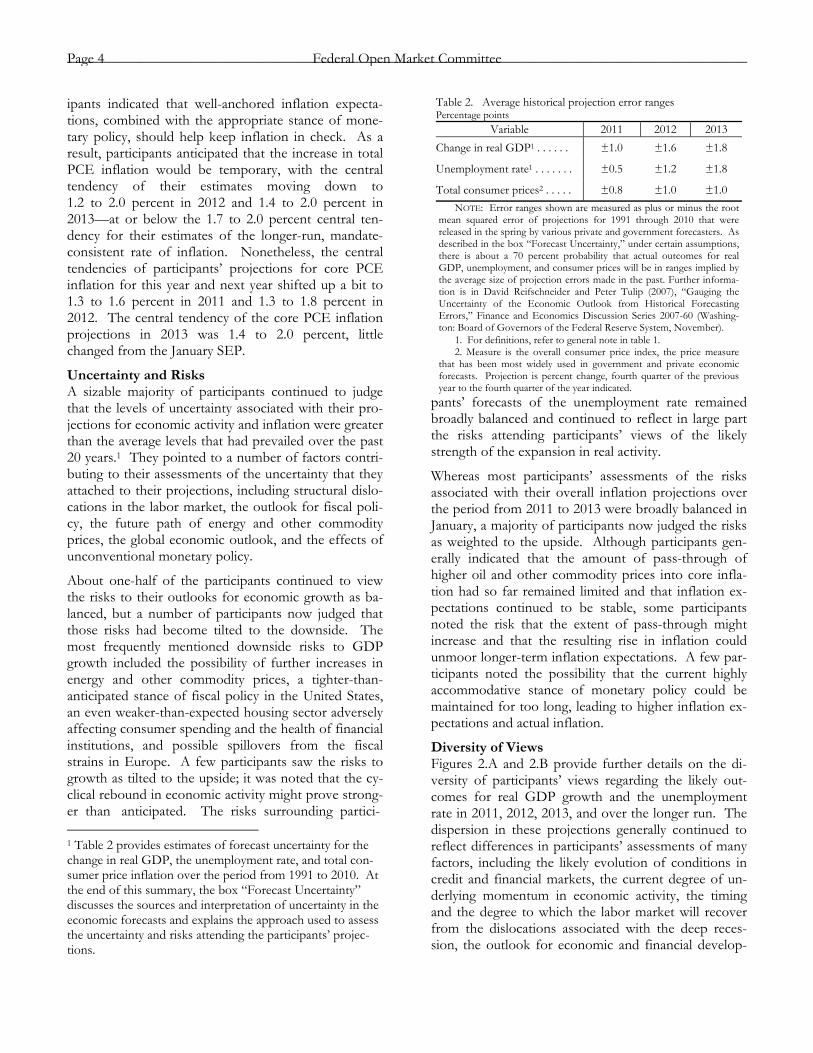
Table 2. Average historical projection error ranges Percentage points
Variable 2011 2012 2013
Change in real GDP1 . . . . . . ±1.0 ±1.6 ±1.8
Unemployment rate1 . . . . . . . ±0.5 ±1.2 ±1.8
Total consumer prices2 . . . . . ±0.8 ±1.0 ±1.0
NOTE: Error ranges shown are measured as plus or minus the root mean squared error of projections for 1991 through 2010 that were released in the spring by various private and government forecasters. As described in the box “Forecast Uncertainty,” under certain assumptions, there is about a 70 percent probability that actual outcomes for real GDP, unemployment, and consumer prices will be in ranges implied by the average size of projection errors made in the past. Further informa-tion is in David Reifschneider and Peter Tulip (2007), “Gauging the Uncertainty of the Economic Outlook from Historical Forecasting Errors,” Finance and Economics Discussion Series 2007-60 (Washing-ton: Board of Governors of the Federal Reserve System, November).
1. For definitions, refer to general note in table 1. 2. Measure is the overall consumer price index, the price measure
that has been most widely used in government and private economic forecasts. Projection is percent change, fourth quarter of the previous year to the fourth quarter of the year indicated.
pants’ forecasts of the unemployment rate remained broadly balanced and continued to reflect in large part the risks attending participants’ views of the likely strength of the expansion in real activity.
Whereas most participants’ assessments of the risks associated with their overall inflation projections over the period from 2011 to 2013 were broadly balanced in January, a majority of participants now judged the risks as weighted to the upside. Although participants gen-erally indicated that the amount of pass-through of higher oil and other commodity prices into core infla-tion had so far remained limited and that inflation ex-pectations continued to be stable, some participants noted the risk that the extent of pass-through might increase and that the resulting rise in inflation could unmoor longer-term inflation expectations. A few par-ticipants noted the possibility that the current highly accommodative stance of monetary policy could be maintained for too long, leading to higher inflation ex-pectations and actual inflation.
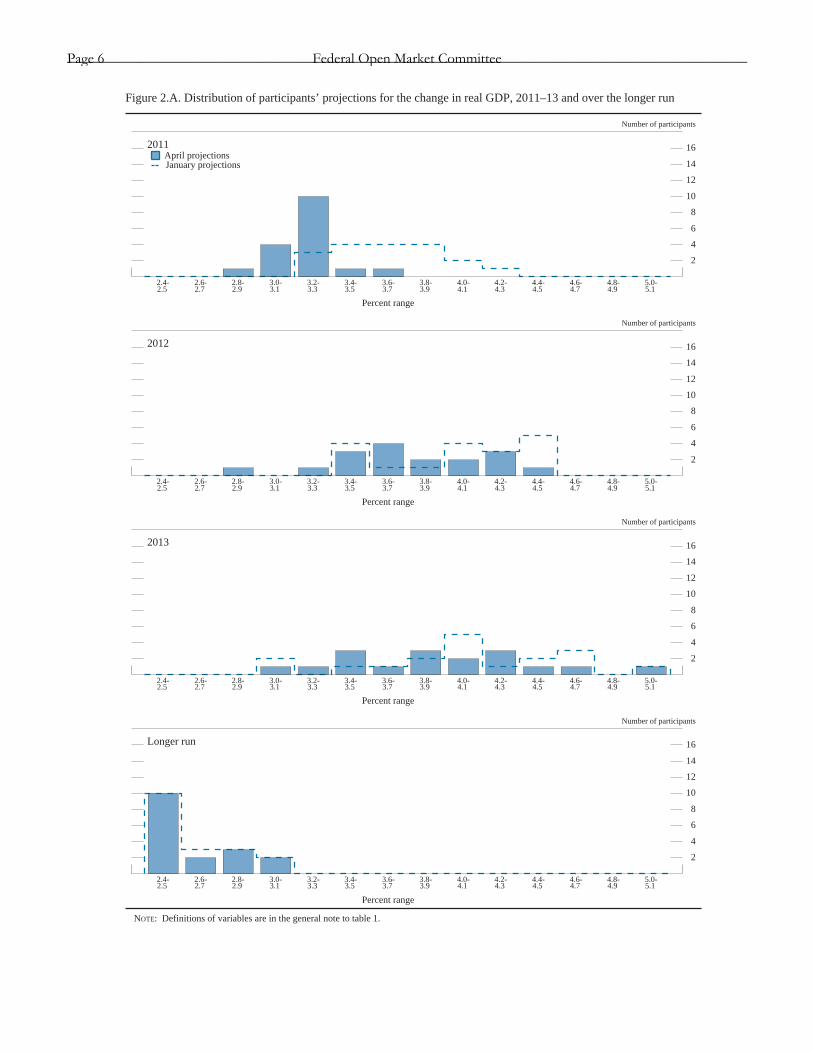
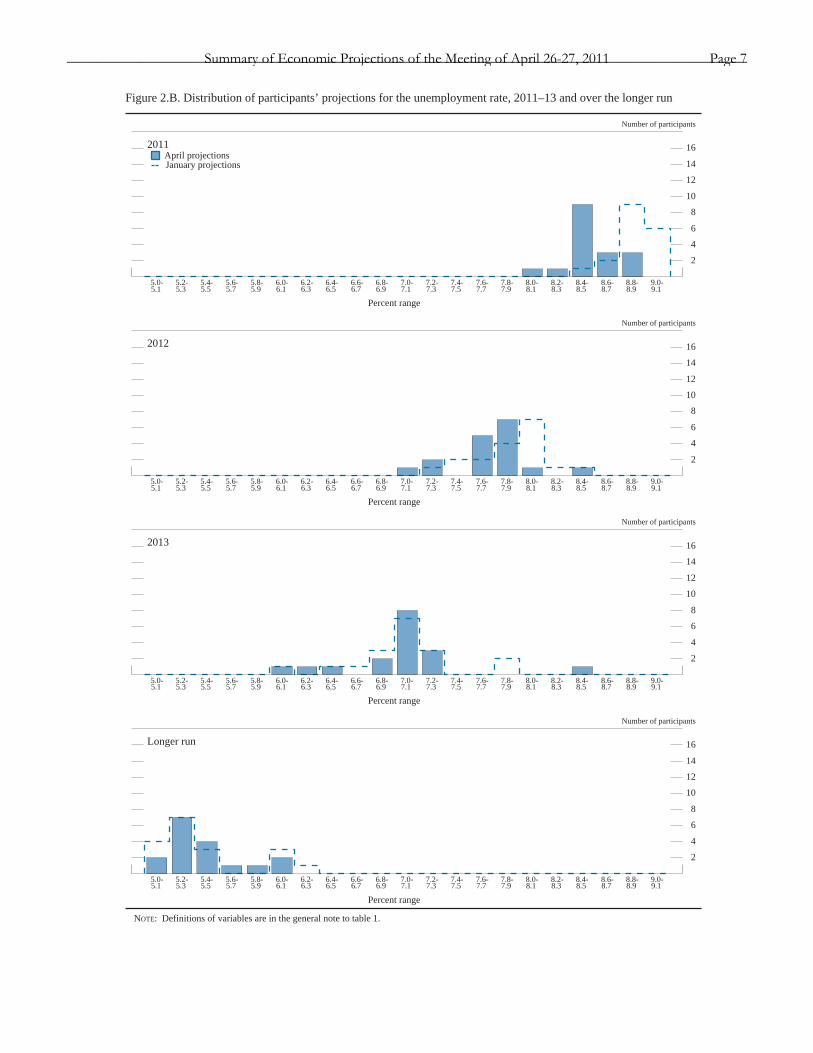
Diversity of Views Figures 2.A and 2.B provide further details on the di-versity of participants’ views regarding the likely out-comes for real GDP growth and the unemployment rate in 2011, 2012, 2013, and over the longer run. The dispersion in these projections generally continued to reflect differences in participants’ assessments of many factors, including the likely evolution of conditions in credit and financial markets, the current degree of un-derlying momentum in economic activity, the timing and the degree to which the labor market will recover from the dislocations associated with the deep reces-sion, the outlook for economic and financial develop-
Page 4 Federal Open Market Committee_____________________________________________________________________________________________
ments abroad, and appropriate future monetary policy and its effects on economic activity. Regarding partici-pants’ projections for real GDP growth, the distribu-tion for this year shifted noticeably lower and was sig-nificantly more tightly concentrated than the distribu-tion in January, with more than one-half of participants expecting the change in real GDP in 2011 to be in the 3.2 to 3.3 percent interval. By contrast, the distribu-tions for real GDP growth in 2012 and 2013 were little changed. Regarding participants’ projections for the unemployment rate, the distribution for this year shifted down relative to the distribution in January, with about one-half of participants anticipating the un-employment rate in the final quarter of 2011 to be 8.4 to 8.5 percent; this shift likely reflects the recent im-provements in labor market conditions. The distribu-tions of the unemployment rate for 2012 and 2013 were little changed. The distribution of participants’ estimates of the longer-run unemployment rate was somewhat more tightly concentrated than in January, while that for their estimates of longer-run GDP growth was about unchanged.
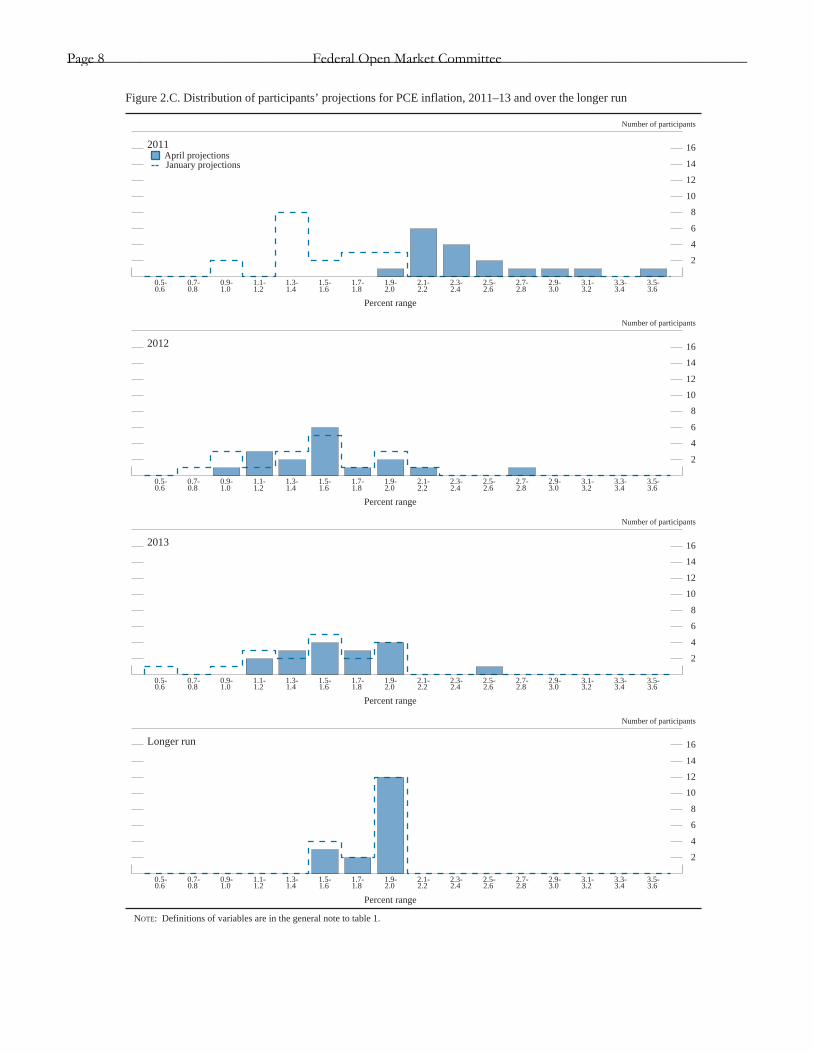
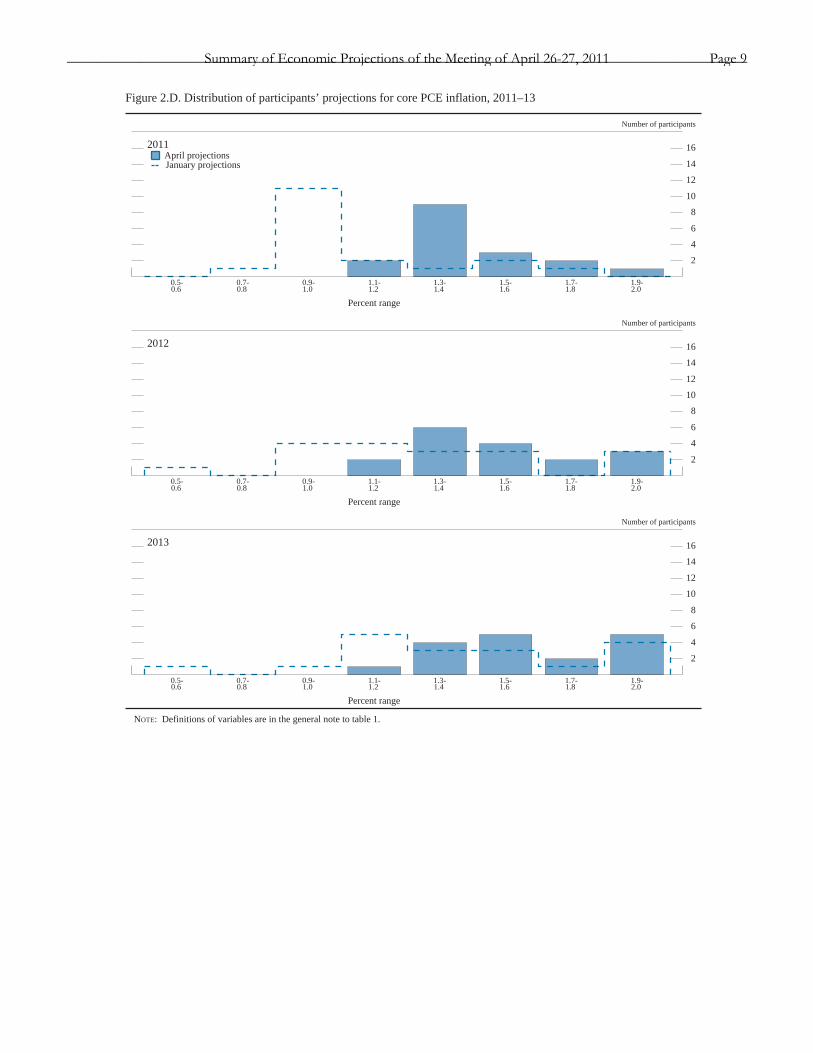
Corresponding information about the diversity of par-ticipants’ views regarding the inflation outlook is pro-vided in figures 2.C and 2.D. In general, the dispersion in the participants’ inflation forecasts for the next few years represented differences in judgments regarding
the fundamental determinants of inflation, including estimates of the degree of resource slack and the extent to which such slack influences inflation outcomes and expectations, as well as estimates of how the stance of monetary policy may influence inflation expectations. Regarding overall PCE inflation, the distribution of participants’ projections for 2011 shifted noticeably higher relative to the distribution in January, reflecting the recent increases in energy and other commodity prices, but the dispersion in forecasts was little changed. The distributions for 2012 and 2013 were generally little changed and remained fairly wide. Re-garding core PCE inflation, the distribution of partici-pants’ projections for 2011 shifted noticeably to the right, but it remained about as wide as in January. The distributions of core inflation for 2012 and 2013 also shifted somewhat higher but were otherwise little changed. Although the distributions of participants’ inflation forecasts for 2011 through 2013 continued to be relatively wide, the distribution of projections of the longer-run rate of overall PCE inflation remained tightly concentrated. The narrow range illustrates the broad similarity in participants’ assessments of the ap-proximate level of inflation that is consistent with the Federal Reserve’s dual objectives of maximum em-ployment and price stability.
Summary of Economic Projections of the Meeting of April 26-27, 2011 Page 5_____________________________________________________________________________________________
2
4
6
8
10
12
14
16
Number of participants
Figure 2.A. Distribution of participants’ projections for the change in real GDP, 2011–13 and over the longer run
2011
January projections
2.4-2.5
2.6-2.7
2.8-2.9
3.0-3.1
3.2-3.3
3.4-3.5
3.6-3.7
3.8-3.9
4.0-4.1
4.2-4.3
4.4-4.5
4.6-4.7
4.8-4.9
5.0-5.1
Percent range
April projections
2
4
6
8
10
12
14
16
Number of participants
2012
2.4-2.5
2.6-2.7
2.8-2.9
3.0-3.1
3.2-3.3
3.4-3.5
3.6-3.7
3.8-3.9
4.0-4.1
4.2-4.3
4.4-4.5
4.6-4.7
4.8-4.9
5.0-5.1
Percent range
2
4
6
8
10
12
14
16
Number of participants
2013
2.4-2.5
2.6-2.7
2.8-2.9
3.0-3.1
3.2-3.3
3.4-3.5
3.6-3.7
3.8-3.9
4.0-4.1
4.2-4.3
4.4-4.5
4.6-4.7
4.8-4.9
5.0-5.1
Percent range
2
4
6
8
10
12
14
16
Number of participants
Longer run
2.4-2.5
2.6-2.7
2.8-2.9
3.0-3.1
3.2-3.3
3.4-3.5
3.6-3.7
3.8-3.9
4.0-4.1
4.2-4.3
4.4-4.5
4.6-4.7
4.8-4.9
5.0-5.1
Percent range
NOTE: Definitions of variables are in the general note to table 1.
Page 6 Federal Open Market Committee_____________________________________________________________________________________________
2
4
6
8
10
12
14
16
Number of participants
Figure 2.B. Distribution of participants’ projections for the unemployment rate, 2011–13 and over the longer run
2011
January projections
5.0-5.1
5.2-5.3
5.4-5.5
5.6-5.7
5.8-5.9
6.0-6.1
6.2-6.3
6.4-6.5
6.6-6.7
6.8-6.9
7.0-7.1
7.2-7.3
7.4-7.5
7.6-7.7
7.8-7.9
8.0-8.1
8.2-8.3
8.4-8.5
8.6-8.7
8.8-8.9
9.0-9.1
Percent range
April projections
2
4
6
8
10
12
14
16
Number of participants
2012
5.0-5.1
5.2-5.3
5.4-5.5
5.6-5.7
5.8-5.9
6.0-6.1
6.2-6.3
6.4-6.5
6.6-6.7
6.8-6.9
7.0-7.1
7.2-7.3
7.4-7.5
7.6-7.7
7.8-7.9
8.0-8.1
8.2-8.3
8.4-8.5
8.6-8.7
8.8-8.9
9.0-9.1
Percent range
2
4
6
8
10
12
14
16
Number of participants
2013
5.0-5.1
5.2-5.3
5.4-5.5
5.6-5.7
5.8-5.9
6.0-6.1
6.2-6.3
6.4-6.5
6.6-6.7
6.8-6.9
7.0-7.1
7.2-7.3
7.4-7.5
7.6-7.7
7.8-7.9
8.0-8.1
8.2-8.3
8.4-8.5
8.6-8.7
8.8-8.9
9.0-9.1
Percent range
2
4
6
8
10
12
14
16
Number of participants
Longer run
5.0-5.1
5.2-5.3
5.4-5.5
5.6-5.7
5.8-5.9
6.0-6.1
6.2-6.3
6.4-6.5
6.6-6.7
6.8-6.9
7.0-7.1
7.2-7.3
7.4-7.5
7.6-7.7
7.8-7.9
8.0-8.1
8.2-8.3
8.4-8.5
8.6-8.7
8.8-8.9
9.0-9.1
Percent range
NOTE: Definitions of variables are in the general note to table 1.
Summary of Economic Projections of the Meeting of April 26-27, 2011 Page 7_____________________________________________________________________________________________
2
4
6
8
10
12
14
16
Number of participants
Figure 2.C. Distribution of participants’ projections for PCE inflation, 2011–13 and over the longer run
2011
January projections
0.5-0.6
0.7-0.8
0.9-1.0
1.1-1.2
1.3-1.4
1.5-1.6
1.7-1.8
1.9-2.0
2.1-2.2
2.3-2.4
2.5-2.6
2.7-2.8
2.9-3.0
3.1-3.2
3.3-3.4
3.5-3.6
Percent range
April projections
2
4
6
8
10
12
14
16
Number of participants
2012
0.5-0.6
0.7-0.8
0.9-1.0
1.1-1.2
1.3-1.4
1.5-1.6
1.7-1.8
1.9-2.0
2.1-2.2
2.3-2.4
2.5-2.6
2.7-2.8
2.9-3.0
3.1-3.2
3.3-3.4
3.5-3.6
Percent range
2
4
6
8
10
12
14
16
Number of participants
2013
0.5-0.6
0.7-0.8
0.9-1.0
1.1-1.2
1.3-1.4
1.5-1.6
1.7-1.8
1.9-2.0
2.1-2.2
2.3-2.4
2.5-2.6
2.7-2.8
2.9-3.0
3.1-3.2
3.3-3.4
3.5-3.6
Percent range
2
4
6
8
10
12
14
16
Number of participants
Longer run
0.5-0.6
0.7-0.8
0.9-1.0
1.1-1.2
1.3-1.4
1.5-1.6
1.7-1.8
1.9-2.0
2.1-2.2
2.3-2.4
2.5-2.6
2.7-2.8
2.9-3.0
3.1-3.2
3.3-3.4
3.5-3.6
Percent range
NOTE: Definitions of variables are in the general note to table 1.
Page 8 Federal Open Market Committee_____________________________________________________________________________________________
2
4
6
8
10
12
14
16
Number of participants
Figure 2.D. Distribution of participants’ projections for core PCE inflation, 2011–13
2011
January projections
0.5-0.6
0.7-0.8
0.9-1.0
1.1-1.2
1.3-1.4
1.5-1.6
1.7-1.8
1.9-2.0
Percent range
April projections
2
4
6
8
10
12
14
16
Number of participants
2012
0.5-0.6
0.7-0.8
0.9-1.0
1.1-1.2
1.3-1.4
1.5-1.6
1.7-1.8
1.9-2.0
Percent range
2
4
6
8
10
12
14
16
Number of participants
2013
0.5-0.6
0.7-0.8
0.9-1.0
1.1-1.2
1.3-1.4
1.5-1.6
1.7-1.8
1.9-2.0
Percent range
NOTE: Definitions of variables are in the general note to table 1.
Summary of Economic Projections of the Meeting of April 26-27, 2011 Page 9_____________________________________________________________________________________________

Forecast Uncertainty
The economic projections provided by the members of the Board of Governors and the presidents of the Federal Reserve Banks inform discussions of monetary policy among policymakers and can aid public understand-ing of the basis for policy actions. Consider-able uncertainty attends these projections, however. The economic and statistical models and relationships used to help produce eco-nomic forecasts are necessarily imperfect de-scriptions of the real world. And the future path of the economy can be affected by myr-iad unforeseen developments and events. Thus, in setting the stance of monetary policy, participants consider not only what appears to be the most likely economic outcome as em-bodied in their projections, but also the range of alternative possibilities, the likelihood of their occurring, and the potential costs to the economy should they occur.
Table 2 summarizes the average historical accuracy of a range of forecasts, including those reported in past Monetary Policy Reports and those prepared by the Federal Reserve Board’s staff in advance of meetings of the Federal Open Market Committee. The pro-jection error ranges shown in the table il-lustrate the considerable uncertainty associated with economic forecasts. For example, sup-pose a participant projects that real gross do-mestic product (GDP) and total consumer prices will rise steadily at annual rates of, re-spectively, 3 percent and 2 percent. If the uncertainty attending those projections is sim-
ilar to that experienced in the past and the risks around the projections are broadly balanced, the numbers reported in table 2 would imply a probability of about 70 percent that actual GDP would expand within a range of 2.0 to 4.0 percent in the current year, 1.4 to 4.6 percent in the second year, and 1.2 to 4.8 percent in the third year. The corresponding 70 percent con-fidence intervals for overall inflation would be 1.2 to 2.8 percent in the current year, and 1.0 to 3.0 percent in the second and third years.
Because current conditions may differ from those that prevailed, on average, over his-tory, participants provide judgments as to whether the uncertainty attached to their pro-jections of each variable is greater than, smaller than, or broadly similar to typical levels of forecast uncertainty in the past as shown in table 2. Participants also provide judgments as to whether the risks to their projections are weighted to the upside, are weighted to the downside, or are broadly balanced. That is, participants judge whether each variable is more likely to be above or below their projec-tions of the most likely outcome. These judg-ments about the uncertainty and the risks at-tending each participant’s projections are dis-tinct from the diversity of participants’ views about the most likely outcomes. Forecast un-certainty is concerned with the risks associated with a particular projection rather than with divergences across a number of different pro-jections.
Page 10 Federal Open Market Committee_____________________________________________________________________________________________