Embed Size (px)
Citation preview

APPENDIX

Notes for FOMC MeetingDecember 17, 1985
Sam Y. Cross
Since your last meeting the dollar has declined about 2-3percent against most major currencies. This means that since the weekbefore the September G-5 meeting the mark has appreciated by 14 percentagainst the dollar and the yen by over 19 percent against the dollar(2.90 to 2.5240 DM; Y242 to Y202.5). For the first time since G-5,there has been more diversity of exchange rate movements, with thedollar actually rising against pound sterling and the Canadian dollarwhile declining against most other currencies.
For the most part, the dollar has fallen without much help fromcentral bank intervention. Our only intervention during this periodoccurred on one day shortly after the last FOMC meeting (Thursday, Nov.7), when commercial demand and large short covering put rather suddenupward pressure on dollar exchange rates. We responded by selling $77million against yen and $25 million against marks, operating bothdirectly and through agents. These operations, which were split equallybetween the Federal Reserve and the Treasury, were followed up by othercentral banks and the pressures subsided.
After these operations, the dollar declined through most ofNovember. The incoming U.S. business statistics of that month wereviewed as evidence of lackluster economic performance, raising marketexpectations of lower dollar interest rates. At the same time, afurther rise in Japanese interest rates narrowed the extent to whichinterest rate differentials favor the dollar. This prompted thedollar's fall particularly against the Japanese yen during much ofNovember. At one point just before Thanksgiving, it dropped temporarilyto a five-year low of less than 200 yen against the dollar. Then achange in tone of Japanese official statements, and some easing of yeninterest rates, led observers to conclude that the authorities weresatisfied with the size of the yen's appreciation and the dollar ratestabilized at just over 200Y per dollar.
Late in November attention turned to the German mark. Againsta background of growing optimism about the German economy, speculationtook hold that the mark would tend to catch up with the yen's earlierrise. This prompted the market to undertake heavy purchases of marksagainst dollars as well as against yen and European currencies.
The rise in the mark tended to reveal the vulnerabilities inexisting EMS exchange rate relationships. Despite sporadic signs ofimprovement in the trade and inflation performance of France, Italy andBelgium, there is a view that cumulative inflation differentials willnecessitate an eventual EMS realignment, with only timing a matter ofdebate. The planned entry of Spain and Portugal into the EC in Januaryand prospective French national elections in March both served to focusattention on the possibility of a realignment early next year. Many

market participants expect that the present French Government willresist strongly any realignment before the elections, and that a newconservative government, if elected, would wish to press promptly for acut in the rate and blame the need for devaluation on its predecessors'policies. This expectation had led to pressure against the French francand also against the currencies of Italy and Belgium, currencies thatwould also be expected to be devalued in event of an EMS realignment.All these countries have intervened and sold large amounts of marks.
The Germans, for their part, have been in on both sides of themarket, both buying and selling dollars. Early in December, when thedollar fell temporarily below DM2.50, viewed as a key level by manytraders, the Bundesbank stepped in to buy $170 million in the spotmarket in two days. It used the proceeds to cover settlement of someforward dollar sales which it had made during the heavy interventionoperations undertaken around the end of February. Then, last week, whenthe dollar firmed suddenly to approach DM2.56, the Bundesbank againentered the market, this time selling dollars in a small but highlyvisible operation. These Bundesbank operations, buying dollars atDM2.50 and selling DM2.56 have reinforced the view in the market thatthe central banks are reasonably satisfied with the dollar tradingnarrowly around current levels. With respect to the yen, there has beensome further easing of interest rates today, as the seasonal pressureson Japanese interest rates are ending, and the Bank of Japan has notoffset that easing. But this seems to have had little or no effect onthe exchange rate, which continues to trade around 202-203 yen perdollar.
PETER D. STERNLIGHT
NOTES FOR FOMC MEETING
DECEMBER 16-17, 1985
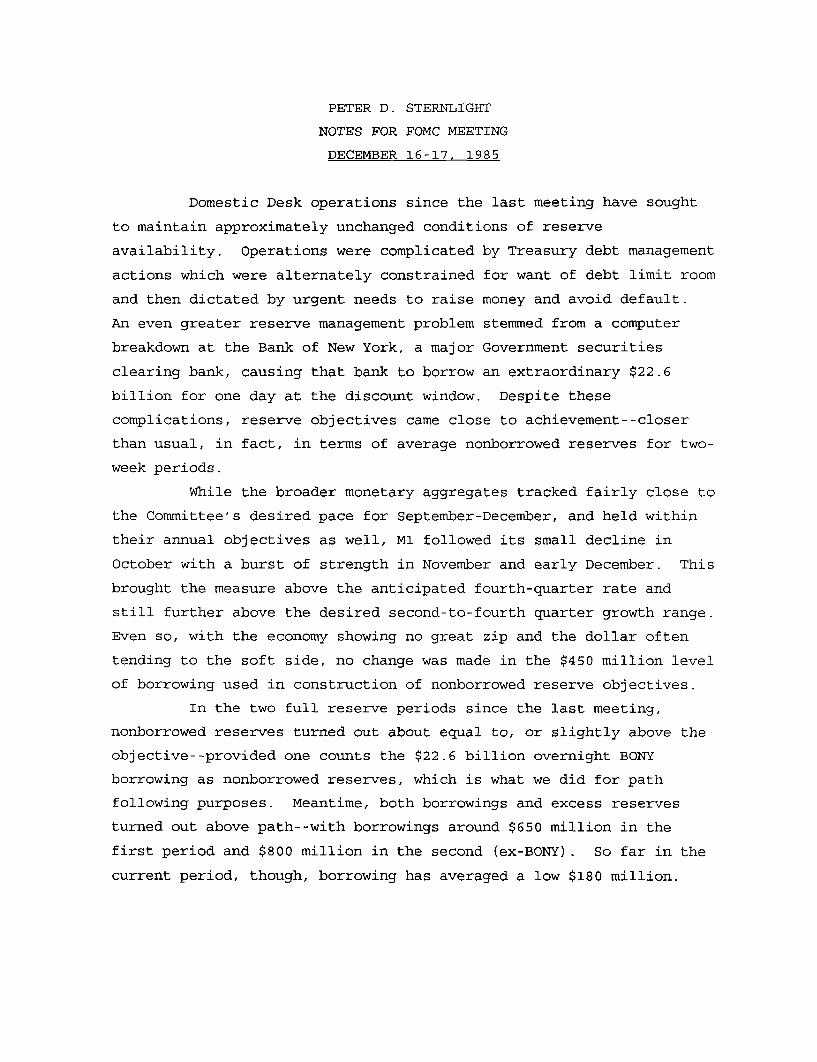
Domestic Desk operations since the last meeting have sought
to maintain approximately unchanged conditions of reserve
availability. Operations were complicated by Treasury debt management
actions which were alternately constrained for want of debt limit room
and then dictated by urgent needs to raise money and avoid default.
An even greater reserve management problem stemmed from a computer
breakdown at the Bank of New York, a major Government securities
clearing bank, causing that bank to borrow an extraordinary $22.6
billion for one day at the discount window. Despite these
complications, reserve objectives came close to achievement--closer
than usual, in fact, in terms of average nonborrowed reserves for two-
week periods.
While the broader monetary aggregates tracked fairly close to
the Committee's desired pace for September-December, and held within
their annual objectives as well, M1 followed its small decline in
October with a burst of strength in November and early December. This
brought the measure above the anticipated fourth-quarter rate and
still further above the desired second-to-fourth quarter growth range.
Even so, with the economy showing no great zip and the dollar often
tending to the soft side, no change was made in the $450 million level
of borrowing used in construction of nonborrowed reserve objectives.
In the two full reserve periods since the last meeting,
nonborrowed reserves turned out about equal to, or slightly above the
objective--provided one counts the $22.6 billion overnight BONY
borrowing as nonborrowed reserves, which is what we did for path
following purposes. Meantime, both borrowings and excess reserves
turned out above path--with borrowings around $650 million in the
first period and $800 million in the second (ex-BONY). So far in the
current period, though, borrowing has averaged a low $180 million.
The federal funds rate ranged fairly widely over the period,
partly because of temporary maldistributions in the aftermath of the
BONY borrowing. For the two full reserve periods, the rate averaged
8.04 and 8.10 percent, while thus far in the current period the
average is just under 8.
Viewing the period as a whole, funds have thus averaged a
shade firmer than the 8 percent or slightly under the range that was
anticipated in association with $450 million of borrowing. The
slightly greater firmness may reflect some of the stress and strain
produced by debt ceiling problems--with several big Treasury payment
days including some requiring same day auction and settlement--and the
aforementioned BONY problem that skewed the distribution of reserves
both geographically and over time. Another factor, possibly, has been
the decline in seasonal borrowing from $100-150 million a month or two
ago to more like $50 million more recently; as seasonal needs ran
lower a little more of the borrowing gap had to be filled by
adjustment borrowing.
While shifting Treasury balances and the outsize BONY
borrowing affected the timing of reserve needs, strong seasonal needs
did finally show through, chiefly because of increased currency in
circulation. To meet the needs, the Desk bought nearly $6.7 billion
of Treasury securities on an outright basis during the intermeeting
period, requiring--as you know--a temporary increase in leeway.
The purchases included abut $3.3 billion of bills bought in the
market, about $1.8 billion of bills bought from foreign accounts and
$1.55 billion of coupon issues purchased in the market. Repurchase
agreements were arranged about a dozen times, about evenly divided
between System and customer-related operations. Matched sales were
undertaken three times to absorb reserves temporarily in over-supply,
including one occasion a few days after the BONY problem.
With year-end approaching, it may be of interest to note that
the System's net outright securities purchases so far this year came
to a record $18.4 billion. This brings the portfolio of Treasury and
agency issues close to $190 billion. The previous record increase was

$16.4 billion in 1983, while in other recent years the rise was $7 or
$8 billion. This year's increase included about $14 billion in bills
and $4 billion in coupon issues. Chiefly, the large outright increase
was needed to offset the reserves absorbed through an $11 billion
increase in currency in circulation and a $7 billion rise in
requirements as money expanded and some required reserve ratios were
phased up.
Interest rates fell appreciably in the intermeeting period,
especially for intermediate- and longer-term issues. A major factor
seemed to be the growing confidence that Congress would pass some sort
of Gramm-Rudman deficit restraint measure, as they finally did. The
economy was regarded as advancing only modestly with inflation not a
serious threat, particularly given the outlook for oil prices. Some
analysts drew comfort from official statements and actions to support
their view that monetary policy might be tending to the more
accommodative side and certainly was not firming despite strong M1
growth. Anticipations of a discount rate cut waxed and waned,
rebuilding to a fairly widespread expectation by the close of the
period. The decline in the dollar posed a cautionary consideration at
times as market observers noted official concerns on this score, but
as the dollar steadied this factor became less potent.
Against this buoyant background, the markets absorbed a huge
amount of debt, including a backlog of Treasury issues piled up
because of debt limit constraints until mid-November. Yields on
Treasury issues due in two years or longer were mostly down by 65-75
basis points, while the Treasury raised about $22 billion in the
coupon area. Yields on the longest Treasury bonds fell through 10
percent for the first time since 1980, approaching 9-1/2 percent in
recent days. There was also heavy corporate and tax-exempt issuance,
generally at declining yields. Spreads on Farm Credit issues over
Treasury yields narrowed as the Congress moved toward approving
legislation that would provide for a possible Treasury back-up behind
that agency's paper. On the other hand, Texaco issues rose sharply in
yield following an adverse court judgment against that company, and

they have been shut off from their usual funding in the commercial
paper market.
In the short-term area, yields fell more modestly, perhaps
anchored by a federal funds rate that fluctuated mainly around 8
percent, though a bit below in recent days. Bill rates held quite
steady through most of the period, around 7-1/4 percent for three-
month issues, but came down to about 7 percent in the last week or so
as a stronger conviction pervaded the market that policy was taking,
or was about to take, an easier turn. Both three- and six-month bills
were sold today at average rates of about 7 percent, compared with
7.21 and 7.30 just before the last meeting. The Treasury meantime
raised a net of about $10 billion in the bill market. Rates on CDs
and commercial paper fell less than on bills, roughly by 10 basis
points.
A widespread, though not universal, market expectation now is
that policy is tending to the easier side, with a discount rate cut
likely in a matter of weeks. This leaves participants content with a
funds rate a little under 8 percent for the time being but mainly
expecting a reduction near term. These expectations have also been a
factor in the big stock market rally of recent weeks.

DELindsey12/16/85
FOMC Briefing on Monetary Aggregates
This year's slowdown in nominal GNP growth, shown in the top left
box of your first chart, was accompanied by a marked acceleration of M1
expansion, in the second box. The associated drop in the velocity of M1,
shown in the adjoining graph, was a little faster this year than its rate of
decline from late 1981 to early 1983. This year's drop moved V1 well below its
1981 peak. V's decline on balance over this period stands in sharp contrast
to its previous 3 percent annual trend rate of growth since the early fifties.
A rough correspondence of V1 with short-term interest rates, represented in
the top graph by a two-quarter moving average of the 3-month Treasury bill
rate, is evident. But the relationship with the bill rate has not been very
stable.
The lower panels portray less steep declines this year in the
velocities of M2 and M1-A than for V1. During the last five years, M2's
velocity has fallen on balance, while M1-A's velocity generally has continued
to rise.
These measures of contemporaneous velocities do not capture the
ability of an aggregate to foreshadow future movements in GNP. Any leading
relationship from money to GNP would be better reflected by calculating its
velocity with money measured for an earlier period than for GNP. In chart 2
velocities are calculated as ratios of current GNP to money lagged two quarters.
As shown in the second panel, using this procedure gives a smoother pattern
of M1 velocity than the standard V1 measure through 1985. This suggests the
presence of some leading relationship over two quarter periods going from M1

-2-
to GNP. Even so, a marked departure frcm the postwar uptrend in M1 velocity
remains. Also, the leading relationship is somewhat erratic and recently
seems to be deteriorating further. Given the M1 growth that has occurred,
another decline in this lagged measure of V1 is in store for the first half
of 1986 unless nominal GNP grows at a 12 percent annual rate. Sane decline
in the velocities of M2 and M1-A also seems in train over the first half of
next year, when nominal GNP is likely to grow more slowly than the growth
rates of these aggregates over the second half of this year.
Recent growth rates of all three aggregates, but especially M1,
also have been considerably more rapid than suggested by postwar relationships
as enbodied in econometric models of money demand. Model underpredictions
of M1 growth, shown in the top panel of chart 3, are of unprecedented size
both for 1985 as a whole, in the left panel, and for the third quarter, in
the right panel. The model errors for M2 and M1-A growth over the same
periods, though appreciable, were smaller than for M1.
The outsized growth of M1 this year in part seems to have reflected
the relative behavior of offering rates on various accounts that have been
newly authorized or deregulated during the 1980s. The rate on regular NOWs
has remained fixed at its 5-1/4 percent ceiling, while--as shown in the top
panel of chart 4-offering rates on Super NOWs have adjusted only sluggishly
to changes in market yields. MMDA rates, in the middle panel, have adjusted
somewhat more flexibly. Small time deposit rates, in the lowest panel,
have moved rather promptly in response to variations in Treasury bill
rates.
Thus, the general decline in market rates since the late summer
of 1984 has been associated with a narrowing in the the spread between offering
rates on small time deposits and Super NOWs, as shown on the top panel of

-3-
your next chart. As the opportunity cost of holding NOW accounts has diminished,
inflows to those accounts have strengthened considerably, as indicated by
the solid line in the middle panel . Sane of these inflows evidently were
diverted from small time deposits, which, as the dashed line shows, recorded
sizable outflows after mid-year. The rough inverse relationship between
flows of small time deposits and OCDs suggests an influx of savings-type
balances into NOW accounts this year. The increased relative returns on
NOWs seem to have lessened the public's desire to separate transactions
from savings balances by more than the models suggest.
Other liquid assets, including MMDAs, shown in the bottom panel,
and savings and demand deposits, not shown, also accelerated markedly this
year. Lower interest rates on market instruments and small time deposits
likely played an important role. But some of the reallocation of funds to
all these more liquid accounts may have been motivated in part by the public's
concerns about financial fragility and desires to have readily accessible
insured deposits.
In assessing the future behavior of the aggregates, the effects of the
final steps of deposit deregulation need to be considered. The present
$1,000 minimum balance requirement on Super NOWs and MMDAs will be eliminated
on January 1, 1986, and the remaining interest rate ceilings will be removed
on April 1. We expect these steps to induce little initial shifting of funds
between the various onetary aggregates. Present indications are that
depository institutions generally do not plan to offer any more attractive
rates on small-sized NOW or savings accounts or to promote such accounts
heavily.

-4-
These final steps of deposit deregulation, though, may well have
effects on the characteristics of the monetary aggregates over tie. The
interest responsiveness of M2 is likely to become still smaller, as offering
rates on savings accounts begin to exhibit some responsiveness to variations
in market rates, though just how flexible they will be is still uncertain.
In addition, the bulk of deposit flows induced by changing relative returns
will tend to be contained within M2.
The interest responsiveness of M1, even with the deregulation of
regular NOWs, may well not be reduced by much--at least over periods of up
to a year. Given the sluggish adjustment likely for NOW rates and the
currently low spreads between market interest rates and these offering
rates, M1 could show a fairly large response if short-term interest rates
were to decline. Considering the present wide range of uncertainty about
what future interest rate levels will be consistent with adequate economic
performance, a large M1 sensitivity to interest rates would make it harder
to set a narrow target range for M1.
Final deregulation also may influence the ongoing trend rate of
growth in M1 velocity, considered apart from effects of interest rate
movements. The trend of M1 velocity may have diminished some already,
since lower market interest rates and deregulation of transactions deposit
rates probably have reduced incentives for innovations aimed at economizing
on M1 balances. But the experience of recent years affords little real
guidance in this regard, because disentangling the separate impact of a
lower trend of innovations from other influences is virtually impossible.
In addition, the future evolution of deposit pricing and account offerings is
difficult to foretell.

-5-
The unusual strength in demand deposits during 1985, which was
concentrated in business accounts, is a sign that the behavior of M1-A, as
well as M1, is hard to predict. The interest sensitivity of M1-A may not
be much affected by the full deregulation of accounts outside it. The
future trend rate rate of M1-A velocity could exceed that of M1 for some
time, but by how much will depend in part on the extent of the ongoing
conversion o f demand deposits to other accounts.
Experience in coming years may help diminish these uncertainties
involving the monetary aggregates. M2, for example, could become a more
useful guide than M1 as the broader aggregate develops less sensitivity to
interest rate changes, and if its relationships to other economic measures
remain at least no more unstable than relations involving M1. On the other
hand, M1 should remain more dominated than M2 by transactions motives, so
that M1's "transactions" component would probably be more closely connected
than M2 with movements in GNP. The usefulness of M1 could tend to be
enhanced, even assuming its interest sensitivity proves to be somewhat
larger than M2's, if experience in coming years also makes the enlarged
"savings" component of M1 more predictable than is the case today.

STRICTLY CONFIDENTIAL (FR) CLASS I-FOMC
Materials for
Staff Presentation to the
Federal Open Market Committee
December 16-17, 1985

Nominal GNPGrowth
(Q4 to Q4)
1984 9.5
1985 5.8e
M1 Growth
(Q4 to Q4)
1984 5.2
1985 11.7e
Chart 1
Treasury Bill Rate and Current Velocities
Three-month Treasury Bill Rate (two-quarter moving average)Percent, ratio scale
- 14.00
12.00
10.00
8.00
I I I I 6.001981 1983 1985
M1 Velocity
1981 1983 1985
M2 Velocity
M2 Growth
(Q4 to Q4)
1984 7.7
1985 8.7e
M1-A Growth
(Q4 to Q4)
1984 3.5
1985 8.1e
e -- partly estimated
Shift Adjusted
1981
M1-A Velocity
1983 1985
1981 1983 1985
Ratio scale
-1.70
-1.65
- 1.60
S1.55
Ratio scale
9.25
-- 9.00
S8.75
- 8.50
8.25

Chart 2
Treasury Bill Rate and Velocities Using Two-Quarter Money Lag
Three-month Treasury Bill Rate (two-quarter moving average)Percent, ratio scale
14.00
- 12.00
- 10.00
8.00
I I I I I 6001981 1983 1985
M1 VelocityRatio scale
- 7.00
- 6.80Shift Adjusted
- 6.60
- 6.40
1981 1983 1985
M2 VelocityRatio scale
S- 1.80
1.75
S- 1.70
-hift Afiiatn e -- 1.65
1981 1983 1985
M1-A Velocity
1983 19851981

Chart 3
Money Growth Rate Errorsin Board Staff Quarterly and Monthly Demand Models
(Actual Minus Predicted)
Percent-I
Annual
- Monthly Model
SQuarterly Model /
I I I I1981 1982 1983 1984
/
4,"p
"p
1985
]8
4
Percent
Annual
Monthly Model
-. --
1981
Quarterly Model
I I I I1982 1983 1984 1985
-4
Quarterly
Monthly Model- ,
Quarterly- Model
04
198401 02 03
1985
1984 1985
M1-A
Annual
Percent
-14
Quarterly Model
8 1
1 1 1984 19851981 1982 1983 1984 1985
M1-A
04 01 02 U
1984 1985
Percent
7\b \\
II I I
Percent
4
4
Percent
4
\ +0
4
I
I
~---

Chart 4
Bank Offering Rates and Market Interest Rates
I-
Three-month Treasury Bill
SSuper NOW
I II II1984 1985
Three-month Treasury Bill-\
S MMDA
MMDA......... ....
I I I I I I I I1985
Treasury Bill
Small Time
1983 184 198
Percent
11
10
9
8
7
6
1983
Percent
10
9
8
7
6
1983 1984
1984 19851983

Chart 5
Rate Spreads and Deposit Inflows'
Percent
Six-month Small Time less.**'"". Super NOW Rate Spread
-1 3
-- 2* a *S a
. a
I I I i I I I I I I I I I I I I I I I I II1983 1984 1985
Billions of dollars
8
4--
Billions of dollars
/ -- \
\l Te D tSmall Time Deposit Inflows
0 0 / \-OCD Inflows /
I I I I I I I I I I ) I I I I I I I I I I1983
of dollars
1984 1985
Percent
Six-month Small Timeless MMDA Rate Spread
a
1983 1984 1985
1 Rate spreads are calculated using average offering rates at commercial banks Deposit inflows are three-month moving averages
of inflows at all depository institutions
4
3
2
1
.
"''

J.L. KichlineDecember 16-17, 1985
FOMC BRIEFING
The staff's forecast prepared for this meeting of the
Committee is, on the whole, about unchanged for the current and
next quarter, but a shade weaker later on in 1986. The
downward revision to expected real growth next year stems
mainly from a reassessment of the fiscal assumptions in light
of the enactment of the Gramm-Rudman legislation, and we now
have somewhat more fiscal restraint built into the forecast.
For all of 1986 real GNP is projected to rise 2 percent or the
same as expected for this year. On the price side there have
not been any significant changes and we still project inflation
to show a little uptick in response to the lower foreign
exchange value of the dollar, but to remain under 4 percent.
In the current quarter, our reading of the available
information generally is consistent with the earlier notion
that real GNP is expanding at a 2-1/2 percent annual rate. The
labor market reports have been upbeat with nonfarm employment
increasing 180,000 in November after a much larger gain in the
preceding month; the unemployment rate in November dipped a
tenth to 7 percent. Increases in employment continue to be
concentrated in the services area, although manufacturing
employment edged up after a larger gain in October. Industrial
output is estimated to have increased 0.4 percent last month as

- 2 -
most major categories of production rose, but the level of
output was only fractionally above the third-quarter average
given the September and October decline.
Retail sales excluding autos were reported to have
risen strongly in November after a sluggish performance in
October. Reports from retailers on post-Thanksgiving sales
present a mixed picture and are very difficult to interpret,
but we would judge sales to be up moderately. Automobile sales
in November remained depressed for domestic models, and
manufacturers reintroduced some limited financing incentives.
Early in December sales picked up to near 7-1/2 million units
annual rate, a level that is still below recent and planned
production.
Housing starts in October finally demonstrated some
life even though new home sales had weakened in that month and
the two preceding months. Unfortunately, the Census Bureau
provided a surprise this morning, reporting that starts in
November fell 200,000 units annual rate to 1.55 million. The
decline was concentrated in single-family units and occurred
across all regions. Those numbers are not readily explicable,
although mortgage interest rates are even lower now and we
would still expect housing to be a growth sector over the
forecast period.

- 3 -
Business fixed investment spending seems likely to
expand sluggishly this quarter. A rise in nondefense capital
goods shipments including IBM's new Sierra mainframes is
expected to be damped by a reduction in business purchases of
autos and weakness in nonresidential construction outlays.
Business inventory investment is projected to contribute
substantially to growth of real GNP this quarter in association
with the rebuilding of auto stocks. I should note, however,
that retail inventories excluding autos showed unexpected rapid
accumulation in October, and to hit the staff forecast
manufacturing and trade inventories excluding autos will need
to be essentially flat over the balance of the quarter.
Government purchases and net exports are not expected
to influence significantly growth in GNP this quarter, although
they are quite important elements in the staff's forecast for
1986. Net exports next year are projected to account for about
1/2 percentage point of the growth in real GNP as the reduced
foreign exchange value of the dollar helps boost exports and
cuts into import volume.
In contrast, the government sector acts as a drag on
the economy as a result of the assumed fiscal restraint. In
this forecast the staff has assumed that the first stage
Gramm-Rudman cuts amounting to $12 billion will go into effect
next March 1; however, because of slippage in reaching earlier
outlay objectives, we have a net reduction of only about

- 4 -
$5 billion from the assumption we had made in previous
forecasts. The impact of the additional restraint is partly
offset by the effect of lower interest rates which leads to
somewhat higher spending than otherwise in interest sensitive
sectors, notably housing.
The degree of uncertainty attached to the staff's or
any other forecast for 1986 it seems is rather large at this
juncture. There indeed are substantial risks connected with
the underlying assumptions as well as developments in
individual sectors of the economy. As to the assumptions
themselves, we have a further moderate decline in the dollar in
prospect although clearly one could pick out uncertainties in
both directions. For fiscal policy the assumed total deficit-
reducing actions in the forecast of $50 billion for fiscal year
1986 still give a deficit a little over $190 billion. With a
Gramm-Rudman objective of $144 billion for the next fiscal
year, it is not at all clear how fiscal policy will evolve as
the year progresses. As to risks in some individual sectors I
might note the case of consumer spending where the staff is
projecting 2 percent growth next year. That is sluggish growth
compared to recent experience, but we have tried to balance the
stimulative effects of now lower interest rates and higher
wealth against prospective slow growth of disposable income, an
already low saving rate, and high debt burdens. Whether or not

- 5 -
we have weighted these and other considerations correctly is,
of course, open to debate.
On the inflation side, recent monthly price numbers
have been higher than earlier in the year, reflecting what is
believed to be a temporary rise in food and energy prices.
Livestock prices surged this fall but indications from futures
markets are that those prices will fall somewhat in the first
half of next year. Energy prices also rose somewhat in the
past couple of months although oil prices have since declined
and we expect flat energy prices next year. Overall, the price
forecast indicates only a small rise next year in association
with the lower value of the dollar.

FOMC BriefingSHAxilrod/pjdDecember 16, 1985
The alternatives presented to the Committee indicate that M1 can be
expected to slow sharply from its recent pace even with interest rates
around recent levels or a bit lower. The bases for such a judgment are,
one, the results of the staff's quarterly and monthly money demand models
and, two, the belief that the level of demand deposits has already risen well
beyond the need for them in relation to current and prospective increases
in income. Both bases have admittedly and to say the least been shaky
over the past several months, but while M1 growth has been stronger than
expected, at least it has decelerated--to just under 8 percent annual rate
on average over the three months ending in November from just over a 16-1/2
percent annual rate over the three months ending last August.
While some further deceleration may be in prospect, after a potential
bulge in December, it has to be kept in mind that M1 seems highly sensitive
to interest rate developments, particularly in the current range of market
rates when the opportunity costs of holding highly liquid balances like NOW
accounts is quite low. The odds on a further deceleration are much the
greatest if rates stabilize or rise. Some further downtrend of rates, on
the other hand, could well trigger sizable inflows into NOW accounts. Even
if that were to develop, though, it may not be accompanied by any substantial
acceleration of M2, given the quite moderate growth in GNP that we are
projecting, unless there was a temporary surge of market funds shifting into
MMDAs or money funds as adjustments in their rates lagged further market
rate declines.
The potential for unfavorable economic developments--either
undesired weakness in economic activity or accelerated price inflation--

-2-
seems less embedded in the behavior of the aggregates at this point in time--
assuming all of the aggregates do not more or less together either accelerate
or decelerate--than it does in other factors. The potential for economic
weakness--while partly related to lingering adverse effects of the unexpected
earlier strength of the dollar--is also a product, from a financial perspec-
tive, of relatively high real market interest rates. They have probably
become a constraining force in the plant and equipment and residential
construction areas as ebullience from the initial surge in demand in the
period of rapid recovery has waned, as expectations of "inflationary"
profits have become or are becoming more muted, and if, or as, fiscal
restraint does eventuate.
Looking at the inflationary side, on the other hand, the behavior
of the exchange rate seems under current circumstances to be the key
element. With commodity prices weak and unit labor costs at least not
showing a tendency to accelerate significantly, a sharp drop in the
dollar seems to be the main threat for setting off a price acceleration.
In that context, the rapid rise of M1 over the past several months would
provide a permissive financial background, in the sense that the cash is
there readily to finance transactions, even though the M1 expansion in and
of itself seems unlikely to initiate further inflationary tendencies.
The room for maneuver for monetary policy in these circumstances
depends in part on one's assessment of the nation's underlying growth
potential, and on the trade-off between price behavior and the degree of
economic expansion at this point in time. With regard to current policy
options, if the Committee opted to keep bank reserve conditions unchanged,
it seems unlikely that interest rates as a whole or the exchange rate
would decline much further--and they could back up some--unless current

economic indicators were clearly weak. Some little easing in bank reserve
conditions may not entail undue risk of initiating a very sharp further
drop of the dollar along with some farther decline of interest rates, since
some easing has already been anticipated by markets. But that is obviously
the policy direction that has the greatest risk of causing the dollar to
become unstuck. Thus, should the Committee decide to head in an easing
direction, it may wish to temper any such moves in light of behavior of the
exchange rate. Indeed, under current circumstances, it is probably not too
much of an exaggeration to say that, insofar as effects on the economy as a
whole are concerned--considering both real and price developments-there
may be some trade-off between interest rate and exchange market developments,
with a decline in the dollar in some degree substituting for a decline in
rates and vice-versa.