Embed Size (px)
Citation preview

Content last modified 03/31/2011.
Prefatory Note The attached document represents the most complete and accurate version available based on original files from the FOMC Secretariat at the Board of Governors of the Federal Reserve System. Please note that some material may have been redacted from this document if that material was received on a confidential basis. Redacted material is indicated by occasional gaps in the text or by gray boxes around non-text content. All redacted passages are exempt from disclosure under applicable provisions of the Freedom of Information Act.

Class II FOMC - Restricted (FR)
Part 1 August 4, 2005
CURRENT ECONOMICAND FINANCIAL CONDITIONS
Summary and Outlook
Prepared for the Federal Open Market Committeeby the staff of the Board of Governors of the Federal Reserve System

Class II FOMC - Restricted (FR)
August 4, 2005
Summary and Outlook
Prepared for the Federal Open Market Committeeby the staff of the Board of Governors of the Federal Reserve System

Class II FOMC—Restricted (FR)
Domestic Developments
I-1
According to the latest available information, economic activity expanded somewhat more quickly than its potential during the first half of this year. Real GDP now is reported to have risen at a 3½ percent average annual rate in the first and second quarters—about in line with its pace in the second half of 2004. Consumer spending trended up through most of the first half at a moderate pace and responded with vigor in June and July to the introduction of “employee pricing” on motor vehicles. At the same time, spending on residential investment increased at close to double-digit annual rates. In the business sector, the growth in capital spending has been fairly well maintained, but actions by firms to reduce their stockbuilding were a drag on production. The labor market continued to firm gradually in the first half of the year, with the unemployment rate falling to 5 percent. Core PCE prices accelerated during the first quarter but then subsided to an annual rate of about 1¾ percent in the second quarter. Looking ahead, we project the pace of activity to accelerate noticeably in the second half of this year before falling back to about its potential in 2006. Arithmetically, the near-term quickening of production relative to the first half of this year can be roughly attributed to two key mechanisms: First, we have the pace of inventory investment outside the motor vehicle sector essentially leveling out in the third and fourth quarters rather than stepping down sharply as it did in the second quarter. With stockbuilding already at a moderate level and most firms indicating no dissatisfaction with either their own or their customers’ inventory holdings, the leveling out seems consistent with business intentions. The second mechanism providing near-term impetus to real GDP is an acceleration in motor vehicle production—an acceleration that appears warranted given the recent heady pace of sales in that sector. Meanwhile, we have trimmed our estimate of the growth of potential output on the basis of information in the revisions to the national accounts (discussed in greater detail below and in the appendix to Greenbook Part II). All told, we have revised up our projection for the growth of real GDP this year to nearly 4 percent and trimmed our forecast for next year to just over 3 percent. We expect the unemployment rate to remain in the neighborhood of 5 percent over the projection period and the output gap to be essentially closed by the end of this year. Although most of the recent news about inflation has been encouraging, two pieces of information have clouded the outlook somewhat. First, the recent revisions to the national income and product accounts put the so-called nonmarket component of core PCE prices on a steeper upward trajectory. While these prices have little or no implication for the future behavior of the market-based component, they do, obviously,

I-2 Class II FOMC—Restricted (FR) Part I: Summary and Outlook, August 4, 2005
contribute directly to the increase in the overall core index. Second, energy prices are higher in our latest outlook than in the June Greenbook, and that upward revision feeds through a little bit into core prices. Against the backdrop of greater near-term thrust in aggregate demand, slightly higher inflation pressures (including less slack), and apparently somewhat slower growth of productive capacity, we have assumed a significantly tighter monetary policy in this Greenbook than in the last one. On our estimates, the higher trajectory for the federal funds rate is necessary to keep aggregate demand from exceeding supply, to limit the increase in core PCE inflation in 2006, and to point core PCE inflation slightly downward heading into 2007. Key Background Factors Since the June FOMC meeting, market participants have marked up their expected path for the federal funds rate on generally better-than-expected news about the economy. As noted above, we, too, have allowed for a more rapid removal of monetary accommodation and now assume that, in addition to a ¼ percentage point hike in the federal funds rate at the August meeting, the FOMC will raise the rate an additional ¼ percentage point at both the September and November meetings, bringing it to 4 percent. We also assume that an additional step-up to 4¼ percent around the middle of next year will be required to keep inflation from heading up further and output from exceeding its potential. The resulting assumed path for the federal funds rate is essentially the same as current market expectations. Long-term interest rates have also moved up since the June Greenbook, and we have taken that change on board. We expect bond rates to hold near their current levels during the forecast period. Broad equity price indexes are about 3½ percent above the level that we anticipated in the June Greenbook. We have raised the starting point for share prices commensurately and continue to assume that they will increase at a rate of 6½ percent per year, roughly maintaining risk-adjusted parity with the yield on long-term bonds. A key factor in the run-up in household net worth over the past few years has been the extraordinary gains recorded in house prices. We expect gains to continue, although not at the 12 percent rate recorded last year: We project price gains of about 7 percent this year and 3 percent in 2006. We have made no change to our fiscal policy assumptions: Current spending levels for operations in Iraq and Afghanistan will be maintained through 2006; other defense

Domestic Developments Class II FOMC—Restricted (FR) I-3
spending will increase about 3 percent per year in real terms; the Medicare drug benefit will come on line in 2006; and AMT relief will be extended. On these assumptions, federal fiscal policy provides only a small stimulus to growth—about ¼ percent of GDP—in both 2005 and 2006. Roughly half the stimulus in each year reflects projected increases in real defense spending; the Medicare drug policy and lagged effects from the 2003 cut to personal income tax rates account for the remainder. Our projections for the federal unified budget deficit are little changed from the June Greenbook at $334 billion for fiscal 2005 and $330 billion for fiscal 2006, and they are close to the deficit projections the Administration released in mid-July. Our projected path for the broad real dollar starts out a touch lower than in the June Greenbook, in part because of China’s small revaluation against the dollar. Going forward, our forecast holds to the view that our sizable external imbalance will put pressure on the dollar, and we continue to project a small depreciation over the remainder of this year and next. Our projection of foreign activity is generally little changed from the June Greenbook, with growth among our trading partners averaging about 3¼ percent in the third quarter and over the rest of the forecast period. In the past week, spot and near-term futures prices for West Texas intermediate (WTI) crude oil have risen above the level that we anticipated in the June Greenbook. Prices moved up following fires at offshore oil platforms in India and the North Sea and the death of King Fahd of Saudi Arabia. Longer-term futures prices also have risen since the June Greenbook. In line with the most recent set of futures prices, we assume the WTI price will edge up $63.75 per barrel in the first half of 2006 before slipping to just above $63 by year-end. Relative to the June Greenbook, our assumptions imply an upward revision to the WTI price of roughly about $1 per barrel over the second half of this year and a substantially larger upward revision of $3.50 per barrel to the average price next year. The NIPA Revision and Aggregate Supply Assumptions In this forecast, we have incorporated the revised data on the national income and product accounts that were published at the end of July. Among the key features of this revision is the markdown of real GDP growth by a cumulative 0.9 percentage point over the 2002-04 period (0.4 percentage point each in 2002 and 2003, and 0.1 percentage point in 2004); the largest downward adjustments were in real spending on equipment and software and in real personal consumption expenditures. Cumulative growth in the nonfarm business sector was reduced by a somewhat larger 1.3 percentage points, which

I-4 Class II FOMC—Restricted (FR) Part I: Summary and Outlook, August 4, 2005
translates into a similar revision to labor productivity over this period. Only trivial changes were made to the estimated rate of increase in the market-based measure of core PCE prices, but substantial upward revisions to the prices of some medical and financial services boosted the nonmarket component, and hence the overall core PCE price indexes, in 2004. We interpreted the absence of any material revision to market-based core PCE inflation as implying that we should largely preserve our earlier estimates of the GDP gap. As for the future, we have lowered our estimates of growth in potential output about ¼ percentage point in each of 2005 and 2006, a move reflecting a smaller contribution from capital deepening that is consistent with the downward revision to the level of investment in this forecast. Recent Developments and the Near-Term Outlook Real GDP is estimated to have grown at a 3¼ percent pace in the second quarter. Although overall growth was only a little above our projection in the June Greenbook (we had expected 3 percent), the composition of demand was considerably different: The growth in private domestic final purchases was broadly in line with our expectations, but the arithmetic contribution from net exports was a considerably greater plus for production, and the slowdown in inventory investment was much steeper than we had expected. The greater contribution to growth from net exports reflected a double-digit increase in exports and a decline in imports—developments that we do not expect to be repeated in subsequent quarters. We do not expect inventory investment outside the motor vehicle sector to decline further from its pace in the second quarter. In the motor vehicle industry, we expect manufacturers to step up the pace of assemblies from the second-quarter pace, but even so, with sales proceeding at a very rapid pace in the third quarter, motor vehicle inventories look set for another steep decline. On net, and pending the receipt of the labor market report for July (due for release the day after this forecast is published), we are forecasting real GDP to increase at a 4¼ percent annual rate in the current quarter and at a 4 percent pace in the fourth quarter. The introduction of “employee pricing” in the motor vehicle industry was met by a sharp increase in sales in June and July and a significant reduction in dealer inventories of new vehicles. As best we can judge, the automakers have been surprised by the success of this program, and the days’ supply of light vehicles has likely fallen below desired levels. (Some reports have suggested that vehicles that might otherwise have been purchased by businesses are being redirected toward individuals.) In the very near term, the

Domestic Developments Class II FOMC—Restricted (FR) I-5
Summary of the Near-Term Outlook (Percent change at annual rate except as noted)
2005:Q2 2005:Q3 Measure June
GB Aug. GB
June GB
Aug. GB
Real GDP 3.0 3.3 3.8 4.3 Private domestic final purchases 4.2 4.4 4.0 4.7 Personal consumption expenditures 3.1 3.6 3.3 4.6 Residential investment 11.4 9.7 .5 3.2 Business fixed investment 7.6 6.7 10.9 5.9 Government outlays for consumption and investment 1.7 2.5 2.9 3.1
Contribution to growth (percentage points)
Inventory investment -1.5 -2.3 -.1 -.2 Net exports .6 1.4 -.1 -.1
manufacturers may have relatively little latitude for raising their production above the currently scheduled pace, particularly because several production lines are being changed over to new models. Nevertheless, General Motors and Ford have extended their employee-pricing programs at least through September 6 (Chrysler has not announced an expiration date for their program). All told, we anticipate that gross motor vehicle output will contribute about ½ percentage point to the growth of real GDP in the third quarter and a further ¼ percentage point in the fourth quarter, after having been a roughly neutral influence over the first half of the year. Outside the motor vehicle sector, inventory investment last quarter was half as large as we anticipated in the previous forecast. We think that firms are generally comfortable with their holdings of inventories relative to sales. Accordingly, we anticipate that they will maintain—rather than further reduce—the pace of inventory accumulation at the observed second-quarter rate. On this assumption, inventories outside of motor vehicles have little net influence on GDP growth in the next two quarters. Consumption spending in the current quarter is projected to increase at an annual rate of 4½ percent, a significant pickup from its second-quarter pace, before slowing to about 2 percent in the fourth quarter. Spending on motor vehicles is projected to accelerate this quarter as the extension of the employee-pricing schemes is projected to call forth an
I-6 Class II FOMC—Restricted (FR) Part I: Summary and Outlook, August 4, 2005
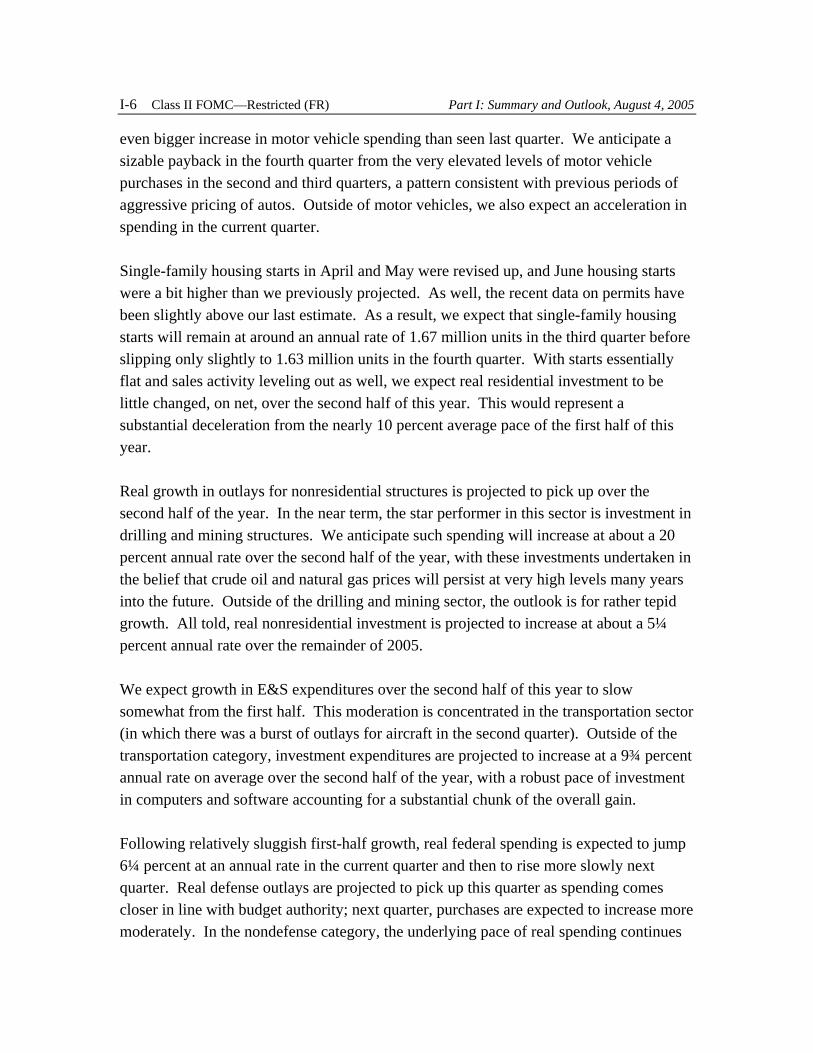
even bigger increase in motor vehicle spending than seen last quarter. We anticipate a sizable payback in the fourth quarter from the very elevated levels of motor vehicle purchases in the second and third quarters, a pattern consistent with previous periods of aggressive pricing of autos. Outside of motor vehicles, we also expect an acceleration in spending in the current quarter. Single-family housing starts in April and May were revised up, and June housing starts were a bit higher than we previously projected. As well, the recent data on permits have been slightly above our last estimate. As a result, we expect that single-family housing starts will remain at around an annual rate of 1.67 million units in the third quarter before slipping only slightly to 1.63 million units in the fourth quarter. With starts essentially flat and sales activity leveling out as well, we expect real residential investment to be little changed, on net, over the second half of this year. This would represent a substantial deceleration from the nearly 10 percent average pace of the first half of this year. Real growth in outlays for nonresidential structures is projected to pick up over the second half of the year. In the near term, the star performer in this sector is investment in drilling and mining structures. We anticipate such spending will increase at about a 20 percent annual rate over the second half of the year, with these investments undertaken in the belief that crude oil and natural gas prices will persist at very high levels many years into the future. Outside of the drilling and mining sector, the outlook is for rather tepid growth. All told, real nonresidential investment is projected to increase at about a 5¼ percent annual rate over the remainder of 2005. We expect growth in E&S expenditures over the second half of this year to slow somewhat from the first half. This moderation is concentrated in the transportation sector (in which there was a burst of outlays for aircraft in the second quarter). Outside of the transportation category, investment expenditures are projected to increase at a 9¾ percent annual rate on average over the second half of the year, with a robust pace of investment in computers and software accounting for a substantial chunk of the overall gain. Following relatively sluggish first-half growth, real federal spending is expected to jump 6¼ percent at an annual rate in the current quarter and then to rise more slowly next quarter. Real defense outlays are projected to pick up this quarter as spending comes closer in line with budget authority; next quarter, purchases are expected to increase more moderately. In the nondefense category, the underlying pace of real spending continues

Domestic Developments Class II FOMC—Restricted (FR) I-7
to be restrained in the second half of the year.1 In the state and local sector, where fiscal conditions continue to improve, we project that real spending will increase at an annual rate of about 1¾ percent in the current and next quarters. Export growth in the second quarter, at a 12¼ percent annual rate, was surprisingly strong, in part because of some special factors. We anticipate a moderation in export growth in the second half of the year, to a 7½ percent pace. Imports actually declined in the second quarter after a strong first-quarter showing, in part owing to quirky seasonal factors for oil imports; we think that import growth will rebound significantly, to 5 percent this quarter and to 8½ percent next quarter. All told, the external sector’s contribution of nearly 1½ percentage points to second-quarter growth is expected to swing to a ¼ percentage point negative contribution in the second half. Aside from the upward revision to last year’s rate of increase in the prices of some financial and medical services—prices that are not derived from market transactions—the incoming news on inflation has been better than expected, with the core PCE price index flat in June following modest increases in April and May. For the first half of the year, core PCE price inflation now appears to have averaged 2.1 percent, a shade less than we had expected as of the June Greenbook even with the faster growth of nonmarket prices. For this quarter and next, we have overall core PCE inflation averaging 2 percent, with the market-based component running a little lower than we had previously assumed and the non-market-based component somewhat higher. Overall PCE inflation is projected to be slightly higher than core inflation in light of an expected near-term rise in consumer energy prices. The most recent readings on employment costs have been mixed. The ECI for hourly compensation in private industry increased at an annual rate of only 2½ percent in the second quarter—the same as the first-quarter increase and nearly 2 percentage points less than our forecast in the June Greenbook. Meanwhile, the productivity and cost (P&C) measure of compensation per hour is currently estimated to have increased at a 3½ percent annual rate—a little stronger than we assumed previously—and the first-quarter gain was revised up. In response to these developments, we have taken down our projection for the growth of the ECI over the second half of this year by ¾ percentage point, leaving it at roughly 3¾ percent. At the same time, we have marked up slightly
1 Growth rates of nondefense spending in the second and third quarters are buffeted by a swing in
inventories held by the Commodity Credit Corporation.
I-8 Class II FOMC—Restricted (FR) Part I: Summary and Outlook, August 4, 2005
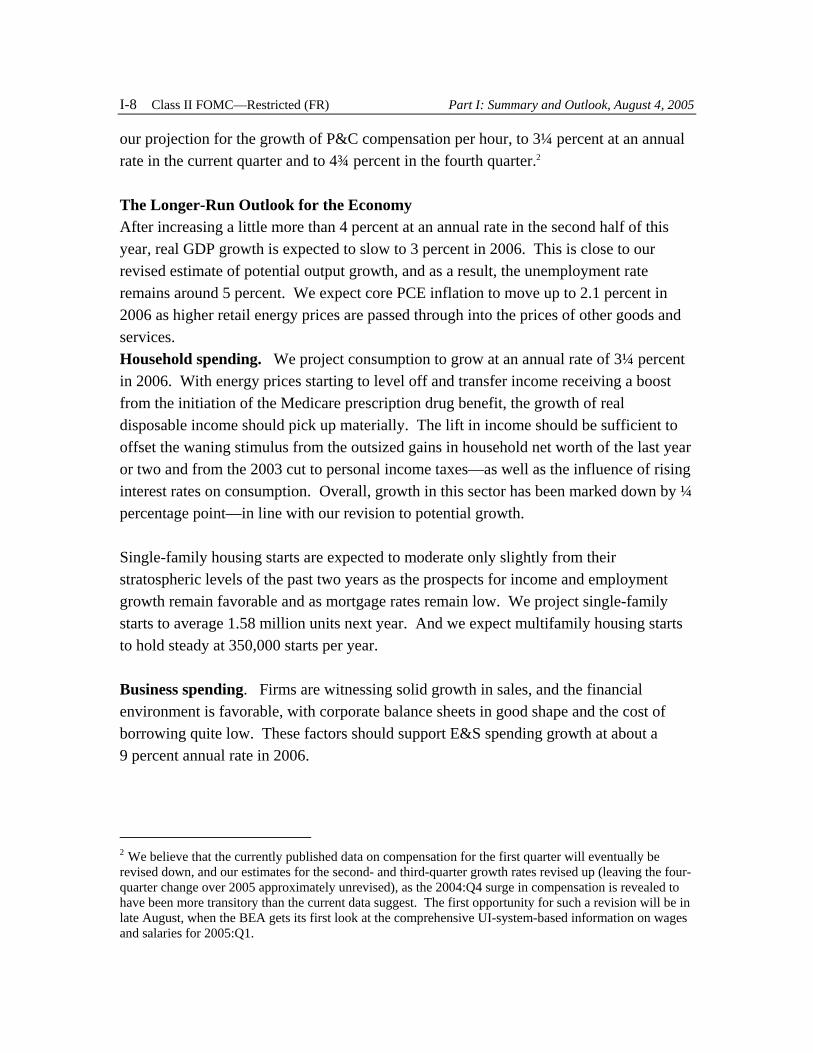
our projection for the growth of P&C compensation per hour, to 3¼ percent at an annual rate in the current quarter and to 4¾ percent in the fourth quarter.2 The Longer-Run Outlook for the Economy After increasing a little more than 4 percent at an annual rate in the second half of this year, real GDP growth is expected to slow to 3 percent in 2006. This is close to our revised estimate of potential output growth, and as a result, the unemployment rate remains around 5 percent. We expect core PCE inflation to move up to 2.1 percent in 2006 as higher retail energy prices are passed through into the prices of other goods and services. Household spending. We project consumption to grow at an annual rate of 3¼ percent in 2006. With energy prices starting to level off and transfer income receiving a boost from the initiation of the Medicare prescription drug benefit, the growth of real disposable income should pick up materially. The lift in income should be sufficient to offset the waning stimulus from the outsized gains in household net worth of the last year or two and from the 2003 cut to personal income taxes—as well as the influence of rising interest rates on consumption. Overall, growth in this sector has been marked down by ¼ percentage point—in line with our revision to potential growth. Single-family housing starts are expected to moderate only slightly from their stratospheric levels of the past two years as the prospects for income and employment growth remain favorable and as mortgage rates remain low. We project single-family starts to average 1.58 million units next year. And we expect multifamily housing starts to hold steady at 350,000 starts per year. Business spending. Firms are witnessing solid growth in sales, and the financial environment is favorable, with corporate balance sheets in good shape and the cost of borrowing quite low. These factors should support E&S spending growth at about a 9 percent annual rate in 2006.
2 We believe that the currently published data on compensation for the first quarter will eventually be revised down, and our estimates for the second- and third-quarter growth rates revised up (leaving the four-quarter change over 2005 approximately unrevised), as the 2004:Q4 surge in compensation is revealed to have been more transitory than the current data suggest. The first opportunity for such a revision will be in late August, when the BEA gets its first look at the comprehensive UI-system-based information on wages and salaries for 2005:Q1.

Domestic Developments Class II FOMC—Restricted (FR) I-9
Projections of Real GDP (Percent change at annual rate from end of
preceding period except as noted)
2005 Measure
H1 H2 2006
Real GDP 3.6 4.1 3.1 Previous 3.4 3.7 3.4
Final sales 4.6 3.2 3.2 Previous 3.8 3.7 3.4
PCE 3.6 3.4 3.3 Previous 3.3 3.4 3.6
Residential investment 9.6 .4 -.4 Previous 10.8 -1.0 .2
BFI 6.2 6.0 7.9 Previous 6.0 10.4 8.1
Government purchases 2.2 2.7 2.1 Previous .9 2.9 2.2
Exports 9.8 7.4 5.5 Previous 8.8 8.0 6.2
Imports 3.0 6.7 5.9 Previous 5.8 6.7 6.6
Contribution to growth (percentage points)
Inventory change -1.0 .9 -.1 Previous -.3 .0 .0
Net exports .5 -.3 -.4 Previous -.0 -.3 -.4
Vacancy rates in the office and industrial sectors have fallen over the past year, and, while they remain at elevated levels relative to their most recent troughs in 2000, the projected pace of business activity and payroll gains should support moderate growth in outlays for nonresidential structures. Spending on drilling and mining structures has responded robustly to the elevated prices of oil and natural gas, and we expect this response to continue through the first quarter of next year. But, in line with our

I-10 Class II FOMC—Restricted (FR) Part I: Summary and Outlook, August 4, 2005
projection of a flattening out of crude energy prices next year, we project those outlays to decelerate over the course of 2006, leveling off by the end of the year. We continue to expect that inventory-sales ratios will remain on a long-run downward trend. As a result, overall stockbuilding makes little contribution to the growth of real GDP next year. Government spending. Our projection of real federal outlays over the forecast period is in line with the Administration’s spending policies. Accordingly, real nondefense purchases are projected to hold to their recent pace of growth of just under 1 percent per year. Defense spending is projected to slow to a 2 percent rate of growth next year. As has occurred at the federal level, state and local governments have recently seen a surge in personal income tax receipts. The financial situation is improving in this sector, thereby positioning states and localities for a slightly faster pace of spending next year compared with recent experience. Net exports. The growth of real exports is projected to slow in 2006 from this year’s strong pace, to 5½ percent, as the lagged stimulus from the dollar’s decline in previous years wears off. The restraint on imports imposed by the dollar’s earlier depreciation wanes as well, so that import growth picks up to nearly 6 percent in 2006. All told, net exports are projected to restrain real GDP growth by nearly ½ percentage point next year. (These developments are discussed in more detail in the International section of the Greenbook.) Productivity and the labor market. We expect average monthly increases in payrolls of about 150,000 next year, down about 30,000 from the pace of hiring over 2005. These employment gains should be sufficient to hold the unemployment rate at 5 percent. We expect actual productivity to grow a bit more than 2 percent in 2006, about ¾ percentage point below its pace this year. With actual productivity growing a bit less than structural productivity, the gap between actual and structural productivity that opened in 2003 is projected to close by the end of next year. Wages and prices. We have raised the longer-term outlook for inflation in this Greenbook. Overall PCE prices now are forecast to increase 2.1 percent in 2006—almost ½ percentage point higher than in the June Greenbook. The bulk of this upward revision reflects the higher assumed path for energy prices in this projection. The forecast for WTI crude oil prices has been raised about $3.50 dollars per barrel next year, and as a

Domestic Developments Class II FOMC—Restricted (FR) I-11
Decomposition of Structural Labor Productivity
(Percent change, Q4 to Q4, except as noted)
Measure 1974-95
1996-2001 2002 2003 2004 2005 2006
Structural labor productivity 1.5 2.7 3.1 3.4 3.2 2.8 2.9 Previous 1.5 2.7 3.3 3.7 3.5 3.0 3.1
Contributions1 Capital deepening .7 1.4 .6 .5 .7 .8 .9 Previous .7 1.3 .6 .7 .9 1.1 1.1 Multifactor productivity .5 1.1 2.3 2.6 2.2 1.7 1.7 Previous .5 1.1 2.4 2.8 2.4 1.7 1.7 Labor composition .3 .3 .3 .3 .3 .3 .2
MEMO Potential GDP 3.0 3.3 3.2 3.3 3.0 3.0 3.1 Previous 3.0 3.4 3.4 3.6 3.5 3.2 3.4
NOTE. Components may not sum to totals because of rounding. For multiyear periods, the percent change is the annual average from Q4 of the year preceding the first year shown to Q4 of the last year shown. 1. Percentage points.
The Outlook for the Labor Market
(Percent change, Q4 to Q4, except as noted)
Measure 2003 2004 2005 2006
Output per hour, nonfarm business 5.0 2.6 2.9 2.1 Previous 5.4 2.8 2.5 2.6 Nonfarm private payroll employment -.1 1.8 1.9 1.4 Previous -.1 1.8 1.7 1.3 Household survey employment 1.2 1.3 1.7 1.1 Previous 1.2 1.3 1.4 1.2 Labor force participation rate1 66.1 66.0 66.0 66.0 Previous 66.1 66.0 66.0 66.0 Civilian unemployment rate1 5.9 5.4 5.0 5.0 Previous 5.9 5.4 5.1 5.1 MEMO GDP gap2 1.6 .9 .1 .1 Previous 1.4 1.1 .7 .7
1. Percent, average for the fourth quarter 2. Percent difference between potential and actual GDP in the fourth quarter of the year indicated. A positive number indicates that the economy is operating below potential.

I-12 Class II FOMC—Restricted (FR) Part I: Summary and Outlook, August 4, 2005
result, we now expect consumer energy prices to rise 1¾ percent in 2006—an upward revision of more than 3 percentage points. These higher retail prices of energy raise the cost of doing business and are expected to be passed through to the prices of other goods and services. As far as the market-based measure of core PCE prices is concerned, these higher costs offset the otherwise favorable incoming data on prices, leaving our projection unchanged, on balance, at 1.9 percent. However, we have boosted our projection for the nonmarket component of core PCE prices to reflect the post-NIPA-revision trends in these prices. This contributes an additional 0.2 percentage point to core PCE inflation, raising the projection to 2.1 percent in 2006. Looking beyond our present forecast horizon, crude oil prices are projected to decline a bit further in 2007, and as the indirect energy price effects wane, we would expect core PCE inflation to edge down to 2 percent in 2007. Our projection for the increase in the P&C measure of hourly compensation in 2006 is largely unchanged since the June Greenbook. This measure of hourly compensation is projected to rise a little more rapidly next year than this, mostly because this year’s gain is held down by the reversal of the burst of compensation gains in 2004:Q4. In contrast, and as noted earlier, we have revised down sharply our projection for the increase in the ECI to 4 percent in 2006, about ¾ percentage point below the previous projection. We still are puzzled by the low readings of the past few quarters, and our forecast of an acceleration next year reflects an expectation that the ECI will come back into more normal alignment with its fundamentals. Financial Flows and Conditions After having increased at an 8 percent pace over the first half of this year, domestic nonfinancial debt is expected to decelerate to 6¾ percent in the second half and to 6¼ percent in 2006. Increases in the debt of households, state and local governments, and the federal government are projected to step down noticeably beginning in the second half of 2005, while the debt of nonfinancial businesses continues to rise at its recent, moderate pace. Nonfinancial corporations remain flush with cash, and we expect them to be able to accommodate rising capital expenditures with only a moderate pickup in borrowing. After a notable turnaround in 2004, commercial paper and bank loans are forecast to continue to expand steadily, while net bond issuance is projected to pick up noticeably next year. By contrast, commercial mortgage growth is forecast to slow from its recent

Domestic Developments Class II FOMC—Restricted (FR) I-13
Inflation Projections (Percent change, Q4 to Q4, except as noted)
Measure 2003 2004 2005 2006
PCE chain-weighted price index 1.7 3.1 2.6 2.1 Previous 1.7 2.6 2.5 1.7
Food and beverages 2.7 2.9 1.9 2.3 Previous 2.7 2.9 2.2 2.2
Energy 7.2 17.9 12.4 1.8 Previous 7.2 18.5 9.9 -1.4
Excluding food and energy 1.3 2.2 2.0 2.1 Previous 1.2 1.6 2.1 1.9
Consumer price index 1.9 3.4 3.0 2.2 Previous 1.9 3.4 2.9 2.0
Excluding food and energy 1.2 2.1 2.3 2.3 Previous 1.2 2.1 2.4 2.3
GDP chain-weighted price index 2.0 2.9 2.3 2.1 Previous 1.7 2.4 2.3 1.9
ECI for compensation of private industry workers1 4.0 3.8 3.1 4.0 Previous 4.0 3.8 4.0 4.8
NFB compensation per hour 5.0 5.9 4.6 5.2 Previous 5.3 5.9 4.0 5.0
Prices of core nonfuel imports 1.6 3.7 2.5 .7 Previous 1.6 3.7 2.6 .5
1. December to December. torrid pace. All told, we expect nonfinancial corporate debt to rise about 5¾ percent this year and next. We continue to predict that household debt growth will slow from its double-digit pace in 2004, to 8½ percent in 2005 and 6½ percent in 2006. This deceleration is driven mainly by a step-down in residential mortgage borrowing, to slightly less than 10 percent in 2005 and 7 percent in 2006, that reflects our forecast for slowing gains in house prices. We forecast consumer credit growth to be about 4¼ percent in 2005 and about 4½ percent in 2006, an acceleration roughly in line with that of expenditures on consumer durables. We have trimmed our forecast of federal borrowing in response to higher-than-expected tax receipts. We now expect federal debt to increase 7¼ percent this year and 7½ percent

I-14 Class II FOMC—Restricted (FR) Part I: Summary and Outlook, August 4, 2005
in 2006. State and local government debt is expected to grow about 8 percent this year and 4 percent next year, as opportunities for advance refunding wane in the coming quarters. After having expanded 5¼ percent in 2004, M2 is expected to increase about 2¼ percent in 2005 and 3½ percent in 2006. Rising opportunity costs associated with increasing interest rates should hold money growth below nominal income growth over the forecast period. Alternative Simulations In this section, we consider four risks to the baseline forecast using simulations of the FRB/US model. The first scenario explores the possibility that the underlying strength in the economy may be greater than it is in our baseline forecast. By contrast, the second scenario considers whether the recent softness in inventory investment may be a harbinger of a broader retrenching in business spending. The next two scenarios consider the chance that we have misgauged how much slack now remains in the economy—either that there is considerably more room to grow or, alternatively, that the unemployment rate is now well below its long-run sustainable level. We first evaluate each of these four risks under the assumption that the federal funds rate is held at its baseline path, and then we consider how their economic implications would differ if monetary policy were to respond to the change in the outlook along the lines suggested by the Taylor rule.3 Stronger demand. In this scenario, E&S outlays accelerate to a 14 percent annual rate by 2006 under the baseline monetary policy, a rate similar to last year’s pace and 5 percentage points above baseline. In addition, the saving rate rises only slightly in this scenario and is 1 percentage point below baseline by the end of 2006. Finally, residential investment grows at a 5 percent pace through next year rather than leveling off as in the baseline. Under these conditions, real GDP rises at an average annual rate of a bit more than 5 percent over the second half of this year and 4½ percent next year, bringing the unemployment rate down to 4¼ percent by late 2006. The resultant tightening in labor and product markets boosts inflation a touch next year and, in the absence of a monetary response, would lead to further upward pressure in 2007. To head off such an event, policy might respond along the lines suggested by the Taylor rule, which would prescribe gradually increasing the funds rate to almost 5½ percent by late 2006. Under this
3 Specifically, in the Taylor-rule scenarios, the federal funds rate is assumed to rise 1 percentage point
relative to baseline for each percentage point deviation of the output gap from baseline, and 1½ percentage points for each percentage point deviation of core PCE inflation from baseline.

Domestic Developments Class II FOMC—Restricted (FR) I-15
Alternative Scenarios (Percent change, annual rate, from end of preceding period,
except as noted)
2005 Measure and scenario
H1 H2 2006
Real GDP Baseline 3.6 4.1 3.1 Stronger demand 3.6 5.2 4.5 With monetary policy response 3.6 5.1 4.1 Weak business demand 3.6 3.0 2.5 With monetary policy response 3.6 3.1 2.8 More room to grow 3.6 4.3 3.3 With monetary policy response 3.6 4.3 3.3 Less room to grow 3.6 3.7 3.0 With monetary policy response 3.6 3.7 3.0
Civilian unemployment rate1
Baseline 5.1 5.0 5.0 Stronger demand 5.1 4.8 4.2 With monetary policy response 5.1 4.8 4.4 Weak business demand 5.1 5.2 5.5 With monetary policy response 5.1 5.2 5.3 More room to grow 5.1 5.0 4.9 With monetary policy response 5.1 5.0 4.9 Less room to grow 5.1 5.1 5.2 With monetary policy response 5.1 5.1 5.2
PCE prices excluding food and energy Baseline 2.1 2.0 2.1 Stronger demand 2.1 2.0 2.2 With monetary policy response 2.1 2.0 2.1 Weak business demand 2.1 2.0 2.0 With monetary policy response 2.1 2.0 2.1 More room to grow 2.1 1.9 1.9 With monetary policy response 2.1 1.9 1.9 Less room to grow 2.1 2.2 2.5 With monetary policy response 2.1 2.2 2.5
1. Average for the final quarter of the period. strategy, the increment to GDP growth next year would be somewhat smaller and the fall in the unemployment rate less pronounced, with the result that inflation would be close to baseline in 2007 (not shown).

I-16 Class II FOMC—Restricted (FR) Part I: Summary and Outlook, August 4, 2005
Weak business demand. Non-motor-vehicle inventory investment slowed significantly in the second quarter. In the baseline forecast, we assume that firms are comfortable with the resulting ratio of inventories to sales and, going forward, the ratio moves down about in line with its longer-term trend. In this scenario, we instead assume that desired and actual inventory-sales ratios fall faster over coming quarters. We also assume that other business outlays are damped: Spending on equipment and software continues its recent deceleration, and nonresidential construction is assumed to be about flat over the next year and a half rather than rising moderately as in the baseline. If the federal funds rate remained on its baseline path, the growth rate of real GDP would slip to 3 percent in the second half of this year and 2½ percent in 2006. As a result, the unemployment rate would move up to 5½ percent by the end of next year, and inflation would be slightly below its baseline pace. Conditions would be less weak under the responsive monetary policy: Because the funds rate would rise to only 3¾ percent by late next year, real GDP would grow a bit faster next year and the unemployment rate would stay close to 5¼ percent. More room to grow. We could be wrong in our assessment that the economy is currently close to potential, given the inherent imprecision of such estimates. Taking a cue from the recent surprisingly small increases in the ECI, in this scenario we assume that the NAIRU is 4¼ percent, which is ¾ percentage point (or roughly one standard error) below the staff estimate. Such an assumption would imply that considerable slack remains at present; as a result, inflation would move below 2 percent next year. If the nominal funds rate followed its baseline path, such a movement in prices would imply slightly higher real interest rates relative to the baseline assumptions. Nonetheless, real economic activity would be somewhat stronger than in the staff projection because the lower NAIRU would imply higher long-run levels of household income and corporate earnings, which in turn would boost projected consumption and investment spending. That the NAIRU was different than in the baseline would be difficult to discern for some time. In its implementation of the Taylor rule, we have assumed that the Committee, like the staff, misjudges the NAIRU to be 5 percent. As a result, the federal funds rate would differ little from its baseline path even under the responsive monetary policy because the downward pressure on the funds rate from lower inflation would be offset by the false impression that resource utilization was rising relative to baseline. Hence, outcomes for real activity and inflation would be similar to those under the baseline policy.

Domestic Developments Class II FOMC—Restricted (FR) I-17
Less room to grow. In contrast to the previous scenario, here we assume that labor and product markets are now tighter than the staff estimates, with the NAIRU equal to 5¾ percent. By itself, this assumption would yield inflation effects symmetric to those just discussed. But in addition to a higher NAIRU, we also assume that inflation expectations are less well anchored than in the baseline, causing the tighter labor market conditions in this scenario to produce a more substantial change in both expected and actual inflation. For this reason, core PCE price inflation moves up to 2½ percent next year. If the nominal funds rate were held unchanged at the baseline path, real GDP would rise only a bit more slowly than in the baseline despite the less-favorable supply-side conditions, largely because the higher inflation would push down real interest rates. If the Committee and the staff misjudged the NAIRU to be 5 percent, then even under a responsive policy, the funds rate would differ only slightly from the baseline, as the upward pressure on the funds rate from elevated inflation would be largely offset by the false perception that output is below its potential level. In this case, little progress would be made in bringing output and unemployment into better alignment with their equilibrium levels.

I-18 Class II FOMC—Restricted (FR) Part I: Summary and Outlook, August 4, 2005
Selected Greenbook Projections and 70 Percent Confidence Intervals Derived from
Historical Forecast Errors and FRB/US Simulations
Measure 2005 2006
Real GDP (percent change, Q4 to Q4) Projection 3.9 3.1 Confidence interval Greenbook forecast errors1 2.9–4.8 1.1–5.0 FRB/US stochastic simulations 2.9–4.8 1.5–4.9
Civilian unemployment rate (percent, Q4)
Projection 5.0 5.0 Confidence interval Greenbook forecast errors1 4.7–5.3 4.2–5.8 FRB/US stochastic simulations 4.6–5.4 4.1–5.8
PCE prices excluding food and energy (percent change, Q4 to Q4) Projection 2.0 2.1 Confidence interval Greenbook forecast errors2 1.7–2.3 1.4–2.8 FRB/US stochastic simulations 1.7–2.4 1.3–2.9
NOTE. Shocks underlying stochastic simulations are randomly drawn from the 1978–2004 set of model equation residuals. 1. 1978–2004. 2. 1981–2004.

Class II FOMC - Restricted (FR)
Forecast Confidence Intervals and Alternative Scenarios
Confidence Intervals Based on FRB/US Stochastic Simulations;
Greenbook baseline
Stronger demand
Weak business demand
More room to grow
Less room to grow
2003 2004 2005 2006
0.5
1.0
1.5
2.0
2.5
3.0
3.5
0.5
1.0
1.5
2.0
2.5
3.0
3.54-quarter percent change
PCE Prices excluding Food and Energy
2003 2004 2005 2006
0
1
2
3
4
5
6
7
0
1
2
3
4
5
6
74-quarter percent change
90 percent interval
70 percent interval
Real GDP
2003 2004 2005 2006
3.0
3.5
4.0
4.5
5.0
5.5
6.0
6.5
7.0
3.0
3.5
4.0
4.5
5.0
5.5
6.0
6.5
7.0Percent
Unemployment Rate
Scenarios Assume Baseline Federal Funds Rate
I-19

I-20
Class II FOMC August 4, 2005Restricted (FR)
STAFF PROJECTIONS OF CHANGES IN GDP, PRICES, AND UNEMPLOYMENT(Percent, annual rate)
Core PCE Unemployment Nominal GDP Real GDP PCE price index price index rate1
Interval 6/22/05 8/4/05 6/22/05 8/4/05 6/22/05 8/4/05 6/22/05 8/4/05 6/22/05 8/4/05
ANNUAL______
2002 3.5 3.4 1.9 1.6 1.4 1.4 1.8 1.8 5.8 5.82003 4.9 4.8 3.0 2.7 1.9 1.9 1.3 1.3 6.0 6.02004 6.6 7.0 4.4 4.2 2.2 2.6 1.5 2.0 5.5 5.52005 6.1 6.2 3.7 3.7 2.5 2.6 1.9 2.1 5.2 5.12006 5.5 5.6 3.5 3.4 2.0 2.3 1.9 2.0 5.1 5.0
QUARTERLY_________
2003 Q1 4.9 4.8 1.9 1.7 3.2 3.0 1.5 1.1 5.8 5.8 Q2 5.3 4.8 4.1 3.7 0.7 0.6 1.1 1.0 6.1 6.1 Q3 8.8 9.3 7.4 7.2 1.6 2.0 0.9 1.5 6.1 6.1 Q4 5.7 5.5 4.2 3.6 1.2 1.3 1.3 1.4 5.9 5.9
2004 Q1 7.4 8.1 4.5 4.3 3.3 3.9 2.1 2.7 5.6 5.6 Q2 6.6 7.5 3.3 3.5 3.1 3.8 1.7 2.5 5.6 5.6 Q3 5.5 5.3 4.0 4.0 1.3 1.5 0.9 1.5 5.5 5.5 Q4 6.2 6.1 3.8 3.3 2.7 3.1 1.7 2.3 5.4 5.4
2005 Q1 7.1 7.0 3.9 3.8 2.1 2.3 2.2 2.4 5.3 5.3 Q2 5.6 5.9 3.0 3.3 3.7 3.3 2.2 1.8 5.1 5.1 Q3 5.4 5.9 3.8 4.3 2.4 2.2 2.1 1.9 5.1 5.0 Q4 5.6 6.1 3.7 4.0 2.0 2.5 2.0 2.1 5.1 5.0
2006 Q1 5.8 5.5 3.5 3.0 1.8 2.3 1.9 2.1 5.1 5.0 Q2 5.3 5.2 3.4 3.1 1.7 2.1 1.9 2.1 5.1 5.0 Q3 5.3 5.2 3.4 3.1 1.7 2.0 1.8 2.1 5.1 5.0 Q4 5.2 5.2 3.3 3.1 1.7 2.0 1.8 2.1 5.1 5.0
TWO-QUARTER2___________
2003 Q2 5.1 4.8 3.0 2.7 2.0 1.8 1.3 1.1 0.2 0.2 Q4 7.2 7.3 5.8 5.4 1.4 1.6 1.1 1.5 -0.2 -0.2
2004 Q2 7.0 7.8 3.9 3.9 3.2 3.8 1.9 2.6 -0.3 -0.3 Q4 5.9 5.7 3.9 3.6 2.0 2.3 1.3 1.9 -0.2 -0.2
2005 Q2 6.4 6.4 3.4 3.6 2.9 2.8 2.2 2.1 -0.3 -0.3 Q4 5.5 6.0 3.7 4.1 2.2 2.3 2.0 2.0 0.0 -0.1
2006 Q2 5.5 5.4 3.5 3.1 1.8 2.2 1.9 2.1 0.0 0.0 Q4 5.2 5.2 3.3 3.1 1.7 2.0 1.8 2.1 0.0 0.0
FOUR-QUARTER3____________
2002 Q4 3.8 3.6 2.3 1.9 1.8 1.8 1.5 1.6 0.4 0.42003 Q4 6.2 6.1 4.4 4.0 1.7 1.7 1.2 1.3 0.0 0.02004 Q4 6.4 6.8 3.9 3.8 2.6 3.1 1.6 2.2 -0.5 -0.52005 Q4 5.9 6.2 3.6 3.9 2.5 2.6 2.1 2.0 -0.3 -0.42006 Q4 5.4 5.3 3.4 3.1 1.7 2.1 1.9 2.1 -0.0 -0.0
1. Level, except as noted. 2. Percent change from two quarters earlier; for unemployment rate, change in percentage points. 3. Percent change from four quarters earlier; for unemployment rate, change in percentage points.

I-21
Class II FOMC August 4, 2005Restricted (FR) REAL GROSS DOMESTIC PRODUCT AND RELATED ITEMS, ANNUAL VALUES
(Seasonally adjusted annual rate)
- - - Projected - - -
Item Units1 1998 1999 2000 2001 2002 2003 2004 2005 2006
Expenditures____________
Nominal GDP Bill. $ 8747.0 9268.4 9817.0 10128.0 10469.6 10971.2 11734.3 12467.4 13161.8Real GDP Bill. Ch. $ 9066.9 9470.3 9817.0 9890.7 10048.8 10320.6 10755.7 11153.6 11533.4
Real GDP % change 4.5 4.7 2.2 0.2 1.9 4.0 3.8 3.9 3.1Gross domestic purchases 5.5 5.5 3.0 0.4 2.7 4.0 4.5 3.6 3.3Final sales 4.8 4.2 2.9 1.5 0.8 4.0 3.6 3.9 3.2Priv. dom. final purchases 6.4 5.3 4.3 1.0 1.1 4.4 4.8 3.9 3.6
Personal cons. expenditures 5.4 4.9 4.1 2.8 1.9 3.8 3.8 3.5 3.3 Durables 14.4 7.3 4.7 10.8 1.2 9.2 5.2 5.7 6.9 Nondurables 4.7 4.9 3.0 1.9 2.1 4.1 4.6 4.3 3.8 Services 3.8 4.4 4.5 1.6 1.9 2.5 3.1 2.6 2.3
Business fixed investment 10.9 7.7 7.8 -9.6 -6.5 5.6 10.9 6.1 7.9 Equipment & Software 13.5 10.8 7.5 -9.0 -3.4 7.2 13.8 7.2 9.0 Nonres. structures 4.0 -0.9 8.8 -11.1 -14.9 1.2 2.7 2.7 4.8Residential structures 10.3 3.6 -1.9 1.4 7.0 11.8 6.6 4.9 -0.4
Exports 2.6 5.6 6.5 -11.9 3.8 6.0 6.1 8.6 5.5Imports 11.0 12.1 11.2 -7.6 9.7 5.1 10.6 4.9 5.9
Gov’t. cons. & investment 3.3 4.2 0.4 5.0 4.0 1.9 2.1 2.5 2.1 Federal 0.1 4.2 -2.2 6.4 7.8 5.5 4.2 3.2 1.6 Defense -1.2 4.3 -3.5 6.5 8.4 7.5 4.9 3.7 1.9 State & local 5.1 4.2 1.7 4.2 2.1 0.0 0.9 2.0 2.4
Change in bus. inventories Bill. Ch. $ 72.6 68.9 56.5 -31.7 12.5 15.5 52.0 21.8 33.1 Nonfarm 71.2 71.5 57.8 -31.8 15.2 15.5 49.9 25.8 31.5Net exports -203.7 -296.2 -379.5 -399.1 -471.3 -521.4 -601.3 -620.2 -645.8
Nominal GDP % change 5.7 6.3 4.6 2.7 3.6 6.1 6.8 6.2 5.3GDP Gap2 % -1.5 -2.4 -2.5 0.1 1.6 2.1 1.1 0.4 0.1
Employment and Production_________________________
Nonfarm payroll employment Millions 125.9 129.0 131.8 131.8 130.3 130.0 131.5 133.7 135.7Unemployment rate % 4.5 4.2 4.0 4.7 5.8 6.0 5.5 5.1 5.0
Industrial prod. index % change 4.2 5.2 1.9 -5.1 1.5 1.2 4.3 4.4 3.4Capacity util. rate - mfg. % 81.8 81.1 80.6 74.5 73.5 73.7 76.7 78.7 80.4
Housing starts Millions 1.62 1.64 1.57 1.60 1.70 1.85 1.96 2.02 1.93Light motor vehicle sales 15.56 16.91 17.35 17.13 16.75 16.63 16.81 16.97 17.21 North Amer. produced 13.52 14.41 14.48 14.05 13.46 13.32 13.43 13.54 13.71 Other 2.04 2.50 2.87 3.08 3.28 3.31 3.38 3.44 3.50
Income and Saving_________________
Nominal GNP Bill. $ 8768.3 9302.2 9855.9 10171.6 10500.2 11039.3 11788.0 12491.9 13140.2Nominal GNP % change 5.5 6.5 4.7 2.9 3.3 6.5 6.2 5.9 4.9Nominal personal income 7.0 5.5 7.1 2.2 1.9 4.5 7.5 5.0 7.0Real disposable income 5.6 2.8 4.4 1.2 2.9 3.8 4.1 1.3 4.7Personal saving rate % 4.3 2.4 2.3 1.8 2.4 2.1 1.8 0.2 1.0
Corp. profits, IVA & CCAdj. % change -10.0 9.6 -8.6 -0.2 20.6 16.4 9.6 11.5 -3.0 Profit share of GNP % 9.1 9.2 8.3 7.5 8.4 9.3 9.9 10.6 10.1 Excluding FR Banks 8.9 8.9 8.0 7.3 8.2 9.2 9.7 10.5 10.0
Federal surpl./deficit Bill. $ 38.8 103.6 189.5 46.7 -247.9 -382.7 -406.5 -303.2 -355.2State & local surpl./def. 52.0 50.4 50.0 4.8 -34.2 -23.8 -5.9 11.2 20.8 Ex. social ins. funds 50.3 48.7 47.9 2.2 -35.9 -25.1 -7.7 10.4 19.8
Gross natl. saving rate % 18.2 18.0 18.0 16.3 14.2 13.4 13.3 13.1 12.9Net natl. saving rate 7.4 6.9 6.7 4.2 2.1 1.5 1.3 1.8 1.7
Prices and Costs________________
GDP chn.-wt. price index % change 1.1 1.6 2.2 2.4 1.7 2.0 2.9 2.3 2.1Gross Domestic Purchases chn.-wt. price index 0.7 2.0 2.4 1.6 1.9 2.0 3.4 2.7 2.0PCE chn.-wt. price index 0.9 2.1 2.3 1.7 1.8 1.7 3.1 2.6 2.1 Ex. food and energy 1.4 1.6 1.5 2.2 1.6 1.3 2.2 2.0 2.1
CPI 1.5 2.6 3.4 1.8 2.2 1.9 3.4 3.0 2.2 Ex. food and energy 2.3 2.0 2.6 2.7 2.1 1.2 2.1 2.3 2.3
ECI, hourly compensation3 3.5 3.4 4.4 4.2 3.2 4.0 3.8 3.1 4.0Nonfarm business sector Output per hour 2.7 3.5 2.0 3.2 2.8 5.0 2.6 2.9 2.1 Compensation per Hour 5.5 5.2 6.3 3.6 3.1 5.0 5.9 4.6 5.2 Unit labor cost 2.7 1.6 4.2 0.3 0.2 0.0 3.2 1.6 3.1
1. Changes are from fourth quarter to fourth quarter. 2. Percent difference between potential and actual. A positive number indicates that the economy is operating below potential. 3. Private-industry workers.

I-22
Class II FOMC August 4, 2005Restricted (FR) REAL GROSS DOMESTIC PRODUCT AND RELATED ITEMS, QUARTERLY VALUES
(Seasonally adjusted, annual rate except as noted)
2002 2002 2002 2002 2003 2003 2003 2003 2004 2004Item Units Q1 Q2 Q3 Q4 Q1 Q2 Q3 Q4 Q1 Q2
Expenditures____________
Nominal GDP Bill. $ 10333.3 10426.6 10527.4 10591.1 10717.0 10844.6 11087.4 11236.0 11457.1 11666.1Real GDP Bill. Ch. $ 9977.3 10031.6 10090.7 10095.8 10138.6 10230.4 10410.9 10502.6 10612.5 10704.1
Real GDP % change 2.7 2.2 2.4 0.2 1.7 3.7 7.2 3.6 4.3 3.5Gross domestic purchases 3.6 2.7 2.8 1.7 1.5 4.2 6.5 3.9 5.2 4.7Final sales -0.2 1.7 1.4 0.1 1.9 4.6 6.9 2.8 3.8 2.6Priv. dom. final purchases -0.0 1.7 1.7 0.9 2.2 4.5 7.4 3.7 5.1 4.2
Personal cons. expenditures 1.4 2.4 2.3 1.4 2.5 3.6 5.8 3.1 4.7 1.9 Durables -4.2 3.6 11.5 -5.2 3.6 15.1 19.8 -0.3 4.4 0.4 Nondurables 3.3 1.3 0.3 3.6 3.2 1.9 8.3 3.1 6.6 2.6 Services 1.8 2.6 1.3 1.8 1.9 2.3 2.0 3.8 3.8 1.8
Business fixed investment -12.8 -6.1 -2.0 -5.0 -1.1 8.4 11.2 4.4 7.9 13.5 Equipment & Software -10.4 -0.9 3.3 -4.9 1.6 6.7 15.4 5.5 12.0 15.2 Nonres. structures -19.0 -19.0 -15.5 -5.3 -8.4 13.3 -0.1 1.3 -3.5 8.8Residential structures 10.4 9.5 2.0 6.4 4.7 9.6 21.9 11.5 5.2 17.8
Exports 5.2 10.6 2.9 -3.1 -2.9 -2.1 11.5 19.1 5.0 6.9Imports 11.7 12.5 5.7 9.0 -2.5 3.3 4.1 16.5 12.0 14.5
Gov’t. cons. & investment 4.3 4.8 2.3 4.8 -0.3 7.2 0.5 0.5 3.3 2.3 Federal 5.9 12.5 3.0 10.2 0.3 22.1 -2.0 3.1 10.7 3.2 Defense 3.7 11.5 4.1 14.8 -3.6 37.4 -6.5 7.9 13.8 0.8 State & local 3.5 1.0 1.9 2.0 -0.6 -0.3 2.0 -0.9 -0.7 1.8
Change in bus. inventories Bill. Ch. $ -10.2 2.6 28.0 29.5 24.0 -0.4 9.3 29.0 41.9 65.6 Nonfarm -11.1 12.4 29.3 29.9 19.7 1.0 13.0 28.1 46.8 58.5Net exports -441.3 -458.9 -472.2 -513.0 -510.7 -528.4 -516.2 -530.2 -563.0 -601.7
Nominal GDP % change 4.3 3.7 3.9 2.4 4.8 4.8 9.3 5.5 8.1 7.5GDP Gap1 % 1.2 1.4 1.6 2.3 2.7 2.6 1.7 1.6 1.3 1.2
Employment and Production_________________________
Nonfarm payroll employment Millions 130.5 130.3 130.3 130.3 130.1 129.8 129.9 130.2 130.5 131.3Unemployment rate % 5.7 5.8 5.7 5.9 5.8 6.1 6.1 5.9 5.6 5.6
Industrial prod. index % change 2.3 4.4 1.7 -2.3 -0.7 -4.0 4.1 5.7 5.6 4.3Capacity util. rate - mfg. % 73.0 73.6 74.0 73.5 73.5 73.0 73.7 74.8 75.6 76.5
Housing starts Millions 1.72 1.68 1.70 1.74 1.74 1.75 1.89 2.04 1.93 1.92Light motor vehicle sales 16.60 16.53 17.35 16.51 16.13 16.43 17.22 16.74 16.58 16.57 North Amer. produced 13.28 13.32 14.00 13.26 12.75 13.15 13.84 13.55 13.31 13.19 Other 3.33 3.21 3.35 3.25 3.38 3.28 3.37 3.19 3.28 3.38
Income and Saving_________________
Nominal GNP Bill. $ 10359.5 10443.3 10557.0 10641.1 10761.9 10911.4 11154.8 11329.2 11540.1 11712.8Nominal GNP % change 2.3 3.3 4.4 3.2 4.6 5.7 9.2 6.4 7.7 6.1Nominal personal income 2.8 3.6 0.2 1.4 4.0 4.7 4.3 5.0 6.9 5.6Real disposable income 11.6 1.9 -1.6 0.2 2.5 4.5 7.2 1.0 3.6 1.2Personal saving rate % 2.9 2.8 2.0 1.8 1.9 2.1 2.5 2.0 1.8 1.6
Corp. profits, IVA & CCAdj. % change 19.7 17.9 15.2 30.0 -1.9 24.5 22.6 22.8 12.9 5.2 Profit share of GNP % 8.0 8.3 8.5 9.0 8.8 9.2 9.5 9.8 9.9 9.9 Excluding FR Banks 7.8 8.0 8.3 8.8 8.6 9.0 9.3 9.7 9.8 9.8
Federal surpl./deficit Bill. $ -208.5 -241.4 -247.3 -294.6 -296.0 -373.8 -456.2 -405.0 -429.3 -413.4State & local surpl./def. -35.3 -35.1 -31.4 -34.9 -67.8 -26.1 -13.8 12.5 -6.5 -1.6 Ex. social ins. funds -37.4 -36.9 -33.0 -36.2 -69.0 -27.3 -15.0 11.0 -8.3 -3.6
Gross natl. saving rate % 14.8 14.5 13.8 13.6 13.1 13.4 13.2 13.7 13.3 13.2Net natl. saving rate 2.8 2.5 1.8 1.5 1.1 1.4 1.4 2.0 1.6 1.5
Prices and Costs________________
GDP chn.-wt. price index % change 1.7 1.5 1.6 2.2 3.1 1.1 1.8 1.9 3.6 3.9Gross Domestic Purchases chn.-wt. price index 1.5 2.5 1.7 2.2 4.1 0.4 2.0 1.7 4.2 4.1PCE chn.-wt. price index 0.9 2.8 1.8 1.7 3.0 0.6 2.0 1.3 3.9 3.8 Ex. food and energy 1.3 1.8 1.9 1.2 1.1 1.0 1.5 1.4 2.7 2.5
CPI 1.6 3.2 2.0 2.2 4.0 0.4 2.2 0.9 4.0 4.4 Ex. food and energy 2.4 2.1 2.1 1.7 1.3 0.8 1.7 1.0 1.9 2.5
ECI, hourly compensation2 3.3 4.4 2.5 3.3 5.5 3.4 4.4 3.4 4.6 3.8Nonfarm business sector Output per hour 6.5 0.8 4.0 0.2 3.1 6.6 9.6 0.8 2.2 4.6 Compensation per hour 6.1 4.2 1.7 0.4 5.7 6.4 5.2 2.8 3.6 3.8 Unit labor cost -0.4 3.4 -2.2 0.3 2.5 -0.2 -4.1 1.9 1.3 -0.8
1. Percent difference between potential and actual. A positive number indicates that the economy is operating below potential. 2. Private-industry workers.

I-23
Class II FOMC August 4, 2005Restricted (FR) REAL GROSS DOMESTIC PRODUCT AND RELATED ITEMS, QUARTERLY VALUES
(Seasonally adjusted, annual rate except as noted)
- - - - - - - - - - - Projected - - - - - - - - - - - - - - -
2004 2004 2005 2005 2005 2005 2006 2006 2006 2006Item Units Q3 Q4 Q1 Q2 Q3 Q4 Q1 Q2 Q3 Q4
EXPENDITURES____________
Nominal GDP Bill. $ 11818.8 11995.2 12198.8 12374.8 12554.6 12741.4 12912.7 13078.0 13244.3 13412.2Real GDP Bill. Ch. $ 10808.9 10897.1 10999.3 11090.0 11207.8 11317.3 11401.5 11489.2 11577.3 11665.5
Real GDP % change 4.0 3.3 3.8 3.3 4.3 4.0 3.0 3.1 3.1 3.1Gross domestic purchases 3.9 4.1 4.0 1.9 4.3 4.3 3.4 2.9 3.1 3.6Final sales 4.6 3.3 3.5 5.8 4.5 1.9 3.3 3.5 3.2 2.6Priv. dom. final purchases 5.1 4.9 4.1 4.4 4.7 2.3 4.0 3.6 3.5 3.4
Personal cons. expenditures 4.4 4.3 3.5 3.6 4.6 2.1 3.7 3.2 3.2 3.2 Durables 10.8 5.5 2.6 11.3 13.6 -3.9 9.9 5.7 5.9 6.2 Nondurables 3.9 5.5 5.3 3.3 4.4 4.1 3.9 3.8 3.8 3.8 Services 3.4 3.6 2.8 2.3 2.9 2.4 2.4 2.4 2.3 2.3
Business fixed investment 11.8 10.4 5.7 6.7 5.9 6.1 10.8 7.7 7.1 6.1 Equipment & Software 15.5 12.4 8.3 8.0 6.3 6.2 12.4 8.1 8.4 7.3 Nonres. structures 1.4 4.7 -2.0 2.6 4.5 5.8 6.1 6.7 3.6 2.9Residential structures 2.6 1.6 9.5 9.7 3.2 -2.4 -3.8 0.8 0.6 0.9
Exports 5.5 7.1 7.5 12.3 6.9 7.9 4.7 5.6 5.4 6.4Imports 4.7 11.3 7.4 -1.2 5.0 8.6 6.8 3.6 4.7 8.4
Gov’t. cons. & investment 1.8 0.9 1.9 2.5 3.1 2.4 2.4 2.2 2.0 1.9 Federal 3.6 -0.6 2.4 1.3 6.3 2.8 2.5 1.8 1.2 1.1 Defense 9.0 -3.3 3.0 2.0 6.4 3.4 2.8 2.2 1.4 1.1 State & local 0.8 1.8 1.6 3.2 1.2 2.2 2.3 2.4 2.4 2.4
Change in bus. inventories Bill. Ch. $ 50.4 50.1 58.2 -5.6 -11.7 46.5 39.1 28.2 25.8 39.5 Nonfarm 43.7 50.8 61.8 -1.3 -6.3 49.2 38.1 26.2 23.8 37.7Net exports -606.5 -634.1 -645.4 -605.7 -607.6 -622.1 -638.7 -638.2 -643.3 -662.8
Nominal GDP % change 5.3 6.1 7.0 5.9 5.9 6.1 5.5 5.2 5.2 5.2GDP Gap1 % 1.0 0.9 0.7 0.6 0.3 0.1 0.1 0.1 0.1 0.1
EMPLOYMENT AND PRODUCTION_________________________
Nonfarm payroll employment Millions 131.7 132.3 132.8 133.4 133.9 134.5 135.0 135.5 135.9 136.3Unemployment rate % 5.5 5.4 5.3 5.1 5.0 5.0 5.0 5.0 5.0 5.0
Industrial prod. index % change 2.7 4.5 3.6 2.1 6.3 5.6 3.3 3.4 3.6 3.3Capacity util. rate - mfg. % 77.0 77.6 78.1 78.2 78.9 79.7 80.0 80.2 80.5 80.7
Housing starts Millions 1.97 1.97 2.08 2.01 2.01 1.98 1.95 1.94 1.93 1.91Light motor vehicle sales 17.01 17.09 16.50 17.21 17.67 16.51 17.19 17.20 17.22 17.24 North Amer. produced 13.71 13.51 13.16 13.72 14.18 13.08 13.69 13.70 13.72 13.74 Other 3.30 3.58 3.34 3.49 3.48 3.43 3.50 3.50 3.50 3.50
INCOME AND SAVING_________________
Nominal GNP Bill. $ 11867.3 12032.0 12238.2 12406.8 12576.8 12745.9 12909.1 13064.2 13217.1 13370.5Nominal GNP % change 5.4 5.7 7.0 5.6 5.6 5.5 5.2 4.9 4.8 4.7Nominal personal income 4.9 12.7 2.6 5.8 5.3 6.5 8.0 7.4 6.3 6.3Real disposable income 2.8 9.1 -2.9 1.4 3.0 3.7 5.2 5.1 4.1 4.3Personal saving rate % 1.2 2.3 0.7 0.1 -0.2 0.2 0.5 1.0 1.2 1.5
Corp. profits, IVA & CCAdj. % change -14.6 42.0 24.5 8.7 12.7 1.4 -3.1 -4.2 -2.7 -1.9 Profit share of GNP % 9.4 10.1 10.5 10.6 10.8 10.7 10.5 10.2 10.0 9.9 Excluding FR Banks 9.2 10.0 10.3 10.5 10.6 10.5 10.3 10.1 9.9 9.7
Federal surpl./deficit Bill. $ -411.6 -371.6 -293.4 -295.8 -306.8 -316.8 -355.9 -358.1 -357.6 -349.0State & local surpl./def. -19.3 4.0 7.4 6.6 11.5 19.4 18.8 19.0 23.4 22.1 Ex. social ins. funds -21.2 2.3 6.5 6.2 10.5 18.4 17.8 18.0 22.4 21.1
Gross natl. saving rate % 13.4 13.4 13.5 13.2 12.8 13.0 12.8 12.9 13.0 13.1Net natl. saving rate 0.5 1.7 1.9 1.8 1.6 1.8 1.5 1.7 1.7 1.8
PRICES AND COSTS________________
GDP chn.-wt. price index % change 1.5 2.7 3.1 2.5 1.6 2.0 2.4 2.0 2.0 2.0Gross Domestic Purchases chn.-wt. price index 2.0 3.2 2.9 3.2 2.3 2.4 2.5 1.9 1.8 1.8PCE chn.-wt. price index 1.5 3.1 2.3 3.3 2.2 2.5 2.3 2.1 2.0 2.0 Ex. food and energy 1.5 2.3 2.4 1.8 1.9 2.1 2.1 2.1 2.1 2.1
CPI 1.7 3.4 2.5 4.0 2.5 2.9 2.6 2.2 2.1 2.1 Ex. food and energy 1.8 2.3 2.6 2.0 2.1 2.4 2.3 2.3 2.3 2.3
ECI, hourly compensation2 4.0 3.2 2.5 2.5 3.6 4.0 4.0 4.0 4.1 4.1Nonfarm business sector Output per hour 1.3 2.4 3.3 1.9 3.7 2.8 1.6 1.9 2.3 2.5 Compensation per hour 6.2 10.1 7.0 3.4 3.2 4.8 5.2 5.2 5.2 5.2 Unit labor cost 4.8 7.5 3.6 1.4 -0.4 1.9 3.5 3.3 2.9 2.6
1. Percent difference between potential and actual. A positive number indicates that the economy is operating below potential. 2. Private-industry workers.

I-24
Class II FOMC
August 4, 2005
Restricted (FR)
CONTRIBUTIONS TO GROWTH IN REAL GROSS DOMESTIC PRODUCT AND RELATED ITEMS
2002
2002
2003
2003
2003
2003
2004
2004
2004
02Q4/
03Q4/
04Q4/
Item
Q3
Q4
Q1
Q2
Q3
Q4
Q1
Q2
Q3
01Q4
02Q4
03Q4
Real GDP
2.4
0.2
1.7
3.7
7.2
3.6
4.3
3.5
4.0
1.9
4.0
3.8
Gross dom. purchases
2.9
1.7
1.6
4.3
6.8
4.0
5.4
4.9
4.1
2.8
4.2
4.7
Final sales
1.4
0.1
1.9
4.5
6.9
2.8
3.8
2.6
4.5
0.8
4.0
3.6
Priv. dom. final purchases
1.5
0.8
1.9
3.8
6.3
3.2
4.3
3.6
4.3
0.9
3.8
4.1
Personal cons. expenditures
1.6
1.0
1.7
2.6
4.1
2.2
3.3
1.3
3.1
1.3
2.6
2.7
Durables
1.0
-0.5
0.3
1.2
1.6
-0.0
0.4
0.0
0.9
0.1
0.8
0.4
Nondurables
0.1
0.7
0.6
0.4
1.7
0.6
1.3
0.5
0.8
0.4
0.8
0.9
Services
0.5
0.7
0.8
0.9
0.8
1.6
1.6
0.8
1.4
0.8
1.0
1.3
Business fixed investment
-0.2
-0.5
-0.1
0.8
1.1
0.4
0.8
1.3
1.2
-0.7
0.6
1.1
Equipment & Software
0.2
-0.4
0.1
0.5
1.1
0.4
0.9
1.1
1.1
-0.3
0.5
1.0
Nonres. structures
-0.4
-0.1
-0.2
0.3
0.0
0.0
-0.1
0.2
0.0
-0.5
0.0
0.1
Residential structures
0.1
0.3
0.2
0.5
1.1
0.6
0.3
0.9
0.2
0.3
0.6
0.4
Net exports
-0.5
-1.5
0.1
-0.7
0.5
-0.5
-1.2
-1.4
-0.2
-0.9
-0.1
-0.9
Exports
0.3
-0.3
-0.3
-0.2
1.0
1.7
0.5
0.7
0.5
0.4
0.6
0.6
Imports
-0.8
-1.2
0.4
-0.5
-0.6
-2.2
-1.7
-2.0
-0.7
-1.3
-0.7
-1.5
Government cons. & invest.
0.4
0.9
-0.1
1.4
0.1
0.1
0.6
0.4
0.4
0.7
0.4
0.4
Federal
0.2
0.6
0.0
1.4
-0.1
0.2
0.7
0.2
0.3
0.5
0.4
0.3
Defense
0.2
0.6
-0.2
1.5
-0.3
0.4
0.6
0.0
0.4
0.3
0.3
0.2
Nondefense
0.0
0.1
0.2
-0.1
0.2
-0.1
0.1
0.2
-0.2
0.1
0.0
0.1
State and local
0.2
0.3
-0.1
-0.0
0.3
-0.1
-0.1
0.2
0.1
0.3
0.0
0.1
Change in bus. inventories
1.0
0.1
-0.2
-0.8
0.4
0.8
0.5
0.9
-0.6
1.1
0.0
0.2
Nonfarm
0.7
0.0
-0.3
-0.6
0.5
0.6
0.7
0.4
-0.6
1.1
-0.0
0.2
Farm
0.3
0.0
0.2
-0.2
-0.1
0.2
-0.2
0.5
-0.0
0.0
0.0
-0.0
Note: Components may not sum to totals because of rounding.

I-25
Class II FOMC
August 4, 2005
Restricted (FR)
CONTRIBUTIONS TO GROWTH IN REAL GROSS DOMESTIC PRODUCT AND RELATED ITEMS
- - - - - - - - - - Projected - - - - - - - - - - - - - - - - - Projected - -
2004
2005
2005
2005
2005
2006
2006
2006
2006
04Q4/
05Q4/
06Q4/
Item
Q4
Q1
Q2
Q3
Q4
Q1
Q2
Q3
Q4
03Q4
04Q4
05Q4
Real GDP
3.3
3.8
3.3
4.3
4.0
3.0
3.1
3.1
3.1
3.8
3.9
3.1
Gross dom. purchases
4.3
4.2
2.0
4.5
4.5
3.6
3.1
3.3
3.8
4.7
3.8
3.5
Final sales
3.3
3.5
5.7
4.5
1.9
3.3
3.5
3.2
2.6
3.6
3.9
3.1
Priv. dom. final purchases
4.1
3.6
3.8
4.0
2.0
3.5
3.1
3.0
2.9
4.1
3.3
3.1
Personal cons. expenditures
3.0
2.4
2.5
3.2
1.5
2.6
2.2
2.2
2.2
2.7
2.4
2.3
Durables
0.5
0.2
0.9
1.1
-0.3
0.8
0.5
0.5
0.5
0.4
0.5
0.6
Nondurables
1.1
1.1
0.7
0.9
0.8
0.8
0.8
0.8
0.8
0.9
0.9
0.8
Services
1.5
1.2
1.0
1.2
1.0
1.0
1.0
1.0
0.9
1.3
1.1
1.0
Business fixed investment
1.0
0.6
0.7
0.6
0.6
1.1
0.8
0.8
0.7
1.1
0.6
0.8
Equipment & Software
0.9
0.6
0.6
0.5
0.5
0.9
0.6
0.7
0.6
1.0
0.6
0.7
Nonres. structures
0.1
-0.1
0.1
0.1
0.2
0.2
0.2
0.1
0.1
0.1
0.1
0.1
Residential structures
0.1
0.5
0.6
0.2
-0.1
-0.2
0.0
0.0
0.1
0.4
0.3
-0.0
Net exports
-1.0
-0.4
1.4
-0.1
-0.5
-0.6
-0.0
-0.2
-0.7
-0.9
0.1
-0.4
Exports
0.7
0.7
1.2
0.7
0.8
0.5
0.6
0.6
0.7
0.6
0.9
0.6
Imports
-1.7
-1.1
0.2
-0.8
-1.4
-1.1
-0.6
-0.8
-1.4
-1.5
-0.8
-1.0
Government cons. & invest.
0.2
0.4
0.5
0.6
0.5
0.5
0.4
0.4
0.4
0.4
0.5
0.4
Federal
-0.0
0.2
0.1
0.4
0.2
0.2
0.1
0.1
0.1
0.3
0.2
0.1
Defense
-0.2
0.1
0.1
0.3
0.2
0.1
0.1
0.1
0.1
0.2
0.2
0.1
Nondefense
0.1
0.0
-0.0
0.1
0.0
0.0
0.0
0.0
0.0
0.1
0.0
0.0
State and local
0.2
0.2
0.4
0.1
0.3
0.3
0.3
0.3
0.3
0.1
0.2
0.3
Change in bus. inventories
-0.0
0.3
-2.3
-0.2
2.0
-0.3
-0.4
-0.1
0.5
0.2
-0.0
-0.1
Nonfarm
0.3
0.4
-2.2
-0.2
2.0
-0.4
-0.4
-0.1
0.5
0.2
-0.0
-0.1
Farm
-0.3
-0.1
-0.1
-0.0
0.1
0.1
0.0
0.0
0.0
-0.0
-0.0
0.0
Note: Components may not sum to totals because of rounding.

I-26
Cla
ss I
I F
OM
CA
ugus
t 4,
200
5R
estr
icte
d (F
R)
Staf
f P
roje
ctio
ns o
f F
eder
al S
ecto
r A
ccou
nts
and
Rel
ated
Ite
ms
(Bill
ions
of
dolla
rs e
xcep
t as
note
d)
Fisc
al y
ear
2004
2005
2006
Item
2003
a20
04a
2005
2006
Q1a
Q2a
Q3a
Q4a
Q1a
Q2
Q3
Q4
Q1
Q2
Q3
Q4
Uni
fied
bud
get
Not
sea
sona
lly a
djus
ted
Rec
eipt
s117
8218
8021
3322
75
410
550
479
487
452
665
529
524
484
709
559
546
Out
lays
121
5922
9324
6626
05
581
576
565
605
628
620
612
643
671
653
639
675
Surp
lus/
defi
cit1
-377
-413
-334
-330
-1
71-2
6-8
6-1
18-1
7745
-84
-119
-187
56-8
0-1
29
On-
budg
et
-538
-568
-507
-512
-1
94-9
9-9
6-1
71-2
02-3
8-9
7-1
78-2
10-2
9-9
4-1
92
Off
-bud
get
161
155
174
182
23
7310
5325
8313
6022
8514
63
Mea
ns o
f fi
nanc
ing
B
orro
win
g
374
378
305
351
13
641
8310
216
5-4
381
118
172
-27
8811
9
Cas
h de
crea
se
26
-16
-5
12-2
38
122
-11
35
15-2
50
10
Oth
er2
-22
3622
-16
23
8-6
410
9-1
-40
-4-8
-0
Cas
h op
erat
ing
bala
nce,
end
of
peri
od
35
3630
35
2145
3625
2233
3025
1035
3525
NIP
A f
eder
al s
ecto
r
Se
ason
ally
adj
uste
d an
nual
rat
es
Rec
eipt
s
18
6119
3321
8723
45
1918
1951
1975
2055
2202
2231
2261
2288
2336
2365
2392
2422
Exp
endi
ture
s
2216
2348
2504
2693
23
4723
6523
8724
2624
9525
2725
6726
0526
9227
2327
5027
71
Con
sum
ptio
n ex
pend
iture
s
647
711
758
802
71
172
173
673
576
076
377
578
480
280
881
381
8
D
efen
se
42
547
450
854
0
473
480
495
490
509
512
521
527
539
544
548
552
Non
defe
nse
22
223
725
026
2
238
241
241
245
251
251
255
257
262
264
265
266
O
ther
spe
ndin
g
1569
1637
1745
1891
16
3716
4416
5116
9117
3517
6417
9218
2118
9119
1519
3719
53C
urre
nt a
ccou
nt s
urpl
us
-3
55-4
15-3
17-3
47
-429
-413
-412
-372
-293
-296
-307
-317
-356
-358
-358
-349
Gro
ss in
vest
men
t
9299
105
113
98
104
101
106
101
105
109
111
112
113
114
115
Gro
ss s
avin
g le
ss g
ross
inv
estm
ent3
-357
-421
-325
-359
-4
35-4
24-4
18-3
81-2
97-3
03-3
18-3
29-3
68-3
71-3
70-3
61
Fis
cal i
ndic
ator
s4H
igh-
empl
oym
ent (
HE
B)
sur
plus
/def
icit
-2
82-3
77-3
05-3
60
-391
-385
-385
-351
-274
-284
-310
-328
-368
-372
-371
-362
Cha
nge
in H
EB
, per
cent
of
pote
ntia
l GD
P
1.
30.
7-0
.80.
3
0.3
-0.1
-0.0
-0.3
-0.7
0.1
0.2
0.1
0.3
-0.0
-0.0
-0.1
Fisc
al im
petu
s (F
I)
p
erce
nt o
f G
DP
1.0
0.8
0.3
0.3
0.
30.
10.
10.
10.
00.
10.
10.
10.
10.
10.
0-0
.0
1
. In
July
, OM
B p
roje
cted
def
icits
of
$333
bill
ion
and
$341
bill
ion
for
FY 2
005
and
FY 2
006.
In
its J
uly
Mon
thly
Bud
get R
evie
w, C
BO
sta
ted
that
the
FY 2
005
defi
cit w
ould
be
sign
ific
antly
less
than
$35
0 bi
llion
, and
per
haps
bel
ow $
325
billi
on. B
udge
t rec
eipt
s, o
utla
ys, a
nd s
urpl
us/d
efic
it in
clud
e co
rres
pond
ing
soci
al s
ecur
ity (
OA
SDI)
cat
egor
ies.
The
OA
SDI
surp
lus
and
the
Post
al S
ervi
ce s
urpl
us a
re e
xclu
ded
from
the
on-b
udge
t sur
plus
and
sho
wn
sepa
rate
ly a
s of
f-bu
dget
, as
clas
sifi
ed u
nder
cur
rent
law
.
2. O
ther
mea
ns o
f fi
nanc
ing
are
chec
ks is
sued
less
che
cks
paid
, acc
rued
item
s, a
nd c
hang
es in
oth
er f
inan
cial
ass
ets
and
liabi
litie
s.
3. G
ross
sav
ing
is th
e cu
rren
t acc
ount
sur
plus
plu
s co
nsum
ptio
n of
fix
ed c
apita
l of
the
gene
ral g
over
nmen
t as
wel
l as
gove
rnm
ent e
nter
pris
es.
4
. HE
B is
gro
ss s
avin
g le
ss g
ross
inve
stm
ent (
NIP
A)
of th
e fe
dera
l gov
ernm
ent i
n cu
rren
t dol
lars
, with
cyc
lical
ly s
ensi
tive
rece
ipts
and
out
lays
adj
uste
d to
the
staf
f’s
mea
sure
of
pote
ntia
l out
put a
nd th
eN
AIR
U. Q
uart
erly
fig
ures
for
cha
nge
in H
EB
and
FI
are
not a
t ann
ual r
ates
. T
he s
ign
on C
hang
e in
HE
B, a
s a
perc
ent o
f no
min
al p
oten
tial G
DP,
is r
ever
sed.
FI
is th
e w
eigh
ted
diff
eren
ce o
f di
scre
tiona
rych
ange
s in
fed
eral
spe
ndin
g an
d ta
xes
in c
hain
ed (
2000
) do
llars
, sca
led
by r
eal G
DP.
The
ann
ual F
I es
timat
es a
re o
n a
cale
ndar
yea
r ba
sis.
Als
o, f
or F
I an
d th
e ch
ange
in H
EB
, pos
itive
val
ues
indi
cate
aggr
egat
e de
man
d st
imul
us.
a
--A
ctua
l

I-27
Cla
ss I
I F
OM
CC
hang
e in
Deb
t of
the
Dom
esti
c N
onfi
nanc
ial S
ecto
rsA
ugus
t 4,
200
5 R
estr
icte
d (F
R)
(Per
cent
)
Non
fede
ral
Hou
seho
lds
Mem
o:Fe
dera
lH
ome
Con
sum
erSt
ate
and
loca
lN
omin
alPe
riod
1T
otal
gove
rnm
ent
Tot
alT
otal
mor
tgag
escr
edit
Bus
ines
sgo
vern
men
tsG
DP
Yea
r19
996.
4-1
.98.
98.
39.
27.
910
.73.
46.
320
004.
8-8
.08.
38.
78.
310
.89.
41.
34.
620
016.
2-0
.27.
68.
89.
68.
16.
18.
92.
720
026.
97.
66.
79.
611
.94.
52.
711
.13.
6
2003
8.1
10.9
7.5
10.1
12.5
4.7
4.3
8.2
6.1
2004
8.6
9.0
8.6
11.2
13.6
4.6
5.5
7.4
6.8
2005
7.6
7.3
7.6
8.4
9.7
4.2
6.6
7.9
6.2
2006
6.3
7.5
6.0
6.5
7.1
4.6
5.9
4.0
5.3
Qua
rter
2004
:19.
312
.08.
711
.813
.95.
64.
610
.38.
12
7.7
10.7
7.0
10.3
12.1
2.8
3.7
3.4
7.5
38.
24.
88.
911
.414
.35.
85.
79.
45.
34
8.2
7.2
8.4
9.4
11.4
3.8
7.7
5.6
6.1
2005
:110
.013
.89.
19.
310
.64.
67.
416
.27.
02
6.3
2.1
7.3
8.3
9.9
3.1
5.9
7.0
5.9
36.
54.
27.
17.
88.
84.
76.
64.
75.
94
6.7
8.4
6.3
7.1
8.0
4.2
5.9
2.8
6.1
2006
:17.
413
.56.
16.
67.
34.
65.
74.
15.
52
5.4
3.3
5.9
6.3
6.9
4.5
5.8
4.1
5.2
35.
64.
45.
96.
26.
84.
55.
93.
85.
24
6.2
8.0
5.7
6.1
6.6
4.5
5.7
3.8
5.2
N
ote.
Qua
rter
ly d
ata
are
at s
easo
nally
adj
uste
d an
nual
rat
es.
1.
Dat
a af
ter
2005
:Q1
are
staf
f pr
ojec
tions
. Cha
nges
are
mea
sure
d fr
om e
nd o
f th
e pr
eced
ing
peri
od to
end
of
peri
od in
dica
ted
exce
pt f
or a
nnua
l nom
inal
GD
P gr
owth
, whi
chis
cal
cula
ted
from
Q4
to Q
4.
2.6.
3 F
OF

I-28
Cla
ss I
I F
OM
CF
low
of
Fun
ds P
roje
ctio
ns:
Hig
hlig
hts
Aug
ust
4, 2
005
Res
tric
ted
(FR
)(B
illio
ns o
f do
llars
at
seas
onal
ly a
djus
ted
annu
al r
ates
exc
ept
as n
oted
)
2004
2005
2006
Cat
egor
y20
0320
0420
0520
06Q
3 Q
4 Q
1 Q
2 Q
3 Q
4 Q
1 Q
2 Q
3 Q
4
Net
fund
s ra
ised
by
dom
esti
cno
nfin
anci
al s
ecto
rs 1
Tot
al16
09.8
1761
.415
75.2
1502
.216
97.0
1759
.721
83.9
1272
.413
64.1
1480
.317
45.9
1311
.513
91.4
1560
.1 2
N
et e
quity
issu
ance
-57.
8-1
57.0
-257
.3-1
35.0
-203
.2-1
83.2
-226
.0-2
94.4
-284
.0-2
25.0
-179
.0-1
31.0
-115
.0-1
15.0
3
Net
deb
t iss
uanc
e16
67.5
1918
.418
32.5
1637
.219
00.2
1942
.924
09.9
1566
.816
48.1
1705
.319
24.9
1442
.515
06.4
1675
.1
Bor
row
ing
sect
ors
Non
fina
ncia
l bus
ines
s 4
F
inan
cing
gap
120
.072
.9-3
5.5
112.
66.
418
1.6
81.4
17.6
-153
.8-8
7.0
-61.
214
2.3
165.
720
3.6
5
Net
equ
ity is
suan
ce-5
7.8
-157
.0-2
57.3
-135
.0-2
03.2
-183
.2-2
26.0
-294
.4-2
84.0
-225
.0-1
79.0
-131
.0-1
15.0
-115
.0 6
C
redi
t mar
ket b
orro
win
g30
7.3
411.
251
8.7
492.
243
3.1
594.
257
7.0
473.
753
6.2
487.
747
5.3
492.
750
3.4
497.
5
Hou
seho
lds
7
Net
bor
row
ing
284
6.5
1030
.286
1.2
719.
811
08.5
943.
495
4.8
873.
083
9.2
777.
973
9.5
714.
071
4.6
711.
1 8
H
ome
mor
tgag
es73
6.4
904.
273
1.7
588.
510
17.0
838.
280
1.7
770.
770
0.6
653.
960
7.2
583.
958
3.9
579.
2 9
C
onsu
mer
cre
dit
92.7
94.1
89.8
101.
612
1.6
81.6
97.4
66.3
103.
691
.710
1.5
100.
510
1.6
102.
810
D
ebt/D
PI (
perc
ent)
310
7.7
112.
611
7.8
118.
711
4.1
113.
811
6.6
117.
811
8.6
119.
011
8.8
118.
711
8.7
118.
7
Stat
e an
d lo
cal g
over
nmen
ts11
N
et b
orro
win
g11
7.8
115.
113
1.8
72.8
151.
993
.227
1.9
122.
682
.949
.874
.874
.870
.870
.812
C
urre
nt s
urpl
us 4
155.
918
1.3
172.
718
8.2
173.
819
3.2
168.
216
6.7
173.
218
2.8
183.
818
5.6
191.
519
1.8
Fede
ral g
over
nmen
t13
N
et b
orro
win
g39
6.0
361.
932
0.8
352.
420
6.7
312.
160
6.2
97.5
189.
738
9.9
635.
416
1.0
217.
639
5.8
14
Net
bor
row
ing
(n.s
.a.)
396.
036
1.9
320.
835
2.4
83.3
102.
116
4.7
-42.
881
.311
7.7
172.
0-2
6.9
88.3
119.
115
U
nifi
ed d
efic
it (n
.s.a
.)39
9.1
400.
733
4.1
340.
585
.711
8.1
176.
6-4
4.8
83.8
118.
618
7.5
-55.
979
.912
9.1
Dep
osit
ory
inst
itut
ions
16
Fund
s su
pplie
d47
6.4
825.
666
7.7
585.
842
3.3
1010
.410
92.6
471.
659
5.1
511.
467
3.5
527.
364
5.0
497.
4
Mem
o (p
erce
ntag
e of
GD
P)17
D
omes
tic n
onfi
nanc
ial d
ebt 5
194.
919
7.7
201.
220
3.8
198.
319
9.5
200.
620
1.8
202.
120
2.4
203.
220
3.9
204.
120
4.5
18
Dom
estic
non
fina
ncia
l bor
row
ing
15.2
16.3
14.7
12.4
16.1
16.2
19.8
12.7
13.1
13.4
14.9
11.0
11.4
12.5
19
Fede
ral g
over
nmen
t 63.
63.
12.
62.
71.
72.
65.
00.
81.
53.
14.
91.
21.
63.
020
N
onfe
dera
l11
.613
.312
.19.
814
.313
.614
.811
.911
.610
.310
.09.
89.
79.
5
N
ote.
Dat
a af
ter
2005
:Q1
are
staf
f pr
ojec
tions
.
4
. NIP
A s
tate
and
loca
l gov
ernm
ent s
avin
g pl
us c
onsu
mpt
ion
of f
ixed
cap
ital a
nd n
et c
apita
l tra
nsfe
rs.
1.
For
cor
pora
tions
: Exc
ess
of c
apita
l exp
endi
ture
s ov
er U
.S. i
nter
nal f
unds
.
5. A
vera
ge d
ebt l
evel
s in
the
peri
od (
com
pute
d as
the
aver
age
of p
erio
d-en
d de
bt p
ositi
ons)
div
ided
by
nom
inal
GD
P.
2. I
nclu
des
chan
ge in
liab
ilitie
s no
t sho
wn
in li
nes
8 an
d 9.
6.
Exc
lude
s go
vern
men
t-in
sure
d m
ortg
age
pool
sec
uriti
es.
3.
Ave
rage
deb
t lev
els
in th
e pe
riod
(co
mpu
ted
as th
e av
erag
e of
per
iod-
end
debt
pos
ition
s)
n.s
.a.
Not
sea
sona
lly a
djus
ted.
divi
ded
by d
ispo
sabl
e pe
rson
al in
com
e.
2.6.
4 F
OF

International Developments
Oil prices have scaled new heights as global economic activity has continued to gain momentum. The spot price of West Texas intermediate (WTI) crude oil is currently around $61 per barrel, up since the time of the June Greenbook, and futures prices have also increased substantially. To date, the foreign economies have proved resilient to high oil prices, and we continue to project some pick-up in foreign growth, though it amounts to slightly less than we predicted in June. Higher oil prices have boosted consumer prices in recent months and are projected to continue to do so in coming months. However, with inflation expectations generally well-anchored and with slack persisting in some economies, we expect inflation rates to remain contained and move down a bit sometime next year.
Summary of Staff Projections (Percent change from end of previous period, s.a.a.r.)
Projection
2005 Indicator 2004 2005: Q1
Q2 H2 2006
Foreign output 3.6 2.7 3.1 3.4 3.3 June GB 3.6 2.7 3.2 3.5 3.3
Foreign CPI 2.8 1.3 2.2 2.7 2.5 June GB 2.8 1.3 2.3 2.6 2.4
NOTE. Changes for years are measured as Q4/Q4; for half-years, Q2/Q4 or Q4/Q2.
Prominent among intermeeting developments was the announcement on July 21 of a change in China’s exchange rate system. In addition to an immediate 2.1 percent revaluation of the renminbi against the dollar, the authorities also announced that the renminbi would no longer be pegged to the dollar but would instead be managed with reference to an as-yet unspecified basket of currencies. In the wake of these changes, other Asian currencies also appreciated against the dollar. Despite recent statements by China’s authorities that additional movements in the exchange rate are not imminent, we think there is now more scope for exchange rate adjustment in China. Accordingly, we have incorporated some further moderate appreciation of the renminbi into our forecast, congruent with the 2 percent pace of appreciation we project for the major foreign currencies. We now project that several

I-30 Part I: Summary and Outlook, August 4, 2005 other Asian currencies will appreciate slightly against the dollar as well. As a consequence, our forecast path for the broad real dollar tilts downward a bit more than it did in the June Greenbook. It also starts from a slightly lower level than in the previous forecast, reflecting both the renminbi’s revaluation and the dollar’s recent movements against other currencies. These changes to our exchange rate forecast are small, however, and have only limited effects on the outlook for the foreign economies and the U.S. external sector. The effects of a more substantial renminbi appreciation, coupled potentially with sizable appreciations of other Asian currencies against the dollar, are explored in the alternative-simulations section below. Real net exports subtracted nearly ½ percentage point from U.S. GDP growth in the first quarter of this year. Export growth then strengthened and imports, especially oil imports, declined; for the second quarter, net exports are estimated to have contributed about 1½ percentage points to growth, ¾ percentage point more than we projected in the June Greenbook. This upward revision reflects a smaller-than-expected trade deficit for May as well as technical adjustments to the foreign transactions data in the U.S. national income accounts. We project that imports will rebound in the current quarter, and that net exports will deduct about ¼ percentage point from growth in the second half of this year and subtract about ½ percentage point in 2006. The U.S. current account deficit is expected to widen from $766 billion (annual rate) in the second quarter of 2005 to $960 billion in the fourth quarter of 2006, or about 7¼ percent of GDP. Oil Prices The spot price of West Texas intermediate (WTI) crude oil closed at $60.87 per barrel on August 3, up about $2.50 per barrel since late June. News of the death of King Fahd of Saudi Arabia added to upward pressure on oil prices, although Saudi oil policy is not expected to change in the near term. However, King Abdullah and the newly appointed crown prince are in their 80s; and, with younger members of the royal family jockeying for position in the hierarchy, Saudi Arabia’s subsequent leadership is unclear. A worsening of tensions regarding Iran’s development of nuclear technology is also causing instability in the region. In addition, oil prices received a boost from production disruptions in the North Sea and India as well as from the hurricane season in the Gulf of Mexico, which is shaping up to be unusually active. As the spot price of WTI has increased, the price spreads between WTI and lower quality grades of crude oil have widened a bit, due in part to several refinery outages.

International Developments I-31 Although there have been indications that oil demand growth in the United States and China has slowed from last year’s torrid pace, growth of world oil demand is expected to be strong going forward as global economic growth remains robust. Oil prices are also expected to be supported by a lack of OPEC spare production capacity and concerns about future supplies from Iraq, Russia, and Venezuela. The far-dated futures contract (for delivery in December 2011) closed at $59.19 per barrel on August 3, up $3 per barrel from late June, an indication that market participants expect today’s tight market conditions to persist. In line with NYMEX futures prices, the spot price of WTI is projected to move up in the near term, averaging $63.75 per barrel in the first half of next year. The spot price is projected to edge down thereafter to about $63.20 in 2006:Q4. Relative to the oil price forecast in the June Greenbook, the current projection averages about $1 per barrel higher in the second half of 2005 and about $3.50 higher in 2006. Our projected path of the price of imported oil is little changed in the second half of this year relative to the projection in the June Greenbook, but the new projection is about $3.30 per barrel higher in 2006. The minimal revision to the price of imported oil in the remainder of this year reflects in part the recent widening of the spread between WTI and lower quality grades of crude oil. International Financial Markets The trade-weighted exchange value of the dollar against the major foreign currencies rose in the days following the June FOMC meeting on positive economic news for the United States. But it declined ¾ percent on balance over the intermeeting period, even though interest rate differentials moved in favor of the dollar, with the dollar’s decline concentrated in the past week. Although no particular data release or news triggered this depreciation, concerns about the financing burden of U.S. external deficits may have played a role. On balance, the dollar depreciated 1¾ percent against the euro and ¾ percent against the Canadian dollar but appreciated somewhat against the pound and the yen. The exchange value of the dollar declined 1½ percent against the currencies of our other important trading partners over the intermeeting period, a move led by the dollar’s depreciation of 2 percent against the Chinese renminbi and 1½ percent against the Mexican peso. The renminbi’s spot exchange rate against the dollar has fluctuated in a very narrow range around 8.11 yuan per dollar since July 21. China’s authorities have stated that further adjustments to the renminbi’s exchange rate would be undertaken

I-32 Part I: Summary and Outlook, August 4, 2005 “when necessary according to market developments as well as the economic and financial situation.” Nondeliverable forward renminbi-dollar contracts currently price in additional renminbi appreciation of about 2 percent in six months and 4½ percent at a twelve-month horizon. The dollar also depreciated 2 percent against the Singapore dollar and the Korean won and 1¼ percent against the Malaysian ringgit, which was unpegged from the dollar immediately after the renminbi’s revaluation. On the basis of these developments, we have lowered the third-quarter starting point for the projected path of the broad real dollar nearly ½ percent relative to the June Greenbook. We project that the broad real dollar will depreciate at an annual rate of roughly 1½ percent over the forecast period. With little insight into how much and when China’s authorities will allow the renminbi to move, we are assuming that the dollar will depreciate against the renminbi in nominal terms at a rate similar to that projected for the major foreign currencies. The resulting endpoint of the projected path of the broad real dollar is about 1 percent below its level in the June Greenbook. The only change in monetary policy in the major foreign industrial countries during the intermeeting period was a 25-basis-point cut in the repo rate by the Bank of England on August 4, a move that had been widely anticipated. Market participants no longer appear to expect the European Central Bank to ease policy in the near term, in large part because several ECB officials have warned of the dangers of increasing inflationary pressures. After they fell in the second quarter, yields on long-term European, Canadian, and Japanese government bonds rose 15 to 20 basis points, less than the run-up in U.S. yields over the period. Announcements of generally better-than-expected earnings contributed to increases of headline stock market indexes of 4 percent in the United Kingdom and the euro area and 7 percent in Canada. These indexes have recently risen to three-to-four-year highs in local-currency terms, as has the Standard and Poor’s 500 index. Japan’s TOPIX index rose 2¼ percent, moving slightly above last year’s peak. Brazilian financial indicators suffered in early July from new revelations in the bribes-for-votes scandal affecting Brazil’s Congress, but recovered late in the intermeeting period on signs that the scandal’s reach remains limited. Mexican financial assets appeared to benefit from good news about the U.S. economy and continued high oil prices. On net, Mexican and Brazilian share prices rose 8 percent and 7 percent, respectively, during the intermeeting period. EMBI+ spreads for these countries fell about 20 basis points despite the rise in long-term interest rates in industrial countries.

International Developments I-33
. The Desk did not intervene during the period for the accounts of the System or the Treasury. Foreign Industrial Countries We estimate that the growth of real GDP in the foreign industrial countries slipped just below 2 percent (annual rate) in the second quarter, with particularly sluggish performance in the euro area and Japan. We see most of the factors restraining growth in the second quarter as only temporary, however, and project that real GDP will expand at an annual rate near 2½ percent in the current and subsequent quarters. Our forecast is slightly weaker than that in the previous Greenbook; the markdown is largely attributable to a downward revision to our outlook for U.K. growth. Recent data on prices have been in line with our previous forecast, and we continue to project that four-quarter headline inflation in the foreign industrial countries will remain near 1½ percent during the forecast period. Revised U.K. national accounts revealed slower rates of real GDP growth for the second half of 2004 and the first quarter of 2005. In addition, preliminary data for the second quarter of 2005 put growth at 1½ percent, a pace weaker than we had expected. Seeing less momentum in U.K. economic activity entering the forecast period, we lowered our projection for growth. Consumption is projected to be fairly sluggish over the forecast period, as households rebuild savings from the very low levels reached in 2004. The more subdued outlook leads us to assume that the Bank of England will ease again sometime next year. Headline inflation is projected to move a little above the Bank of England’s target of 2 percent during the second half of this year before falling back below target in 2006. We estimate that euro-area GDP expanded only about 1 percent in the second quarter after nearly 2 percent growth in the first quarter. Domestic demand appears to have rebounded in the second quarter, but because imports also bounced back from a sharp contraction in the first quarter, net exports contributed negatively to growth. We project that domestic demand will expand moderately over the forecast period and lead overall economic activity to grow at about 1½ percent in the third quarter and a bit higher thereafter. Higher oil prices helped push euro-area inflation above 2 percent in June and July, but we expect inflation to fall back a bit next year, and thus we assume that the ECB will continue to keep rates on hold for the remainder of the forecast period.

I-34 Part I: Summary and Outlook, August 4, 2005 We now estimate that, after a surge of nearly 5 percent in the first quarter, Japanese GDP grew about 1¼ percent at an annual rate in the second quarter, as consumption and investment returned to more sustainable rates of growth and the buildup of inventory stocks slowed. Domestic demand is expected to drive growth during the forecast period, and we also see net exports beginning to make a positive contribution. Japan’s GDP growth is forecast to pick up to around 1¾ percent by the end of 2006. We project CPI inflation to turn positive on a sustained basis in the second half of 2006 and prompt the Bank of Japan to begin its exit from quantitative easing. In Canada, GDP growth is estimated to have firmed to 2¾ percent in the second quarter, and we expect it to increase to 3½ percent in the second half of the year before moderating in 2006 towards the economy’s potential growth rate of just above 3 percent. Strong final domestic demand is expected to continue spurring the economy, while the negative contributions from net exports and inventories diminish. Recent statements by the Bank of Canada have reinforced our view that monetary policy tightening will resume in the current quarter and continue over the next year. These measures should keep inflation around the 2 percent midpoint of the Bank of Canada’s inflation target range. Other Countries We estimate that average real GDP growth in the emerging market economies increased to about 4¾ percent in the second quarter after having been restrained by several one-time factors in the first quarter, and we expect growth to remain around that pace over the remainder of the forecast period. Four-quarter consumer price inflation is projected to rise during the forecast period to 3½ percent next year, as the moderating effect of recent decreases in food prices in several countries lessens and domestic fuel subsidies are gradually reduced in the face of sustained high oil prices. In emerging Asia, real GDP growth is estimated to have jumped to 5¾ percent in the second quarter, as a sharp rebound in Singapore and robust growth in consumer spending in Korea more than offset weaker performance in China. Our forecast calls for growth in emerging Asia to average about 5¼ percent over the rest of the forecast period, down from the 6 percent pace recorded in 2004. Growth in China is projected to recover from its weak second-quarter pace, but it is not expected to regain its blistering pace of recent years, mainly because policy restraint will keep investment growth to a less frenetic pace. Activity is expected to further strengthen in Korea, where domestic demand should continue to improve as consumer debt burdens are worked down. Our projection that the renminbi and other emerging Asian currencies will appreciate modestly over the forecast

International Developments I-35 period has little net effect on growth in the region, although some shifting of activity across sectors and economies may occur in response to the associated changes in relative prices. In Latin America, growth is estimated to have bounced back to 3½ percent in the second quarter from its weak first-quarter pace, largely as a result of improvement in the Mexican economy. We project that Mexican growth will rise further, along with projected growth in U.S. manufacturing, to reach about 4 percent by the end of the year, and then remain around that pace over the remainder of the forecast period. The monetary policy tightening begun more than a year ago appears to have ended, as inflation has fallen back to a level close to the top of the Bank of Mexico’s target range, and some easing is now expected. Growth in Brazil appears to have improved a bit in the second quarter and is projected to remain at 2½ percent over the forecast period, restrained by high real interest rates. Four-quarter consumer price inflation in emerging Asia is expected to rise to 3¼ percent in 2006, as the effects of increases in oil prices over the past several quarters show through to consumer prices. In Latin America, we expect some moderation in four-quarter inflation this year, to 3¾ percent, largely in response to previous monetary policy tightening in both Mexico and Brazil. Next year we forecast inflation to increase to about 4¼ percent, as higher energy prices are passed on to consumers. Prices of Internationally Traded Goods After rising at an annual rate of 4.6 percent in the first quarter of this year, core import prices rose 2.1 percent in the second quarter, a touch lower than projected in the June Greenbook. In both May and June, as the dollar strengthened, core import prices actually declined, driven by lower prices for material-intensive goods. After large price increases in the first quarter, finished goods exhibited only small price movements in the second quarter. We project that core import prices will continue to increase at an annual rate of 2 percent in the second half of the year, because of the lingering effects of previous rises in commodity prices as well as the prospective depreciation of the dollar. In 2006, the impetus from the earlier run-up in commodity prices vanishes, and with only small changes projected for the dollar, core import price inflation drops below 1 percent. We continue to assume that the expiration of the Multi-fiber Arrangement, by allowing expanded imports from lowest-cost producers, will slightly restrain overall core import

I-36 Part I: Summary and Outlook, August 4, 2005 prices during the forecast period. Compared with the previous Greenbook, our outlook for core import price inflation is just a touch higher as the effects of the slightly lower path of the dollar are largely offset by a downward revision to the projected path of nonfuel commodity prices.
Staff Projections of Selected Trade Prices (Percent change from end of previous period
except as noted, s.a.a.r.)
Projection
2005 Trade category 2004 2005: Q1
Q2 H2 2006
Exports Core goods 5.1 6.1 4.0 2.8 2.2 June GB 5.1 6.0 5.1 2.8 2.0
Imports Non-oil core goods 4.3 4.6 2.1 2.0 0.8 June GB 4.2 4.8 2.6 1.9 0.6 Oil (dollars per barrel) 40.91 39.89 46.27 55.74 58.31 June GB 40.91 39.89 46.90 54.97 54.29
NOTE. Prices for core exports and non-oil core imports, which exclude computers and semiconductors, are on a NIPA chain-weighted basis. The price of imported oil for multi-quarter periods is the price for the final quarter of the period.
In the second quarter, core export prices rose at an annual rate of 4 percent, down from a 6 percent pace in the first quarter. The second-quarter rise occurred entirely in April, as core export prices were about flat in May and June, when lower prices for nonagricultural industrial supplies offset higher prices for agricultural products. We project core export price inflation to average 2¾ percent in the second half of this year and to drift down to 2¼ percent in 2006 as prices for agricultural exports decelerate. Trade in Goods and Services During the intermeeting period, we received nominal trade data for May, which showed a decline in the value of imports from April’s record high, a drop led by steep declines in imports of oil and of industrial supplies. In line with these data, we now estimate that real imports fell 1¼ percent at an annual rate in the second quarter, in part because of a steep drop in the volume of oil imports, which in turn mainly reflects quirky seasonal adjustment factors. In addition, core imports, which for two quarters grew considerably

International Developments I-37 faster than the rate predicted by the paths of relative prices and U.S. GDP, are estimated to have expanded in the second quarter somewhat more slowly than suggested by these fundamentals. Imported services, on the other hand, appear to have registered unusually strong growth in the second quarter, as the appreciation of the dollar earlier this year damped inflation of import prices for services. Imports of computers and semiconductors accelerated slightly. Overall, real imports grew considerably more slowly than projected in the June Greenbook; the revision reflects not only May trade data, which were somewhat weaker than expected, but also adjustments to the factors BEA uses to translate balance of payments data into the national income accounts. In the second half of 2005 and in 2006, real import growth is projected to rise to about 6¼ percent (annual rate) on average as imports of oil stabilize and imports of core goods resume steady expansion. Core goods imports are supported during the second half of this year by a pick-up in U.S. growth. In 2006, U.S. growth moderates somewhat, but the effects of this are largely offset by the diminishing restraint from core import prices. Imports of computers and semiconductors are projected to rise steadily, whereas the growth of imported services eases, along with U.S. growth. Compared with the June Greenbook, our current projection is about unchanged for the second half of 2005 but a bit lower next year, mainly reflecting the effects of slower U.S. GDP growth on imports of core goods and services as well as a bit more drag from the downward revision of the dollar.
Staff Projections for Trade in Goods and Services (Percent change from end of previous period, s.a.a.r.)
Projection
2005 Measure 2004 2005: Q1
Q2 H2 2006
Real exports 6.1 7.5 12.3 7.4 5.5 June GB 5.9 9.1 8.5 8.0 6.2
Real imports 10.6 7.4 -1.2 6.7 5.9 June GB 9.8 9.9 1.8 6.7 6.6
NOTE. Changes for years are measured as Q4/Q4; for half-years, Q2/Q4 or Q4/Q2.
In May, nominal exports of goods and services grew a bit, defying our expectations of a step-down from a very robust April. The growth was fairly widespread across categories,

I-38 Part I: Summary and Outlook, August 4, 2005 with agricultural goods being especially strong. We have penciled in only a slight retreat in nominal exports in June, which implies that real exports expanded 12¼ percent (annual rate) in the second quarter, well above the June Greenbook projection. Core exports for the second quarter are estimated to have risen 12 percent, a rate well above that predicted by foreign growth and relative prices. The growth of services exports slowed a bit in the second quarter but appears to have remained quite robust. Real exports of computers and semiconductors are estimated to have strengthened in the second quarter after a weak performance in recent quarters. In the second half of this year, growth in real exports of goods and services is expected to slow to about 7½ percent. Exports of core goods decelerate to a pace more in line with their fundamental determinants but continue to be supported both by solid foreign growth and by the lingering effects of the dollar’s depreciation in previous years. Exports of services, which react more quickly to changes in the exchange rate, are projected to slow in part because of the fading support from the dollar’s past depreciation. Growth in exports of computers and semiconductors is projected to ease from the second quarter’s torrid pace. In 2006, solid foreign GDP growth should continue to boost exports, but the diminishing effects of past dollar depreciation likely will further damp growth in exports of core goods and services. Our projection for export growth beyond the current quarter is somewhat lower than the forecast in the June Greenbook. We have marked down the growth of real semiconductor exports to better reflect its performance in recent years, and we have made technical adjustments to the path of core exports to bring it more in line with projected foreign growth and relative prices. Alternative Simulations Our baseline projection assumes a modest rate of appreciation of the Chinese renminbi against the dollar over the forecast period. The effects of a 20 percent appreciation of the renminbi over the next year are examined in two scenarios utilizing the FRB/Global model. In the first scenario, the appreciation of the renminbi is accompanied by risk-premium shocks that lead to a 10 percent appreciation of other developing Asian currencies and the Japanese yen against the dollar in the absence of endogenous adjustment, phased in over four quarters beginning in 2005:Q3. As a result, U.S. real GDP growth rises about 0.2 percentage point above baseline in 2006, largely because of the stimulus to real net exports. However, the stimulus is small because exports to Asia account for only about 28 percent of total U.S. exports and because import substitution away from Asian

International Developments I-39 products is limited by the low pass-through of exchange rates to import prices. With the dollar depreciation occurring gradually, the J-curve effects are protracted, and the nominal trade balance is still below baseline in 2006. (The ratio of the trade balance to GDP rises about 0.1 percentage point above baseline in 2007, which is beyond this Greenbook’s horizon.)
In the second scenario, we consider the possibility that the 20 percent renminbi appreciation is accompanied by risk-premium shocks that would lead to a gradual 10 percent appreciation of most other foreign currencies against the dollar. This more broadly based appreciation of foreign currencies may result from diminished confidence in dollar-denominated assets associated with the reduction in demand for U.S. securities by Asian central banks, as they allow their currencies to appreciate against the dollar. In this case, U.S. real GDP growth rises about 0.6 percentage point above baseline in 2006. Higher import prices and cost pressures arising from increased resource utilization push up core PCE inflation, which increases about 0.2 percentage point above baseline in 2005:H2 and 2006. As the J-curve effects dissipate, the ratio of the trade balance to GDP rises about 0.2 percentage point above baseline in 2006:H2 (and about 0.5 percentage point in 2007).

I-40 Part I: Summary and Outlook, August 4, 2005
Alternative Scenarios (Percent change from previous period, annual rate,
except as noted)
2006 Indicator and simulation 2005:
H2 H1 H2
U.S. real GDP Baseline 4.1 3.1 3.1 Appreciations of RMB and other East Asian currencies vs. dollar 4.1 3.2 3.3 Appreciations of RMB and most foreign currencies vs. dollar 4.2 3.6 3.9
U.S. PCE prices excluding food and energy Baseline 2.0 2.1 2.1 Appreciations of RMB and other East Asian currencies vs. dollar 2.1 2.2 2.2 Appreciations of RMB and most foreign currencies vs. dollar 2.2 2.3 2.2
U.S. trade balance (percent of GDP) Baseline -5.8 -6.0 -5.9 Appreciations of RMB and other East Asian currencies vs. dollar -5.9 -6.2 -6.0 Appreciations of RMB and most foreign currencies vs. dollar -5.9 -6.1 -5.7
NOTE. H1 is Q2/Q4; H2 is Q4/Q2. In these simulations, the nominal federal funds rate remains unchanged from baseline, and the monetary authorities in major foreign economies adjust their policy rates according to a Taylor rule.

I-41
Class II FOMC August 4, 2005
Restricted (FR)
OUTLOOK FOR FOREIGN REAL GDP AND CONSUMER PRICES: SELECTED COUNTRIES
(Percent, Q4 to Q4)
___________________________________________________________________________________________________
Projected
Measure and country 1998 1999 2000 2001 2002 2003 2004 2005 2006
___________________________________________________________________________________________________
REAL GDP (1)
------------
Total foreign 1.6 5.0 4.2 0.3 3.0 2.9 3.6 3.1 3.3
Industrial Countries 2.8 4.4 3.6 0.8 2.5 1.8 2.4 2.3 2.5
of which:
Canada 4.4 5.9 4.1 1.3 3.6 1.7 3.3 3.0 3.3
Japan -1.1 0.2 3.2 -2.0 1.5 2.2 0.9 2.2 1.6
United Kingdom 3.3 3.4 3.2 2.0 2.1 3.1 2.7 1.7 2.0
Euro Area (2) 1.8 4.0 3.1 1.0 1.2 0.9 1.5 1.5 1.6
Germany 0.7 3.5 2.3 1.0 0.4 0.3 0.5 1.7 1.3
Developing Countries -0.3 6.0 5.3 -0.5 3.6 4.5 5.5 4.3 4.5
Asia -1.9 8.5 5.8 1.1 5.8 6.5 5.9 5.2 5.1
Korea -5.5 11.5 4.5 4.6 7.8 4.2 3.0 3.3 3.5
China 9.8 7.1 7.7 7.0 8.4 10.0 9.5 8.2 7.3
Latin America 1.2 4.4 4.5 -1.3 1.5 2.4 5.1 3.4 4.0
Mexico 2.9 5.5 4.8 -1.3 2.0 2.1 4.8 3.3 4.1
Brazil -1.7 3.4 3.9 -0.9 4.2 0.8 4.6 2.2 2.5
CONSUMER PRICES (3)
-------------------
Industrial Countries 0.9 1.1 1.7 0.9 2.1 1.3 1.8 1.3 1.5
of which:
Canada 1.1 2.4 3.1 1.1 3.8 1.7 2.3 1.9 2.1
Japan 0.7 -1.1 -1.2 -1.3 -0.5 -0.5 0.4 -0.7 0.2
United Kingdom (4) 1.4 1.2 1.0 1.0 1.5 1.3 1.4 2.2 1.9
Euro Area (2) 0.9 1.5 2.5 2.1 2.3 2.0 2.3 2.1 1.7
Germany 0.3 1.1 1.7 1.5 1.2 1.2 2.1 1.5 1.5
Developing Countries 9.0 4.6 4.1 2.8 2.8 3.1 3.9 3.2 3.6
Asia 4.9 0.1 1.9 1.2 0.7 2.2 3.2 3.0 3.3
Korea 5.8 1.2 2.5 3.3 3.4 3.5 3.4 3.5 4.2
China -1.2 -1.0 1.0 -0.1 -0.5 2.7 3.3 2.1 3.2
Latin America 15.4 12.5 8.4 5.3 6.4 5.0 5.6 3.7 4.2
Mexico 17.3 13.5 8.7 5.1 5.3 3.9 5.3 3.1 3.8
Brazil 2.0 8.4 6.4 7.5 10.7 11.5 7.2 6.3 5.1
___________________________________________________________________________________________________
1. Foreign GDP aggregates calculated using shares of U.S. exports.
2. Harmonized data for euro area from Eurostat.
3. Foreign CPI aggregates calculated using shares of U.S. non-oil imports.
4. CPI excluding mortgage interest payments, which is the targeted inflation rate.

I-42
Class II FOMC August 4, 2005
Restricted (FR)
OUTLOOK FOR FOREIGN REAL GDP AND CONSUMER PRICES: SELECTED COUNTRIES
(Percent changes)
______________________________________________________________________________________________________________
----------------- Projected ---------------
2004 2005 2006
----------------------- ----------------------- -----------------------
Measure and country Q1 Q2 Q3 Q4 Q1 Q2 Q3 Q4 Q1 Q2 Q3 Q4
______________________________________________________________________________________________________________
REAL GDP (1) -------------------- Quarterly changes at an annual rate ------------------
------------
Total foreign 4.8 3.7 2.8 3.3 2.7 3.1 3.3 3.4 3.4 3.3 3.3 3.3
Industrial Countries 3.1 3.1 1.9 1.5 2.2 1.9 2.5 2.6 2.6 2.4 2.5 2.5
of which:
Canada 2.6 5.0 3.5 2.1 2.3 2.7 3.4 3.6 3.6 3.1 3.3 3.2
Japan 5.2 -0.6 -1.0 0.2 4.9 1.2 1.3 1.5 1.5 1.6 1.7 1.7
United Kingdom 3.8 3.4 1.4 2.2 1.5 1.5 1.8 1.8 1.8 1.9 2.0 2.1
Euro Area (2) 2.6 1.8 1.1 0.6 1.9 1.0 1.5 1.6 1.6 1.6 1.7 1.7
Germany 1.7 0.8 -0.2 -0.5 4.2 0.3 1.1 1.2 1.2 1.2 1.3 1.4
Developing Countries 7.3 4.6 4.1 5.8 3.5 4.7 4.6 4.6 4.5 4.5 4.5 4.5
Asia 8.1 4.6 5.1 6.0 4.5 5.8 5.2 5.1 5.1 5.1 5.1 5.1
Korea 2.6 2.4 3.3 3.8 1.5 5.0 3.2 3.5 3.5 3.5 3.5 3.5
China 13.8 3.7 9.1 11.8 12.7 5.0 7.9 7.4 7.3 7.3 7.3 7.3
Latin America 6.7 4.5 4.0 5.3 2.2 3.6 3.8 3.9 4.0 4.0 4.0 4.0
Mexico 5.8 4.2 4.0 5.4 1.7 3.6 3.8 4.0 4.1 4.1 4.1 4.1
Brazil 7.5 4.3 5.1 1.7 1.3 2.5 2.5 2.5 2.5 2.5 2.5 2.5
CONSUMER PRICES (3)
------------------- --------------------------- Four-quarter changes --------------------------
Industrial Countries 0.9 1.5 1.5 1.8 1.4 1.4 1.5 1.3 1.6 1.5 1.5 1.5
of which:
Canada 0.9 2.2 2.0 2.3 2.1 1.9 2.1 1.9 2.1 2.0 2.1 2.1
Japan -0.3 -0.2 -0.1 0.4 -0.4 -0.4 -0.3 -0.7 -0.1 0.1 0.2 0.2
United Kingdom (4) 1.2 1.5 1.3 1.4 1.7 1.9 2.2 2.2 2.1 2.0 1.9 1.9
Euro Area (2) 1.7 2.3 2.3 2.3 2.0 2.0 2.2 2.1 2.2 1.9 1.7 1.7
Germany 1.0 1.9 2.0 2.1 1.7 1.6 1.6 1.5 1.9 1.6 1.5 1.5
Developing Countries 3.1 3.6 4.5 3.9 3.5 3.3 3.0 3.2 3.5 3.8 3.7 3.6
Asia 2.4 3.3 4.2 3.2 2.9 2.4 2.3 3.0 3.2 3.6 3.4 3.3
Korea 3.2 3.4 4.3 3.4 3.1 3.0 2.6 3.5 4.0 4.5 4.5 4.2
China 3.0 4.3 5.2 3.3 2.8 1.7 1.4 2.1 2.3 3.2 3.2 3.2
Latin America 4.7 4.6 5.2 5.6 4.9 5.0 4.4 3.7 4.1 4.1 4.2 4.2
Mexico 4.3 4.3 4.8 5.3 4.4 4.5 3.9 3.1 3.7 3.7 3.8 3.8
Brazil 6.8 5.5 6.8 7.2 7.4 7.7 6.6 6.3 5.7 5.1 5.3 5.1
______________________________________________________________________________________________________________
1. Foreign GDP aggregates calculated using shares of U.S. exports.
2. Harmonized data for euro area from Eurostat.
3. Foreign CPI aggregates calculated using shares of U.S. non-oil imports.
4. CPI excluding mortgage interest payments, which is the targeted inflation rate.

I-43
Class II FOMC August 4, 2005
Restricted (FR)
OUTLOOK FOR U.S. INTERNATIONAL TRANSACTIONS
________________________________________________________________________________________________________________
Projected
1998 1999 2000 2001 2002 2003 2004 2005 2006
________________________________________________________________________________________________________________
NIPA REAL EXPORTS and IMPORTS
Percentage point contribution to GDP growth, Q4/Q4
Net Goods & Services -1.1 -1.0 -0.9 -0.2 -0.9 -0.1 -0.9 0.1 -0.4
Exports of G&S 0.3 0.6 0.7 -1.3 0.4 0.6 0.6 0.9 0.6
Imports of G&S -1.4 -1.6 -1.6 1.1 -1.3 -0.7 -1.5 -0.8 -1.0
Percentage change, Q4/Q4
Exports of G&S 2.6 5.6 6.5 -11.9 3.8 6.0 6.1 8.6 5.5
Services 4.4 5.3 1.8 -8.9 10.2 4.5 4.6 7.4 4.9
Computers 7.3 13.4 22.7 -23.5 -1.1 11.0 6.3 18.1 14.4
Semiconductors 9.5 34.6 27.6 -34.6 10.1 38.8 -6.1 12.1 17.0
Other Goods 1/ 1.2 3.3 5.9 -10.2 0.7 4.5 7.8 8.5 4.8
Imports of G&S 11.0 12.1 11.2 -7.6 9.7 5.1 10.6 4.9 5.9
Services 10.4 6.6 10.6 -5.9 8.8 4.2 7.7 5.6 4.0
Oil 4.1 -3.4 13.3 3.7 3.8 1.5 9.7 -7.7 0.7
Computers 26.4 26.0 13.9 -13.6 13.2 16.8 22.2 14.0 17.5
Semiconductors -7.7 34.2 22.8 -51.1 11.0 -0.2 9.4 7.9 17.0
Other Goods 2/ 11.2 12.9 10.5 -6.5 10.1 5.1 10.5 6.3 6.5
Billions of Chained 2000 Dollars
Net Goods & Services -203.7 -296.2 -379.5 -399.1 -471.3 -521.4 -601.3 -620.2 -645.8
Exports of G&S 966.5 1008.2 1096.3 1036.7 1013.3 1031.2 1117.9 1206.8 1283.8
Imports of G&S 1170.3 1304.4 1475.8 1435.8 1484.6 1552.6 1719.2 1827.0 1929.6
________________________________________________________________________________________________________________
Billions of dollars
US CURRENT ACCOUNT BALANCE -214.1 -300.1 -416.0 -389.5 -475.2 -519.7 -668.1 -807.2 -928.8
Current Acct as Percent of GDP -2.4 -3.2 -4.2 -3.8 -4.5 -4.7 -5.7 -6.5 -7.1
Net Goods & Services (BOP) -165.0 -263.4 -378.3 -362.7 -421.2 -494.8 -617.6 -709.0 -781.9
Investment Income, Net 8.8 19.1 25.7 30.3 15.5 51.8 36.2 5.9 -40.1
Direct, Net 65.5 78.2 94.9 115.9 99.8 121.8 127.9 134.8 145.8
Portfolio, Net -56.7 -59.1 -69.2 -85.5 -84.3 -70.0 -91.7 -128.9 -185.9
Other Income & Transfers,Net -57.9 -55.8 -63.5 -57.1 -69.5 -76.7 -86.7 -104.2 -106.8
________________________________________________________________________________________________________________
1. Merchandise exports excluding computers and semiconductors.
2. Merchandise imports excluding oil, computers, and semiconductors.

I-44
Class II FOMC August 4, 2005
Restricted (FR)
OUTLOOK FOR U.S. INTERNATIONAL TRANSACTIONS
___________________________________________________________________________________________________________________________
2001 2002 2003
---------------------------- ---------------------------- ---------------------------
Q1 Q2 Q3 Q4 Q1 Q2 Q3 Q4 Q1 Q2 Q3 Q4
___________________________________________________________________________________________________________________________
NIPA REAL EXPORTS and IMPORTS
Percentage point contribution to GDP growth
Net Goods & Services -0.0 0.5 -0.6 -0.7 -1.0 -0.6 -0.5 -1.5 0.1 -0.7 0.5 -0.5
Exports of G&S -0.6 -1.4 -2.0 -1.1 0.5 1.0 0.3 -0.3 -0.3 -0.2 1.0 1.7
Imports of G&S 0.6 1.9 1.5 0.5 -1.4 -1.6 -0.8 -1.2 0.4 -0.5 -0.6 -2.2
Percentage change from previous period, s.a.a.r.
Exports of G&S -5.3 -12.7 -18.2 -10.8 5.2 10.6 2.9 -3.1 -2.9 -2.1 11.5 19.1
Services -5.0 -0.7 -13.7 -15.3 22.9 2.7 4.6 11.7 -11.9 -6.6 17.2 23.7
Computers -9.8 -35.7 -24.9 -21.3 -21.1 14.7 -6.0 12.6 -5.7 0.2 35.9 18.2
Semiconductors -30.0 -54.0 -45.3 3.7 22.3 42.1 12.6 -25.0 34.8 33.9 43.7 43.2
Other Goods 1/ -2.5 -11.5 -17.6 -8.6 -1.6 12.5 2.0 -9.1 0.0 -2.0 5.5 15.4
Imports of G&S -3.7 -12.6 -10.3 -3.4 11.7 12.5 5.7 9.0 -2.5 3.3 4.1 16.5
Services -5.0 12.8 -18.3 -10.4 24.7 -3.0 1.7 14.0 -2.2 -10.2 21.4 10.7
Oil 63.6 -33.8 -28.2 48.9 -9.8 -10.3 -12.7 64.3 -9.0 7.8 -1.3 9.5
Computers -22.6 -23.3 -13.4 8.4 52.2 5.3 2.8 -0.2 11.5 12.4 8.7 36.4
Semiconductors -43.9 -70.1 -55.4 -23.7 39.8 34.8 -6.2 -14.0 -6.7 1.5 -3.7 8.9
Other Goods 2/ -5.5 -10.6 -3.7 -5.9 7.6 19.4 9.5 4.3 -2.6 5.8 0.7 17.7
Billions of Chained 2000 Dollars, s.a.a.r.
Net Goods & Services -398.2 -385.2 -398.4 -414.5 -441.3 -458.9 -472.2 -513.0 -510.7 -528.4 -516.2 -530.2
Exports of G&S 1097.2 1060.6 1008.7 980.3 992.8 1018.0 1025.2 1017.2 1009.7 1004.5 1032.2 1078.4
Imports of G&S 1495.4 1445.8 1407.1 1394.9 1434.0 1476.9 1497.4 1530.2 1520.4 1532.9 1548.4 1608.6
___________________________________________________________________________________________________________________________
Billions of dollars, s.a.a.r.
US CURRENT ACCOUNT BALANCE -430.4 -393.6 -371.4 -362.4 -440.4 -477.1 -480.3 -503.0 -546.6 -515.2 -515.9 -501.0
Current Account as % of GDP -4.3 -3.9 -3.7 -3.5 -4.3 -4.6 -4.6 -4.7 -5.1 -4.8 -4.7 -4.5
Net Goods & Services (BOP) -389.0 -355.8 -357.1 -349.0 -372.7 -413.8 -430.3 -467.9 -499.3 -491.4 -490.8 -497.7
Investment Income, Net 24.7 31.3 3.3 62.1 11.4 1.8 14.1 34.5 29.3 50.6 50.9 76.5
Direct, Net 106.2 116.1 95.0 146.2 100.5 91.4 95.0 112.2 102.3 117.4 119.9 147.8
Portfolio, Net -81.5 -84.7 -91.7 -84.2 -89.2 -89.6 -80.9 -77.7 -72.9 -66.8 -69.0 -71.3
Other Inc. & Transfers, Net -66.0 -69.1 -17.6 -75.5 -79.0 -65.1 -64.2 -69.6 -76.6 -74.4 -76.0 -79.7
___________________________________________________________________________________________________________________________
1. Merchandise exports excluding computers and semiconductors.
2. Merchandise imports excluding oil, computers, and semiconductors.

I-45Last Page
Class II FOMC August 4, 2005
Restricted (FR)
OUTLOOK FOR U.S. INTERNATIONAL TRANSACTIONS
___________________________________________________________________________________________________________________________
------------------- Projected ---------------------
2004 2005 2006
---------------------------- ---------------------------- ---------------------------
Q1 Q2 Q3 Q4 Q1 Q2 Q3 Q4 Q1 Q2 Q3 Q4
___________________________________________________________________________________________________________________________
NIPA REAL EXPORTS and IMPORTS
Percentage point contribution to GDP growth
Net Goods & Services -1.2 -1.4 -0.2 -1.0 -0.4 1.4 -0.1 -0.5 -0.6 -0.0 -0.2 -0.7
Exports of G&S 0.5 0.7 0.5 0.7 0.7 1.2 0.7 0.8 0.5 0.6 0.6 0.7
Imports of G&S -1.7 -2.0 -0.7 -1.7 -1.1 0.2 -0.8 -1.4 -1.1 -0.6 -0.8 -1.4
Percentage change from previous period, s.a.a.r.
Exports of G&S 5.0 6.9 5.5 7.1 7.5 12.3 6.9 7.9 4.7 5.6 5.4 6.4
Services -0.4 4.8 -0.6 15.5 12.5 8.4 4.4 4.6 4.6 4.8 5.0 5.2
Computers -7.4 1.6 21.7 11.5 12.6 32.0 14.3 14.3 14.4 14.4 14.4 14.4
Semiconductors 7.0 -4.8 -19.4 -5.5 -12.9 32.4 17.0 17.0 17.0 17.0 17.0 17.0
Other Goods 1/ 8.6 9.2 9.5 3.8 6.1 12.1 7.1 8.7 3.6 4.9 4.5 6.0
Imports of G&S 12.0 14.5 4.7 11.3 7.4 -1.2 5.0 8.6 6.8 3.6 4.7 8.4
Services 10.0 13.7 4.6 3.1 3.7 7.1 5.9 5.5 4.1 4.0 3.9 3.9
Oil 35.7 -26.0 -0.5 45.0 3.4 -28.7 -13.2 13.7 6.9 -13.8 -7.8 21.1
Computers 21.2 34.3 25.3 9.5 11.3 10.1 17.3 17.3 17.5 17.5 17.5 17.5
Semiconductors 42.6 20.2 4.7 -20.3 -7.9 7.5 17.0 17.0 17.0 17.0 17.0 17.0
Other Goods 2/ 8.4 20.4 4.0 9.7 9.1 1.3 7.3 7.6 6.6 6.2 6.5 6.5
Billions of Chained 2000 Dollars, s.a.a.r.
Net Goods & Services -563.0 -601.7 -606.5 -634.1 -645.4 -605.7 -607.6 -622.1 -638.7 -638.2 -643.3 -662.8
Exports of G&S 1091.8 1110.2 1125.0 1144.5 1165.3 1199.5 1219.5 1243.0 1257.4 1274.6 1291.6 1311.7
Imports of G&S 1654.8 1711.9 1731.5 1778.6 1810.7 1805.2 1827.1 1865.1 1896.0 1912.8 1934.9 1974.6
___________________________________________________________________________________________________________________________
Billions of dollars, s.a.a.r.
US CURRENT ACCOUNT BALANCE -584.4 -666.5 -667.9 -753.4 -780.2 -766.2 -815.0 -867.6 -911.8 -911.9 -931.8 -959.7
Current Account as % of GDP -5.1 -5.7 -5.7 -6.3 -6.4 -6.2 -6.5 -6.8 -7.1 -7.0 -7.0 -7.2
Net Goods & Services (BOP) -555.4 -608.2 -629.9 -676.9 -687.0 -682.6 -717.5 -748.8 -774.8 -774.5 -779.0 -799.3
Investment Income, Net 65.8 29.6 30.8 18.8 20.7 13.4 3.6 -14.1 -22.1 -32.4 -45.8 -60.2
Direct, Net 140.3 116.3 121.4 133.7 125.2 134.3 140.2 139.7 143.8 143.1 146.4 149.9
Portfolio, Net -74.6 -86.7 -90.6 -114.9 -104.4 -120.8 -136.6 -153.8 -165.9 -175.6 -192.2 -210.1
Other Inc. & Transfers, Net -94.7 -88.0 -68.8 -95.3 -113.9 -97.0 -101.0 -104.7 -114.8 -104.9 -107.0 -100.2
___________________________________________________________________________________________________________________________
1. Merchandise exports excluding computers and semiconductors.
2. Merchandise imports excluding oil, computers, and semiconductors.