Embed Size (px)
Citation preview

Prefatory Note
The attached document represents the most complete and accurate version available based on original copies culled from the files of the FOMC Secretariat at the Board of Governors of the Federal Reserve System. This electronic document was created through a comprehensive digitization process which included identifying the best-preserved paper copies, scanning those copies,1 and then making the scanned versions text-searchable.2 Though a stringent quality assurance process was employed, some imperfections may remain.
Please note that this document may contain occasional gaps in the text. These gaps are the result of a redaction process that removed information obtained on a confidential basis. All redacted passages are exempt from disclosure under applicable provisions of the Freedom of Information Act.
1 In some cases, original copies needed to be photocopied before being scanned into electronic format. All scanned images were deskewed (to remove the effects of printer- and scanner-introduced tilting) and lightly cleaned (to remove dark spots caused by staple holes, hole punches, and other blemishes caused after initial printing). 2 A two-step process was used. An advanced optimal character recognition computer program (OCR) first created electronic text from the document image. Where the OCR results were inconclusive, staff checked and corrected the text as necessary. Please note that the numbers and text in charts and tables were not reliably recognized by the OCR process and were not checked or corrected by staff.

Confidential (FR) Class III FOMC
Part 2 May 14, 1998
CURRENT ECONOMICAND FINANCIAL CONDITIONS
Recent Developments
Prepared for the Federal Open Market Committeeby the staff of the Board of Governors of the Federal Reserve System

Confidential (FR) Class III FOMC
May 14, 1998
RECENT DEVELOPMENTS
Prepared for the Federal Open Market Committeeby the staff of the Board of Governors of the Federal Reserve System
_ ~__

DOMESTIC NONFINANCIALDEVELOPMENTS

DOMESTIC NONFINANCIAL DEVELOPMENTS
The remarkable combination of strong growth and low inflation
continued during the first quarter. As expected, net exports
exerted a considerable drag on growth of real GDP, but that was more
than offset by a large rise in domestic demand. Consumption and
home building advanced briskly, and business outlays for equipment
surged once again. Perhaps presaging less robust expansion ahead,
however, inventory investment also picked up further to an
extraordinary pace. The tight labor market has led to a discernible
acceleration in labor compensation over the past year, but the steep
decline in energy prices and the weakness in non-oil import prices
have led to a further deceleration in consumer prices in recent
months.
Real GDP: 1998:Q1
The incoming data since the BEA published its initial estimates
would appear to translate into a full percentage point upward
revision in growth of real GDP. Final sales may be marked down in
the next reading, largely because of weaker outlays for state and
local government construction and a slightly greater decline in net
REAL GDP AND SELECTED COMPONENTS
Real GDP
Final sales
Private domestic final purchasesConsumptionBusiness fixed investmentResidential investment
Federal governmentState and local government
Nonfarm inventory investmentNet exports
1998:01BEA Expected
1997:Q4 adv. revisionPercent change
annual rate3.7 4.2 5.2
2.3 4.1 3.5
2.3 7.7 8.02.5 5.7 5.8
-0.8 17.6 17.79.1 17.6 17.6
-2.3 -8.3 -8.31.8 1.7 0.4
Level, billions ofchained (1992) dollars
64.5 67.0 92.9-159.1 -199.7 -208.0
II-1

II-2
CHANGES IN EMPLOYMENT(Thousands of employees; based on seasonally adjusted data)
1996 19971997 1998
03 04 011998
Feb. Mar. Apr.
Nonfarm payroll employment 1
PrivateGoods Producing
ManufacturingConstruction
Service ProducingTransportation and utilitiesTradeFinance, insurance, real estateServices
Help supply servicesTotal government
Private nonfarm production workers 1
Manufacturing production workers
--- Average212 267198 24619 38-5 1924 19
178 2089 16
60 6011 1698 11613 1014 21
168 198-5 14
monthly changes---2452201912
7201136316
1095
25
358339754035
2652
9823
1423219
161 2739 32
211197
281415
169272122991015
25922835
135
193282820
1175731
-24-26-95
-7-856915
-122838
-212
145 271 -46 1208 2 -9 -15
Total employment 2Monagricultural
Memo;Aggregate hours of private production
workers (percent change) 1- 3
Average workweek (hours) 1
Manufacturing (hours)
232 240 123 339 72 80 -169 389226 243 112 351 157 65 33 171
2.934.441.5
3.034.642.0
1.634.541.8
4.534.642.1
4.834.842.0
0.634.942.0
-0.734.741.8
-0.434.440.7
ote. Average change fran final month of preceding period to1. Suavey of establihmeans.2. Sarrey of households.
final ronth of period indicated.
3. Annual data are percent change from Q4 to Q4. Quarterly data are percent change from preceding periodat an annual rate. Monthly data are percent cbange from preceding maoth.
Average Weekly HoursHours
S- 35.2
Experimental 35
- - 34.8
a V 34.6.~, . .. .. .Apr.
SIf
Published - 34.2
34
1995 1996
26224321
-1035
222-25530
1393019
1993 1994 19981997

II-3
exports. However, the March inventory reports came in much stronger
than the BEA had assumed, contributing to a $26 billion upward
revision to nonfarm inventory investment. The principal piece of
information that the BEA will receive prior to its next estimate of
first-quarter real GDP is the international trade data for March.
Labor Market Developments
Recent data suggest that labor demand remains robust. Nonfarm
payroll employment rose 262,000 in April, and even with a decline in
March of 24,000, growth of payroll employment has averaged 224,000
per month so far this year. Moreover, the still-low level of
initial claims for unemployment insurance in recent weeks provides
little hint of moderation.
In several areas, employment gains in April likely represented
rebounds from below-trend March levels. Specifically, bad weather
during the March survey reference week seemed to have depressed
employment in construction, which rebounded 35,000 in April, and at
eating and drinking places, which jumped 33,000. Nonetheless,
employment increased solidly in a number of other industries.
Strong gains at help supply and computer services firms contributed
to a rise of 139,000 in services, and jobs in the finance and real
estate industry rose another 30,000. In contrast, manufacturing
employment fell 10,000 in April, for a third consecutive month of
relative weakness.
As published, aggregate weekly hours of production or
nonsupervisory workers on private nonfarm payrolls declined in April
for a second month. However, last month's change was distorted by
the length-of-pay-period problem in the measurement of the workweek
as well as by difficulties in seasonally adjusting hours in
manufacturing for the Easter holiday. Based on the BLS's
experimental corrected workweek series, which adjusts for these two
factors, aggregate hours rose 0.7 percent in April to stand
0.3 percent (not at an annual rate) above their first-quarter
average.
In the household report, the unemployment rate plunged
0.4 percentage point in April, to 4.3 percent, after having held at
around 4-3/4 percent since November. Declines were registered for
most demographic and education groups. Even the rate for married
men with a spouse present--a series that is a less noisy indicator
1. Details on the length-of-pay-period problem and its effects onvarious labor market data series are given in the appendix.

II-4
SELECTED EMPLOYMENT AND LABOR FORCE PARTICIPATION RATES 1
(Percent; based on seasonally adjusted data, as published)
1997 1998 19981996 1997 Q3 Q4 Q1 Feb. Mar. Apr.
Civilian unemployment rate(16 years and older)
TeenagersMen, 20 years and olderWomen, 20 years and older
Labor force participation rate
TeenagersMen, 20 years and olderWomen, 20 years and older
Women maintaining families
1. Data for 1998 are not coparableAen=oducd by the Bzs in Ganuazy
Unemployment Rate*
5.4 4.9 4.9 4.7 4.7 4.6 4.7 4
16.7 16.0 16.3 15.0 14.6 14.7 15.0 134.6 4.2 4.1 4.0 3.8 3.8 3.9 34.8 4.4 4.3 4.0 4.3 4.3 4.3 4
66.8 67.1 67.1 67.1 67.3 67.3 67.2 67
52.3 51.6 51.1 51.4 53.3 53.3 53.5 5176.8 76.9 76.9 76.9 76.9 76.9 76.7 7659.9 60.5 60.6 60.5 60.6 60.6 60.7 60
65.3 67.4 68.0 68.2 67.9 68.3 66.8 67
with ealier year because of a etrhodological change1998.
Percent of Population Not in theLabor Force Who Want Jobs*
Percent Percent
.3
.1.4.1
.0
.. 8;.9'.3
'.3
1994 1995 1996 1997 1998 1994 1995 1996 1997Note. Seasonally adjusted by FRB staff.
Labor Force Participation Rate*
1998
PercentS6B
67.5
Apr. 67
66.5
- 6619981990 1992 1994 1996
Data after January 1998 are not strictly comparable to data before January 1998 due to methodological changesintroduced by the BLS.

II-5
Labor Market IndicatorsInitial Claims for Unemployment Insurance
Thousands
1993 1994 1995 1996 1997 1998
Note. State programs, includes EUC adiustment.
Reporting Positions Hard to FillPercent
Current Job AvailabilityPercent of households
1988 1990 1992 1994 1996 1998 1988 1990 1992 1994 1996 1998
Help Wanted IndexIndex, 1990=100
Expected Change in Unemployment
1988 1990 1992 1994 1996 1998
Note. Percentage expecting "more' minus percentage expecting'less' plus 100.
Index
1988 1990 1992 1994 1996 1998
Note. Series has been adjusted to take account of structural andirstitutional changes, including consolidation of newspaper industryand tendency to increase hiring through personnel supply agencies.

II-6
Change, annual rate
- Adjusted for length of pa-- *Ptulshed
1988 1989 1990 19
Four-quarter change
- Adjusted for length of p--- Published
Productivity Growth(Nontarm business sector)
Percent10
y period8
6
4
0
-2
4
6
91 1992 1993 1994 1995 1996 1997
Percent- 6
ay period
4
I2
-2----- ---- 1 -------- 1 --- I ------ --- : 02I I II ~
1988 1989 1990 1991 1992 1993 1994 1995 1996 1997

II-7
than the aggregate rate--fell 0.3 percentage point to its lowest
level (2.2 percent) since 1973. The labor force participation rate
also dropped back in April, from 67.2 percent to 67.0 percent,
primarily because participation among teenagers--which is volatile
from month to month--stepped down from its high level during the
first quarter.
Other indicators of labor market activity lately have been
consistently upbeat. In April, the index of the expected change in
unemployment from the Michigan Survey Research Center survey moved
to its most favorable reading since 1984. In the Conference Board
survey, perceptions of current employment conditions deteriorated a
bit in April but remained extremely positive, while consumers'
expectations for employment conditions six months hence improved.
The National Federation of Independent Businesses survey indicated
that the percentage of small businesses reporting vacancies "hard to
fill" rose one point, to 29 percent, in April. Although somewhat
dated, the Conference Board's index of help wanted advertising held
steady in March, well above its level one year earlier.
As published, productivity in the nonfarm business sector rose
at an annual rate of just 0.2 percent in the first quarter,
reflecting a 5.3 percent increase in output and a 5.0 percent
increase in hours. As mentioned above, however, the estimates of
the workweek that underlie the published hours numbers have not yet
been corrected for the length-of-pay-period problem. 2 Using the
BLS's corrected hours estimates, productivity rose 1.6 percent in
the first quarter. Incorporating the expected revisions to output
and using the corrected hours estimates, productivity rose
2.6 percent over the four quarters ended in 1998:Q1, compared with
1.2 percent over the previous four quarters.
Industrial Production
Industrial activity has decelerated sharply from the rapid pace
of the second half of last year: On the basis of production hours
and available physical product data, the staff estimates that
industrial production rose slightly in April following a weak first
2. Although the BLS in June will revise the historical hoursseries to account for the workweek reporting problems at the sametime it issues its rebenchmarked series, the productivity data willnot be revised until August. At that time, the published quarterlypatterns for productivity from 1989 through the first quarter of1998 will change not only because of the updated information onhours, but also because of the incorporation of the annual revisionto the output series.

II-8
quarter. Some of the slowdown so far this year was attributable
to unusually warm weather that damped utility output. More
important, manufacturing growth slowed considerably: The staff
believes that manufacturing output rose moderately in April
following small declines in February and March.
Although motor vehicle assemblies picked up a bit in April, the
deceleration in manufacturing so far this year had been exacerbated
by the direct and indirect effects of a slower pace of motor vehicle
production. Production was boosted temporarily in the latter part
of 1997 to make up for shortfalls that occurred last spring and
summer; since peaking in November, motor vehicle assemblies have
dropped back 0.9 million units, to 12.2 million units at an annual
rate in April. Even with this slowdown in production, inventories
were a little on the high side in March and April, especially for
PRODUCTION OF DOMESTIC AUTOS AND TRUCKS(Millions of units at an annual rate; FRB seasonal basis)
1998 1997 1998Feb. Mar. Apr. Q4 Q1 Q2
Sched.U.S. production 12.0 11.8 12.2 12.7 12.1 12.4
Autos 5.4 5.3 5.5 5.9 5.5 5.6Trucks 6.6 6.5 6.7 6.7 6.5 6.7
Days' supplyAutos 62.7 64.5 61.3 60.1 64.5 ...Light trucks 75.2 74.9 74.6 70.6 74.9
Note. Components may not sum to totals because of rounding.
3. The staff estimate of growth in manufacturing productionworker hours in April is 2.2 percentage points higher than BLS'sestimate because of differences in the April seasonal adjustmentfactors. The differences arose because the BLS seasonal adjustmentprocedures assume that Easter affects hours paid only when GoodFriday lands in the Sunday-to-Saturday pay period containing the12th of April. This year, with Easter on April 12, Good Fridaypreceded the Sunday-to-Saturday pay period of April 12 to 18. Incontrast to the BLS's procedures, the staff seasonal adjustmentprocedure allows for other Easter effects, two of which occurredthis year. First, some firms, such as those in the motor vehicleindustry, have Monday-to-Sunday pay periods, and Good Friday fell intheir survey week. Second, some firms may be affected by a holidayfor Easter Monday. On the basis of statistical analysis of changesin the workweek in past years, the staff estimates that the GoodFriday and Easter Monday effects reduced actual manufacturingproduction worker hours in April about 1.6 percent.

II-9
light trucks. In response, the Big Three have stepped up sales
incentives this quarter, as discussed later in the section on
consumer spending.
Evidence is mounting that some of the slackening in production
is attributable to the Asian crisis, although showing direct causal
relationships at the industry level is difficult. The May Beige
Book reported reduced Asian exports and increased competition from
Asian firms for a variety of industries, particularly metals,
industrial machinery, high technology equipment, apparel, paper, and
chemicals. Production in the chemical industry has recently
slowed, and the inventory-to-sales ratio has risen to the highest
level since 1991. Output in the semiconductor industry also appears
to have decelerated noticeably in recent months. Manufacturers of
semiconductor equipment have been affected by the Asian crisis:
Several Asian firms have cancelled or pushed back orders for this
equipment, and a survey by the industry trade association indicates
that manufacturers expect orders to decline 12 percent this year.
NEW ORDERS FOR DURABLE GOODS(Percent change from preceding period, seasonally adjusted)
Share, 1997 19981997:H2 Q4 Q1 Jan. Feb. Mar.
Total durable goods 100.0 2.0 -.9 1.6 -.9 .5
Adjusted durable goods 1 69.0 -.1 .9 -.6 1.6 .5
Computers 5.0 -3.5 13.4 3.7 3.7 4.1Nondefense capital goods
excluding aircraftand computers 17.0 -.6 2.3 2.4 2.3 -1.1
Other 47.0 .8 -.7 -1.9 2.0 -.4
Memo: 2Real adjusted orders .. .6 2.2 -.1 2.0 1.1
1. Orders excluding defense capital goods, nondefense aircraft,and motor vehicle parts.
2. Nominal adjusted durable goods orders were split into threecomponents: computers, electronic components, and all other. Thesecomponents were deflated and then aggregated in a chain-weightedfashion.
4. In addition, NAPM surveys have indicated that the percentageof manufacturers reporting declines in export orders has exceededthe percentage reporting increases so far this year.

Indicators of Future Production
Diffusion index Percent
Purchasing Managers orders (left scale)
1991 1992 1993 1994 1995 1996 1997 1998
Contracts for Industrial Buildings(Six-month moving average)
Index, Dec. 1989=100, ratio scale
Capital Expenditure PlansSemiannual NAPM
Diffusion Index
December survey
I /1/
May survey
1990 1992 1994 1996 1998 1992 1995 1998

Leading indicators of industrial production point to moderate
growth over the next few months. The staff's estimate of real
adjusted durable goods orders advanced 2.2 percent (not at an annual
rate) in the first quarter, 1.6 percentage points faster than in the
fourth quarter of last year. The new orders index from the National
Association of Purchasing Management also turned up in recent
months, while the new orders index from the Dun & Bradstreet
Manufacturing Survey remains at a high level (chart).
Recent indicators suggest that manufacturers may have scaled
back their capacity expansion plans. The six-month moving average
of contracts for industrial buildings has fallen from the high level
reached last summer (chart). Also, according to a semiannual NAPM
survey released this month, a substantially smaller percentage of
manufacturers are planning to increase capital spending in 1998 than
were planning such an increase in December (chart).
Consumption and Personal Income
Growth in consumer spending has remained strong, and the
fundamentals continue to be highly favorable. Real income gains
have been robust this year, household net worth has soared further,
and consumer sentiment continues to hover near record levels.
The only household spending data available for the second
quarter are for goods. Nominal sales in the retail control
category, which excludes sales at automotive dealers and building
material and supply stores, increased 0.4 percent in April. Nominal
outlays rose in all major nondurable goods components. However,
sales moved lower at stores selling furniture and appliances and
"other durable goods." On the basis of retail sales and CPI
reports, the staff estimates that real personal consumption
expenditures for goods excluding motor vehicles increased 0.4
percent in April to a level 0.9 percent above that in the first
quarter.
In April, light vehicle sales (adjusted for shifts in reporting
periods) rose 200,000 units, to nearly 15-1/2 million units (annual
rate). The increase was concentrated in sales at the Big Three and
likely reflected, in part, the effects of a sharp increase in
incentives (chart). In response to concerns about inventories and
market share, the Big Three initiated a "coupon" program that runs
to the beginning of July and offers discounts of between $500 and
$1,000 per vehicle to original owners who still drive a Big Three
vehicle. The combination of aggressive pricing and strong gains in

II-12
RETAIL SALES(Percent change; seasonally adjusted)
1997 1998 1998
04 01 Jan. Feb. Mar. Apr.
Total sales .2 2.0 1.0 .9 .0 .5Previous estimatel 1.9 .7 -.0
Building materialsand supplies 1.3 5.5 4.0 1.2 .0 1.6
Automotive dealers -.2 2.2 -.3 1.D -.1 .7
Retail control2 .2 1.6 1.2 .8 .0 .4Previous estimatel 1.5 .6 .3
Durable goods 2.0 3.9 3.2 .4 -1.1 -.4Furniture and appliances 1.7 4.8 3.3 .0 -. 5 -.4Other durable goods 2.1 3.1 3.1 .8 -1.5 -.4
Nondurable goods -.2 1.1 .8 .9 .2 .6Apparel -. 8 4.0 2.8 1.3 .0 1.3Food .3 .1 -. 3 .8 .5 .4General merchandise .9 2.9 1.9 1.5 .2 .8Gasoline stations -.7 -5.0 -2.1 -1.4 -1.3 .1Drug stores .7 2.4 2.2 .8 -.2 1.2Other nondurable goods -1.1 2.0 1.3 1.2 .6 .5
1 Reflects revised retail sales data released on May 1.2. Total retail sales less sales
stores and automotive dealers, except autostores.
Real Disposable Personal income(change, 04 to 04)
at building material supplyand home supply
Ratio of Net Worth to Disposable incomeRatio
1987 1989 1991 1993 1995 1997 1987 1989 1991 1993 1995 1997

II-13
SALES OF AUTOMOBILES AND LIGHT TRUCKS(Millions of units at an annual rate; FRB seasonals)
1997 1998 1998
1996 1997 Q3 Q4 Q1 Feb. Mar. Apr.
Total 15.1 15.1 15.3 15.3 14.8 15.0 15.0 15.4Adjustedi 15.0 15.1 15.3 15.0 15.1 14.9 15.2 15.4
Autos 8.5 8.3 8.4 8.2 7.8 8.0 8.0 8.2Light trucks 6.6 6.9 6.9 7.1 7.0 7.0 7.1 7.3
North American2 13.4 13.2 13.3 13.3 12.9 12.9 13.2 13.5Autos 7.3 6.9 7.1 6.8 6.5 6.6 6.6 6.8
Big Three 5.3 4.9 5.1 4.8 4.6 4.7 4.7 4.9Transplants 2.0 2.0 2.0 2.0 1.9 1.9 1.9 1.9
Light trucks 6.1 6.3 6.3 6.5 6.4 6.3 6.5 6.6
Foreign produced 1.7 1.9 2.0 2.0 1.9 2.1 1.9 2.0Autos 1.3 1.4 1.4 1.4 1-3 1.4 1.3 1.4Light trucks .4 .6 .6 .6 .6 .6 .6 .6
Note. Components may not sum to totals because of rounding. Data on salesof trucks and imported autos for the most recent month are preliminary.
1. Excludes the estimated effect of automakers' changes in reporting periods.2. Excludes some vehicles produced in Canada that the industry classifies as
imports
New Car and Light Truck Incentives
1992 dollars per vehicle1600
1400
1200
1000
800
600
400
Buying Attitudes for New Vehicles(3-month moving average)
Michigan Survey Index
1991 1993 1995 1997
160
150
140
130
120
110
1001991 1993 1995 1997
Nole. Incentve data trom J D. Powers. defated by CPI for alt tems

II-14
REAL PCE SERVICES(Percent change from the preceding period)
1997 1998 1998
1997 Q3 Q4 Q1 Jan. Feb. Mar.
Q4/Q4 ----- Annual rate ------ Monthly rate ---
PCE Services 4.0 3.9 4.4 3.5 .2 .1 .6
Energy -. 6 -6.6 4.4 -17.1 -6.7 -. 2 9.6
Non-energy 4.2 4.4 4.4 4.5 .5 .1 .3Housing 2.1 2.0 2.1 2.4 .3 .1 .2Household operation 5.2 8.3 7.2 7.3 .9 .6 .3Transportation 5.0 6.1 5.6 3.7 -. 4 .3 .1Medical 2.8 3.1 1.5 1.3 -. 1 .1 .0Recreation 7.8 4.8 10.9 13.6 2.5 -. 5 .2-Personal business 6.8 7.5 7.8 7.5 1.0 .2 .5Other 6.4 5.4 6.9 6.7 .9 -. 2 .9
Note. Derived from billions of chained (1992) dollars.
PERSONAL INCOME(Average monthly percent change)
1997 1998 1998
1997 Q4 Q1 Jan. Feb. Mar.
Q4/Q4 Annual rate --- Monthly rate ---
Total personal income 6.0 6.3 6.6 .5 .6 .3
Wages and salaries 7.1 8.9 8.8 .7 .9 .2Private 7.8 10.1 9.6 .8 1.0 .2
Other labor income 3.0 3.6 3.6 .3 .3 .3
Less: Personal tax andnontax payments 10.8 10.0 4.1 -. 4 1.0 .0
Equals: Disposablepersonal income 5.2 5.7 7.1 .7 .6 .4
Memo:Real disposable incomet 3.7 4.5 6.8 .7 -5 .4Saving rate (percent) 3.9 3.9 4.2 4.1 4.4 4.2
1. Derived from billions of chained (1992) dollars.

II-15
income and wealth kept consumer attitudes toward new vehicle
purchases at a high level in April (chart).
Real outlays for services rose 3-1/2 percent at an annual rate
in the first quarter. Spending for recreation services picked up
noticeably, and brisk activity in the stock market helped to boost
brokerage services--a component of personal business services.
However, warmer-than-average temperatures held down expenditures for
energy last quarter. Temperatures in April were about average, and
if this pattern were to continue through May and June, we would
expect to see higher outlays for energy provide a considerable boost
to PCE this quarter.
BEA's advance estimate showed that real disposable personal
income surged 6-3/4 percent at an annual rate in the first quarter,
and the saving rate rose to 4.2 percent. As usually occurs in the
first quarter of the year, the level of the saving rate was
overstated (about 1/4 percentage point) because the BEA does not
seasonally adjust the annual federal government pay increase or
cost-of-living adjustments to federal tax and transfer programs that
take effect each January.5 In addition, the introduction of new
tax provisions under the Taxpayer Relief Act of 1997 held down
personal tax payments in the first quarter--boosting DPI. However,
the unanticipated surge in tax receipts this spring, which is
discussed in the federal government section, points to an upward
revision to NIPA personal income taxes in the first quarter because
BEA spreads the April payments over the entire year. All else
equal, this revision to personal income taxes would lower BEA's
first-quarter estimates of DPI and the saving rate. Turning to
April, the labor market report suggests that real DPI posted another
sizable gain. 6
5. The BEA's practice of introducing these changes in the firstquarter of each year without seasonal adjustment leads to anoverstatement of the saving rate over the first half of the year andan understatement of the saving rate over the second half of theyear.
6. As discussed in the section on labor markets, average weeklyhours in the employment report were likely understated in Aprilbecause of reporting problems associated with the length of payperiods and because of seasonal adjustment difficulties with theEaster holiday. This understatement probably will not carry throughentirely in the estimate of hours used to generate NIPA wage andsalary income because BEA adjusts the BLS data to reflect anestimate of the workweek that likely prevailed over the entiremonth.

II-16
Household IndicatorsNIPA Personal Saving Rate
Percent
1987 1989 1991 1993 1995 1997
Consumer Confidence Expected Inflation*Index
160 rApr. Michigan Survey
.- (-:-: nnfor rnra ifl rr 140 r ":
1987 1989 1991 1993 1995 1997
Expected Nominal Income Growth*n Percent
Michigan Suney
Percent
1987 1989 1991 1993 1995 1997
*Mean over the next 12 months.Expected Real Income Growth*
Percent
FMichigan Survey Apr.(f) 1
1987 1989 1991 1993 1995 1997*Over the next 12 months, 3-month moving average.
1987 1989 1991 1993 1995 1997
-"Over the next 12 months, 3-month moving average.

II-17
Consumers remain extremely upbeat. The Conference Board index
of consumer confidence rose in April. Respondents had somewhat less
favorable appraisals of current business and employment conditions,
but they were considerably more optimistic about business
conditions, jobs prospects, and income gains over the next six
months. The Michigan SRC index of consumer sentiment also rose in
April and remains just a touch below the historical high reached in
February. One factor supporting consumer sentiment appears to be
favorable appraisals of future real income gains, which can be
constructed from survey responses regarding nominal income and
expected inflation. The improved expectations regarding real income
gains reflect the decline in expected inflation, which has been
important for some time, and the more recent improvement in expected
nominal income growth over the coming year.
Housing Markets
The market for single-family housing has expanded rapidly in
recent months. During the first quarter, sales of existing homes
rose to a strong 4.7 million unit annual rate; sales of new
homes were at the highest pace in any quarter except one in the late
1970s. Home sales have been boosted by the continuing improvement
in housing affordability resulting from declining mortgage rates and
rapidly growing employment. Also, the huge increase in financial
wealth no doubt has added to housing demand.
Construction of single-family homes rose 9 percent in the first
quarter, to an annual rate of 1.24 million units, the highest
quarterly average since late 1993. Many analysts had attributed a
large part of the strength of starts in January and February to an
artificial boost from unusually warm weather. However, the weather
7. Each month, the SRC reports the expected nominal incomegrowth over the coming year by the share of respondents in fixedranges. The ranges are 1-4 percent, 5 percent, 6-9 percent,10-24 percent, and 25 percent or more. Expected nominal incomegrowth was generated by weighting the midpoint of each range by therespective share of respondents. The value for the top range wasset at 25 percent. Individuals who assumed that their incomes wouldrise but did not specify a value were given the midpoint of thelowest range (2.5 percent). The SRC does not report a value forthose who expect their incomes to decline, so they were assigned thevalue of -2.5 percent. This construction implies that the change inexpected nominal income growth is a more reliable indicator than thelevel.
8. Existing home sales have also been running quite high relativeto the stock of housing units that are either owner occupied orvacant and for sale; however, this ratio was not as high in thefirst quarter as during the late 1970s.

II-18
Private Housing Activity(Millions of units; seasonally adjusted annual rate)
1997 1998
1_997 Q3 Q4 Q1P Jan.r Feb.r Mar.P
All unitsStarts 1.47 1.45 1.53 1.59 1.55 1.64 1.59Permits 1.44 1.42 1.47 1.58 1.53 1.63 1.58
Single-family unitsStarts 1.13 1.13 1.14 1.24 1.23 1.27 1.24Permits 1.06 1.04 1.07 1.15 1.13 1.16 1.15Adjusted permits 1 1.12 1.10 1.15 1.23 124 1.24 1.22
New home sales .80 .81 .83 .85 .85 .87 .83Existing home sates 4.22 4.25 4.38 4.6B 4.37 4.77 4.89
Multifamily unitsStarts .34 .32 .39 .35 .32 .37 .35Permits .39 .38 .40 .43 .39 .46 .44
Mobile homesShipments .35 .35 .35 n.a. .36 .38 n.a.
Note. p Preliminary. r Revised, n.a. Not available.
1. Adjusted permits equal permit issuance plus total starts outside of permit-issuing areas, and a correction forstarts occurring in permit issuing places, but without a permrt.
Private Housing Starts(Seasonally adjusted annual rate) ili. .
IVsIII4 U n Uls-- 2.4
\1P1 2r~ ~ ir V i Multifamily
V4 ' Mar.
197( 1 979---- I Is 1985- 1997 1 99 I-L-1997 -
1987 1989 1991 1993 1995 1997
i,
1977 1979 1981 1983 1985

II-19
in January and February was also extremely wet, which generally
depresses construction. Furthermore, single-family starts declined
only 2-1/2 percent in March, even though the weather turned colder
than normal and remained unusually wet. The absence of an
appreciable "payback" in March suggests that the strength of single-
family starts in the first quarter may have been due less to the
weather and more to the underlying fundamentals.
Builders appear to have been exercising considerable restraint
with regard to inventories, presumably in an effort to avoid
repeating past episodes of overbuilding. For example, from the
first quarter of 1997 to the first quarter of this year. the average
number of units for sale declined 4 percent, even though sales rose
nearly 4 percent. In terms of the number of months of sales, the
inventory declined from 4.5 months to only 4.1 months, the lowest
quarterly ratio on record. The historically low level of unsold
homes in relation to sales has likely been an additional factor
underlying the increase in single-family starts in the first
quarter.
The combination of strong sales and declining inventories has
been reflected in rising house prices. The rates of increase in the
nominal price indexes for both new (constant-quality) homes and for
repeat sales of existing homes have moved above their respective
averages for the period beginning in the early 1980s but remain
below the upper end of their ranges in recent years (chart, upper10
panel). In real terms, these house prices have also accelerated
9. Part of the decline in inventories reflects adjustments madeby the Census Bureau from mid-1996 to mid-1997 to weed out unitsthat were classified as for sale but that no longer were beingactively marketed. In addition, in recent months builders in someregions have reported difficulty in hiring skilled workers; althoughsuch reports suggest that some of the decline in inventories mayreflect an inability of builders to increase construction as quicklyas they desire, these reports have not been widespread.
10. The chart shows the year-over-year changes in the constant-quality price index for new homes and in the repeat sales index forexisting homes that are smoothed with a four-quarter moving average.Both indexes control for the regional composition of sales and seekto minimize the effects of shifts in the mix of structural featuresof homes sold. However, in addition to changes in the underlyingtrend of house prices, the repeat sales index reflects the neteffect of home improvements, structural deterioration, and changesin neighborhood characteristics between earlier and later dates ofsale; observations that show extremely large increases or decreasesin price are excluded.

II-20
Change in House Prices(Four-quarter moving average of year-to-year percent changes)
NominalPercent
20
18
S16
--44
* -1 12
SRepeat sales of existing homes -
-
0Constant-quality new homes
S12
2 10
- 8
Repeat sales of existing homes 6
S/ I 15 2
is
1-
4 -.\ -Constant-quality new homes V, 2• =,
-- -- 1 - F I- I 6 I
1979 1981 1983 1985 1987 1989 1991 1993 1995 1997
Note: Nominal house price indexes divided by the consumer price index excluding shelter.

II-21
in recent quarters (lower panel); 11 these recent rates of
increase are near the upper end of their ranges in recent years,
although they are still below the levels of the late 1970s and the
mid-1980s. In sum, both nominal and real house prices have risen;
however, the acceleration to date has been modest.
Multifamily housing starts retreated sharply in the first
quarter following a burst of activity in the fourth quarter of 1997,
but they remained above the average pace during 1997. Nonetheless,
starts appear to have been running low relative to permit issuance,
and the stock of unused permits for multifamily units has edged up,
suggesting some potential for construction to rise. Moreover, the
multifamily rental vacancy rate in the first quarter was unchanged
from its level a year earlier, which was the lowest first-quarter
level since 1986.12
Business Fixed Investment
Real business fixed investment rebounded from its fourth-
quarter decline to post an increase of 18 percent at an annual rate
in the first quarter. This expansion was driven by soaring
expenditures on producers' durable equipment, which grew at a 29
percent annual rate, the largest quarterly gain since the fourth
quarter of 1983. Outlays on nonresidential structures, however,
remained depressed. Looking forward, some slowdown from the heady
growth of the first quarter seems likely, although a strong orders
picture and the recent strength in business output point to the
potential for growth to remain at a substantial pace in coming
quarters.
While the first-quarter surge in spending on producers' durable
equipment reflected widespread strength, real outlays on office and
computing equipment again led the way. The first-quarter growth
rate of 93 percent at an annual rate for this category was driven by
the steepest decline in prices in twenty years. A number of factors
contributed to this exceptional price decline. First was Compaq's
decision to cut inventories by moving toward the "channel assembly"
method of production, which involves pushing inventory closer to the
customer by shipping components to resellers, who then assemble them
into a branded computer. This inventory adjustment was facilitated
11. Real house price indexes were calculated by dividing thenominal house price indexes by the consumer price index excludingshelter.
12. Comparisons are made on a same-quarter basis because theseCensus data are not seasonally adjusted.

II-22
Determinants of Equipment SpendingAcceleration of Business OutputPercentage points Percent
2019 5 15 1§7t 1§73 1h 1981 1984 1987 1990 1993 1996
Note. The accelerator is the 8-quarter percent change in buness output less the year-earier B-quarte percent changeReal PDE is the percent change over the most recent tur quarters.
Real Domestic Corporate Cash FlowPercent
1963 1966 1969 1972 1975 1978 1981 1984 1987 1990 1993 1996
Real User Cost of Capital t
Index, 1982:Q4 = 100210
180
150
120
90
60
301963 1966 1969 1972 1975 1978 1981 1984 1987 1990 1993 1996
* Staff estmate.

II-23
BUSINESS CAPITAL SPENDING INDICATORS(Percent change from preceding comparable period;
based on seasonally adjusted data, in current dollars)
1997 1998 1998
Q2 Q3 Q4 Ql Jan. Feb. Mar.
Producers' durable equipment
Shipments of nondefense capital goods 5.5 3.9 -.6 5.3 1.6 1.6 2.2Excluding aircraft and parts 4.1 4.0 .3 4.1 .0 2.5 2.6
Office and computing 2.3 5.5 -2.2 10.5 1.9 3.6 4.2Communications equipment 6.2 7.8 -1.3 4.5 .0 5.3 -.4All other categories 4.3 2.6 1.6 1.6 -.8 1.4 2.8
Shipments of complete aircrafti 23.3 6.7 4.5 n.a. 12.9 -1.0 n.a.
Sales of heavy trucks -1.8 4.7 4.9 3.3 -3.0 2.5 4.8
Orders of nondefense capital goods -.5 6.5 7.3 -1.9 13.5 -4.2 -.4Excluding aircraft and parts .3 7.2 -1.2 4.7 2.7 2.7 .1
Office and computing .2 7.8 -3.5 13.4 3.7 3.7 4.1Communications equipment 4.6 -.6 -5.7 21.9 29.9 -6.3 .2All other categories -.7 9.1 .7 -2.3 -3.9 5.0 -1.4
Nonresidential structures
Construction put in place, buildings -2.0 3.2 -1.1 -.7 1.3 -3.5 -.0Office -3.3 8.5 4.6 -2.4 6.7 -10.8 -5.0Other commercial -5.8 1.8 -2.6 .2 .3 -1.4 .7Institutional 4.6 .9 2.8 3.3 1.8 1.7 .8Industrial -3.9 3.4 -5.2 -.5 .6 -2.9 2.5Lodging and miscellaneous 3.5 2.1 -5.3 -5.9 -5.0 -3.6 1.5
Rotary drilling rigs in use 2 7.6 -.1 -2.6 8.1 6.4 .8 -2.6
Memo-Business fixed investment 14.6 19.2 -.8 17.6 n.a. n.a. n.a.
Producers' durable equipment 23.0 24.1 -.3 28.8 n.a. n.a. n.a.Office and computing 46.2 47.0 14.4 90.9 n.a. n.a. n.a.Commnications equipment 7.9 31.3 -3.8 39.2 n.a. n.a. n.a.Other equipment3 19.7 9.9 1.0 12.1 n.a. n.a. n.a.
Nonresidential structures -4.7 6.7 -2.3 -8.9 n.a. n.a. n.a.
1. From the Current Industrial Report "Civil Aircraft and Aircraft Engines."Monthly data are seasonally adjusted using FRB seasonal factors constrained toBEA quarterly seasonal factors. Quarterly data are seasonally adjusted usingBEA seasonal factors.2. Percent change of number of rigs in use, seasonally adjusted.3. Producers' durable equipment excluding office and computing,
communications, motor vehicles, and aircraft and parts.n.a. Not available.

II-24
Orders and Shipments of Nondefense Capital GoodsOffice and Computing Equipment
Billions of dollars, ratio scale
Orders
I"'
Shipments
1994 1995 1996 19971 R
1998
Communications EquipmentBillions of dollars, ratio scale
31994 1995 1996 1997 1998
Other Equipment (Excluding Aircraft, Computing, and Communications Equipment)Billions of dollars, ratio scale
2r
S20
I1 I I I9 16998
1 I I I
1!1994 1995 1996 1997
II-25
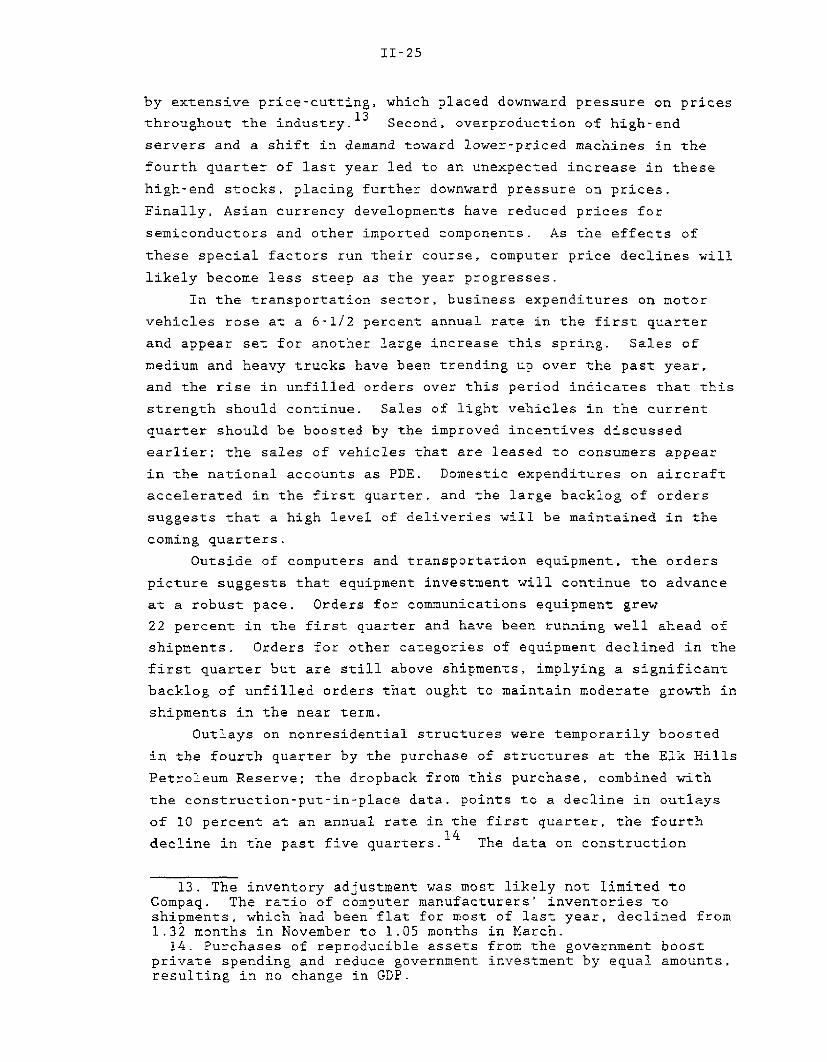
by extensive price-cutting, which placed downward pressure on prices
throughout the industry. 1 3 Second, overproduction of high-end
servers and a shift in demand toward lower-priced machines in the
fourth quarter of last year led to an unexpected increase in these
high-end stocks, placing further downward pressure on prices.
Finally, Asian currency developments have reduced prices for
semiconductors and other imported components. As the effects of
these special factors run their course, computer price declines will
likely become less steep as the year progresses.
In the transportation sector, business expenditures on motor
vehicles rose at a 6-1/2 percent annual rate in the first quarter
and appear set for another large increase this spring. Sales of
medium and heavy trucks have been trending up over the past year,
and the rise in unfilled orders over this period indicates that this
strength should continue. Sales of light vehicles in the current
quarter should be boosted by the improved incentives discussed
earlier; the sales of vehicles that are leased to consumers appear
in the national accounts as PDE. Domestic expenditures on aircraft
accelerated in the first quarter, and the large backlog of orders
suggests that a high level of deliveries will be maintained in the
coming quarters.
Outside of computers and transportation equipment, the orders
picture suggests that equipment investment will continue to advance
at a robust pace. Orders for communications equipment grew
22 percent in the first quarter and have been running well ahead of
shipments. Orders for other categories of equipment declined in the
first quarter but are still above shipments, implying a significant
backlog of unfilled orders that ought to maintain moderate growth in
shipments in the near term.
Outlays on nonresidential structures were temporarily boosted
in the fourth quarter by the purchase of structures at the Elk Hills
Petroleum Reserve; the dropback from this purchase, combined with
the construction-put-in-place data, points to a decline in outlays
of 10 percent at an annual rate in the first quarter, the fourth
decline in the past five quarters. 1 4 The data on construction
13. The inventory adjustment was most likely not limited toCompaq. The ratio of computer manufacturers' inventories toshipments, which had been flat for most of last year, declined from1.32 months in November to 1.05 months in March.
14. Purchases of reproducible assets from the government boostprivate spending and reduce government investment by equal amounts,resulting in no change in GDP.

II1-26
Nonresidential Construction and Contracts(Six-month moving average)
Total Building Index, Dec. 1982 = 100, ratio scale
1980 1982 1984 1986 1988 1990 1992 1994 1996 1998
Other Commercial
I I 1 1 I I 1 I I I I I 1 501984 1986 1988 1990 1992 1994 1996 1998
Lodging and Miscellaneous350
250
150
I I I -I -I9 -I I I I I I I ' 801984 1986 1988 1990 1992 1994 1996 1998
Institutional
j I 0 I T I I i I I I 1 1 I i I 1 1 Il 501984 1986 1988 1990 1992 1994 1996 1998 1984 1986 1988 1990 1992 1994 1996 1998
Note. For contracts, total includes private only; individual sectors include public and private.
Office

II-27
Nonresidential Construction IndicatorsVacancy Rates
Percent- T
Square footage available
- -- -
Downtown office
Suburban office N.N.
I I I I I I
1990 1991 1992
Source. CB Commercial Real Estate.
National Real Estate Price index
1993 1994 1995 1996 1997 11J 8998
Index, 1985:Q4 = 100--
Warehouse
Office
I I I I I 1 I I t I I I
1986 1988 1990 1992 1994
Note. Data are semiannual from 1986 to 1991 and quarterly from 1992 forward.
FDIC Survey
"In general, how would you characterize the commercial real estate market?"
1996 1IS70
998
Diffusion index--
F? I I Ir
130
120
110
100
90
80
1991 1992 1993 1994 1995 1996
Note. Calculated as [(Percent reporting tight supply - Percent reporting excess supply)2] + 50.
-i n1998
- -- ---

II-28
CHANGES IN MANUFACTURING AND TRADE INVENTORIES(Billions of dollars at annual rates;based on seasonally adjusted data)
1997 1998 1998
Q3 Q4 Q1 Jan. Feb. Mar.
Book value basis
Total 41.5 41.9 55.5 17.1 88.6 60.7Excluding wholesale and
retail motor vehicles 35.4 42.3 51.3 25.8 85.5 42.5Manufacturing 17.3 17.8 20.6 18.4 35.2 8.3
Excluding aircraft 13.3 15.3 18.1 15.1 28.1 11.0Wholesale 14.5 18.1 15.4 -14.0 43.4 16.6
Excluding motor vehicles 12.9 19.5 11.4 -14.3 38.1 10.4Retail 9.7 6.0 19.5 12.7 9.9 35.8
Auto dealers 4.5 .9 .2 -9.1 -2.3 12.0Excluding auto dealers 5.2 5.1 19.2 21.8 12.2 23.7
SELECTED INVENTORY-SALES RATIOS(Months' supply, based on Census book-value data. seasonally adjusted)
Cyclicalreference points Range over1990-91 1995-96 preceding 12 months Marchhigh low High Low 1998
Manufacturing and trade 1.58 1.38 1.38 1.36 1.37Less wholesale and retail
motor vehicles 1.55 1.34 1.35 1.33 1.34
Manufacturing 1.75 1.36 1.37 1.34 1.35Primary metals 2.08 1.49 1.65 1.59 1.59Nonelectrical machinery 2.48 1.80 1.80 1.70 1.66Electrical machinery 2.08 1.41 1.39 1.29 1.33Transportation equipment 2.93 1.48 1.61 1.52 1.51
Motor vehicles .97 .56 .62 .54 .55Aircraft 5.84 4.15 4.76 4.04 4.14
Nondefense capital goods 3.09 2.31 2.34 2.18 2.13Textiles 1.71 1.44 1.52 1.45 1.52Chemicals 1.44 1.25 1.41 1.27 1.42Petroleum .94 .75 .86 .79 .85Home goods & apparel 1.96 1.67 1.74 1.64 1.68
Merchant wholesalers 1.36 1.26 1.30 1.24 1.30Less motor vehicles 1.31 1.22 1.27 1.22 1.27
Durable goods 1.83 1.55 1.61 1.55 1.60Nondurable goods .95 .91 .96 .89 .95
"Retail trade 1.61 1.50 1.51 1.47 1.49Less automotive dealers 1.48 1.43 1.43 1.40 1.42
Automotive dealers 2.22 1.69 1.78 1.68 1.70General merchandise 2.42 2.20 2.20 2.06 2.06Apparel 2.53 2.27 2.45 2.31 2.37GAF 2.42 2.23 2.21 2.07 2.09

II-29
contracts suggest little evidence of a pickup in the near term.
This weakness continues to be at odds with indicators of demand
pressures, particularly in the markets for office and commercial
buildings. For instance, although office prices rose 13 percent in
1997 and vacancy rates plunged, real outlays on construction of
office buildings fell at an 11 percent annual rate in the first
quarter of 1998.
Business Inventories
Investment in business inventories excluding motor vehicles was
amazingly heavy in the first quarter. Nonetheless, for most
manufacturing and trade groupings, book-value inventory-sales ratios
in March were within the ranges observed over the past twelve
months.
The growth of manufacturers' stocks slowed in March after
having accumulated fairly rapidly in the first two months of the
quarter. Contributing to the slowdown were liquidations of stocks
held by producers of aircraft, primary metals, and industrial
machinery. The latter industry includes makers of office and
computing equipment, who reported a slight drawdown in book-value
stocks in March; with shipments rising strongly, the inventory-
shipments ratio in this category, as discussed earlier, fell sharply
for the fourth month in a row.
Inventory accumulation was boosted considerably in the first
quarter by large increases in a number of sectors that hold
petroleum stocks. The unusually warm winter reduced demand for
refined products, and low prices provided an incentive for refiners
and distributors to accumulate stocks. Despite further large price
declines, book-value stocks at petroleum refiners fell at only a
$1.5 billion rate in March after having declined $9.5 billion on net
in the previous two months; however, the BEA estimates that real
stocks held by refiners rose $11 billion (average annual rate) in
January and February. Book-value inventory investment by petroleum
merchant wholesalers fell $1 billion in the first quarter, but in
real terms petroleum stocks held by merchant wholesalers rose in the
first quarter. Another sector in which petroleum stocks may have
been built up last quarter is the nondurable component of "other
nonfarm" inventories, which includes holdings by pipelines and
utilities; the BEA estimates that real stocks in this sector rose
$9 billion at an annual rate in the first quarter, toward the high
end of the range of accumulations in recent periods. In contrast to

II-30
Inventory-Sales Ratios, by Major Sector(Book value)
ManufacturingRatio
- 2.15
1.9
1.65
1.4
Mar,
t I i I I I I I i . .. I I - I I , I I I 1 1 1.151979 1981 1983 1985 1987 1989 1991 1993 1995 1997
Wholesale Excluding Motor VehiclesRatio
1.5
-1.4
- 1.3
Mar.
1.2
1.1
I ! I _ I . I I I I I I 1 1 I I I L I 1
1979 1981 1983 1985 1987 1989 1991 1993 1995 1997
RetailRatio
2.8 - - 1.7
2.6 - . " GAF group (left scale)
2.2 - « tr\ A ' ^ , ,,- *A .,,\, 1.5, Mar.
1.42 1 18 Total excluding autos (right scale)
1.8 I- 198i I--I8 I I - I I993 19-- I -I'I '1.31979 1981 1983 1985 1987 1989 1991 1993 1995 1997

II-31
the pattern seen in these sectors, the BEA's estimate of real
nondurable inventories held by nonmerchant wholesalers, a grouping
that also includes a large petroleum component, rose only a bit in
the first quarter.
Inventories held by merchant wholesalers excluding motor
vehicles accumulated at a $10 billion annual rate in March, about in
line with sales.15 Inventories in the "other nondurables"
grouping increased markedly, continuing the large up-and-down swings
of previous months. In March, the buildup in this volatile sector
was driven by increased stocks at alcohol and drug wholesalers.
However, in recent months, no single subcategory has consistently
driven the large changes in this grouping.
Book-value inventories at non-auto retailers rose at a $23.7
billion annual rate in March; moreover, rather than having declined
slightly, February stocks are now estimated to have increased at
$12.2 billion annual rate. As a result, at a $19.2 billion annual
rate, the average pace of stockbuilding in this sector in the first
quarter was nearly four times its fourth-quarter pace. Much of the
step-up in inventory investment last quarter occurred at stores
selling nondurable goods, but higher rates of accumulation also
occurred at furniture stores and dealers selling lumber and building
supplies. Still, sales growth was strong last quarter, and
inventory-sales ratios for most types of retail establishments were
in the middle or at the low end of their recent ranges.16
Federal Government
Real consumption and gross investment by the federal government
fell nearly 8 percent (annual rate) in the first quarter because of
a sharp drop in defense spending. Nondefense purchases rebounded
from the fourth-quarter level which had been held down by the sale
of equipment and structures at the Elk Hills Petroleum Reserve.
Over the past four quarters, real defense spending fell 2 percent,
and real nondefense spending was nearly unchanged. Spending
restraint and robust growth of receipts appear to have brought the
15. The annual revisions to the wholesale trade sales andinventory data were negligible and had little effect on the outlook.
16. Based on the 1996 Annual Retail Trade Survey, both sales andinventories in the retail sector have been revised up by the CensusBureau. The largest revisions were for 1995 and 1996. Inventorieswere revised up more than sales for 1995, and inventory-sales ratiosrose accordingly. For 1996, revisions to inventories and sales wereabout matched, and the inventory-sales ratio was revised little.
II-32
FEDERAL GOVERNMENT OUTLAYS AND RECEIPTS(Unified basis; billions of dollars)
January-March 12 months ending in Mar.
Percent Percent1997 1998 change 1997 1998 change
OutlaysDeposit insuranceSpectrum auctionOther
401.1-3.70.0
404.7
408.7-1.1-0.6
410.3
349.1 378.5
52.0 30.2Deficit (+)
1.9n.a.n.a.
1.4
8.4
n.a.
1593.1-13.0-3.8
1609.9
1629.4-6.2-8.1
1643.7
1502.2 1648.7
90.9 -19.3
2.3n.a.n.a.2.1
9.8
n.a.
Adjusted for payment timing shifts1
and excluding deposit insurance and spectrum auction
OutlaysNational defenseNet interestSocial securityMedicareMedicaidOther healthZncome securityOther
ReceiptsIndividual income and
payroll taxesWithheld + FIC&Nonwithheld + SECARefunds (-)
CorporateOther
Deficit (+)
412.465.560.990.646.923.7
6.771.946.3
418.163.861.193.947.524.6
7.273.446.5
349.1 378.5
289.6276.049.235.625.833.7
316.0297.8
57.038.824.737.8
63.3 39.6
1.4-2.6
0.43.71.53.77.32.10.4
8.4
9.17.9
15.98.9
-4.012.1
n.a.
1609.9271.4243.2357.5183.1
95.428.0
231.6199.6
1643.7271.9245.5372.4193.6
98.428.4
231.8201.7
1502.2 1648.7
1175.91020.1245.8
90.0175.5150.7
1292.61101.8
287.797.0190.3165.9
2.10.20.94.25.73.11.20.11.0
9.8
9.98.0
17.17.88.4
10.0
107.7 -5.1 n.a-
Note. Components may not sum to totals because of rounding.1. A shift in payment timing occurs when the first of the month falls on
a weekend or holiday. Outlays for defense, Medicare, income security, and*other" have been adjusted to account for this shift.
n.a.--Not applicable
Receipts

II-33
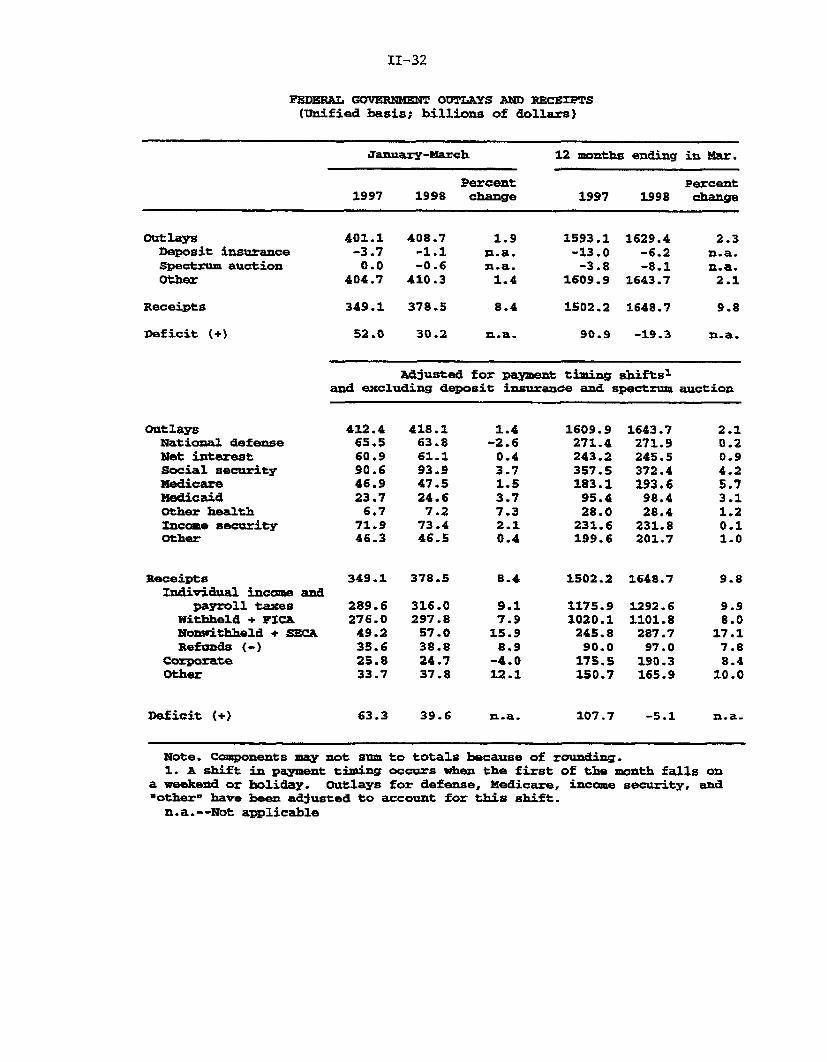
NIPA measures of the federal budget into surplus in the first
quarter for the first time since 1969.17
Incoming unified budget data have pointed to an even larger
surplus for fiscal year 1998 than seemed likely at the time of the
last Greenbook. The budget recorded a $19 billion surplus over the
twelve months ending in March, and daily data indicate that April
receipts were robust. Indeed, the Congressional Budget Office now
projects that the fiscal 1998 surplus will be in the range of $43
billion to $63 billion, up from a projected surplus of $8 billion in
March. The improvement reflects stronger-than-expected receipts of
withheld and employment taxes and nonwithheld taxes, combined with
weaker-than-expected outlays.
Receipts rose 8 percent in the first quarter compared with a
year earlier, led by growth of 9 percent in personal income taxes
and social insurance collections. Net corporate income taxes fell,
as a small rise in collections was more than offset by increased
refunds. The stalling of corporate taxes is consistent with the
relatively weak growth seen in S&P 500 profits. First-quarter
outlays were only 1-1/2 percent higher than a year earlier, held
down by a drop in defense spending and a leveling-off in debt
service payments.
Daily Treasury Statements indicate that April tax payments were
10 percent higher than a year earlier. Nonwithheld personal income
taxes and social insurance contributions--primarily final payments
on 1997 income tax liability--were $20 billion, or 16 percent,
higher than last year's heady level. Preliminary calculations
incorporating the April data show that the effective personal income
tax rate on a liability basis--the ratio of the staff's estimate of
personal income tax liability to the NIPA tax base--rose
17. Two deficit measures are available in the national accounts.The current surplus measures the difference between receipts andcurrent expenditures (which include consumption of fixed capital andexclude investment). Using the staff estimate of corporate profitaccruals for the first quarter and an expected revision to personaltaxes, this measure would show a surplus of $41 billion, comparedwith a deficit of $55 billion a year earlier. A second measure isnet lending, or the current surplus excluding capital consumptionand including gross investment, which is, in some respects, morecomparable to the unified deficit. This measure also was in surplusin the first quarter, because gross investment was approximatelyequal to capital consumption.

Unified Deficit
F 12-month moving sum
1988 1989 1990
Effective Personal Tax Rate'
II-34
Federal Sector Developments
Billions of dollars400
300
200
100
+
0Mar. -
I 1001991 1992 1993 1994 1995 1996 1997 1998
PercentS14.5
14
13.5
13
-12.5
12
11.5
I t 1 I 11 I I I 11 1 I 11
1979 1982 1985 1988 1991 1994 1997"Estimate of tax liability as a percentage of NIPA tax base.

II-35
1/2 percentage point in 1997, to 13-1/2 percent (chart).1 8 The
effective tax rate, computed on a liability basis, has risen
2 percentage points since the 1992-94 period, as a result of an
increase in marginal tax rates, increased capital gains
realizations, real bracket creep, and a shift in the income
distribution. April collections were also boosted by strong
withheld personal income tax and social insurance receipts.
A fiscal 1998 supplemental spending bill was enacted at the end
of April. The bill provides $3 billion in budget authority for
military spending related to Bosnia and Iraq, $2-1/2 billion for
natural disaster assistance, and $500 million for veterans'
compensation. The bill also included $2-1/2 billion of rescissions
of budget authority (which are not expected to affect outlays) for
low-income housing reserve funds and for excess contract authority
for the Airport Improvement Program. OMB expects that the bill will
raise outlays $1 billion in fiscal 1998 and $1-1/2 billion in fiscal
1999. Not much headway has been made on the fiscal 1999 budget.
The Senate passed its version of the Budget Resolution in early
April, calling for small tax cuts financed by reductions to
mandatory spending, but the House has yet to vote on a budget
blueprint.
State and Local Government Sector
Real consumption and investment outlays by state and local
governments now appear to have been little changed in the first
quarter. Increases in spending on consumption items were largely
offset by a drop in outlays for construction that now looks to have19been larger than BEA had assumed. Sizable declines were
recorded in all major categories of construction except highway
construction, which rose a little. The pattern suggests that the
difficulties associated with the attempts to pass legislation
reauthorizing transportation programs did not substantially disrupt
construction; it now appears that legislation will not be passed for
at least several weeks. State and local employment rose 18,000 in
April, nearly the same as the average increase in the first quarter.
18. The staff allocates nonwithheld tax payments to differentliability years on the basis of Treasury data and historicalpatterns for the most recent months. Withheld payments areattributed to current year liability and refunds to the previousyear.
19. The March construction data were not available at the time ofthe advance release and turned out to be weaker than BEA hadassumed. Moreover, construction spending in January and Februarywas revised down.
State General Fund Balances
Percentage of previous years ex;
SExpected_ Actual
1993 1994
Source. National Conference of State L
State and Local Taxes
11-36
State and Local Sector
Percent10
,enditures
7
6
5
4
3
2
1995 1996 1997 1998
egislatures
Percent26
iditures
!- / A24
S" " Q01 - 22
Property20
S- 1 8
Personal income
12- 1 4
1980 1984 1988 1992 1996Source. NIPA accounts.
II-37
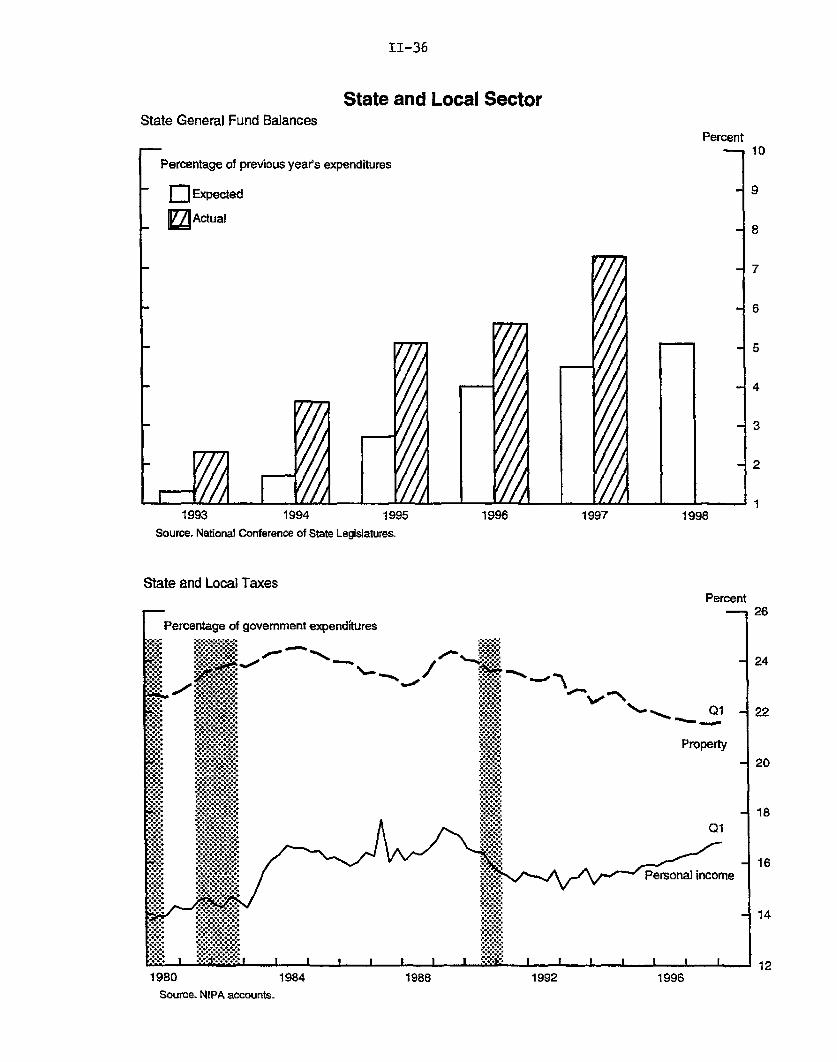
The fiscal health of the state and local sector remains
favorable, with state governments faring especially well. All
states appear to be finishing fiscal year 1998, which ends on June
30 for most states, with their general fund budgets in balance.
Ending balances have risen as a share of expenditures in each of the
past five years, consistently outstripping states' expectations
(chart, top panel). Although the final tally for 1998 is not yet
available, revenues again appear to be coming in above expectations
while outlays are close to target. According to the Center for the
Study of the States, state tax collections for the first three
quarters of the fiscal year (1997:Q3 through 1998:Q1) were, on
average, 6 percent above collections for the same period one year
earlier. Moreover, although state data are not yet available,
extrapolations based on federal nonwithheld income tax payments this
spring suggest that states that collect income taxes have received
strong payments once again.
Regarding local governments, reports from the National League
of Cities and the National Association of Counties indicate that the
fiscal positions of these jurisdictions are improving, although they
do not appear to be as well off as the states, in part because they
rely heavily on property taxes rather than personal income taxes for
their revenues. In recent years, overall receipts from property
taxes as a share of state and local expenditures have fallen, while
income tax revenue has risen (chart, lower panel).
Prices
In April, the CPI increased 0.2 percent, the largest increase
in six months. Energy prices edged down after having fallen rapidly
in the previous four months, and food prices edged up after having
been unchanged in both February and March. Consumer prices
excluding food and energy rose 0.3 percent, as tobacco prices jumped
and services prices accelerated. Over the twelve months ending in
April, the CPI rose only 1.4 percent, down from the 2-1/2 percent
rate recorded over the previous twelve-month period. Excluding food
and energy, CPI inflation over the past year was 2.1 percent, the
smallest twelve-month increase since April 1966.
Consumer energy prices declined only 0.1 percent in April.
Gasoline prices fell more slowly than in recent months, as crude oil
prices, which had bottomed out in mid-March, began to move up
somewhat. Since their recent trough, crude oil prices have risen
roughly $2.50 per barrel; the spot price of West Texas intermediate,

II-38
CPI AND PPI INFLATION RATES(Percent change)
From twelvemonths earlier 1997 1998 1998
Apr. Apr.1997 1998 04 Q1 Mar. Apr.
-Annual rate- -Monthly rate-
CPI
All items (100.0)1
Food (15.3)Energy (7.0)CPI less food and energy (77.7)
Commodities (24.1)
New vehicles (5.1)Used cars and trucks (1.9)Apparel (4.9)Tobacco (0.9)Other Commodities (11.3)
Services (53.6)
Shelter (29.4)Medical care (4.4)Other Services (19.8)
Finished goods (100.0)2
Finished consumer foods (23.2)Finished energy (13.6)Finished goods less food
and energy (63.3)
Consumer goods (38.0)Capital equipment (25.3)
Intermediate materials (100.0)3
Intermediate materialsless food and energy (81.8)
Crude materials (100.0)4
Crude food materials (42.2)Crude energy (36.2)Crude materials less
food and energy (21.6)
1.4 2.3
2.8 2.0.0 -7.4
2.7 2.1
1.1
1.2-2.0
.95.5
.8
3.3
.2
-. 6-4.0
-. 28.3
.6
3.0
.8 -1.2
2.4-1.8
.7
-. 5-8.7
.2
-. 1 -1.6
.5 .0 .2
2.1 1.41.2 -19.92.1 2.4
.6
-1.5-2.8
,411.0
.4
.0-1.2
.1
.8 -. 1
-. 3 .1.4 -. 7
-1.5 -.29.6 -2.61.6 .2
3.0 3.1
3.5 3.13.1 3.12.7 3.2
.6 -3.9
-2.1-22.0
-. 2
1.4 -.1-1.0 -.7
.3 -4.2
.1 -. 8
.0
.6-. 13.8-. 1
-. 4 .4-1.9 -.1
.0 .2
.1 .3
.0 .1
-5.7 -7.3 20.6 -34.4 -1.6
-2.4-12.5
-. 8
-9.0-6.3-5.8
2.964.8-3.8
-14.1-59.5-14.6
.7-4.3-1.9
1. Relative importance weight2. Relative importance weight3. Relative importance weight4. Relative importance weight
for CPI, December 1997.for PPI, December 1997.for intermediate materials, December 1997.for crude materials, December 1997.

II-39
for example, has averaged nearly $15.50 per barrel thus far in May,
up from the low of about $13 per barrel recorded in mid-March. As a
result, private survey data suggest that, on a seasonally adjusted
basis, the retail price of gasoline turned up in May, the first
increase in eight months.
The CPI for food was relatively stable for a third month in
April. Grocery store prices were down a tenth for a third month,
and the index for food away from home rose 0.2 percent, matching its
average for the year to date. Over the twelve months ending in
April, food prices were up just 2.0 percent, down from a
2-3/4 percent pace in the year-earlier period. Farm prices in April
remained well below the levels of a year earlier, and agricultural
futures prices have changed little, on balance, since the week of
the March Greenbook. As of May 10, planting of crops was moving
ahead at a faster-than-average clip despite weather-related delays
in some regions.
The index for consumer prices excluding food and energy
increased 0.3 percent in April. Goods prices edged up, reflecting a
jump in tobacco prices, but prices of durable goods fell further.
Tobacco prices have fluctuated widely in recent months: the April
index is now up 4-3/4 percent from December, which is roughly
consistent with announced price hikes over this period. The index
for non-energy services rose 0.4 percent last month, the largest
increase in three years. Owners equivalent rent rose 0.4 percent in
April, after having increased 0.2 percent in March; as a result, the
six-month increase in owners equivalent rent has picked up to
3-1/2 percent (an annual rate).
Falling import prices have helped hold the rate of change of
core CPI commodities to 0.2 percent over the year ending in April,
despite a sizable increase in tobacco prices; prices of non-energy
services advanced 3.0 percent over that period, a bit less than over
the preceding twelve months. Declines in prices of motor vehicles
have been an important contributor to the deceleration in prices of
core consumer goods. However, the prices of other import-sensitive
goods--such as apparel and footwear, toys, and photographic
equipment--have also declined. The small deceleration in prices of
non-energy services is the result of slower price increases for
services other than shelter and medical care, such as air fares and
personal care services.

II-40
BROAD MEASURES OF INFLATION(Four-quarter percent change)
1995 1996 1997 1998Q1 Q1 Q1 Q1
Product prices
GDP chain price index 2.7 2.3 2.2 1.4
Nonfarm business chain-type price index1 2.8 1.5 2.0 1.0
Expenditure prices
Gross domestic purchases chain-type price index 2.8 2.2 2.1 0.9Less food and energy 2.8 2.2 1.8 1.2
PCE chain-type price index 2.9 2.1 2.6 1.0Less food and energy 3.0 2.1 2.3 1.4
CPI 2.8 2.8 2.9 1.5Less food and energy 2.9 2.9 2.5 2.3
Median CPI 2.7 3.3 2.8 2.8Trimmed mean C1P 2.7 2.8 2.7 1.9
1. Excluding housing.
SURVEYS OF (CPI) INFLATION EXPECTATIONS(Percent)
University of Michigan Conference ProfessionalActual (1-year) (1-year) Board forecasters
inflation1 Mean 2 Median 3 (1-year) (10-year)*
1996-Q1 2.7 3.9 2.8 4.1 3.0Q2 2.8 4.5 3.0 4.3 3.0Q3 2.9 4.2 3.1 4.3 3.0Q4 3.2 4.0 3.0 4.2 3.0
1997-Q1 2.9 3.8 2.9 4.2 3.0Q2 2.3 3.6 2.9 4.0 2.903 2.2 3.4 2.7 4.0 3.0Q4 1.9 3.3 2.8 4.1 2.7
1998-Q1 1.5 2.8 2.4 3.8 2.6
Oct. 2.1 3.2 2.8 4.1Nov. 1.8 3.4 2.9 4.1Dec. 1.7 3.4 2.8 4.0 2.7
1998-Jan. 1.6 2.8 2.3 3.7Feb. 1.4 2.6 2.4 4.0Mar. 1.4 2.9 2.5 3.8 2.6
Apr. 2.7 2.4 4.0
1. CPI; percent change from the same period in the preceding year.2. Average increase for responses to the question: By about what percent do you
expect prices (CPI) to go up, on the average, during the next 12 months?3. Median increase for responses to the question above.4. Compiled by the Federal Reserve Bank of Philadelphia.

II-41
Large declines in energy and non-oil import prices and the
deceleration in food prices have also been important contributors to
the favorable performance of other broad measures of prices. In the
first quarter of this year, the four-quarter changes in chain price
indexes for GDP and for PCE excluding food and energy were down
3/4 percent and 1 percent, respectively, from their pace a year
earlier. As with the core CPI, the deceleration in the chain price
index for PCE excluding food and energy reflects a decline in prices
of durable goods and a deceleration in services other than energy
and housing.
Short-term inflation expectations held near their first-quarter
level in April and remain substantially below year-ago levels. As
measured by the Michigan SRC index, mean one-year-ahead inflation
expectations edged down to 2.7 percent in April, 1 percentage point
below the level recorded a year earlier. The median one-year-ahead
expectations were unchanged in April at 2.4 percent, about
1/2 percentage point lower than a year earlier. Longer-term
inflation expectations in the Michigan survey--both the mean and the
median--edged down in April from their first-quarter average and now
lie somewhat below year-ago levels.
Greater import price competition may have also helped hold down
the PPI for finished goods, especially for capital equipment.
Prices of capital equipment in the PPI fell 3/4 percent at an annual
rate in the first quarter, reflecting further declines for motor
vehicles and a very large drop in computer prices. In April, prices
of capital equipment edged up 0.1 percent, as the prices of motor
vehicles purchased by businesses rose 0.4 percent. Overall computer
prices declined more slowly in April--2.3 percent--than in the first
quarter, despite an even faster rate of decline in personal computer
prices. Excluding computers and motor vehicles, capital goods
prices were unchanged, on average, last month.
Prices at earlier stages of processing remain subdued. The PPI
for intermediate materials other than food and energy was unchanged
in April, after declining in the first quarter, and stood about
unchanged from its level a year earlier. The PPI for core crude
materials fell further in April to a level 5-3/4 percent below a
year earlier. Since mid-April, when the PPI was measured, the
Journal of Commerce and KR-CRB industrial price indexes have risen a
bit on balance.

II-42
Daily Spot and Posted Prices of West Texas Intermediate
Dollars per barrel
June July Aug Sep Oct Nov Dec Jan Feb Mar Apr May
Note. Posted prices are evaluated as the mean of the range listed in the Wall Street Journal.
Monthly Average Prices of West Texas Intermediate
Month Posted Spot
June 17.96 19.17July 18.15 19.63August 18.51 19.93September 18.14 19.79October 19.80 21.25November 18.83 20.17December 16.97 18.32January 15.33 16.71February 14.78 16.06March 13.44 15.02April 13.90 15.44May 1 13.85 15.41
1. Through May 13, 1998.

II-43
Commodity Price Measures
Journal of Commerce IndexRatio scale, index, 1990=100
KR-CRB Spot IndustrialsRatio scale, index, 1967=100
KR-CRB Industrials307
304
296Mar. Apr. May
1998
KR-CRB FuturesRatio scale, index, 1967=100
KR-CRB Futures
Note. Weekly data, Tuesdays. Vertical lines on small panels indicate week of last Greenbook. The Journal of Commerce index is based almostentirely on industrial commodities, with a small weight given to energy commodities, and the KR-CRB spot price index consists entirely of industrialcommodities, excluding energy. The KR-CRB futures index gives about a 60 percent weight to food commodities and splits the remaining weight roughlyequally among energy commodities, industrial commodities, and precious metals. Copynght for Journal of Commerce data is held by CIBCR, 1994.
II-44
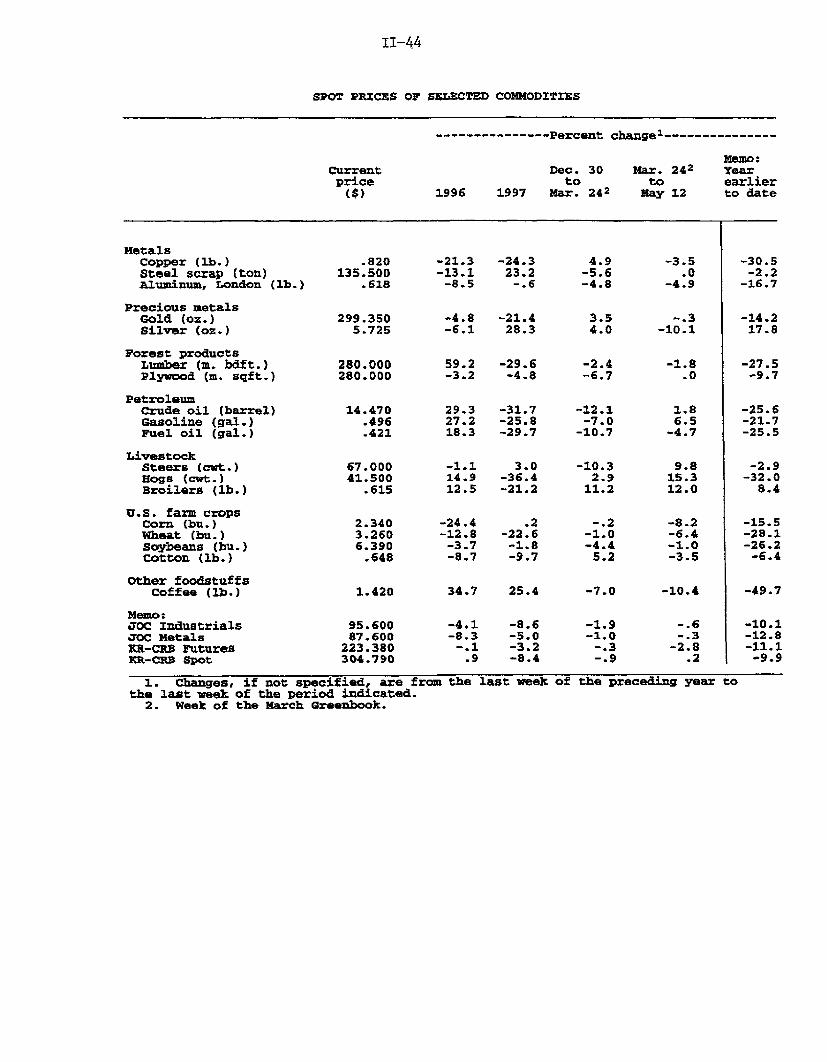
SPOT PRICES OF SELECTED COMMODITIES
--------------- Percent changel---------------
Memo:Current Dec. 30 Mar. 242 Yearprice to to earlier($) 1996 1997 Mar. 242 May 12 to date
MetalsCopper (lb.) .820 -21.3 -24.3 4.9 -3.5 -30.5Steel scrap (ton) 135.500 -13.1 23.2 -5.6 .0 -2.2Aluminum, London (lb.) .618 -8.5 -. 6 -4.8 -4.9 -16.7
Precious metalsGold (oz.) 299.350 -4.8 -21.4 3.5 -. 3 -14.2Silver (oz.) 5.725 -6.1 28.3 4.0 -10.1 17.8
Forest productsLumber (a. bdft.) 280.000 59.2 -29.6 -2.4 -1.8 -27.5Plywood (m. sqft.) 280.000 -3.2 -4.8 -6.7 .0 -9.7
PetroleumCrude oil (barrel) 14.470 29.3 -31.7 -12.1 1.8 -25.6Gasoline (gal.) .496 27.2 -25.8 -7.0 6.5 -21.7Fuel oil (gal.) .421 18.3 -29.7 -10.7 -4.7 -25.5
LivestockSteers (cwt.) 67.000 -1.1 3.0 -10.3 9.8 -2.9Hogs (cwt.) 41.500 14.9 -36.4 2.9 15.3 -32.0Broilers (lb.) .615 12.5 -21.2 11.2 12.0 8.4
U.S. farm cropsCorn (bu.) 2.340 -24.4 .2 -. 2 -8.2 -15.5Wheat (bu.) 3.260 -12.8 -22.6 -1.0 -6.4 -28.1Soybeans (bu.) 6.390 -3.7 -1.8 -4.4 -1.0 -26.2Cotton (lb.) .648 -8.7 -9.7 5.2 -3.5 -6.4
Other foodstuffscoffee (lb.) 1.420 34.7 25.4 -7.0 -10.4 -49.7
Memo:TOC Industrials 95.600 -4.1 -8.6 -1.9 -. 6 -10.1JOC Metals 87.600 -8.3 -5.0 -1.0 -. 3 -12.8KR-CRBS utures 223.380 -. 1 -3.2 -. 3 -2.8 -11.1FK-CBs Spot 304.790 .9 -8.4 -. 9 .2 -9.9
1. Changes, if not specified, are from the last week of the preceding year tothe last week of the period indicated.
2. Week of the March Greenbook.

II-45
Labor Costs
The Employment Cost Index for hourly compensation of private
industry workers increased at a seasonally adjusted annual rate of
2.7 percent over the three months ending in March after having risen
4.3 percent in the fourth quarter. Over the past twelve months,
this measure of hourly compensation rose 3.5 percent, up
1/2 percentage point from its pace in the preceding twelve months.
On a twelve-month-change basis, most industries registered an
acceleration in compensation relative to the year-earlier period,
with the largest pickup in finance, insurance, and real estate.
Compensation in FIRE has been boosted in the past two quarters by
sizable nonproduction bonuses and commissions generated, in part,
from a wave of mortgage refinancings. Most occupational groups also
recorded an acceleration in compensation. The large pickup for
workers in service occupations likely reflects the influence of last
fall's minimum wage increase. We think that last year's increase of
the minimum wage had a larger effect than the 1996 minimum wage hike
because a higher percentage of workers were below the new minimum at
the time of the latest increase. Gains were also notable for most20
white collar workers.
The acceleration in compensation costs over the past twelve
months resulted primarily from faster growth of wages and salaries,
which rose 4.0 percent over the twelve months ended in March,
0.6 percentage point more than the increase over the preceding
twelve months. By contrast, benefits rose a modest 2.3 percent over
the past twelve months, just 1/4 percentage point above the increase
recorded over the year-earlier period. Benefits were boosted by a
pickup in the costs of health insurance and supplemental pay
(including bonuses and wage differentials for overtime and late
shifts). However, pension costs decelerated over the past year
because rising stock prices reduced the need for employers to pay
into defined benefit plans; costs for state unemployment insurance
and workers' compensation fell sharply as well.
Anecdotal reports point to a further pickup in health insurance
costs. Many managed care plans are raising premiums in an attempt
to recoup the losses they suffered in 1997, and both consumers and
providers are seeking changes (for example, fewer restrictions on
access to specialists) that may make it more difficult for insurers
20. Twelve-month compensation growth edged down for sales workersin March but picked up nearly a percentage point for other whitecollar workers (such as professionals and managers).

II-46
EMPLOYMENT COST INDEX OF HOURLY COMPENSATIONFOR PRIVATE INDUSTRY WORKERS
1997 1998
Mar. June Sept. Dec. Mar.
---- Quarterly percent change------(Compound annual rate)
Total hourly compensation1 2.5 3.7 3.4 4.3 2.7Wages and salaries 3.5 3.8 4.1 4.7 3.4Benefit costs 0.3 2.6 2.0 3.8 1.1
By industryConstruction 2.5 3.2 2.8 1.9 2.8Manufacturing 0.9 3.4 3.0 2.1 3.0Transportation and 1.2 2.8 3.1 4.0 3.9
public utilitiesWholesale trade 6.2 1.5 3.3 2.1 7.6Retail trade 3.8 2.8 3.8 2.5 5.3FIRE 8.5 2.5 3.4 12.8 6.7Services 2.7 3.6 3.9 4.8 1.7
By occupationWhite collar 3.4 3.0 3.6 5.1 3.3Blue collar 1.2 3.1 3.1 2.8 1.8Service occupations 3.5 3.8 6.6 2.1 4.3
Memo:State and local governments 2.1 1.8 2.4 2.4 3.3
----- Twelve-month percent change----
Total hourly compensation 3.0 2.9 3.2 3.4 3.5Excluding sales workers 2.8 2.9 3.0 3.4 3.4Wages and salaries 3.4 3.3 3.6 3.9 4.0Excluding sales workers 3.1 3.3 3.5 3.8 4.0
Benefit costs 2.0 2.0 2.0 2.3 2.3
By industryConstruction 2.3 2.7 3.0 2.6 2.7Manufacturing 2.6 2.6 2.5 2.4 2.9Transportation and 2.7 2.6 2.8 2.9 3.4
public utilitiesWholesale trade 4.2 3.5 3.6 3.2 3.6Retail trade 3.2 3.9 3.9 3.4 3.6FIRE 3.3 2.5 3.0 6.7 6.3Services 3.0 3.0 3.2 3.8 3.5
By occupationWhite collar 3.2 3.2 3.1 3.8 3.8
Sales 4.2 3.0 4.3 4.2 4.0Nonsales 2.9 3.1 3.0 3.7 3.8
Blue collar 2.4 2.5 2.8 2.6 2.7Service occupations 3.2 3.5 4.5 4.0 4.2
Memo:State and local governments 2.5 2.4 2.4 2.3 2.5
1. Seasonally adjusted by the BLS.

II-47
Components of ECI Benefits Costs(Private industry workers; twelve-month change)
Insurance Costs Supplemental PayPercent
QI
-W
1982 1984 1986 1988 1990 1992 1994-1-5
1996 1998
Paid LeavePercent
1982 1984 1986 1988 1990 1992 1994
Workers' Compensation InsurancePercent
Retirement and Savings
'21996 1998
Percent
Q1
SV-t1982 1984 1986 1988 1990 1992 1994 1996 19
State Unemployment InsurancePercent
1982 1984 1986 1988 1990 1992 1994 1996 1998
"Note. Unpublished ECI benefits detail.
Percent
zu
9-598
" ' ' ' ' ' ' '"' ' ' ' ' ' ' '
i :
"' ~~'-' ' ' ' ' ""'~~' '~' ' ' ' . . . . . . . i p I i~' " ' T [ I '
\Total
,I ; ; Total\
J

II-48
LABOR PRODUCTIVITY AND COSTS(Percent change; annual rate; based on seasonally adjusted data)
1997 1998 1997:Q1S--- to
19961 19971 Q2 Q3 Q4 Q1 1998:Q1
Output per hourTotal business 1.8 2.2 2.2 3.5 1.6 .8 2.0
Nonfarm business 1.7 2.1 2.3 3.6 1.4 .2 1.9Manufacturing 5.1 4.8 3.8 8.0 4.3 .5 4.1Nonfinancialcorporations2 2.8 2.7 2.4 6.3 .6 n.a. n.a.
Compensation per hourTotal business 4.0 4.3 3.1 4.2 5.6 4.2 4.3
Nonfarm business 3.9 4.1 3.2 3.8 5.2 4.1 4.1Manufacturing 3.0 4.1 2.6 3.4 6.1 2.8 3.7Nonfinancialcorporations 2 3.8 4.0 3.2 4.3 4.7 n.a. n.a.
Unit labor costsTotal business 2.2 2.0 .9 .7 3.9 3.4 2.2
Nonfarm business 2.2 2.0 .9 .2 3.8 3.8 2.2Manufacturing -1.9 -. 6 -1.1 -4.2 1.8 2.3 -. 3Nonfinancial
corporations2 1.0 1.3 .8 -1.9 4.1 n.a. n.a.
1. Changes are from fourth quarter of preceding year to fourth quarter ofyear shown.
2. The nonfinancial corporate sector includes all corporations doingbusiness in the United States with the exception of banks, stock and commoditybrokers, finance and insurance companies; the sector accounts for abouttwo-thirds of business employment.
Measures of Compensation per Hour(Four-quarter changes)
Percent
1%
/
1I'
r I
I
Employment Cost index
Productivity and Cost
// V
'I / I
90i 19 19 2 1 1 1 1 1 9 9 7 i i i i I
1990 1991 1992 1993 1994 1995 1996 1997I 1
I

II-49
to restrain costs. Additional upward pressure on premiums appears
to be coming from higher spending on prescription drugs and efforts
by providers to offset the reductions in Medicare reimbursements.
Information about 1999 is very limited, but many insurers are
reportedly seeking increases above those agreed to this year. For
example, CalPERS, the second largest purchaser of employee health
benefits (behind the federal government), will see an average
increase of at least 5 percent in HMO premiums, and that figure
could be considerably higher if Kaiser, which covers more than one-
third of CalPERS HMO members, were to achieve the 12 percent
increase it is seeking. In 1998, CalPERS HMO premiums rose about
3 percent after having declined for four years.
Hourly compensation in the nonfarm business sector--reported in
the Productivity and Cost report--rose at a 4.1 percent annual rate
in the first quarter, down considerably from its rapid fourth-21quarter pace.21 Over the past four quarters, compensation per
hour has increased 4.1 percent, little changed from the 4.0 percent
rise over the previous four-quarter period. This measure of
compensation has continued to rise more rapidly than the ECI, likely
reflecting the rise in overtime, a shift toward industries with
higher-than-average pay, and perhaps greater job-grade creep in a
tight labor market. These factors affect compensation per hour in
the nonfarm business sector but should affect the fixed-weighted
ECI.
Information on labor costs this quarter are mostly limited to
the BLS monthly data on average hourly earnings of production and
nonsupervisory workers. In April, average hourly earnings rose
0.3 percent on a published basis; when adjusted for the distortion
caused by reporting problems with the workweek, however, they
increased 0.5 percent, the fastest pace in six months. On both the
published and adjusted basis, the twelve-month change in average
hourly earnings was 4.2 percent in April, up 1/2 percentage point
from the year-earlier period.
The difficulties in adjusting hours for the Easter holiday this
year may also affect average hourly earnings by reducing the amount
of overtime worked during the week at establishments with Monday-to-
Sunday workweeks. Thus far, the BLS does not believe that an Easter
21. This measure of hourly compensation is potentially affected bythe length-of-pay-period problem noted earlier. As discussed in theappendix, however, the extent of any bias is difficult to determine,although it is undoubtedly smaller than the bias in productivity.

II-50
AVERAGE HOURLY EARNINGS(Percentage change; based on seasonally adjusted data)
Twelve-month Percent changepercent change 1 to Apr. 1998 1998
Apr. Apr. Apr. Oct. Jan.1996 1997 1998 1997 1998 Mar. Apr.
- - - - - - - -Annual rate- -- - - - - - -Monthly rate-
Total private nonfarm 3.2 3.7 4.2 4.4 4.9 .3 .3
Adjusted2 3.3 3.7 4.2 4.1 4.5 .3 .5
Manufacturing 3.5 2.8 3.2 1.8 2.7 .3 .0
Construction 1.9 3.5 3.7 4.3 6.1 .7 .3Transportation and
public utilities 2.5 2.6 3.2 3.6 .5 -.3 .6Finance, insurance,
and real estate 3.5 2.7 6.6 6.1 9.7 .4 .4
Retail trade 3.5 4.5 5.0 5.5 5.7 .5 .7
Wholesale trade 2.5 4.3 4.4 4.9 6.9 .5 .2
Services 2.9 4.2 4.4 5.6 7.6 .5 .6
1. Uses not seasonally adjusted data.2. Adjusted for length of pay period.
Average Hourly Earnings(Smoothed twelve-month changes*)
Percent
Percent
Percent
Percent
1990 1992 1994 1996 1998 1990
* Three-month moving average of twelve-month changes.

II-51
adjustment is warranted for the average hourly earnings series for
this April. Our own view is that the Easter problem may have caused
average hourly earnings in all private industries to be understated
in April by one or two cents.2 2
22. The problem this year with seasonal adjustment for the Easterholiday was particularly severe in manufacturing, and thus theeffect of overtime on average hourly earnings is large inmanufacturing. In April, average hourly earnings in manufacturingwere flat, but straight-time earnings rose 0.7 percent.

APPENDIX
THE LENGTH-OF-PAY-PERIOD PROBLEM AND LABOR MARKET INDICATORS
Earlier this year, the Bureau of Labor Statistics uncovered astatistical error in its method of estimating hours and earnings ofproduction or nonsupervisory workers from the payroll survey. Theproblem, which has come to be known as the length-of-pay-period(LP) bias, generates a spurious negative correlation betweenmeasured hours or earnings and the number of weekdays in the firsthalf of each month and, to a lesser extent, in the month as a whole.The problem affects payroll series calculated directly from thesedata (average weekly hours and average hourly earnings) as well asestimates from other BLS programs that use these hours and earningsmeasures as source data (such as output per hour and compensationper hour in the nonfarm business sector).
As part of the payroll (or establishment) survey, the BLS asksestablishments to report the paid hours of production ornonsupervisory employees during the pay period that includes the12th of the month. For employees paid on a monthly or semimonthlybasis, the length of this pay period varies from month to month.For example, the semimonthly pay period that includes the 12th cancontain either ten weekdays or eleven weekdays. Under theassumption that establishments report actual hours paid, the BLSmakes an adjustment to each establishment's reported hours in orderto convert them to a common weekly basis. Put another way, BLSstaff standardize the hours reported by establishments to make themmatch a standard-length month or semimonth.
Last fall, the BLS became aware of a negative correlationbetween the length of the month or semimonth and changes in thereported levels of average weekly hours and average hourly earnings.This spring, the BLS interviewed a sample of establishments that usemonthly or semimonthly pay periods and confirmed that many have beenreporting hours as though each month or semimonth were of "typical"length. That is, some firms have been "standardizing" the payperiod themselves, so when the BLS performs its standardizingadjustment, it is, in effect, over-adjusting hours for these firms.This problem, which mostly concerns establishments that have semi-monthly pay periods, has led to an overstatement of hours in monthswith ten-weekday pay periods (which are "standardized" up too much)and an understatement in months with eleven-weekday pay periods(which are "standardized" down too much). The problem appears tohave begun in 1989, when the BLS stopped asking establishments tospecify the length of the pay period for which they were reporting,and is concentrated in the service-producing sectors of the economy.
A similar problem plagues the measure of average hourlyearnings. The BLS computes average hourly earnings by dividingtotal weekly payroll (of production or nonsupervisory workers) at anestablishment by total weekly hours, after adjusting both numbers toreflect a standard-length pay period. Thus, "over-standardization"can affect both payrolls and hours. Hourly earnings are notaffected in cases in which the establishment reports both payrollsand hours on an actual length-of-pay-period basis, or in cases inwhich the establishment reports both payrolls and hours on astandardized length-of-pay-period basis, for which the biases fromthe over-standardization cancel. However, a significant number of
II-A-1

II-A-2
Effect of Length of Pay Period
Workweek Production Worker Hours
Published Experimental Published Experimental
1997: Jan. 34.4 34.6 138.2 138.9Feb. 34.8 34.7 140.0 139.5Mar. 34.8 34.7 140.2 139.7Apr. 34.5 34.6 139.6 139.9May. 34.5 34.7 140.0 140.7Jun. 34.6 34.6 140.6 140.5Jul. 34.4 34.6 140.2 140.9Aug. 34.6 34.7 140.8 141.1Sep. 34.5 34.6 140.9 141.2Oct. 34.5 34.7 141.2 141.9Nov. 34.8 34.6 142.9 142.0Dec. 34.6 34.6 142.5 142.4
1998: Jan. 34.8 34.8 143.6 143.5Feb. 34.9 34.7 144.5 143.6Mar. 34.7 34.5 143.5 142.6Apr. 34.4 34.6 142.9 143.6
NFB Hours ProductivityGrowth Growth
Published Experimental Published Experimental
1997: Q1 4.5 3.4 1.1 2.2Q2 1.5 2.6 2.3 1.2Q3 0.1 0.5 3.6 3.2Q4 3.5 2.0 1.4 2.9
1998: Q1 5.0 3.6 0.2 1.6
1997:Q4/1996:Q4 2.4 2.1 2.1 2.4

II-A-3
establishments standardize payrolls without standardizing hours.1Thus, the BLS's over-standardization of payrolls causes averagehourly earnings to be overstated in months with ten-weekday payperiods and understated in months with eleven-weekday pay periods.This bias in average hourly earnings is much less severe than is thebias in hours, but it is nonetheless significant.
With the May data (published in June), the BLS will instituteprocedures to adjust the hours and earnings data to account forthese reporting problems and will revise the data back to 1989accordingly. In the meantime, the BLS has provided the public withan experimental series of corrected figures for average weekly hoursand average hourly earnings, which the staff has used to correctother affected data series (table). Unfortunately, the correctedworkweeks and earnings are available to only one decimal place, andthe associated rounding can make a considerable difference to thecorrections made by the staff. Thus, all of the corrected seriesshould be viewed as approximate for the present. In addition, theBLS's correction factors are not yet official and are subject tosome uncertainty until the published (and rebenchmarked) series areofficially released in June.
Additional complications arise when we use the BLS estimates tocorrect the data series published in the BLS's Productivity andCosts release. In particular, the data for the nonfarm business(NFB) sector, which is the most prominent example, refer to abroader group of workers than production and nonsupervisory workerson -private nonfarm payrolls; they include nonproduction orsupervisory employees, self-employed persons, employees ofgovernment enterprises, and unpaid family workers. Because the datasubject to the LP bias refer to only the narrower group, we mustscale down the corrections to hours. This adjustment adds another,albeit small, element of imprecision to the staff's corrections.
Output in the nonfarm business sector is probably not muchaffected by the LP bias, because it is constructed so as to resemblea product-side measure of output. The estimates for some elementsof output are influenced by data on the income side, but we believethat this effect is small. Therefore, corrected output per hour inthe nonfarm business sector can be reasonably approximated bydividing output by corrected hours.
We are more uncertain about how to adjust compensation per hourfor the LP bias. For historical data (currently data prior to1997), annual estimates of compensation are derived independently ofthe data from the payroll survey (from unemployment insurance systemrecords, tax data, and other sources). Thus, the bias incompensation per hour has been the same as the bias in output perhour just discussed. For the more recent period, however, the BEAuses the hours and earnings data from the payroll survey (along withother data) to estimate compensation. Moreover, even afterbenchmarking, the payroll survey data are used to interpolate thequarterly patterns between the annual benchmarks. BEA staff haveroutinely made judgmental adjustments to the payroll data to smooththrough movements that they viewed as distorted, either byobservable special factors, such as particularly bad storms, orbecause the data themselves appeared unusually volatile. As aresult, the BEA's estimates of compensation probably have corrected
1. Few establishments standardize hours while not standardizingpayrolls.

II-A-4
somewhat for the LP bias, although there apparently is no explicitcorrection for the LP bias as such. Unfortunately, we do not knowthe extent to which the BEA's compensation estimates correct for theLP bias, and thus we have little sense of the degree of distortionremaining in estimates of recent compensation per hour, or in theintra-year movements in estimates of past compensation per hour forearlier years.

DOMESTIC FINANCIALDEVELOPMENTS
_ _~ ~_

III-T-1
Selected Financial Market Quotations1(Percent except as noted)
1997 1998 Change to Ma 13 fom
Instnument FOMC * FOMC*Sep. 30 Jan. 2 Mar. 31 May 13 Sep. 301 an. 2 Mar. 31
Short-term ratesFederal funds
intended rate 5.50 5.50 5.50 5.50 .00 .00 .00realized rate3 5.51 5.44 5.52 5.49 -.02 .05 -.03
Treasury bills'3-month 4.93 5.18 5.09 4.99 .06 -.19 -.106-month 5.08 5.19 5.04 5.17 .09 -.02 .131-year 5.18 5.18 5.16 5.16 -.02 -.02 .00
Commercial paper
1-month 5.51 5.56 5.54 5.49 -.02 -.07 -.053-month 5.48 5.54 5.44 5.48 .00 -.06 .04
Large negotiable CDs 4
1-month 5.59 5.64 5.59 5.56 -.03 -.08 -.033-month 5.67 5.69 5.60 5.59 -.08 -.10 -.016-month 5.72 5.71 5.64 5.67 -.05 -.04 .03
Eurodollar deposits
1-month 5.56 5.59 5.56 5.50 -.06 -.09 -.063-month 5.63 5.69 5.56 5.56 -.07 -.13 .00
Bank prime rate 8.50 8.50 8.50 8.50 .00 .00 .00
Intermediate- and long-term rates
U.S. Treasury (constant maturity)
3-year 5.88 5.62 5.69 5.60 -28 -.02 -.0910-year 6.12 5.67 5.72 5.64 -48 -.03 -.0830-year 6.41 5.86 5.98 5.95 -.46 .09 -.03
U.S. Treasury 10-year indexed note 3.61 3.70 3.75 3.76 .15 .06 .01
Municipal revenue (Bond Buyer) 5.63 5.41 5.42 5.49 -.14 .08 .07
Corporate-A utility, recently offered 7.44 6.96 7.17 7.17 -.27 .21 .00
High-yield corporate' 9.02 9.04 8.86 9.00 -.02 -.04 .14
Home mortgages'
FHLMC 30-yr fixed rate 7.28 7.03 7.08 7.14 -.14 -.70 .06PHLMC 1-yr adjustable rate 5.51 5.50 5.70 5.65 .14 .15 -.05
ecad hih 199 Percenae ch e to May 13. from:
FOMC* Record FOMC *
tock echange index Level Date an. 2 Mar. 31 May 13 igh Jan. 2 Mar. 31
Dow-Jones Industrial 9211.84 5/13/98 7965.04 8782,12 9211.84 .00 15.65 4.89
S&P 500 Composite 1130.54 4/22/98 975.04 1093.55 1118.86 -1.03 14.75 2.31
NASDAQ (OTC) 1917.61 4/22/98 1581.53 1818.70 1866.18 -2.68 18.00 2.61
Russell 2000 491.41 4/21/98 436.52 476.23 477.48 -2.83 9.38 .26
Wilshire 10782.75 4/22/98 9327.71 10423.24 10622.47 -1.49 13.88 1.911. One-day quotes except as noted.2. FOMC's intended rate.3. Average for two-week reserve maintenance period ending on or before date shown. Most recent observation is average for current maintenance
period to date.4. Secondary market5. Bid rates for Eurodollar deposits at 11 am. London time.6. Most recent observation based on one-day Thursday quote and futures market index changes.7. Merril Lynch Master H high-yield bond index composite.8. Quotes for week ending Friday previous to date shown.* Figures cited are as of the close on March 30,1998.

Selected Short-Term Interest Rates6.5 -
Statement Week Averages
Federal funds
6.0 -
5.5
5.0
4.5
4.0
9
8
7
6
5
4
9.0
8.5
8.0
7.5
7.0
6.5
6.0
5.5
Selected Interest Rates
Percent
,I *
* - .:.-. ..S' * *" .. * e~" 9.
I 3 *, I-I; pI~: I~ 1
1997 1998
Selected Long-Term Interest Rates Percent
wew Corporate bondsFriday .. Autility* .* ***-* '*.. .. .* ***, recently ofered
.*. Thawuybods *."'..,..30-year ont maturity " ',,.
.*
Municipal bondsBond Buyr Fl lue
(Thursday)
r ' | I ! I I "" ' I I I - 'I I
1997 1998
Selected Mortgage Rates
weeklyFriday
FRM
*^\-y
- .*.. ARM.* **
.- - .' *' *.. * * -* * ' * * * * ' * *
6
Federal Funds' Percent8 - - 8
Daily
7 - - 7
6 6
5 5
4 L'"'uJ"l-'r 'ii'"" 4
Mar. 20 May 13Vwrtal Unes indicte nd ol reervea aod
Treasury Bills Percent.0 -- 6
3-monthDily
May13
Percent
rporat ........,-I
5.5
5.0
4.5
4.0 u..u.Mar. 20
8.0 -Weekly
7.5
7.0 *-
6.5
5.5 Mu
5.0 I--Mar. 20
*o vr equev.
Mar. 20 May 8
nolpal 6S6.
May
Percent
1997 1998

DOMESTIC FINANCIAL DEVELOPMENTS
Interest rates were little changed on balance over the
intermeeting period. After dropping a bit in early April, rates
crept higher in response to public statements by FOMC members
expressing concern about the risk of unsustainably rapid economic
growth. Rates stepped up a notch near month-end amid press reports
that the latest policy directive had tilted toward restraint, but
they subsequently receded when incoming data indicated that
inflation continued to be subdued even as the economy grew rapidly.
Federal funds and Eurodollar futures rates remain relatively flat
for contracts through the summer, implying (after allowance for a
small term premium) that market participants place only small odds
on System tightening at the next few FOMC meetings. Quality spreads
on corporate debt have widened a bit but still are quite narrow by
historical standards, and major equity price indexes have tacked on
gains of 2 percent to 5 percent. The higher stock prices, in the
face of slower growth in earnings, have kept price-earnings ratios
for these indexes near historical highs.
Private sector borrowing has remained brisk in recent months
and has involved some shifting from shorter-term to longer-term
debt, particularly by businesses. Gross bond issuance by
nonfinancial firms rose to a record level in April from a strong
March, while bank loans to businesses weakened and net issuance of
commercial paper turned negative over those months. Households have
been adding substantially to their total mortgage debt as the
housing market has boomed and have been refinancing a sizable
portion of their existing mortgages at lower rates. Consumer credit
expansion has been relatively light, at least partly because of
substitution into mortgage debt in the course of refinancing a
mortgage or obtaining a home equity loan. Borrowing by state and
local governments has eased off its torrid pace very recently as
municipalities have pared their offerings at a time of seasonally
low investor demand. Gross issuance of Treasury debt has been
trimmed of late, as swollen tax-payment receipts have enabled the
Treasury to pay down a hefty amount of marketable debt.
The monetary aggregates continued to grow rapidly in April,
boosted by a larger-than-seasonal buildup in household liquid
accounts in anticipation of income tax payments. Since the fourth
III-1

III-2
GROSS ISSUANCE OF SECURITIES BY U.S. CORPORATIONS(Billions of dollars; monthly rates, not seasonally adjusted)
1997 1998
Type of security 1996 1997 4 Q1 Feb. Mar. Apr.
All U.S. corporationsStocks 1
Bonds
Nonfinancial cororationsStocks1
Initial public offeringsSeasoned offerings
Bonds
By rating, sold in U.S. 2
Investment gradeSpeculative grade
PublicRule 144A
Finpcial comporationsStocks'Bonds
Net issuance of commercialpaper, nonfinancial corporations 3
Change in Cal loans atcommercial banks 3
58.410.248.2
69.79.8
59.9
72.011.660.4
95.812.483.4
5.0 5.61.8 2.53.2 3.1
85.411.274.3
119.818.4
101.4
89.211.777.5
5.7 10.61.8 1.54.0 9.1
12.5 17.3 17.0 25.7 22.9 24.8 32.4
6.34.82.32.5
3.5 4.835.8 42.6
6.043.4
1.1 1.1
6.0 5.4
13.310.51.98.6
6.457.7
8.811.91.6
10.2
5.451.3
4.5
13.110.0
2.97.1
7.876.6
12.817.51.9
15.6
6.445.2
-. 7 -8.2
3.6 10.0 -9.1
Note. Components may not sum to totals because of rounding. Thesedata include speculative-grade bonds issued privately under Rule 144&.All other private placements are excluded. Total reflects gross proceedsrather than par value of original discount bonds.
1. Excludes equity issues associated with equity-for-equity swaps that haveoccurred in restructurings.
2. Bonds categorized according to Moody's bond ratings, or to Standard & Poor'sif unrated by Moody's. Excludes mortgage-backed and asset-backed bonds.
3. End-of-period basis. Seasonally adjusted.
Share of High Yield New IssuanceRated B- or Lower Percent
-i 80
1986 1990 1994 1998
Rating ChangesBillions of dollars
-400Nonfinancial
30001
Upgrades- 200
100
100
Downgrades 200
300
4001990 1992 1994 1996 1998
Note. 199&81 observation at an annual rate.Source. Moody's Investors Service.
6.4
Note. 1998 estimate through April.Source. Merrill Lynch, Securities Data Company.
-. =Amw-.-s- I
1III3I(11 1 11 1

III-3
quarter of last year, M2 has grown at a rate of 8-1/4 percent, well
above the upper bound of its target range. In May, however, with
the tax payment dates having passed, M2 balances are apparently
running off.
Business Finance
Gross issuance of nonfinancial corporate bonds surged in April
on the heels of robust growth in March, in large part reflecting a
desire to lock in low funding costs. A large portion of the
proceeds from investment-grade offerings have been used to retire
shorter-term liabilities, including both bank loans and commercial
paper. Indeed, following a slight runoff in March, nonfinancial
commercial paper outstanding dropped more than $8 billion in April.
Gross offerings of speculative-grade bonds climbed to a record high
in April, but a substantial portion of the funds has been used to
retire outstanding debt with higher interest rates. On balance,
total net borrowing by businesses over the past two months has
moderated from the elevated pace of early this year to one closer to
that of 1997 as a whole.
The most recent spate of junk bond issuance involved several
companies with very low bond ratings that entered the market for the
first time. As a result, the percentage of total junk bond proceeds
raised through issues rated B- or lower has jumped to 35 percent for
the current year to date (chart, lower left), establishing a bond
market tone reminiscent of the go-go days of the late 1980s. 1
Indeed, if the recent pace persists, this year's dollar volume of
proceeds from lower-rated junk issuance will surpass 1988's
$20 billion record by midyear. Perhaps because of pressure from the
recent flood of offerings, junk spreads recently widened about
10 basis points, but they are still close to historical lows.
Recent information on corporate credit quality has been mixed.
Missed payments by two large retailers helped boost junk bond
defaults in the first quarter; nonetheless, the default rate on junk
1. The chart likely understates the importance of very low ratedcompanies tapping the junk bond market during the current wave ofissuance. Since 1990, about two-thirds of high-yield debt issuedhas represented senior debt of the issuer. In contrast,subordinated debt accounted for the majority of high-yield debt inthe 1985-89 period, suggesting that the share of the lowest-ratedissues on a "senior equivalent" basis during those years would beconsiderably lower than represented in the chart. Indeed, a WallStreet firm that calculates high-yield debt issuance on a "seniorequivalent" basis puts the share of the lowest-rated issues for thefirst quarter of 1998 at a record high.

III-4
Corporate Earnings and Stock Market PricesCorporate Earnings Nonfinancial S&P 500 Earnings
Percent change from 4 quarters earlier Percent change from 4 quarters earlier30
Quarterlyi20 Technoogy
. 0 ". / , -
1992 1995
'Source. Goldman Sachs
Stock Market Price Indexes
2400 raiDaily
2100
1800
1500
1200
9001996 1997
1998 1996 1997Source. 1/B/E/S.
S&P 500 Forward Earnings-Price Ratio
1200
1100
1000
900
800
700
600
5001985 1990 1995
*Nominal yield minus 10-year inflation expectation Iromthe Philadelphia Fed survey.

III-5
debt remains quite low by historical standards. In addition,
business failures slowed in the first quarter after picking up some
during the second half of 1997. Rating changes in the first quarter
resulted in a small net upgrade in the nonfinancial sector (chart,
lower right). However, looking forward, the amount of nonfinancial
debt on Moody's Watchlist for a possible downgrade slightly exceeds2
that on review for an upgrade. Expected default rates, based on
the distribution of outstanding debt by rating and default
probabilities across the rating classes, moved up during the first
quarter as the share of outstanding debt at the bottom end of the
credit-quality spectrum increased.
Gross equity issuance by nonfinancial firms surged in March but
retreated to a more modest $5-1/4 billion total in April. Seasoned
offerings have been bolstered in these months by companies issuing
equity to help pay for cash-financed acquisitions. IPO activity
remained fairly light in March and April. Although investors have
bid prices sharply higher for a few Internet and computer software
companies, they have otherwise remained relatively cautious about
new offerings.
Despite strong gross issuance of equities, net issuance has
continued to be quite negative and, based on recent announcements,
will remain so for a time. About $27 billion in equity was retired
in merger and acquisition transactions completed during the first
quarter, and this pace was roughly maintained in April. Since the
beginning of the year, more than half of the equity retirement
occurred through merger and acquisition deals of less than
$1 billion, and lists of pending mergers suggest that this pattern
will persist. Corporations also continued to announce sizable share
repurchase programs.
With most first-quarter earnings reports now in, the four-
quarter growth rate in S&P 500 earnings per share appears to have
slowed to around 4 percent, from 7 percent in the fourth quarter
(chart, upper left). Profits in the nonfinancial sector were nearly
flat year-over-year. In contrast, the growth of financial sector
profits picked up in the first quarter, to about 15 percent, driven
by spectacular gains in the securities industry.
2. On the financial side, debt of nearly $220 billion associatedwith two mammoth mergers--Citicorp with Travelers Group andBankAmerica with Nationsbank--was put on watch with positiveimplications.

III-6
Consumer Credit
1997 1998
1996 1997 Q3 Q4 Q 1P Jan Feb Mar p
Credit outstanding, end of period
Growth rates(percent, SAAR)
7.8 4.3 4.0 2.2
(7.8) (4.4) (4.2) (2.5)
3.8 6.0(4.5) (6.9)
7.7
12.7
0.5
Levels(billions of dollars, SA)
Total
AutoRevolving
Other
Interest rates 1
(annual percentage rate)
Commercial banksNew cars (48 mo.)2
Personal (24 mo.)2
Credit cards3
Auto finance companies 4
New cars
Used cars
1179.9 1230.7 1223.8 1230.7 1241.7 1234.6 1240.7 1241.7
392.4 413.5 405.2 413.5 419.7 415.5 416.8 419.7
499.2 530.8 526.4 530.8 537.2 532.9 536.6 537.2288.3 286.4 292.3 286.4 284.9 286.2 287.3 284.9
9.013.5
15.6
13.5
9.0
13.9
15.8
7.1
13.3
9.013.8
15.8
6.3
13.4
9.0
14.5
15.7
6.7
13.2
8.9
14.0
15.7
6.312.8
n.a.
n.a.
n.a.
6.1
12.8
8.914.0
15.7
7.012.9
n.a,
n.a,
n.a.
5.9
12.8
Total
(Previous)
Auto
RevolvingOther
1.0
8.4
1.3-10.1
1. Annual data are averages of quarterly data for commercial banks and of monthly data for finance companies.2. Average of most common rate charged for specified type and maturity during the first week of the middle month of each quarter.3. StatedAPR averaged across all credit card accounts at all reporting banks during the period.4. Average rate for all loans of each type, regardless of maturity, made during the period.p Preliminary. n.a. Not available,

III-7
The deceleration in the profits of nonfinancial firms was more
than accounted for by a plunge in the profits of oil and gas
companies (chart, upper right), together with an erosion of earnings
in the technology sector that has stemmed partly from the financial
turmoil in Asia. In contrast, profits for nonfinancial firms
outside these two sectors--companies that account for about three-
fourths of the profits of nonfinancial firms in the S&P 500--stayed
on a steady 5 percent to 7 percent growth path. Profits at some of
these firms--particularly airlines--have probably benefited from the
lower fuel costs depressing energy sector profits; in fact, the
decline in fuel costs may have boosted first-quarter earnings growth
of the "other nonfinancial" sector roughly 1 percentage point.
Assuming that oil prices remain at their current levels, this
beneficial effect (on four-quarter comparisons) likely will extend
into the second quarter. After that, however, the boost to profits
is expected to dissipate and then to at least partly reverse as the
cost savings of cheaper fuels are passed on to consumers.
Reflecting the propensity of both analysts and investors to
view the recent weakness in profits as transitory and to view the
economic outlook as favorable to earnings, equity prices moved up to
record highs during the intermeeting period before dropping back a
bit (chart, lower left). Most major equity indexes rose 2 percent
to 5 percent over the period, bringing year-to-date gains to between
15 percent and 20 percent, although the Russell 2000--an index of
small-cap firms--has gained only about 10 percent year-to-date.
These recent price gains, together with the current flattening
of earnings, has pushed many valuation measures further beyond
historical experience. The forward-earnings yield on the S&P 500
--equal to expected earnings in the year ahead divided by current
price--has fallen below 4-1/2 percent (chart, lower right). At the
same time, the real long-term bond yield, measured as the difference
between the nominal thirty-year yield minus the Philadelphia Fed's
measure of long-term inflation expectations, has remained about
unchanged at 3-1/2 percent.
Household Sector Finance
Total household debt appears to have posted another sizable
gain in the first quarter, reflecting the robust expansion in
consumer spending and housing activity. The growth of household
debt was again driven by strong mortgage borrowing, as consumer
credit increased only 3-1/2 percent at an annual rate in the first

III-8
MBA Mortgage Purchase Application Index(Seasonally adjusted by Board staff)
Weekly........ Index
4-week moving average
March 16,1990 = 100
., May 8
1990 1991 1992 1993 1994 1995 1996 1997
MBA Mortgage Refinancing Application Index(Seasonally adjusted by Board staff)
Weekly
March 16, 1990=100
May 8
2500
2000
1500
1000
500
01990 1991 1992 1993 1994 1995 1996 1997 1998
Delinquency Rate at Auto Finance Companies(Seasonally adjusted)
Percent-I 3.75
Monthly- 3.50
I . , I , , I .I I 1 . I . I I . I . I
3.25
3.00
2.75
2.50
2.25
2.00
1998
1996
-~ ~--
- - -- - - - - - -1990 1991 1992 1993 1994 1995 1997 1998

III-9
quarter (table). The growth of consumer credit likely has been
stunted to some extent by paydowns associated with this year's
increased mortgage refinancings.
Low mortgage rates and strong home sales continue to fuel
household mortgage borrowing. Complete data for the first quarter
are not yet available, but the figures for commercial banks and
mortgage pools are indicative of robust growth. Available
indicators for April point to a continuation of this trend; for
instance, the mortgage purchase application index from the Mortgage
Bankers Association remains at an elevated level (chart). The MBA
index of mortgage refinancing applications is also high, although
below the peak reached in January (chart).
The few recent indicators of household credit quality have been
favorable. The auto loan delinquency rate at the captive auto
finance companies declined in February and March and is at its
lowest level in two years (chart). Also, the delinquency rate on
credit card receivables backing securities rated by Moody's fell in
March from the year-earlier period for the fourth consecutive month
(not shown).
Households continue to invest heavily in stock and bond mutual
funds. The Investment Company Institute reports that net sales of
long-term mutual funds in March totaled nearly $32 billion, with
both stock and bond funds selling briskly (table). Staff estimates
based on weekly ICI data suggest that equity fund sales remained
strong in April, but that net flows into bond funds moderated some,
quite possibly because of redemptions associated with income tax
payments. Sales of international equity funds have bounced back in
recent months after falling off sharply in the October-January
period; however, equity funds focused on Asia had small net outflows
in March and April. Preliminary data, provided by the ICI on a
confidential basis, indicate that mutual fund inflows were very
strong in the first week of May. Household balance sheets continue
to be strengthened by rising equity prices, which boosted the ratio
of household net worth to income to a new high in the first quarter
(chart).
Federal Sector Finance
Strong inflows of federal tax receipts this spring have led
the Treasury to further pare its weekly bill auctions, from
$14-1/2 billion in February to $13-1/2 billion in March and to
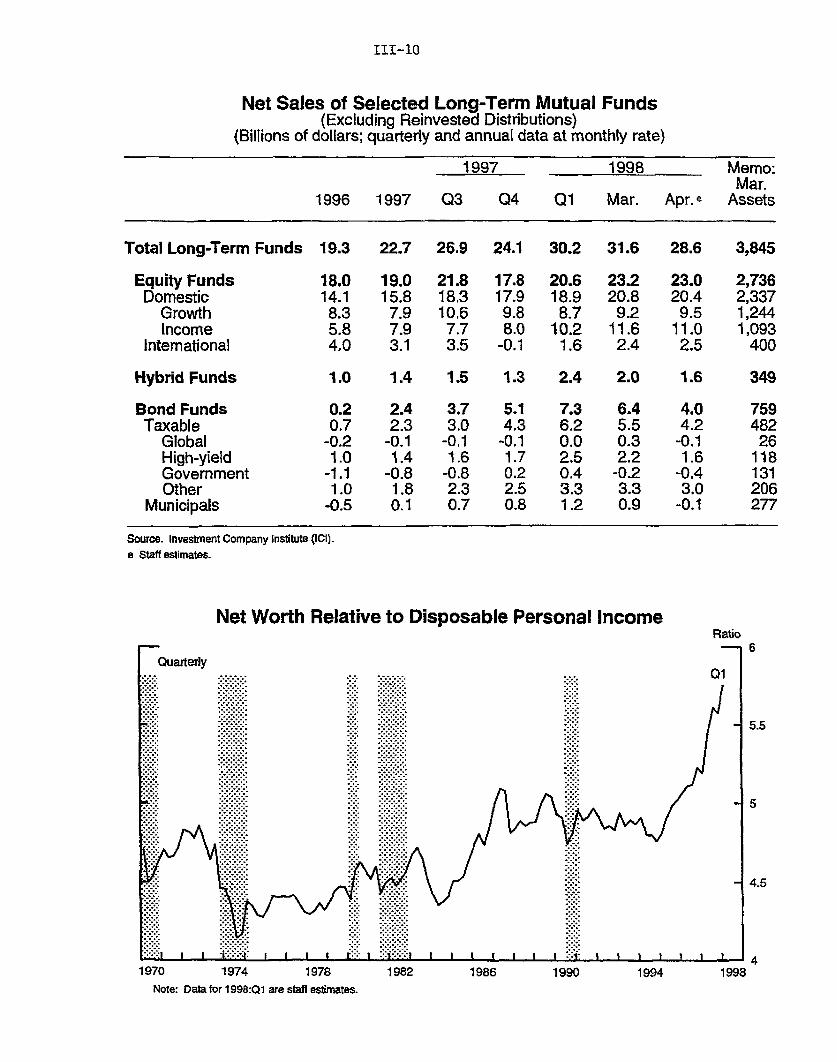
I1I-10
Net Sales of Selected Long-Term Mutual Funds(Excluding Reinvested Distributions)
(Billions of dollars; quarterly and annual data at monthly rate)
1997 1998 Memo:Mar.
1996 1997 Q3 Q4 Q1 Mar. Apr.e Assets
Total Long-Term Funds 19.3 22.7 26.9 24.1 30.2 31.6 28.6 3,845
Equity Funds 18.0 19.0 21.8 17.8 20.6 23.2 23.0 2,736Domestic 14.1 15.8 18.3 17.9 18.9 20.8 20.4 2,337
Growth 8.3 7.9 10.6 9.8 8.7 9.2 9.5 1,244Income 5.8 7.9 7.7 8.0 10.2 11.6 11.0 1,093
International 4.0 3.1 3.5 -0.1 1.6 2.4 2.5 400
Hybrid Funds 1.0 1.4 1.5 1.3 2.4 2.0 1.6 349
Bond Funds 0.2 2.4 3.7 5.1 7.3 6.4 4.0 759Taxable 0.7 2.3 3.0 4.3 6.2 5.5 4.2 482
Global -0.2 -0.1 -0.1 -0.1 0.0 0.3 -0.1 26High-yield 1.0 1.4 1.6 1.7 2.5 2.2 1.6 118Government -1.1 -0.8 -0.8 0.2 0.4 -0.2 -0.4 131Other 1.0 1.8 2.3 2.5 3.3 3.3 3.0 206
Municipals -0.5 0.1 0.7 0.8 1.2 0.9 -0.1 277
Source. Investment Company institute (ICI).e Staff estimates.
Net Worth Relative to Disposable Personal IncomeRatio
19981970 1974 1978 1982 1986 1990 1994
Note: Data for 1998:Q1 are staff estimates.

III-ll
$13 billion in April. The decline in bills auctioned in recent years
has curtailed liquidity in this market, threatened the benchmark
status of these instruments, and lengthened the average maturity of
Treasury debt. Going forward, the Treasury plans to reduce coupon
issuance and step up bill sales to curb these trends: After this
quarter, it will stop issuing three-year notes and will reduce the
frequency of five-year note auctions to quarterly from monthly.
Bill auctions are expected to rise back to the $14 billion to
$15 billion range after the second quarter, reversing a long string
of net paydowns. The Treasury also plans to slash the amount of
cash management bills outstanding by about $50 billion in the second
quarter.
In April, the Treasury held its first auction of thirty-year
index-linked bonds, raising about $8 billion at a yield of
3.74 percent. With a bid-to-cover ratio of 2.6, this auction was
viewed as less successful than the initial auctions of five- and
ten-year Treasury Inflation Protected Securities (TIPS), for which
bids ran at least three times the amount sold. The Treasury plans
to sell an additional $8 billion of thirty-year indexed bonds in
July as a reopening of this issue. TIPS yields have tended to rise
in recent months, and the TIPS yield curve has a pronounced downward
slope, with the thirty-year bond yielding about 25 basis points less
than the five-year note. This inversion may reflect, in part, the
combined effect of high and rising real short-term rates and
expectations that they will eventually decline.
Foreign holdings of marketable U.S. Treasuries evidently have
plateaued after having risen substantially since early 1995.
Foreign official holdings fell over recent weeks, primarily as a
result of the sale of about $15 billion of bills by the Bank of
Japan to finance its mid-April intervention in support of the yen.
Government-sponsored enterprises continued to issue large
amounts of debt over the intermeeting period, capitalizing on the
slightly lower market yields and the favorable financing environment
resulting from the cutback in Treasury auctions. Freddie Mac
completed the largest U.S. corporate debt sale ever--a $5 billion
issue of its new Reference Notes series. These notes are intended
to take advantage of the reduction in Treasury issuance to establish
GSE securities as benchmarks for corporate issuance and to realize
the yield advantages of the additional liquidity that is associated
with such status. Fannie Mae has been issuing in volume as well and

III-12
TREASURY FINANCING(Billions of dollars)
1997 1998
Item Q3 Q4 Q1 Feb. Mar. Apr.
Total surplus / deficit(-) -10.9 -39.7 -30.2 -41.7 -13.8
Means of financing deficit
Net borrowing andrepayments (-) 10.6 33.7 25.9 30.6 20.1 -59.8
Nonmarketable 4.1 15.8 16.8 5.0 9.6 8.0Marketable 6.5 17.9 9.0 25.5 10.5 -67.8
Bills -2.2 14.4 4.5 16.3 14.9 -62.0Coupons 8.7 3.5 4.6 9.2 -4.4 -5.7
Decrease in cash balance 7.6 11.7 4.3 24.0 -11.4 -60.4
Other1 -7.4 -5.7 0.0 -12.8 5.0
Memo:Cash balance, end of period 43.6 31.9 27.6 16.3 27.6 88.0
Note. Details may not sum1. Direct loan financing,
and other transactions.e estimated
to totals because of rounding.accrued items, checks issued less checks paid,
NET CASH BORROWING OF GOVERNMENT-SPONSORED ENTERPRISES(Billions of dollars)
1997 1998
Agency Q4 Q1 Jan. Feb. Mar.
FHLBs 18.7 4.0 -2.5 0.6 5.9FHLMC 9.2 24.1 12.7 2.2 9.2FNMA 11.8 11.3 0.8 3.1 7.5Farm Credit Banks 1.9 -1.2 -2.2 -0.1 1.1SLMA -2.8 -1.4 1.7 0.2 -3.3
Note. Excludes mortgage pass-through securities issued byFNMA and FHLMC.

III-13
has announced that it plans to sell $100 billion of debt over the
year compared with $80 billion issued in 1997. Despite heavier
issuance, spreads between non-callable agency-issued securities and
Treasuries have remained largely unchanged, currently ranging from
17 to 35 basis points. The GSEs are mainly using these newly raised
funds to expand their portfolio holdings. Fannie Mae's net mortgage
portfolio increased $11 billion in the first quarter, and Freddie
Mac's portfolio expanded $22 billion. Both reported record earnings
for the first quarter.
State and Local Government Finance
Issuance of municipal debt slowed in April to $21-1/2 billion
from a near record $29 billion in March. Issuers, typically faced
with weakened investor demand during the tax-payment season, were
hesitant to come to market in April. New capital raised was about
$13 billion, well below the March figure (although substantially
more than last April). As in the first quarter, the largest
issuance for new capital was in the education, health, and
transportation categories. With the rates on tax-exempt securities
backing up 10 to 12 basis points in April, refundings also declined
from the very rapid March pace. Indicative of the market's
difficulty in absorbing new issues during the tax season, long-term
yields relative to Treasuries have risen a bit despite the drop in
issuance. Credit quality continued to improve across all sectors
over the first four months of the year, with the number of upgrades
outpacing the number of downgrades by a ratio of around six to one.
Monetary Aggregates and Bank Credit
The monetary aggregates expanded briskly in April before
slowing most recently. M2 grew at a 9 percent rate last month,
about 1-1/4 percentage points faster than its first-quarter pace.
A buildup in household liquid accounts in apparent preparation for
income tax payments boosted M2 growth well beyond the amount allowed
for by seasonal factors. Indications are that M2 contracted in
early May, presumably as tax payments cleared deposit accounts.
M3 grew slightly faster than M2 in April. Most of the increase
in M3's non-M2 components was accounted for by a 52 percent (SAAR)
surge in institutional money market mutual funds. The surge, which
was most pronounced just before the deadline for corporate tax
payments, was partly offset by a 10 percent runoff in large time
deposits.

III-14
GROSS OFFERINGS OF MUNICIPAL SECURITIES(Billions of dollars; monthly rates, not seasonally adjusted)
1997 1998
1995 1996 1997 Q4 Q1 Feb. Mar. Apr.
Total tax-exempt 15.4 17.9 21.5 24.0 23.3 22.3 28.9 21.5Long-term 12.1 14.3 17.9 21.1 22.0 21.3 27.9 20.3Refundings1 3.6 4.9 6.6 8.0 9.5 8.8 12.7 7.7New capital 8.5 9.4 11.3 13.1 12.5 12.5 15.1 12.6
Short-term 3.3 3.6 3.6 2.9 1.3 1.0 1.1 1.3
Total taxable 0.7 0.8 1.1 0.9 1.3 0.7 2.2 0.8
Note. Includes issues for public and private purposes.1. All issues that include any refunding bonds.
Tax-Exempt to Taxable Yield Ratio
Thirty-Year Revenue Bond Yield to Thirty-Year Treasury Yield Ratio1
0.98
0.96
0.94
0.92
0.9
0.88
0.86
0.84
-- 0.821998
*Average of weekly data. Last value is average of weeks to date.
1994 1995 1996 1997

III-15
MONETARY AGGREGATES(Based on seasonally adjusted data)
1997 1998 1998 1997:Q4 Level- --- to (bil. S)
1997 Q4 Q1 Feb. Mar. Apr. Apr. 98 Apr. 98Aggregate or component (p) (p) (p)
Aggregate Percentage change (annual rate) 1
1. Ml2. M22
3. M3
Selected Components
4. Currency
5. Demand deposits
6. Other checkable deposits
-1.2 .95.6 6.98.8 10.2
7.5 8.7
3.07.9
11.3
5.1 -1.88.2 9.6
14.1 10.2
9.8 3.9
2.3 1079.48.5 4159.6
11.4 5583.3
3.9 6.8 433.8
-2.0 -3.7 -1.8 -2.4 -2.4 -12.0 -4.0 387.2
-12.2 -4.7 1.5 19.6 4.8 5.2 250.5
7. M2 minus M13 8.3 9.1 9.7 11.8 9.3 13.6 10.7 3080.2
8. Savings deposits9. Small time deposits
10. Retail money market funds
11. M3 minus M24
12. Large time deposits, net5
13. Institution-only money marketmutual funds
14. RPs15. Eurodollars
Memo
16. Sweep-adjusted M1617. Monetary base18. Household M27
9.91.9
16.0
12.2 12.0 13.3 11.9 23.5.7 .2 -1.0 -2.6 -4.0
16.0 19.6 28.7 21.6 18.0
20.0 20.8 21.8
18.1
21.017.030.4
6.15.96.5
14.6 1470-0-1.1 960.320.6 649.9
6.9 31.4 11.9 20.5 1423.7
12.7 20.3 27.0 31.2 -9.2 16.4 610.9
22.0 18.9 12.3 22.5 51.7 26.3 408.838.3 32.3 -26.4 87.6 -4.2 28.8 256.423.4 17.7 -30.6 -33.8 23.2 8.4 147.7
6.43.5
12.5
4.9 6.4 1353.22.4 5.4 486.99.9 9.8 3769.3
Average monthly change (billions of dollars)
Memo
Selected managed liabilitiesat commercial banks:
19. Large time deposits, gross20. Net due to related foreign
institutions
21. U.S. government depositsat commercial banks
11.2
-3.4
8.4 8.5 13.1 17.6 -4.2
7.2 -7.9 -22.1 -30.2
.2 .8 -. 4 -6.3
1. For the years shown, fourth quarter-to-fourth quarter percent change. For the quarters shown, based onquarterly averages.
2. Sum of seasonally adjusted Ml, retail money market funds, savings deposits, and small time deposits.3. Sum of retail money funds, savings deposits, and small time deposits, each seasonally adjusted separately.4. Sum of large time deposits, institutional money funds, RP liabilities of depository institutions, and
Eurodollars held by U.S. addressees, each Seasonally adjusted separately.5. Net of holdings of depository institutions, money market mutual funds, U.S. government, and foreign banks
and official institutions.6. Sweep figures used to adjust these series are the estimated national total of transaction account
balances initially swept into MMDAs owing to the introduction of new sweep programs, on the basis of monthlyaverages of daily data.7. M2 less demand deposits.8. For the years shown, "average monthly change" is the fourth quarter-to-fourth quarter dollar change,
divided by 12. For the quarters shown, it is the quarter-to-quarter dollar change, divided by 3.
p--Preliminary.
. . . 711.7
. . . 171.1
. . . 26.6
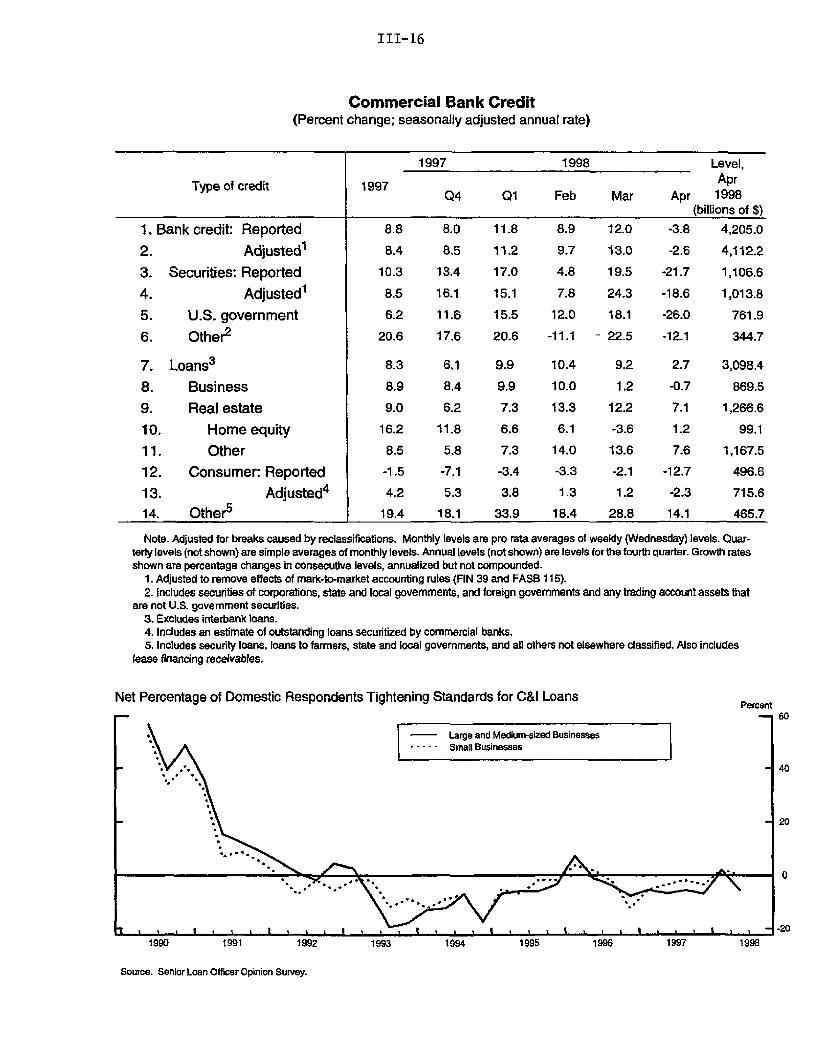
III-16
Commercial Bank Credit(Percent change; seasonally adjusted annual rate)
1997 1998 Level,
Type of credit 1997 AprQ4 Q1 Feb Mar Apr 1998
(billions of $)
1. Bank credit: Reported 8.8 8.0 11.8 8.9 12.0 -3.8 4,205.0
2. Adjusted1 8.4 8.5 11.2 9.7 13.0 -2.6 4,112.2
3. Securities: Reported 10.3 13.4 17.0 4.8 19.5 -21.7 1,106.6
4. Adjusted' 8.5 16.1 15.1 7.8 24.3 -18.6 1,013.8
5. U.S. government 6.2 11.6 15.5 12.0 18.1 -26.0 761.9
6. Other2 20.6 17.6 20.6 -11.1 - 22.5 -12.1 344.7
7. Loans3 8.3 6.1 9.9 10.4 9.2 2.7 3,098.4
8. Business 8.9 8.4 9.9 10.0 1.2 -0.7 869.5
9. Real estate 9.0 6.2 7.3 13.3 12.2 7.1 1,266.6
10. Home equity 16.2 11.8 6.6 6.1 -3.6 1.2 99,1
11. Other 8.5 5.8 7.3 14.0 13.6 7.6 1,167.5
12. Consumer: Reported -1.5 -7.1 -3.4 -3.3 -2.1 -12.7 496.6
13. Adjusted4 4.2 5.3 3.8 1.3 1.2 -2.3 715.6
14. Other5 19.4 18.1 33.9 18.4 28.8 14.1 465.7
Note. Adjusted for breaks caused by reclassifications. Monthly levels are pro rata averages of weekly (Wednesday) levels. Quar-terly levels (not shown) are simple averages of monthly levels. Annual levels (not shown) are levels for the fourth quarter. Growth ratesshown are percentage changes in consecutive levels, annualized but not compounded.
1. Adjusted to remove effects of mark-to-market accounting rules (FIN 39 and FASB 115).2. Includes securities of corporations, state and local governments, and foreign governments and any trading account assets that
are not U.S. government securities.3. Excludes interbank loans.4. Includes an estimate of outstanding loans securitized by commercial banks.5. Includes security loans, loans to farmers, state and local governments, and all others not elsewhere classified. Also includes
lease financing receivables.
Net Percentage of Domestic Respondents Tightening Standards for C&l LoansPercent
I- arge and Medium-sized Businesses-..... Small Businesses
nL 1.-.
%' ~-, ..
t . I . I I 1
Source. Senior Loan Officer Opinion Survey.
'
'-''

III-17
The weakness in these deposits was linked to a decline in
credit provided by commercial banks in April. Bank credit, adjusted
for mark-to-market rules, fell at a 2-1/2 percent rate, a sharp
turnaround from the double-digit monthly gains posted since the
beginning of the year. Adjusted securities holdings fell at nearly
a 19 percent rate in April following several months of very rapid
growth. Declines were evident in both trading and investment
accounts and were driven by large sales of mortgage-backed
securities.
Loan growth also slowed markedly last month, registering only a
2-3/4 percent rise. The slowing was particularly pronounced for
real estate credit and consumer loans. Even after adjusting
consumer loans for a sizable amount of securitizations, weakness was
still evident in that category, most likely reflecting households'
continued substitution of real estate credit for consumer loans.
The reduced growth in real estate lending by banks owed partly to
increased securitization of home mortgages by some large
institutions in April; underlying originations of primary mortgages
apparently remained strong. The relatively small increase in home
equity loans (and the March decline) reflects in part the folding of
second mortgages into refinanced first liens.
Business loans, which slowed sharply in March, declined a
little in April. The movement of business loans from balance sheets
to collateralized loan obligations (CLOs) contributed to some of the
softening in business loans over March and April. In addition, as
noted, corporations have continued to use the proceeds of bond
offerings to pay down bank loans and other forms of debt. Business
loans made by foreign banks--for whom CLO issuance was particularly
pronounced--plummeted at a 31 percent annual rate last month,
whereas domestic institutions recorded moderate increases.
The May Senior Loan Officer Opinion Survey found that a handful
of domestic banks, on net, had eased business lending standards
since the January survey (chart) and that a larger number had been
providing more favorable terms, suggesting a more accommodative
posture than in January. 3 About 40 percent of the domestic
respondents, on net, had narrowed yield spreads for large firms, and
3. The FDIC's semiannual report on underwriting practicesindicated that a few more banks had loosened standards than hadtightened them over the six months ending March 31, but that thevast majority had made no change in lending standards at all. Thisfinding is consistent with the marginal easing shown by the loanofficer opinion surveys for that period.

III-18
about a quarter reported narrower spreads for small businesses. By
contrast, about a quarter of the branches and agencies of foreign
banks reported tighter standards on commercial and industrial loans.
About a third, on net, reported increasing costs of credit lines,
and somewhat smaller proportions reported widening spreads and
cutting loan sizes. These institutions--primarily arms of Japanese
banks--attributed their tightening mainly to a weakening of their
parents' capital positions.

APPENDIX
THE MAY SENIOR LOAN OFFICER OPINION SURVEYON BANK LENDING PRACTICES
The May 1998 Senior Loan Officer Opinion Survey on Bank LendingPractices, primarily covering changes over the past three months,posed the usual questions bearing on the supply of and demand forbank loans to businesses and households. Additional questionstargeted the recent growth in bank securities holdings, residentialmortgage loans, and loans to real estate investment trusts (REITS);banks' handling of possible risks related to the year 2000preparedness of their customers; and the effects of the economicproblems in Asia on the provision of trade credit to firms in theaffected economies.
A few of the domestic respondents reported easing standards onloans to businesses, and a large percentage cut their spreads onsuch loans. These results are similar to those reported last year:in January, lending standards were about unchanged, on net, andfewer banks reported easing loan terms. The May survey showsforeign branches and agencies continuing to pull back from businesslending, with many--mainly those of Japanese banks--reportingtighter standards and terms. Lending to REITS was reported to haveexpanded rapidly over the past year, reflecting heavy demand. Anumber of domestic and foreign respondents reported increasedrequests for trade finance from firms in emerging economies in Asiaaffected by the financial problems in the region, but many of thebanks that had provided such finance in the past indicated that theywere less willing to do so now.
The survey showed small mixed changes in standards and terms onloans to households. A few banks tightened standards and terms oncredit card loans, but the number doing so was smaller than in pastsurveys. The fraction of banks tightening standards on otherconsumer loans also declined, and terms on such loans were aboutunchanged, on net. A few banks reported eased standards forresidential mortgage loans in May, following no net change in theJanuary survey. Household credit demands appear to have increased,especially in the case of mortgage loans.
Responses to a special question suggested that the recent rapidgrowth in securities reflected banks' efforts to increase leveragein order to boost returns on equity. Other special questionsindicated that banks have not generally cut back on lending tocustomers because of possible year-2000 problems, although many arenow including year-2000 related covenants in some loan contracts.
Lending to Businesses
The number of U.S. banks reporting easier standards and termsfor business borrowers on the latest survey remained in the rangeseen over the past several quarters. A few banks, on net, reportedhaving eased standards for large and middle market firms, while onlyone bank reported having done so for small businesses. About
1. This summary of the survey results is based on responses fromfifty-four of the fifty-eight domestic banks and all twenty-three ofthe branches and agencies of foreign banks in the panel.
III-A-1

III-A-2
40 percent of the respondents, on net, narrowed yield spreads forlarger firms, a considerably higher share than in the Januarysurvey. As in January, about a quarter reported narrower spreadsfor small businesses. Smaller fractions eased other terms, such asthe size and cost of credit lines, loan covenants, andcollateralization requirements.
Many branches and agencies--primarily those of Japanese banks--reported curtailing their business lending. About a quarter of theforeign respondents reported tighter standards on commercial andindustrial loans. Large fractions tightened loan terms: about athird boosted the costs of credit lines, about a quarter widenedspreads over base rates, and 20 percent cut the maximum sizes ofcredit lines. Smaller fractions tightened other loan terms. Thosetightening standards and terms indicated that their primary reasonfor doing so was a weakening of their parent bank's current orexpected capital position.
The fraction of respondents reporting strengthening demand forbusiness loans has trended higher since mid-1996. In the latestsurvey, about 30 percent of the domestic banks noted increaseddemand for business loans from larger firms, and 20 percent fromsmall businesses. About 20 percent of the branches and agenciesreported a pickup in demand as well. Consistent with the lastcouple of surveys, the increased demand was attributed to higherborrowing for mergers and acquisitions, plant and equipmentinvestment, and inventory financing, in that order.
A few of the domestic respondents reported eased standards forcommercial real estate loans; there was little change in standardsat the branches and agencies. As in January, substantial fractionsof both the domestic and foreign respondents reported increaseddemand for these loans.
The reported easing of lending standards for business andcommercial real estate loans on recent surveys is consistent withthe findings of the March 1998 FDIC Report on UnderwritingPractices, which summarizes trends in bank underwriting standardsbetween October 1997 and March 1998 based on questionnaires filledout by FDIC examiners following bank examinations. Relative tothe previous six-month period, the fraction of banks at which theexaminers noted specific risky practices in the underwriting ofbusiness and commercial real estate loans generally increased by afew percentage points. Nonetheless, the examiners reported anincrease of only 1 percentage point, to 11 percent, in the fractionof banks that employed underwriting practices of above average risk.
The May Senior Loan Officer survey included special questionsthat showed loans to REITS had grown very rapidly at many of therespondent banks. Indeed, the volume of such loans, which can beeither secured or unsecured, nearly doubled at the respondent banksover the past year. The most rapid growth was at large domesticbanks and the branches and agencies of foreign banks. Therespondents indicated that this growth reflected primarily the need
2. The FDIC points out in their report that comparisons of theresults of their examiner survey across time may not be validbecause banks are not selected for examination on a random basis.The bulk of FDIC-insured institutions are considerably smaller thanthe banks on the Senior Loan Officer survey panel.

III-A-3
to finance increased direct holdings of properties by REITS and, toa somewhat lesser extent, a pickup in merger and acquisitionactivity involving REITS.
Another set of special questions found that about a quarter ofthe domestic respondents and a somewhat smaller share of thebranches and agencies were receiving more requests for loans tofinance imports or exports (or for other forms of trade finance)from firms located in East Asian emerging economies affected by theeconomic problems in the region. However, more than 80 percent ofboth the domestic and foreign respondents that had provided suchtrade financing before the outbreak of the Asian economic problemslast year indicated that they were now either somewhat orconsiderably less willing to provide such loans, and a fewrespondents are now unwilling to make such loans.
Lending to Households
Fewer banks reported changes in consumer loan standards andterms than on recent surveys, suggesting that more banks havecompleted desired adjustments to take account of the deteriorationin consumer loan quality that became evident a couple of years ago.On net, two banks expressed greater willingness to make consumerinstallment loans, five banks tightened standards on credit cardloans, and three banks tightened standards on other consumer loans.Most banks reported no changes in credit card terms, although about10 percent cut the size of credit lines on new or existing accounts.Terms on other consumer loans, which had eased at a few banks on thelast few surveys, were about unchanged in May. The demand forconsumer loans of all types increased at more than 10 percent of therespondents, on net.
Standards applied to mortgage applications were also aboutunchanged, with just three banks easing them. Nearly two-thirds ofthe banks reported increased demand for these loans. Even thoughthis question specifically refers to mortgages to purchase homes,the large number of respondents indicating increased demand mayreflect, in part, the brisk pace of refinancing activity. Indeed,the banks attributed the recent rise in residential mortgage loanson banks' books to both increased home sales and higher refinancingactivity. They noted that refinancing has boosted mortgage loansheld by banks both because some households take "cash outs" to paydown other debts or make new purchases and because the refinancingof securitized mortgage loans moves the loans back onto bank books,at least temporarily.
Securities Growth
Responses to a special question about the reasons for the rapidgrowth in securities holdings late in 1997 and early this yearindicated that U.S. banks were purchasing securities in order toleverage up their capital and boost returns on equity. Untilrecently, many bank holding companies repurchased shares to pay outexcess capital. However, with stock prices high, this alternativemay not be attractive now. In addition, the respondents pointed tothe fact that U.S. bank holding companies that engage in pooling-of-interest mergers are not allowed to repurchase shares for a time.For banks in these holding companies, strong earnings may generatemore capital than the firm needs for its operations, and securitiespurchases may be viewed as a low-cost way to put the excess capitalto work. In addition to higher desired leverage, a number of the

III-A-4
foreign branches and agencies reported that the trend in financialmarkets toward the securitization of new classes of assets waspresenting banks with attractive securities to purchase.
Year 2000 Risks
Additional special questions asked respondents about themanagement of risks resulting from possible year-2000 problems oftheir customers. Both the domestic and foreign respondents hadgenerally included year-2000 preparedness in their underwriting andloan review standards. However, the responses suggest that U.S.banks are somewhat further along in the process of assessing suchrisks: Most U.S. banks had evaluated more than 5 percent of theirmaterial business customers for year-2000 compliance, while onlyabout half of the branches and agencies had done so. Nonetheless,even among the domestic respondents, only a fairly small number hadevaluated a large fraction of their customers. While few of therespondents reported rejecting loan applicants because of year-2000compliance problems, more than a third currently impose year-2000-related covenants either almost all of the time or some of the time.
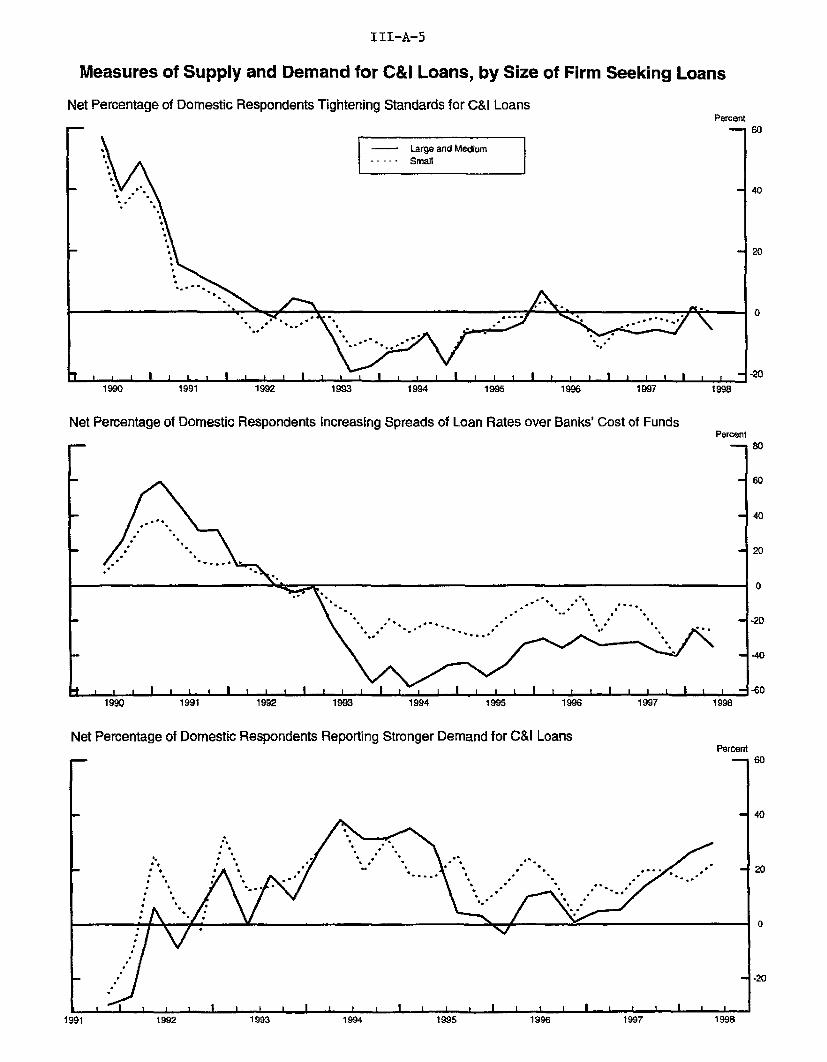
III-A-5
Measures of Supply and Demand for C&l Loans, by Size of Firm Seeking Loans
Net Percentage of Domestic Respondents Tightening Standards for C&I LoansPercent
--- Large and Medium----- Small
11 1fi ll lil l l i l it il lli l llt i f f l i l l i l l
1990 1991 1992 1993 1994 1995 1996 1997
Net Percentage of Domestic Respondents Increasing Spreads of Loan Rates over Banks' Cost of Funds
1998
Percent
Percent
1990 1991 1992 1993 1994 1995 199
Net Percentage of Domestic Respondents Reporting Stronger Demand for C&l Loans
A.

III-A-6
Measures of Supply and Demand for Loans to Households
Net Percentage of Domestic Respondents Indicating More Willingness to Make Consumer Installment Loans
Net Percentage of Domestic Respondents Reporting Stronger Demand for Loans to Households
Net Percentage of Domestic Respondents Tightening Standards for Mortgages to Individuals
Percent
Percent
Percent
Z f----h
I I i i I i I I 1 1 t I I I I 1 1 ~ i I ~I I I I i
1990 1991 1992 1993 1994 1995 1996 1997 1996
I~
1996 1997 19981990 1991 1992 1993 1994 1995

INTERNATIONAL DEVELOPMENTS

INTERNATIONAL DEVELOPMENTS
U.S. International Trade in Goods and Services
In February, the U.S. trade deficit in goods and services
widened to $12.1 billion, as exports declined more than imports.
The deficit for January-February combined was substantially larger
than for any quarter of 1997. Trade data for March will be released
on May 20.
NET TRADE IN GOODS & SERVICES(Billions of dollars, seasonally adjusted)
Annual rates Monthly rates197 1997 99 8 198
03 04 Qle/ Dec Jan FebReal NIPA 1/Net exports of G&S -146.5 -164.1 -159.1 -199.7
Nominal BOPNet exports of G&S -113.7 -119.6 -115.1 -142.4 -10.9 -11.6 -12.1
Goods, net -199.0 -208.0 -199.8 -221.4 -17.7 -18.3 -18.6Services, net 85.3 88.4 84.6 79.0 6.8 6.7 6.5
1. In billions of chained (1992) dollars.e. BOP data are two months at an annual rate.Source. U.S. Dept. of Commerce, Bureaus of Economic Analysis and Census.
In January-February, exports of goods and services were 2-1/2
percent less than in the fourth quarter and were lower than in any
quarter since the first quarter of last year. The decline in
January-February was primarily in the value of machinery,
agricultural products, and industrial supplies. Much of the
declines in exports were to countries in Asia (especially Korea).
Imports of goods and services in January-February were 1/4
percent higher than in the fourth quarter. Increases in the value
of imported automotive products and service payments more than
offset declines in oil and capital goods. Service payments were
boosted by a one-time payment for acquisition of broadcast rights
for the 1998 Winter Olympic Games. The decline in oil imports was
due entirely to a $3 per barrel fall in oil import prices during
January-February; the quantity of imported oil edged up.
Oil Imports and Prices
After very strong oil imports in the second and third quarters
of last year (driven by extremely robust consumption), the quantity
of oil imported declined 2-1/2 percent in the fourth quarter and

IV-2
U.S. International Trade in Goods and Services
Net Exports Billions of dollars, SAARContribution of Net Exports to Real GDP Growth
Percentage points
1990 1992 1994 1996 1998Bil$, SAAR
Net Automotive Tradewith Canada and Mexico
Net Trade in Computersanrl C/-mnn A. .ta,'
e11 mo4 Q MU U oL I 1 I U I
1990 1992 1994 1996 1998
1990 1992 1994 1996 1998Selected Imports
Selected Exports Bil$, SAAR
1990 1992 1994 199611 Excludes oil and gold.2/ Excludes computers and semiconductors.3/ Excludes Canada and Mexico.
5-11-98
Bil$, SAAR
1990 1992 1994 1996 19981/ Excludes agriculture and gold.2/ Excludes computers and semiconductors.
1998
S...I ... 1

IV-3
U.S. EXPORTS AND IMPORTS OF GOODS AND SERVICES(Billions of dollars, SAAR, BOP basis)
Levels Amount Change 1/19.2 1998 1998 . 1997 1998 199804 Ole/ Jan Feb Q4 Qle/ Jan Feb
Exports of G&S 952.3 927.9 931.7 924.1 13.7 -24.4 -20.5 -7.6
Goods exports 697.3 673.8 680.2 667.3 16.3 -23.5 -20.7 -12.9Agricultural 61.5 55.8 55.9 55.6 3.3 -5.7 -3.4 -0.3Gold 3.4 5.5 7.2 3.8 -0.0 2.1 3.2 -3.4Other goods 632.4 612.5 617.1 607.8 13.1 -19.9 -20.5 -9.2
Aircraft & pts 44.3 43.6 42.6 44.7 8.0 -0.6 -20.3 2.0Computers 48.6 45.5 45.7 45.3 -3.8 -3.1 0.1 -0.4Semiconductors 38.9 38.4 38.7 38.2 -1.4 -0.5 -0.8 -0.5Other cap gds 174.0 165.5 165.1 165.8 5.0 -8.6 -7.2 0.7
Automotive 76.8 75.9 77.5 74.4 3.9- -0.9 6.9 -3.1to Canada 40.8 39.2 37.5 40.9 2.2 -1.6 -2.2 3.4to Mexico 13.3 12.8 11.5 14.0 2.0 -0.6 1.0 2.5to ROW 22.6 24.0 28.5 -19.5 -0.3 1.3 8.1 -9.0
Ind supplies 143.9 138.9 140.3 137.6 0.6 -4.9 -2.4 -2.7Consumer goods 78.9 78.1 79.4 76.8 2.0 -0.8 2.4 -2.5All other 27.2 26.5 27.9 25.1 -1.2 -0.7 -1.5 -2.8
Services exports 255.0 254.1 251.5 256.8 -2.6 -0.9 0.2 5.4
Imports of G&S 1067.4 1070.3 1071.1 1069.4 9.2 2.8 -11.9 -1.7
Goods imports 897.1 895.1 900.2 890.1 8.0 -1.9 -13.2 -10.1Petroleum 69.1 57.0 59.5 54.5 -1.2 -12.1 -3.7 -5.0Gold 3.8 6.0 7.7 4.3 0.8 2.2 2.3 -3,5Other goods 824.2 832.1 832.9 831.3 8.4 7.9 -11.8 -1.6
Aircraft & pts 18.6 15.8 15.7 15.9 -0.4 -2.8 -5.7 0.2Computers 71.0 70.8 72.2 69.3 -2.7 -0.2 0.9 -2.9Semiconductors 37.8 35.7 35.1 36.4 -1.1 -2.1 -1.8 1.3Other cap gds 138.1 139.1 138.2 139.9 7.2 1.0 -3.2 1.7
Automotive 140.7 146.0 142.7 149.2 -2.3 5.2 -4.0 6.5from Canada 50.5 53.5 52.5 54.5 0.2 3.0 -4.4 1.9from Mexico 27.7 24.7 24.8 24.5 2.1 -3.0 0.4 -0.4from ROW 62.5 67.8 65.4 70.3 -4.7 5.3 0.0 4.9
Ind supplies 141.2 143.5 144.9 142.2 0.1 2.3 1.8 -2.7Consumer goods 203.1 205.4 207.7 203.0 7.9 2.3 -0.7 -4.7Foods 40.2 41.0 40.3 41.7 -0.4 0.8 -2.0 1,4All other 33.5 34.9 36.1 33.7 0.3 1.4 2.9 -2.3
Services imports 170.4 175.2 171.0 179.3 1.2 4.8 1.4 8.4
Memo:Oil qty (mb/d) 10.69 10.76 10.86 10.67 -0.26 0.07 0.54 -0.19Oil price ($/bbl) 17.67 14.50 15.01 13.98 0.11 -3.18 -1.77 -1.03
1. Change from previous quarter or month, e. Average of two months.Source. U.S. Dept. of Commerce. Bureaus of Economic Analysis and Census.

IV-4
remained at about the fourth-quarter level in January-February.
These relatively lower import levels were driven mostly by lower
consumption as a result of favorable winter weather. Preliminary
Department of Energy statistics indicate that oil imports were flat
again in March but rose sharply in April. The sharp rise in imports
during April was due to a large accumulation of stocks.
For the first quarter, the price of oil imports dropped by the
greatest percent since the first quarter of 1991. Prices declined
from November through March as the market reacted to increased
production from Saudi Arabia, Kuwait, and the United Arab Emirates,
to weak demand in Asia, to relatively warm weather in the northern
hemisphere, and to the resumption of oil production for export by
Iraq. In April, the price of imported oil increased, as impending
production cuts by both OPEC and non-OPEC producers were agreed and
market prices rose. The spot price of WTI in May has remained near
its April average level of $15.44.
Prices of Non-oil Imports and Exports
Prices of non-oil imports fell about 5 percent (at an annual
rate) during the first quarter. This was a somewhat sharper decline
than in the fourth quarter of 1997. A substantial drop in prices of
imported non-oil industrial supplies in the first quarter
contributed importantly to the faster decline in prices of non-oil
imports. Non-oil import prices edged down further in April, with
declines in all major trade categories except imported foods.
Prices of exports also fell about 5 percent in the first
quarter. The decline was attributable mostly to lower prices for
agricultural products (primarily oilseeds and grains).
nonagricultural industrial supplies, computers, and semiconductors.
Export prices declined slightly in April. There were declines in
all major trade categories except automotive vehicles.
U.S. International Financial Transactions
Net private foreign purchases of U.S. securities remained
strong in February and March, bringing the total for the first
quarter to $76 billion--near the level of last year's fourth
quarter. (See line 4 of the Summary Table of U.S. International
Transactions.) Although the total changed little between the
quarters, there was a significant shift away from U.S. Treasuries
into other types of securities.

IV-5
PRICES OF U.S. IMPORTS AND EXPORTS(Percentage change from previous period)
Annual rates Monthly rates1997 1998 1998
03 04 01 Feb Mar Apr
Merchandise imprtsOilNon-oil
Core goods*
Foods, feeds, bev.Ind supp ex oilComputersSemiconductorsCap. goods ex comp & semiAutomotive productsConsumer goods
Merchandise exportsAgriculturalNonagricultural
Core goods'
Ind supp ex agComputersSemiconductorsCap. goods ex comp & semiAutomotive productsConsumer goods
-----------BLS-1.5 -2.0-2.8 7.1-1.5 -2.7-0.3 -0.8
-5.31.6
-14.5-5.3-1.11.9
-0.8
-1.1-10.8
-0.11.1
0.7-7.9-8.70.50.41.7
-4.5-1.4
-17.7-15.3-2.11.3
-0.8
-2.9-6.4-2.4-1.0
-5.2-7.6
-14.4-0.50.11.2
prices-11.5-61.6-5.2-4.1
-5.1
-11.2-16.8-13.9
-3.1-0.1-1.2
-5.0-15.7-3.5-3.3
-8.9-10.5-5.10.50.1
-0.5
(1995=100)------------0.8 -1.0 -0.1-6.5-0.4-0.3
-1.0-0.8-1.8-1.0-0.3
0.00.1
-0.3-1.5-0.1-0.3
-0.2-0.5-0.20.00.00.0
-9.1-0.2-0.4
-0.1-0.3-1.4-0.3
0.00.1
-0.5
-0.3-0.6-0.3-0.2
-1.0-1.0-0.20.20.00.0
2.5-0.30.0
0.0-0.1-1.3-0.6-0.4-0.1-0.4
-0.3-1,3-0.3-0.3
-0.3-0.9-0.8-0.2
0.0-0.3
---Prices in the NIPA accounts (1992100)--Chain-weightImports of gds & serv.Non-oil merchandise
Core goods*
Exports of gds & serv.Nonag merchandise
Core goods*
-3.0-2.30.2
-2.0-2.30.9
-2.1-3.4-0.7
-2.1-3.2-0.8
-11.1-6.9-3.5
-4.8-5.6-2.4
*/ Excludes computers and semiconductors.
5-11-98
Oil PricesDollars per barrel
Spot West Texas intermediate
1988 1989 1990 1991 1992 1993 1994 1995 1996 1997 1998

IV-6
Foreign purchases of corporate and agency bonds increased by
$20 billion between the fourth quarter of last year and the first
quarter of this year (line 4.b). The increase was evenly split
between corporates and government agency bonds. Fannie Mae and
Freddie Mac both issued heavily in the first quarter in efforts to
establish global benchmark note programs. The rise in foreign
purchases of U.S. corporate bonds mirrors the general step up in
domestic and foreign issuance by U.S. corporations. Foreign
purchases of U.S. equities also rose throughout the first quarter
(line 4.c). In terms of major countries and regions, only Japanese
residents recorded significant net sales of U.S. equities ($3
billion) in the quarter.
In contrast, private foreigners sold almost $14 billion in
U.S. Treasuries in March, yielding small net sales for the quarter
as a whole (line 4.a). This compares with net purchases of over $35
billion in the fourth quarter. Net purchases in the United Kingdom
slowed considerably, but most of the swing from the fourth to the
first quarter is attributable to the Netherlands Antilles, which
swung from net purchases of $11 billion to net sales of $15 billion.
Japanese residents sold over $7 billion in the first quarter, about
the same as in the prior quarter.
U.S. residents' purchases of foreign securities slowed
considerably in the first quarter as a small pickup in equity
purchases was more than offset by large net bond sales in March
(lines 5a and 5b). Within equities, the pickup from the fourth to
first quarter was more than entirely accounted for by a swing in
sentiment toward Japan--from sales of $4 billion to purchases of $3
billion. In contrast, U.S. residents on net sold about $2 billion
in European equities in the first quarter, following small net
purchases in the fourth. Within bonds, there was a considerable
slowing in purchases in Europe and a swing from net sales to net
purchases in Japan.
Foreign official reserve assets in the United States rose
almost $10 billion in March, following very modest increases earlier
this year (line 1). Asian economies account for most of the March
increase, especially Japan, China, Hong Kong, and Thailand. The
increase in Thailand's reserves reflects an IMF disbursement. OPEC
reserves in the United States also increased in March, while

IV-7
SUMMARY OF U.S. INTERNATIONAL TRANSACTIONS(Billions of dollars, not seasonally adjusted except as noted)
1997 19981996 1997
Q2 Q3 Q4 Q1 Feb Mar
Official capital
1. Change in foreign official assetsin U.S. (increase. +)
a. G-10 countries
b. OPEC countries
c. All other countries
2. Change inU.S. official reserveassets (decrease. +)
Private capital
Banks
3. Change in net foreign positionsof banking offices in the U.S. 1
Securities2
4. Foreign net purchases ofU.S. securities (+)
a. Treasury securities 3
b. Corporate and other bonds 4
c. Corporate stocks
5. U.S. net purchases (-) offoreign securities
a. Bonds
b. Stocks
Other flows (quarterly data. s.a.)
6. U.S. direct investment (-) abroad
7. Foreign direct investment in U.S.
8. Foreign holdings of U.S. currency
9. Other (inflow, + )
U.S. current account balance (s.a.)
Tia-1 ti a disrrannvly (.a_)
127.7 18.4 -4.9 22.4 -26.7 11.2 -.3 9.7
36.6
15.4
75.7
6.7
4.6
2.6
-12.1
-. 2
2.1
3.5
16.8
-. 7
-12.6
-1.3
-12.8
-4.5
-50.1 34.5 15.5 -1.0 46.1 -5.1 15.7 -9.8
287.2 346.1 97.4 96.4 72.9 76.2 38.1 18.1
155.6
118.9
12.7
-110.6
147.3
131.0
67.8
-87.5
42.8
33.2
21.5
-22.8
35.6
37.1
23.7
-40.3
-51.4 -47.2 -9.2 -24.6
-59.3 -40.2 -13.6 -15.8
-87.8
77.0
17.3
-72.3
-148.2
-46.9
-119.4
107.9
24.8
-60.3
-166.4
-97.1
-37.0
26.7
4.8
-27.7
-37.8
-14.0
-22.8
25.9
6.6
-13.9
-43.1
-29.5
35.4
27.0
10.4
-7.5
-1.2
47.3
30.1
-4.4
11.7
16.5
9.9
-3.9
-13.8
19.1
12.8
3.1
-8.3 -2.1 -2.8 4.4
.8 -2.3 -1.1 -1.4
-32.9
24.6
9,9
3.4
-45.6
-39.6
n.a n.a
n.a n.a
n.a n-a
n.a n.a
n.a n.a
n.a n.a
Note. The sum of official capital, private capital, the current account balance, and the statisticaldiscrepancy is zero. Details may not sum to totals because of rounding.1. Changes in dollar-denominated positions of all depository institutions and bank holding companies
plus certain transactions between broker-dealers and unaffiliated foreigners (particularly borrowingand lending under repurchase agreements). Includes changes in custody liabilities other than U.S.Treasury bills.2. Includes commissions on securities transactions and therefore does not match exactly the data on U.S.
international transactions published by the Department of Commerce.3. Includes Treasury bills.4. Includes U.S. goverment agency bonds.5. Transactions by nonbanking concerns and other banking and official transactions not shown elsewhere
plus amounts resulting from adjustments made by the Department of Commerce and revisions in lines 1through 5 since publication of the quarterly data in the Survey of Current Business.n.a. Not available. * Less than $50 million.

IV-8
reserves of European countries, especially Spain, declined. Partial
data for April from FRBNY indicate a small net increase in official
holdings--a large decline in Japanese reserves, associated with
foreign exchange intervention, was offset by a modest increase in
Hong Kong's reserves and a huge increase in Brazil's. Brazil's
total foreign exchange reserves rose by more than $20 billion in the
first four months of this year and much of this increase is now
reflected in its holdings at FRBNY.
There were modest net capital outflows recorded through
private banking transactions in the first quarter (line 3). U.S.
banks reduced their net liabilities to affiliated foreigners
significantly and increased their claims on unaffiliated foreigners.
Offsetting much of these outflows was an increase in borrowing by
U.S. banks and securities dealers from private nonbanks abroad.
Much of this latter borrowing was associated with RP transactions
and likely reflects, in part, the financing of the large foreign
sales of Treasuries in March.
Recorded international banking flows for the first quarter can
be quite volatile as they reflect end-of-month data for both the end
of the calendar year and the Japanese fiscal year. However, monthly
average data for net interbank claims on affiliated foreign offices
indicate that the reduced reliance on funds from foreign affiliates
persisted into April (line 1 of the International Banking Data
table).

IV-9
INTERNATIONAL BANKING DATA 1(Billions of dollars)
1994 1995 1996 1997 1998Dec. Dec. Dec. Dec. Jan. Feb. Mar. Apr.
1. Net claims of U.S. -224.0 -260.0 -231.2 -195.8 -230.5 -225.6 -201.0 -171.3banking offices(excluding IBFs)on own foreignoffices and IBFsa. U.S.-chartered -70.1
banksb. Foreign-chartered -153.9
banks
2. Credit extended to U.S.nonbank residents
a. By foreign branchesof U.S. banks
b. By Caribbeanoffices of foreign-chartered banks
3. Eurodollar holdings ofU.S. nonbank residents
a. At all U.S.-chartered banks andforeign- charteredbanks in Canada andthe United Kingdom
b. At the Caribbeanoffices of foreign-chartered banks
-86.1 -66.4 -69.8 -83.7 -82.5 -76.1
-173.9 -164.8 -126.0 -146.8 -143.0 -124.9
-72.5
-98.8
23.1 26.5 31.9 34.4 35.4 36.4 35.2 35.6
78.4 86.3 79.4 90.1 n.a n.a n.a n.a
86.3 94.6 119,5 156.0 162.6 156.4 147.7 147.9
86.0 92.3 122.2 115.0 n.a n.a n.a n.a
MEMO: Data as recorded in the U.S.international transactions accounts
4. Credit extended to U.S.nonbank residents
5. Eurodeposits of U.S.nonbank residents
178.1 212.8
242.0 275.8
239.0 287.2
336.7 415.2
n.a. n.a. n.a n.a
n.a. n.a. n.a n.a
1. Data on lines 1 through 3 are from Federal Reserve sources and sometimesdiffer in timing from the banking data incorporated in the U.S. internationaltransactions accounts.
Lines la, Ib, and 2a are averages of daily data reported on the FR 2950 andFR2951,
Lines 2b and 3b are end-of-period data reported quarterly on the FFIEC 002s.Line 3a is an average of daily data (FR 2050) supplemented by the FR 2502 and
end-of-quarter data supplied by the Bank of Canada and the Bank of England. Thereis a break in the series in April 1994.
Lines 4 and 5 are end-of-period data estimated by BEA on the basis of dataprovided by the BIS, the Bank of England, and the FR 2502 and FFIEC 002s. Theyinclude some foreign-currency denominated deposits and loans. Source: SCB

IV-10
Foreign Exchange Markets
Since the March FOMC meeting, the trade-weighted foreign
exchange value of the dollar, measured against the 16 currencies in
our narrow index (see Appendix), is little changed on balance.
Movements in the index meld a depreciation of almost 4 percent
against the mark and related currencies and respective appreciations
of more than 3 percent and 1-1/4 percent against sterling and the
yen.
Over most of the intermeeting period, the dollar steadily
depreciated against the mark. Early in the period, signs of robust
German economic activity and the rejection of petitions seeking to
block German participation in EMU contributed to the mark's rise.
The dollar/mark rate changed little following the long-anticipated
selection of 11 countries to participate in Stage III of the
monetary union on May 1-2. The mark continued to firm on the
prospect of a smooth introduction of the euro and signs of continued
increases in economic activity in the 11 countries slated to enter
EMU. Although Bundesbank officials later voiced the opinion that
German rate hikes were not immediately necessary, the dollar
recouped only a small portion of its declines vis-a-vis the mark.
Despite an increase in the Canadian 3-month interest rate of
roughly 25 basis points, the U.S. dollar has appreciated almost 2
percent against the Canadian dollar over the intermeeting period.
This week's assessment in the Bank of Canada's semi-annual monetary
policy report that Canadian monetary conditions were appropriate
contrasted with market participants' perceptions of easy conditions
and contributed to the Canadian dollar's weakness,
Against the yen, the dollar has gained on continued
indications of weak economic activity in Japan. Throughout April,
market participants remained generally unimpressed as the details of
the Y16 trillion fiscal stimulus package announced in late March
became available. Long-term Japanese yields declined steadily.
with the bellwether yield falling almost 30 basis points on balance.
On April 9-10, Japanese authorities sold dollars for yen on a
massive scale,
The effects of the intervention
were short-lived and relatively small -- the dollar immediately

IV-11
Dollar Exchange Rate IndicesIndex, January 1997 = 100
J F M A M J J A S O N D J F M A M
Interest Rates in Major Industrial Countries
Three-month rates Ten-year bond yields
March 30 May 14 Change March 30 May 14 Change
Canada 4.91 5.17 0.26 5.40 5.45 0.05Japan 0.65 0.55 -0.10 1.66 1.38 -0.28
Germany 3.48 3.56 0.08 4.92 4.99 0.07United Kingdom 7.47 7.37 -0.10 5.95 5.92 -0.03France 3.36 3.50 0.14 4.93 5.05 0.12
Italy 5.25 4.94 -0.31 5.12 5.23 0.11Switzerland 1.31 1.53 0.22 2.83 3.03 0.20
Australia 5.00 4.98 -0.02 5.84 5.67 -0.17
Weighted-averageforeign 3.52 3.56 0.04 4.22 4.18 -0.04
United States 5.60 5.58 P -0.02 5.67 5.66P -0.01
Ni Ch A, -. t a a P 0 l: i
ote. ange s n percen s.
rI c il IIlal y .

IV-12
depreciated 3 percent but recouped these losses within 10 days. The
dollar's recovery was boosted by the G-7 communique that noted the
excessive depreciation of the yen but made no mention of a
coordinated policy response. Japanese share prices have also
responded to the poor economic performance, falling almost 6 percent
from their levels near the end of the fiscal year on March 30.
These declines leave Japanese equity prices up only about 1/4
percent from the end of 1997.
Over the intermeeting period, market participants have marked
down the odds of a further tightening of monetary policy in the
United Kingdom. Both short-term and long-term interest rates have
fallen. The shift in sentiment has come on data releases consistent
with a slowing in output growth and an easing of price pressures in
the United Kingdom. Sterling weakened on later-confirmed press
reports that between the March and April meetings of the Monetary
Policy Committee the balance of members voting for no change in
interest rates shifted from 4-4 to 5-3.
Elsewhere in Europe, on May 4 the central bank of Denmark
raised its discount and repo rates by 50 basis points in order to
support the crown. The increase came as a surprise to market
participants. On the same day, the central bank of Spain cut its
repo rate by a less-than-expected 25 basis points,
Equity prices in most industrial countries have continued to
rise. Since the March FOMC meeting, the largest price increases
have been recorded in Europe, led by a more than 6 percent gain in
French share prices. Stock indices for Belgium, Sweden, Germany,
and the United Kingdom have all increased 3-1/2 percent or more
during the intermeeting period. Since the turn of the year,
increases in European share prices range from 46 percent in Italy to
18 percent in the United Kingdom. Canadian share prices have risen
almost 2 percent over the past seven weeks and have posted a 15
percent increase year to date.
Asian financial markets have come under pressure again after
two months of relative calm. In early April, Indonesian and IMF
officials reached an agreement that accelerated reform measures and
allowed for a resumption of IMF disbursements on May 4. Since then,
social unrest in Indonesia has intensified, partly in response to an
increase in fuel prices, and the rupiah has declined 21 percent

IV-13
against the dollar. Late in the period, Bank Indonesia raised
interest rates across the maturity spectrum between 4 and 12
percentage points in reaction to the weakness in the rupiah. In
Korea, labor unrest has weighed on the won. In the last several
days, Yankee bond yield spreads over U.S. Treasuries have risen
noticeably for Indonesia and Korea, although those for Thailand and
Malaysia show very little change. Brady bond stripped yield spreads
over U.S. Treasuries have moved up somewhat for Russia, Brazil and
to a lesser extent for Mexico. Over the intermeeting period, equity
prices in Indonesia, Korea, Malaysia, Singapore, and Thailand have
fallen more than 20 percent. Share prices in Hong Kong are down
almost 17 percent. In the past week, interest rates in Hong Kong
have risen roughly 2 percentage points, reflecting concern over
developments in Indonesia and anxiety that slowing economic activity
in Hong Kong may lead to speculative pressure on the Hong Kong
dollar.
The Desk did not intervene in the foreign
exchange market for U.S. accounts during the period.
Developments in Foreign Industrial Countries
Real GDP growth in the foreign G-7 countries appears to have
remained sluggish in the first quarter, due primarily to continued
weakness in Japan. Growth in the United Kingdom also appears to be
slowing from the rapid pace of the last two years. In contrast,
available indicators suggest that the major continental European
economies are gathering steam, with improving domestic demand
helping to offset the impact of Asia on foreign trade. In Canada as
well, robust growth in domestic demand has continued to buoy the
economy.
Inflation remains quite subdued in most of the major foreign
industrial countries, reflecting recent declines in oil prices as
well as continued moderate wage growth. Inflation is less than 1 1/2
percent in France, Germany, and Canada and is under 2 percent in
Italy. After netting out the effects of tax increases, inflation
remains near zero in Japan. In the United Kingdom, however,consumer
IV-14
price inflation remains slightly above the government's target of 21/2percent.
The heads of state or government and the finance ministers
from the European Union met in Brussels during the first weekend in
May and formally selected eleven countries to launch the third stage
of monetary union on January 1, 1999. The President and other
members of the board of the new European Central bank were also
selected. Markets generally reacted favorably to these developments
despite a last-minute compromise under which Wim Dusienberg, the
first President, is expected to step down halfway through his term
in favor of Jean-Claude Trichet, the current head of the Bank of
France.
Individual country notes. In Japan, economic indicators
suggest that the economy contracted during the first quarter.
Industrial production was down sharply, and the unemployment rate
surged to a new all-time high of 3.9 percent in March, with the
ratio of job offers to applicants at its lowest level since 1983.
Consumer demand was also sluggish during the first quarter, with
household expenditures up only slightly from their very weak fourth-
quarter level. New car registrations in April were down 7 percent
from a year earlier--the month the consumption tax was increased--
and down 20 percent from two years earlier. Despite the cutbacks in
production, the inventory-to-shipments ratio soared to its highest
level since 1975, and business sentiment continued to fall sharply.
Consumer price inflation, net of the effects of fiscal measures,
remains near zero.
Japan's trade surplus during the first quarter was $98 billion
at an annual rate, essentially unchanged from the fourth quarter.
The yen value of both imports and exports declined from their
fourth-quarter levels. The decline in imports reflects the weakness
of Japanese domestic demand, coupled with falling import prices.
(During the first quarter, import prices were down 6 percent from a
year earlier, led by sharp declines in the prices of oil and
lumber.) The decline in exports can be linked to the Asian crises.
In recent months, Japanese exports to Korea, Thailand and Indonesia
have fallen by over one-third from a year earlier.

IV-15
JAPANESE ECONOMIC INDICATORS(Percent change from previous period except where noted, SA)
1997 1998
Q3 Q4 Q1 Jan Feb Mar Apr
Industrial Production -0.3 -2.3 -1.4 2.9 -3.9 -1.9 n.a.
Housing Starts -10.5 0.2 1.1 1.1 1.8 -1.3 n.a.
Machinery Orders 1.3 -12.9 -3.4 -0.8 -4.9 7.5 n.a.
New Car Registrations 2.9 -0.0 -7.5 -13.9 -1.6 1.5 -8.5
Unemployment Rate (%) 3.4 3.5 3.6 3.5 3.6 3.9 n.a.
Job Offers Ratio 1 0.73 0.69 0.61 0.64 0.61 0.58 n.a.
Business Sentiment 2 3 -11 -31 .. ... ... ...
CPI (Tokyo area) 3 1.7 2.1 2.1 2.0 2.0 2.2 0.7
Wholesale Prices 3 1.7 1.4 -0.4 0.8 -1.0 -1.1 -2.7
1. Level of indicator.2. Percent of large manufacturing firms having a favorable view of
business conditions less those with an unfavorable view (Tankansurvey).
3. Percent change from previous year, NSA.
On April 24, the Japanese government released the details of a
massive ¥16 trillion stimulus package, which appears to contain ¥12
trillion (2.4 percent of GDP) of "real water" stimulus. The real
water portion of the package includes ¥4 trillion of temporary tax
cuts, divided evenly between CY1998 and CY1999, and about ¥8
trillion of government expenditures, mostly public works projects.
The portion of the package that is not real water consists of steps
to boost the land market (including plans to streamline foreclosure
on bad loans and to facilitate the sale of underlying collateral)
and programs to help small businesses. The stimulus package will be
transformed into a supplementary budget that will be submitted to
the Diet later this month.
Two financial reform measures were implemented on April 1 as
part of Japan's "Big Bang" program. First, the Bank of Japan Reform
Law, which strengthens BOJ independence and increases the
transparency of monetary policy formulation, came into effect.
Second, a new foreign exchange law abolishes restrictions on cross-
border capital transactions and allows Japanese citizens to open
deposit and investment accounts abroad.

IV-16
Economic activity in the eleven European countries scheduled to
enter monetary union appears to have continued to expand at a moderate
rate in the first quarter. Partial data suggests that area-wide
industrial production rose at an average rate of about 1 percent, while
both business and consumer confidence continued the upward trend begun
last year. The average unemployment rate fell as a result of
widespread declines across countries. Inflation remains quite subdued
across the area.
EURO-11 ECONOMIC INDICATORS1
(Percent change from previous period except where noted, SA)
1996 1997 1998
Q1 Q2 Q3 Q4 Q1 Apr
GDP 1.9 1.5 5.0 3.3 2.0 n.a. n.a
Industrial Production 0.9 0.8 2.0 1.8 1.0 0.92 n.e
Unemployment Rate3 12.3 12.5 12.5 12.5 12.4 12.1 n.e
Business Confidence4 -16 -9 -7 -2 1 2 3
Consumer Confidence 5 -21 -19 -19 -15 -11 -8 -6
Consumer Prices6 2.0 1.7 1.2 1.5 1.4 1.2 n.a
1. Weighted by CDP shares, except as otherwise noted.2. Partial data: excludes Austria and Ireland.3. Excludes Portugal.4. Excludes Austria and Finland.5, Excludes Austria, Finland, and Portugal.6. Harmonized CPI; percent change from previous year, weighted by shares
in private final domestic consumption expenditure.
t .
t.
In Germany, indicators for the first quarter suggest a pick-up
in growth from its sluggish fourth-quarter pace, as both production
and orders rose substantially. The rise in orders owed primarily to
increases in domestic orders, suggesting that the long-awaited pick-
up in domestic demand may have begun to occur. Business confidence
strengthened further during the first quarter. Conditions in the
labor market have improved somewhat this year, with the all-German
unemployment rate edging down from 11.8 percent in December to 11.4
percent in April. Consumer price inflation rose slightly in April
reflecting an increase of 1 percentage point in the value-added tax.
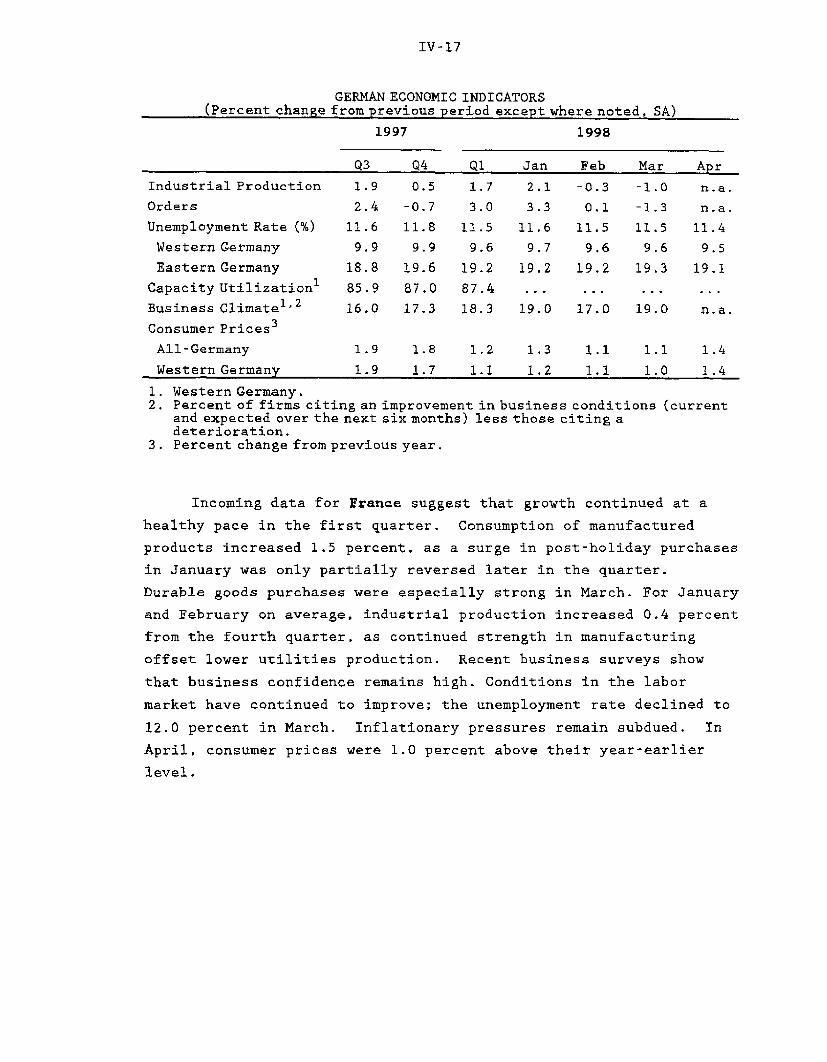
IV-17
GERMAN ECONOMIC INDICATORS(Percent change from previous period except where noted, SA)
Industrial Production
Orders
Unemployment Rate (%)
Western Germany
Eastern Germany
Capacity Utilization 1
Business Climate 1'2
Consumer Prices3
All-Germany
Western Germany
1997
Q3 Q4
1.9 0.5
2.4 -0.7
11.6 11.8
9.9 9.9
18.8 19.6
85.9 87.0
16.0 17.3
Q1
1.7
3.0
11.5
9.6
19.2
87.4
18.3
Jan
2.1
3.3
11.6
9.7
19.2
1998
Feb
-0.3
0.1
11.5
9.6
19.2
Mar
-1.0
-1.3
11.5
9.6
19.3
Apr
n.a.
n.a.
11.4
9.5
19.1
19.0 17.0 19.0 n.a.
1. Western Germany.2. Percent of firms citing an improvement in business conditions (current
and expected over the next six months) less those citing adeterioration.
3. Percent change from previous year.
Incoming data for France suggest that growth continued at a
healthy pace in the first quarter. Consumption of manufactured
products increased 1.5 percent, as a surge in post-holiday purchases
in January was only partially reversed later in the quarter.
Durable goods purchases were especially strong in March. For January
and February on average, industrial production increased 0.4 percent
from the fourth quarter, as continued strength in manufacturing
offset lower utilities production. Recent business surveys show
that business confidence remains high. Conditions in the labor
market have continued to improve; the unemployment rate declined to
12.0 percent in March. Inflationary pressures remain subdued. In
April, consumer prices were 1.0 percent above their year-earlier
level.
1.9 1.8 1.2 1.3 1.1 1.1 1.4
1.9 1.7 1.1 1.2 1.1 1.0 1.4

IV-18
FRENCH ECONOMIC INDICATORS(Percent change from previous period except where noted, SA)
1997 1998
Q3 Q4 QI Jan Feb Mar Apr
Consumption of 2.5 1.0 1.5 3.7 -2.7 -0.1 n.a.Manufactured Products
Industrial Production 1.8 1.7 n.a. -0.9 0.7 n.a. n.a.
Capacity Utilization 84.9 81.2 82.5... ...
Unemployment Rate (%) 12.5 12.4 12.1 12.1 12.1 12.0 n.a.
Business Confidencel 14.5 15.3 17.7 16.0 18.0 19.0 20.0
Consumer Prices 2 1.3 1.2 0.7 0.5 0.7 0.8 1.0
1. Percent balance of manufacturing firms citing an improvement in theoutlook versus those citing a worsening.
2. Percent change from previous year.
In Italy, monthly indicators generally point to modest
economic growth in the first quarter. Although industrial
production in January and February changed little on average from
its fourth-quarter level, consumer confidence more than retraced its
fourth-quarter decline while business sentiment soared due to the
removal of any remaining doubt regarding Italy's first-wave entry
into the EMU. Inflation remains below 2 percent.
(Percent changeITALIAN ECONOMIC INDICATORSfrom previous period except where noted, SA)
1997 1998
Q3 Q4 Q1 Jan Feb Mar Apr
Industrial Production 0.5 1.3 n.a. 0.9 -1.3 n.a. n.a.
Cap. Utilization (%) 77.7 79.0 78.2 ...... .
Unemployment Rate (%) 12.1 12.1 12.1
Consumer Confidencel 117.2 115.3 118.6 120.8 118.7 116.3 120.3
Bus. Sentiment2 (%) 18.0 17.0 32.0 35.0 34.0 27.0 n.a.
Consumer Prices 3 1.5 1.6 1.7 1.6 1.8 1.7 1.8
1. Level of index, NSA.2. Percent of manufacturing firms having a favorable view of business
conditions minus those with an unfavorable outlook.3. Percent change from previous year.

IV-19
On April 17, the government approved its long-range plan to
eliminate the budget deficit by 2001 and reduce government debt to
60 percent of GDP--the Maastricht reference value--by 2016.
Reductions in debt servicing costs account for most of the projected
decline in government indebtedness. Nonetheless, achieving the
medium-term fiscal objectives remains a challenge for the government
as the rift between the center-left coalition and the Communists on
welfare reform and health care spending remains wide.
On April 22, the Bank of Italy cut its official discount and
Lombard rates by 50 basis points each. Currently, the discount rate
stands at 5 percent and the Lombard rate at 6 1/2 percent. Since July
1997, Italian official rates have been lowered six times for a
cumulative total of 4 percentage points.
The pace of economic activity in the United Kingdom slowed
further in the first quarter. The preliminary estimate showed real
GDP growth of 1.6 percent(SAAR); subsequent data suggest that the
revised figure will be a little higher. Industrial production
declined for the second consecutive quarter, as manufacturing output
was little changed and continued mild weather led to lower output of
utilities industries. Output growth in the service sector slowed
somewhat, but consumer expenditure remained robust.
Recent survey data suggest that the outlook for manufacturing
industries has deteriorated in the current quarter. Business
sentiment weakened in April, reflecting continued soft export orders
due primarily to the strength of sterling. Conditions in the labor
market remain tight, however, with the official claims-based
unemployment rate dipping to 4.8 percent in April, while underlying
average annual earnings growth picked up to 4.9 percent in February.
Retail prices excluding mortgage interest payments rose 2.6 percent
over the year to March, slightly above the government's target of 2 1/2
percent for underlying inflation.
In its May Inflation Report, the Monetary Policy Committee of
the Bank of England lowered slightly its central projection for
inflation over the medium term, as economic activity appeared
somewhat weaker than had been assumed at the time of the February
Report while sterling had appreciated somewhat further. The MPC
noted that in the near term the balance of risks to activity are on

IV-20
UNITED KINGDOM ECONOMIC INDICATORS(Percent change from previous period except where noted, SA)
1997 1998
Q3 Q4 Q1 Jan Feb Mar Apr
Real GDP (AR) 3.6 2.5 1.6 .. ..
Non-oil GDP (AR) 2.9 2.9 1.9 ......
Industrial Production 1.0 -0.9 -0.4 -0.5 0.1 0.6 n.a.
Retail Sales 1.0 1.4 0.9 1.8 -1.2 0.3 n.a.
Unemployment Rate (%) 5.3 5.1 4.9 5.0 4.9 4.9 4.8
Business Confidence1 18.0 13.0 10.7 9.0 11.0 12.0 3.0
Consumer Prices 2 2.8 2.8 2.5 2.5 2.6 2.6 n.a.
Producer Input Prices 3 -8.5 -8.9 -10.0 -10.1 -9.8 -10.1 -9.03Average Earnings 4.4 4.6 n.a. 4.6 4.9 n.a. n.a.
1. Percent of firms expecting output to increase in the next four monthsminus those expecting output to decrease.
2. Retail prices excluding mortgage interest payments. Percent changefrom previous year.
3. Percent change from previous year.
the downside. However, the risks to the exchange rate are
asymmetric, so that in the medium term the balance of risks to
inflation are on the upside, reflecting the possibility of the
exchange rate falling more sharply than assumed in the central
projection.
On April 23, the Bank of England Act 1998 was passed by
Parliament. The bill formally implements, as of June 1, the changes
to the Bank of England announced by Chancellor of the Exchequer
Gordon Brown last May, including the granting of operational
responsibility for setting interest rates to the Bank of England,
the creation of the Monetary Policy Committee, and the transfer of
banking supervision to the Financial Services Administration. The
provisions for setting monetary policy have been operating de facto
from the Chancellor's announcement last May.
In Canada, monthly indicators show that the economy has
regained its momentum, shaking off the effects of the January ice
storm in eastern Canada. Real GDP at factor cost rose 0.9 percent
in February, fully recovering from the 0.8 percent decline in
January, and employment was up strongly for the quarter as a whole.
Employment rose by a further 72,000 in April, the second largest

IV-21
monthly increase in the past three years. The unemployment rate
fell to 8.4 percent in April, down from 9.5 percent the previous
April, and the lowest since August 1990.
Housing starts rose at a rapid clip in February and March,
reflecting strong income growth and moderate mortgage interest
rates. Housing starts retreated in April, but the decline was
entirely due to a drop in volatile multiple-unit construction.
Housing related purchases -- mostly furniture and appliances --
offset weakness in motor vehicle sales to buoy overall retail sales
in February.
Consumer price inflation has edged back below the Bank of
Canada's 1 to 3 percent target range in recent months, to 0.8
percent (12-month change) in April. Excluding food and energy,
consumer prices rose 1.2 percent in the 12 months to April, down
from 1.6 percent in February. The good inflation news comes despite
the depreciation of the Canadian currency since October. Declines
in computer prices and mortgage interest payments over the past year
have helped hold down core inflation. A 3.7 percent decline in
energy prices over the preceding twelve months has contributed to
the low rate of overall inflation.
In its semi-annual Monetary Policy Report issued on May 13,
the Bank of Canada indicated its belief that "monetary conditions in
the recent range would be broadly appropriate" over the next six
months. Beyond the six-month horizon, however, the Bank sees some
tightening in monetary conditions if aggregate demand remains robust
and the economy continues to take up slack.

IV-22
CANADIAN ECONOMIC INDICATORS(Percent change from previous period except where noted, SA)
1997 1998
Q3 Q4 Q1 Jan Feb Mar Apr
GDP at Factor Cost 1.1 0.7 n.a. -0.8 0.9 n.a. n.a.
Industrial Production 1.6 0.7 n.a. -2.9 2.3 n.a. n.a.
Manufacturing Survey:Shipments 2.5 0.9 n.a. -3.8 2.9 n.a. n.a.
NewOrders 2.0 1.6 n.a. -0.6 0.8 n.a. n.a.
Retail Sales 1.7 1.2 n.a. -1.8 0.1 n.a. n.a.
Housing Starts 2.2 0.1 1.8 -5.5 9.0 4.1 -8.1
Employment 0.8 0.4 0.7 -0.0 0.6 0.1 0.5
Unemployment Rate (%) 9.0 8.9 8.7 8.9 8.6 8.5 8.4
Consumer Prices1 1.7 1.0 1.0 1.1 1.0 0.9 0.8
Consumer Attitudes2 119.9 116.8 n.a.......
Business Confidence3 164.9 159.2 n.a.. .. ...
1. Percent change from year earlier.2. Level of index, 1991 - 100.3. Level of index. 1977 = 100.
EXTERNAL BALANCES(Billions of U.S. dollars.SAAR)
1997 1998
Q3 Q4 Q1 Jan Feb Mar
Japan: trade 88.7 98.8 98.0 100.1 110.2 83.7
current account 99.6 119.2 116.6 97.3 148.7 103.8
Germany: trade1 76.1 79.4 n.a. 39.6 77.5 n.a.
current account 1 -8.9 17.0 n.a. -89.1 0.6 n.a.
France: trade 29.8 34.2 n.a. 32.4 27.6 n.a.current account 34.0 43.9 n.a. 35.8 n.a. n.a.
U.K.: trade -18.4 -28.1 n.a. -22.1 -43.3 n.a.
current account 8.9 0.8 n.a. ... ... ...
Italy: trade 28.6 25.5 n.a. n.a. n.a. n.a.
current account 1 45.9 37.5 n.a. n.a. n.a. n.a.
Canada: trade 13.5 11.6 n.a. 12.4 15.3 n.a.
current account -19.1 -17.7 n.a. ... ..
1. Not seasonally adjusted... Data not available on a monthly basis.

IV-23
Industrial Production in Selected Industrial Countries
Japan 1991=100-1 120
1993 1994 1995 1996 1997 1998
France
i l ' 'I I li u I l I 111993 1994 1995 1996
Italy
1997 1998
Germany 1991=100
United Kingdom
K -- 120
,1 I I 1 , , I ' ' I , , , 1 , , 1, _11993 1994 1995 1996 1997 1998
Canada
1993 1994 1995 1996 1997 1998
MAY 14,1998

IV-24
MAY 14, 1998Consumer Price Inflation in Selected Industrial Countries
(12-month change)
PercentGermany
Percerr
1993 1994 1995 1996 1997 1998
FrancePercent
, ' ' I I, 1J <iJ L -I1993 1994 1995 1996 1997 1998
ttalyPercent
-2
1993 1994 1995 1996 1997 1998
United KingdomPercent
-. I
-1 i I II2, I I L
1993 1994 1995 1996 1997 1998
CanadaPercent
r
F
FS.t I _L L ,
1993 1994 1995 1996 1997 1998
Japan
SI It ,I I I I I I I I I I I 1- -- ~~"
1993 1994 lI<LI ~IL111 I1L1 I '
,t4
IV-25
Economic Situation in Other Countries
In Korea and the ASEAN region, economic activity continued to
be generally weak due to a decline in domestic demand, although
Singapore showed signs of a rebound. Growth has slowed in China and
contracted sharply in Hong Kong, but remains relatively steady in
Taiwan. In Latin America, growth was strong in Argentina and
Mexico, but weak in Brazil and Venezuela. Inflation has generally
been stable to moderate, although it accelerated in Indonesia as
well as in Venezuela.
The general adjustment toward surplus in external balances in
Asia continued, with the exception of Taiwan. In Latin America,
external balances continued to deteriorate except in Brazil, where
the trade deficit narrowed further.
Implementation of reforms continued in Korea. Thailand, and
the Philippines under their respective IMF programs. In April,
Indonesia reached agreement with the IMF on a revised program and
qualified for a $1 billion drawing on its stand-by in May. However,
Malaysia rejected an IMF recommendation against bailing out
insolvent firms.
Individual country notes. Korea is experiencing a sharp
recession. Based on partial data for several components of
aggregate expenditures, we estimate that real GDP fell 8 percent
(SAAR) during the first quarter. Real activity has contracted as a
result of a downturn in domestic demand that is attributable in part
to a high degree of economic uncertainty, balance sheet adjustments
by corporations and households, and tight credit conditions. CPI
inflation rose to 8.8 percent in April on a 12-month basis from an
average rate of below 5 percent in 1997 because of the depreciation
of the won.
Korea's current account surplus rose to $43 billion (AR)
during the first quarter, a swing of $72 billion from the $29
billion deficit recorded a year earlier. Most of the swing in the
balance in dollar terms has reflected a contraction in imports,
which fell 35 percent from their year-earlier level. A sharp
decline in the volume of imports, due to weak domestic demand, a
real depreciation of the won, and financing constraints, has been

IV-26
reinforced by a considerable fall in the dollar price of imported
goods.
Korea has experienced substantial labor unrest during the past
two months, due in part to a marked rise in unemployment and a
limited social safety net. The unemployment rate rose to 6.5
percent in March compared with 2.1 percent in October. One major
federation of Korean trade unions has demanded that a key labor
reform approved by the Korean legislature in February--which eased
the ability of employers to lay off workers in the context of
restructurings--be modified significantly. Employees at the
financially distressed Kia conglomerate went on a temporary strike
in April to forestall the government from selling its majority stake
in Kia to a third party.
Financial market developments have been mixed during the past
six weeks. The Korean won has remained basically stable at around
1400 won/dollar, supported by the Korean government's success in
raising $3.9 billion through issuing 5- and 10-year international
market bonds at spreads about 350 basis points over comparable-
maturity U.S. Treasuries. However, the Korean stock market has
declined about 35 percent since the March FOMC meeting, returning to
near its mid-December trough.
KOREAN ECONOMIC INDICATORS(Percent change from year earlier except where noted)
1996 1997 1997 1998 1998
Q4 Q1 Mar Apr
Real GDP 6.8 5.5 3.9 n.a. ... ...
Industrial Production 8.4 8.1 7.0 -7.9 -10.1 n.a.
Consumer Prices 4.9 4.4 5.0 8.9 9.0 8.8
TradeBalancel -15.3 -3.9 10.8 38.4 45.6 n.a.
Current Account 1 -23.7 -8.6 13.2 42.8 44.4 n.a.1. Billions of U.S. dollars, AR, NSA.
In the ASEAN region, weakening domestic demand and tightening
liquidity continued to constrain economic activity. In Indonesia,
real year-over-year GDP growth slowed in the fourth quarter of 1997
to under 1.5 percent. Industrial production declined in Malaysia
and Thailand in the early months of 1998, but Singapore showed signs
of a rebound led by a surge in the output of high-valued
pharmaceuticals.

IV-27
ASEAN ECONOMIC INDICATORS: GROWTH
1996 1997 1997 1998
Q4 Jan Feb Mar
Real GDP, SAARIndonesia 8.0 4.7 1.4 ...
Malaysia 8.6 7.8 6.5 ...
Philippines 5.7 5.1 1.1......
Singapore 6.7 7.5 2.2 ... ...
Thailand 6.4 -0.4 n.a. ... ......
Industrial Production 1
Indonesia 6.6 n.a. 1.6 n.a. n.a. n.a.
Malaysia 11.0 10.8 10.2 3.0 -2.2 n.a.
Philippines 4.3 3.8 12.3 -12.7 n.a. n.a.
Singapore 4.0 4.3 8.3 -5.1 16.5 8.5
Thailand 7.2 -0.9 -11.5 -15.8 -13.7 n.a.1. Year-over-Year.
Consumer prices accelerated in Indonesia as spot food
shortages and announcements of impending withdrawals of subsidies
triggered panic buying of basic consumer goods, and the weak
currency kept import prices high. Recent increases in fuel prices
set off a new round of protests that have turned violent, with
security forces firing on student demonstrators and mobs attacking
shops owned by ethnic Chinese. These protests are roiling financial
markets and heightening uncertainty about the economic situation.
ASEAN ECONOMIC INDICATORS: INFLATION(Percent change from year earlier)
1996 1997 1997 1998
Q4 Q1
1998
Mar Apr
Consumer Prices
Indonesia 8.0 6.5 10.0 29.7 39.1 44.9
Malaysia 3.5 2.7 2.7 4.3 5.1 n.a.
Philippines 8.4 5.1 6.1 7.1 7.3 7.9
Singapore 1.4 2.0 2.3 1.0 1.0 n.a.
Thailand 5.8 5.6 7.5 9.0 9.5 10.1
Trade balances have continued to swing into surplus for most
of the ASEAN countries. This primarily reflects the effects of
weakened currencies and slowing growth discouraging imports,
although export performance has begun to strengthen as well.

IV-28
ASEAN ECONOMIC INDICATORS: TRADE BALANCE1
1996 1997 1997 1998
Q4 Jan Feb Mar
Indonesia 6.9 11.8 12.5 18.8 20.4 n.a.
Malaysia -0.1 -0.2 1.7 7.0 7.9 12.0Philippines -11.4 -10.7 -9.2 -8.7 -4.3 n.a.
Singapore2 -5.9 -5.8 -3.3 5.4 0.5 6.1Thailand -16.1 -4.6 10.0 10.4 13.7 11.9
1. Billions of U.S. dollars, AR, NSA.2. Non-oil trade balance.
Implementation of economic reforms varied across the ASEAN
region. In mid-April. Indonesia signed its third letter of intent
with the IMF, agreeing to a 117-point program that focuses on
monetary policy, resolution of private external debt, banking
reforms, and other structural reforms. Jakarta also agreed to
weekly monitoring of monetary indicators. On April 22, the
government announced it had met the target date for the first round
of reforms, and on May 4 the IMF Executive Board voted to release $1
billion of the $10 billion credit. Contingent on continued
satisfactory implementation of the program, the IMF will release
another $1 billion in June.
Elsewhere, Thailand announced a 15-point plan in late April to
address the continuing crisis in the financial system. The plan
includes raising the debt ceiling on foreign borrowing by the
government, an IMF recommendation, and loosening restrictions on
joint ventures between local banks and foreign investors. In early
April, the Philippines submitted a plan to the IMF, under its $1.4
billion stand-by facility, to improve financial sector supervision.
In response to a caution from the IMF against bailing out insolvent
firms. Prime Minister Mahathir reaffirmed his government's intention
to assist firms harmed by what he characterized as foreign
speculators' attack on the ringgit.
In Hong Kong, economic activity has weakened significantly.
We estimate that output fell 6 percent in the fourth quarter of 1997
(SAAR) from the previous quarter. In the first quarter, the
unemployment rate rose to 3.5 percent from 2.4 percent in the
previous quarter. Interest rates rose sharply in mid-May amid
concerns that a weaker economy and renewed turmoil in Indonesia
might make the Hong Kong dollar vulnerable to a speculative attack.
__

IV-29
On May 14, the yield spread between Hong Kong government securities
and comparable U.S. Treasuries was around 300 basis points at
maturities of 1-10 years, up about 100 basis points from the
beginning of the month. Foreign exchange reserves were $97 billion
at the end of March, up about $4 billion from December.
In China, real GDP growth slowed to 7.2 percent in the first
quarter over a year ago, while consumer prices remained virtually
unchanged in April from a year earlier. China's trade surplus
increased in the first four months of 1998. The dollar value of
exports was up 12 percent in the first four months of this year from
year-earlier levels, and 8 percent in April, significantly less than
the 20 percent growth rate in 1997. The dollar value of imports
rose 3 percent in the first four months from a year earlier, equal
to the growth rate in 1997. Total reserves less gold were $144
billion in March, up about $1 billion from the beginning of the
year.
CHINESE ECONOMIC INDICATORS(Percent change from year earlier except where noted)
1996 1997 1997 1998 1998
Q4 Q1 Mar Apr
Real GDP 9.7 8.8 8.2 7.2 ... ...
Industrial Production 15.6 13.1 13.0 10.3 10.7 n.a.
Consumer Prices I 7.0 0.4 0.4 0.7 0.7 -0.3
Trade Balance2 12.2 40.3 38.8 42.4 40.8 51.1
1. End of period.2. Billions of U.S. dollars, AR, NSA.
Taiwan's industrial production decelerated in the first
quarter, as export growth slowed substantially. A very small trade
surplus in the first four months of 1998 compares with a surplus of
$4.8 billion (AR) in the year-earlier period. Exports to Asia fell
sharply from year-ago levels, while exports to the United States and
Europe rose slightly; imports fell 3 percent. Consumer price
inflation rose above 2 percent (year-over-year) in March and April.
Inflation has been more evident in wholesale prices, which rose at
an average rate of about 5 percent (year-over-year) in the first
four months of 1998. International reserves were about $84 billion
at the end of March, largely unchanged from the beginning of the
year.

IV-30
TAIWAN ECONOMIC INDICATORS(Percent change from year earlier except where noted, NSA)
1996 1997 1997 1998 1998
Q4 Q1 Mar Apr
Real GDP 5.7 6.8 7.1 n.a.
Industrial Production 1.6 7.0 8.2 4.6 3.9 n.a.
Consumer Prices 1 2.5 0.2 0.2 2.6 2.6 2.1
Trade Balance 2 14.3 7.7 2.2 -2.4 4.8 3.2
Current Account 2 10.5 7.4 8.8 n.a....1. End of period.2. Billions of U.S. dollars, AR, NSA.
In Mexico, economic activity remains strong but the pace of
growth has slowed somewhat as a result of budget cuts in January and
March prompted by the decline in oil prices. Growth of industrial
production slowed to 7.2 percent in February from its year-earlier
level, compared with a 7.6 percent rate in January. On the other
hand, the unemployment rate declined to 3.4 percent in March from
3.6 percent in January. The trade deficit widened to $7.2 billion
(AR) in the first quarter.
MEXICAN ECONOMIC INDICATORS(Percent change from year earlier except where noted)
1996 1997 1997 1998 1998
Q4 Q1 Mar Apr
Real GDP 5.1 7.0 6.7 n.a....
Industrial Production 10.4 9.2 8.9 n.a. n.a. n.a.
Unemployment Rate (%) 5.5 3.7 3.1 3.5 3.4 n.a.
ConsumerPrices 1 27.7 15.7 14.3 22.5 15.4 11.9
Trade Balance 2 6.5 0.6 -5.2 -7.2 -7.2 n.a.
Imports2 89.5 109.8 124.0 119.2 134.4 n.a.
Exports2 96.0 110.4 118.8 112.0 127.2 n.a.
CurrentAccount 2 -1.9 -7.3 -12.4 n.a. ... ...
1. End of period; percentage change from previous period. AR, NSA.2. Billions of U.S. dollars, AR. NSA.
The CPI inflation rate fell to under 12 percent (AR) in April.
The peso value of the dollar has stabilized since the Bank of Mexico
tightened monetary policy in mid-March. The 28-day cetes interest
rate has declined to 17.4 percent in May, below its mid-March high
of 21.52 percent. Spreads on Mexican Brady bonds, adjusted for

IV-31
collateral, fell slightly from 479 basis points on January 2 to
about 430 basis points in recent trading.
In Brazil, economic activity has been sluggish. Industrial
output of consumer durables and capital goods rose somewhat in
February, but to a level still about 10 percent below its peak in
October 1997. The unemployment rate reached 8.2 percent in March,
the highest since 1984. Inflation was around 6 percent (AR) in
March.
Indications are that net capital inflows have been strong in
recent months, prompting the central bank to intervene to mitigate
upward pressures on the currency. International reserves (liquidity
concept) rose to $75 billion in mid-May from $52 billion at end-
1997. Events in recent weeks, however, have cast a pall on
Brazilian stocks and Brady bonds. In April, two close allies of
President Cardoso, Brazil's communications minister and a leader in
Brazil's unruly lower house, died, fueling the perception that
economic reforms would be more difficult to pass through Congress.
These perceptions were further heightened by the defeat (by one
vote) in early May of the government's social security reform
proposal. (The proposal is critical to fiscal stability.)
BRAZILIAN ECONOMIC INDICATORS(Percent change from year earlier except where noted)
1996 1997 1997 1998 1998
Q4 Q1 Feb Mar
Real GDP 1 2.9 3.0 2.0 n.a.
Industrial Production1 5.4 2.0 -9.2 -10.0 11.3 8.7
Open Unemployment Rate (%) 5.4 5.6 5.3 7.6 7.4 8.2
ConsumerPrices 2 9.4 4.3 4.5 7.4 6.2 6.2
Trade Balance 3 -5.5 -8.4 -11.6 -6.4 -1.2 -9.6
Current Account 3 -24.3 -33.8 -44.8 -24.0 -20.4 -30.0
1. Percent-change from previous period, SAAR.2. INPC, Percentage change from previous period, AR. Annual data are Dec/Dec.3. Billions of U.S. dollars, AR, NSA.
In early April, the central bank had reduced its overnight
lending rate by about 5 percentage points over the previous 6 weeks
to 23 percent. Large net capital inflows plus concern over rising
unemployment most likely motivated the interest rate reduction.

IV-32
In Argentina, economic activity continues to grow at a healthy
pace with low inflation. Industrial production (SA) in March was up
6.4 percent over a year ago. Consumer prices have been roughly flat
over the past two months, and the 12-month inflation rate in April
was slightly over 1 percent. A combination of strong imports due to
robust growth, a fall in commodity prices, and a slowdown in exports
to Brazil has led to further deterioration of the current account
deficit, which widened to about $15 billion (AR) in the fourth
quarter of 1997. The recent widening of the trade deficit has
exceeded the IMF's target under the terms of Argentina's Extended
Fund Facility.
ARGENTINE ECONOMIC INDICATORS(Percent change from year earlier except where noted)
1996 1997 1997 1998 1998
Q4 Ql Mar Apr
Real GDP 4.3 8.4 8.2 n.a....
Industrial Production (SA) 3.1 8.6 9.2 6.8 6.4 n.a.
Unemployment Rate (%)2 17.2 14.9 13.7... ...
Consumer Pricesl 0.1 0.3 -0.8 3.6 -1.2 0.0
TradeBalance 3 1.6 -3.2 -7.2 -6.0 -6.0 n.a.
Current Account 3 -4.0 -10.2 -15.2 n.a. ...1. End of period; percentage change from previous period. AR, NSA.2. Unemployment figures available only in May and October of each year. Theannual figure is the average of the two surveys.3. Billions of U.S. dollars, AR, NSA.
In Venezuela, the recent slump in oil prices, together with
the accompanying tightening of fiscal and monetary policies, is
putting considerable strain on the economy. The unemployment rate
rose by a percentage point in the first quarter of this year.
Although quarterly data on real GDP are not available, the
government has acknowledged that economic activity may have
contracted in the first quarter. Inflation has been rising
recently, reaching almost 50 percent (AR) in April.
Falling oil prices have led to declines in both exports and
government revenues, causing international reserves (excluding gold)
to fall 13 percent during January-March, and forcing the government
to cut public spending. Despite this tightening, the fiscal
situation has deteriorated and fears of devaluation have grown. In
order to prevent a large depreciation of the bolivar and a bigger

IV-33
rundown of international reserves, the government has raised
interest rates substantially. The bolivar has depreciated some 6
percent through April this year but is still considered
substantially overvalued.
VENEZUELAN ECONOMIC INDICATORS(Percent change from year earlier except where noted)
1996 1997 1997 1998 1998
Q4 Q1 Mar Apr
Real GDP -0.4 5.1... .
Unemployment Rate (NSA, %) 11.8 11.8 10.6 11.6 ...
ConsumerPrices 1 103.3 37.6 43.2 32.1 37.7 49.4
Non-oil Trade Balance 2 -4.8 -6.6 -8.0 n.a. n.a. n.a.
Trade Balance 2 13.8 11.6 -9.2 n.a. n.a. n.a.
Current Account 2 8.8 6.0 ......1. End of period; percentage change from previous period. AR, NSA.2. Billions of U.S. dollars. AR. NSA.
In Russia, recent data confirm a slowing of activity in the
first quarter, possibly reflecting the influence of higher interest
rates and shaken business confidence over this period arising from
spillover to Russian financial markets from the Asian financial
crises. Real GDP in the first quarter showed no increase on a year-
over-year basis after rising about 3/4 percent in the previous
quarter. Industrial output growth also slowed noticeably in the
first quarter. The inflation rate has continued to moderate in
recent months, moving down to a 12-month rate of 8-1/2 percent in
March.
So far in the second quarter, interest rates have eased
slightly on balance, despite episodes of downward pressure on the
ruble seemingly related to concern over the uncertain political
situation.
On April 24, the Duma (parliament) voted to accept Sergei
Kiriyenko as Prime Minister. The Communist-dominated Duma had twice
previously voted to reject Kiriyenko, President Yeltsin's choice to
replace the fired Viktor Chernomyrdin. However, the Duma backed
down when faced with the certainty of its dissolution and new
parliamentary elections if it had voted against Kiriyenko a third
time. Kiriyenko's cabinet appointments suggest that the new
government will be at least as supportive of economic reform as its

IV-34
predecessor. Probably the most pressing problem facing the new
government is to hold down the budget deficit (optimistically
estimated to be about 5 percent of GDP in the recently passed 1998
budget) in the face of increased interest costs and falling revenue
from the oil sector (which accounts for over one-third of total
government taxes).
RUSSIAN ECONOMIC INDICATORS(Percent change from year earlier except where noted)
1996 1997 1997 1998 1998
Q4 Q1 Feb Mar
Real GDP -6.3 0.4 0.8 0.0 0.0 0.1
Industrial Production -5.2 1.9 3.4 1.3 1.4 0.9
Consumer Prices 52.8 14.8 11.8 9.3 9.4 8.5
Ruble Depreciation 12.5 12.7 7.8 6.1 7.0 6.1
Trade Balancel 16.4 n.a. n.a. n.a. ...
CurrentAccount 1 2.2 -1.4 n.a. n.a... .1. Billions of U.S. dollars.

IV-35
Appendix: New Exchange Rate Indices
The staff's multilateral trade weighted index of the dollar's
exchange value against the other G-10 currencies is about to be
retired. Prompted in part by the expected creation of the euro on
1 January 1999, which will lead to the extinction of half of the
currencies included in the G-10 index, and in part by increasing
interest in the currencies of our developing and newly
industrializing trading partners, the staff has developed some new
exchange rate indices to summarize and characterize the dollar's
movements in foreign exchange markets.
Three new indices of the dollar's overall foreign exchange
value have been developed: a narrow nominal index, a broad nominal
index, and a broad real or price-adjusted index.1 These indices
include a larger number of currencies than the G-10 index and have
weights that vary over time. Furthermore, the weights are derived
from more detailed measures of trading patterns than those in the
G-10 index.
The movements of the narrow nominal and broad real indices are
similar to those of the comparable G-10 indices, although the swings
in the new series are generally less extreme. In contrast, the
broad nominal index has moved quite differently due to the presence
in the index of currencies of some high inflation countries. These
currencies have experienced persistent depreciations against the
dollar, a feature which tends to restrict the usefulness of the
broad nominal index to discussions of shorter-term developments in
foreign exchange markets because, over the longer-term, large
nominal depreciations of a few currencies swamp information on the
value of the dollar against other currencies.
The new indices employ a common weighting scheme based on
measures of the competitiveness of U.S. goods. Considerably more
weight is given to the Canadian dollar and the Japanese yen than is
1A real version of the narrow index could be calculated whenappropriate, and the broad version of the indices along with thenarrow version implies a second narrow measure, comprised of theadditional currencies in the broad measure.

IV-36
U.S. Dollar Exchange Rate Indices(Ratio scales, Index, March 1973 = 100)
Nominal Indices
600 - - 160Monthly ISO
500 - 150
, - 140
400 - ,'(
- 120
300 -120
20 N 110
200 - ,;-. - 10200 ,..0' ! v A 0''V % ' '"
rv ^ 1^^90
Narrow 80
100
70I I I I I t ! I t I I I I 1 1 1 I 1 I I 1 I i I \ 701974 1978 1982 1986 1990 1994 1998
Real Indices
- - 160Monthly
- 150fIt
Is - 140
G-10 ? i
S* - 130
1 IS
- 120
/ Broad - 110
- ' *; 't; - 80, It to I
1982 1986 19901974 1978 1994 1998

IV-37
1996 Weights for US. Dollar Exchange Rate Index(percent)
Country or Region G-10 Narrow Broad Export Sector Import Sector
Canada
EU-11
Japan
Mexico
China
Korea
United Kingdom
Taiwan
Singapore
Hong Kong
Brazil
Malaysia
Switzerland
Thailand
Australia
Indonesia
Philippines
Sweden
Argentina
Chile
Total
9.1
57.6
13.6
11.9
3.6
4.2
100.0
29.4 17.3
28.4 16.7
26.9 15.8
7.7
6.6
4.3
7.4 4.4
4.2
3.5
3.2
2.8
2.6
3.5 2.0
1.8
2.7 1.6
1.4
1.2
1.7 1.0
1.0
0.9
100.0 100.0
EU-11:
Germany
France
Italy
Belgium/Luxembourg
Netherlands
Spain
Ireland
Austria
Finland
Portugal
Total 57.6 28.4 16.7 17.9 15.5
12.9
17.9
14.2
5.5
5.5
5.2
4.8
3.9
4.0
4.9
4.3
2.6
2.9
2.0
2.6
1.6
1.1
1.0
1.7
1.5
21.7
15.5
17.4
10.0
7.7
3.4
3.9
4.5
3.0
1.5
1.3
2.7
1.2
1.7
0.5
1.2
1.2
1.1
0.2
0.3
100.0100.0
20.8
13.1
9.0
6.4
8.3

IV-38
given by the G-10 index,2 with an offsetting decline in the weight
assigned to the euro-area currencies.
The narrow nominal index includes dollar exchange rates
against the currencies of Canada, the EU-11 countries, Japan, the
United Kingdom, Switzerland, Australia, and Sweden--making it a
16-currency index until Europe's monetary union begins, at which
time it will become a 7-currency index. The broad index includes,
along with the currencies in the narrow index, four currencies from
Latin America and nine from Asia--making it a 29-currency index
until European Monetary Union begins and a 20-currency index
thereafter.
While we expect that these new indices will become the
standard summary measures used in presentations to the Board and the
FOMC on the foreign exchange value of the dollar, other, specially-
tailored exchange rate indices may also be used from time to time.
Two key exchange rate indices are likely candidates in this regard--
one currently used in the nonagricultural export sector of the
staff's trade model and the other currently used in the non-oil
import sector. Weights for these indices are shown in the two
rightmost columns of the preceding table. The average of the
weights for these two indices form the basis for the weights in the
broad and narrow summary indices.
A number of factors went into the decisions on which
currencies to include in the indices. Aside from creating indices
that will accommodate the introduction of the euro, our basic
strategy was to enlarge the currency coverage to include the
currencies of other major U.S. trading partners. Currency selection
for the broad indices was based largely on country trade shares,
although, at the margin, other considerations also influenced our
choices. The foreign countries whose currencies are included in the
broad indices supplied more than 90 percent of U.S. non-oil imports
in 1997 and absorbed more than 85 percent of U.S. nonagricultural
exports in that year. Those same countries were responsible for 70
percent of aggregate world trade in 1996, measured as the sum of
multilateral exports and imports, and they generated a bit more than
2 The G-10 index uses fixed weights based on multilateral tradeshares between 1972 and 1976.

IV-39
half of world GNP in 1995, measured on the basis of purchasing power
parity exchange rates.
Trade Shares by Group(percent)
Broad Narrow G-10
U.S. non-oil imports (1997) 91 55 53
U.S. nonagricultural exports 88 56 52(1997)
World multilateral trade (1996) 70 50 43
memo:
World GNP share (1995, PPP basis) 54 31 27
While the subset of countries with currencies in the narrow
index provides significantly less coverage in terms of trade share
and productive capacity, the coverage is still substantial.
Moreover, the narrow nominal index was designed not only to measure
competitive pressures on the dollar, particularly against the major
industrial countries, but also to serve as one gauge of financial
pressures on the dollar. As a consequence, the index includes
currencies traded in deep and relatively liquid financial markets
and excludes currencies with a history of high inflation relative to
the United States or with limited liquidity and depth in financial
intermediation.
The weighting scheme is based on measures of trade
competitiveness, where the weights capture the extent to which U.S.
goods compete with the goods produced in foreign countries.
For the portion of that competition which occurs in the U.S.
market, a weight equal to a country's share of U.S. imports is used
to proxy for the degree of competition from that country. These
weights are the import sector weights mentioned earlier.
For the portion of that competition which occurs in foreign
markets, we use the export sector weights mentioned earlier. These

IV-40
weights are made up of two pieces, corresponding to the fact that
U.S. goods compete with the goods of a particular foreign country in
that country's home market and in third-country markets. One
piece--which measures foreign home-market competition like that
between U.S. and German goods in Germany--is proxied by the U.S.
export share to the foreign country. A second piece--which measures
foreign third-market competition like that between U.S. and German
goods in Japan--is proxied by the U.S. export share to the third
country scaled by the share of the foreign country's goods in the
third country's imports. In this way, a country will have a high
combined export weight if it figures importantly as a direct
destination for U.S. exports or is a major exporter to other
countries that take a large share of U.S. exports.
The weight in the summary index is then computed as the simple
average of the bilateral import share weights and the combined
export weights. Overall, we believe that this weighting scheme is
useful in that it lends itself to a number of other purposes not
detailed here, including the calculation of summary exchange rate
measures for other currencies and the calculation of indices for
other subsets of currency groupings.
Consistent with the shift away from fixed-weight indices in
the United States, the new exchange rate indices use weights that
vary over time. A benefit of this approach is that the exchange
rate index can readily incorporate changes in the pattern of trade,
such as the expansion of trade with China or other Asian economies.
In addition, adjustable weights permit the recognition of events
such as the accession of a second wave of EU countries to the
European Monetary Union, which would affect the trade shares
assigned to currencies in the indices.
Because the new indices are intended to be proxies for
competitiveness, the data used to compute the bilateral import and
export shares for the United States exclude U.S. military exports
and trade in oil and agricultural commodities, which are less likely
to be differentiated by country of destination or origin and thus
less likely to reflect differences in competitiveness among
countries. Comparably disaggregated trade data for other countries
are not as readily available. Therefore, the import and export
shares used in the calculation of third-country competitiveness are

IV-41
based on aggregate bilateral merchandise imports and exports for
each country pair. In addition, because of the impending move into
monetary union by 11 EU countries, and the highly integrated trading
relationships among the remaining member countries, intra-EU trade
is excluded in the calculations.
Because the weights in the new indices vary over time and
because the data used to construct the weights are released with a
lag and are periodically revised, the new indices will be subject to
revision. This is particularly true for index values in the current
year and the year immediately preceding the current year, although
earlier historical values may also be revised from time to time.