Embed Size (px)
Citation preview
Prefatory Note
The attached document represents the most complete and accurate version available based on original copies culled from the files of the FOMC Secretariat at the Board of Governors of the Federal Reserve System. This electronic document was created through a comprehensive digitization process which included identifying the best-preserved paper copies, scanning those copies,1 and then making the scanned versions text-searchable.2 Though a stringent quality assurance process was employed, some imperfections may remain.
Please note that this document may contain occasional gaps in the text. These gaps are the result of a redaction process that removed information obtained on a confidential basis. All redacted passages are exempt from disclosure under applicable provisions of the Freedom of Information Act.
1 In some cases, original copies needed to be photocopied before being scanned into electronic format. All scanned images were deskewed (to remove the effects of printer- and scanner-introduced tilting) and lightly cleaned (to remove dark spots caused by staple holes, hole punches, and other blemishes caused after initial printing). 2 A two-step process was used. An advanced optimal character recognition computer program (OCR) first created electronic text from the document image. Where the OCR results were inconclusive, staff checked and corrected the text as necessary. Please note that the numbers and text in charts and tables were not reliably recognized by the OCR process and were not checked or corrected by staff.

Strictly Confidential (FR) Class II FOMC
Part 1 September 20, 1995
CURRENT ECONOMICAND FINANCIAL CONDITIONS
Summary and Outlook
Prepared for the Federal Open Market Committee
By the staff of the Board of Governors of the Federal Reserve System

DOMESTIC NONFINANCIAL DEVELOPMENTS
Overview
The economic data in recent weeks suggest that activity is
growing moderately on the whole. Businesses have made some progress
in bringing inventories into better alignment with sales and appear
to be confident enough about the sustainability of the expansion
that they are adding to their payrolls. Nevertheless, the inventory
adjustment process still appears incomplete, and this is likely to
place some limits on output growth in the short run. Consequently,
we are projecting that real GDP will expand at an annual rate of
only a bit more than 2-1/4 percent, on average, during the third and
fourth quarters.
Indeed, assuming no change in monetary policy, as indexed by
the current 5 3/4 percent federal funds rate, we would expect that
activity would continue to expand at around this pace through 1996.
The inventory correction should be largely complete within the next
few months, and the lifting of this restraint on production--which
we expect will have taken 3/4 percentage point off GDP growth this
year--is a positive element in the outlook for activity thereafter.
Similarly, growth is expected to be boosted by some lessening of the
negative influence of real net exports in response to the lagged
effects of the depreciation of the dollar earlier this year and an
improvement in economic performance abroad, especially in Mexico.
In contrast, growth in domestic final demand--which has remained
fairly robust thus far this year--should slow. The recent rallies
in the bond and stock markets may well bolster demand for a while
longer, but this effect is more than offset in our projection for
1996 by additional fiscal restraint and waning accelerator effects
on business fixed investment.

I-2
In an environment of slightly below-trend growth, the
unemployment rate is projected to drift upward--to 6 percent by the
end of next year. But we expect that there will be a marginal
firming in compensation growth in the near term, given the current
tautness in the labor market, with the ECI for private industry
workers accelerating to a rise of just over 3 percent in 1996,
compared with 2-3/4 percent in the year ended this past June. But,
meanwhile, strains on domestic manufacturing capacity have
diminished greatly since the beginning of the year, and high levels
of investment point to an easing of price pressures from this
source. Moreover, a firmer dollar should translate into flat import
prices and reinforce the competitive pressures on U.S. producers.
All told, the circumstances point to some reversal of the widening
of profit margins that has occurred, and so the core CPI is
projected to rise 2.8 percent in 1996, a shade below the pace in the
last twelve months.
Key assumptions
The federal funds rate is assumed to remain where it is now
until late in 1996 and then to ease thereafter only enough to match
the decline in inflation. Such a path would come as a mild surprise
to credit markets, which evidently are anticipating some further
policy easing in the next few months. While this might have some
adverse consequences for bond prices, there are offsetting factors
in the outlook. First, we believe that the inflation rates we are
projecting will be more favorable than is currently anticipated in
the market. And, second, market participants probably have retained
a considerable measure of skepticism about the prospects for deep
reductions in the budget deficit; if a fiscal package similar to
that assumed in our forecast were enacted, the bond market might
respond positively. In light of these opposing influences, we have

I-3
projected essentially no change in long-term interest rates over the
forecast period.
As regards federal fiscal policy, we have retained our
assumption of deficit reduction measures amounting to $30 billion
(relative to CBO's current-policy baseline) in fiscal year 1996,
$55 billion in fiscal 1997, and $80 billion in fiscal 1998. This
package is more front-loaded than some other quite plausible
outcomes, and it is arguable that the greater risk is that the
degree of fiscal restraint next year will fall short of what we have
assumed.1 On a unified basis, the budget deficit has fallen
sharply in the current fiscal year, from $203 billion in fiscal 1994
to about $162 billion. The drop has been exaggerated by the
transitory effects of proceeds from spectrum auctions and deposit-
insurance-related transactions. Given as well our projection of
rather slow growth in nominal income, the deficit is forecast to
jump to $176 billion in fiscal 1996 and remain in that vicinity in
fiscal 1997. We have not assumed any type of tax reform at this
point; if, as seems likely, the issue is more actively discussed,
that debate could elicit significant anticipatory responses.
The trade-weighted foreign exchange value of the dollar has
risen in recent weeks and is expected to stay near recent levels
over the forecast period--an increase of approximately 2-1/2 percent
relative to the path in the August Greenbook. Prospects for
economic growth abroad have changed little since the last forecast:
On an export-weighted basis, foreign real GDP is projected to
increase 2 percent in 1995 and 3-1/2 percent in 1996. The posted
price of WTI crude oil has firmed a bit over the inter-meeting
1. Some bigger first-year deficit reduction estimates includepositive initial revenue effects of a capital gains tax cut. Wehave not included such a cut in our package, and it is in any eventquestionable whether such a revenue increase really implies much (ifany) fiscal restraint: Investors would realize the gains now onlyif they felt they would be better off over the long haul.

I-4
period and now is expected to average $16.75 per barrel in the third
quarter. In response to the projected increases in world oil
demand, the posted price is projected to rise to $18.50 per barrel
by the third quarter of 1996.
Developments in the Third Quarter
Our point-forecast of real GDP growth in the current quarter is
2-1/4 percent at an annual rate--with the many missing data leaving
a sizable band of uncertainty around that number. Labor market
indicators appear consistent with a moderate increase in output.
Although payrolls were essentially unchanged in July, they rose
substantially in August, and the latest readings on initial claims
suggest a solid job gain in September. The workweek is expected to
bounce back in September, and aggregate hours of private production
or nonsupervisory workers are projected to increase at an annual
rate of about 1-1/2 percent in the third quarter. After ticking
down in August, the unemployment rate is expected to move back up to
about 5-3/4 percent in September, implying little change for the
third quarter as a whole.
In the industrial sector, we estimate that output spurted more
than a percent in August, after increasing an upward-revised
1/4 percent in July. The gain in August seems outsized, but both
the hours figures and the available physical-product information
point persuasively to such a burst of production. That said, we do
not think that strong output gains will continue. The surge in
electricity generation will be reversed as temperatures become more
seasonable. Last month's rebound in motor vehicle assemblies also
is likely to be transitory, given reported parts shortages and the
2need to trim excessive stocks of some models. In other
2. For the third quarter as a whole, lower motor vehicleproduction is forecast to reduce the growth in real GDP by0.4 percentage point; cutbacks in assemblies depressed growth1.1 percentage points in the second quarter.

I-5
manufacturing sectors, orders trends have flattened recently, and
our industry contacts report a variety of soft spots. As a result,
we are projecting that IP will decline some in the near term. Even
with the August bulge, manufacturing output should increase only at
a 2 percent annual pace on a quarterly average basis in the current
period.
SUMMARY OF THE NEAR-TERM OUTLOOK(Percent change, at annual rates, unless otherwise noted)
1995Q2 03 04
Real GDP 1.1 2.2 2.5Previous 0.5 2.2 2.9
Final sales 2.5 3.4 2.8Previous 2.1 3.3 2.4
Civilian unemployment rate1 5.7 5.7 5.8Previous 5.7 5.8 5.8
CPI inflation 3.2 2.0 2.8Previous 3.2 2.0 2.8
1. Percent.
Real consumer spending is expected to rise at a fairly hefty
3-1/4 percent annual rate this quarter, in part reflecting the
arithmetic effects of the high level in June. Consumer purchases of
motor vehicles fluctuated considerably in July and August but are
running only a little above the average level of the second quarter,
bolstered, in part, by incentive programs. Outside of motor
vehicles, retail sales reportedly have flattened out after
substantial gains in late spring; the demand for home electronic
equipment apparently remains robust, but sales of apparel have
continued to languish. On the service side, hefty air-conditioning
bills have boosted expenditures.
Housing demand has strengthened in recent months in response to
lower mortgage rates. Single-family housing starts rose sharply in

I-6
July and edged up further in August. Figures on mortgage
applications and reports from homebuilders suggest that sales have
been brisk in September. Given the normal lags in construction,
this increase in activity will translate into a modest increase in
real residential investment in the current quarter and a double
digit gain in the fourth.
Real business fixed investment is expected to increase at a
10 percent annual rate in the current quarter--off from the
12 percent pace in the second quarter. The slowing has occurred in
equipment spending, where orders and shipments have weakened of
late. Business purchases of computers are projected to increase at
"only" a 15 to 20 percent annual rate (versus better than 50 percent
in the second quarter); this drop-off apparently has been
exacerbated by parts shortages, leading us to think there may be a
partial rebound in the fourth quarter. However, the slowing in
growth of computer outlays likely is part of a broader and more
fundamental cyclical deceleration in capital spending, and outlays
for other types of equipment are also projected to grow more
moderately. In contrast, the incoming data on construction put-in-
place have been quite strong, and spending on real nonresidential
structures is expected to advance at a 13-1/2 percent annual rate in
the third quarter.
Cutbacks in business inventory investment are expected to
depress real GDP growth more than a percentage point at an annual
rate in the third quarter. The bulk of the adjustment occurs in the
motor vehicle sector, where stocks fell appreciably in August.
Elsewhere, the data now in hand extend only through July and present
a rather mixed picture: Stocks rose sharply in manufacturing and
wholesale trade but were drawn down at the retail level. We suspect
that some of the July stockbuilding was intended, but the rise in

I-7
inventory-sales ratios and anecdotal reports suggest that stocks
probably are higher than many businesses would prefer. As a result,
we anticipate further cuts in the pace of inventory accumulation.
Real government spending is forecast to rise at a 1-1/4 percent
annual rate in the third quarter, led by a spurt in state and local
expenditures. Incoming data indicate a sharp increase in
construction expenditures, particularly for highways, while state
and local governments also appear to be adding to their payrolls.
At the federal level, real purchases are projected to fall at a
3-1/4 percent annual rate.
The deficit on net exports of goods and services was little
changed in July, as nominal exports and imports both declined. For
the third quarter as a whole, we expect a deterioration in real net
exports equal to about 1/2 percentage point of real GDP.
The CPI rose 0.1 percent in August and is projected to increase
only 2 percent at an annual rate in the third quarter. Energy
prices are forecast to decline, as lower crude oil costs are passed
on to the retail level, but food prices are expected to rise around
2-1/4 percent, held down by declines in the prices of fresh
vegetables in recent months. Excluding food and energy, the core
CPI rose 0.2 percent in August and appears headed for a quarterly
average increase of about 2-1/2 percent. Prices of used cars, auto
finance charges, and airfares have continued to reverse the large
increases they recorded earlier in the year. Materials costs, too,
have decelerated in recent months, with the PPI for intermediate
materials excluding food and energy up only 0.1 percent last month.
The latest news on labor costs also has been reasonably favorable:
Average hourly earnings fell 0.2 percent in August, producing an
average rate for the most recent three months just a little above
the 3 percent pace of the past year.

I-8
The Outlook for the Economy
As was noted above in the overview, we are forecasting that
real GDP growth will run around 2-1/4 percent through 1996. Our
output path is obviously far smoother than can reasonably be
expected to materialize, but at this point we have no basis for
predicting significant twists and turns. Broadly characterized, the
forecast involves a sequence of balancing impulses. Near term, the
recent decline in the cost of capital and the ample availability of
credit are expected to sustain above-trend growth of domestic final
demand, but overall production is constrained by efforts to curb the
rate of inventory accumulation. During 1996, the effects of this
year's financial market rally begin to wane--and monetary policy
remains rather restrictive, as gauged by the relatively high level
of real short-term rates. In addition, fiscal policy exerts a
greater restraint on demand in 1996, offsetting the lessening of the
drag on activity coming from the external sector.
SUMMARY OF STAFF REAL GDP PROJECTION FOR 1995-1996(Percent change, at annual rates)
1994 1995 1996H1 H2
Real GDP 4.1 1.9 2.3 2.2Previous 4.1 1.6 2.5 2.3
Final sales 3.4 2.5 3.1 2.2Previous 3.4 2.3 2.9 2.1
Gross domestic purchases 4.5 2.6 2.6 2.2Previous 4.5 2.2 2.4 2.1
Overall, the picture is one of output growth averaging
something less than potential and of a resultant slight easing of
pressures on labor and capital resources. In this environment, the
risks of inflation picking up materially would seem quite limited;

I-9
however, the prospects of achieving more than slight progress toward
price stability also appear small.
Consumer spending. Real consumer spending is projected to grow
at a comparatively modest pace through 1996. With household stocks
of durable goods having grown appreciably in the past few years, a
major cyclical impetus to demand is no longer present. We
anticipate that this year's run-up in financial asset prices will
give a boost to spending; however, the effect is expected to be
dulled by the less robust tone of the labor market and the problems
increasing numbers of households are encountering in servicing their
enlarged debts. Mortgage refinancing activity appears to be on the
rise once again, but this episode is unlikely to yield the same kind
of improvement in household finances that other recent refi waves
did.
Real PCE is forecast to increase at a 2-1/4 percent annual rate
in the fourth quarter--a figure that is depressed almost
1/2 percentage point by the return of energy consumption to more
normal levels; in 1996, consumer spending is projected to increase
about 2 percent. We anticipate that spending on durable goods will
be the fastest growing component of PCE, expanding 3-1/2 percent
next year. Although sales of light vehicles are expected to move
down to around 14-1/2 million units next year, spending on other
durable goods is projected to remain fairly brisk. Sales of
furniture and appliances are likely to benefit from the step-up in
home sales, and the demand for home electronic equipment is expected
to remain strong. In contrast, we are looking for subpar growth in
spending on nondurable goods and services.
Residential investment. Real residential investment is
expected to increase at a 13 percent annual rate in the fourth
quarter of 1995 and 4 percent in 1996. Anticipating that most of

I-10
the effect of this year's decline in mortgage rates has already been
reflected in demand, we are projecting that single family housing
starts will only rise a little further from here--to 1.15 million
units (annual rate) late next year versus 1.11 million in the past
two months and under 1 million at the low this spring. Demand will
be moderated by the mild growth in disposable income and could be
negatively affected by concerns about the future value--or
existence--of mortgage interest deductions (given discussions of tax
reform). But there are upside risks as well: The lag in the
response of housing demand to interest rate changes has sometimes
been surprisingly long, and more strengthening could be in the
pipeline; in addition, it is conceivable that the higher rate of
household formation observed in the past year could be maintained
for a while.
In the multifamily sector, starts are projected to rise
something over 10 percent by the end of next year, to an annual rate
of just above 300,000 units. This would still be a low level of
construction by historical standards, which is consistent with the
still high rental vacancy rate. But financial conditions are
generally favorable to an expansion of activity, and the supply-
demand balance is conducive to building in some locales.
Business fixed investment. Business capital spending has been
one of the driving forces in this expansion, and it is expected to
remain so through 1996, although outlays are expected to rise at a
less impressive pace. After increasing at double-digit rates for a
good many quarters, real BFI is expected to grow 8 percent (annual
rate) in the fourth quarter and 6 percent in 1996. The slowdown
reflects the waning of accelerator effects that stimulated spending
earlier in the expansion. Capacity utilization rates are projected

I-11
to move lower, and the supply of internal funds is likely to expand
only a little in a period of lackluster output growth.
Real PDE is projected to increase at an 8 percent annual rate
in the fourth quarter and 6-3/4 percent in 1996. Spending on
computers is expected to increase at a rapid clip--albeit one, at a
mere 16 percent next year, that is well below the average of recent
years. As noted earlier, we see computer outlays as participating
in a general cyclical deceleration of capital spending;
nonetheless, this forecast has some upside risk, given the rapidity
of technological progress and the ongoing decline in prices that
have led firms to upgrade their systems frequently and opened the
door to new uses for the equipment.3 Business purchases of motor
vehicles are projected to fall slightly over the forecast period,
reflecting in part a fall-off in deliveries of heavy trucks, for
which orders have weakened of late. Spending on other types of
equipment is expected to rise slowly, with substantial variation
across categories.
Real NRS investment is projected to increase at an annual rate
of close to 8 percent in the fourth quarter and 4 percent in 1996.
The backlog of permits remains fairly high. and, given the long lags
in this sector, spending growth should be sustained. Office
construction is expected to rise, with vacancy rates now down
considerably in some locales and financing readily available for
qualified borrowers. Industrial building is likely to register a
considerable advance, with notable capacity expansion under way not
only in high-tech sectors like semiconductors but also in steel and
some other "basic" industries.
3. This upside risk to our forecast of real GDP is, of course,more of a concern in the case of the fixed 1987-weight GDP accountswith which we are currently working; growth in computer expenditureswill be a less important element once the GDP accounts are based onchain weights or 1992 relative prices.

I-12
Business inventories. Tight supply conditions--reflected, for
example, in deteriorating vendor performance--and concerns about
rising materials prices apparently prompted firms to raise their
target stock-sales ratios last year. With the slackening in sales
growth this year, some firms found themselves with uncomfortably
large stockpiles, and the effort to realign inventories with
expected sales has been an important element in the deceleration of
output. During the forecast period, concerns about the availability
of goods are likely to subside further, and consequently, we would
expect to see a resumption of at least a slight downtrend to
inventory sales ratios.
The bulk of the gearing-down in the pace of accumulation is
forecast to be completed by the end of this year. Thereafter, we
expect that business stocks will rise at a relatively steady rate in
the absence--at least in our forecast--of any major short-run
gyrations in final demand.
Government purchases. As in the August Greenbook, the staff
assumes that the Congress and the President will reach a compromise
on the budget within the next few months and avoid any extraordinary
disruption of federal activities. Real federal purchases are
projected to decline at a 6-1/4 percent annual rate in the fourth
quarter of 1995, as the first round of spending cuts starts to take
effect. Real purchases are projected to decline 5-3/4 percent in
1996, with real defense spending falling 3-3/4 percent and real
nondefense purchases dropping 10 percent. As federal grants are
cut, we anticipate that state and local governments will be forced
to restrain their spending. After growing 2 percent in 1995, real
state and local purchases are projected to rise only 1-1/2 percent
in 1996.

I-13
Net exports. The restraint on domestic production coming from
the external sector is expected to diminish over the projection
period. Stimulated by faster growth abroad and the still relatively
low level of the dollar, real exports are forecast to increase
9-1/4 percent in 1996 after an increase of 6-1/2 percent in 1995.
Real imports are projected to expand a hefty 8-1/2 percent in 1996,
despite the slower pace of output growth; this reflects this
country's overall high propensity to import as well as exchange rate
effects and continued large increases in purchases of computers and
electronic components from abroad. (More detail on these
projections is contained in the International Developments section.)
STAFF LABOR MARKET PROJECTIONS(Percent change, Q4 to Q4, unless otherwise noted)
1994 1995 1996
Output per hour, nonfarm business 1.8 1.8 1.0Previous 1.8 1.5 1.3
Nonfarm payroll employment 3.1 1.7 1.1Previous 3.1 1.7 1.1
Civilian unemployment rate 5.6 5.8 6.0Previous 5.6 5.8 5.9
1. Average for the fourth quarter.
Labor markets. Reported productivity growth during the first
half of this year was remarkably high, for a period in which output
was decelerating markedly. This raises some question about our
assumption that the cyclically adjusted uptrend of output per hour
in the nonfarm business sector is about 1-1/2 percent per annum (in
1987 dollars). While it could be that the trend is somewhat
steeper, a couple of considerations lead us to retain our prior
assumption for the time being. First, the surge in productivity in
the second quarter appears to reflect importantly a fluke decline in
self-employed workers, and we anticipate a reversal of that drop in
I-14
the current quarter. In addition, the official figures are derived
from the income side of the national accounts and--arithmetically--
have been elevated relative to GDP numbers by the steep increase
over the past year or so in the statistical discrepancy as income
growth has exceeded measured production growth. The product-side
figures may well be running closer to the truth in this period.
(Indeed, the BLS plans to shift to a product-side measure of
productivity next year.)
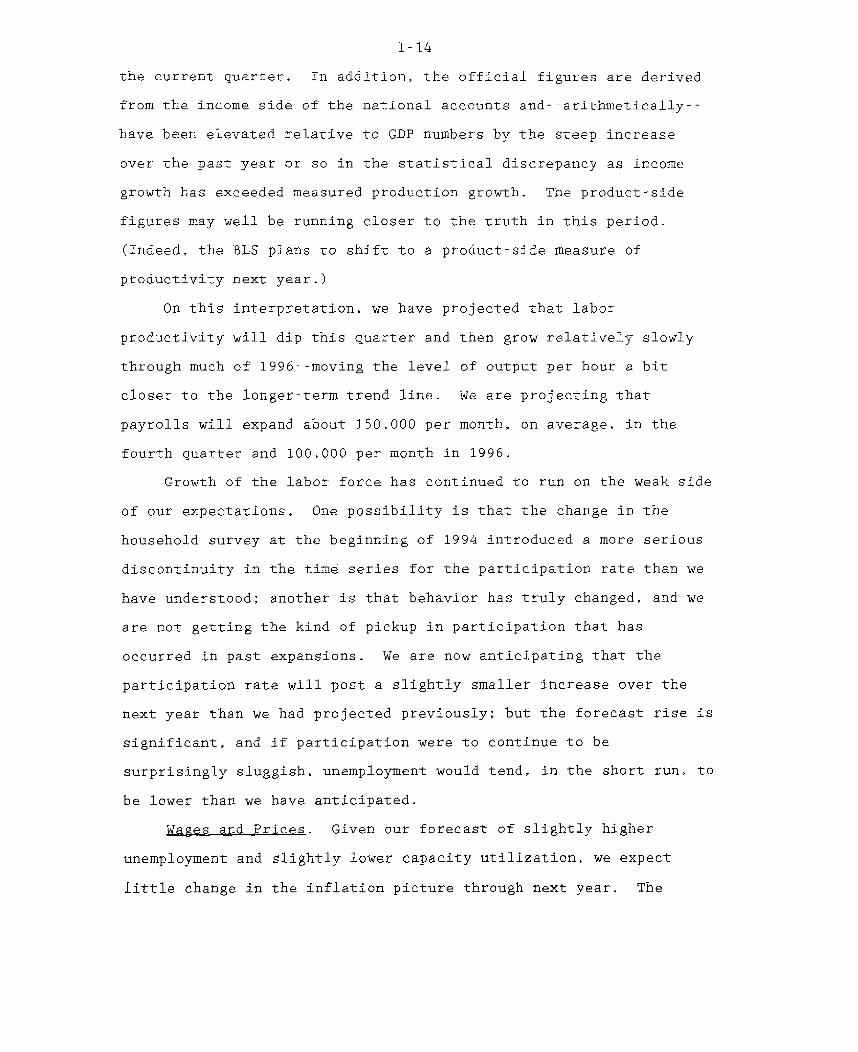
On this interpretation, we have projected that labor
productivity will dip this quarter and then grow relatively slowly
through much of 1996--moving the level of output per hour a bit
closer to the longer-term trend line. We are projecting that
payrolls will expand about 150,000 per month, on average, in the
fourth quarter and 100,000 per month in 1996.
Growth of the labor force has continued to run on the weak side
of our expectations. One possibility is that the change in the
household survey at the beginning of 1994 introduced a more serious
discontinuity in the time series for the participation rate than we
have understood; another is that behavior has truly changed, and we
are not getting the kind of pickup in participation that has
occurred in past expansions. We are now anticipating that the
participation rate will post a slightly smaller increase over the
next year than we had projected previously; but the forecast rise is
significant, and if participation were to continue to be
surprisingly sluggish, unemployment would tend, in the short run, to
be lower than we have anticipated.
Wages and Prices. Given our forecast of slightly higher
unemployment and slightly lower capacity utilization, we expect
little change in the inflation picture through next year. The

I-15
overall CPI is projected to rise 2.9 percent in 1996, with the core
component increasing a bit less than that, at 2.8 percent.
We are anticipating that the employment cost index for hourly
compensation will accelerate slightly in coming quarters. Employers
have thus far captured a disproportionate share of the recent gains
associated with savings on medical insurance and other benefits
costs, and some partial catch-up by workers would not be surprising.
In addition, it seems unlikely that benefit cost savings will be as
easy to come by now that many companies have already shifted to
managed care schemes. 4 But compensation gains are projected only
to inch up: Although labor markets remain relatively tight--reports
persist of "shortages" of qualified job applicants--workers still
seem sufficiently concerned about preserving their jobs and benefits
that they are not putting much pressure on employers to raise pay.
STAFF INFLATION PROJECTIONS(Percent change, Q4 to Q4, unless otherwise noted)
1994 1995 1996
Consumer price index 2.6 2.8 2.9Previous 2.6 2.8 3.0
Excluding food and energy 2.8 3.1 2.8Previous 2.8 3.1 2.9
ECI for compensation of 1private industry workers 3.1 2.8 3.1
Previous 3.1 2.8 3.1
1. December to December.
Even if hourly compensation and unit labor cost increases do
grow somewhat, the effects on prices should be minor. Prices have
been rising considerably faster than labor costs for some time,
leading to a widening of profit margins. This situation suggests
4. Current discussions of cuts in Medicare/Medicaid outlayssuggest a further upside risk to benefit costs: "cost-shifting" bymedical care providers squeezed by government price constraints. Atthis point, however, we have not incorporated such specificprogrammatic changes into our fiscal assumptions.

I-16
that some cushion exists to absorb higher compensation rates in the
short run. Moreover, the easing of capacity pressures has reduced
the pricing leverage of materials producers, and the firming of the
dollar is likely to be reflected in a softening of import prices.
Meanwhile, we are assuming that there will be no major shocks
from the energy and agriculture sectors disturbing this otherwise
quiescent inflation picture. Energy prices are expected to
accelerate appreciably in the near term as the projected increase in
crude oil costs is passed through to the retail level. Although we
have raised our forecast of food prices since the August Greenbook
in response to reports of additional crop losses in late summer, the
increases still are expected to be modest--2.7 percent in both 1995
and 1996. Although the prices of grains and oil seeds have climbed
a good deal this year, unless there is a substantial further rise,
the effects on grocery store or restaurant prices should be modest.
A First Glance at 1997
In this Greenbook, the projection has been extended through
1997. The tentativeness of this exercise must be regarded as even
greater than usual, given the prospective revisions to the GDP
accounts and the extraordinary uncertainty surrounding the fiscal
outlook (including both deficit reduction and possible tax reform).
With that caveat, as noted above, we have assumed a slight easing in
short-term interest rates by 1997 to keep pace with the decline in
inflation. Yet, even with this adjustment, we view the level of
real short-term interest rates as high enough to continue to exert a
restraining influence on the growth of aggregate demand; real GDP is
projected to grow less than its potential pace, and the unemployment
rate moves up somewhat further. With the reemergence of slack in
the economy, the core inflation rate is forecast to edge down to
2.7 percent in 1997.

I-17
Alternative Simulations
We have run an alternative set of forecast simulations with the
Board's econometric model in which the federal funds rate is assumed
to be raised or lowered relative to the baseline path by 100 basis
points--implemented in four equal installments beginning in the
fourth quarter of 1995. Given the lags in the model, neither policy
action has any appreciable effect on 1995. Thereafter, under the
lower funds rate assumption, real GDP growth is raised almost
1/2 percentage point in 1996 and 3/4 percentage point in 1997. The
unemployment rate is 1/2 percentage point lower by the end of 1997,
and core inflation is 0.1 percentage point higher in 1996 and almost
1/2 percentage point higher in 1997. The results for the tighter
monetary policy simulations are symmetrical.
ALTERNATIVE FEDERAL FUNDS RATE ASSUMPTIONS(Percent change, Q4 to Q4, except as noted)
1995 1996 1997
Real GDPBaseline 2.1 2.2 2.0Lower funds rate 2.1 2.6 2.8Higher funds rate 2.1 1.8 1.2
Civilian unemployment rate 1
Baseline 5.8 6.0 6.2Lower funds rate 5.8 5.9 5.7Higher funds rate 5.8 6.1 6.7
CPI excluding food and energyBaseline 3.1 2.8 2.7Lower funds rate 3.1 2.9 3.1Higher funds rate 3.1 2.7 2.3
1. Average for the fourth quarter.

Strictly Confidential (FR)Class II FOMC
STAFF PROJECTIONS OF CHANGES IN GDP, PRICES, AND UNEMPLOYMENT(Percent, annual rate) September 20, 1995
Unemploymentrate
GDP fixed-weight Consumer (level exceptNominal GDP Real GDP price index price index1 as noted)
Interval 08/16/95 09/20/95 08/16/95 09/20/95 08/16/95 09/20/95 08/16/95 09/20/95 08/16/95 09/20/95
ANNUAL
19932 5.4 5.4 3.1 3.1 3.0 3.0 3.0 3.0 6.8 6.819942 6.2 6.2 4.1 4.1 2.7 2.7 2.6 2.6 6.1 6.11995 4.9 5.1 2.9 3.0 2.9 2.9 2.9 2.9 5.7 5.71996 4.5 4.6 2.3 2.2 2.9 2.9 2.9 2.9 5.9 5.91997 4.0 2.1 2.7 2.7 6.1
QUARTERLY
1994 Q12 6.1 6.1 3.3 3.3 3.1 3.1 2.2 2.2 6.6 6.6Q22 7.2 7.2 4.1 4.1 2.9 2.9 2.5 2.5 6.2 6.2Q3
2 6.2 6.2 4.0 4.0 3.0 3.0 3.6 3.6 6.0 6.0
Q42 6.4 6.4 5.1 5.1 2.6 2.6 2.2 2.2 5.6 5.6
1995 Q12 4.7 4.7 2.7 2.7 3.3 3.3 3.2 3.2 5.5 5.5Q22 2.0 2.8 .5 1.1 2.7 2.8 3.2 3.2 5.7 5.703 4.6 5.1 2.2 2.2 2.8 2.8 2.0 2.0 5.8 5.7Q4 5.4 5.1 2.9 2.5 2.9 3.1 2.8 2.8 5.8 5.8
1996 Q1 4.7 5.1 2.3 2.3 3.1 3.4 3.3 3.0 5.8 5.8Q2 4.3 4.3 2.3 2.2 2.7 2.7 3.1 3.1 5.9 5.9Q3 4.4 4.1 2.3 2.2 2.8 2.6 2.9 2.9 5.9 5.904 4.3 4.1 2.3 2.1 2.8 2.6 2.8 2.7 5.9 6.0
1997 Q1 4.1 2.0 2.9 2.7 6.0Q2 3.9 2.0 2.6 2.7 6.1Q3 3.9 2.0 2.6 2.7 6.1Q4 3.8 2.0 2.6 2.7 6.2
6.6 6.66.3 6.3
3.7 3.7 3.04.6 4.6 2.8
3.0 2.3 2.3 -. 3 -. 32.8 2.9 2.9 -. 6 -. 6
3.4 3.7 1.6 1.9 2.95.0 5.1 2.5 2.3 2.8
4.5 4.74.4 4.1
4.03.8
2.3 2.2 2.92.3 2.1 2.8
2.02.0
2.9 3.2 3.2 .13.0 2.4 2.4 .1
3.0 3.2 3.1 .12.6 2.9 2.8 .0
FOUR-QUARTER4
1993 0421994 Q421995 Q41996 Q41997 Q4
For all urban consumers.Actual.
Percent change from two quarters earlier; for unemployment rate, change in percentage points.4. Percent change from four quarters earlier; for unemployment rate, change in percentage points.
TWO-QUARTER3
1994 Q22042
1995 022
Q4
1996 Q2Q4
1997 Q2Q4

Strictly Confidential (FR)Class II FOMC
REAL GROSS DOMESTIC PRODUCT AND RELATED ITEMS, ANNUAL VALUES(Seasonally adjusted annual rate) September 20, 1995
Projected
Item Unit1 1989 1990 1991 1992 1993 1994 1995 1996 1997
EXPENDITURES
Nominal GDPReal GDP
Real GDPGross domestic purchasesFinal salesPrivate dom. final purch.
Personal cons. expend.DurablesNondurablesServices
Business fixed invest.Producers' dur. equip.Nonres. structures
Res. structures
ExportsImports
Government purchasesFederal
DefenseState and local
Change in bus. invent.Nonfarm
Net exports
Nominal GDP
EMPLOYMENT AND PRODUCTION
Nonfarm payroll employ.Unemployment rate
Industrial prod. indexCapacity util. rate-mfg.
Housing startsLight Motor Vehicle Sales
Auto sales in U.S.North American prod.Other
INCOME AND SAVING
Nominal GNPNominal GNPNominal personal incomeReal disposable incomePersonal saving rate
Corp. profits, IVA&CCAdjProfit share of GNP
Federal surpl./def.State/local surpl./def.
Ex. social ins. funds
PRICES AND COSTS
GDP implicit deflatorGDP fixed-wt. price indexGross domestic purchases
fixed-wt. price indexCPI
Ex. food and energy
ECI, hourly compensation2
Nonfarm business sectorOutput per hourCompensation per hourUnit labor cost
5250.8 5546.14838.0 4897.3
1.6 .2.9 -. 4
1.5 1.2.5 -. 1
1.2 .7-. 5 -. 81.2 -.11.7 1.7
-. 4 .7-1.7 2.92.3 -3.9-7.7 -15.2
11.3 6.72.6 .4
Bill. $Bill. 87$
% change
Bill. 87$
% change
Millions
% change%
Millions
Bill. $% change
%
% change%
Bill. $
% change
3.32.81.53.6
5.73.2
-54.7
4.7
109.45.5
-.281.3
1.1913.85
9.506.902.60
5567.84.96.51.14.2
2.36.8
-163.525.1-35.6
4.54.6
5.26.35.3
4.6
572486
-1
-I
4.8 6020.27.6 4979.3
.3 3.7-. 1 4.1-. 4 3.8-. 8 5.1
.0 4.21.3 9.61.6 3.21.2 3.5
6.2 6.73.2 11.0
.2.4 -3.4.7 17.0
8.1 5.04.0 8.6
-. 8 .7*3.2 .87.0 -1.3
.8 .6
1.1 2.51.3 -2.09.5 -32.3
3.5 6.4
108.36.7
.278.0
1.0112.318.396.142.25
5740.83.23.7.9
5.0
8.86.8
-202.917.0
-46.5
3.33.6
2.93.04.4
4.4
-1.4 .4 2.33.1 6.2 4.74.6 5.7 2.3
1. Percent changes are from fourth quarter to fourth quarter.
108.67.4
4.079.2
1.2012.808.356.262.10
6025.86.18.15.05.5
9.66.7
-282.724.8
-41.6
2.63.2
3.23.13.5
3.5
6343.35134.5
3.13.93.05.0
3.09.01.32.5
16.021.3
1.68.1
5.812.4
-1.0-6.9-9.0
3.0
15.318.5
-73.9
5.0
110.76.8
3.680.9
1.2913.89
8.726.751.97
6347.85.02.8
.54.1
23.47.7
-241.426.3
-40.0
1.82.8
2.52.73.1
3.6
6738.4 7078.7 7403.05344.0 5504.8 5624.8
4.1 2.1 2.24.5 2.6 2.23.4 2.8 2.24.9 4.0 2.9
3.5 2.6 2.18.6 2.9 3.63.1 1.8 1.22.4 2.9 2.2
12.9 12.7 6.015.5 13.3 6.74.6 10.7 3.93.1 -.3 4.1
11.6 6.4 9.313.8 9.0 8.6
-1.0 -.4 -1.1-5.9 -4.6 -5.8-8.2 -4.1 -3.72.0 1.9 1.4
47.8 28.3 16.040.7 28.4 16.0
-110.0 -128.5 -141.9
6.5 4.4 4.4
114.0
6.1
6.083.4
1.4615.079.247.281.96
6726.96.16.84.44.1
4.98.1
-159.126.2
-39.3
116.65.7
2.183.3
1.3514.67
8.847.101.74
118.15.9
2.782.0
1.4614.508.617.001.61
7061.3 7382.14.5 4.35.3 4.52.5 2.04.4 4.2
4.5 2.68.3 8.1
-143.1 -133.826.7 29.8-38.0 -34.3
2.0-. 6
-1.54.0
29.829.9
-73.7
6.0
107.95.3
-. 183.2
1.3814.53
9.917.082.83
5266.86.16.51.14.0
-6.36.9
-122.344.8
-17.5
4.44.4
4.44.64.4
4.8
3.1 1.3 1.8 1.85.1 1.9 3.2 3.71.9 .5 1.4 1.8
2. Private-industry workers.
7699.45740.2
2.01.92.02.3
1.93.81.21.7
5.16.3.9
-. 4
9.47.9
-. 4-4.5-4.3
1.5
15.414.4
-141.7
3.9
119.16.1
2.481.5
1.4814.508.617.001.61
7675.83.94.41.94.3
1.97.9
-148.141.1
-22.6
1.92.7
2.62.72.7
3.0
1.43.21.8
2.3 2.32.9 3.0
2.9 2.82.6 2.82.8 3.1
3.1 2.8

Strictly Confidential (FR)Class II FOMC
REAL GROSS DOMESTIC PRODUCT AND RELATED ITEMS, QUARTERLY VALUES(Seasonally adjusted; annual rate except as noted) September 20, 1995
1993 1994 1995
Item Unit Q1 Q2 Q3 Q4 Q1 Q2 Q3 Q4 Q1 Q2
EXPENDITURES
Nominal GDPReal GDP
Real GDPGross domestic purchasesFinal salesPrivate dom. final purch.
Personal cons. expend.DurablesNondurablesServices
Business fixed invest.Producers' dur. equip.Nonres. structures
Res. structures
ExportsImports
Government purchasesFederalDefense
State and local
Change in bus. invent.Nonfarm
Net exports
Nominal GDP
EMPLOYMENT AND PRODUCTION
Nonfarm payroll employ.Unemployment ratel
Industrial prod. indexCapacity util. rate-mfg.
1
Housing startsLight Motor Vehicle Sales
Auto sales in U.S.North American prod.Other
INCOME AND SAVING
Nominal GNPNominal GNPNominal personal incomeReal disposable incomePersonal saving rate
1
Corp. profits, IVA&CCAdjProfit share of GNP
1
Federal govt. surpl./def.State/local surpl./def.
Ex. social ins. funds
PRICES AND COSTS
GDP implicit deflatorGDP fixed-wt. price indexGross domestic purchases
fixed-wt. price indexCPI
Ex. food and energy
ECI, hourly compensation2
Nonfarm business sectorOutput per hourCompensation per hourUnit labor cost
Bill. $Bill. 87$
% change
Bill. 87$
% change
Millions%
% change%
Millions
Bill. $% change
%
% change
Bill. $
% change
-2.2 .41.9 2.44.1 2.0
6235.95075.3
1.22.7
.23.5
1.63.2
-1.63.1
15.120.0
2.55.3
-1.011.6
-5.9-15.4-20.0
.9
18.519.7
-57.6
4.4
109.77.0
5.180.8
1.1613.23
8.326.361.96
6243.95.1
-5.8-7.44.0
9.67.1
-283.521.6
-44.7
3.34.2
3.33.13.5
4.2
6299.95105.4
2.43.32.43.7
2.69.81.61.4
15.621.6
.3-7.6
7.714.9
1.2-3.6-2.24.4
18.922.8
-69.3
4.2
110.47.0
.780.6
1.2514.11
8.936.872.07
6303.33.98.64.74.6
30.77.5
-237.025.3
-41.1
1.62.4
2.62.83.5
3.5
6359.25139.4
2.74.03.25.3
3.97.72.83.6
12.216.2
.59.4
-3.27.4
1.1-3.0-9.2
3.7
13.020.9
-86.3
3.8
111.06.7
3.380.7
1.3113.69
8.656.681.97
6367.84.22.4.8
3.9
18.47.7
-224.923.9
-42.4
1.02.0
1.61.72.4
3.4
2.9 4.2 1.71.5 1.6 4.9
-1.3 -2.5 3.1
6478.15218.0
6.35.86.47.4
4.015.5
2.42.0
21.127.5
3.328.2
21.716.0
-.1-5.0-3.6
2.9
10.810.7
-82.2
7.7
111.86.5
5.381.4
1.4714.53
8.977.081.89
6476.27.06.74.34.0
37.08.2
-220.134.5
-31.7
1.32.4
2.43.42.9
3.4
6574.75261.1
3.35.02.25.8
4.78.83.84.0
10.918.6-11.810.0
-3.59.5
-4.9-10.3-16.0-1.4
25.422.1
-104.0
6.1
112.76.6
7.182.3
1.3615.45
9.457.442.00
6574.06.25.33.43.6
-17.97.7
-176.225.2
-40.7
2.93.1
2.52.22.9
3.0
-1.4 2.71.4 2.72.8 .0
6689.95314.1
4.14.61.52.7
1.3.4
2.21.1
9.26.1
20.67.0
16.618.9
-1.2-7.9-4.12.9
59.251.7
-111.8
7.2
113.66.2
6.083.1
1.4414.769.157.161.99
6682.56.87.73.54.1
33.68.2
-145.127.0
-38.9
2.92.9
3.22.52.9
3.4
6791.75367.0
4.04.44.34.1
3.15.83.32.2
14.118.1
1.6-6.0
14.815.6
6.710.912.84.3
57.147.4
-117.0
6.2
114.56.0
4.983.6
1.4714.659.097.092.01
6779.65.95.43.14.1
7.28.2
-154.023.9
-41.4
1.93.0
3.53.63.1
3.3
6897.25433.8
5.14.25.76.8
5.120.4
3.12.3
17.619.611.02.3
20.211.4
-4.1-14.4-21.8
2.3
49.441.7
-107.1
6.4
115.35.6
5.984.5
1.5115.449.257.421.83
6871.35.58.87.54.6
3.18.2
-161.128.8
-36.4
1.32.6
2.62.22.3
2.6
4.33.8-. 4
1. Not at an annual rate. 2. Private-industry workers.
6977.4 7024.95470.1 5485.2
2.7 1.13.5 1.72.6 2.54.2 3.8
1.6 3.4-3.4 2.92.3 2.02.6 4.3
21.5 11.824.5 12.311.5 10.1-3.4 -13.2
4.8 6.110.1 9.5
-. 7 -. 8-3.8 -4.9-7.5 -2.91.0 1.6
51.1 32.749.1 31.9
-118.5 -126.8
4.7 2.8
116.1 116.45.5 5.7
5.2 -2.484.7 83.1
1.31 1.2814.90 14.358.84 8.727.03 6.911.81 1.82
6959.5 7005.85.2 2.77.4 2.94.1 -1.15.1 4.0
6.9 11.38.2 8.4
-148.6 -127.828.2 26.1-36.9 -38.7
2.2 1.63.3 2.8
2.5 4.84.1 3.51.6 -1.2
1. Not at an annual rate. 2. Private-industry workers.

Strictly Confidential (FR)Class II FOMC
REAL GROSS DOMESTIC PRODUCT AND RELATED ITEMS, QUARTERLY VALUES(Seasonally adjusted, annual rate except as noted) September 20, 1995
Projected
1995 1996 1997
Item Units Q3 Q4 Q1 Q2 Q3 Q4 Q1 Q2 Q3 Q4
EXPENDITURES
Nominal GDPReal GDP
Real GDPGross domestic purchasesFinal salesPrivate dom. final purch.
Personal cons. expend.DurablesNondurablesServices
Business fixed invest.Producers' dur. equip.Nonres. structures
Res. structures
ExportsImports
Government purchasesFederal
DefenseState and local
Change in bus. invent.Nonfarm
Net exports
Nominal GDP
EMPLOYMENT AND PRODUCTION
Nonfarm payroll employ.Unemployment rate
1
Industrial prod. indexCapacity util. rate-mfg
1
Housing startsLight Motor Vehicle Sales
Auto sales in U.S.North American prod.Other
INCOME AND SAVING
Nominal GNPNominal GNPNominal personal incomeReal disposable incomePersonal saving rate
1
Corp. profits, IVA&CCAdjProfit share of GNP
1
Federal govt. surpl./def.State/local surpl./def.
Ex. social ins. funds
PRICES AND COSTS
GDP implicit deflatorGDP fixed-wt. price indexGross domestic purchases
fixed-wt. price indexCPI
Ex. food and energy
ECI, hourly compensation2
Nonfarm business sectorOutput per hourCompensation per hourUnit labor cost
1. Not at an annual rate.
Bill. $Bill. 87$
% change
Bill. 87$
% change
Millions%
% change8
Millions
Bill. $% change
%
% change%
Bill. S
% change
7112.05515.3
2.22.73.44.4
3.28.7.9
3.0
10.09.1
13.64.4
2.96.0
1.3-3.3-4.4
3.9
17.118.1
-134.1
5.1
116.85.7
3.882.7
1.4014.74
9.067.351.71
7098.25.45.14.04.1
4.48.3
-139.124.4
-40.2
7200.55548.8
2.52.42.83.6
2.23.81.91.8
7.98.07.8
13.1
12.110.4
-1.4-6.2-1.5
1.2
12.414.4
-134.6
5.1
117.35.8
1.982.4
1.4314.698.727.101.62
7181.84.85.83.34.3
-3.88.2
-157.028.0
-36.3
7290.35579.9
2.32.52.13.2
2.23.51.22.4
6.36.94.38.2
7.68.6
-1.7-6.3-2.3
.8
14.815.9
-139.1
5.1
117.65.8
3.082.3
1.4514.498.617.001.61
7271.65.15.03.24.5
6.18.2
-145.725.8
-38.4
7366.65609.7
2.22.22.22.9
2.13.71.22.2
6.06.63.84.4
11.810.5
-1.3-6.5-4.0
1.5
14.614.3
-140.3
4.3
118.05.9
2.682.1
1.4614.508.617.001.61
7344.34.14.4
.44.1
-. 48.1
-120.628.3
-35.8
7440.45640.1
2.22.61.72.8
2.13.61.32.1
5.96.63.62.6
4.36.9
-. 9-5.9-4.61.7
21.320.8
-147.4
4.1
118.35.9
2.782.0
1.4614.50
8.617.001.61
7421.94.34.02.44.2
4.08.1
-128.531.2
-32.8
7514.75669.4
2.11.62.72.7
2.03.61.22.0
5.96.63.61.5
13.68.4
-. 6-4.6-4.0
1.5
13.512.9
-141.0
4.1
118.56.0
2.481.7
1.4614.50
8.617.001.61
7490.53.74.72.04.2
.88.0
-140.533.8
-30.1
2.7 2.6 2.8 2.1 1.8 1.92.8 3.1 3.4 2.7 2.6 2.6
2.3 2.6 3.0 2.7 2.6 2.62.0 2.8 3.0 3.1 2.9 2.72.6 2.9 2.8 2.8 2.7 2.7
3.0 3.0 3.1 3.1 3.1 3.1
-. 8 .7 .93.5 3.5 3.64.3 2.8 2.7
2. Private-industry workers.
7590.55697.6
2.01.92.12.5
2.04.91.11.7
5.46.32.0-. 4
7.66.2
-. 7-4.9-4.3
1.4
12.711.9
-140.4
4.1
118.86.0
2.481.6
1.4714.50
8.617.001.61
7569.74.35.03.14.4
4.78.0
-148.737.3
-26.5
2.12.9
2.82.72.7
3.0
1.33.52.2
7662.95725.5
2.01.92.02.3
1.83.51.21.7
5.16.3
.7-. 5
12.410.4
-. 1-3.6-4.3
1.6
12.911.9
-140.2
3.9
119.06.1
2.381.5
1.4714.50
8.617.001.61
7637.63.64.21.64.4
-4.67.9
-146.539.2
-24.5
1.92.6
2.62.72.7
3.0
1.33.11.8
7735.75754.3
2.02.41.62.3
1.83.51.21.7
5.16.2
.7-. 4
5.16.7
-. 1-3.5-4.2
1.6
19.418.4
-145.8
3.9
119.26.1
2.481.4
1.4814.508.617.001.61
7715.04.13.91.14.2
6.27.9
-141.844.3
-19.3
1.82.6
2.62.72.7
3.0
1.43.11.7
7808.55783.4
2.01.62.22.3
1.83.51.21.7
5.06.3
.3-. 3
12.68.3
-. 9-5.9-4.2
1.6
16.515.4
-140.1
3.8
119.46.2
2.681.4
1.4814.50
8.617.001.61
7780.73.54.31.74.2
1.87.9
-155.443.5
-20.0
1.72.6
2.62.72.7
3.0
1.53.11.6

Strictly Confidential (FR)Class II FOMC
NET CHANGES IN REAL GROSS DOMESTIC PRODUCT AND RELATED ITEMS 1
(Billions of 1987 dollars) September 20, 1995
1993 1994 1995 Projected
Item Q1 Q2 Q3 Q4 01 Q2 Q3 Q4 Q1 Q2 1992 1993 1994 1995
Real GDPGross domestic purchases
Final salesPrivate dom. final purch.
Personal cons. expend.DurablesNondurablesServices
Business fixed invest.Producers' dur. equip.Nonres. structures
Res. structures
Change in bus. invent.NonfarmFarm
Net exportsExportsImports
Government purchasesFederal
DefenseNondefense
State and local
14.6 30.1 34.0 78.6 43.1 53.0
33.7 41.8 51.1 74.4 64.9 60.7
2.7 29.7 40.035.9 38.6 54.5
52.9 66.8 36.3 15.158.2 56.9 47.7 23.4
80.7 28.5 19.2 55.1 74.4 34.6 33.576.9 61.9 29.8 45.4 74.3 47.7 43.6
22.0 33.0 34.0 40.1 11.5 26.9 44.9 14.3 30.4
11.2 9.0 18.1 10.9 .5 7.4 25.2 -4.8 3.9
4.3 7.4 6.3 10.3 6.0 9.1 8.5 6.3 5.7
6.4 16.6 9.6 18.9 5.1 10.4 11.1 12.8 20.7
19.4 20.7 16.9 29.3 16.418.4 20.7 16.6 28.2 20.9
.9 .1 .2 1.2 -4.62.7 -4.1 4.7 13.5 5.4
14.3 22.1 28.2 35.4 21.1
7.5 21.5 24.2 31.1 17.2
6.9 .6 4.0 4.3 3.93.9 -3.6 1.3 -2.0 -8.0
11.9 .4 -5.9 -2.2 14.6 33.8 -2.1 -7.7 1.7 -18.4
13.4 3.1 -1.9 -10.2 11.4 29.6 -4.3 -5.7 7.4 -17.2
-1.5 -2.7 -4.0 8.0 3.2 4.2 2.2 -2.0 -5.7 -1.1
4.1 -21.829.9 -5.625.8 16.2
-11.6-9.4
-10.2.8
-2.1
-7.8 -5.2 9.9 -11.424.3 22.6 31.4 8.332.0 27.9 21.5 19.6
-2.8-7.0-2.4-4.54.1
14.9
8.86.9
1.86.1
-9.8-13.1-13.9
.83.3
-8.310.619.0
-1.8-4.1-1.6
-2.52.3
179.9 157.3 215.8 115.0
201.6 201.0 240.7 142.4
186.8 153.1 177.2 152.0
202.2 205.9 211.4 183.2
138.1 102.8 123.4 93.7
41.1 42.0 44.0 16.1
33.8 13.8 33.9 20.1
63.1 47.0 45.5 57.4
86.383.92.4
16.8
4.24.4-.2
21.6 -43.728.1 34.549.9 78.1
-9.1-25.9-23.7-2.216.8
81.0 90.174.1 73.46.9 16.77.0 -.6
38.6 -37.031.0 -27.37.6 -9.7
-24.972.797.6
-9.3-20.7-19.6-1.111.4
-27.5
44.872.3
-3.8-15.1-9.0-6.111.3
1. Annual changes are from Q4 to Q4.
13.83.7
-4.214.4
-19.1-1.517.5
-14.1-15.4-14.2-1.31.3
-11.711.022.8
2.8-3.3-1.4-1.86.1
-17.0-4.912.0
2.5-2.7-5.93.25.2

Strictly Confidential (FR)
Class II FOMC
Item
Real GDPGross domestic purchases
Final salesPrivate dom. final purch.
Personal cons. expend.DurablesNondurablesServices
Business fixed invest.Producers' dur. equip.Nonres. structures
Res. structures
Change in bus. invent.NonfarmFarm
Net exportsExportsImports
Government purchasesFederal
DefenseNondefense
State and local
NET CHANGES IN REAL GROSS DOMESTIC PRODUCT AND RELATED ITEMS1
(Billions of 1987 dollars) September 20, 1995
Projected
1996 1997 Projected
Ql Q2 Q3 Q4 | Ql Q2 Q3 Q4 1994 1995 1996 1997
30.1 33.5 31.2 29.8 30.4 29.3 28.2 27.9 28.837.4 33.9 35.7 31.0 37.5 22.9 27.6 27.7 34.4
45.6 38.2 28.8 29.9 23.7 37.1 29.0 27.7 22.349.9 41.9 37.3 34.1 32.9 32.0 30.0 27.8 28.1
29.123.4
32.028.2
29.1 19.8 20.3 19.7 19.4 18.9 19.1 17.4 17.5 17.611.7 5.3 4.9 5.3 5.1 5.2 7.0 5.2 5.2 5.32.7 5.5 3.4 3.4 3.7 3.4 3.2 3.5 3.5 3.5
14.9 9.1 12.0 11.0 10.6 10.3 8.9 8.8 8.8 8.8
18.5 15.1 12.3 11.9 12.0 12.1 11.1 10.7 10.8 10.813.2 11.9 10.5 10.2 10.4 10.5 10.2 10.4 10.5 10.7
5.3 3.2 1.8 1.6 1.6 1.6 .9 .3 .3 .12.4 7.0 4.6 2.5 1.5 .9 -.2 -.3 -.2 -.2
-15.6-13.8-1.9
-4.7 2.4 -.2 6.6-3.7 1.5 -1.6 6.4-1.0 .9 1.4 .2
-7.3 -.5 -4.5 -1.25.1 20.9 13.7 21.4
12.4 21.3 18.3 22.6
-7.8 -.8-7.9 -1.0
.1 .2
6.5 -2.96.5 -3.0
.0 .1
-7.1 6.5 .5 .2 -5.6 5.78.3 25.4 15.0 24.5 10.6 25.9
15.4 19.0 14.5 24.3 16.1 20.2
-3.9
-5.1-1.2-3.91.2
-. 3-2.7-2.2
-. 52.4
-. 2-2.6-2.1
-. 52.4
-2.0-4.4-2.1-2.3
2.4
215.8240.7
177.2211.4
123.4
44.033.945.5
115.0142.4
152.0183.2
120.7127.1
119.6136.2
114.0
113.1
111.0114.1
93.7 78.4 71.6
16.1 20.5 22.7
20.1 14.0 13.657.4 43.9 35.3
81.0 90.1 48.374.1 73.4 41.66.9 16.7 6.67.0 -.6 9.6
38.6 -37.0 1.131.0 -27.3 -1.57.6 -9.7 2.6
-24.972.797.6
-9.3-20.7-19.6-1.111.4
-27.544.872.3
-3.8-15.1
-9.0-6.111.3
43.541.81.7-.9
3.0
2.5.5
-6.4 .8
68.8 75.9
75.3 75.1
-10.2-18.4
-7.8-10.6
8.2
-4.0-13.4-8.6
-4.89.4
1. Annual changes are from Q4 to 04.

Strictly Confidential (FR)Class II FOMC
STAFF PROJECTIONS OF FEDERAL SECTOR ACCOUNTS AND RELATED ITEMS(Billions of dollars except as noted)
Item
UNIFIED BUDGET
Receipts1
Outlays1Surplus/deficit
1
On-budgetOff-budget
Surplus excludingdeposit insurance
2
Means of financingBorrowingCash decreaseOther
3
Cash operating balance,end of period
NIPA FEDERAL SECTOR
ReceiptsExpenditures
PurchasesDefenseNondefense
Other expendituresSurplus/deficit
FISCAL INDICATORS4
High-employment (HEB)surplus/deficit
Change in HEB, percentof potential GDP
Fiscal impetus (FI),percent, cal year
Fiscal year
1994a
1995 1996 1997_I ~I
13561517-162-22766
-179
168-3-3
13951571-176-23862
-183
203-21-5
14511624-173-230
57
-176
17300
36 39 60 60
13551529439296144
1090-174
14511595433284148
1163-144
15131651423284139
1228-138
-168 -157
1 - 2
-5 9 -11 3
1997
Ql Q2b Q3 Q4 Q1 2 Q3 Q4 IQ1 Q2 Q3 Q4
Not seasonally adjusted
307 404 338 323 291 429 353 338 310 438 365 346380 381 376 391 395 391 394 410 414 398 402 421-73 23 '-38 -68 -105 38 -41 -72 -104 40 -37 -76-85 -11 -44 -77 -111 -5 -45 -77 -110 0 -42 -8012 34 6 9 7 42 4 5 6 40 5 4
-79 18 -39 -71 -107 38 44 -71 -106 40 -39 -75
66 26 17 61 88 8 46 50 75 6 42 548 -42 22 9 15 -45 0 25 20 45 0 25-1 -6 -1 -1 2 -1 -4 -3 9 -1 -5 -3
18 61 39 30 15 60 60 35 15 60 60 35
Seasonally adjusted, annual rate
14411590
434284151
1155-149
14751603433285148
1170-128
149316504272841431223-157
153016514222841371229-121
15311659418283135
1242-129
15461687415281134
1271-141
-176 -151 -161 -178 -165 -139 -145 -155
- 1 - 4 1 -2 - 4
-1 7 -1 6 - 8 -1 5 -6 7 -2 5 6 -3 1
155517044162821341287-149
15651712415281134
1297-147
15971753
410279131
1343-155
-160 -155 -148 -159
1 -1 -1 1
-1 2 - 7 - 7 -2 9
1 OMB's July 1995 deficit estimates are $160 billion in FY95, $163 billion in FY96 and $179 billion in FY97 CBO's August 1995 deficitestimates are $161 billion in FY95, $189 billion in FY96 and $218 billion in FY97 Budget receipts, outlays, and surplus/deficit includecorresponding social security (OASDI) categories The OASDI surplus 1s excluded from the on-budget deficit and shown separately as off-budget,as classified under current law The Postal Service deficit is included in off-budget outlays beginning in FY90
2 OMB's July 1995 deficit estimates, excluding deposit insurance spending, are $177 billion in FY95, $170 billion in FY96 and $182 billionin FY97 CBO's August 1995 deficit estimates, excluding deposit insurance spending, are $177 billion in FY95, $197 billion in FY96 and $222billion in FY97
3 Other means of financing are checks issued less checks paid, accrued items, and changes in other financial assets and liabilities
4 HEB is the NTPA measure in current dollars, with cyclically sensitive receipts and outlays adjusted to the level of potential output generatedby 2 4 percent real growth and an associated unemployment rate of 6 percent Quarterly figures for change in HEB and FI are not at annual rateschange in HEB, as a percent of nominal potential GDP, is reversed in sign FI is the weighted difference of discretionary changes in federalspending and taxes (in 1987 dollars), scaled by real federal purchases For change in HEB and FI, negative values indicate restraint
a--Actualb--Preliminary
1 IL
September 20, 1995
DOMESTIC FINANCIAL DEVELOPMENTS
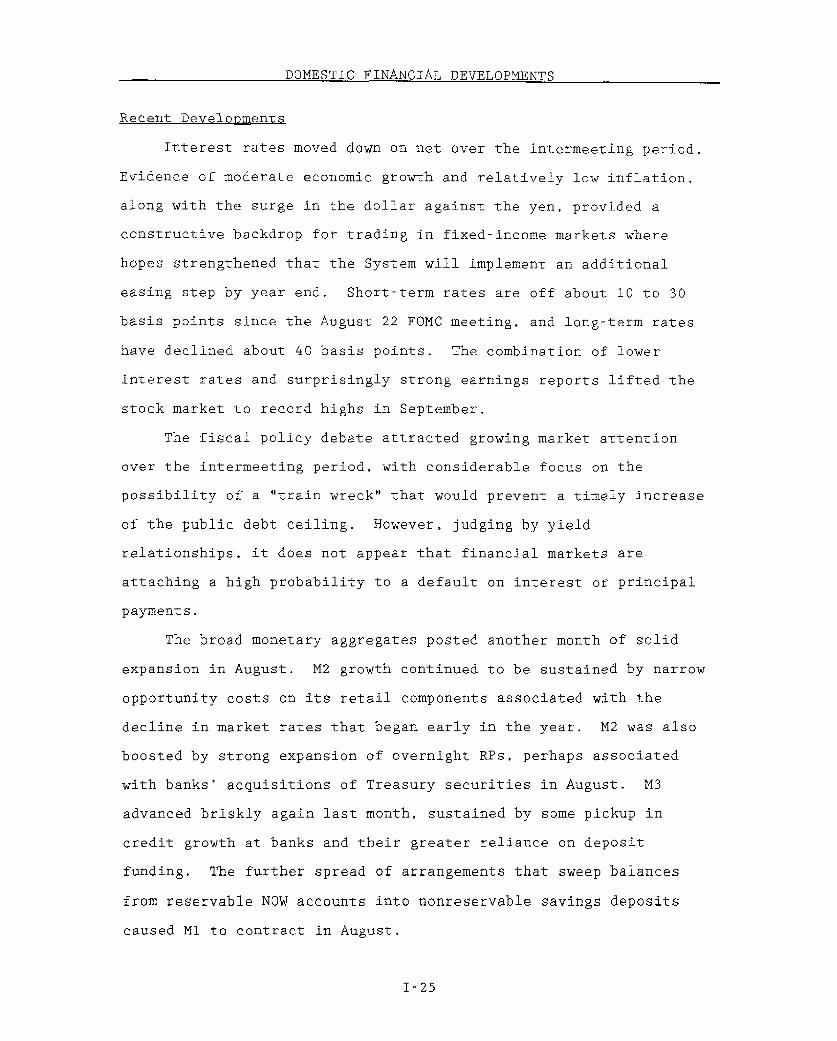
Recent Developments
Interest rates moved down on net over the intermeeting period.
Evidence of moderate economic growth and relatively low inflation,
along with the surge in the dollar against the yen, provided a
constructive backdrop for trading in fixed-income markets where
hopes strengthened that the System will implement an additional
easing step by year end. Short-term rates are off about 10 to 30
basis points since the August 22 FOMC meeting, and long-term rates
have declined about 40 basis points. The combination of lower
interest rates and surprisingly strong earnings reports lifted the
stock market to record highs in September.
The fiscal policy debate attracted growing market attention
over the intermeeting period, with considerable focus on the
possibility of a "train wreck" that would prevent a timely increase
of the public debt ceiling. However, judging by yield
relationships, it does not appear that financial markets are
attaching a high probability to a default on interest or principal
payments.
The broad monetary aggregates posted another month of solid
expansion in August. M2 growth continued to be sustained by narrow
opportunity costs on its retail components associated with the
decline in market rates that began early in the year. M2 was also
boosted by strong expansion of overnight RPs, perhaps associated
with banks' acquisitions of Treasury securities in August. M3
advanced briskly again last month, sustained by some pickup in
credit growth at banks and their greater reliance on deposit
funding. The further spread of arrangements that sweep balances
from reservable NOW accounts into nonreservable savings deposits
caused M1 to contract in August.
I-25

I-26
The pickup in bank credit growth last month occurred despite a
general slowing of lending. Business loans were especially weak,
consistent with reports from loan officers of flagging demand owing
to reduced needs to finance inventories and plant and equipment
expenditures, and also with reports that the proceeds of some
commercial paper issuance were used to pay down bank debt. Security
loans contracted for a second month, perhaps reflecting reduced
dealer financing needs associated with lackluster bond issuance.
Growth of real estate loans also slowed. Consumer loan growth
picked up in August, but adjusted for securitizations this component
of bank credit, too, moderated last month.
For the household sector more broadly, available evidence
indicates some revival in mortgage borrowing, but a slowing in the
rapid pace of consumer credit growth. Data for the second quarter
suggest that financial stresses in this sector have risen a bit, as
indicated by increases in delinquency rates on consumer auto and
revolving credit loans as well as in personal bankruptcies.
Available evidence suggests that borrowing by nonfinancial
firms was subdued in August. Although commercial paper issuance was
strong, this partly reflected funds raised to pay down bank debt, as
noted above. Bond issuance had slackened following the backup of
rates in July, but the recent decline in rates triggered some upturn
in investment-grade issuance in the first half of September. Risk
spreads for junk bonds have widened since the August FOMC meeting--
reflecting both the expectation of heavy issuance and some recent
defaults--but are narrow by historical standards. Gross equity
issuance also remained moderate in August, despite the surge in
share prices. Although many merger transactions are being

I-27
structured as share exchanges, the volume of cash transactions
along with hefty share repurchases programs--continues to hold net
equity issuance in negative territory.
In the state and local sector, a revival of sorts took place in
refunding offerings last month, boosting gross issuance of tax-
exempt bonds. Even so, the stock of outstanding state and local
debt continued to contract, and has fallen more than 4 percent since
the end of last year, owing to the retirement of a large volume of
debt pre-refunded in the early 1990s. Although the municipal market
shared in the bond market rally, the ratio of tax-exempt to taxable
yields remains high, particularly for longer-dated issues, largely
reflecting fears that tax reform will limit, or eliminate, the tax
advantage of municipal debt. Municipal rates have also been held up
to an extent by the lingering effects of the Orange County
bankruptcy and the fiscal problems of Los Angeles and the District
of Columbia, even though rating changes on municipal debt have been
positive on balance over the first half of the year.
With the Treasury drawing down its cash balances to finance
much of this quarter's federal deficit, growth of federal debt is
projected to slow to a seasonally adjusted annual rate of only 1
percent. The mid-August refunding operation included a thirty-year
issue, and its overall size, including the three and ten-year
notes, was raised. The emphasis on coupon financing led to the
redemption of nearly $9 billion of Treasury bills.
Outlook
The interest rate path underlying the staff forecast does not
involve much change in either short- or long-term rates over the
next year or so. This would imply the persistence of a relatively
flat yield curve after allowance for normal liquidity premia. Our
thinking is that, though anticipations of further Fed easing would

I-28
be disappointed in the near term, the markets would remain
optimistic about the prospects for short-term rates. Enactment of a
fiscal package along the lines assumed by the staff would be at
least as good as the financial markets seem to be anticipating, and
the outlook for inflationary pressures would be seen as relatively
benign.
The projection for M2 for the balance of this year has been
strengthened a bit on the basis of recent declines in opportunity
costs and flattening of the yield curve. The projection for M3 also
has been raised, in part reflecting the additional strength of M2,
and in recognition of the recent increased reliance on deposit
funding by banks. M2 is now expected to grow 5 percent this year
and M3 should expand 6-3/4 percent--the latter somewhat exceeding
the FOMC's announced target range. Looking to 1996, M2 is expected
to accelerate somewhat, reflecting lagged effects of the flatter
yield curve as well as lower deposit insurance premia. M3 growth,
however, is expected to slow, as expansion of bank credit moderates.
Growth of domestic nonfinancial debt is expected to edge down
to 4-3/4 percent next year from a projected 5-1/4 percent in 1995.
Federal debt expands somewhat faster next year owing to a rising
budget deficit, but this is more than offset by a slowing of
nonfederal debt, reflecting less credit expansion in both the
business and household sectors.
In the business sector, the financing gap is expected to narrow
next year as cash flow rises more than capital expenditures. This,
coupled with a reduced pace of net equity retirements, suggests that
corporate borrowing in 1996 will be a bit below this year's pace.
With long rates expected to retain their current lower levels, firms
with access to bond markets are anticipated to concentrate their
borrowings in this sector of the market, resulting in a considerable

I-29
shift from this year when banks and commercial paper supplied more
financing than bond markets. With interest coverage levels of
nonfinancial firms remaining generally comfortable, the capital
markets should remain receptive to offerings, and quality spreads on
corporate bonds should remain narrow. Given their ample liquidity
and strong profit and capital positions, banks should continue to be
willing lenders to businesses. Indeed, declining opportunities to
lend, implicit in the projected shift to bond markets, could further
intensify competitive pressures in the bank loan market, the
principal factor banks have cited for the steady easing of credit
terms they have been reporting for some time. A further easing of
credit terms will be limited, however, by banks' recognition, and
regulators' reminders, that they already have moved to a fairly
aggressive lending stance.
Although our forecast of household borrowing is driven mainly
by demand rather than supply factors, the availability of credit to
the household sector may well tighten a little over the forecast
period in response to recent increases in the level of loan
delinquencies and charge-offs. Indeed, the slower growth of
household debt forecast for next year still exceeds the rise in
disposable income, leading to a further increase in debt burden and,
likely, a further deterioration in repayment performance. The
reduction in household debt growth is expected to be concentrated in
consumer credit, with mortgage growth projected to edge up to
finance a rising level of housing activity fostered by attractive
mortgage rates.
In the state and local sector, debt is projected to continue
contracting, as pre-refunded bonds are called or mature and budgets
remain under austerity pressures.

Confidential FR Class IISeptember 20, 1995
CHANGE IN DEBT OF THE DOMESTIC NONFINANCIAL SECTORS 1
(Percent)
---------------------Nonfederal---------------------
----- Households------ ------- MEMO--------State and Private
Federal Home Cons. local financial NominalTotal govt. Total Total mtg. credit Business govt. assets GDP
Year
1983 11.9 18.9 10.1 11.8 10.8 12.6 8.7 9.7 12.5 11.01984 14.6 16.9 13.9 13.0 11.7 18.7 15.6 9.1 12.8 9.11985 15.5 16.5 15.2 15.3 13.2 15.8 12.1 31.6 12.4 7.01986 12.3 13.6 11.9 12.0 14.3 9.6 12.2 9.8 7.3 4.71987 9.4 8.0 9.8 11.4 14.9 5.0 7.9 12.1 8.1 8.0
1988 8.9 8.0 9.2 10.5 12.7 7.2 8.7 6.0 8.6 7.71989 7.8 7.0 8.1 9.2 10.8 6.2 6.9 9.3 5.8 6.01990 6.3 11.0 5.0 6.5 7.9 2.0 3.4 5.7 4.7 4.71991 4.5 11.1 2.4 4.7 6.5 -1.8 -0.9 7.4 -1.0 3.51992 4.8 10.9 2.8 5.7 6.7 0.9 0.0 2.4 0.7 6.4
1993 5.3 8.3 4.2 7.0 6.4 7.3 0.5 6.8 -0.1 5.01994 4.9 4.7 4.9 8.2 6.4 14.0 3.7 -4.4 4.9 6.51995 5.2 4.8 5.3 6.8 5.7 11.8 6.5 -7.2 2.1 4.41996 4.8 5.2 4.6 6.0 5.9 7.6 4.9 -5.2 1.0 4.41997 4.5 4.6 4.5 5.8 6.0 5.9 4.5 -3.9 1.0 3.9
Quarter (seasonally adjusted annual rates)
1994:1 5.3 6.3 4.9 7.2 6.4 8.0 3.6 -0.3 6.1 6.12 4.2 3.6 4.4 7.1 5.2 13.9 3.8 -4.7 4.8 7.23 4.8 3.9 5.1 8.8 7.0 14.4 3.5 -5.4 2.4 6.24 4.9 4.5 5.0 9.0 6.2 17.1 3.5 -7.5 5.9 6.4
1995:1 6.5 7.8 6.0 7.0 6.4 10.2 7.8 -5.9 2.6 4.72 6.2 5.4 6.5 6.9 4.6 14.6 8.3 -2.9 4.2 2.83 3.2 1.4 3.9 6.5 5.7 10.5 4.4 -11.6 0.7 5.14 4.3 4.4 4.3 6.3 5.8 10.0 4.9 -9.2 1.0 5.1
1996:1 6.3 10.0 4.9 6.2 5.8 8.8 5.7 -6.7 1.0 5.12 4.3 3.3 4.6 6.1 5.8 7.7 4.6 -3.4 1.0 4.33 4.3 4.3 4.3 5.7 5.8 6.7 4.4 -5.3 1.0 4.14 3.9 3.0 4.2 5.6 5.8 6.2 4.4 -5.8 1.0 4.1
1. Data after 1995:q2 are staff projections. Changes are measured from end of the preceding period toend of period indicated except annual nominal GDP growth, which is Q4 to Q4. On a quarterly averagebasis, total debt grows 5.2 percent in 1995, 4.7 percent in 1996, and 4.6 percent in 1997. Federaldebt rises 4.6 percent in 1995, 5.1 percent in 1996, and 4.9 percent in 1997. Nonfederal debt isprojected to increase 5.4 percent in 1995, 4.5 percent in 1996, and 4.5 percent in 1997.
2.6.3 FOF

Confidential FR Class IISeptember 20, 1995
FLOW OF FUNDS PROJECTIONS: HIGHLIGHTS 1
(Billions of dollars)
Calendar year ----------- 1995------------ ---- 1996---- ---- 1997----1994 1995 1996 1997 Q1 Q2 Q3 Q4 HI H2 HI H2
------------ Seasonally Adjusted Annual Rates------------Net funds raised by domestic
nonfinancial sectors1 Total 557.5 601.7 589.4 624.9 774.0 746.4 359.6 526.6 651.3 527.6 656.4 593.32 Net equity issuance -44.9 -67.4 -58.5 -20.0 -68.4 -73.2 -72.0 -56.0 -72.0 -45.0 -24.0 -16.03 Net debt issuance 602.4 669.1 647.9 644.9 842.4 819.6 431.6 582.6 723.3 572.6 680.4 609.3
Borrowing sectorsNonfinancial business
4 Financing gap 2 48.5 101.2 82.6 94.8 124.8 86.2 108.2 85.6 81.1 84.2 89.1 100.45 Net equity issuance -44.9 -67.4 -58.5 -20.0 -68.4 -73.2 -72.0 -56.0 -72.0 -45.0 -24.0 -16.06 Credit market borrowing 137.1 252.0 201.9 193.9 302.4 328.8 176.6 200.2 214.5 189.4 191.8 196.0
Households7 Net borrowing, of which: 353.5 316.7 299.6 307.4 324.4 324.7 311.2 306.4 307.6 291.7 307.4 307.48 Home mortgages 189.1 180.7 197.7 213.5 200.9 146.9 185.0 190.0 195.0 200.5 211.0 216.09 Consumer credit 121.2 116.3 83.5 70.0 100.3 147.9 109.7 107.2 92.2 74.7 70.0 70.0
10 Debt/DPI (percent)3 90.0 91.4 92.7 93.9 90.3 91.6 91.8 91.9 92.4 93.1 93.5 94.3
State and local governments11 Net borrowing -44.0 -68.5 -45.7 -33.0 -56.2 -27.5 -107.6 -82.8 -44.2 -47.2 -33.0 -33.012 Current surplus4 -46.8 -72.3 -52.5 -41.2 -111.6 -65.8 -57.4 -54.3 -55.2 -49.8 -44.1 -38.4
U.S.government13 Net borrowing 155.9 168.9 192.1 176.6 271.8 193.6 51.4 158.9 245.5 138.7 214.3 138.914 Net borrowing;quarterly, nsa 155.9 168.9 192.1 176.6 65.6 25.6 17.1 60.6 96.6 95.5 81.0 95.615 Unified deficit;quarterly, nsa 184.5 154.7 180.0 176.4 71.3 -23.0 38.0 68.3 67.1 112.9 63.8 112.6
Funds supplied by16 depository institutions 196.9 257.6 213.7 202.2 388.9 298.2 170.6 172.5 213.7 213.7 203.7 200.7
MEMO: (percent of GDP)17 Dom. nonfinancial debt 3 188.0 188.0 188.6 189.8 187.4 189.1 189.0 188.4 188.6 189.2 189.6 190.218 Dom. nonfinancial borrowing 8.9 9.5 8.8 8.4 12.1 11.7 6.1 8.1 9.9 7.7 8.9 7.819 U.S. government5 2.3 2.4 2.6 2.3 3.9 2.8 0.7 2.2 3.3 1.9 2.8 1.820 Private 6.6 7.1 6.2 6.1 8.2 8.9 5.3 5.9 6.5 5.8 6.1 6.1
1. Data after 1995:q2 are staff projections.2. For corporations: Excess of capital expenditures over U.S. internal funds.3. Average debt levels in the period (computed as the average of period-end debt positions) divided by nominal GDP.4. NIPA surplus, net of retirement funds.5. Excludes government-insured mortgage pool securities.
2.6.4 FOF

INTERNATIONAL DEVELOPMENTS
Recent Developments
The foreign exchange value of the dollar in terms of the other G-10
currencies is about unchanged on balance since the August FOMC meeting.
The dollar appreciated significantly further against the yen and
declined slightly against most European currencies. On balance, the
yen/dollar rate has risen 6 3/4 percent over the intermeeting period and
nearly 30 percent since its low on April 19, bringing it above its level
at the start of the year. Although much of the total rise in the
yen/dollar rate remains difficult to explain, as was the weakness of the
dollar earlier this year, the upward movement of the dollar over the
intermeeting period was supported by sizable dollar purchases by the
Bank of Japan, by the reduction, on September 8, of the Bank of Japan's
discount rate to 1/2 percent, by statements by Japanese and U.S.
officials that they would welcome a weaker yen, and by data showing a
lower Japanese current account surplus.
The dollar declined 1 percent in terms of the mark over the period.
The dollar fell, on balance, despite the cut on August 24 by the
Bundesbank of its official lending rates, which was quickly followed by
similar moves by several other European central banks, and the continued
declines of the Bundesbank repo rate. Although the dollar fell against
the Canadian dollar early in the intermeeting period, it has
strengthened more recently and is currently about unchanged from the
rate at the time of the August FOMC. Concerns about the referendum on
Quebec sovereignty scheduled for October 30 have led to downward
pressure on the Canadian dollar.
Short-term market interest rates have fallen since the August
FOMC meeting in most foreign industrial countries but have risen, on
balance, in Canada in response to the downward pressure on the currency.
Japanese rates are down about 35 basis points, reflecting the steps by
the Bank of Japan to move the call money rate below the reduced discount
I-32

I-33
rate. Short-term market rates in the continental European G-10
countries are 5 to 35 basis points lower than they were at the time of the
August meeting. Long-term market interest rates are also generally
lower. The Japanese ten-year rate has declined 55 basis points over the
intermeeting period while the U.S. ten-year Treasury bond rate has moved
down 40 basis points. The German long-term rate is down 25 basis points.
The Desk did not intervene.
Indicators of real economic activity in the third quarter suggest
that expansion is continuing in most of the major foreign industrial
countries, but the rate of growth remains near the subdued pace of the
first half of the year. In Japan, data for the current quarter suggest
some weakness despite the 3. 1 percent growth at an annual rate of GDP
just reported for the second quarter. Industrial production fell again
in July after remaining flat on average in the second quarter. New car
registrations were also down in July. Labor market indicators suggest
some further deterioration through July. The Bank of Japan's August
Tankan survey showed a decline in business sentiment since the previous
survey in May. However, this survey may not fully reflect the yen's
recent weakness. Japanese officials have just announced a supplementary
budget that totals Y14 trillion, about 3 percent of GDP, only half of
which is estimated to be additional real expenditures.
In Germany, industrial production rose strongly in July after
little change in the previous two months, and orders rebounded as well.
However, the unemployment rate remained little-changed from the
beginning of the year through August. Recently released data on real GDP
for the first half of the year show growth at an annual rate of 2-1/2
percent, with the second quarter stronger than the first. In the United
Kingdom, output growth may be slowing somewhat from the second-quarter

I-34
pace. In July, industrial production showed little gain from its second-
quarter average, and manufacturing output fell slightly. Retail sales
fell sharply in August, leaving the average for July and August only a
bit above the second-quarter rate. Nevertheless, the unemployment rate
fell in August and is now somewhat below its level early in the year.
Indicators suggest that economic activity in Canada is expanding slowly
in the current quarter after weakness in the automotive sector
contributed to a decline in the second quarter. Through August,
employment remains about unchanged from the second-quarter level.
Housing starts rose in August but not enough to offset their decline in
July. However, new manufacturing orders picked up in July for the first
time in six months.
Consumer price inflation remains low in the major foreign
industrial countries, with the exception of Italy. In Japan, consumer
prices in August were below their year-earlier level, as were wholesale
prices. A redefined index for western Germany shows inflation at only
1.5 percent over the twelve-month period ending in August. Inflation has
edged down some in Canada over the past several months; it has moved up
slightly in the United Kingdom, but remains below 3 percent for retail
prices excluding mortgage interest. In contrast, consumer price
inflation in Italy rose to 5.8 percent in August, significantly above its
pace at the start of the year.
The U.S. nominal trade balance in goods and services in July was
slightly above its second-quarter average. Exports and imports both
declined. In the second quarter, the trade deficit was substantially
larger than in the first quarter. Exports of goods and services were 2.5
percent above their first-quarter pace, with the sharpest increases
recorded for capital goods and industrial supplies. Imports of goods and
services rose somewhat more (4 percent) from the first quarter.
Increases occurred in most major trade categories, especially oil,
capital goods, and automotive products from Europe and Japan.

I-35
The current account deficit widened $18.4 billion, at a seasonally
adjusted annual rate, from the revised first-quarter level. Most of the
change is accounted for by the larger trade deficit and weaker net
investment income, largely a result of growing U.S. net indebtedness.
Prices of non-oil imports rose in July, after pausing in June, with
higher prices for industrial supplies accounting for much of the
increase. Prices of exports moved up a bit in July, largely driven by
higher prices for agricultural exports. In the second quarter, non-oil
import prices rose at an annual rate of about 5-3/4 percent, about the
pace experienced in the second half of last year, and export prices rose
about 7 percent, annual rate, with upward pressure coming primarily from
prices for agricultural products and industrial supplies. The price of
imported oil fell sharply in July. Most recently, spot oil prices have
resumed rising in response to lean U.S. inventories, tensions with Iraq,
and concerns about the effect of recent hurricanes on production from
Carribean refineries. Currently, spot WTI is trading around $18.96 per
barrel.
Outlook
Total foreign real output (weighted by U.S. nonagricultural export
shares) is projected to rise at an annual rate of 2-3/4 percent during
the second half of 1995, considerably stronger than the 1 percent growth
rate experienced in the first half of the year, when growth was depressed
by the sharp contraction in Mexican activity. Output is projected to
grow at about an average annual rate of 3-1/2 percent over the remainder
of the forecast period, a bit higher than the rate projected in the
previous Greenbook. The dollar is expected to remain near recent levels.
Real net exports are projected to deteriorate somewhat over the ten
quarters of the forecast period, making a marginal negative contribution
to real GDP in 1996 after subtracting about 1/4 percentage point from GDP
growth during the second half of 1995. This forecast is slightly weaker
than that in the previous Greenbook, largely as a result of stronger

I-36
imports that in turn reflect the higher path of the dollar and reduced
import price inflation.
The dollar. We project that the foreign exchange value of the
dollar in terms of the other G-10 currencies will remain little changed
from its recent levels throughout the forecast period. This is slightly
higher than the level forecast in the previous Greenbook, an adjustment
that in large part reflects the sustained strength of the dollar against
the yen. We expect that the CPI-adjusted value of the dollar in terms of
the currencies of key developing countries will depreciate a bit over the
remainder of this year, then decline at a moderate pace next year and
during 1997. In particular, the peso is expected to appreciate in real
terms over the forecast period, as the peso's nominal exchange value
against the dollar depreciates at a slower pace than the extent to which
Mexican inflation exceeds U.S. inflation.
Foreign G-7 countries. Real GDP growth in the foreign G-7
countries (weighted by U.S. export shares) is projected to average 1-3/4
percent at an annual rate during the second half of this year, somewhat
stronger than the growth experienced during the first half. The improved
growth projected for this quarter and next is largely accounted for by
expected recovery in Canada. Average output growth in the G-7 countries
is expected to improve to about 2-1/2 percent next year and to remain at
about that pace through the end of 1997, as strengthening in the pace of
economic activity occurs in most of the G-7 countries. Only weak
expansion of real output is projected for Japan during the second half of
1995, with growth firming over the forecast period to about 2-1/2 percent
in 1996 and 1997. This forecast is somewhat stronger than that in the
previous Greeenbook. The lagged effects of monetary easing already in
place and the recently announced fiscal stimulus measures are expected
to contribute to recovery while the reversal since April of the yen
appreciation that occurred earlier this year should limit the negative
contribution from the external sector.

I-37
German real GDP growth is projected to average an annual rate of
2-1/2 percent during the second half of 1995 and to reach 2-3/4 percent
over the remainder of the forecast period. This pace would imply some
strengthening in 1996-97 average growth, as investment is expected to
rebound and consumption to pick up next year in reponse to lower taxes.
Real GDP in Canada is projected to resume growing during the current
quarter and to expand at an average annual rate of 2 percent during the
second half of the year. Growth is projected to rise further to 2-1/2
percent over the rest of the forecast period as domestic demand
strengthens.
Average consumer price inflation in the G-7 countries (weighted by
U.S. non-oil import shares) is projected to remain low in the near term
as prices decelerate further in Canada and deflation continues in Japan.
In 1996, inflation is projected to average about 1 percent and slightly
higher in 1997.
This forecast incorporates the assumption that, on average,
foreign short-term market interest rates will remain little changed
through the end of this year and then will rise about 100 basis points
over the remainder of the forecast period. In general, the rising rates
reflect the continuing real output growth in these economies. An
exception is Canada, where exchange rate pressures have led to higher
rates currently that are expected to decline over the forecast period.
Long-term market rates, on average, are expected to rise slightly over
the forecast period, except in Japan where long-term rates are flat.
Other countries. The real GDP growth rate of major developing
country trading partners of the United States (weighted by U.S.
nonagricultural export shares) is projected to increase from about 2-1/2
percent during 1995 (on a Q4/Q4 basis) to around 5 percent during
1996-97. The pickup in growth in 1996-97 largely reflects an anticipated
recovery in Mexico.

I-38
We now project that real GDP in Mexico will fall about 9-1/2 percent
during 1995, compared with the 6 percent decline projected in the last
Greenbook. The downward revision to our growth forecast reflects data
for the second quarter that indicate a considerably sharper-than-
expected contraction in domestic demand. Although Mexico's growth
outlook remains highly uncertain, several factors are expected to allow
Mexico to achieve positive output growth by early next year, including a
loosening of fiscal policy, some relaxation of tight credit conditions,
and a gradual revival of household spending as the effects of balance
sheet adjustments wear off and as declining interest rates ease debt
burdens. We project that Mexico's real GDP will recover to its pre-
crisis level by mid-1997. We have also revised downward our forecast for
real GDP growth in Brazil during 1995 to reflect second-quarter data that
suggest that Brazil 's tight monetary policy stance has slowed domestic
demand by more than previously expected.
In Asia, our major developing country trading partners are
expected to continue to grow at a robust rate in 1995-97. Average growth
is expected to decline from a projected rate of 7 percent during 1995 to a
rate of around 6-1/2 percent during 1996-97. The projected moderation in
the aggregate growth rate during 1996-97 reflects the reversal of
certain temporary factors that allowed for especially rapid growth
during the first half of 1995, including yen appreciation against the
Asian currencies during the early part of this year and accommodative
monetary policy in some countries.
U.S.real net exports. The deficit on real net exports of goods and
services is projected to widen somewhat over the forecast period. With
real output growth abroad stronger than that in the United States, real
export growth is expected to remain vigorous, at an annual rate of 7-1/2
percent during the second half of this year and about 9-1/4 percent
during 1996 and 1997. However, with the dollar expected to remain near
recent levels, import growth is also projected to edge up from an annual

I-39
rate of 8 percent during the second half of this year to 8-1/2 percent in
1996 before slowing a bit in 1997. As a consequence, given the larger
base of the current level of imports, real net exports will deteriorate
some in the second half of this year and weaken slightly further in 1996.
Notwithstanding that the dollar moved down this year through April and
remained fairly weak through July, previous staff forecasts did not
extrapolate the full extent of that dollar weakness into the forecast
path. As a consequence, the current forecast for the dollar (to remain
at recent levels) is only 2-1/2 percent higher than the forecast in the
Greenbooks since March. This upward revision to the dollar results in
projected real net exports that are about $10 billion (1987 prices)
weaker by the end of 1996, all else the same.
QUANTITIES OF GOODS AND SERVICES(Percent change from end of previous period, SAAR)
------------ Projection-----------
199Z5 1996 1997H2 Q3 Q4
Exports of G&S 5.5 2.9 12.1 9.3 9.4
Services -2.3 3.2 3.2 4.8 5.0Computers 26.6 29.6 30.0 31.0 31.0Other goods' 6.0 -4.5 12.7 4.9 3.4
Imports of G&S 9.8 6.0 10.4 8.6 7.9
Services 6.0 0.3 4.9 3.2 2.7Oil -2.8 15.2 5.2 2.2 4.4Computers 21.5 28.5 28.5 22.4 21.5Other goods' 9.2 0.8 7.3 6.3 4.7
Note. NIPA basis, 1987 dollars.1. Nonagricultural exports of goods excluding computers.2. Non-oil imports of goods excluding computers.
Real nonagricultural exports of goods other than computers are
projected to increase at an annual rate of 4 percent during the final two
quarters of this year. Growth of these exports is expected to strengthen
somewhat, to 5 percent, in 1996 as foreign output growth recovers and
then to slow somewhat in 1997 as the lagged effects of the stronger
dollar are felt. Continued strong growth of the quantity of computer

I-40
exports helps to boost total export growth throughout the forecast
period.
Real non-oil imports of goods other than computers are projected to
grow at an annual rate of 4 percent for the second half of this year,
reflecting the slowdown in U.S. GDP growth in the middle of this year.
Imports of these goods will accelerate to 6-1/4 percent next year because
while U.S. growth remains moderate, import prices rise more slowly than
domestic prices, stimulating import demand. Growth of computer imports
remains strong but slows a bit in 1996-97. We expect the quantity of oil
imports to rise this quarter on seasonally higher consumption and
inventory accumulation; imports should remain strong in the fourth
quarter as consumption continues to rise seasonally against a backdrop
of lean inventories. During the remainder of the forecast period,
imports are projected to increase as consumption rises and U.S.
production declines.
Oil prices. The projected price of imported oil for the third
quarter has been revised up about $0.50 per barrel to average $16.12 per
barrel in line with recent increases in spot prices. However, this price
is still below the second-quarter average by about $1.30 per barrel
because of an expected uptick in world oil production. The price of
imported oil is expected to remain around $16.00 per barrel in the fourth
quarter. Spot oil prices are projected to rise after year end, given the
staff's view that Iraq will not return to the world oil export market
during 1996. Longer-term WTI and the oil import unit value are projected
to be $19.50 per barrel and $17.00 per barrel respectively.
Prices of non-oil imports and exports. Non-oil import prices are
projected to decline, on average, over the final two quarters of 1995,
reflecting the recent rise in the dollar and the projected decrease in
global non-oil commodity prices. These prices are expected to increase
only very slightly during 1996, as inflation abroad remains very low,
commodity prices change little, and the dollar is stable, and then to

I-41
rise 1-1/2 percent during 1997 as commodity prices begin to increase.
Prices of nonagricultural exports excluding computers, which rose
sharply during the first half of the year, are projected to increase at
an annual rate of 3-1/2 percent during the second half of 1995 and then to
decelerate somewhat further over the remainder of the forecast period.
These prices tend to move with comparable U.S. producer prices.
SELECTED PRICE INDICATORS(Percent change from end of previous period except as noted, AR)
----------- Projection--------
1995 1996 1997H1 Q3 Q4
U.S. PPI1 5.7 1.2 3.4 2.3 1.8Nonag.exports 2 8.0 3.5 3.4 2.4 1.8Non-oil imports 2 4.4 0.4 -2.7 0.5 1.6Oil imports(Q4 level, $bl.) 17.55 16.12 16.01 17.00 17.00
1. Selected categories (excluding computers) weighted by U.S. exports.2. Excluding computers.
Nominal trade and current account balances. The nominal U.S. trade
deficit on goods and services reached a peak in the second quarter of
about $135 billion (annual rate) and is projected to decline on balance
through the end of 1996 and to remain about unchanged in 1997. U.S.
investment income is projected to fluctuate narrowly during the
remainder of this year and to deteriorate somewhat in 1996 and 1997. The
current account deficit is expected to remain about unchanged at 2-1/4
percent of GDP over the forecast period.

STRICTLY CONFIDENTIAL - FRCLASSS II FOMC
September 20, 1995
REAL GDP AND CONSUMER PRICES, SELECTED COUNTRIES, 1993-96(Percent; quarterly change at an annual rate except as noted)
Projected
Projected 1995 1996
Measure and country 1994 1995 1996 1997 Q2 Q3 Q4 Q1 Q2 Q3 Q4
REAL GDP
Canada 5.4 1.0 2.4 2.5 -1.0 1.4 2.6 2.3 2.4 2.4 2.4France 4.1 1.8 2.8 2.9 1.4 1.2 2.0 2.6 2.8 2.9 2.9Germany 3.7 2.6 2.9 2.7 4.3 2.4 2.9 3.1 2.9 2.7 2.7
W. Germany 3.1 2.2 2.4 2.1 3.8 2.0 2.3 2.4 2.3 2.3 2.4Italy 2.9 4.0 3.0 2.4 2.6 3.8 3.8 3.5 3.0 2.8 2.6Japan 0.8 1.1 2.5 2.2 3.1 -0.3 1.6 1.8 2.5 3.3 2.4United Kingdom 4.0 2.1 2.5 2.3 1.9 1.4 2.2 2.5 2.5 2.5 2.5
Average, weighted by 1987-89 GDP 2.9 2.0 2.7 2.5 2.4 1.3 2.3 2.5 2.7 2.9 2.6
Average, weighted by share ofU.S. nonagricultural exports
Total foreign 4.4 1.9 3.4 3.4 NA NA NA NA NA NA NAForeign G-7 3.9 1.4 2.5 2.5 1.0 1.2 2.4 2.4 2.5 2.7 2.5Developing countries 5.7 2.2 5.2 5.3 NA NA NA NA NA NA NA
CONSUMER PRICES(1)
Canada 0.0 2.5 2.0 2.5 3.1 1.2 1.6 1.8 2.0 2.0 2.0France 1.6 2.8 1.7 1.9 2.1 4.0 2.8 1.6 1.6 1.6 1.8Western Germany 2.5 1.8 2.1 2.3 2.2 1.8 0.4 3.9 2.5 1.8 0.3Italy 3.8 6.0 5.0 4.5 8.0 4.2 5.5 6.1 6.6 2.6 4.7Japan 0.8 -0.5 -0.9 -0.5 0.7 -0.0 -0.1 -0.4 -0.8 -1.0 -1.4United Kingdom 2.6 3.3 3.8 3.6 7.5 0.7 1.6 4.0 7.6 1.0 2.5
Average, weighted by 1987-89 GDP 1.8 2.0 1.7 1.8 3.3 1.6 1.5 2.3 2.5 0.8 1.0
Average, weighted by share ofU.S. non-oil imports 1.0 1.5 1.1 1.4 2.5 1.0 1.0 1.5 1.5 0.7 0.6
Note. Annual values are measured from Q4 to Q4.1. Not seasonally adjusted.

Strictly Confidential (FR) Class II-FOMC
U.S. INTERNATIONAL TRANSACTIONS IN GOODS, SERVICES, AND THE CURRENT ACCOUNT
(Billions of dollars, seasonally adjusted annual
NIPA Real Net Exportsof Goods & Services (87$)
Exports of G&SGoods
AgriculturalComputersOther Goods
Services
Imports of G&SGoods
OilComputersOther Goods
Services
Memo:(Percent change 1/)Exports of G&SAgriculturalComputersOther GoodsServices
Imports of G&SOilComputersOther GoodsServices
Current Account Balance
Goods & Serv (BOP), netGoods (BOP), netServices (BOP), net
Investment Income, netDirect, netPortfolio, net
1993
Q1 Q2 Q3 Q4
1994
Q1 Q2 Q3 Q4
-57.6 -69.3 -86.3 -82.2 -104.0 -111.8 -117.0 -107.1
589.2433.939.160.9333.9155.3
646.8546.653.473.3
419.9100.1
-1.0-19.7
5.4-6.816.1
11.64.6
31.911.14.5
600.2443.339.362.9
341.1156.9
669.6567.457.780.0
429.7102.2
7.72.1
13.88.94.2
14.936.341.99.78.7
595.3438.536.968.5
333.1156.7
681.6577.1
56.787.8
432.6104.5
-3.2-22.340.7-9.1-0.5
7.4-6.845.12.79.3
625.2468.239.174.0355.1157.1
707.4599.958.194.6
447.2107.6
21.726.136.229.21.0
16.010.234.814.212.4
-69.5 -97.4 -108.1 -124.7
-54.3 -75.2 -88.0 -82.0-115.8 -134.4 -146.4 -133.9
61.5 59.2 58.5 51.9
14.8 8.361.1 55.3-46.2 -47.0
12.859.2
-46.5
0.149.7-49.6
619.6464.436.676.9
350.9155.2
723.6615.256.599.7
458.9108.5
-3.5-23.216.6-4.6-4.8
9.5-10.623.410.93.4
643.9484.637.579.3
367.8159.2
755.6648.360.3
106.9481.0107.4
16.610.213.120.710.7
18.929.732.220.7-4.0
666.5505.140.785.9
378.5161.3
783.5674.664.3
115.4494.9108.9
14.838.837.712.25.4
15.629.335.812.15.7
697.9533.545.995.8
391.8164.3
805.0695.957.1
128.9510.0109.1
20.261.854.714.87.6
11.4-37.855.712.80.7
-121.1 -151.9 -158.9 -173.1
-92.1 -107.7 -115.2 -109.9-146.0 -166.0 -178.5 -174.0
53.9 58.3 63.3 64.1
0.546.2
-45.7
-9.143.9-53.0
-10.144.6-54.7
-18.345.7
-64.0
rates)
1995
Q1 Q2
-118.5 -126.8
706.2543.245.9
102.0395.3163.0
824.6711.5
55.4133.0523.1113 . 2
4.80.0
28.53.6-3.1
10.1-11.413.310.715.9
716.8554.543.3
107.8403.4162.4
843.6731.456.3
142.1533.0112.3
6.1-20.824.88.5
-1.5
9.56.7
30.37.8
-3.1
-156.1 -174.5
-117.8 -133.5-180.2 -196.2
62.4 62.7
-7.857.2
-65.1
-11.559.6
-71.1
ANNUAL
1992 1993 1994
-32.3 -73.9 -110.0
578.8426.539.853.9332.8152.3
611.1512.851.260.5
401.298.3
5.09.5
34.83.8
-2.0
8.612.148.75.21.4
602.5446.038.666.6
340.8156.5
676.3572.8
56.583.9
432.4103.6
5.8-5.323.14.55.0
12.410.038.39.38.7
657.0496.940.284.5372.2160.0
766.9658.5
59.6112.7486.2108.5
11.617.429.510.34.6
13.8-1.736.314.01.4
-61.5 -99.9 -151.2
-39.5 -74.8 -106.2-96.1 -132.6 -166.156.6 57.8 59.9
10.151.6
-41.5
9.056.3
-47.3
-9.345.1
-54.4
Unilateral Transfers, net -30.1 -30.4 -32.9 -42.9 -29.5 -35.1 -33.5 -45.0 -30.5 -29.5 -32.1 -34.1 -35.8
1/ Percent change (AR) from previous period; percent changes for annual data are calculated Q4/Q4.

Strictly confidential (FR) Class II-FOMC
OUTLOOK FOR U.S. INTERNATIONAL TRANSACTIONS IN GOODS, SERVICES, AND THE CURRENT ACCOUNT
(Billions of dollars, seasonally adjusted annual rates)
NIPA Real Net Exportsof Goods & Services (87$)
Exports of G&SGoods
AgriculturalComputersOther Goods
Services
Imports of G&SGoods
OilComputersOther Goods
Services
Memo:(Percent change 1/)Exports of G&SAgriculturalComputersOther GoodsServices
Imports of G&SOilComputersOther GoodsServices
Current Account Balance
Goods & Serv (BOP), netGoods (BOP), netServices (BOP), net
Investment Income, netDirect, netPortfolio, net
1995
Q3 Q4
-134.1 -134.6
721.9558.344.5
115.0398.8163.7
856.0743.758.3
151.3534.0112.4
2.911.329.6-4.53.2
6.015.228.50.80.3
742.7577.944.2
122.8410.9165.0
877.3763.759.1
161.1543.5113.7
12.1-2.530.012.73.2
10.45.2
28.57.34.9
Projection
1996
Q1 Q2 Q3 Q4
-139.1 -140.3 -147.4 -141.0
756.5590.544.9
131.4414.2166.1
895.6781.059.9
169.9551.2114.6
7.66.2
31.03.32.7
8.65.8
23.85.83.2
777.9609.6
45.5140.6423.5168.3
918.1802.6
62.3178.5561.7115.7
11.86.0
31.09.35.5
10.517.121.97.83.6
786.2616.0
46.1150.4419.4170.3
933.6817.163.3
187.6566.1116.6
4.35.4
31.0-3.84.7
6.96.6
21.93.23.3
811.6638.7
46.8160.9431.0173.0
952.6835.260.4
197.1577.7117.4
13.65.7
31.011.56.5
8.4-17.4
21.98.42.9
-162.7 -167.8 -154.0 -158.8 -165.1 -173.3
-125.5-189.3
63.8
-6.264.2
-70.5
-113.7-178.2
64.5
-11.065.5
-76.5
-109.9-175.3
65.4
-11.163.8
-74.9
-111.2-178.3
67.1
-14.764.9
-79.6
-121.2-189.9
68.6
-10.967.6
-78.5
-113.2-184.8
71.6
-16.668.7
-85.3
1997
Ql Q2 Q3 Q4
-140.4 -140.2 -145.8 -140.1
826.6651.7
47.4172.2432.0175.1
967.1849.0
59.8207.0582.3118.1
7.65.8
31.01.04.9
6.2-3.821.53.22.3
851.1673.648.1
184.2441.3177.5
991.3872.564.2
217.3591.0119.0
12.45.7
31.08.95.8
10.432.621.56.12.9
861.6682.3
48.8197.1436.5179.4
1007.4887.9
66.2228.1593.5119.7
5.15.7
31.0-4.34.3
6.713.621.51.72.5
887.5705.9
49.4210.9445.6181.7
1027.6907.163.0
239.5604.6120.6
12.65.6
31.08.65.2
8.3-18.021.57.73.1
-159.4 -163.4 -166.3 -178.3
-113.2-187.2
74.0
-13.270.3
-83.4
-112.7-189.3
76.5
-17.671.2
-88.9
-120.2-198.9
78.7
-13.173.8
-86.9
-114.6-195.9
81.3
-20.273.7
-93.9
Projection
ANNUAL
1995 1996 1997
-128.5 -141.9 -141.7
721.9558.544.5
111.9402.1163.5
850.4737.657.3
146.9533.4112.9
6.4-3.728.24.90.4
9.03.5
25.06.64.3
783.0613.7
45.8145.8422.0169.4
925.0809.0
61.5183.3564.2116.1
9.35.8
31.04.94.8
8.62.2
22.46.33.2
856.7678.4
48.4191.1438.9178.4
998.4879.163.3
223.0592.9119.3
9.45.7
31.03.45.0
7.94.4
21.54.72.7
-165.3 -162.8 -166.8
-122.6-186.0
63.4
-9.261.6
-70.8
-113.9-182.1
68.2
-13.366.3
-79.6
-115.2-192.8
77.6
-16.072.3
-88.3
Unilateral Transfers, net -31.0 -43.0 -33.0 -33.0 -33.0 -43.5 -33.0 -33.0 -33.0 -43.5 -33.5 -35.6 -35.6
1/ Percent change (AR) from previous period; percent changes for annual data are calculated Q4/Q4.