Embed Size (px)
Citation preview

Prefatory Note
The attached document represents the most complete and accurate version available based on original copies culled from the files of the FOMC Secretariat at the Board of Governors of the Federal Reserve System. This electronic document was created through a comprehensive digitization process which included identifying the best-preserved paper copies, scanning those copies,1 and then making the scanned versions text-searchable.2 Though a stringent quality assurance process was employed, some imperfections may remain.
Please note that this document may contain occasional gaps in the text. These gaps are the result of a redaction process that removed information obtained on a confidential basis. All redacted passages are exempt from disclosure under applicable provisions of the Freedom of Information Act.
1 In some cases, original copies needed to be photocopied before being scanned into electronic format. All scanned images were deskewed (to remove the effects of printer- and scanner-introduced tilting) and lightly cleaned (to remove dark spots caused by staple holes, hole punches, and other blemishes caused after initial printing). 2 A two-step process was used. An advanced optimal character recognition computer program (OCR) first created electronic text from the document image. Where the OCR results were inconclusive, staff checked and corrected the text as necessary. Please note that the numbers and text in charts and tables were not reliably recognized by the OCR process and were not checked or corrected by staff.

Strictly Confidential (FR) Class II FOMC
March 17, 1993
SUMMARY AND OUTLOOK
Prepared for the Federal Open Market Committee
By the staff of the Board of Governors of the Federal Reserve System

DOMESTIC NONFINANCIAL DEVELOPMENTS
Overview
The staff projection for economic activity has changed little
since the January Greenbook. While incoming data suggest that
first-quarter GDP growth may be slightly greater than we forecast
earlier, a less-promising trade outlook and the adoption of more
restrictive fiscal assumptions have taken just a hair off the pace
of expansion over the remainder of the projection period.
We have patterned our new fiscal assumptions on President
Clinton's proposals. While the analysis is not clear-cut, we
are anticipating that forward-looking consumers will begin to adjust
their spending this year to the higher tax liabilities they will
face and that this adjustment will largely offset the positive
demand effects of the short-run stimulus package. The
contractionary effects are expected to become dominant in 1994, when
the deficit-reduction side of the proposal comes to the fore.
The effects of the increased fiscal drag would be greater in
this forecast were it not for the favorable bond market response we
have seen; although a significant decline in long rates had been
part of our earlier forecasts, recent developments have prompted us
to lower the path of rates slightly through next year. The new
initiatives to encourage lending to smaller businesses increase the
probability that an easing of the credit crunch will help to bolster
the economy.
On balance, real GDP is expected to grow almost 3 percent in
both 1993 and 1994. The pace of expansion is sufficient to
gradually reduce the unemployment rate, which is projected to
decline to almost 6-1/2 percent by the end of next year. The slack
in the economy should result in a further slowing in inflation.
But, reflecting a reassessment of underlying trends and also the

I-2
effects of likely governmental actions, consumer prices are now
expected to decelerate somewhat less over the projection period. We
now put the 1994 increase in the CPI excluding food and energy at
about 2-3/4 percent--1/4 percentage point higher than in the
previous forecast.
Recent Developments and the Near-Term Outlook
We now estimate that real GDP will increase at a 3 percent
annual rate in the first quarter--1/4 percentage point faster than
in the last Greenbook forecast. A key element in that projection is
the recent improvement in the labor market. The unemployment rate
has fallen 1/4 percentage point over the past two months, which
suggests the economy is growing faster than its potential rate
(assumed to be in the vicinity of 2-1/4 percent). Payrolls rose
sharply in February, and aggregate production-worker hours in
January and February were almost 2-1/2 percent (annual rate) above
the fourth-quarter average. Allowing for some further gain in
productivity after the fourth-quarter surge, this increase in hours
is consistent with a solid rise in real GDP.
Among the key components of aggregate demand, real consumer
spending is expected to rise at a 3-1/4 percent annual rate in the
first quarter; outlays likely will increase faster than disposable
income for the third quarter in a row. In part, this rise in
spending is the product of quarterly arithmetic; recent monthly
increases in retail sales have been smaller than during the holiday
season. Consumer sentiment appears to have become somewhat less
upbeat since December.
Residential investment should increase somewhat further this
quarter as construction activity reflects the surge in starts at the
end of 1992. Starts and sales data thus far this year, however,
have been surprisingly sluggish in the face of a confluence of

I-3
factors favorable to housing demand. Single-family starts were
1.06 million units (annual rate) in January and 1.05 million in
February--both appreciably below the fourth-quarter pace. However,
the mortgage bankers' survey and other, anecdotal evidence suggest
that low interest rates are bolstering home sales.
Business fixed investment is projected to rise at roughly a
10 percent annual pace in real terms again in the current quarter,
led by further large gains in equipment spending. Orders for
nondefense capital goods other than aircraft fell only slightly in
January after a big increase at the end of 1992. Computers remain
an area of particular strength, but trends appear to have turned
more positive for other equipment as well. The proposed investment
tax credit may be providing some stimulus to equipment spending, but
the major effect is unlikely to be felt until the ITC is enacted and
businesses have assessed the actual details of the plan.
Nonresidential construction activity is expected to be little
changed in the first quarter.
We are projecting a moderate step-up in nonfarm inventory
investment in the current quarter. The increase in motor vehicles
assemblies this quarter, coupled with a flattening of sales, appears
to have led to a rise in stocks. Outside of motor vehicles, a
decline in inventories in January left stock-to-sales ratios quite
low in a number of industries. Manufacturing purchasing managers
report lengthening delivery times--which may encourage them to hold
larger amounts of materials and supplies. Our forecast anticipates
some accumulation of non-auto inventories over the balance of the
quarter.
The recent news on prices has not been especially encouraging.
Prices of industrial and construction materials have firmed in
response to rising activity, with trade and environmental
I-4
restrictions exacerbating pressures in sectors such as steel and
forest products. The CPI excluding food and energy increased
0.5 percent in both January and February. Although special factors
(such as higher excise taxes on tobacco) accounted for part of the
pickup, we are interpreting the numbers as indicating that the
underlying trend in consumer price inflation is a little higher than
we had previously thought. Wage increases remain modest, however.
suggesting that a significant deterioration in inflation is not in
the cards at this time.
The Outlook Beyond the Current Quarter
Key assumptions. We continue to assume that short-term
interest rates will change little over the 1993-94 projection
period. Long-term interest rates have come down somewhat faster
than we anticipated, evidently because of the expectational effects
of the Clinton budget proposals and subsequent congressional actions
to cut spending further. We believe that some additional decline in
long rates is probable, as the markets adjust to the continued low
levels of short-term rates and inflation. Nonetheless, bond yields
are just a little lower in 1994 than projected in the January
Greenbook--partly because inflation does not decline as much in this
projection.
The growth of the broad monetary aggregates in early 1993 has
been depressed by a temporary slowing of mortgage refinancing and
distortions of seasonal factors arising from the unusual strength of
the aggregates early in 1991 and 1992 following policy easings.
Even abstracting from such special factors, underlying growth of M2
and M3 has been extremely weak relative to the pace of nominal
spending. In the projected economic and interest rate environment,
depositories are unlikely to regain their previous share of credit
supply during the expansion; moreover, given the increased costs of

I-5
intermediation, their asset growth probably will continue to be
financed to a greater extent than before with nondeposit sources of
funding. In light of a still steeply sloped yield curve, the demand
for monetary assets by the public will likely remain subdued, as the
public continues to substitute away from such assets in favor of
capital market instruments and debt repayment. Consequently, both
M2 and M3 are expected to finish this year below the bottom ends of
their respective target ranges and to grow relatively slowly in
1994.
For fiscal policy, we have incorporated the major elements of
President Clinton's budget proposal, taking into account the
congressional efforts to make up the shortfall in targeted deficit-
reduction suggested by the CBO and JCT assessments of the
Administration numbers. We have assumed that the short-run stimulus
package will be enacted in the next few weeks, along with a budget
resolution consistent with the overall package, and that the rest of
the plan will be passed into law by late summer. Apart from the
uncertainties attending the ongoing legislative process, the reader
is cautioned that, in light of such extraordinary devices as
retroactive income tax increases and the temporary, incremental
investment tax credit, the assessment of the aggregate demand
effects of the program is far from straightforward.
It should be noted that the staff had previously assumed that
some deficit reduction would be forthcoming, on the basis of
adherence to OBRA requirements. This has muted the effects of the
Clinton plan on the staff's budget projections. As shown in the
table, our forecast of the unified budget deficit has been lowered
by $18 billion in FY1993 to $277 billion and by $28 billion in F1994
to $279 billion. The direct effects of the new policy assumptions
raise our forecast of the deficit in the current fiscal year by

I-6
$6 billion and reduce the deficit in FY1994 by $23 billion. In
addition, these projections incorporate lower outlays for deposit
insurance, somewhat higher effective tax rates, and changes to
several other technical assumptions.
REVISIONS TO STAFF UNIFIED BUDGET DEFICIT PROJECTIONS(Billions of dollars)
FY1993 FY1994
Deficit, January Greenbook 295 307
New policy assumptionsHigher receipts 0 -29Higher outlays 6 6
Economic assumptionsGDP -4 -2Lower interest rates 0 -2
Technical assumptionsDeposit insurance -10 -4Other -10 3
Deficit, March Greenbook 277 279
The trade-weighted foreign exchange value of the dollar has
been about unchanged, on balance, since the FOMC meeting and is
projected to appreciate gradually over the projection period.
Although the staff still expects foreign economic activity to
accelerate through 1994. the forecast has been revised downward from
the last Greenbook, because of weaker growth in the major
industrialized countries. The projection of crude oil prices is
essentially unchanged from the January Greenbook. The posted price
of West Texas intermediate crude oil is expected to average around
$18.75 per barrel in the first half of this year before edging down
to $18.50 per barrel.
Summary of the forecast. Although the forecast of real GDP
growth is little changed from the last Greenbook, the composition of
output has been altered somewhat. Most notably, in response to the

I-7
Clinton fiscal initiatives and the decline in long-term interest
rates, business investment has been strengthened significantly in
this forecast and personal consumption has been weakened. And we
now expect the external sector to be a greater drag on real GDP than
before in 1993 and 1994, because of the higher value of the dollar
and somewhat slower growth in the economies of our major trading
partners.
STAFF REAL GDP PROJECTION--SELECTED COMPONENTS(Percent change, Q4 to Q4)
1992 1993 1994
Real GDP 3.2 2.9 2.9Previous 2.9 2.8 3.0
Real PCE 3.3 3.0 2.9Previous 3.3 3.1 3.3
Real PDE 12.5 12.4 12.0Previous 10.8 11.1 9.3
Consumer spending. After a 3-1/4 percent increase in 1992,
real personal consumption expenditures are expected to grow
3.0 percent in 1993 and 2.9 percent in 1994--downward revisions from
the January Greenbook of 0.1 percentage point and 0.4 percentage
point, respectively. This change in the outlook reflects the
contractionary effect of higher personal income taxes under the
Clinton plan, which is only partially offset by lower interest
rates. The increased taxes represent a reduction in the "permanent"
income of the affected individuals. Higher-income taxpayers,
especially, are likely to be forward-looking with respect to their
personal finances, and we anticipate that they will begin adjusting
their consumption downward before very long. Although the higher
taxes do not need to be paid until 1994, we expect approximately
one-half of the adjustment to consumption to be complete by the end
of this year and virtually all of the adjustment by the fourth

I-8
quarter of 1994. During the period of adjustment, the personal
saving rate is likely to be depressed. 1
Housing. After a gain of more than 14 percent in 1992,
increases in real residential investment are projected to slow to
8 percent in 1993 and 4-1/2 percent in 1994. Single-family housing
starts are expected to turn upward again in the near term and to
exceed 1.2 million units in 1994. Low mortgage rates, continued
growth in real incomes, and--as prices firm--a stronger investment
motive for owning a home all are projected to be important
influences sustaining the construction of single-family units. 2
Reports of a dearth of developed lots have surfaced recently, but
this shortage has not been confirmed by a rise in home prices; to
the extent that the reports are true, the easing of the credit
crunch should help to alleviate the problem over time. We expect
the spectacular run-up in spot lumber prices to be largely reversed
and to have only a small effect on housing construction. In the
multifamily market, housing starts are expected to drift upward to
220,000 units in 1994, as vacancy rates decline and real rents firm.
Business fixed investment. Business capital spending is
projected to remain strong over the forecast period, stimulated by
higher levels of economic activity, lower interest rates, and the
investment tax credit. Given the complexity of the ITC proposal and
the uncertainty about the ultimate form of the legislation, we do
not expect to see much of a boost to equipment spending until after
the Congress acts on the President's proposal. The ITC will reduce
1. Because the national income accounts measure personal taxes ona cash rather than a liability basis, the underlying movements inthe personal saving rate will be distorted. In 1993, consumerspending will be reduced, but the NIPA will not yet pick up thehigher taxes; this artificially boosts the saving rate by about0.3 percentage point. The NIPA will recognize the additional 1993tax liabilities in 1994, depressing the saving rate by0.3 percentage point at that time.
2. Higher marginal tax rates will encourage high-incomehouseholds to make debt-financed investments in housing.

I-9
the cost of capital and encourage both large and small firms to
adopt somewhat more capital-intensive forms of production; in the
case of the temporary ITC for large firms, the rise in capital
intensity will be transitory, with capital-output ratios eventually
returning to previous levels. In addition, there is likely to be
some shifting into late 1994 of investment that would have occurred
in early 1995 as large firms seek to maximize benefits from the
temporary credit. 3 Based on these considerations, we now project
real spending on producers' durable equipment to rise about
12 percent per year in 1993 and 1994 before decelerating appreciably
in early 1995 when the ITC for large firms expires.
Investment in nonresidential structures is expected to increase
3-1/4 percent in 1993 and 4 percent in 1994. This sector should
benefit from lower long-term interest rates, any easing of the
credit crunch, and efforts (such as the proposed passive loss relief
for real-estate businesses) to boost the liquidity of the commercial
real estate market.4 Significant growth is expected to come from
public utilities in response to requirements of the Clean Air Act.
In addition, we are projecting larger spending increases in the non-
office commercial and industrial sectors. Expenditures on drilling
and mining also are projected to drift upward, with the bulk of the
exploration activity concentrated on natural gas, which benefits
relative to crude oil both from the BTU tax and from efforts to
shift to cleaner-burning fuels. In contrast, we expect office
3. The quantity of investment that is shifted between 1994 and1995 is likely to be restrained by the requirement that qualifyingequipment be installed and contributing to the firm's operation bythe end of 1994, and also by the stringent recapture provisions thatwould penalize firms that reduce spending after 1994.
4. The Clinton plan lengthens the tax depreciation life fornonresidential structures from 31-1/2 years to 36 years. Thischange will raise the cost of capital only slightly, and its impacton investment in nonresidential structures is likely to be small.

I-10
construction to continue to trend lower through 1993 and to bottom
out in 1994.
Inventory investment. Inventories appear to be fairly lean on
the whole, and with the sustained pickup in economic activity; we
expect businesses to build their stocks. In addition, producers of
capital goods are likely to raise their inventories in anticipation
of the increased shipments associated with the ITC; this production
smoothing boosts inventory investment (and real GDP) into early 1994
and restrains it in the latter part of next year as these added
stocks are run off.
Net exports. Real exports of goods and services are projected
to increase 5-1/4 percent in 1993 and 5-1/2 percent in 1994,
restrained by the appreciation of the dollar and only a mild
recovery in foreign activity. Real imports of goods and services
are forecast to rise 9-1/2 percent this year and another
7-3/4 percent in 1994, reflecting favorable relative prices and
growing domestic spending. As a result, net exports subtract
somewhat more than 1/2 percentage point from real GDP growth in 1993
and somewhat less than 1/2 percentage point in 1994--more than in
the January Greenbook. (A detailed discussion of these developments
is contained in the International Developments section.)
Government purchases. Real federal purchases are forecast to
fall 5-3/4 percent this year and 4 percent in 1994. Real defense
spending is expected to decline more than 9 percent this year and
almost 7 percent in 1994, reflecting declines in employment of
5 percent per year and even sharper reductions in major weapons
procurement. Small increases in spending on health, space, basic
research, law enforcement, and agency modernization programs raise
real nondefense purchases 2-1/2 percent in 1993 and 1-3/4 percent in
1994.
I-11
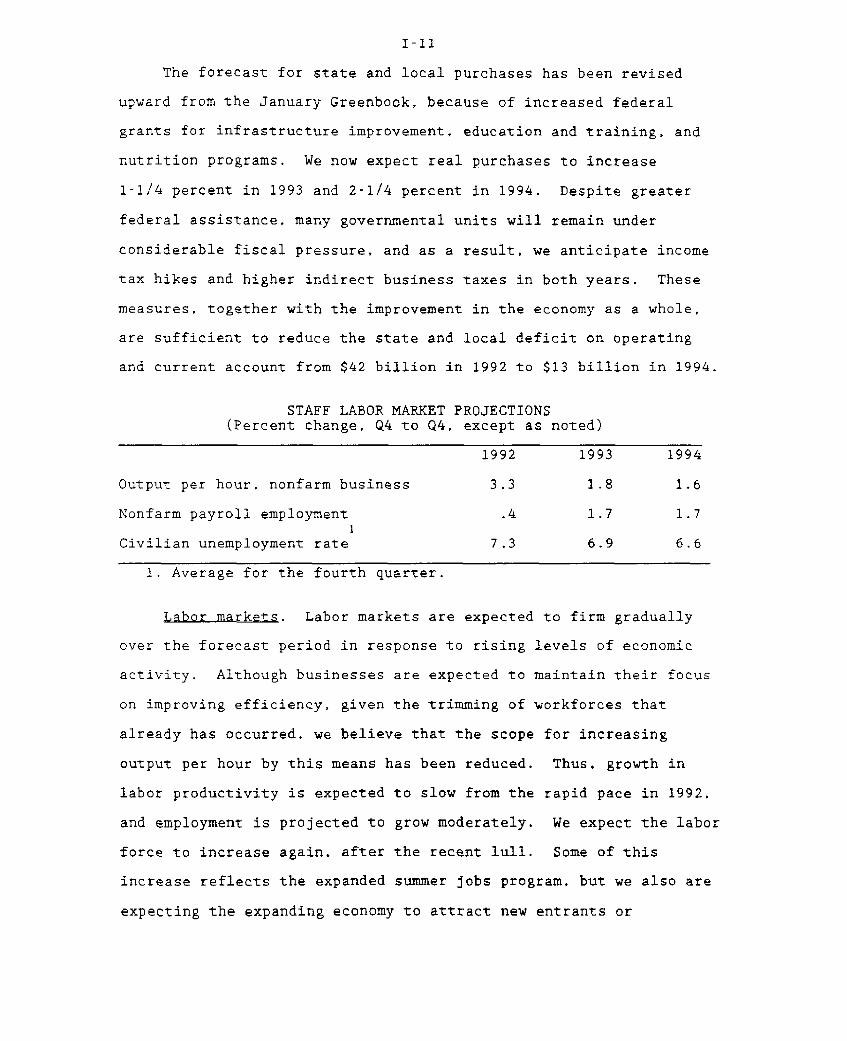
The forecast for state and local purchases has been revised
upward from the January Greenbook, because of increased federal
grants for infrastructure improvement, education and training, and
nutrition programs. We now expect real purchases to increase
1-1/4 percent in 1993 and 2-1/4 percent in 1994. Despite greater
federal assistance, many governmental units will remain under
considerable fiscal pressure, and as a result, we anticipate income
tax hikes and higher indirect business taxes in both years. These
measures, together with the improvement in the economy as a whole,
are sufficient to reduce the state and local deficit on operating
and current account from $42 billion in 1992 to $13 billion in 1994.
STAFF LABOR MARKET PROJECTIONS(Percent change, Q4 to Q4, except as noted)
1992 1993 1994
Output per hour, nonfarm business 3.3 1.8 1.6
Nonfarm payroll employment .4 1.7 1.7
Civilian unemployment rate1 7.3 6.9 6.6
1. Average for the fourth quarter.
Labor markets. Labor markets are expected to firm gradually
over the forecast period in response to rising levels of economic
activity. Although businesses are expected to maintain their focus
on improving efficiency, given the trimming of workforces that
already has occurred, we believe that the scope for increasing
output per hour by this means has been reduced. Thus, growth in
labor productivity is expected to slow from the rapid pace in 1992,
and employment is projected to grow moderately. We expect the labor
force to increase again, after the recent lull. Some of this
increase reflects the expanded summer jobs program, but we also are
expecting the expanding economy to attract new entrants or

I-12
reentrants into the labor force. 5 On balance, we are projecting
the unemployment rate to decline only a bit further this year--to
6.9 percent in the fourth quarter--but to fall to almost
6-1/2 percent by the end of 1994.
Wages and prices. With slack remaining in labor markets,
growth in ECI hourly compensation is expected to slow somewhat
further over the forecast period. This deceleration is a bit less
than in the January Greenbook, reflecting a slightly higher trend
increase in prices and an assumed increase in the minimum wage in
1994. 6 After an increase of 3-1/2 percent in 1992, the
employment cost index is forecast to slow to 3-1/4 percent in 1994,
with deceleration evident in both wages and benefits. At this
juncture, the forecast does not include a health-care reform
package; rather, the deceleration in benefits reflects a
continuation of current efforts to cut costs and shift more of the
burden of health insurance to employees.
Although "core" inflation--as measured by the CPI excluding
food and energy--appears to be running a bit higher at present than
we anticipated in the last forecast, we still expect it to slow over
the forecast period. The disinflationary trend of the past few
years has contained numerous short-run gyrations, suggesting that
5. We are assuming that an additional 650,000 youths will behired (in June and July) as the result of the expansion of thesummer jobs program. Approximately 85 percent of those jobs areexpected to be at state and local governments, with the remainder inthe private sector. We do not think that the summer jobs programwill have a significant effect on the unemployment rate: most of theincrease in employment is expected to come from people who currentlyare not in the labor force.
6. In light of recent statements by congressional leaders andmembers of the Administration, we have assumed that the minimum wagewill be raised. We have built in an increase from the $4.25 perhour level established in April 1991 to $4.75 at the beginning of1994: although there is some chance of an even larger increase--$5 per hour has been mentioned--this seemed a reasonable, middle-of-the-road assumption, given the uncertainties. The effect of ourassumed increase is to add 0.1 percentage point to the growth inhourly compensation in 1994.

I-13
some caution is appropriate in reacting to the most recent data. Of
course, the firming in materials prices that has accompanied the
recent pickup in activity is a departure from the pattern of the
past couple of years. However, we believe that, at this point, it
is appropriate to put greater weight in our forecast of inflation on
the continued slack in labor and product markets and the relative
stability of non-oil import prices. Food prices are projected to
increase only a bit more than 2 percent in both 1993 and 1994.
Energy prices increase 1 percent this year but accelerate to
4-1/2 percent in 1994, as the first round of the BTU tax goes into
effect in July. Excluding food and energy, the CPI is expected
to slow to almost a 3 percent pace this year and to 2-3/4 percent in
1994--core inflation is 1/4 percentage point higher than in the
previous forecast. The overall CPI is projected to increase just
under 3 percent in 1993 and 2-3/4 percent in 1994.
Consumer priPrevious
EnergyPrevious
ExcludingPrevious
STAFF INFLATION PROJECTIONS(Percent change, Q4 to Q4, except as
1992
ce index 3.13.0
2.42.4
food and energy 3.43.4
ECI for compensationprivate industry workers
Previous
1. December to December.
3.53.5
noted)
1993
2.92.6
1.12.2
3.12.8
3.33.2
1994
2.72.4
4.63.2
2.72.4
3.22.9
7. The staff estimates that the BTU tax will raise consumerprices by 0.2 percentage point in 1994: it eventually will add1 percent to the price level when it is fully implemented in 1998.

I-14
Strictly Confidential (FR) STAFF PROJECTIONS OF CHANGES IN GDP, PRICES, AND UNEMPLOYMENTClass II FOMC (Percent, annual rate) March 17, 1993
Unemploymentrate
GDP fixed-weight Consumer (level exceptNominal GDP Real GDP price index price index1 as noted)
Interval 1/27/93 3/17/93 1/27/93 3/17/93 1/27/93 3/17/93 1/27/93 3/17/93 1/27/93 3/17/93
ANNUAL
19902
199121992219931994
QUARTERLY
1991 Q12Q22Q32
Q42
1992 Q12Q22Q32
042
1993 01Q2Q3Q4
1994 01Q2Q3Q4
TWO-QUARTER3
1991 Q22Q42
1992 Q22
Q42
1993 Q2Q4
1994 Q2Q4
FOUR-QUARTER4
1990 Q421991 Q421992 Q421993 Q41994 Q4
3.5 3.5
3.4 3.4-.7 -.7 4.2 4.2 2.9 3.0 .7 .7.9 .9 2.7 2.7 3.1 3.0 .3 .3
5.2 5.2 2.2 2.2 3.4 3.4 3.1 3.2 .5 .55.9 6.2 3.5 4.1 2.6 2.5 3.0 2.9 -.2 -.2
5.7 6.0 2.8 2.9 2.9 3.3 2.6 3.3 -.1 -.35.1 5.1 2.9 2.9 2.4 2.4 2.6 2.4 -.2 -.1
5.1 5.1 2.9 2.9 2.4 2.4 2.5 2.7 -.2 -.14.9 5.1 3.0 2.9 2.1 2.5 2.3 2.8 -.2 -.2
4.13.55.65.45.0
1. For all urban consumers.2. Actual.3. Percent change from two quarters earlier; for unemployment rate, change in percentage points.
4. Percent change from four quarters earlier; for unemployment rate, change in percentage points.

I-15
Strictly Confidential (FR) REAL GROSS DOMESTIC PRODUCT AND RELATED ITEMS, ANNUAL VALUESClass II FOMC (Seasonally adjusted annual rate) March 17, 1993
Projected
Item Unitl 1986 1987 1988 1989 1990 1991 1992 1993 1994
EXPENDITURES
Nominal GDP Bill. $ 4268.6 4539.9 4900.4 5250.8 5522.2 5677.5 5950.7 6301.3 6625.9Real GDP Bill. 87$ 4404.5 4540.0 4718.6 4838.0 4877.5 4821.0 4922.8 5080.7 5226.1
Real GDP % change 2.2 4.5 3.3 1.6 -.5 .1 3.2 2.9 2.9Gross domestic purchases 2.1 3.9 2.5 .9 -1.2 -.2 3.7 3.4 3.2Final sales 3.3 2.7 4.2 1.5 .6 -.6 3.1 2.5 2.9Private dom. final purch. 3.0 1.9 4.2 .5 -.8 -.9 4.4 4.2 4.0
Personal cons. expend. 4.0 2.1 4.2 1.2 .2 .0 3.3 3.0 2.9Durables 12.5 -2.6 8.5 -.5 -2.3 -2.5 9.2 6.9 5.9Nondurables 3.3 1.4 3.2 1.2 -.7 -1.5 3.3 1.9 1.8Services 2.5 3.7 3.7 1.7 1.3 1.6 2.0 2.7 2.8
Business fixed invest. -5.7 3.0 5.5 --4 -1.4 -7.0 7.9 9.9 10.0Producers' dur. equip. -.7 2.4 9.1 -1.7 -.2 -3.5 12.5 12-4 12-0Nonres. structures -14.1 4.4 -1.2 2.3 -3.7 -14.3 -2.8 3.3 4.1
Res. structures 11.1 -3.1 .9 -7.7 -14.7 -.1 14.3 7.9 4.4
Exports 9.9 12.6 13.5 11.3 7.2 7.4 5.0 5.2 5.4Imports 6.7 4.7 3.6 2.6 .1 4.8 9.6 9.6 7.7
Government purchases 4.1 3.3 .2 2.0 2.8 -.6 .5 -1.6 -.1Federal 3.8 3.7 -3.4 -.6 3.0 -2,3 -.7 -5.8 -4.1Defense 3.7 4.5 -3.2 -1.5 1.5 -5.2 -1.8 -9.3 -6.8
State and local 4.4 2.9 2.9 4.0 2.7 .7 1.4 1-2 2.3
Change in bus. invent. Bill. 87$ 8.6 26.3 19.9 29.8 6.2 -9.3 5.0 24.3 28.9Nonfarm 10.6 32.7 26.9 29.9 3.7 -9.6 2.7 25.9 31.7
Net exports -155.1 -143.0 -104.0 -73.7 -51.8 -21.8 -41.5 -67.9 -90.6
Nominal GDP % change 4.7 8.0 7.7 6.0 4.1 3.5 5.7 5.6 5.1
EMPLOYMENT AND PRODUCTION
Nonfarm payroll employ. Millions 99.5 102.2 105.5 108.3 109.8 108.3 108.4 109.9 111.7Unemployment rate % 7.0 6.2 5.5 5.3 5.5 6.7 7.4 6.9 6.7
Industrial prod. index % change 1.4 6.5 4.5 1.1 .3 -.5 2.2 4.7 3.7Capacity util. rate-mfg. % 79.0 81.4 83.9 83.9 82.3 78.2 77.8 79.4 80.0
Housing starts Millions 1.81 1.62 1.49 1.38 1.19 1.01 1.20 1.33 1.44Auto sales in U.S. 11.45 10.24 10.63 9.91 9.51 8.39 8.35 8.70 9.27
North American produced 8.22 7.07 7.54 7.08 6.91 6.14 6.25 6.63 7.06Other 3.24 3.18 3.10 2.83 2.60 2.25 2.10 2.06 2.21
INCOME AND SAVING
Nominal GNP Bill. S 4277.8 4544.5 4908.2 5266.8 5542.9 5694.9 5962.0 6305.2 6628.1Nominal GNP % change 4.4 8.1 7.8 6.1 4.2 3.1 5.6 5.5 5.1Nominal personal income 5.5 7.4 7.1 6.5 6.3 3.3 5.2 6.0 5.4Real disposable income 2.8 2.1 3.2 1.1 .9 .5 2.5 2.8 2.1Personal saving rate % 6.0 4.3 4.4 4.1 4.4 4.8 4.8 4.3 3.7
Corp. profits, IVA&CCAdj % change -7.1 29.7 10.2 -6.3 -3.0 .9 25.4 8.8 1.5Profit share of GNP % 6.4 7.0 7.4 6.9 6.5 6.1 6.6 7.4 7.2
Federal surpl./def. Bill. $ -201.1 -151.8 -136.6 -122.3 -166.2 -210.4 -295.2 -245.1 -174.7State/local surpl./def. 54.3 40.1 38.4 44.8 30.1 17.1 15.4 34.5 43.2
Ex. social ins. funds 1.5 -14.7 -18.4 -17.5 -32.9 -43.1 -42.1 -21.5 -12.5
PRICES AND COSTS
GDP implicit deflator % change 2.6 3.3 4.2 4.4 4.5 3.4 2.5 2.6 2.2GDP fixed-wt. price index 2.6 3.4 4.2 4.3 4.7 3.5 2.9 2.9 2.5Gross domestic purchases
fixed-wt. price index 2.3 3.9 4.1 4.3 5.3 2.8 2.9 2.7 2.4CPI 1.3 4.5 4.3 4.6 6.3 3.0 3.1 2.9 2.7Ex. food and energy 3.9 4.3 4.5 4.4 5.3 4.5 3.4 3.1 2.7
ECI, hourly compensation2
3.2 3.3 4.8 4.8 4.6 4.4 3.5 3.3 3.2
Nonfarm business sectorOutput per hour 1.2 1.8 .5 -1.4 .1 1.3 3.2 1.8 1.6Compensation per hour 4.6 3.8 3.8 3.1 6.3 4.2 3.7 3.5 3.3Unit labor cost 3.4 1.9 3.3 4.6 6.2 2.8 .4 1.6 1.6
1. Percent changes are from fourth quarter to fourth quarter- 2. Private-industry workers.

1-16
Strictly Confidential (FR) REAL GROSS DOMESTIC PRODUCT AND RELATED ITEMS, QUARTERLY VALUESClass II FOMC (Seasonally adjusted, annual rate except as noted) March 17, 1993
1990 1991 1992
Item Unit Q1 Q2 Q3 Q4 Q1 Q2 Q3 Q4 Q1 Q2
EXPENDITURES
Nominal GDP Bill. $ 5445.2 5522.6 5559.6 5561.3 5585.8 5657.6 5713.1 5753.3 5840.2 5902.2Real GDP Bill. 87$ 4890.8 4902.7 4882.6 4833.8 4796.7 4817.1 4831.8 4838.5 4873.7 4892.4
Real GDP % change 2.8 1.0 -1.6 -3.9 -3.0 1.7 1.2 .6 2.9 1.5Gross domestic purchases 2.1 .9 -1,4 -6.0 -4.2 1.7 2.4 -.4 3.0 3.4Final sales 4.3 -1.1 .1 -.9 -3.2 1.3 -.5 .0 4.7 -.1Private dom. final purch. 2.9 -1.7 .8 -5.0 -6.0 1.5 1.4 -.4 5.5 2.4
Personal cons. expend. 2.2 .1 1.7 -3.1 -3.0 2.0 1.5 -.3 5.1 -.1Durables 16.2 -12.0 -1.4 -9.8 -13.0 -.7 8.1 -3.1 16.5 -2.1Nondurables -.2 -.5 .8 -2.8 -3.2 1.3 -.6 -3.5 5.5 -1.5Services .3 3.7 3.1 -1.6 -.3 3.0 1.2 2.3 2.2 1.2
Business fixed invest. 6.2 -6.6 5.6 -9.6 -15.8 -3.1 -3.4 -5.2 3.0 16.1Producers' dur, equip. 6.8 -7.8 7,2 -6.1 -16.7 .7 6.0 -2.4 3.2 24.1Nonres, structures 5.0 -4.1 2.5 -16.5 -14.0 -10.6 -20.8 -11.5 2.7 -.8
Res. structures 5.3 -15.9 -22.9 -22.4 -26.9 7.0 14.4 11.3 20.1 12.6
Exports 10.7 7.0 -.2 11.6 -5.0 16.6 6.2 13.3 2.9 -1.4Imports 2.6 5.1 1.5 -8.5 -14.6 15.6 17.1 4.2 3.5 14.7
Government purchases 6.4 1.1 -2.0 6.1 2.8 .2 -2.3 -3.0 1.7 -1.2Federal 8.0 2.1 -7.2 9.9 7.2 -.3 -6.5 -9.0 -3.0 -2.7Defense 4.9 .3 -10.5 12.8 8.7 -5.6 -9.4 -13.0 -7.7 -5.2
State and local 5.2 .4 1.9 3.5 -,1 .6 .9 1.4 5.1 -.2
Change in bus. invent. Bill. 87$ 7.5 32.8 11.2 -26.8 -25,1 -20.4 .6 7.5 -12.6 7.8Nonfarm 5.9 27.9 6.6 -25.6 -24.7 -24.5 -1.0 11.8 -10.7 6.0
Net exports -58.4 -56.9 -59.3 -32.7 -17.9 -17.4 -31.6 -20.5 -21.5 -43.9
Nominal GDP % change 7.7 5.8 2.7 .1 1.8 5.2 4.0 2.8 6.2 4.3
EMPLOYMENT AND PRODUCTION
Nonfarm payroll employ. Millions 109.8 110.2 109.9 109.3 108.6 108.2 108.3 108.2 108.1 108.4Unemployment ratel % 5.3 5.3 5.6 6.0 6.5 6.7 6.7 7.0 7.3 7.5
Industrial prod. index % change .6 4.2 3.9 -7.0 -9.7 2.6 6.6 -.7 -2.9 5.2Capacity util. rate-mfg.
1 % 82.7 82.8 82.9 80.8 78.0 77.9 78.7 78.2 77.3 77.9
Housing starts Millions 1.43 1.21 1.13 1.04 .90 1.01 1.04 1.09 1.26 1.14Auto sales in U.S. 9.95 9.52 9.56 9.02 8.36 8.43 8.56 8.21 8.31 8.50
North American produced 7.16 6.80 7.05 6.61 6.13 6.10 6.28 6.06 6.07 6.32Other 2.79 2.71 2.51 2.41 2.23 2.33 2.28 2.15 2.24 2.19
INCOME AND SAVING
Nominal GNP Bill. $ 5464.1 5537.0 5577.8 5592.7 5614.9 5674.3 5726.4 5764.1 5859.8 5909.3Nominal GNP % change 7.6 5.4 3.0 1.1 1.6 4.3 3.7 2.7 6.8 3.4Nominal personal income 9.5 6.2 4.6 5.2 .1 4.6 3.3 5.1 6.1 3.9Real disposable income 4.2 .8 -1.2 -.2 -2.6 1.9 .7 2.2 4.0 1.2Personal saving ratel % 4.4 4.6 3.9 4.6 4.7 4.7 4.5 5.1 4.9 5.3
Corp. profits, IVA&CCAdj % change 15.6 19.1 -29.9 -8.2 6.7 -2.6 -6.8 7.1 49.8 4.7Profit share of GNP
1 % 6.7 6.9 6.3 6.2 6.2 6.1 6.0 6.0 6.6 6.6
Federal govt. surpl./def. Bill. $ -167.8 -156.9 -145.6 -194.6 -149.9 -212.2 -221.0 -258.7 -289.2 -302.9State/local surpl./def. 36.1 33.8 30.3 20.2 14.6 16.5 15.4 22.0 16.6 17.7
Ex. social ins. funds -27.3 -29.4 -32.5 -42.2 -46.6 -44.1 -44.5 -37.3 -41.8 -40.3
PRICES AND COSTS
GDP implicit deflator % change 4.4 4.8 4.7 3.9 5.3 3.5 2.4 2.4 3.1 2.7GDP fixed-wt. price index 5.4 4.6 4.7 4.1 4.7 3.5 3.0 2.4 3.6 2.9Gross domestic purchases
fixed-wt. price index S.9 3.7 5.6 5.8 3.1 2.5 2.9 2.5 3.1 3.2CPI 7.5 3.8 7.0 6.9 3.6 2.1 2.7 3.3 3.5 2.9
Ex. food and energy 5.3 5.5 5.8 4.2 6.5 3.8 4.0 3.7 4.2 3.5
ECI, hourly compensation2
5.6 5.1 4.3 3.8 4.6 4.9 4.4 3.7 4.0 2.9
Nonfarm business sectorOutput per hour -.5 2.5 -1.7 .1 -.7 1.7 1.9 2.5 3.7 1.7Compensation per hour 5.0 7.8 6.4 5.9 3.9 5.8 3.9 3.1 3.8 2.4Unit labor cost 5.6 5.1 8.2 5.8 4.6 4.0 2.0 .6 .1 .8
1. Not at an annual rate, 2. Private-industry workers.
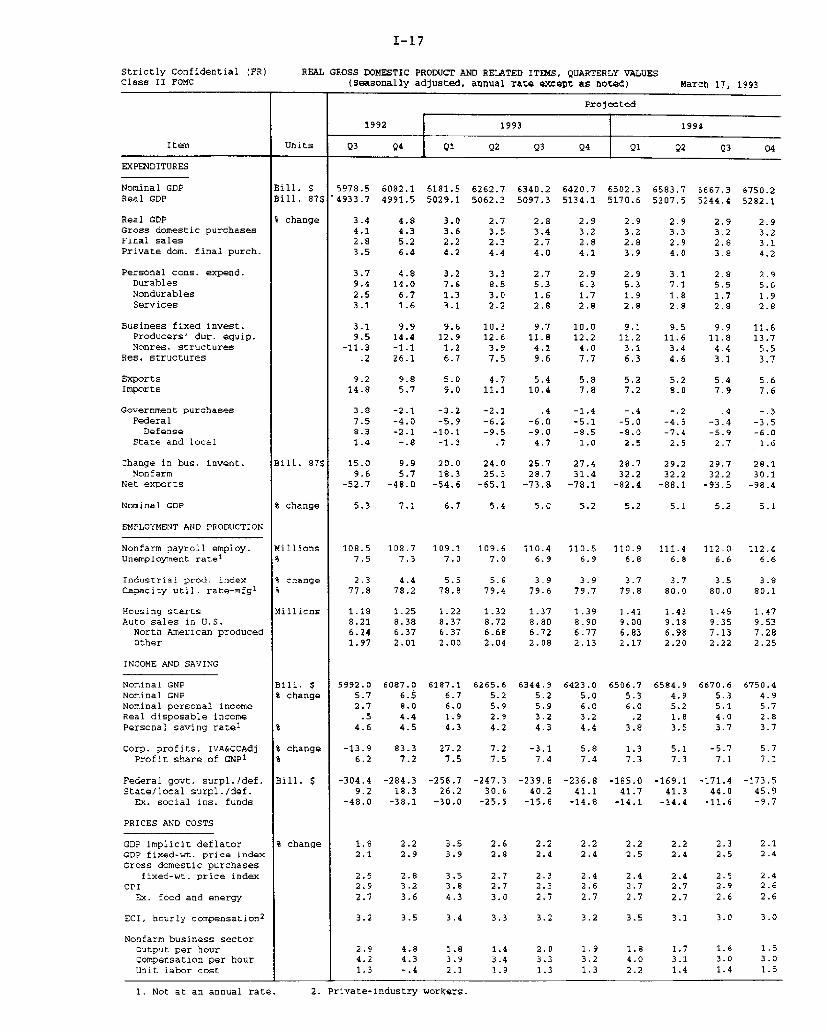
I-17
Strictly Confidential (PR)Class II FOMC
REAL GROSS DOMESTIC PRODUCT AND RELATED ITEMS, QUARTERLY VALUES(Seasonally adjusted, annual rate except as noted) March 17, 1993
Projected
1992 1993 1994
Item Units Q3 Q4 Q1 Q2 Q3 Q4 Q1 Q2 Q3 Q4
EXPENDITURES
Nominal GDPReal GDP
Real GDPGross domestic purchasesFinal salesPrivate dom. final purch.
Personal cons. expend.DurablesNondurablesServices
Business fixed invest.Producers' dur. equip.Nonres. structures
Res. structures
ExportsImports
Government purchasesFederalDefense
State and local
Change in bus. invent.Nonfarm
Net exports
Nominal GDP
EMPLOYMENT AND PRODUCTION
Nonfarm payroll employ.Unemployment ratel
Industrial prod. indexCapacity util. rate-mfg1
Housing startsAuto sales in U.S.
North American producedOther
INCOME AND SAVING
Nominal GNPNominal GNPNominal personal incomeReal disposable incomePersonal saving rate
1
Corp. profits, IVA&CCAdjProfit share of GNP
1
Federal govt. surpl./def.State/local surpl./def.
Ex. social ins. funds
PRICES AND COSTS
GDP implicit deflatorGDP fixed-wt. price indexGross domestic purchases
fixed-wt. price indexCPI
Ex. food and energy
ECI, hourly compensation2
Nonfarm business sectorOutput per hourCompensation per hourUnit labor cost
Bill. $Bill. 87$
% change
Bill. 875
% change
Millions%
% change%
Millions
Bill. $% change
%
% change%
Bill. $
% change
5978.5 6082.1 6181.5 6262.7 6340.2 6420.7 6502.3 6583.7 6667.3 6750.2"4933.7 4991.5 5029.1 5062.3 5097.3 5134.1 5170.6 5207.5 5244.4 5282.1
3.4 4.8 3.0 2.7 2.8 2.9 2.9 2.9 2.9 2.94.1 4.3 3.6 3.5 3.4 3.2 3.2 3.3 3.2 3.22.8 5.2 2.2 2.3 2.7 2.8 2.8 2.9 2.8 3.13.5 6.4 4.2 4.4 4.0 4.1 3.9 4.0 3.8 4.2
3.7 4.8 3.2 3.3 2.7 2.9 2.9 3.1 2.8 2.99.4 14.0 7.6 8.5 5.3 6.3 5.3 7.1 5.5 5.62.5 6.7 1.3 3.0 1.6 1.7 1.9 1.8 1.7 1.93.1 1.6 3.1 2.2 2.8 2.8 2.8 2.8 2.8 2.8
3.1 9.9 9.6 10.3 9.7 10.0 9.1 9.5 9.9 11.69.5 14.4 12.9 12.6 11-8 12.2 11.2 11.6 11.8 13.7
-11.3 -1.1 1.2 3.9 4.1 4.0 3.1 3.4 4.4 5.5.2 26.1 6.7 7.5 9.6 7.7 6.3 4.6 3.1 3.7
9.2 9.8 5.0 4.7 5.4 5.8 5.2 5.2 5.4 5.614.8 5.7 9.0 11.1 10.4 7.8 7.2 8.0 7.9 7.6
3.8 -2.1 -3.2 -2.1 .4 -1.4 -.4 -.2 .4 -.37.5 -4.0 -5.9 -6.2 -6.0 -5.1 -5.0 -4.5 -3.4 -3.58.3 -2.1 -10.1 -9.5 -9.0 -8.5 -8.0 -7.4 -5.9 -6.01.4 -.8 -1.3 .7 4.7 1.0 2.5 2.5 2.7 1.6
15.0 9.9 20.0 24.0 25.7 27.4 28.7 29.2 29.7 28.19.6 5.7 18.3 25.3 28.7 31.4 32.2 32.2 32.2 30.1
-52.7 -48.0 -54.6 -65.1 -73.8 -78.1 -82.4 -88.1 -93.5 -98.4
5.3 7.1 6.7 5.4 5.0 5.2 5.2 5.1 5.2 5.1
108.5 108.7 109.1 109.6 110.4 110.5 110.9 111.4 112.0 112.47.5 7.3 7.0 7.0 6.9 6.9 6.8 6.8 6.6 6.6
2.3 4.4 5.5 5.6 3.9 3.9 3.7 3.7 3.5 3.877.8 78.2 78.8 79.4 79.6 79.7 79.8 80.0 80.0 80.1
1.18 1.25 1.22 1.32 1.37 1.39 1.41 1.43 1.45 1.478.21 8.38 8.37 8.72 8.80 8.90 9.00 9.18 9.35 9.536.24 6.37 6.37 6.68 6.72 6.77 6.83 6.98 7.13 7.281.97 2.01 2.00 2.04 2.08 2.13 2.17 2.20 2.22 2.25
5992.0 6087.0 6187.1 6265.6 6344.9 6423.0 6506.7 6584.9 6670.6 6750.45.7 6.5 6.7 5.2 5.2 5.0 5.3 4.9 5.3 4.92.7 8.0 6.0 5.9 5.9 6.0 6.0 5.2 5.1 5.7.5 4.4 1.9 2.9 3.2 3.2 .2 1.8 4.0 2.8
4.6 4.5 4.3 4.2 4.3 4.4 3.8 3.5 3.7 3.7
-13.9 83.3 27.2 7.2 -3.1 5.8 1.3 5.1 -5.7 5.76.2 7.2 7.5 7.5 7.4 7.4 7.3 7.3 7.1 7.1
-304.4 -284.3 -256.7 -247.3 -239.8 -236.8 -185.0 -169.1 -171.4 -173.59.2 18.3 26.2 30.6 40.2 41.1 41.7 41.3 44-0 45.9
-48.0 -38.1 -30.0 -25.5 -15.8 -14.8 -14.1 -14.4 -11.6 -9.7
1,82.1
2.52.92.7
3.2
2.94.21.3
2.2 3.52.9 3.9
2.8 3.53.2 3.83.6 4.3
3.5 3.4
2.6 2.22.8 2.4
2.7 2.32.7 2.33.0 2.7
3.3 3.2
2.0 1.9 1.83.3 3.2 4.01.3 1.3 2.2
2.2 2.32.4 2.5
2.4 2.52.7 2.92.7 2.6
3.1 3.0
1.7 1.6 1.53.1 3.0 3.01.4 1.4 1.5
2. Private-industry workers.1. Not at an annual rate.

Strictly Confidential (FR)Class II FOMC
NET CHANGES IN REAL GROSS DOMESTIC PRODUCT AND RELATED ITEMS1
(Billions of 1987 dollars) March 17, 1993
Item
Real GDPGross domestic purchases
Final salesPrivate dom. final purch.
Personal cons. expend.DurablesNondurablesServices
Business fixed invest.Producers' dur. equip.Nonres. structures
Res. structures
change in bus. invent.NonfarmFarm
Net exportsExportsImports
Government purchasesFederalDefenseNondefense
State and local
Q1 Q2 Q3 Q4 Q1 Q2 Q3 Q4
34.1 11.9 -20.1 -48.8 -37.1 20.4 14.7 6.7 35.2 18.725.1 10.4 -17,7 -75.4 -51.9 19.9 28.9 -4.4 36.2 41.1
51.5 -13.3 1.4 -10.8 -38.8 15.6 -6.2 -. 3 55.4 -1,728.3 -17.4 8.4 -51.1 -60.2 14.6 13.4 -4.3 52.5 23.5
17.5 .616.7 -14.3
-. 6 -1.21.4 16.0
8.15.92.22.7
-17.4-25.3
7.9
13.8 -25.9-1.5 -11.12.0 -7.5
13.4 -7.3
-9.2 7.3-7.3 6.2-1,9 1.1-8.9 -12.7
25.3 -21.622.0 -21.33.2 -.2
9.0 1.512.5 8.5
3.6 7.0
-13.6-5.6-8.0
-11.6
-38.0-32.2
-5.8
-2.4 26.6
-. 3 14.2
2.1 -12.4
-4.6-7.1-7.8
.72.5
-24.5-14.6
-8.6-1.3
-22.3-15,9
-6.4-13.4
1,7.9.8
14.8-6.7
-21.5
6.66.86.0
.7-.2
15.8 11.9 -2.2 40.3 -.8-.7 8.1 -3.3 16.2 -2.33.3 -1,5 -9.2 14.0 -4.0
13.3 5.2 10.4 9.9 5.6
-4.0 -4.3 -6.6 3.7.6 5.0 -2.1 2.7
-4.6 -9.2 -4.6 1.02.8 5.7 4.7 8.3
21.0 6.9 -20.1
23.5 12.8 -22.5
-2.5 -5.8 2.3
18.919.2
-. 3
5,6
20.416.73.7
.5 -14.2 11.1 -1.0 -22.420.2 8.1 17.2 4.0 -2.019.7 22.3 6.0 5.0 20.5
-7.1-9.0-9.6
.61.9
1989 1990 1991 1992
77.0 -22.941.7 -57.6
73.1 28.819.7 -31.8
39.1 6.0-2.4 -10.212.1 -7.329.4 23.5
.2.1 -7.4-6.2 -. 84.1 -6.6
-17.3 -30.5
4.0 -51.7.7 -56.8
3.3 5.1
4.7-7.5
-29.7-36.5
1.0-10.5-16.0
27.6
-37.2-12.4-24.8
-. 2
34.337.4-3.0
153.0180.5
150.6173.2
108.738.333.736.6
39.043.1-4.1
25.4
2.4-6.18.4
35.3 34.7 12.2 -27.549.5 34.9 38.8 28.114.1 .3 26.5 55.6
18.1-2.3-4.2
2.020.4
25.911.24.36.8
14.7
-5.4-9.1
-14.85.73.7
1. Annual changes are from Q4 to Q4.
-- - ---- --- -----

Strictly Confidential (FR)Class II FOMC
NET CHANGES IN REAL GROSS DOMESTIC PRODUCT AND RELATED ITEMS1
(Billlons of 1987 dollars)
Projected
1992 1993 1994 Projected
Item Q3 Q4 Q1 Q2 Q3 Q4 Q1 Q2 Q3 Q4 1991 1992 1993 1994
Real GDPGross domestic purchases
Final sales
Private dom. final purch.
Personal cons. expend.DurablesNondurablesServices
Business fixed invest.
Producers' dur. equip.Nonres. structures
Res. structures
Change in bus. invent.NonfarmFarm
Net exportsExportsImports
Government purchasesFederal
DefenseNondefense
state and local
41.3 57.8 37.6 33.2 34.9 36.8 36.6 36.9 36.8 37.750.1 53.0 44.2 43.7 43.7 41.1 40.8 42.7 42.3 42.6
34.1 62.8 27.7 29.1 33.3 35.0 35.3 36.4 36.3 39.334.1 63.1 41.8 44.5 41.1 42.6 40.6 42.7 40.8 44.9
29.9 39.3 26.2 27.3 23.2 24.8 24.4 26.5 24.5 25.49.8 14.6 8.4 9.5 6.1 7.3 6.3 8.5 6.7 7.06.4 17.3 3.5 7.9 4.2 4.5 5.0 4.8 4.5 5.1
13.7 7.4 14.2 9.9 12.9 13.0 13.1 13.1 13.2 13.3
4.0 12.4 12.3 13.4 13.1 13.8 32.8 13.7 14.6 17.48.4 12.8 11.9 12.0 11.6 12.4 11.7 12.4 12.9 15.4
-4.4 -.4 .4 1.4 1.5 1.4 1.2 1.3 1.6 2.1.1 11.4 3.3 3.7 4.9 4.0 3.4 2.5 1.7 2.1
-5.1 10.1 4.1 1.6 1.8-3.9 12.6 7.1 3.3 2.8-1.1 -2.5 -3.0 -1.7 -1.0
-1.6-2.1
.5
-8.8 4.7 -6.6 -10.5 -8.7 -4.3 -4.3 -5.7 -5.4 -4.922.5 13.6 7.2 6.8 8.0 8.7 7.9 8.1 8.4 8.921.3 8.8 13.9 17.3 16.8 13.0 12.2 13.8 13.9 13.7
-3.3-4.7
-5.4.7
1.4
-.5-4.0-4.5
.53.5
4.7-7.5
-29.7-36.5
1.0-10.5-16.0
27.6
-37.2-12.4-24,8
-. 2
34.3
37.4-3.0
12.238.826.5
-5.4-9.1
-14.85.73.7
153.0180.5
150.6173.2
108.738.333.736.6
39,043.1-4.125.4
2.4-6.18.4
-27.528.155.6
4,9-2.6-5.02.47.5
142.6172.6
125.1170.0
101.531.320.150.0
52.647.9
4.715.9
17.525.7
-8.2
-30.1
30.861.0
-14.8-21.8-24.7
2.97.0
148.0168.4
147.4169.0
100.828.619.552.8
58.552.4
6.19.7
.6-1.42.0
-20.333.353.6
-1.3-14.5-16.5
2.013.2
1. Annual changes are from Q4 to Q4,
March 17, 1993

Strictly Confidential (FR)Class II FOMC
STAFF PROJECTIONS OF FEDERAL SECTOR ACCOUNTS AND RELATED ITEMS(Billions of dollars except as noted) March 17, 1993
Fiscal year 1992 1993 1994
Item 1991 a 1992a 1993 1994 Qla Q2a Q3a Q4b Q1 Q2 Q3 Q4 Q1 Q2 Q3 Q4
UNIFIED BUDGET Not seasonally adjusted
Receipts1 1054 1091 1180 1243 239 322 276 265 266 356 293 271 272 392 308 290Outlays1 1324 1381 1457 1522 355 350 338 386 329 365 377 383 376 383 380 397Surplus/deficit1 -269 -290 -276 -279 -116 -28 -62 -120 -63 -9 -84 -112 -104 9 -72 -107On-budget -322 -340 -338 -340 -121 -60 -62 -108 -93 -47 -90 -123 -113 -25 -78 -119Off-budget 52 50 62 61 6 31 -1 -13 30 38 7 11 9 34 6 12
Surplus excludingdeposit insurance 2 -203 -287 -276 -263 -105 -25 -69 -128 -68 -7 -72 -106 -101 14 -69 -102
Means of financingBorrowing 293 311 244 285 83 62 77 81 57 31 75 108 91 26 59 96Cash decrease -1 -17 19 0 29 -27 -12 29 6 -25 9 10 10 -30 10 10Other3 -23 -4 14 -6 4 -7 -3 10 1 3 0 -6 3 -5 3 1
Cash operating balance,end of period 41 59 40 40 20 47 59 30 24 49 40 30 20 50 40 30
NIPA FEDERAL SECTOR Seasonally adjusted, annual rate
Receipts 1118 1144 1243 1352 1143 1150 1155 1198 1243 1259 1274 1292 1357 1380 1379 1398Expenditures 1313 1433 1500 1543 1433 1453 1460 1482 1499 1507 1513 1529 1542 1550 1551 1572
Purchases 447 446 449 436 445 445 455 452 453 449 444 441 437 434 432 430Defense 326 315 313 294 314 312 320 319 316 311 305 300 296 292 289 286Nondefense 121 132 137 142 131 133 136 133 137 138 139 140 141 142 144 145
other expenditures 866 987 1051 1107 988 1008 1005 1030 1046 1058 1069 1088 1105 1116 1119 1141Surplus/deficit -194 -289 -257 -191 -289 -303 -304 -284 -257 -247 -240 -237 -185 -169 -172 -174
FISCAL INDICATORS4
High-employment (HEB)surplus/deficit -153 -222 -208 -159 -224 -233 -237 -227 -206 -201 -197 -199 -151 -139 -147 -154
Change in HBB, percentof potential GDP -.4 1.2 -.2 -.8 .5 .2 .1 -.2 -.3 -.1 -.1 0 -.7 -.2 .1 .1
Fiscal impetus (FI),percent, cal. year -3.8 -3.8 -2.2 -6.1 -2.6 -.1 1.3 -1 -1.6 -.3 .4 -2.5 -2.4 -1.5 -1.9 -.8
I
1. OMB's February deficit estimates, including the President's proposals, are $332 billion in FY93 and $262 billion in FY94. CBO's preliminarydeficit estimates of the President's proposals are $308 billion in FY93 and $268 billion in FY94. Budget receipts, outlays, and surplus/deficitinclude corresponding social security (OASDI) categories. The OASDI surplus is excluded from the on-budget deficit and shown separately as off-budget, as classified under current law. The Postal Service deficit is included in off-budget outlays beginning in FY90.
2. OMB's February deficit estimates, excluding deposit insurance spending, are $325 billion in FY93 and $254 billion in FY94. CBO's preliminarydeficit estimates, excluding deposit insurance spending, are $315 billion in FY93 and $263 billion in FY94.
3. Other means of financing are checks issued less checks paid, accrued items, and changes in other financial assets and liabilities.
4. HEB is the NIPA measure in current dollars, with cyclically sensitive receipts and outlays adjusted to the level of potential output generatedby 2.0 percent real growth and an associated unemployment rate of 6 percent. Quarterly figures for change in HEB and FI are not at annual rates.Change in HEB, as a percent of nominal potential GDP, is reversed in sign. FI is the weighted difference of discretionary changes in federalspending and taxes (in 1987 dollars), scaled by real federal purchases. For change in HEB and FI, negative values indicate restraint.
a--Actual.
b--Unified and NIPA data are actuals except for NIPA corporate profit tax total which is a staff projection.

DOMESTIC FINANCIAL DEVELOPMENTS
Recent Developments
Investors have responded enthusiastically to Administration and
congressional proposals aimed at achieving substantial cuts in
projected federal deficits. Thus, while short-term interest rates
have changed little, intermediate- and long-term rates have fallen
30 to 40 basis points over the intermeeting period--in many
instances reaching the lowest levels in two decades. Buoyed by
lower interest rates, major stock price indexes posted record highs
during the intermeeting period; most are up 1 percent to 2 percent.
M2 fell in February at a 3-3/4 percent rate, a bit faster than
in January. Weakness in the aggregate resulted in part from
transitory factors, including seasonal adjustment distortions and a
lull in mortgage refinancing settlements. Even abstracting from
special factors, though, underlying growth still was quite sluggish.
Liquid retail deposits ran off as deposit interest rates continued
to drop. Substitution by households of money holdings into bonds
and stocks likely remained substantial, as flows into long-term
mutual funds reportedly were near record levels. M3 declined at a
1-3/4 percent rate in February, despite a hefty increase in
institutional money funds. Banks continued to tap capital markets
in volume last month, reducing their need to fund assets with M3-
type deposits.
Bank credit grew at a 1-1/2 percent rate in February, but the
growth was more than accounted for by an increase in security
holdings in connection with the acquisition of one large thrift.
Business loans ran off in part because firms continued to pay down
bank debt--as well as commercial paper--with the proceeds of capital
market financings. Rate spreads and non-price terms on loans to
businesses have not indicated any real shift toward a more
1-21

I-22
accommodative lending posture. While real estate loans also fell in
February, consumer loans posted a second month of solid gains,
though some of the strength may be transitory, resulting from
unusually large tax-refund-anticipation loans.
Debt of nonfinancial businesses apparently has grown only
modestly so far this year. Gross public issuance of investment-
grade and junk bonds has surged, but the proceeds continue to be
used largely to refund other debt. Nonfinancial firms are extending
the maturity of their bond offerings to take advantage of reduced
long-term rates and narrow risk premia. Gross public equity
issuance was robust in February, and the pace so far this year
nearly matches the vigorous performance in 1992. Nonfinancial firms
also have placed a significant amount of equity shares privately
under SEC Rule 144A.
Consumer installment debt decelerated in January, as auto loans
fell off after a December spurt; revolving debt posted a sizable
gain during the month. Home mortgage debt appears to be growing
less rapidly than in the fourth quarter. However, a sharp increase
in applications for home purchases and refinancings portends a re-
acceleration of home mortgage growth in the months ahead.
The decline in municipal bond yields has spurred heavy
refunding issuance in the last three months, but the growth of
municipal debt has been restrained by a falloff in financings to
raise new capital and by the retirement of issues that had been
advance-refunded earlier.
Growth of debt of domestic nonfinancial sectors over 1992 was
revised up 1/2 percentage point to 5 percent as a result of new data
on mortgages. Debt growth in the fourth quarter dipped to 4-1/2
percent with a slowdown in federal borrowing but appears likely to
edge back up in the first quarter of 1993.

I-23
Outlook
The staff assumes that short-term interest rates will change
little over the projection period, in contrast to the prevailing
market expectation that money market rates will rise appreciably.
Long-term interest rates are projected to edge down further,
reflecting the persistence of low short-term rates and a likely
downward adjustment of long-run inflation expectations. Unusual
restraints on the supply of credit by banks and other intermediaries
should ease gradually, as their balance sheets continue to improve.
Efforts by banking regulators may help to spur lending to small
businesses and other borrowers, but the capital markets are likely
to remain the financing source of choice for those entities with
access to them.
Domestic nonfinancial debt is projected to grow 5 percent in
1993 and 6 percent in 1994--essentially the same as the projections
in the last Greenbook. The composition of debt growth has been
revised, however, in part as a result of incorporation in this
forecast of the Administration's fiscal program. Federal debt
growth has been reduced in this forecast and is expected to run at a
near 9 percent rate for 1993 and 8 percent for 1994. Nonfederal
debt growth has been raised and is forecast to be a moderate 4
percent for 1993 and to be near 5 percent for 1994.
The staff projects that business borrowing will strengthen over
the projection period, as investment outlays outstrip internal funds
and as net equity issuance tapers off. The lion's share of net
corporate financing needs are expected to continue to be met through
the bond market. Gross bond issuance may remain exceptionally high
for a while, as higher-cost debt continues to be refinanced. Bank
loans and other short-term credit turn up only mildly over the

I-24
forecast period in association with a modest increase in inventory
financing.
Home mortgage borrowing is projected to rise moderately over
coming quarters, in line with increases in housing activity. Still,
the pace of mortgage debt growth is likely to remain subdued
compared with that experienced during the 1980s. Although mortgage
rates have fallen substantially, they are still high relative to
returns on liquid household assets--encouraging people to make
larger downpayments and to repay debt more rapidly. Households also
may maintain a more cautious attitude toward the use of debt until a
greater sense of job security is reestablished. At the same time,
loan underwriting standards are likely to remain firmer than in the
1980s.
Debt growth in the state and local government sector is
expected to edge down from the moderate pace of 1992, as call dates
for previously refunded issues arrive over the next two years and as
the budgetary positions of state and local governments continue to
improve. However, many governmental units may experience continuing
fiscal distress, the most notable case being California. The
Administration is proposing to extend or enhance the availability of
tax-exempt financing for mortgage revenue bonds, small industrial
development bonds, high-speed rail projects, and business
investments in economically depressed areas, including proposed
enterprise zones. These initiatives are likely to provide only a
modest contribution to the growth of tax-exempt debt over the
forecast period.

Confidential FR Class IIMarch 17, 1993
CHANGE IN DEBT OF THE DOMESTIC NONFINANCIAL SECTORS 1
(Percent)
--------------------- Nonfederal---------------------
----- Households------ ------- MEMO --------State and Private
Federal Home Cons. local financial NominalTotal 2 govt. Total Total mtg. credit Business govt. assets GDP
Year
1980 9.4 11.8 8.9 8.7 11.1 0.7 10.2 3.6 9.7 9.91981 9.8 11.6 9.4 7.9 7.6 4.8 11.6 5.2 10.6 9.31982 9.4 19.6 7.0 5.6 4.8 4.4 7.8 9.3 10.4 3.21983 11.7 18.9 9.9 11.6 11.3 12.6 8.3 9.7 11.7 11.01984 14.5 16.9 13.8 13.2 12.0 18.7 15.4 9.1 13.0 9.1
1985 15.0 16.5 14.5 14.3 12.2 15.8 11.5 31.4 13.1 7.01986 12.9 13.6 12.7 14.1 17.3 9.6 11.9 10.5 9.1 4.71987 9.2 8.0 9.6 11.5 13.7 5.0 7.1 13.4 8.4 8.01988 9.1 8.0 9.4 11.1 12.5 7.2 8.3 7.0 8.4 7.71989 8.0 6.9 8.2 9.6 11.3 5.6 6.9 8.4 7.1 6.0
1990 6.6 11.0 5.3 7.2 9.0 2.2 3.3 5.9 4.5 4.11991 4.1 11.1 2.0 3.8 4.8 -1.6 -0.5 4.5 0.6 3.51992 5.2 10.9 3.4 5.5 7.0 0.3 0.6 5.3 1.0 5.71993 5.4 8.8 4.2 5.8 6.8 3.3 2.3 4.5 0.1 5.61994 5.7 8.1 4.7 6.4 7.2 5.2 2.8 4.5 0.9 5.1
Quarter (seasonally adjusted annual rates)
1992:1 6.1 13.3 3.8 5.8 7.9 0.4 1.2 5.1 5.9 6.22 5.1 12.3 2.7 4.4 5.3 -1.6 -0.3 6.9 -0.6 4.33 4.1 6.5 3.3 5.5 6.9 0.1 0.3 5.4 -2.4 5.34 5.2 10.0 3.5 5.7 7.2 2.4 1.0 3.5 1.3 7.1
1993:1 5.2 8.5 4.0 5.7 6.7 2.5 2.0 4.0 -1.6 6.72 4.8 7.0 4.0 5.5 6.6 3.0 2.2 4.6 0.6 5.43 4.6 6.0 4.2 5.6 6.6 3.5 2.5 4.3 -0.1 5.04 6.6 12.6 4.4 5.9 6.7 4.3 2.6 4.7 1.5 5.2
1994:1 6.5 11.9 4.5 6.0 6.9 4.5 2.7 4.2 1.2 5.22 5.0 5.9 4.7 6.2 6.9 4.9 2.8 4.5 0.8 5.13 4.4 3.7 4.7 6.4 7.1 5.3 2.8 4.1 0.0 5.24 6.3 10.1 4.8 6.5 7.2 5.8 2.9 4.7 1.4 5.1
1. Data after 1992:4 are staff projections. Year-to-year change in nominal GDP measured from thefourth quarter of the preceding year to the fourth quarter of the year indicated; other changesmeasured from end of preceding period to end of period indicated.
2. Deposit insurance outlays raised total debt growth roughly 0.4 percentage point in 1991; it had little effecton debt growth in 1992 and is not anticipated to affect debt growth significantly in 1993 or 1994.On a quarterly average basis, total debt growth is projected to be 5.2 in 1993 and 5.7 percent in 1994.

ConfidentialMarch 17, 1993
Class II
FLOW OF FUNDS PROJECTIONS: HIGHLIGHTS1
(Billions of dollars)
Calendar year ----------- 1993----------- ----------- 1994-----------1991 1992 1993 1994 Q1 Q2 Q3 Q4 Q1 Q2 Q3 Q4
----------- Seasonally Adjusted Annual Rates----------Net funds raised by domesticnonfinancial sectors1 Total 460.9 614.2 652.4 707.8 634.3 591.1 570.4 813.9 810.5 635.0 569.9 816.02 Net equity issuance 18.3 26.8 13.5 5.0 22.0 14.0 10.0 8.0 5.0 5.0 5.0 5.03 Net debt issuance 442.7 587.5 638.9 702.8 612.3 577.1 560.4 805.9 805.5 630.0 564.9 811.0
Borrowing sectorsNonfinancial business
4 Financing gap 2 -4.4 -29.7 18.2 57.9 -3.9 11.7 27.0 38.1 46.6 51.1 63.5 70.65 Net equity issuance 18.3 26.8 13.5 5.0 22.0 14.0 10.0 8.0 5.0 5.0 5.0 5.06 Credit market borrowing -18.9 20.3 84,4 104.6 74.1 78.7 90.6 94.1 99.4 105.1 106.1 107.7
Households7 Net borrowing, of which: 144.9 215.2 241.0 281.8 237.7 232.7 237.1 256.5 264.3 276.6 289.2 297.28 Home mortgages 123.9 190,8 199.2 225.0 195.4 196.9 200.2 204.4 214.2 219.9 229.6 236.49 Consumer credit -12.6 2.5 26.8 43.1 20,0 24.0 28.0 35.0 37.0 41.1 45.0 49.4
10 Debt/DPI (percent) 3 91.5 91.0 91.3 92.3 91.8 91.8 91.9 91.9 92.6 93.0 93.0 93.2
State and local governments11 Net borrowing 38.5 48.1 42.5 44.2 3B.4 44.2 41.3 46.2 41.6 45.6 41.5 48.112 Current surplus 4 -39.6 -42.9 -27.4 -23.4 -32.7 -27.6 -25.7 -23.8 -23.7 -25.1 -23.0 -21.7
U.S.government13 Net borrowing 278.2 304.0 271.0 272.2 262.1 221.5 191.4 409.1 400.3 202.7 128.0 357.914 Net borrowing;quarterly, nsa 278.2 304.0 271.0 272.2 56.7 31.0 75.0 108.3 91.2 26.3 59.2 95.615 Unified deficit;quarterly, nsa 266.8 326.9 268.0 273.8 63.4 8.9 83.8 112.0 104.0 -8.9 72.0 106.7
Funds supplied by16 depository institutions -61.0 27.0 93.2 107.0 39.4 96.6 114.1 122.8 124.5 92.4 91.6 119.6
MEMO: (percent of GDP)17 Dom. nonfinancial debt3 193.4 193.2 192.1 192.9 193.2 193.0 192.8 193.5 194.2 194.2 193.9 194.518 Dom. nonfinancial borrowing 7.8 9.9 10.1 10.6 9.9 9.2 8.8 12.6 12.4 9.6 8.5 12.019 U.S. government 5 4.9 5,1 4.3 4.1 4.2 3.5 3.0 6.4 6.2 3.1 1.9 5.320 Private 2.9 4.8 5.8 6.5 5.7 5.7 5.8 6.2 6.2 6.5 6.6 6.7
divided by nominal GDP.
2.6.4 FOF
Data after 1992:4 are staff projections.For corporations: Excess of capital expenditures over U.S. internal funds.Annuals are average debt levels in the year (computed as the average of year-end debt positions)NIPA surplus, net of retirement funds.Excludes government-insured mortgage pool securities.

INTERNATIONAL DEVELOPMENTS
Recent Developments
Since the February FOMC meeting, the weighted-average foreign-
exchange value of the dollar in terms of other G-10 currencies has
been about unchanged, on balance. The dollar depreciated after mid-
February, partly in response to data that pointed to some slowing of
economic expansion in the United States and partly to the decline in
U.S. long-term interest rates associated with the Clinton
Administration's fiscal program. Since late February, however,
unexpectedly strong U.S. employment statistics and disappointing
inflation data, combined with further signs of weakening activity
abroad, have helped reverse the earlier decline in the dollar.
The dollar has appreciated 1-1/4 percent on balance against the
mark, partly because the Bundesbank has lowered interest rates and
is now expected to ease more and sooner than markets had
anticipated. In early February, the Bundesbank cut its discount and
Lombard rates, and in early March it lowered its RP rate. Over the
intermeeting period, three-month interest rates in Germany came down
70 basis points, to 7.70 percent, and rates in other major European
countries declined 30 to 100 basis points. The German easing has
reduced, but not eliminated, pressure on the French franc, which has
traded above its floor in the ERM against the mark. However, the
lira has declined significantly further against the mark as a result
of political turmoil in Italy. Since the February FOMC meeting,
long-term interest rates in most European countries have come down
about 50 basis points.
In a widely anticipated move, the Bank of Japan lowered its
discount rate 3/4 percentage point, to 2-1/2 percent, in early
February. The dollar fell sharply against the yen through late
February and now stands 6-1/4 percent below its level at the time of
1-27

1-28
the last FOMC. Remarks by U.S. and European officials advocating a
stronger yen apparently contributed to the upward pressure on the
yen. Those pressures abated around the time of the G-7 meeting in
late February, however, when it was perceived that the meeting did
not produce further pressure on Japan to appreciate the yen to
reduce Japan's trade surplus.
The
Desk did not intervene.
Recently released data for the fourth quarter of 1992 indicate
that growth of real GDP was positive and stronger than expected
in Canada and the United Kingdom but negative and weaker than
expected in continental Europe and Japan. Indicators for the first
quarter suggest that growth has continued negative in Germany and
much of the rest of continental Europe and remained close to zero in
Japan.
A 3.3 percent (s.a.a.r.) decline in west German real GDP in the
fourth quarter was more than accounted for by sharp declines in net
exports and investment; a rise in consumption was stimulated by the
anticipation of a value-added tax increase scheduled for the
beginning of 1993. Industrial production and manufacturing orders
picked up a bit in January from the depressed levels of the fourth
quarter, but labor market indicators remained negative. French real
GDP fell 1.2 percent (s.a.a.r.) in the fourth quarter, and various
surveys of business activity point to continued decline in the
current quarter. Japanese real GDP edged off at a 0.3 percent
annual rate in the fourth quarter despite significant expansions of
I-29
government spending, net exports, and inventories. Industrial
production and housing starts declined further in January, and the
latest Bank of Japan survey showed a further decline in business
sentiment and negative investment intentions for 1993. However,
orders picked up for the third month in a row. In the fourth
quarter, U.K. real GDP showed modest positive growth for the second
quarter in a row; retail sales turned up strongly in January and
February, but industrial production in January fell 1/2 percent from
its fourth-quarter average. Canadian real GDP advanced at a 3-1/2
percent rate in the fourth quarter as a result of a surge in net
exports, which in turn largely reflected strong demand in the United
States; indicators for the first quarter are mixed.
Inflation rates abroad have ticked up recently as a result of
special factors, including a value added tax hike in Germany and the
pass-through of recent currency depreciations in Italy, the United
Kingdom, and Canada. However, underlying inflation rates appear to
be steady or easing further in most foreign industrial countries.
The nominal U.S. merchandise trade deficit narrowed slightly in
December and somewhat more for the fourth quarter as a whole but
remained above $100 billion at an annual rate.1 Exports advanced
strongly in the fourth quarter, with most of the growth accounted
for by shipments of capital goods and autos to developing countries
in Asia (especially China and Taiwan) and the Middle East. The
current account deficit widened to $88 billion in the fourth quarter
(from an upward-revised $63 billion in the third); declines in both
net service receipts and net investment income receipts offset the
improvement in the trade balance.
1. January trade data will be released on March 18.

I-30
Outlook
The outlook for growth in foreign countries on average is
somewhat weaker than in the January projection. That weakening,
combined with a moderately higher projected path for the dollar,
contributes to a more negative trajectory for real net exports. We
now expect real net exports to decline over the next two years by
about 1 percent of GDP, compared with a decline of 3/4 percent of
GDP in the previous forecast.
The dollar. We project that the foreign exchange value of the
dollar in terms of the other G-10 currencies will drift up from
current levels through the end of 1994. The dollar takes off from a
higher starting point than in the previous forecast, but the
projected rate of increase is about the same. This forecast
reflects a balance of several factors--fiscal contraction in the
United States, weaker activity abroad, and the assumption that
European interest rates, long-term as well as short-term, will
continue to decline relative to comparable U.S. rates. Against the
currencies of key developing countries, the CPI-adjusted value of
the dollar is expected to show a moderate depreciation on average
through the end of the forecast period.
Foreign industrial countries. The combination of weaker-than-
expected real GDP growth at the end of 1992 and negative indicators
for the first quarter have led us to revise downward the projected
1993 growth rates in western Germany, Japan, France, and Italy.
Four-quarter growth in the G-6 countries (weighted by their shares
in U.S. exports) is projected to average about 1-1/2 percent in 1993
and to recover to nearly 3 percent in 1994.2
2. On a U.S.-export-weighted basis, the outlook for 1993 is 1/2percentage point less than that in the January forecast; on a GDP-weighted basis, the downward revision is closer to 1 percentage point.

I-31
We project west German real GDP to decline 1/2 percent this
year (Q4/Q4) and growth elsewhere in Europe and in Japan to be
anemic (in a range of zero to 1 percent). Growth in the United
Kingdom and Canada is expected to be a bit stronger--l-1/2 percent
and 2-3/4 percent respectively. Economic recovery in Japan and
continental Europe is now expected to begin taking hold in the
second half of 1993 and to accelerate moderately in 1994, stimulated
largely by recent and projected further easing of monetary policy.
Expansionary fiscal measures adopted in Japan in recent months and
anticipated for both Japan and France in the year ahead should help
as well.
We project consumer-price inflation in the major foreign
industrial countries to average slightly less than in the January
forecast--about 2-3/4 percent in 1993 and 2-1/4 percent in 1994.
Foreign short-term interest rates, on average, are projected to
decline about 150 basis points from current levels by the end of
1993 and another 25 basis points during 1994. The end-1994 level is
more than 50 basis points below that projected in the January
Greenbook, reflecting the weaker outlook for growth abroad. We
expect German short-term interest rates to fall about 200 basis
points from current levels by the end of the year and to decline
another 75 basis points during 1994. Rates in France, which are
well above German rates, are projected to fall substantially more.
while those in other major European countries should fall somewhat
less. (We are assuming that the French franc will maintain its
central rate with the DM after the French elections later this
month.) We expect Japanese short-term rates to ease moderately, to
about 3 percent over the next few months, and to remain there
through year-end. Long-term interest rates in the major foreign
countries should decline on average more than 50 basis points over

I-32
the forecast period. Long-term rates in Germany should remain
significantly above the rate of inflation, in part, because of that
country's extremely large budget deficit.
Developing countries. The outlook for real GDP growth in the
developing countries that are major U.S. trading partners is
essentially unchanged from that in the previous Greenbook. Real GDP
growth slowed to 4 percent in 1992, as weak import demand in
industrial countries and tight macroeconomic policies in several
developing countries restrained growth. Some relaxation of
contractionary policies, as well as a pickup in demand in industrial
countries, should support faster growth in 1993-94. We expect real
GDP in Mexico to expand at an annual rate of 3 to 3-1/2 percent over
the next two years, up from growth of 2-3/4 percent in 1992. Annual
growth in the key U.S. export markets among developing countries in
Asia is projected to be in the range of 6 to 7 percent on average
over the next two years (up from growth of 5-1/2 percent in 1992),
supported in part by continued rapid growth in China.
U.S. real net exports. We project real net exports of goods
and services to decline $30 billion over the four quarters of 1993
and another $20 billion during 1994.
Real merchandise exports are projected to increase 6-1/4
percent at an annual rate in the current quarter--significantly less
than they increased during the second half of 1992--and to continue
to grow at roughly a 6 percent rate through the end of the forecast
period. Shipments of agricultural commodities should recede a bit
in the near term and then expand moderately through 1994. Exports
of computers are projected to continue expanding at about the same
rapid rate seen on average over the past two years. We expect the
growth of other exports to average around 4 percent in 1993 and to
slow to 2-1/4 percent in 1994 as the depressing effects of the

I-33
recent and projected further appreciation of the dollar more than
offset the stimulative effects of the gradual pickup in GDP growth
abroad. Although exports take off from a significantly higher level
in the fourth quarter of 1992 than we had projected previously, the
projected growth of exports averages nearly 1 percentage point per
year less than in the January forecast, reflecting the higher path
of the dollar and the weaker outlook for growth abroad.
(Percent
ExportsTotalAgricultural
ComputersOther nonag.
ImportsTotalOil
ComputersOther non-oil
* GDP basis. 1987
TRADE QUANTITIESchange from preceding period shown, A.R.
---------- Projection ----1992 1993
Q3 Q4 Q1 Q2 Q3 Q4
12.7 13.9 6.2 5.4 6.2 .6.658.7 -6.5 1.8 -11.9 2.1 13.5
35.4 34.4 21.3 21.6 21.6 21.65.1 13.6 4.4 5.0 4.0 3.1
15.513.2
81.28.3
dollars.
6.5-1.5
19.75.6
9.9-3.7
23.39.6
12.38.9
24.010.8
11.414.7
23.99.0
8.62.1
24.06.8
We expect total merchandise imports in real terms to expand
10-1/2 percent in 1993 and about 8-1/2 percent in 1994, somewhat
faster than projected in the January Greenbook. Declines in
relative prices of imports (associated in part with the appreciation
of the dollar) and rapid growth of trade in computers contribute
importantly to the projected strong growth of imports. Even so, the
growth of computer imports is expected to slow substantially from
the exceptionally rapid rate of about 50 percent during 1992 and to
be generally in line with the projected growth of computer exports.
)
1994Q4
5.92.6
26.42.3
8.59.2
22.35.8

I-34
The quantity of oil imports is projected to remain essentially
flat in the first quarter. Over the rest of the forecast period,
imports are likely to show seasonal fluctuations around a strong
upward trend as U.S. oil drilling activity stagnates and production
declines.
Oil prices. Since the previous Greenbook, spot West Texas
Intermediate (WTI) has varied between roughly $19.00 and $21.00 per
barrel, nearly $1.00 per barrel above the range assumed in the last
Greenbook. We assume that the price will recede a bit from the
current level (just below $20 per barrel) as production cuts by OPEC
fail to fully offset seasonal declines in consumption. Beyond the
middle of the year we assume that spot WTI prices will remain at
$19.50 per barrel. This spot price should be consistent with an
import unit value of $17.00 per barrel, which is the same projection
for the longer-term as in the January Greenbook. We continue to
assume that Iraq will begin exporting significant volumes of oil
sometime in early 1994.
SELECTED PRICE INDICATORS(Percent change from preceding period shown, except as noted, A.R.)
---------- Projection ------------1992 1993 1994
Q3 Q4 Q1 Q2 Q3 Q4 Q4
PPI (exp. wts.) 3.0 -1.5 2.2 2.3 1.4 1.6 1.7Nonag. exports* 3.2 -0.3 1.5 0.9 0.7 1.2 1.5Non-oil imports* 4.7 0.9 -0.9 -0.2 1.3 2.1 1.5Oil imports(level, $/bl) 18.60 17.90 16.90 17.40 17.00 17.00 17.00
* Excluding computers.
Prices of non-oil imports and exports. The appreciation of the
dollar in recent months is expected to result in slight declines in
U.S. non-oil import prices during the first half of 1993. We expect
these import prices to continue rising less rapidly than domesticthese import prices to continue rising less rapidly than domestic
I-35
prices abroad after mid-1993, partly because of the actual and
projected appreciation of the dollar. The increase in prices of
U.S. nonagricultural exports (excluding computers) should roughly
keep pace with increases in U.S. producer prices. The prices of
agricultural exports are projected to rise somewhat faster than
those of other exports on average, consistent with prices in
commodity futures markets.
Nominal trade and current account balances. The merchandise
trade deficit is projected to widen from an annual rate of less than
$105 billion in the fourth quarter of 1992 and the first quarter of
1993 to nearly $130 billion by the end of 1993 and to $150 billion
by the end of 1994. Beyond the current quarter, the projected level
of the deficit is somewhat greater than that in the previous
forecast. The worsening reflects a combination of lower growth of
exports and higher import growth associated with the higher path for
the dollar and weaker growth abroad.
We expect that the current account deficit will widen to more
than $100 billion by the end of 1993 and more than $120 billion (or
over 1-3/4 percent of nominal GDP) by the end of 1994. A continued
expansion of net service receipts is expected to be partly offset by
declines in net investment income receipts. Net receipts of direct
investment income in particular are expected to decline as the
earnings of foreign companies in the United States (and their
payments to home offices) rise with the recovery of U.S. corporate
profits.

I-36
March 17, 1993
STRICTLY CONFIDENTIAL - FRCLASS II FOMC
REAL GDP AND CONSUMER PRICES, SELECTED COUNTRIES, 1990-94(Percent change from fourth quarter to fourth quarter)
Projection
Measure and country 1990 1991 1992 1993 1994
REAL GDP
Canada -2.0 -0.0 1.3 2.7 3.2France 1.5 1.6 1.0 0.9 3.1Western Germany 6.0 2.0 0.2 -0.6 2.1Italy 1.6 1.7 -0.0 0.1 1.7Japan 4.7 3.0 0.2 0.8 2.7United Kingdom -1.0 -1.6 0.1 1.5 2.5
Average, weighted by 1987-89 GDP 2.6 1.5 0.3 0.8 2.5
Average, weighted by share ofU.S. nonagricultural exports
Total foreign 1.8 1.7 1.5 2.3 3.3G-6 0.6 0.8 0.7 1.6 2.9Developing countries 5.0 4.9 3.9 4.8 5.2
CONSUMER PRICES
Canada 4.9 4.1 1.8 2.1 1.8France 3.6 2.9 2.2 2.5 1.8Western Germany 3.0 3.9 3.7 3.2 2.2Italy 6.3 6.1 4.8 5.8 3.8Japan 3.2 3.2 0.9 1.9 1.6United Kingdom 10.0 4.2 3.1 2.4 3.5
Average, weighted by 1987-89 GDP 4.8 3.9 2.4 2.8 2.3
Average, weighted by share ofU.S. non-oil imports 4.4 3.8 1.9 2.3 2.0

Strictly Confidential (FR) Class II-FOMC
U.S. CURRENT .JUNT AND REAL NET EXPORTS
(Billions of dollars, seasonally adjusted annual rates)
1990 1991 1992
Q1 Q2 Q3 Q4 Q1 Q2 Q3 Q4 Q1 42
ANNUAL
1989 1990 1991
GDP Net Exports ofGoods and Services (87$)
Exports of G+SMerchandiseServices
Imports of G+SMerchandise
OilNon-oil
Services
Memod(Percent changes 1/)
Exports of G+Sof which: Goods
Imports of G+Sof whichi Non-oil
Goods
Current Account Balance
Merchandise Trade, net
ExportsAgriculturalNonagricultural
ImportsOilNon-oil
-58.4
500.2363.5136.7
558.6458.3
55.9402.4100.3
-56.9
508.7368.7140.0
565.6464.555.6
408.9101.2
-59.3
508.4366.7141.7
567.7465.753.3
412.4102.0
-32.7
522.6375.3147.3
555.3452.743.5
409.1102.6
-17.9
515.9377.4138.5
533.8438.9
44.2394.794.9
-17.4
536.1390.1146.1
553.5454.951.5
403.498.5
-31.6
544.2395.2149.0
575.8477.9
52.4425.597.9
-20.5
561.4407.3154.0
581.8482.2
46.5435.799.6
-21.5
565.4408.1157.3
586.8488.046.7
441.398.8
-43.9
563.4408.0155.4
607.3507.8
50.9456.8
99.5
-73.7
471.8343.8127.9
545.4450.451.3
399.095.0
-51.8
510.0368.5141.4
561.8460.3
52.1408.2101.5
-21.8
539.4392.5146.9
561.2463.548.6414.897.7
10.7 7.0 -0.2 11.6 -5.0 16.6 6.2 13.3 2.9 -1.4 11.3 7.2 7.410.2 5.8 -2.2 9.7 2.3 14.2 5.3 12.8 0.8 -0.1 10.2 5.8 8,5
2.6 5.1 1.5 -8.5 -14.6 15.6 17.1 4.2 3.5 14.7 2.6 0.1 4.8
-4.4 6.6 3.5 -3.2 -13.4 9.1 23.8 9.9 5.2 14.8 3.1 0.5 6.5
-89.5 -85.3 -95.9 -91.0 48.8 9.7 -44.3 -28.9 -25.5 -73.1 -101.1 -90.4 -3.7
-109.5 -99.2 -115.6 -111.1 -73.3 -65.6 -80.7 -74.2 -70.7 -100,0 -115.7 -108.9 -73.4
379.9 386.6 386.2 402.1 402.5 413.3 416.6 431.4 430.5 428.6 361.7 388.7 416.043.0 40.5 39.4 37.9 39.2 37.5 40.7 43.2 42.9 41.4 42.2 40.2 40.1
337.0 346.1 346.8 364.2 363.3 375.8 375.9 388.2 387.7 387.2 319.5 348.5 375.8
489.4 485.8 501.7 513.2 475.8 478.9 497.3 505.6 501.2 528.6 477.4 497.6 489.463.2 51.3 61.8 72.9 51.7 51.7 52.5 48.8 41.6 51.9 50.9 62.3 51.2426.3 434.5 439.9 440.3 424.2 427.1 444.8 456.8 459.6 476.8 426.4 435.3 438.2
Other Current Account 2.7 1.1 2.8 -10.0 94.2 59.6 24.0 35.5 27.6 19,5 0.2 -0.9 53.3
Invest. Income, net 17.3 12.8 16.9 30.1 27.9 15.7 12.3 9.8 17.6 7.4 14.4 19.3 16.4Direct, net 52.1 51.5 54.0 59.7 61.7 53.0 48.3 48.5 55.0 47.7 47.8 54.3 52.9Portfolio, net -34.8 -38.7 -37,1 -29.6 -33.9 -37.3 -36.0 -38.7 -37.4 -40.3 -33.5 -35.1 -36.5
Military, net -7.5 -6.5 -6.8 -10.5 -10.3 -5.7 -4.0 -2.2 -2.5 -2.5 -6.8 -7.8 -5.5Other Services, net 36.3 37.2 38.3 47.6 47.7 48.8 52.1 54.7 57.8 53.0 32.6 39.9 50.8Transfers, net -26.2 -29.6 -28.8 -47.1 56.8 16.5 -24.0 -17.1 -27.7 -31.0 -25.6 -32.9 8.0
1/ Percent change (AR) from previous period; percent changes for annual data are calculated Q4/44.
March 16, 1993

Strictly Confidential (FR) Class II-FOMC
OUTLOOK FOR U.S. CURRENT ACCOUNT AND REAL NET EXPORTS
(Billions of dollars, seasonally adjusted annual rates)
Projection
March 16, 1993
Projection
GDP Net Exports ofGoods and Services (87$)
Exports of G+SMerchandiseServices
Imports of G+SMerchandise
OilNon-oil
Services
Memo:(Percent changes 1/)
Exports of G+Sof which: Goods
Imports of G+Sof which: Non-oil
Goods
current Account Balance
Merchandise Trade, net
ExportsAgriculturalNonagricultural
ImportsOilNon-oil
Other Current Account
Invest. Income, netDirect, netPortfolio, net
Military, netOther Services, netTransfers, net
1992
Q3 Q4
-52.7 -48.0
575.9420.4155.5
628.6526.452.5
473.9102.2
9.212.714.8
589.5434.3155.1
637.4534.852.3
482.5102.6
9.813.95.7
1993
Q1 Q2 Q3 Q4
-54.7 -65.2 -73.9 -78.2
596.7440.9155.8
651.3547.5
51.8495.7103.8
603.6 611.6446.7 453.4156.8 158.1
668.7563.7
52.9510.7105.0
5.0 4.76.2 5.49.0 11.1
685.4579.154.8
524.4106.3
5.46.2
10.4
620.3460.7159.6
698.4591.355.1
536.2107.2
1994
Q1 Q2 Q3 Q4
-82.5 -88.2 -93.6 -98.5
628.2467.2161.0
710.6602.555.0
547.5108.1
636.3 644.7 653.6473.7 480.7 487.9162.5 164.0 165.6
724.4615.557.2
558.2108.9
738.3628.559.0
569.5109.8
752.0641.360.1581.2110.7
ANNUAL
1992 1993 1994
-41.5 -68.0 -90.7
573.5417.7155.8
615.0514.250.6463.6100.8
5.2 5.2 5.4 5.65.8 5.7 6.0 6.27.2 8.0 7.9 7.6
608.1 640.7450.4 477.4157.5 163.2
676.0570.453.6
516.8105.6
731.3621.9
57.9564.1109.4
5.0 5.2 5.46.6 6.1 5.99.6 9.6 7.7
15.8 7.5 11.4 12.7 11.1 9.3 8.7 8.1 8.3 8.5 10.7 11.1 8.4
-63.1 -88.1 -77.6 -89.6 -94.3 -103.0 -102.1 -110.4 -112.6 -122.6 -62.4 -91.1 -111.9
-110.5 -103.9 -104.3 -114.8 -122.5 -127.6 -132.5 -139.0 -144.8 -150.5
440.5 457.545.9 45.6394.6 411.9
551.0 561.457.1 55.0493.9 506.4
35.5 12.5
11.9 3.449.1 44.9
-37.2 -41.6
-2.365.3
-27.4
-2.754.5
-39.3
461.0 465.244.8 44.6
416.2 420.7
565.3 580.051.3 54.1514.0 525.9
471.145.1
426.0
478.147.1431.0
593.6 605.754.7 54.9
538.9. 550.8
21.7 22.9 24.1 22.8
5.042.7
-37.6
-2.055.1
-31.4
2.3 4.1 1.841.4 40.9 41.3
-39.1 -36.8 -39.5
-1.6 -1.055.9 56.5
-31.4 -31.4
-0.657.6
-34.2
484.0 489.447.9 48.7
436.1 440.7
616.5 628.454.9 57.1
561.6 571.3
495.449.6
445.8
500.950.4
450.5
640.2 651.458.9 59.9
581.3 591.4
26.7 28.1 29.5 28.3
3.840.9
-37.2
-0.258.3
-31.4
0.6 2.740.7 41.1
-40.2 -38.4
0.259.3
-31.4
0.660.3
-31.4
-0.441.3
-41.7
1.061.5
-34.2
-96.3 -117.3 -141.7
439.343.9
395.3
468.9 492.445.4 49.1
423.5 443.3
535.5 586.2 634.151.4 53.8 57.7484.2 532.4 576.4
23,8 22.9 28.1
10.1 3.3 1.749.2 41.6 41.0
-39.1 -38.3 -39.4
-2.557.6
-31.4
-1.3 0.456.3 59.8
-32.1 -32.1
L/ Percent change (AR) from previous period; percent changes for annual data are calculated Q4/Q4.


