Embed Size (px)
Citation preview
Prefatory Note
The attached document represents the most complete and accurate version available based on original copies culled from the files of the FOMC Secretariat at the Board of Governors of the Federal Reserve System. This electronic document was created through a comprehensive digitization process which included identifying the best-preserved paper copies, scanning those copies,1 and then making the scanned versions text-searchable.2 Though a stringent quality assurance process was employed, some imperfections may remain.
Please note that this document may contain occasional gaps in the text. These gaps are the result of a redaction process that removed information obtained on a confidential basis. All redacted passages are exempt from disclosure under applicable provisions of the Freedom of Information Act.
1 In some cases, original copies needed to be photocopied before being scanned into electronic format. All scanned images were deskewed (to remove the effects of printer- and scanner-introduced tilting) and lightly cleaned (to remove dark spots caused by staple holes, hole punches, and other blemishes caused after initial printing). 2 A two-step process was used. An advanced optimal character recognition computer program (OCR) first created electronic text from the document image. Where the OCR results were inconclusive, staff checked and corrected the text as necessary. Please note that the numbers and text in charts and tables were not reliably recognized by the OCR process and were not checked or corrected by staff.

Confidential (FR) Class III FOMC
September 30, 1992
RECENT DEVELOPMENTS
Prepared for the Federal Open Market Committee
By the staff of the Board of Governors of the Federal Reserve System

CONTENTS
II DOMESTIC NONFINANCIAL DEVELOPMENTSLabor market developments.......................... ....................... 1Industrial production............................................. 9Personal income and consumption................................... 11Housing markets .................................. ................. . 17Business fixed investment......................................... 21Business inventories.............................................. 27Federal sector.................................... .. ............. 31State and local government sector................................. 33Prices........ . ................................. ................ . 37
TablesChanges in employment............................................. 2Unemployment and labor force participation rates.................. 2Productivity in the nonfarm business sector....................... 6Initial claims with EUC adjustment............................... 7Growth in selected components of industrial production............ 8Capacity utilization.............................................. 8Average hourly earnings......................................... 9Production of domestic autos and trucks........................... 10Personal income................................................... 12Real personal consumption expenditures............................ 12Sales of automobiles and light trucks............................. 16Private housing activity.......................................... 18Business capital spending indicators.............................. 22Prices of commercial buildings.................................... 25Changes in manufacturing and trade inventories.................... 28Inventories relative to sales..................................... 28Federal government outlays and receipts........................... 32Recent changes in consumer prices................................. 36Recent changes in producer prices................................. 36Price indexes for commodities and materials........................ 40Monthly average prices--West Texas Intermediate................... 41
ChartsLabor market indicators ....... ................................... 4Alternative labor market indicators............................... 5Output per hour.................................................. . 6Personal consumption expenditures and consumer attitudes.......... 14Private housing starts............................................ 18Survey data on housing activity................ .. ............. ... . 19Nominal house prices................................... ........... 20Recent data on orders and shipments.......... ..................... 23Nonresidential construction and selected indicators.............. 26Ratio of inventories to sales...................................... 30State and local sector............................................. 34Commodity price measures........................................... 38Index weights................................. ................... . 40Daily spot and posted prices of West Texas Intermediate........... 41

ii
III DOMESTIC FINANCIAL DEVELOPMENTSMonetary aggregates and bank credit............................... 3Business finance............................. ...................... 7Treasury financing ................................................Municipal securities.............................................. 11Mortgage markets. ................................................. 13Consumer installment credit....................................... 17
TablesMonetary aggregates............... ........... .................... 2Commercial bank credit and short- and intermediate-term
business credit................................................ 4Gross offerings of securities by U.S. corporations................ 6Treasury and agency financing...................... .............. 10Gross offerings of municipal securities........................... 12Selected mortgage debt aggregates............................... ... . 14Mortgage-backed security issuance............ ........ ............. 15Consumer credit................................... ............... . 16Consumer interest rates........................................... 16
ChartsHome mortgage delinquency rates at all lenders.................... 14Factors affecting consumer credit growth.......................... 18
IV INTERNATIONAL DEVELOPMENTSMerchandise trade................................. ................ 1Prices of exports and non-oil imports................... .......... 4U.S. current account............................................... 6U.S. international financial transactions......................... 7Foreign exchange markets........................................... 11Developments in foreign industrial countries ..................... 16Economic situation in other countries.............................. 3.
TablesU.S. merchandise trade: Monthly data.............................. 1Major trade categories............................................ 2Oil imports.................................. ................. ..... 3Import and export price measures................................... 5U.S. current account............................................. 6Summary of U.S. international transactions........................ 8International banking data........................................ 10Major industrial countries
Real GNP and industrial production........................... ... 18Consumer and wholesale prices.................................. 19Trade and current account balances.............................. 20
Japanese economic indicators ...................................... 21Western German economic indicators..................... ........... 23
ChartsWeighted average exchange value of the dollar...................... 12Selected dollar exchange rates..................................... 12

DOMESTIC NONFINANCIALDEVELOPMENTS

DOMESTIC NONFINANCIAL DEVELOPMENTS
Recent indicators have been mixed but, on balance, suggest that
economic growth has not broken out of the sub-par range that has
prevailed since the beginning of the recovery. Although domestic
final sales apparently picked up around midyear, employment and
industrial production have been weak. Hurricane Andrew has been a
net negative for production and incomes to date, but the rebuilding
that is under way should be a slight positive for the next few
quarters. Meanwhile, the news on prices has continued to be very
favorable.
Labor Market Developments
The August labor market report contained a confusing set of
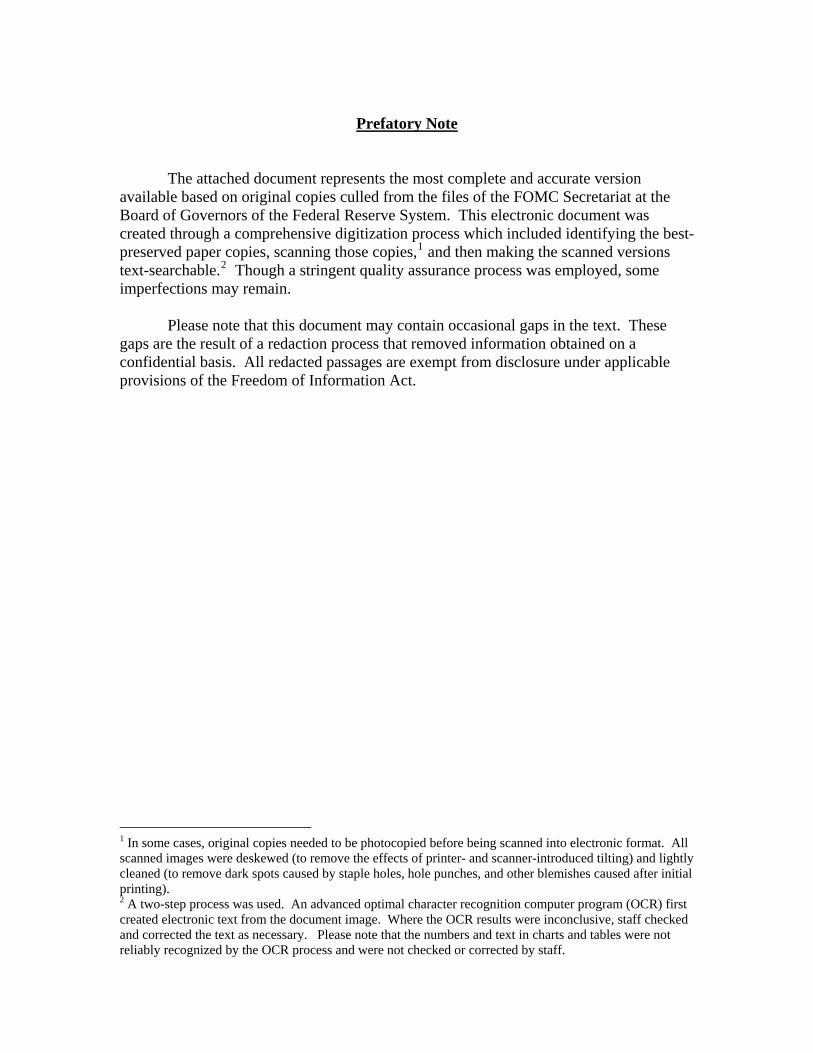
signals. Nonfarm payroll employment fell 83,000 in August, and the
decline would have been considerably larger if not for a federally
funded employment program that added almost 100,000 public and
private sector jobs. However, the average workweek in the
private sector shot up 0.4 hour in August, and aggregate hours
worked rose 0.8 percent. The unemployment rate declined
0.1 percentage point to 7.6 percent.
Private payrolls fell 167,000 in August with most of the loss
occurring in manufacturing and retail trade. The loss of almost
100,000 jobs in manufacturing was widespread and was split about
evenly between producers of durable and nondurable goods. Defense-
related industries--defined as those that are dependent on defense
expenditures for at least 50 percent of their output--lost another
10,000 jobs; the cumulative drop since mid-1990 has been more than
200,000. In retail trade, an employment decline of 71,000 in August
1. The BLS estimates that the summer jobs program in August added90,000 jobs to government payrolls and 10,000 jobs to privatepayrolls. In July, the programs added 60,000 to governmentemployment and 15,000 to private payrolls.
II-1
II-2
CHANGES IN EMPLOYMENT 1(Thousands of employees; based on seasonally adjusted data)
1991 1992 19921990 1991 Q4 Q1 Q2 June July Aug.
------------ Average monthly changes ----------
Nonfarm payroll employment 2 -5 -79 -46 15 74 -73 177 -83
Private -34 -91 -67 -4 64 -65 95 -167Manufacturing -47 -36 -28 -17 -14 -39 11 97Durable -36 -33 -30 -16 -15 -27 -22 -45
Defense-related -4 -8 -8 -9 -12 -11 -16 -10Nondurable -11 -3 2 -1 1 -12 33 -52
Construction -23 -26 -23 4 -1 -32 -16 -7Retail trade -8 -35 -36 -7 21 6 24 -71Finance, insurance, real estate -1 -3 2 2 -1 -9 -3 6Services 44 30 36 28 70 21 100 22
Health services 31 29 29 16 20 9 33 18Business services 0 3 13 11 39 14 9 16
Total government 29 12 21 19 10 -8 82 84
Private nonfarm production workers -40 -76 -54 18 89 -28 53 -157Manufacturing production workers -39 -23 -15 1 -9 -32 25 -86
Total employment 4 -32 -62 -120 207 75 -82 198 -35Nonagricultural -39 -54 -87 203 56 -156 246 -49
Memo:
Aggregate hours of private productionworkers (percent change) .0 -. 1 .0 .1 .0 -. 7 .0
Average workweek (hours) 34.5 34.3 34.4 34.5 34.4 34.3 34.3 34
1. Average change from final month of preceding period to final month of periodindicated.
2. Survey of establishments.3. Industries which are dependent on defense expenditures for at least 50 percent of
their output.4. Survey of households.
UNEMPLOYMENT AND LABOR FORCE PARTICIPATION RATES
(Percent: seasonally adjusted)
1991 1992 19921990 1991 Q4 Q1 02 June July Aug,
Civilian unemployment rate(16 years and older) 5.5 6.7 6.9 7.2 7.5 7.8 7.7 7.6
Teenagers 15.5 18.7 19.0 19.6 21.0 23.6 21.0 19.820-24 years old 8.8 10.8 11.4 11.1 11.3 11.1 11.7 11.5Men, 25 years and older 4.4 5.7 5.8 6.3 6.5 6.8 6.5 6.7Women, 25 years and older 4.3 5.1 5.3 5.6 5.8 5.9 5.9 5.9
Labor force participation rate 66.4 66.0 65.9 66.2 66.5 66.6 66.6 66.4

II-3
more than reversed the gains recorded earlier in the summer. The
job gain posted in services was considerably smaller than earlier in
the year.
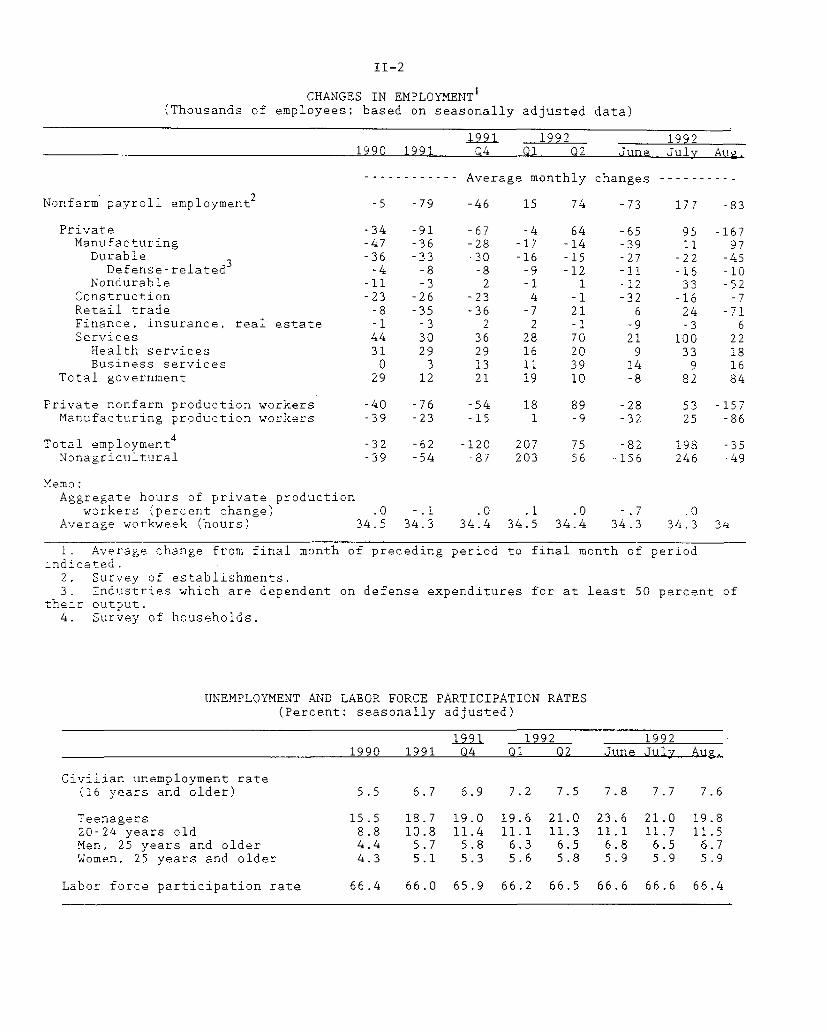
The jump in average weekly hours in August should be viewed
with skepticism. The workweek is a volatile series, and large
monthly movements often are revised or partially reversed in the
following month. Further, the August increase occurred almost
entirely in the service-producing sector, where movements are
especially erratic, particularly in those industries that commonly
use part-time workers. In manufacturing, where the average weekly
hours tend to be more stable, the workweek was unchanged.
The tick down in the unemployment rate in August is
attributable almost entirely to teenagers, likely reflecting hiring
in the summer jobs program. Unemployment among adults was little
changed. The weakness in labor markets apparently has slowed the
flow of jobseekers, and the labor force has declined about 100,000
over the past two months. By contrast, the labor force had risen
around 300,000 per month from December through June, exerting strong
upward pressure on the unemployment rate. At 66.4 percent, the
participation rate in August stood 0.2 percentage point below its
June peak, but remained well above the levels of late 1991.
Since the August labor market survey, fielded during the week
ended August 15, initial claims for unemployment insurance under
regular state programs have averaged close to 400,000 per week.
However, these numbers understate the true level of new claims.
Under revisions made in July to the Emergency Unemployment
Compensation (EUC) program, some eligible workers are able--and find
it more attractive--to file for EUC benefits rather than regular
state benefits. As shown in the table below, when those EUC
II-4
LABOR MARKET INDICATORS
Average weekly hours of production or nonsupervisory workersHours
-- 35.2
Aug -
I I I . 1I1111I _11 liiultLtI iiiII I ii
Aggregate hours of production or nonsupervisory workers1982-100
Initial Claims for Unemployment InsuranceThousands
All regular programs
I I
Sept-Sept 12
lltIIIII1r l 111ll l 111198 198 1989 190 99 1
34.8
34.4
34
130
125
120
115
110
700
600
500
400
300
2001991 19921987 1988 1989 1990

II-5
ALTERNATIVE LABOR MARKET INDICATORS
Help-Wanted Advertising
I I I I1985 1986 1987 1988
Conference Board: Percent Reporting Jobs Plentiful
1989 1990
I I I I I I1985 1986 1987 1988
Manpower Inc. Employment Outlook Index
1989 1990 1991
Sept 10
Iir l llll Il1992
Percentage points
1967.100
'July
Ilrllllnrlil;l1992
Percent
- 30
20
1985 1986 1987 1988 1989 1990 1991 1992
1. Percent of respondents planning to increase employment minus the percentplanning to decrease employment; seasonally adjusted.
I I I.lll~ll L1 l ~l

II-6
OUTPUT PER HOUR(Nonfarm Business Sector)
$1987/hour
1974 1977 1980 1983 1986 1989 1992
PRODUCTIVITY IN THE NONFARM BUSINESS SECTOR(Percent change, annual rate)
1991 19921989 1990 1991 Q2 Q3 Q04 Q1 Q2
Output .1 -. 9 -. 6 .9 1.5 1.6 2.3 2.0Hours 1.6 -. 9 -1.6 -. 4 -. 1 -. 9 -1.5 .0Output per hour -1.4 .0 1.0 1.3 1.7 2.5 3.8 2.0

II-7
claimants are considered, total claims have moved up since the
August survey week.
INITIAL CLAIMS WITH EUC ADJUSTMENT(In thousands; seasonally adjusted by BLS)
1992Aug. Aug. Aug. Aug. Sep. Sep.
8 15 22 29 5 12
Initial claimsAll regular programs 482 391 394 402 408 422EUC 9 12 16 24 23 30
Adjusted claims 491 403 409 427 431 452
Other labor market indicators also point to continued softness
(chart). The Conference Board's index of help-wanted advertising,
as of July, remained near a cyclical low. The same is true for the
perceived employment prospects as measured by the Conference Board's
consumer confidence survey: The fraction of respondents believing
that jobs are plentiful has shown little improvement in recent
months, and an unusually high proportion of respondents continue to
report that jobs are hard to find. Another indication of
sluggishness comes from the Manpower Inc. Employment Outlook Survey,
which asks approximately 15,000 large public and private employers
about their hiring plans during the next quarter. On a seasonally
adjusted basis, only 9 percent more respondents in this survey
intend to increase employment than to decrease employment in the
fourth quarter; this result represents a reduction from the third-
quarter intentions.
Productivity in the nonfarm business sector rose at a
2.0 percent annual rate in the second quarter, the result of a rise
in output and no change in hours. Productivity has displayed a
fairly normal cyclical pattern during the past couple of years.
From its pre-recession peak in 1988:Q4 to its trough in 1991:Q1,
productivity declined 1.7 percent. That loss was recovered over the

II-8
GROWTH IN SELECTED COMPONENTS OF INDUSTRIAL PRODUCTION(Percent change from preceding comparable period)
Proportionin
totalIP
1991:Q4
1992
19911
1992
Q1 Q2 June July Aug.
-Annual Rate-- ----- Monthly Rate-----
Total indexPrevious
100.0 -.5 -2.9-. 5 -2.9
5.3 -. 45.2 -. 4
Motor vehicles and parts
EXCLUDING MOTOR VEHICLESAND PARTS:
Total indexProducts, total
Final productsConsumer goodsDurablesNondurables
Excluding energy
Business equipmentOffice and computingIndustrialOther
Defense and space equip.
Intermediate productsConstruction supplies
MaterialsDurablesNondurablesEnergy
Memo:Manufacturing excluding
motor vehicles and partsMiningUtilities
8.5 -20.0 44.2 -2.4 -3.0
95.857.142.925.0
3.720.918.2
14.62.83.97.9
4.4
14.25.3
38.718.2
9.010.2
80.87.37.7
-. 9-1.3-.92.03.21.81.7
-1.94.2
-8.7-.2
-2.1-1.4-2.1-1.23.1
-2.1-. 7
-1.713.2
-12. 1-1.3
3.82.22.82.89.11.81.7
7.822.0
6.33.5
-8.0 -10.9 -9.1
-2.3-6.4
-. 2-1.82.3
.0
-. 3-. 4-. 5-. 7
-1.1-. 6-. 5
.02.1-.5-. 5
-. 8
.3 -. 14.5 -.7
-3.2-1.7-1.4-6.0
.7 -. 5
.2 -. 4
.7 -. 2
6.3 -. 1 1.1 -. 96.5 -.2 1.1 -.58.3 .8 .3 -1.52.5 -. 9 2.2 -1.5
-.8 -1.1 3.9 -. 1 .5 -. 4-3.3 -7.1 4.3 -1.7 2.5 -1.31.0 -8.5 2.0 -.2 2.2 -1.2
1. From the final quarter of the previous period to the final quarter of the periodindicated.
CAPACITY UTILIZATION(Percent of capacity; seasonally adjusted)
1967-91 1991 1992 1992
Avg. Aug. Q1 Q2 June July Aug.
Total industry
Manufacturing
Primary processingAdvanced processing
82.1
81.4
79.8 78.2
78.6 77.3
82.3 81.281.0 77.5
80.576.0
78.8 78.7 79.0
77.9 77.8 77.9 77.5
81.3 81.4 92.376.5 76.3 ~?.2
78.5
91.276.1

II-9
subsequent four quarters, as productivity grew 2.3 percent, well
above its trend rate.
Few new wage data have been published since the last Greenbook.
Average hourly earnings for production or nonsupervisory workers,
which are volatile on a monthly basis, jumped 0.7 percent in August.
Increases were widespread across industries but especially large in
the finance, insurance, and real estate industry. Despite the surge
last month, the trend in wages remains disinflationary: Over the
twelve months ended in August, average hourly earnings were up
2.6 percent, 1/2 percentage point below the previous twelve-month
period.
AVERAGE HOURLY EARNINGS(Percent change; based on seasonally adjusted data)
12 months ending in August 19921990 1991 1992 June July Aug.
--Monthly rate--
Total private nonfarm 3.9 3.2 2.6 .2 .0 .7Manufacturing 3.4 3.3 2.5 .0 .1 .6Services 4.8 4.0 3.2 .4 .0 .8Finance, insurance,
real estate 4.9 4.3 4.8 .0 .0 2.0
Recent collective bargaining data from the Bureau of National
Affairs also point to a continued deceleration of wages. First-year
wage adjustments under agreements covering 50 or more workers have
averaged 3.4 percent so far this year, down from the 3.9 percent
average change in 1991.
Industrial Production
Industrial production declined 0.5 percent in August, erasing
most of the July gain and returning IP to a level close to its
average for the second quarter. Weakness in the output of materials
was responsible for much of the August reversal. Hurricane Andrew

II-10
and the strike at GM's Lordstown parts plant together accounted for
about one-third of the decline in total IP.
Regarding the special factors in August, the hurricane
disrupted oil and gas extraction in the Gulf of Mexico and caused
the temporary closing of petroleum refineries and petrochemical
plants in Louisiana and Texas. We estimate that it reduced
industrial production by a little more than 0.1 percent in August.
The strike at Lordstown forced the temporary shutdown of several
assembly plants in late August and early September. Despite the
strike, overall output of motor vehicles (value weighted) posted a 1
percent gain in August because higher truck production more than
offset the drop in auto output.
PRODUCTION OF DOMESTIC AUTOS AND TRUCKS(Millions of units at an annual rate; FRB seasonal basis)
1992
Q1 Q2 July Aug. Sep. e Oct. Q4
------------ actual------------ -scheduled-Domestic production 8.8 10.0 9.5 9.4 9.3 10.0 10.0
Autos 5.2 6.1 5.7 5.4 5.5 5.6 5.5Trucks 3.6 3.9 3.7 4.1 3.8 4.4 4.5
e Estimated.
On balance, automobile and truck assemblies were a bit under
9-1/2 million units at an annual rate in August and much of
September, compared with plans as of mid-August to produce at a rate
of around 10 million units. Part of the shortfall was a result of
the Lordstown strike, but lagging orders from dealers led to
underbuilds at other GM plants and prompted the company to
reevaluate demand. Not only has GM reduced planned sales to car
rental companies by 200,000 for the 1993 model year, but it also
announced a 0.2 million unit (annual rate) cut in scheduled
II-11
assemblies for the fourth quarter. Ford and Chrysler have followed
GM in lowering planned output for the fourth quarter.
The available evidence suggests that industrial activity
remained weak in September. The disruptions in the oil and gas
extraction industry caused by Hurricane Andrew continued into
September and should reduce overall output by about 0.1 percent.
2Output of motor vehicles in September edged down. In addition,
available weekly output data in other manufacturing industries were
down, on balance, from August. Moreover, orders for nondefense
capital goods other than computers and aircraft, despite a bulge in
June, have remained lackluster, on balance, since early in the year.
Also, the downward trend in output of defense and space equipment is
expected to continue. At this point, the only industries for which
we have positive signals for September are computers, heavy trucks,
and electricity generation.
Personal Income and Consumption
Real disposable personal income fell 0.6 percent in August
after registering little change in July. The sharp decline in
income reflected the effects of Hurricane Andrew. Excluding this
influence, income grew 0.8 percent in August, with most of the gain
coming from wages and salaries.
BEA made three major adjustments to personal income in August
to account for losses inflicted by the storm. First, rental income
was reduced about $46 billion and proprietors' income by about
$7 billion at an annual rate to account for uninsured losses to
3housing and other property. Second, wages and salaries were
2. The strike at another GM parts facility (in Lansing), whichbegan last Friday, lasted less than a week; production at theaffected assembly plants should return to normal later this week.
3. In the NIPA, rental income reflects rents received byhouseholds (including implicit rents on owner-occupied housing) netof depreciation and accidental damage as measured by the capitalconsumption allowance. Because the properties destroyed by(Footnote continues on next page)

11-12
lowered about $5 billion to account for work interruptions. Third,
farm income was reduced about $2 billion to account for crop damage.
The saving rate fell from 4.6 percent in July to 4.0 percent in
August; however, excluding all of the hurricane-related effects on
income and saving that BEA has identified, the saving rate in August
was close to 5 percent.
Real personal consumption expenditures rose 0.1 percent in
4August. Because of the larger gains in June and July, the
average level of real PCE in July and August was up 4.1 percent at
an annual rate from the second-quarter. The sluggish pace of
consumer spending in August reflected relatively widespread weakness
in expenditures for goods. Outlays for motor vehicles were little
changed last month, with a drop in auto sales offset by higher
outlays for light trucks. Expenditures on goods other than motor
vehicles fell 0.4 percent, with declines in most major categories of
(Footnote continued from previous page)
Hurricane Andrew were small relative to the total stock in theeconomy, the storm had a negligible effect on the estimated flow ofrents received, and the decline in rental income thus mainlyreflects increases in the capital consumption allowance. In theallowance, accidental damage is measured from estimates of the valueof destroyed property--exclusive of furniture and other personalitems which are not included in the capital stock--net of insuranceclaims paid to cover the damage. Thus, only uninsured losses tohousing and other rental property translate into lower rentalincome. (Insurance disbursements largely are reflected in lowercorporate profits.) Similar methods are used to measure the capitalconsumption allowance for farm and nonfarm proprietors' income; themajor difference is that proprietors' income reflects uninsuredlosses to inventories as well as those to structures and equipment.
4. Unlike real PCE, nominal PCE declined last month. In theNIPA, nominal outlays for property insurance are calculated as thedifference between premiums paid to insurance companies and benefitspaid to individuals. In August, nominal outlays were lowered $15.2billion (annual rate) to account for insurance payments to coverdamage to personal property. In contrast, real outlays for propertyinsurance are estimated using constant-dollar premiums without anysubtraction for benefits paid and so were unaffected by the storm.Consequently, the ratio of nominal to real outlays--the implicitdeflator for household and auto insurance--registered a 52 percentdecline in August. Together, these items have a current weight of0.7 percent in the PCE deflator.

II-13
PERSONAL INCOME(Average monthly change at an annual rate; billions of dollars)
1992 1992
1991 Q1 Q2 June July Aug.
Total personal income 12.8 21.6 9.6 5.8 12.1 -23.7
Wages and salaries 5.2 11.3 3.6 -1.9 4.7 19.4Private 3.8 8.6 .9 -4.7 1.6 16.5
Other labor income 1.5 1.4 1.4 1.4 1.4 1.5
Proprietors' income .1 7.1 -4.2 -2.0 -.7 -6.5Farm -.3 1.7 -5.9 -4.7 -1.7 -7.7
Rent .6 -.1 3.7 4.7 2.2 -43.1Dividend -.8 .1 1.2 1.3 1.6 1.8Interest -.6 -8.6 -.8 -.8 -1.3 -1.1
Transfer payments 7.8 12.2 5.3 3.2 4.7 5.9
Less: Personal contributionsfor social insurance 1.1 1.9 .6 .1 .6 1.5
Less: Personal tax and nontaxpayments -.1 -5.0 3.3 1.4 3.6 6.3
Equals: Disposable personal income 12.9 26.6 6.3 4.4 8.5 -29.9
Memo: Real disposable income 1.2 9.8 -1.9 -2.5 1.7 -20.0
REAL PERSONAL CONSUMPTION EXPENDITURES(Percent change from the preceding period)
1992 1992
1991 Q1 Q2 June July Aug.
-Annual rate- ----Monthly rate----Personal consumption
expenditures .0 5.1 -.1 .5 .4 .1
Durable goods -2.5 16.5 -2.1 2.6 -. 4 -. 6Excluding motor vehicles -1.0 15.2 -1.6 1.4 2.9 -1.1
Nondurable goods -1.5 5.5 -1.5 -.5 .8 -.2Excluding gasoline -1.6 5.6 -1.7 -.3 .9 -.4
Services 1.6 2.2 1.2 .5 .4 .4Excluding energy 1.5 3.0 .9 .5 .4 .4
Memo:Personal saving rate
(percent) 4.7 4.9 5.3 4.9 4.6 4.0

II-14
Personal Consumption Expenditures Excluding Motor Vehicles
F * Quarterly averages
Billions of 1987 dollars
Aug. -
1989 1990 1991 1992
Personal Consumption Expenditures for Motor VehiclesBillions of 1987 dollars
* Quarterly averages
SAug
* Aug.
- -
1989
Consumer Attitudes
1990 1992
Index
1984 1986 1988
3180
3140
3100
3060
3020
2980
250
230
210
190
170
150
140
120
100
80
60
401980 1982 1990 1992
II-15
spending. In contrast, outlays for services rose 0.4 percent in
August; in particular, medical care services continued to rise, and
airline travel registered another noticeable increase.
Unlike its effect on income, the hurricane's disruption to
consumer spending in August likely was small relative to the economy
as a whole: Retail sales for all of Dade County normally account
for less than 1 percent of total retail sales. In addition, buying
in preparation for the hurricane may have provided some offset to
the lost sales at businesses shut down by the storm.
Only bits and pieces of spending data for September are
available. Sales of light vehicles have edged up thus far to about
12-3/4 million units at an annual rate. However, the increase
follows two months of sales that were 500,000 units below the
13 million unit selling pace of the second quarter, and, on balance,
growth of demand for light vehicles seems to have stalled. The
weakness has been especially pronounced in the foreign-produced
segment of the market and likely reflects last spring's increase in
the prices of Japanese imports.
Consumer sentiment deteriorated further in September. The
preliminary reading of the University of Michigan's composite index
of consumer sentiment fell nearly 2 index points in the first half
of September. Respondents' more pessimistic assessments of future
business conditions and of buying conditions for large household
durables were only partially offset by more favorable perceptions of
current personal financial situations. The Michigan index is now
6 points below its recent peak recorded in June. The Conference
Board confidence index also declined in September, with a noticeable
drop in the expectations and buying plans components.

II-16
1SALES OF AUTOMOBILES AND LIGHT TRUCKS
(Millions of units at a seasonally adjusted annual rate)
1991 1992 1992
1990 1991 Q4 Q1 Q2 July Aug. Sept. 2
Total 13.86 12.30 12.26 12.37 12.99 12.49 12.54 12.67
Autos 9.50 8.39 8.21 8.31 8.50 8.34 7.94 8.26
Light trucks 4.36 3.91 4.05 4.06 4.49 4.15 4.60 4.41
North American3 10.84 9.73 9.82 9.86 10.57 10.33 10.38 10.47
Autos 6.90 6.14 6.06 6.07 6.32 6.41 5.96 6.26
Big Three 5.82 4.99 5.00 5.02 5.17 5.10 4.61 5.02
Transplants 1.08 1.14 1.06 1.05 1.15 1.31 1.35 1.24
Light trucks 3.95 3.59 3.76 3.79 4.25 3.92 4.42 4.21
Foreign produced 3.01 2.57 2.45 2.50 2.43 2.16 2.16 2.20
Autos 2.60 2.25 2.15 2.24 2.18 1.93 1.98 2.00
Light trucks .41 .32 .29 .27 .24 .23 .17 .20
1. Components may not add to totals because of rounding.
2. North American sales are actual data for the first 20 days;
foreign produced vehicles are staff estimates.
sales of
3. Excludes some vehicles produced in Canada and Mexico that are classified
as imports by the industry.

II-17
Housing Markets
No indications exist as yet that the appreciably lower interest
rates on home mortgages that emerged this summer are producing more
than a mild pickup in housing construction. Starts rose 10 percent
in August to 1.06 million units (annual rate), their highest level
since March; single-family homebuilding accounted for most of the
gain. Permit issuance declined, however, and the level of permit
issuance in August suggests that the sample-based starts estimate
may be overstating the actual pace of housing construction.
Data on new home sales continue to be difficult to read,
because of the frequency of sizable revisions. Available figures
for August indicate a considerable dropoff from an upward-revised
July total. Given recent tendencies, one might anticipate an upward
revision to the August level in due course, but unless such a
revision was very large, it would leave sales no higher than in the
first quarter; this would, judging by historical norms, be
consistent with single-family starts of little more than 1 million
units. The most recent report from home builders surveyed in early
September also suggested no significant change in sales volume
(chart, top panel).
In the resale home market, transactions declined in August,
offsetting the gain of a month earlier. The continuing weakness in
the trade-up market helps explain the discrepancy between sales
volumes and consumer attitudes toward home buying, which have been
this positive only once before in the last thirty-five years (middle
panel). Low interest rates make this a good time to buy, according
to most respondents to the Michigan survey, but flat prices
apparently have made potential trade-up buyers reluctant to sell.
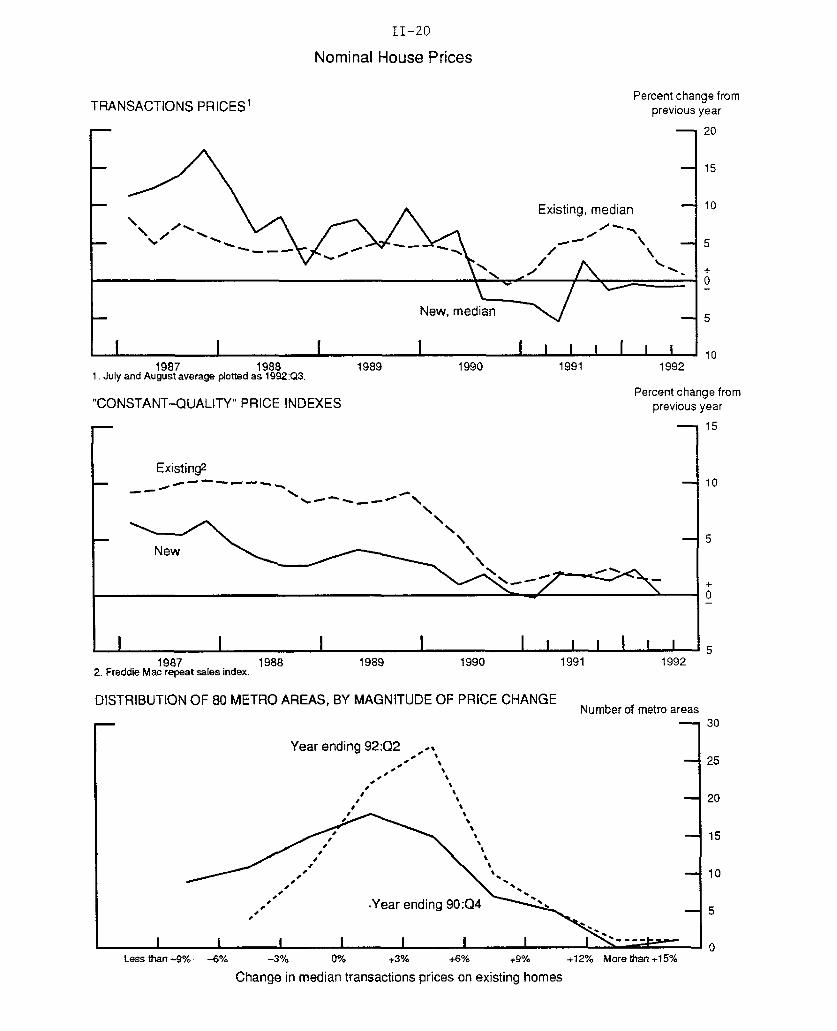
House prices, which had begun to firm, have softened again in
recent months (chart). Year-to-year changes in both transactions

II-18
PRIVATE HOUSING ACTIVITY(Millions of units; seasonally adjusted annual rates)
1991
Annual
1991
Q4 Q1 02 r Juner Julyr Augp
All unitsPermitsStarts
.951.01
1.02 1.12 1.05 1.03 1.08 1.061.10 1.26 1.14 1.15 1.12 1.24
Single-family unitsPermits .75Starts .84
SalesNew homes .51Existing homes 3.22
Multifamily unitsPermitsStarts
.20
.17
.82 .92
.92 1.06
.56 .623.23 3.41
.20 .19
.17 .20
.88 .87
.98 1.00
.56 .58 .613.43 3.35 3.45
.17 -16
.16 .15
p Preliminary. r Revised estimates.
PRIVATE HOUSING STARTS
(Seasonally adjusted annual rate)
Milions of units
1983 1984 1985 1986 1987 1988 1989 1990 1991 1992
1992
.871.06
.573.34
.19
.18

II-19
Survey Data on Housing Activity
BUILDERS' RATING OF NEW HOME SALES 1
Diffusion index (SA)- 20
- 20
40
60
I Iiiii 111111990 1991
1 The index is calculated from National Association of Homebuilders data as the proportion of respondents rating current sales as goodto excellent minus the proportion rating them as poor.
CONSUMER HOMEBUYING ATTITUDES 2
Diffusion index (SA)
I I [ I I ! I I I I1990 1991 1992
2 The homebuying attitudes index is calculated by the Survey Research Center (University of Michigan) as the proportion of respondentsrating current conditions as good minus the proportion rating such conditions as bad.
MBA PURCHASE INDEXIndex
SNot seasonally adjusted- - - - Staff seasonal factors- ----- MBA seasonal factors
1990 1991
II-20
Nominal House Prices
TRANSACTIONS PRICES 1 Percent change fromprevious year
- 20
1987 1988 1989 1990 19911. July and August average plotted as 1992:Q3.
"CONSTANT-QUALITY" PRICE INDEXES
1992
Percent change fromprevious year
- 15
Existing2
---- a. - -
1987 1988 1989 19902. Freddie Mac repeat sales index.
DISTRIBUTION OF 80 METRO AREAS, BY MAGNITUDE OF PRICE CHANGE
1991 1992
Number of metro areas
Year ending 92:02 -
-- %
-
Less than-9% -6% -3% 0% +3% +6% +9% +12% More than +15%
Change in median transactions prices on existing homes

II-21
prices (top panel) and quality-adjusted price indexes (middle) have
slowed; inflation-adjusted prices continue to decline, as they have
by most national measures since mid-1990. While the number of metro
areas posting large year-over-year declines in sales prices is down
from 1990, nominal transactions prices continued to fall during the
year ended in the second quarter in fourteen of the eighty local
markets for which data are available. Soft prices are both cause
and consequence of the recently weak demand for single-family
housing. Because expectations of future price changes are sensitive
to recent experience, flat prices resulting from weak demand further
reduce consumers' drive to buy in advance of price hikes. This
reduced urgency to buy, in turn, causes the expectation of weak
prices to be self-fulfilling.
Other forces continue to restrain demand for single-family
homes. In addition to their concerns about job security, consumers
in many local markets are finding multifamily rental housing to be
an attractive alternative to home purchase for the time being.
Persistently high vacancy rates for rental housing have put downward
pressure on rents.
Rebuilding after the hurricanes will boost residential
construction expenditures, but the effect will be slight. Most
estimates of the damage to residential structures are between
$5 billion and $10 billion. Even if most of the destroyed and
damaged units are eventually replaced, the process will take a
couple of years, and the augmentation of economywide construction
expenditures will be small in percentage terms.
Business Fixed Investment
Real outlays for producers' durable equipment, which rose
nearly 25 percent at an annual rate in the second quarter, appear to
be expanding at a much slower pace in the current quarter. For

II-22
BUSINESS CAPITAL SPENDING INDICATORS(Percent change from preceding comparable period;
based on seasonally adjusted data)
1991
Q4
1992
Q1 Q2 June July Aug.
Producers' durable equipment
Shipments of nondefense capital goodsExcluding aircraft and parts
Office and computingAll other categories
Shipments of complete aircraft1
.5
.25.0
-1.2
-3.1.1.4.0
-2.1-2.4-3.2-2.1
-23.2 65.0 -12.7 9.8 -16.3 n.a.
Sales of heavy weight trucks -1.4 7.1 5.9 .5 .8 1.2
Orders of nondefense capital goodsExcluding aircraft and parts
Office and computingAll other categories
Nonresidential structures
Construction put-in-placeOfficeOther commercialIndustrialPublic utilitiesAll other
Rotary drilling rigs in use
Footage drilled 2
MemoBusiness fixed investment 3
-4.2-10.8-10.4
2.7.8
-4.2
.6-4.9
1.52.45.2
-2.7
.2-6.73.7
-5.9.7
6.2
2.83.9
12.9-3.0
.11.8
-1.7-9.2-7.8
.43.31.1
n.a.n.a.n.a.n.a.n.a.n.a.
-9.2 -4.7 -1.4 -7.3 6.5 -.2
.7 -18.0 -4.0 -8.9 n.a. n.a.
-5.2 3.0 16.1 n.a. n.a. n.a.
1. From the Current Industrial Report "CivilMonthly data are seasonally adjusted using FRB
Aircraft and Aircraft Engines."seasonal factors constrained to
BEA quarterly seasonal factors. Quarterly data are seasonally adjusted usingBEA seasonal factors.
2. From Department of Energy. Not seasonally adjusted.3. Based on constant-dollar data; percent change, annual rate.n.a. Not available.
1992
-4.0-1.3
.4-1.8
2.54.09.22.6
-5.4-1.4-2.5-1.0
-3.7-2.93.9
-4.8
_ ___

II-23
RECENT DATA ON ORDERS AND SHIPMENTS
Office and Computing Equipment
- OrdersS- - Shipment
Billions of dollars
1987 1988 1989
Other Equipment (excluding aircraft and computers)
- Orders- - - - Shpmenwt
1990 1991 1992
Billions of dollars
A f\Aug.
I I I I Ill IIIIl ll iIll Il I I I I1 1 I198 198 198 199 199 1992 CL~ L.-
1991 19921987 1988 1989 1990

II-24
nonresidential construction, recent data suggest activity has
remained essentially flat.
Most of the second-quarter jump in equipment spending was the
result of purchases of transportation equipment, notably a
transitory bunching that doubled deliveries of aircraft to domestic
airlines. Subsequently, Boeing's domestic deliveries fell off from
the second-quarter pace. In addition, business spending on
motor vehicles likely will not repeat the solid gain posted in the
second quarter; sales of heavy trucks in July and August were about
unchanged from the pace recorded last quarter.
In contrast to this recent weakness in outlays for
transportation equipment, demand for computing equipment has
continued to advance briskly. Orders moved up further on net over
July and August; although shipments eased somewhat in August, the
average level of nominal shipments in those months was nearly
2 percent above the second-quarter average. The robust growth in
real spending on computers has been driven, in large part, by the
ongoing rapid declines in prices for personal computers and
workstations.
The demand for other types of equipment appears to have
remained lackluster. Orders dropped in August to the bottom end of
the range that has prevailed over the past year; shipments for this
broad grouping of equipment also declined after posting no change in
July. Nonetheless, because of gains in earlier months, third-
quarter spending for nondefense capital goods other than computers
5. The longer-term outlook for domestic aircraft purchasesremains negative. Over the first eight months of 1992, Boeingreceived orders from domestic carriers for just 17 aircraft,compared with orders for 464 aircraft in 1989 and 201 aircraft in1990. Moreover, several major airlines have either stretched outthe delivery period for aircraft already ordered or have cancelledoptions for future deliveries. In reponse to this evidence ofweakening demand, Boeing is cutting production of its 737s inOctober and has announced that the production rate for 757s will bescaled back next September.

II-25
and aircraft likely will post a moderate rise from the previous
quarter.
Outlays for nonresidential construction in July remained in the
fairly narrow range that has prevailed since last fall. This
overall stability, however, masks divergent patterns among the major
components of nonresidential construction. Outlays for public
utility structures as well as for hospitals and other institutional
buildings continued to trend up through July. In addition, spending
for commercial projects other than office buildings has firmed so
far this year. However, factory construction has edged lower since
the spring, and activity in the office sector has continued to
plunge; in July, outlays for office construction stood nearly
9 percent below the average for the second quarter.
The erosion of prices for office buildings and other commercial
properties does not yet appear to have ended, possibly because
market participants have been disappointed by the still sluggish
demand for commercial space. According to the Russell-NCREIF index,
the national average of nominal appraised values for office
properties fell another 5-1/2 percent in the second quarter, while
PRICES OF COMMERCIAL BUILDINGS(Percent change, national average)
1991 19921989 1990 1991 Q4 Q1 Q2
Russell-NCREIF indexOffice buildings -2.9 -8.3 -17.1 -10.0 -1.7 -5.4Retail stores 3.6 -.4 -8.3 -4.9 -2.0 -2.1Warehouses 2.7 -4.2 -8.7 -4.4 -1.8 -2.2
National Real EstateIndex
Office buildings 1.3 -4.1 -7.5 -2.8 -2.2 NARetail stores 2.6 -2.0 -5.8 -2.7 -1.0 NAWarehouses 3.1 -.1 -7.3 -2.8 -1.3 NA
1. Percent change over four quarters of year shown.

II-26
NONRESIDENTIAL CONSTRUCTION AND SELECTED INDICATORS*(Index, Dec. 1982 = 100, ratio scale)
Total Building
SConstruction (C)--.---- Permits (P), Contracts (CN), or
New commitments (NC)
1980 1982 1984 1986 1988 1990 1992
Office-- 175
g^
i I I I I I I I1984 1986 1988 1990
Industrial
(NC)
l
/
-s
/ '"* ' ' " ' *> " , /* "" " ' ^^ ^ '1. \ -^ ^
I I I I i I r
Other Commercial
1984 1986 1988 1990 1992
Institutional
(CN), ,4
'Si
I I I I I I I I1984 1986 1988 1990 1992 1984 1986 1988 1990 1992
*Six-month moving average for all series shown. For contracts, total only includes private, while individual sectors Include private and public.New comrrtments are the sum of.pemits and contracts.
I ... I I I I
II-27
the values of both retail properties and warehouses dropped roughly
2 percent. Moreover, the FDIC's latest Survey of Real Estate
reaches similar conclusions. Nationwide, 36 percent of the senior
banking examiners and liquidators responding to the survey believed
that prices of commercial real estate had fallen between April and
July, compared with just 5 percent that believed these prices had
risen.
Contracts for total nonresidential building point to a
continuation of essentially flat spending in the near term (chart).
Among the components of nonresidential construction, the leading
indicators suggest a further shrinkage of activity in the office
sector, offset by limited gains in other sectors. These indicators,
however, do not take account of the rebuilding activity likely to
result from Hurricane Andrew. The sketchy estimates now available
suggest that damage to nonresidential structures (including offshore
drilling facilities) could total $2 billion to $3 billion. As with
residential reconstruction, the amount and timing of repairs are
uncertain, but rebuilding could provide a small, though perceptible,
boost to nonresidential construction in coming quarters.
Business Inventories
After a large increase in June, business inventories rose only
a little in July and, in most sectors, inventory-sales ratios at the
end of July were near the lows of their recent ranges.
In manufacturing, inventories at aircraft producers fell
further in July, a continuation of a year-long trend that likely
reflects the drop in civilian aircraft orders and the shrinkage of
6. Separate data on commercial property values published in theNational Real Estate Index (NREI) also display further declinesin prices earlier this year. The NREI is based on actualtransactions prices reported by roughly 200 of the largestparticipants in the commercial real estate market. This index,published with a considerable lag, is currently available onlythrough the first quarter of 1992.

II-28
CHANGES IN MANUFACTURING AND TRADE INVENTORIES
(Billions of dollars at annual rates;based on seasonally adjusted data)
1991 1992 1992
Q4 Q1 Q2 May June July
Current-coat basis
Total 23.1 -7.9 22.7 -7.2 46.1 11.6
Excluding auto dealers 22.1 -13.7 16.1 -2.4 44.4 16.7Manufacturing -14.0 -11.2 -1.5 13.0 -5.2 .7
Excluding aircraft -7.0 -7.1 6.3 16.3 2.5 9.1Wholesale 19.9 -1.2 6.1 -12.4 33.7 -6.1Retail 17.3 4.5 18.1 -7.7 17.6 17.0
Automotive 1.1 5.8 6.6 -4.8 1.6 -5.1Excluding auto dealers 16.2 -1.3 11.5 -3.0 15.9 22.1
Constant-dollar basis
Total 16.2 -13.2 7.4 -23.0 34.1 7.9Excluding auto dealers 17.0 -18.0 1.9 -16.0 29.5 15.3Manufacturing -11.3 -8.7 -6.5 4.4 -6.5 5.3Wholesale 15.2 -4.9 2.1 -13.8 25.2 -7.5Retail 12.3 .5 11.8 -13.7 15.4 10.1Automotive -.9 4.8 5.5 -7.1 4.6 -7.3
Excluding auto dealers 13.1 -4.4 6.3 -6.6 10.7 17.5
INVENTORIES RELATIVE TO SALES 1
(Months supply; based on seasonally adjusted data)
1991 1992 1992
Q4 Q1 Q2 May June July
Current-cost basis
Total 1.54 1.52 1.51 1.52 1.50 1.49Excluding auto dealers 1.52 1.50 1.49 1.49 1.47 1.47
Manufacturing 1.62 1.62 1.57 1.59 1.55 1.55Excluding aircraft 1.45 1.45 1.41 1.42 1.39 1.39
Wholesale 1.37 1.36 1.36 1.36 1.35 1.33Retail 1.58 1.54 1.57 1.55 1.57 1.56
Automotive 1.87 1.95 1.90 1.90 1.90 1.88Excluding auto dealers 1.50 1.46 1.48 1.46 1.48 1.47
1. Ratio of end of period inventories to average monthly sales for the period.

II-29
defense spending. Outside of the aircraft industry, manufacturing
stocks rose moderately in current-cost terms in July after a small
increase in the second quarter. The low investment in factory
inventories in recent months has kept stock-shipments ratios for
many industries at historically low levels. In July, the ratio for
all manufacturing on a current-cost basis was unchanged at 1.55
months.
In the trade sector, wholesale inventories were trimmed in July
after a sizable runup in June. But the July liquidation was
concentrated in just a few categories (machinery and raw farm
products in particular), while the inventory position of other types
of wholesale distributors did not materially change. Wholesale
trade remains the one major sector in which the stock-sales ratio
still is on the high side of its historical range, and further
paring appears likely in the months ahead. In retail trade, non-
auto inventories expanded at a substantial pace in July but were
accompanied by a sharp rebound in sales that lowered the inventory-
sales ratio at most types of stores. However, given the renewed
softness in consumer sentiment in recent months and the still-
sluggish pace of income growth, some retailers may view even these
recent ratios as being uncomfortably high.
The net effect of Hurricane Andrew on third-quarter nonfarm
inventory investment may not be so large as some initial reports
suggested. Petroleum production and distribution facilities
suffered significant damage from the hurricane, and in the two weeks
that ended September 4, crude oil stocks were drawn down nearly
6 million barrels (a 1.7 percent decline) while inventories of
refined products fell 16 million barrels (also a 1.7 percent

II-30
RATIO OF INVENTORIES TO SALES(Current-cost data)
Ratio2.1
Manufacturing
1.9
," ' :" " ,', ,'\ - 1.5
Excluding aircraft ''. , ' '";/ -1",
1 I I I I I I I I I I 1.3
1980 1982 1984 1986 1988 1990 1992
Ratio1.5
Wholesale
1.4
July- 1.3
- 1.2
1980 1982 1984 1986 1988 1990 1992
Ratio Ratio2.7 - 1.7
Retail-;
, , , ' I , G.A.F.2.5 - , ' , , "* ', #1 " - 1.6'* > J'u, " ,'" , .' , , , '
2Ixing aut JL 1, 42.3 - 1.5
2.1 E Excluding auto 1.4
1980 1982 1984 1986 1988 1990 1992

II-31
decline). However, more recent reports indicate that the stocks
are being replenished quickly. Gasoline inventories, for example,
rose about 4.3 million barrels during the two weeks ending September
18, restoring more than one-half of the drawdown during the
preceding two weeks.
Federal Sector
The FY1992 budget deficit is likely be smaller than either
CBO's August estimate of $314 billion or OMB's July estimate of
$334 billion. Outlays over the past few months have been lower than
either agency had projected, while the incoming receipts data
generally have been in line with CBO's expectations, but stronger
than OMB's.
Federal outlays in July and August were about 6 percent below
the level of July-August 1991 on a unified budget basis, according
to the monthly Treasury statements. The decrease largely reflected
the stalemate in funding for deposit insurance. Nonetheless, for
the year to date, expenditures are still up about 5 percent from
last year, primarily because of higher spending on Social Security,
Medicare, Medicaid, and income security programs. Year-to-date
defense expenditures (adjusted for contributions to the Defense
Cooperation Account) are down about 5 percent, despite a temporary
jump in the past two months.
Receipts in July and August were only slightly above the levels
of a year earlier. Nonetheless, the total for the first eleven
months of FY1992 remains 3 percent above the comparable period of
FY1991; social insurance receipts are up about 5 percent, while
7. Most of the petroleum inventory in the nonfarm sector is heldby businesses outside of manufacturing and trade--pipelines,utilities, transportation companies, and bulk terminals--and is notreported in the monthly Census surveys. The current-quarterpetroleum inventory changes in GDP are estimated by BEA, based oninformation from the Department of Energy and other industrysources. The petroleum figures cited in this paragraph are notseasonally adjusted.

II-32
FEDERAL GOVERNMENT OUTLAYS AND RECEIPTS(Unified basis, billions of dollars, except where otherwise noted)
Fiscal year through AugustJuly and August Dollar Percent
1991 1992 FY1991 FY1992 change change
OutlaysDeposit insurance (DI)Defense Cooperation
account (DCA)
Outlays excluding DI andNational defenseNet interestSocial securityMedicare and healthIncome securityOther
ReceiptsPersonal income taxesSocial insurance taxesCorporate income taxesOther
Deficit(+)excluding DI and DCA
239.5 22519.2 -3
-3.5
DCA 223.855.433.645.332.130.227.3
155.073.061.93.1
17.2
1207.5 1268.5 61.049.9 5.7 -44.2
.0 -42.4
228.851.534.048.335.632.926.5
157.369.864.84.3
18.3
84.5 67.868.8 71.4
1200.0292.9178.4246.4160.4159.5162.5
944.9419.7362.0
79.583.8
5.1-88.6
-5.2 37.2 -87.7
1267.9277.3184.2263.4189.0183.9170.1
972.9418.1380.3
82.392.0
67.9-15.65.8
17.028.624.47.6
28.0-1.618.32.88.2
5.7-5.33.36.9
17.815.4.7
3.0-0.45.13.59.8
262.6 295.6 33.0 12.6255.2 295.1 40.0 15.7
Note: Components may not sum to totals because of rounding.

II-33
personal income taxes are little changed from a year earlier, in
part because of the March cut in withholding rates. More recently,
daily data indicate that corporate declarations and payments of
estimated individual income taxes were higher in September than they
were around the last quarterly due date in June; the new regulations
for payment of individual nonwithheld taxes account for only part of
the increase.
Legislation providing $11 billion in disaster relief for the
victims of the hurricanes has been signed by the President. Roughly
two-thirds of the total is for grants and other direct assistance,
and the rest is for loans and loan guarantees. Most of the
resulting increase in the deficit will be incurred in FY1993.
Because the funding is designated as being for emergency purposes,
it does not violate the budget agreement.
Congressional action on the appropriations bills has
accelerated with the approach of the new fiscal year. Of the
thirteen regular appropriations bills, one-third have been sent to
the President for signature; conference reports have been completed
on another third. In total, appropriations are about $10 billion
below the level requested by the President, with virtually all of
the shortfall in defense. Meanwhile, the Senate has passed a wide-
ranging tax bill; among other things, it provides funding for
enterprise zones, extends several expiring tax provisions, and
modifies the luxury taxes that were enacted in 1990. The House
passed a much narrower tax bill earlier this year.
State and Local Government Sector
Spending by state and local governments rose in the early part
of the third quarter. In particular, employment on average jumped
87,000 in July and August, the largest two-month advance since the
fall of 1986. However, most of the increase was in the federally

II-34
STATE AND LOCAL SECTOR
OPERATING AND CAPITAL ACCOUNTS SURPLUS/DEFICIT*Billions of dollars
NAt
.I i I I I 1 I I I I I I I, ] I I IiiiliitIliiiliii1974 1977 1980
*Excludes social Insurance funds.
MEDICAID TRANSFER PAYMENTS*F-==
1985 1986 1987 1988
'1992 is percent change from 1991:Q4 to 1992:02 at an annual rate.
OWN-SOURCE REVENUE*
_I _L IL _L
1983 1986 1989 1992
Percent change, Q4 to Q4*
1989 1990i_1
1991
Percent change, Q4 to Q4**
1985 1986 1987 1988 1989*Personal, sales, property and corporate taxes and fees."1992 is percent change from 1991:Q4 to 1992:02 at an annual rate.
1990 1991 1992
09-30-92
t-F \

II-35
funded program for summer jobs and should have been reversed in
September when school resumed.
Real spending on public construction projects also rose in
July, but it stood nearly 2 percent below the level in the second
quarter. Spending is expected to be boosted in coming months by
rebuilding in Florida, Louisiana, and Hawaii in the aftermath of the
recent hurricanes; however, because the federal government will pick
up most of the tab. the fiscal position of these governments will
not be greatly affected.
In early September--two months after the start of California's
fiscal year--state officials agreed on a budget for FY1993 that
included wide-ranging reductions in outlays, particularly those for
welfare, education, and aid to local governments. New tax measures,
which last year generated a $6-1/2 billion increase in revenues,
were not included. Because of a certain amount of legerdemain and
because revenues continue to come in below expectations, the outlook
for California's fiscal position is still shaky.
The overall fiscal position of state and local governments has
improved only slightly in the past eighteen months (chart) despite
numerous budget cuts and tax hikes. Efforts to deal effectively
with the fiscal erosion have been stymied by the combined effects of
surging medicaid costs and weak tax receipts. Much of the increase
in medicaid expenditures by states in recent years reflects the
expansion of federal mandates, especially those for children and
pregnant women. On the receipts side, increased corporate profits
have supported government revenues this year. Total revenues grew
at a 6.6 percent annual rate in the first half of this year, up from
a 5.2 percent rate for 1991.

II-36
RECENT CHANGES IN CONSUMER PRICES(Percent change; based on seasonally adjusted data) 1
RelativeimportanceDec. 1991
1991
1990 1991
1992
Q4 Q1 Q2 July Aug.
----- Annual rate------ -Monthly rate-
All items 2
FoodEnergyAll items less food
and energyCommoditiesServices
Memorandum:
CPI-W3
100.016.07.4
76.624.851.9
100.0
6.15.3
18.1
3.1 3.2 3.5 2.61.9 2.7 1.5 1.27.4 3.6 -6.9 12.5
5.2 4.4 3.13.4 4.0 .66.0 4.6 4.3
2.8 3.3
4.8 2.85.3 2.14.8 2.9
3.0 2.7
1. Changes are from final month2. Official index for all urban3. Index for urban wage earners
of preceding period to final month of periodconsumers.and clerical workers.
indicated.
RECENT CHANGES IN PRODUCER PRICES(Percent change; based on seasonally adjusted data)1
Relative 1991 1992 1992importanceDec. 1991 1990 1991 Q4 Q1 Q2 July Aug.
----- Annual rate------ -Monthly rate-
Finished goods 100.0 5.7 -.1 1.0 1.0 3.0 .1 .1Consumer foods 21.9 2.6 -1.5 -1.0 .3 -1.6 .0 .7Consumer energy 13.8 30.7 -9.6 -.5 -7.0 16.1 -.4 .1Other finished goods 64.2 3.5 3.1 2.1 3.7 1.8 .2 -.1
Consumer goods 39.5 3.7 3.4 2.4 3.6 2.4 .2 -.1Capital equipment 24.7 3.4 2.5 1.9 3.5 .9 .2 .1
Intermediate materials 2 95.3 4.6 -2.7 -1.7 .0 5.0 .1 .0Excluding food and energy 81.7 1.9 -.8 .0 1.7 1.3 .2 .2
Crude food materials 41.2 -4.2 -5.8 -4.9 11.8 1.5 -1.7 -.4Crude energy 40.0 19.1 -16.6 5.3 -26.6 44.8 1.1 .2Other crude materials 18.7 .6 -7.6 -5.9 15.0 3.5 1.3 .1
1. Changes are from final month of preceding2. Excludes materials for food manufacturing
period to final month of period indicated.and animal feeds.
1992
.2 .4

II-37
Prices
Recent news on prices has continued to be quite favorable. In
August--for the fourth month in a row--the CPI for items other than
food and energy rose just 0.2 percent. With these small increases,
the twelve-month change in this measure was 3.5 percent in August,
down a percentage point from a year earlier. The recent string of
0.2 percent monthly increases, however, was probably below the
underlying trend in inflation, just as the outsized increases
earlier in the year were above the underlying trend.
The deceleration in prices over the past year, in the context
of high unemployment, appears reasonably consistent with historical
relations. A rough rule of thumb--drawn from postwar experience--is
that roughly 2 percentage-point-years of "excess" unemployment will
squeeze out 1 percentage point of inflation, yielding a historical
sacrifice ratio of about 2. In the current episode, the sacrifice
ratio to date is just below 2.
Overall, consumer prices rose 0.3 percent in August, pushed up
by a jump in food prices. In large measure, this jump reflected a
surge in fruit and vegetable prices, which--even after the August
rise--were only 2-1/2 percent above the level of a year earlier.
Recent developments in the farm sector, described later, suggest
that little upward pressure on prices is in store in coming months.
Consumer energy prices edged down in August, as the price of
gasoline partially reversed a runup earlier in the summer. Crude
oil prices declined between June and August, and these lower costs
reached the retail level last month. Although crude prices in
8. Based on the staff estimate of the natural rate ofunemployment, the economy has experienced 2-1/4 percentage-point-years of excess unemployment since the unemployment rate first movedabove the natural rate in the summer of 1990. Since that time, thetwelve-month change in the CPI for items other than food and energyhas moved down about 1-1/2 percentage points, implying a sacrificeratio of slightly more than 1-1/2.

II-38
COMMODITY PRICE MEASURES *
- Journal of Commerce Index, total- Journal of Commerce Index, metals
Ratio scale, index(1980=100)
"e
ftt29- 4 '"' l '/,/'
SI I I -
1983 1984 1985 19861 I 1L98 1989 190 1991 1 92 19 I751987 1988 1989 1990 1991 1992 1993
Total
99
97Aug Sep
1992
Metas 105
104
102
100Aug Sep
1992
CRB Spot Industrials
Ratio scale, index(1967=100)
CRB Industrials
-- 260
Aug Sep1992
Sep 28
I I I I L I I I I T I I I l I I1983 1984 1985 1986 1987 1988 1989 1990 1991 1992 199?
CRB Futures
Ratio scale, index(1967=100)
SWeekly data Tuesdays; Joumal of Conmerce dat mothly before 1985
CRB Futures
Dotted lines indicate week oflast Greenbook.
I
r i i

II-39
September have increased on balance, private survey data for the9
month suggest that retail gasoline prices have not yet moved up.
In contrast to gasoline prices, the index for residential natural
gas rose for a third consecutive month; wellhead prices have firmed
in recent months as the persistent supply overhang appears to be
diminishing.
For goods other than food and energy, prices at retail were up
just 0.2 percent in August; prices of services other than energy
rose 0.3 percent. Declines in airfares and auto finance costs held
down the services index, and residential and owners' equivalent rent
remained subdued, as they have since April. In contrast, the index
for tuition rose substantially as increases for the 1992-93 academic
year began to get into the CPI.
In a reflection of excess capacity and weak demand for many
types of business equipment, prices of capital goods also have
increased at a modest pace recently. Over the past twelve months,
the PPI for capital goods rose just 1-3/4 percent, about
1 percentage point below the pace in the preceding twelve-month
period. Of course, capital goods prices have been held down by the
continued rapid decline in computer prices. But even with computers
excluded, prices of business equipment have risen just 2-1/2 percent
over the past twelve months, also about a percentage point below the
pace in the preceding year.
Spot measures of industrial commodity prices have, on balance,
edged off since the last Greenbook. However, prices of some items
have been boosted by Hurricane Andrew. Spot prices of natural gas
at the wellhead have risen significantly since the storm, reflecting
9. Beginning in November, federal clean air rules require thatonly oxygenated fuel be sold in the thirty-nine metropolitan areaswith high emissions of carbon monoxide. Industry analysts estimatethat this reformulation boosts refiners' costs by 3 to 5 cents pergallon later this year. These cost increases will boost retailprices by a similar amount during the fall.

II-40
PRICE INDEXES FOR COMMODITIES AND MATERIALS 1
vatnnE-
Percent change219921992 'Memo
To Aug. 113 YearAug. to earlier
990 1993 date t ate31990 1991 11 date to date
1. PPI for crude materials4 Aug. 6.0 -11.6 n.a. 1.8
la. Foods and feedsla. Energylb. Excluding food and energyIc. Excluding food and energy,
seasonally adjusted
2. Commodity Research Bureau2a. Futures prices2b. Industrial spot prices
3. Journal of Commerce industrials3a. Metals
4. Dow-Jones Spot
5. IMF commodity index5a. Metals5b. Nonfood agriculture
6. Economist (U.S. dollar index)6a. Industrials
Aug.Aug.Aug.
Aug.
Sep. 29Sep. 29
-4.219.1
.6
-5.8-16.6-7.6
.7 -7.6
-2.7 -6.5.6 -11.3
Sep. 29 -2.4 -7.2Sep. 29 -3.9 -7.1
Sep. 29
Aug.Aug.Aug.
-1.7 -12.1
-5.2-1.1-3.5
.7-8.91.3
Sep. 22 -4.4 -9.1Sep. 22 -3.2 -14.9
2.12.96.4
5.9
-3.96.1
5.77.6
6.3
-1.28.81.7
n.a.n.an.a.
n.a.
-.2-1.1
.0-1.5
-. 6
n.a.n,a.n.a.
4.1 -3.610.5 -4.8
1. Not seasonally adjusted.2. Change is measured to end of period, from3. Week of the August Greenbook.4. Monthly observations. IMF index includes
n.a. Not available
last observation of previous period.
items not shown separately.
Index Weights
Energy
O
PPI for crude materials
CRB futures
CRB industrials
Journal of Commerce index
Dow-Jones
IMF index
Economist
Food Commodities
0Precious Metals
OOthers
I
41 41 1 18
14 57 14 14
100
12 88
58 17 25
5 45
50 50
: Forest products, industial metals, and other industrial matenals
1.01.63.6
3.5
-7.83.0
2.43.9
-. 9
.25.9
.0
-. 93.4

II-41
Daily Spot and Posted Prices of West Texas Intermediate
Dollars per barrel
Spot
r;r r^ ':It
I'
'I Posted
Oct Nov Dec Jan Feb Mar Apr May June July Aug Sep
1. Posted prices are evaluated as the mean of the range listed In the Wall Street Journal.
MONTHLY AVERAGE PRICES-WEST TEXAS INTERMEDIATE
Year and Month Posted Spot
1991October 21.96 23.23November 21.40 22.47December 18.47 19.521992January 17.63 18.82February 17.72 19.00March 17.81 18.92April 19.20 20.24May 19.90 20.94June 21.46 22.38July 20.77 21.76August 20.32 21.36September1 20.84 21.91
1. Price through September 29.

II-42
damage to production facilities along the gulf coast.1 0 Plywood
and lumber prices posted increases that have ranged from 5 percent
to 15 percent, as additional demand was triggered by the hurricane.
Even before the storm, lean supplies were placing upward pressure on
plywood prices.
The spot and futures prices of most agricultural commodities
have continued to be restrained in recent weeks by the prospect of
ample supplies. The condition of the major field crops appears to
have been well-maintained through late summer, and a large harvest
is anticipated. In addition, livestock supplies still are
expanding; according to the Department of Agriculture's latest
forecast, the combined output of meat and poultry is expected to
rise an additional 2 percent in 1993, after a gain of more than
4 percent this year. In Florida, hurricane damage to some specialty
crops--such as limes, avocados, and mangoes--was followed in short
order by large price increases; however, the availability of
supplies from alternative sources probably will limit the magnitude
and duration of those increases.
10. Spot prices are now $2.73 per million BTU, up about $0.80 fromthe pre-hurricane level.

DOMESTIC FINANCIALDEVELOPMENTS ~-~------~-~

III-T-1 1SELECTED FINANCIAL MARKET QUOTATIONS
(percent)....................................................................................
1992 1992 1992 Change from:
FOMC FOMCAug 18 Sept 4 Sept 29 Sept 4 Aug 18
Short-term rates
Federal funds 2
Treasury bills 3
3-month6-month1-year
Commercial paper1-month3-month
Large negotiable CDs 3
1-month3-month6-month
Eurodollar1-month3-month
deposits4
Bank prime rate
3.27 3.19 3.15
3.073.133.22
2.922.963.06
-. 04 -. 12
2.732.852.95
-.19-.11-. 11
3.38 3.22 3.313.37 3.22 3.26
3.263.273.33
3.063.063.11
3.113.123.13
3.25 3.31 3.063.31 3.31 3.13
6.00 6.00 6.00
-. 34-.28-. 27
.09 -. 07
.04 -.11
.05 -. 15
.06 -. 15
.02 -. 20
-. 25 -. 19- .18 -.18
.00 .00
Intermediate- and long-term rates
U.S. Treasury (constant maturity)3-year10-year30-year
Municipal revenue(Bond Buyer)
Corporate--A utilityrecently offered
4.566.487.33
4.386.407.29
4.316.377.36
6.20 6.31 6.49
8.10 8.06 8.17
-. 07 -.25-. 03 -. 11
.07 .03
.18 .29
.11 .07
Home mortgage rates 6
FHLMC 30-yr. FRM 7.96 7.84 8.02FHLMC 1-yr. ARM 5.30 5.15 5.02
...................................................................
1989 1992
Record Lows FOMChighs Date Jan 3 Aug 18 Sept 29
.18 .06-.13 -.28
Percent change from:-------------------.------
Record 1989 FOMChighs lows Aug 18----------------.---------
Stock prices
Dow-Jones Industrial 3413.21 6/1/92 2144.64 3329.48 3266.80 -4.29 52.32 -1.88NYSE Composite 233.73 9/14/92 154.00 231.90 228.90 -2.07 48.64 -1.29AMEX Composite 418.99 2/12/92 305.24 386.81 375.61 -10.35 23.05 -2.90NASDAQ (OTC) A44.92 2/12/92 378.56 570.87 577.63 -10.43 52.59 1.18Wilshire 4121.28 1/15/92 2718.59 4053.95 4013.05 -2.63 47.62 1-.01
........................................................................................
I/ One-day quotes except as noted.2/ Average for two-week reserve maintenance period
closest to date shown. Last observation is averageto date for maintenance period endingSeptember 30. 1992.
3/ Secondary market.41 Bid rates for Eurodollar
deposits at 11 a.m. London time.5/ Based on one-day Thursday quotes
and futures market index changes.6/ Quotes for week ending
Friday previous to date shown.

Selected Interest Rates*
Statement Week Averages
1989 1990 1991 1992Long-Term Percent
12
10
8
6
4
12
11
10
8
Prme Rate
3-month T-B i i
Diount Rat
i8 8/271!
SI I jI
l/ 9/17 929992 Percnt
S8.4
Corpoort Bond
-. (Wkty)Yor T
*, .. *
Pr0Ye ry T xo -Ra
8/18 8/27 9/81992
8.2
8.0
7.8
7.6
S7,.29/17 9/29
Short-Term
1989 1990 1991 1992
* Friday weeks are potted through September 25. statement weeks through September 23.
DOMESTIC FINANCIAL DEVELOPMENTS
Short-term interest rates are generally down 10 to 30 basis
points since the August FOMC meeting, in keeping with the quarter
point easing of the federal funds rate that came on the heels of the
weak September 4 employment report. In contrast, long-term rates
have registered mixed changes over the intermeeting period.
Declines in bond yields around the release of the employment report
have since been reversed, amid concerns about fiscal prospects in
the wake of the election and possible shifts in the demand for U.S.
securities in an unsettled exchange rate environment.
The equity markets rallied sharply in early September with the
fall in interest rates, and several major indexes touched all-time
highs. Most indexes have more than retraced this ground since then,
and they now stand about 1 to 2 percent below mid-August levels.
Prices of most financial stocks, including banks, were weak, as
further signs of a faltering recovery heightened concern about
credit losses.
Debt growth by nonfederal sectors, though still weak, appears
to have picked up a bit in the third quarter. In the business
sector, commercial paper borrowing jumped in August and early
September, while business loans at banks likely posted a gain in
September for the first time in nearly a year. Corporations
continued to issue bonds in volume in the public markets, but
largely for debt refinancing. In the household sector, a firming in
real estate borrowing may be in the offing in September as the
summer surge in mortgage applications progresses to closing.
Consumer credit outstanding, however, probably declined further in
August.
The broad monetary aggregates resumed expanding in August and
continued to grow in September. The liquid components accounted for

III-2
MONETARY AGGREGATES(based on seasonally adjusted data unless otherwise noted)
Growth1992 1992 1992 1992 1992 Q4 91-
19911 Q2 Q3pe Jul Aug Sep pe Sep 92pe
------------ Percent change at annual rates---------------------
8.0 9.82.8 0.31.2 -1.3
101/2 11.3 16.00 -0.9 3.1- -1.1 2.7
Levels------------ Percent change at annual rates------------ bil. $
Aug 92
Selected components
4. Ml-A
5. Currency6. Demand deposits
7. Other checkable deposits
8. M2 minus M12
9. Overnight RPs and Eurodollars, NSA10. General purpose and broker/dealer money
market mutual fund shares11. Commercial banks12. Savings deposits (including MMDAs)13. Small time deposits14. Thrift institutions15. Savings deposits (including MMDAs)16. Small time deposits
17. M3 minus M23
Large time depositsAt commercial banks, net
4
At thrift institutionsInstitution-only money market
mutual fund shares
Term RPs, NSATerm Eurodollars, NSA
5.6 9.1 11 14.7 16.9
8.4 5.8 11 12.2 14.23.4 12.5 11% 18.1 19.4
12.4 11.0 94 6.1 14.1
1.1 -3.1 -3% -5.6 -1.9
-6.9 -27.1 16k 8.3 57.6
3.97.1
13.31.1
-6.99.3
-16.8
-4.80.5
12.0-13.2
-6.718.9
-29.4
-5.7 -9.1
-11.7-5.1
-31.7
33.4-22.0-11.0
-18.9-14.8
-37.0
20.16.1
-18.4
-11.5-2.19.3
-17.0-7.35.2
-19.6
-2 -1.9
-17h -20.6-17 -23.6-17k -5.2
41k 48.1-3% -23.0
-20% -11.3
21 610.9
17 282.325 320.7
13 362.7
-3 2496.0
-35 76.4
-5.8-0.613.6
-19.0-5.9
8.9-21.7
349.11259.5
724.4535.2811.9421.1390.8
0.9 -7 702.7
-16.1-15.4-22.4
54.95.0
-22.8
-16 383.3-18 315.0-5 68.2
217.271.951.6
----- Average monthly change in billions of dollars----MEMORANDA:
5
24. Managed liabilities at commercialbanks (25+26)
25. Large time deposits, gross26. Nondeposit funds
27. Net due to related foreigninstitutions
28. Other6
29. U.S. government deposits at commercialbanks
7
-0.6 -2.8 -3-0.2 -4.8 -3-0.5 2.1 0
-3.7-6.42.7
-4.1-1.5-2.6
0.4 5.0 -1 2.1 -4.0
-0.9 -3.0 1 0.6 1.4
0.2 1.3 0 -3.9 10.7
1. Amounts shown are from fourth quarter to fourth quarter.2. Nontransactions M2 is seasonally adjusted as a whole.3. The non-M2 component of M3 is seasonally adjusted as a whole.4. Net of large denomination time deposits held by money market mutual funds and thrift institutions.5. Dollar amounts shown under memoranda are calculated on an end-month-of-quarter basis.6. Consists of borrowing from other than commercial banks in the form of federal funds purchased, securities
sold under agreements to repurchase, and other liabilities for borrowed money (including borrowing from theFederal Reserve and unaffiliated foreign banks, loan RPs and other minor items). Data are partially estimat'
7. Consists of Treasury demand deposits and note balances at commercial banks.pe - preliminary estimate
1. Ml2. M2
3. M3
681.1384.5296.6
-1 59.81 236.8
-7 32.6

II-3
all the pick up, and runoffs in both large and consumer time
deposits showed no signs of abating.
Monetary Aggregates and Bank Credit
M2 grew at a 3 percent annual rate in August and appears to
have maintained that pace in September. M3 also turned up in
August, increasing at a 2-3/4 percent pace, but slowed somewhat
during September. Both aggregates, however, remain well below their
annual target ranges.
The increase in M2 in September was fully accounted for by
growth in M1, as the non-M1 component contracted at a more rapid
pace in September. Currency growth remains strong, reportedly
because of larger shipments to Latin America, Eastern Europe, and
the former Soviet republics. Growth rates for liquid deposits rose
even though sizable reductions in deposit rates have tempered the
declines in opportunity costs from recent reductions in yields on
market instruments. During most of 1991, market rates fell
considerably more rapidly than deposit rates; this year,
depositories have adjusted their rates more promptly, thus
attenuating the stimulative effect of policy easings on M2 growth.
Demand deposits were likely boosted by increased compensating
balances, as firms were induced to maintain higher balances by the
lagged adjustment of the earnings credit to falling short-term
interest rates. The pickup in mortgage refinancing also contributed
to higher growth in demand deposits as well as MMDAs.
With their rates remaining relatively unattractive, small
time deposits continued to run off. M2 money funds also declined
further in September, as their average yield fell below 3 percent.
Inflows to stock and bond mutual funds dropped off in August to
$14.5 billion from July's record $21 billion pace. Inflows
reportedly were heavy in September, especially at bond funds.

III-4
COMMERCIAL BANK CREDIT AND SHORT- AND INTERMEDIATE-TERM BUSINESS CREDIT 1(Percentage change at annual rate, based on seasonally adjusted data)
1990 Level,Category Dec. to 1992 1992 1992 1992 1992 bil.$
1991 Q1 Q2 Jun. Jul. Aug. 1992Dec. Aug.
Commercial bank credit
1. Total loans and securities at banks 3.9 2.1 2.1 1.7 -0.1 5.4 2,882.2
2. Securities 17.6 6.7 14.7 11.3 14.5 22.8 804.7
3. U.S. government 23.8 11.3 19.7 17.6 14.2 28.7 629.8
4. Other 1.4 -7.9 -2.1 -10.4 14.6 2.8 174.9
5. Loans -0.2 0.5 -2.4 -1.8 -5.5 -1.3 2,077.5
6. Business -2.9 -6.5 -7.3 -8.0 -5.2 -3.8 593.9
7. Real estate 2.9 2.6 0.5 -1.5 -2.5 -1.5 878.5
8. Consumer -3.9 -0.9 -2.2 1.0 -1.0 -5.0 357.7
9. Security 21.3 44.7 25.7 44.3 -65.0 37.3 63.0
10. Other -2.7 3.0 -9.1 -3.9 -9.1 2.6 184.4
Short- and intermediate-term business credit
11. Business loans net of bankers -2.5 -6.7 -7.0 -7.3 -6.5 -3.7 587.1acceptances
12. Loans at foreign branches 2 -1.6 -40.9 26.3 84.6 44.4 -42.9 24.3
13. Sum of lines 11 and 12 -2.5 -8.0 -5.8 -3.7 -4.7 -5.1 611.5
14. Commercial paper issued by -10.4 14.9 -3.9 6.0 4.3 15.3 142.7nonfinancial firms
15. Sum of lines 13 and 14 -4.0 -4.0 -5.4 -1.9 -3.2 -1.3 754.1
16. Bankers acceptances, U.S. trade- 57.3 22.9 -27.3 -37.8 -4.9 -29.4 23.9related 3,4
17. Finance company loans to business4 1.4 -1.9 -1.6 5.2 9.2 n.a. 301.055
18. Total (sum of lines 15, 16, and 17) -1.5 -3.9 -4.9 -1.0 0.3 n.a. 1,080.4
1. Average of Wednesdays. Data are adjusted for breaks caused by reclassifications.2. Loans at foreign branches are loans made to U.S. firms by foreign branches of domestically chartered banks.3. Consists of acceptances that finance U.S. imports, U.S. exports, and domestic shipment and storage of goods.4. Based on average of data for current and preceding ends of month.
5. July 1992.n.a.--Not available.

III-5
The growth of M3 reflected the expansion of M2. On balance,
the non-M2 components fell as large time deposits continued to
contract, and the rapid rates of growth of institution-only money
funds moderated.
Bank credit growth rebounded to a 5-1/2 percent annual rate in
August, the strongest advance since April. Loans contracted for the
fourth consecutive month in August, but more slowly than previously,
while acquisitions of securities strengthened. Preliminary data for
September point to growth in bank credit about in line with that of
August, as a resumption of growth in bank loans appears to be offset
by a slowdown in the growth of securities.
Securities growth at banks during August was somewhat distorted
by the warrants issued by the state of California to employees and
contractors. About $1-3/4 billion of these warrants eventually
appeared on bank balance sheets; the bulk of the remaining $1-1/4
billion of warrants were acquired by county and other local
governments. California began redeeming the warrants in September,
and their retirement could damp bank credit a bit.
Business loans contracted in August at the slowest pace since
last November, and they appear to have increased in September. In
August, the runoff in business loans at large banks slowed, perhaps
reflecting reduced debt restructuring activity by large firms
suggested by the falloff in equity issuance and the moderating pace
of gross bond issuance. At small banks, business loans contracted
at an accelerated pace in August, and another decline appears
probable in September.
The August Senior Loan Officer survey and the Survey of Terms
of Bank Lending (STBL) suggest that lending practices may have
stabilized. Except for land acquisition and development loans, loan
terms and standards apparently have not firmed in recent months.

III-6
GROSS OFFERINGS OF SECURITIES BY U.S. CORPORATIONS(Monthly rates, not seasonally adjusted, billions of dollars)
------------- -- 1992-----------------
1990 1991 Q1 Q2p July p Aug Sept.e
Corporate securities - total1 19.82 32.15 41.01 41.45 46.89 38.43 41.56Public offerings in U.S. 17.68 29.36 37.66 38.20 44.48 35.28 40.30
Stocks--total 2 1.95 5.44 7.53 7.08 6.48 5.28 5.30Nonfinancial 1.03 3.72 5.14 4.99 3.02 2.95 2.60
Utility 0.35 0.42 0.79 1.24 0.56 0.95 1.80Industrial 0.68 3.30 4.35 3.75 2.46 2.00 0.80
Financial 0.92 1.72 2.38 2.09 3.46 2.70 2.70
Bonds 15.73 23.92 30.13 31.12 38.00 30.00 35.00Nonfinancial 5.62 9.51 13.43 12.37 19.50 12.50 16.50
Utility 1.98 2.98 5.00 5.42 9.50 5.50 7.00Industrial 3.64 6.53 8.43 6.95 10.00 7.00 9.50
Financial 10.11 14.41 16.70 18.75 18.50 17.50 18.50
By quality 3
Aaa and Aa 3.42 3.72 4.13 2.89 6.63 4.00 5.50A and Baa 6.44 12.09 15.84 15.01 17.07 12.55 17.70Less than Baa 0.15 1.03 2.64 3.31 4.13 2.62 2.58No rating (or unknown) 0.04 0.02 0.10 0.02 0.03 0.08 0.02
Memo items:
Equity-based bonds 4 0.40 0.63 1.01 0.52 0.23 0.28 0.33Mortgage-backed bonds 2.43 2.99 4.83 6.63 6.20 7.96 3.00Other asset-backed 3.27 4.08 2.63 3.26 3.94 2.79 6.2CVariable-rate notes 0.80 0.84 0.90 2.18 0.98 1.84 2.6'
Bonds sold abroad - total 1.92 2.33 2.61 2.46 2.20 3.00 1.00Nonfinancial 0.46 1.00 0.96 1.06 0.80 1.30 0.30Financial 1.46 1.33 1.64 1.40 1.40 1.70 0.70
Stocks sold abroad - total 0.22 0.46 0.74 0.79 0.21 0.16 0.26Nonfinancial 0.10 0.38 0.53 0.67 0.09 0.14 0.26Financial 0.12 0.08 0.21 0.12 0.12 0.01 0.00
1. Securities issued in the private placement market are not included. Total reflectsgross proceeds rather than par value of original discount bonds.2. Excludes equity issues associated with equity-for-equity swaps that
in restructurings. Such swaps totaled $9.4 billion in 1990.3. Bonds categorized according to Moody's bond ratings, or to Standard
unrated by Moody's. Excludes mortgage-backed and asset-backed bonds.4. Includes bonds convertible into equity and bonds with warrants that
holder to purchase equity in the future.p--preliminary. e--staff estimate.
have occurred
and Poor's if
entitle the

III-7
Further, the STBL indicates that bank loan rates generally moved
down with market interest rates between May and August, leaving
margins little changed on balance. In line with these surveys, the
National Federation of Independent Businesses Survey also reported a
drop in August in the percentage of respondents who indicated they
had greater difficulty obtaining credit.
Real estate loans at banks posted a modest decrease in August,
the third consecutive monthly decline. While relatively heavy
securitizations and loan sales contributed to the decline, these
factors do not appear to account fully for the weakness. Home
equity loans were little changed in August, after rising almost 12
percent at an annual rate in July. Preliminary September data
suggest some rebound in real estate lending.
Business Finance
Net external debt financing by nonfinancial business may have
firmed a bit over the past two months, boosted by growth in
commercial paper and the apparent turnaround in business loans at
banks. Nonetheless, proceeds from bond issuance, including the
deluge in September sparked by a drop in market interest rates,
continue to go largely to debt retirement.1
Nonfinancial corporations have turned less to the equity market
for financing in recent months, which may be influencing business
borrowing. Gross public offerings of equity in September were a
little under $3 billion, about the pace of the last two months but
1. According to one estimate, the nonfinancial sector has usedabout 60 percent of the proceeds from new bonds issued in 1992 torefinance maturing bonds and to call outstanding bonds. Bycontrast, in the late 1980s, only about a third of the proceeds fromnew offerings were applied to retire old bonds. Rough estimatessuggest that refinancing will reduce bond interest payments $2 to $4billion in 1992. Greater reductions in interest expense are beingrealized from the repricing of bank loans and maturing commercialpaper.

III-8
well off that of the first half of the year. Consequently, net
equity issuance by nonfinancial corporations amounted to only
$13 billion (annual rate) in the third quarter, only a third of the
first-half pace. A marked slowing in deleveraging activity has
contributed to the falloff: Reverse leveraged buyouts have declined
from $5.3 billion in the first half to less than $500 million in the
third quarter. Initial public offerings of stock by smaller
companies also have slowed, and the small volume of IPOs in
registration points to a continuation of this trend.
In the junk bond market, nonfinancial corporations issued
$2.6 billion in both August and September, bringing the gross volume
of public offerings for the year to $27 billion. The bulk of this
issuance is to pay down higher-yielding bonds. At an annual rate,
gross issuance of junk bonds in 1992 is about on pace with that of
the late 1980s. The heavy issuance has not resulted in a widening
of yield spreads largely because junk bond retirements have been
equally heavy, defaults have moderated, and demand has been buoyed
by strong inflows to junk bond mutual funds.
Stock price indexes are off since the August FOMC meeting, but
several indexes set all-time highs during the intermeeting period.
The S&P 500 price-earnings ratio, at 24.5, has edged down from its
May peak of 26, but it remains high by historical standards.
Bank share prices have declined about 4 percent since the last
meeting, and yield spreads on their subordinated notes have widened
5 to 15 basis points. The price declines probably reflect lingering
problems with real estate loans. Nevertheless, bank holding
companies have continued to tap the markets for regulatory capital:
Since the August FOMC meeting, they have issued roughly $1 billion
each of subordinated notes and of new equity shares, raising the
combined total issuance for 1992 to $16 billion, already an annual

III-9
record. By contrast, issuance of notes that do not count as
regulatory capital, such as commercial paper and senior notes,
remained weak.
Stock prices of property/casualty insurance companies fell in
the aftermath of Hurricane Andrew, but the prices of some companies
have rebounded recently on the prospect that the industry may now
raise premiums significantly. Initial estimates of insured losses
from Hurricanes Andrew and Hurricane Iniki were $7.3 billion for
southern Florida, $500 million for Louisiana, and $1.6 billion for
Hawaii. Several firms have announced upward revisions to their loss
estimates from Andrew, however, and total insured losses may be as
high as $12 billion. Catastrophic losses for 1992 will almost
certainly exceed the one-year record of $7.3 billion set in 1989,
but their impact on the financial condition of the insurance
industry is expected to be slight. In general, major catastrophes
are only a small portion of the industry's total insured losses over
the course of a year. Nonetheless, some individual companies have
been adversely affected: Moody's has downgraded Allstate and
Continental, and both Moody's and Standard and Poor's are reviewing
Prudential's rating.
Treasury Financing
The projected $71 billion deficit for the third quarter is
expected to be financed by a roughly equal amount of marketable
borrowing. Nonmarketable borrowing is projected to be slightly
positive in the third quarter because of the heavy redemptions by
state and local governments of nonmarketable Treasury obligations
when debt that has been pre-refunded reaches call dates. Instead of
using the SLG program, many municipalities have invested the
proceeds of recent advance refundings in marketable Treasury
securities.
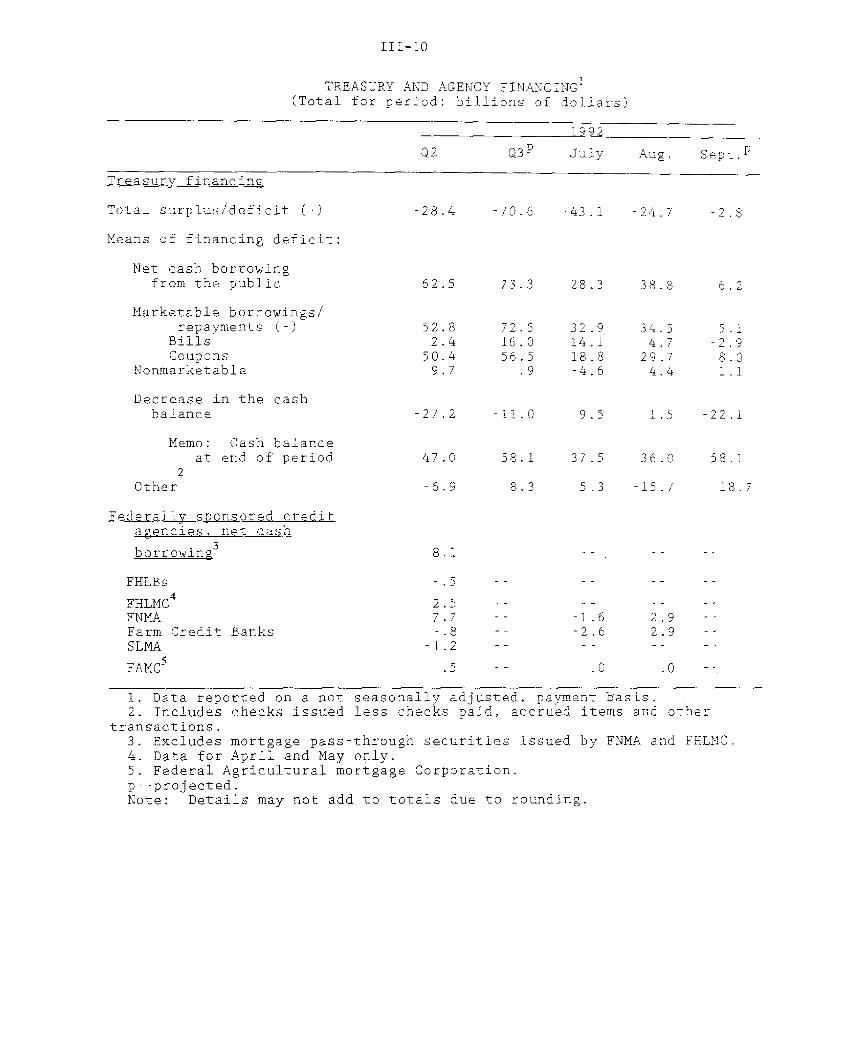
III-10
TREASURY AND AGENCY FINANCING(Total for period; billions of dollars)
1992
Q3 July Aug. Seprp
Treasury financing
Total surplus/deficit (-)
Means of financing deficit:
Net cash borrowingfrom the public
Marketable borrowings/repayments (-)
BillsCoupons
Nonmarketable
Decrease in the cashbalance
Memo: Cash balanceat end of period
Other
-28.4
62.5
52.82.4
50.49.7
-27.2
47.0
6.9
-70.6 -43.1 -24.7
73.3 28.3
72.516.056.5
.9
11 .0
58.1
8.3
32.914.118.8-4.6
38.8
34.54.7
29.74.4
9.5 1 .5
37.5 36.0
5.3 -15.7
Federally sponsored creditagencies, net cash
borrowing3
FHLBs
FHLMC4
FNMAFarm Credit BanksSLMA
FAMC5
- 5 - -
2.57.7 --
.8 --1.2
.5
1. Data reported on a not seasonally adjusted, payment basis.2. Includes checks issued less checks paid, accrued items and other
transactions.3. Excludes mortgage pass-through securities issued by FNMA and FHLMC.4. Data for April and May only.5. Federal Agricultural mortgage Corporation.p--projected.Note: Details may not add to totals due to rounding.
-2.8
o.2
319
871.1
-22.1
58.1
18.7
-- ~-1.6
-2.6
.0
III-11
In recent weeks, the Treasury has cut back the sizes of its
three- and six-month bill and two-year note auctions to reduce the
mid-September bulge in its cash balance resulting from corporate and
individual tax payments. Nevertheless, in the fourth quarter, the
Treasury will likely need to increase sharply gross auction sizes.
The Treasury began a year-long experiment with single-price
("Dutch") auctions, beginning with the monthly two- and five-year
note auctions held in late September. The Treasury hopes that by
removing the risk of paying prices that are higher than necessary to
receive securities, single-price auctions will broaden participation
at auctions as well as prevent the shading of bids by existing
participants. The increased demand for Treasury securities at
auctions may offset the losses created because some buyers pay a
lower price than when the Treasury charged multiple prices. The
two-year auction went well, attracting a heavy volume of bids and
coming in at an unusually tight spread to the when-issued rate at
the time of the auction. The five-year auction, however, went
poorly, as evidenced by a relatively low volume of bids and an
unusually large mark-up over the when-issued rate.
Municipal Securities
During the third quarter, gross issuance of long-term municipal
bonds was robust, but a substantial portion was to refund bonds with
higher yields. During this year, the average monthly refunding
volume, $6.2 billion, has been higher than the record pace
established in 1986, when falling interest rates and anticipated
limits on the number of pre-refundings spurred issuance. The heavy
issuance has caused municipal bond yields to rise relative to
Treasury rates in the past two months.
Sales of short-term debt reached a record pace during
September. The largest issue was by California, which sold about

III-12
$5 billion of notes for funding government operations. The state
had already sold $3 billion of one-month notes to pay down scrip
issued during the state's two-month budget crisis. Despite the
resolution of the budget crisis, many analysts fear that the fiscal
1993 budget does not address the full extent of the state's deficit
problems. These concerns were reflected in the premium paid on the
state's one-month note offering. These tax-exempt notes were priced
to yield 3.4 percent, only about 10 basis points below medium-grade
taxable commercial paper yields with the same maturity.
GROSS OFFERINGS OF MUNICIPAL SECURITIES(Monthly rates, not seasonally adjusted, billions of dollars)
1992 1992
1990 1991 Ql Q2 Q3 f July Aug. p Sept. f
Total offerings 1 13.49 16.60 16.75 21.64 24.18 19.75 23.09 29.71
Total tax-exempt 13.24 16.18 16.20 20.89 23.80 19.67 22.24 29.50
Long-term 2 10.26 12.84 14.47 16.60 17.39 16.18 18.00 18.00Refundings 1.68 3.11 5.12 5.81 7.54 8.62 6.01 8.00
New capital 8.58 9.73 9.35 10.79 9.85 7.56 11.99 10.00Short-term 2.98 3.34 1.73 4.29 6.41 3.49 4.24 11.50
Total taxable .25 .42 .55 .75 .38 .08 .85 .21
p--preliminary. f--forecast.1. Includes issues for public and private purposes.2. Includes all refunding bonds, not just advance refundings.
Several other states have tapped or soon will tap the short-
term market for funds. These states have entered the 1993 fiscal
year with smaller-than-normal cash reserves and are using short-term
debt to finance temporary imbalances between outlays and revenues.
Yields on new tax-exempt notes have jumped over the past month,
owing primarily to the sharp increase in supply. The rating
agencies view negatively the heavy reliance on short-term debt by
states with financial problems, as it signals a reluctance to deal
with budget imbalances. Such borrowings have been a factor in
several downgradings, including Moody's lowering of New Jersey's

III-13
long-term rating from Aaa to Aal in August. In contrast, Standard
and Poor's and Moody's each upgraded Massachusetts's general
obligation debt to A when the state ended the 1992 fiscal year with
a significant budget surplus, and subsequently reduced its reliance
on short-term borrowing.
The credit quality of local governments in south Florida is
being reviewed by Standard & Poor's following Hurricane Andrew.
Dade County officials have estimated a shortfall of at least
$55 million for the county government. Other local governments may
face shortfalls of up to $30 million. Standard & Poor's has
suggested that, without federal aid, some of these governments are
likely to be downgraded.
Mortgage Markets
Over the intermeeting period, net changes in interest rates on
conventional home mortgage loans have been mixed. The average
contract rate on new commitments for thirty-year, fixed-rate loans
has remained relatively stable around 8 percent, while the average
initial rate quoted on ARMs indexed to the one-year constant
maturity Treasury yield has fallen nearly 30 basis points. As a
result, the initial rate advantage of ARMs has widened further to
roughly 3 percentage points, close to the record 313 basis points
set in October 1987. At that time, ARMs accounted for over 60
percent of conventional loan originations. Despite the relatively
wide initial rate spread between FRMs and ARMs, ARMs currently
account for only about 20 percent of loan originations.
Gross issuance of fixed-rate pass-throughs by the agencies,
while still sizable in August, weakened further from the record pace
of the second quarter (table). With the August moderation in pass-
through issuance, REMIC issuance also slowed somewhat, but is
expected to increase in coming months, partly because many

III-14
SELECTED MORTGAGE DEBT AGGREGATES
Mortgage Debt Outstanding Net Issuance of SecuritizedMortgage Debt Outstanding Residential Mortgages
(Percent change at annual rate, nsa) (Percent change at annual rate, nsa)Single Multi
Total Family Family Commercial Farm Total GNMA FNMA FHLMC
1987 12.8 13.3 8.2 17.0 -9.6 25.8 20.2 44.0 24.11988 9.2 11.7 4.4 5.3 -2.6 11.5 7.8 27.4 6.51989 8.5 10.0 4.1 6.6 -1.4 16.9 8.6 28.0 20.51990 6.7 8.7 2.0 3.0 -0.1 17.1 9.1 31.4 15.91991 3.1 4.9 -0.5 -1.2 -0.9 13.4 5.4 24.1 13.5
1991-Q1 3.8 4.4 2.0 3.2 -0.1 10.1 6.3 16.4 9.1Q2 5.7 7.2 4.1 2.0 -0.8 13.0 3.7 24.3 13.9Q3 1.4 4.8 -9.3 -5.7 -2.9 16.2 8.5 25.2 16.8Q4 1.5 3.2 1.0 4.2 0.0 11.8 2.6 22.8 11.8
1992-Q1 4.5 7.5 -0.4 -3.9 -1.3 8.0 -3.1 19.2 9.7Q2 2.8 5.7 -9.7 -3.3 3.2 13.3 0.9 24.0 16.2
1992-Jul. n.a. n.a. n.a. n.a. n.a. n.a. 3.9 15.0 n.a.Aug. n.a. n.a. n.a. n.a. n.a. n.a. 2.5 17.4 n.a.
n.a.--not available
HOME MORTGAGE DELINQUENCY RATES AT ALL LENDERS
(Seasonally adjusted, quarterly averages)
Percent
1968 1972 1976 1980 1984 1988 1992
Source: Mortgage Bankers Association.

III-15
refinanced mortgages are ultimately funded through REMICs and partly
because Freddie Mac has begun issuing REMICs backed by Ginnie Mae
pass-throughs.
MORTGAGE-BACKED(Monthly averages, billions
Federally relatedpass-through securities
Total Fixed- ARM-(SA) Rate backed
1988 12.4 10.2 2.31989 16.5 14.1 2.71990 19.7 17.2 2.41991 22.1 20.4 2.0
1991-Q3 24.5 23.7 2.0Q4 22.6 22.4 2.5
1992-Q1 35.1 29.1 2.0Q2 42.2 36.7 3.6
1992-July 33.4 29.0 3.1Aug. p 30.1 29.4 3.0
1. Excludes pass-through securities wp--preliminary n.a.--not available
SECURITY ISSUANCEof dollars, NSA unless noted)
Multiclass securitiesPrivate FNMA FHLMC Agency
Total issues REMICs REMICS strips
6.8 5.0 .9 .9 n.a.8.4 1.6 3.1 3.2 .3
11.5 2.4 5.1 3.4 .618.4 3.0 8.5 6.0 .9
22.6 3.6 10.4 7.1 1.523.5 2.9 11.2 7.3 2.1
23.5 4.8 11.1 7.0 .633.8 6.6 13.9 12.4 .9
40.3 6.0 19.9 11.7 2.736.5 8.0 15.0 12.7 .8
ith senior/subordinated structures.
Data for the second quarter indicate that mortgage credit for
all property types grew at an estimated 2.8 percent annual rate,
with the expansion largely accounted for by loans on single-family
properties (table). Outstanding multi-family mortgages and
commercial mortgage debt continued to fall. Available data suggest
that net mortgage debt growth remained weak through August: Net
issuance of bonds backed by residential mortgages was relatively
light in July and August, while real estate loans at banks declined
in both months. However, as noted above, preliminary data for banks
indicate a pickup in real estate lending in September, and third
quarter home mortgage applications at mortgage bankers have remained
very strong.
Delinquency rates for mortgages deteriorated a bit in the
second quarter for most types of loans (chart). The 30-day mortgage

III-16
CONSUMER CREDIT(Seasonally adjusted)
Memo:Percent change Outstandings(at annual rate) (billions of
dollars)1992 1992 1992
19891 1990 1991 Q1 Q 2 r Juner Julyp Julyp
Installment 5.8 2.6 -1.0 -.2 -2.6 -.5 -1.9 721.5
Auto 1.4 -2.4 -7.6 -1.3 -7.5 -12.0 2.4 257.8Revolving 15.2 11.9 8.9 4.1 3.4 5.6 -.7 247.2Other 4.2 .8 -2.3 -3.6 -3.6 6.4 -8.3 216.5
Noninstallment 3.9 -3.5 -10.0 17.5 8.0 3.3 7.4 56.5
Total 5.6 2.1 -1.7 1.0 -1.9 -. 2 -1.2 778.1
1. Growth rates are adjusted for discontinuity in data between December 1988 andJanuary 1989.
r--revised. p--preliminary.Note: Details may not add to totals due to rounding.
CONSUMER INTEREST RATES(Annual percentage rate)
19921989 1990 1991 Feb. May June July Aug.
At commercial banksNew cars (48 mo.) 12.07 11.78 11.14 9.89 9.52 ... ... 9.15Personal (24 mo.) 15.44 15.46 15.18 14.39 14.28 ... ... 13.94Credit cards 18.02 18.17 18.23 18.09 17.97 ... ... 17.66
At auto finance cos.New cars 12.62 12.54 12.41 10.19 10.67 10.25 9.94 8.88Used cars 16.18 15.99 15.60 14.00 14.01 13.89 13.67 13.49
1. Average of "most common" rate charged for specified type and maturity duringthe first week of the mid-month of each quarter.
2. Average rate for all loans of each type made during the month regardless ofmaturity.

III-17
delinquency rate rose to 4.8 percent, retracing the previous
quarter's decline. The number of single-family loans 60 days or
more past due, a measure of more serious payment problems, edged up
to 1.6 percent. Despite their recent uptick, both measures of
payment difficulties remain below the peak levels recorded in the
mid-1980s.
Consumer Installment Credit
Consumer installment credit outstanding contracted at a 2
percent annual rate in July, and several indicators suggest that the
downward trend continued in August. In particular, growth of
consumer credit at banks (after adjustment for securitization)
remained slow, and with sluggish new-car sales and with relatively
high interest rate spreads on outstanding consumer loans, consumer
credit demands likely remain subdued.
Growth in consumer debt has been unusually weak throughout the
current economic recovery. By the fifth quarter of the previous
five recovery periods, consumer credit had increased an average of
11 percent from its level at the trough (chart). Assuming the
second quarter of 1992 is the fifth quarter of the current recovery,
consumer credit was 1-1/2 percent below its level in the trough
quarter. A major factor behind this credit contraction is an
atypically sluggish growth for spending on durable goods, which are
frequently financed by consumer debt. Recent spending on consumer
durables also has trended far below its average recovery path
(chart); durables consumption was 4 percent above its trough level
in the fifth quarter of the current recovery period, compared to an
average gain of 17 percent after five quarters of earlier
recoveries.
Other factors influencing the growth in consumer debt are the
shift by borrowers from consumer loans into home equity loans and

III-18
FACTORS AFFECTING CONSUMER CREDIT GROWTH
Recovery in Consumer Credit(Increase from period T) Percent
Average:5 previous periods
T+1 T+2 T+3 T+4 T+5
Recovery in Spending on Durables(increase from period T) Percent
Rate Spread: New-car loan vs. 6-month and 30-month CDs 1
Percent
Car loanless 30-mo. CD
Car loanless 6-mo. CD
- 6
- 4
-1 2
I I I1986 1987
I I I I I ' I1988 1989 1990 1991 1992
1. New-car loan rate is a 12-quarter average; all rates on after-tax basis.
1984 19851 ~_~__

III-19
auto leasing, and the paying down of consumer debt ahead of
schedule. The substantial widening of the spreads of rates that
households are paying on existing consumer debt over the rates at
which maturing financial assets can be reinvested remains a strong
incentive for households to liquidate debt. Although rates charged
on newly originated consumer loans have dropped in recent months,
particularly for auto loans, rates on the existing stock of consumer
debt are mostly fixed at their original levels. Spreads between the
after-tax cost of existing auto loans and currently available after-
tax yields on retail CDs of six- and thirty-month maturity are
estimated to be from 1-1/2 to 2-1/2 percentage points above previous
highs in early 1987 (chart).2
The ability of households to meet payment obligations appears
to have improved over the past year, despite the weakness of the
economic recovery and slow income growth. Most series on loan
delinquencies have been on the downswing since last summer, although
the picture for the second quarter (most recently available data)
has been somewhat mixed.
2. Rates on new-car loan portfolios are measured using a 12-quarter average to approximate the average rate on outstandingloans. The major tax adjustment used here takes account of thephaseout of tax deductibility for nonmortgage interest paymentsstarting in 1987. In that year, 65 percent of nonmortgage interestwas deductible. The deductible portion was reduced to 10 percent by1990, with no deductibility thereafter.
Consumer surveys indicate that most consumer credit is owed byhouseholds with income at or above the median. Most consumers withthis level of income itemize their deductions. To approximate themarginal tax rate for such consumers, the average of marginal ratesat the median income and twice the median income levels for eachyear were used in calculating the after-tax auto loan rate and CDrates.

INTERNATIONAL DEVELOPMENTS

INTERNATIONAL DEVELOPMENTS
Merchandise Trade
The preliminary U.S. merchandise trade deficit in July was $7.8
billion (seasonally adjusted, Census basis), compared with $6.7
billion (revised) in June and an average of $7.0 billion (monthly
rate) in the second quarter. Non-agricultural exports remained
about unchanged from the average monthly rates recorded during each
of the preceding three quarters. Agricultural exports rose
noticeably above the recent quarterly average of $3.6 billion
(monthly rate) due to gains in shipments of wheat and soybeans.
Non-oil imports in July continued on the fairly strong upward
trend that was evident during the first and second quarters of the
year, particularly imports of capital goods and consumer goods.
U.S. MERCHANDISE TRADE: MONTHLY DATA(Billions of dollars, seasonally adjusted, Census basis)
Exports ImportsTotal Ag. NonAg. Total Oil NonOil Balance
1992-Jan 35.5 3.6 31.9 41.3 3.6 37.6 -5.8Feb 37.7 3.7 33.9 40.9 3.3 37.6 -3.3Mar 37.1 3.5 33.6 42.7 3.4 39.2 -5.6
Apr 36.4 3.8 32.7 43.5 4.0 39.5 -7.1May 35.7 3.3 32.4 42.9 4.2 38.7 -7.1Jun 38.2 3.5 34.7 44.9 4.8 40.1 -6.7
Jul 37.3 3.9 33.5 45.2 4.8 40.3 -7.8
Source: U.S. Department of Commerce, Bureau of the Census.
For the second quarter, a combination of flat exports and
growing imports resulted in a merchandise trade deficit that
approached an annual rate of $100 billion (BOP basis), a rate not
seen since 1990-Q4.
IV-1

IV-2
MAJOR TRADE CATEGORIES(Billions of dollars, BOP basis, SAAR)
Year 1991 1992 $ Change1991 Q2 Q3 Q4 Q Q2 Q-Q2 Q2-Q±
Trade Balance -73.4 -65.6 -80.7 -74.2 -68.9 -97.7 -32.1 -28.8
Total U.S. Exports
Agricultural Exports
Nonagric. Exports
Industrial Suppl.GoldFuelsOther Ind. Suppl.
Capital GoodsAircraft & PartsComputers & PartsOther Machinery
Automotive ProductsTo CanadaTo Other
Consumer GoodsOther Nonagric.
Total U.S. Imports
Oil ImportsNon-Oil Imports
Industrial Suppl.GoldOther FuelsOther Ind. Suppl.
Capital GoodsAircraft & PartsComputers & PartsOther Machinery
Automotive ProductsFrom CanadaFrom Other
Consumer GoodsFoodsAll Other
416.0 413.3 416.6 431.4 431.8 430.3 17.0 -1.5
40.1 37.5 40.7 43.2 43.3 42.0375.8 375.8 375.9 388.2 388.5 388.3
101.83.6
14.383.9
167.036.427.3
103.3
40.022.817.5
101.33.2
13.085.2
169.438.727.2
103.4
39.721.917.8
100.53.4
12.784.3
166.735.426.8
104.5
43.725.018.7
100.03.6
14.781.8
176.340.827.9
107.5
41.723.118.6
99.73.8
13.982.1
176.442.627.4
106.4
42.920.822.1
100.43.4
13.683.4
174.137.728.6
107.8
46.223.722.5
45.9 44.5 44.9 48.2 47.9 48.721.0 20.9 20.1 22.1 21.5 19.0
4.5 -1.312.5 -0.2
-0.90.20.6-1.8
4.7-1.01.44.4
0.6-0.4-0.41.4
-2.3-4.91.21.4
6.5 3.31.8 2.94.7 0.4
4.1 0.7-1.9 -2.5-
489.4 478.9 497.3 505.6 500.7 528.0 49.1 27.3
51.2 51.7 52.5 48.8 41.5 51.9438.2 427.1 444.8 456.8 459.2 476.1
83.92.93.977.1
120.711.726.182.9
84.928.856.2
108.026.514.1
80.43.03.9
73.5
120.412.225.882.4
79.128.151.0
101.627.618.0
80.02.33.8
73.9
121.312.527.181.7
90.833,157.7
109.926.316.5
83.33.14.875.4
122.111.526.883.8
88.630.158.5
118.726.417.7
84.32.34.4
77.7
125.112.127.785.4
87.830.956.9
116.226.819.0
88.43.74.6
80.1
131.413.530.787.2
89.331.757.6
119.029.118.9
0.1 10.449.0 16.9
8.00.80.66.6
11.1
1.34.94.8
10.23.66.6
17.41.50.9
4.11.50.22.4
6.31.43.01.9
1.50.70.7
2.92.3
-0.1
Source: U.S. Department of Commerce, Bureau of Economic AnalysisSource: U.S. Department of Commerce, Bureau of Economic Analysis

IV-3
The increase in non-oil imports during the second quarter was
spread across every major trade category, with notable increases in
computers and parts, consumer goods, and industrial supplies. By
area, the largest increase was in imports from Canada, only a small
fraction of which were automotive products. Non-oil imports from
Japan actually fell in the second quarter.
Nonagricultural exports remained essentially unchanged in the
second quarter as a substantial drop in shipments of aircraft about
offset significant increases in exports of automotive products
(largely to Canada) and capital goods other than aircraft. By area,
exports to industrial countries (Japan and Western Europe) dropped
sharply, while exports to developing countries rebounded sharply
from a first-quarter lull. Agricultural exports fell in the second
quarter as wheat shipments retreated from the strong first-quarter
rate that was the byproduct of a bunching of shipments.
Oil imports increased in July, as both the quantity and the
price of these imports rose well above the second-quarter levels.
The noticeable increase in the quantity of oil imported over the
past two months appears to have been the result of a combination of
increased consumption and stockbuilding. Preliminary Department of
Energy data for August indicate a small decline in the quantity of
imports, in part due to the temporary shutdown of the Louisiana
Offshore Oil Pipeline (LOOP) brought about by Hurricane Andrew. The
OIL IMPORTS(BOP basis, seasonally adjusted annual rates)
1991 1992 Months04 Q Q2 Apr May Jun Jul
Value (Bil. $) 48.78 41.47 51.86 47.83 50.11 57.64 57.99Price ($/BBL) 18.05 15.27 17.48 16.16 17.41 18.81 18.68Quantity (mb/d) 7.40 7.44 8.12 8.11 7.88 8.39 8.50
Source: U.S. Department of Commerce, Bureau of Economic Analysis.

IV-4
bulk of Hurricane Andrew's effect on oil production, consumption,
and imports will be reflected in September data.
Since the beginning of June, the spot price for West Texas
Intermediate (WTI) has fluctuated around $22 per barrel, after
having generally risen since March. OPEC's widely expected decision
to increase its quota in the fourth quarter had little effect on oil
prices, with spot prices currently standing at $21.57. These
movements in spot prices suggest that import prices were little
changed from the July level in either August or September.
Prices of Exports and Non-oil Imports
In August, prices of nonagricultural exports rose for the
seventh consecutive month. Relative to the second quarter, prices
of nonagricultural exports in July/August rose at an average annual
rate of 2.2 percent. As for the second quarter, increases in
July/August were primarily attributable to higher prices of exported
industrial supplies (especially building materials and fuels), with
smaller increases recorded for consumer goods and automotive
products. Prices of agricultural exports fell sharply in both
August and July, recording an average annual rate of decline of 9.6
percent relative to the second quarter.
Prices of non-oil imports rose 0.4 percent (monthly rate) in
August. Compared with the second quarter (when prices of non-oil
imports fell), prices of non-oil imports rose at an annual rate of
4.2 percent in July/August. This increase was the result of
continued strength in prices of industrial supplies and consumer
goods, as well as turnarounds in the prices of imports of capital
goods and automotive products. The recent increases in non-oil
import prices reflect in part a lagged adjustment to the decline in
the exchange value of the dollar during the second quarter.

IV-5
IMPORT AND EXPORT PRICE MEASURES(percent change from previous period, annual rate)
Year Quarters Months1992-02 1991 1992 1992
1991-Q2 Q4 Q1 Q2 Jul Aug(Quarterly Average, AR) (Monthly Rates)
--------------------- BLS Prices---------------------
Imports, TotalFoods, Feeds, Bev.Industrial Supplies
Ind Supp Ex Oil*Capital GoodsAutomotive ProductsConsumer Goods
Memo:OilNon-oil
Exports, TotalFoods, Feeds, Bev.Industrial SuppliesCapital GoodsAutomotive ProductsConsumer Goods
Memo:AgriculturalNonagricultural
Fixed-WeightImports, Total
OilNon-oil
Exports, TotalAgNonag
DeflatorsImports, Total
OilNon-oil
0.4-1.7-1.9-2.0
0.71.12.7
5.23.73.1
-4.36.57.45.1
-1.8 19.50.6 3.9
0.01.7-3.2
1.12.01.9
-0.70.0
2.517.6-3.02.23.02.5
-1.210.0
-15.14.74.70.96.2
-45.0 50.34.4 -2.7
-1.4-1.3-6.5
0.71.65.9
10.8 -3.31.2 -1.3
------------- Prices in the NIPA Accounts------------
0.5 4.11.1 20.10.4 2.2
0.0 2.2-1.1 10.40.2 1.1
-1.91.2-2.3
-1.2-2.3-1.2
Exports, TotalAgNonag
2.320.4
0.2
-4.2-48.9
1.8
-0.7-4.1-0.4
-6.9-48.6
-1.5
1.1 -1.14.6 -5.20.6 -0.7
*/Months not for publication.
1.1-15.113.4-0.7-3.6-2.60.4
0.50.30.10.10.90.40.6
0.3-0.3-0.1
0.40.90.20.4
-1.00.4
-0.2-4.40.90.20.00.0
-3.50.3
1.6-2.15.3-0.11.01.6
-1.02.1
0.0-1.70.60.00.20.1
-1.20.3
4.872.1
0.0
1.1-1.1
1.5
1.670.6-3.2
-2.0-1.7-2.0

IV-6
U.S. Current Account
The U.S. current account balance recorded a deficit of $71.2
billion (annual rate) in the second quarter of 1992, compared with a
$23.6 billion deficit (revised) in the first quarter of 1992. Most
of the increase was due to a sharp rise in the merchandise trade
deficit; however, surpluses on both the investment income and
services balances decreased, and net unilateral transfers increased.
U.S. Current Account(billions of dollars, seasonally adjusted)
Current Acct BalMerchandise Services Investment Transfers Ex ForeignTrade, net net Income, net net Pub. Grants 1/
Year1991 -73.4 45.3 16.4 8.0 -3.7 -46.2
Quarters1991-1 -73.3 37.4 27.9 56.8 48.8 -41.9
2 -65.6 43.1 15.7 16.5 9.7 -36.73 -80.7 48.1 12.3 -24.0 -44.3 -62.84 -74.2 52.5 9.8 -17.1 -28.9 -43.5
1992-1r -68.9 55.4 17.9 -28.0 -23.6 -25.42 -97.7 51.9 5.5 -30.9 -71.2 -74.4
1/ Excludes foreign cash grants to the United States to cover costs ofthe war in the Persian Gulf. These grants amounted to $42.5 billion in1991 and $1.3 billion in 1992 and are shown in the accounts as positiveunilateral transfers.
The decline in the surplus on the services balance is the
result of declines in military sales and net service receipts of
affiliated businesses (traditionally a volatile category). A
slowing in the gains recorded in travel receipts, as well as
stagnant performances in most other services categories, also helped
to lower the surplus on services.
The increase in net unilateral transfers was mostly due to a
step-up in U.S. government grants, partly the result of increased
expenditures associated with peace keeping and refugee efforts.

IV-7
The deterioration of the surplus on the investment income
balance was largely the result of an increase in payments on foreign
assets in the United States. In particular, direct investment
income payments swung from losses in the first quarter to small
profits in the second quarter. The swing in direct investment
payments was largely the result of a return to profitability by U.S.
affiliates of foreign banks. In addition, portfolio investment
payments rose in the second quarter despite a decline in short-term
interest rates as foreigners rebalanced their portfolios in favor of
debt with longer maturities.
U.S. International Financial Transactions
Recently released figures for direct investment and other
capital flows confirmed our prediction in the August Greenbook of a
large negative statistical discrepancy in the second quarter (line
10 of the Summary of U.S. International Transactions table).
Although the preliminary value for the second quarter was almost a
negative $20 billion, the revised first-quarter number was increased
by over $7 billion, to just over negative $8 billion. This change
in the first-quarter statistical discrepancy was primarily the
result of revisions in direct investment inflows and outflows;
outflows of direct investment abroad were revised upward (line 6)
and inflows of foreign direct investment into the United States were
revised downward by enough to result in a net outflow for the
quarter of $3.8 billion (line 7).
The $11 billion outflow of direct investment abroad in the
second quarter was very high by historic standards, although lower
than the first-quarter outflow. Once again, direct investment abroad
ran well ahead of the inflow of foreign direct investment into the
United States. For the first half of 1992, outflows reached an

IV-8
SUMMARY OF U.S. INTERNATIONAL TRANSACTIONS
(Billions of dollars)
1990 1991 1991 1992 1992
Year Year Q3 Q4 Q1 Q2 May June Jul
Private Capital
Banks
1. Change in net foreign
positions of banking offices
in the U.S. (+ - inflow)
Securities
2. Private securities2
transactions, net
a) foreign net purchases3
(+) of U.S. corporate bonds
b) foreign net purchases
(+) of U.S. corporate stocks
c) U.S. net purchases (-) of
foreign securities
3. Foreign net purchases (+) of U.S.
Treasury obligations
Official Capital
4. Changes in foreign official
reserves assets in U.S.
(+ = increase)
a) By area
G-10 countries
OPEC
All other countries
b) By type
U.S. Treasury securities4
Other
5. Changes in U.S. official reserve
assets (+ - decrease)
5Other transactions (Quarterly data)
6. U.S. direct investment (-) abroad
7. Foreign direct investment (+) in U.S.6
8. Other capital flows (+ - inflow)
9. U.S. current account balance
10. Statistical discrepancy
36.6 -19.2 11.1 -2.0 3.9 -1.9 5.8 -8.0 -5.6
-29.1 -11.4 -2.5 -6.7 -4.3 1.3 0.1 1.4 -5.6
16.2 25.7 8.2 6.5 7.7 11.9 3.7 4 1 1.7
-13.7 10.1 2.3 -1.5 -2.8 -0.8 0.1 -0.5 -0.1
-31.6 -47.3 -13.0 -11.8 -9.2 -9.8 -3.6 -2.2 -7.2
-1.0 17.8 -1.2 1.5 -0.7 10.4 -4.0 9.4 0.6
32.1 16.0 3.4 13.3 21.1 20.2
10.0 -17.6
1.2 -5.8
20.8 39.3
9.1 7.1 2.3
-1.9 0.5 2.4 3.3 2.8 2.0
-4.4 1.2 2.8 -2.6 -3.1 0.9
9.8 11.6 15.9 19.4 9.4 4.2
29.6 14.8 5.6 12.6 14.9 11.1 5.6 3.0 4.
2.5 1.1 -2.2 0.7 6.2 9.1 3.5 4.1 -2.
-2.2 5.8 3.9 1.2 -1.1 1.5
-32.7
45.1
-5.8
-90.4
47.4
-27.1
11.5
11.4
-3.7
-1.1
-7.1
5.0
-11.1
-1.5
-11.7
5.7
3.5
-7.2
2.4
-15.1
-3.8
14.3
-5.9
-8.4
2.0 -0.3 0.4
-11.0
6.0
10.9
-17.8
-19.6
MEMO:
U.S. merchandise trade balance -- part
of Line 9 (Balance of payments basis,
seasonally adjusted) -108.9 -73.4 -20.2 -18.5 -17.2 -24.4 n.a. n.a. n.a.
1. Includes changes in positions of all depository institutions, bank-holding companies, and certain transactions
between brokers/dealers and unaffiliated foreigners (particularly borrowing and lending under repurchase agreements.)
2. These data have not been adjusted to exclude commissions on securities transactions and, therefore, do not match
exactly the data on U.S. international transactions as published by the Department of Commerce.
3. Includes all U.S. bonds other than Treasury obligations.
4. Includes deposits in banks, commercial paper, acceptances, borrowing under repurchase agreements, and other securities.
5. Seasonally adjusted.
6. Includes U.S. government assets other than official reserves, transactions by nonbanking concerns, and other banking and
official transactions not shown elsewhere. In addition, it includes amounts resulting from adjustments to the data made bythe Department of Comnerce and revisions to the data in lines 1 through 5 since publication of the quarterly data in thpSurvey of Current Business.
*--Less than $50 million.
NOTE: -Details may not add to total because of rounding.

IV-9
unprecedented $26 billion; outflows of over $15 billion to Western
Europe and $7 billion to Latin America were far above recent levels.
A contraction of Eurodollar holdings by U.S. residents
contributed to a net inflow of $10.9 billion in the second quarter
for other capital flows (line 8). Monthly average data presented on
the International Banking Data table, indicate a continued decline
in these holdings in July and August (line 3).
The most striking aspect of the July data in the Summary table
is the dramatic increase in U.S. net purchases of foreign securities
to $7.2 billion -- far above the already robust monthly rates
established in the first and second quarters (line 2c). Net bond
purchases totaled $4.3 billion, with stocks at $2.9 billion. Net
purchases from Japanese residents amounted to $2 billion, three-
quarters of which was for bonds. Net purchases from Canadians were
slightly more than $2 billion (mostly bonds), with nearly another $1
billion from the French. Net purchases of $2.8 billion passed
through the United Kingdom.
On the other hand, July also saw $1.6 billion in net sales of
foreign securities to Latin American residents (presumably a
reduction in U.S. holdings of Latin American securities). $600
million of this total constituted net sales of Chilean bonds, sales
probably triggered by the increased exchange-rate risk engendered by
a shift in the Chilean exchange-rate system from a peg to the dollar
to a peg to a basket of foreign currencies. U.S. investors also
sold net $400 million in Mexican stocks, as the Mexican stock market
declined precipitously from its June peak.
Foreign net purchases of U.S. securities of all kinds were
small in July (lines 2a, 2b, and 3). However, the low figure on
line 2a is partly the result of a net reduction in foreign holdings

INTERNATIONAL BANKING DATA
(Billions of dollars)
1990 1991 1992
Mar. June Sept. Dec. Mar. June Sept. Dec. Mar. June July Aug.
1. Net Claims of U.S. Banking
Offices (excluding IBFS) on Own
Foreign Offices and IBFS -11.7 -11.0 -15.6 -31.3 -23.8 -13.7 -14.1 -35.8 -41,4 -56.8 -55.6 -55.6
(a) U.S.-chartered banks 12.2 7.2 5.7 5.5 7.6 5.4 11.0 12.4 3.2 8.3 9.0 11.2
(b) Foreign-chartered banks -23.9 -18.2 -21.3 -36.9 -31.3 -19.2 -25.2 -48.3 -44.6 -65.1 -64.7 -65.1
2. Credit Extended to U.S.
Nonbank Residents by Foreign
Branches of U.S. Banks 21.8 22.2 24.0 24.7 26.0 23.9 23.7 23.9 23.3 24.5 25.0 24.8
3. Eurodollar Holdings of
U.S. Nonbank Residents 1/ 110.6 106.5 109.1 116.1 114.6 105.8 100.8 102.9 100.3 92.0 90.6 87,7
1. Includes term and overnight Eurodollars held by money market mutual funds. Note: These data differ in coverage and timing from the
overall banking data incorporated in the international transactions accounts. Line 1 is an average of daily dafa reported to the Federal
Reserve by U.S. banking offices. Line 2 is an average of daily data. Line 3 is an average of daily data for the overnight component and an
average of Wednesday data for the term component.

IV-11
of U.S. agency bonds; foreign holdings of U.S. corporate bonds
increased by approximately $2.4 billion, a reasonably robust rate.
Eurobond sales in August continued to be strong.
Banks registered moderate net capital outflows for the second
straight month (line 1). Foreign official reserve holdings in the
United States rose only modestly in July (line 4); partial data for
August from the FRBNY suggest continued slow growth.
Foreign Exchange Markets
The trade-weighted average foreign exchange value of the
dollar, shown in the accompanying chart, was highly volatile during
the inter-meeting period, but finished the period near its level
during the August 18 FOMC meeting. On balance, the dollar declined
nearly 3-1/2 percent against the mark and 5-1/2 percent against the
yen, while it rose 4-1/2 percent against the Canadian dollar, 8
percent against sterling, and 11-1/2 percent against the Italian
lira. During the early part of the period the dollar weakened
against the mark on the perception that strong German money growth
in July reduced the likelihood of a near term German easing.
Nevertheless, the dollar continued to decline, in part
on the market's perception that the Bush administration favored a
lower dollar to boost exports. The dollar was also weakened
somewhat against the yen by the announcement on August 28 of Japan's
Y 10.7 trillion fiscal stimulus package, and subsequently by poor
employment figures for August that were followed by Federal Reserve
easing on September 4.
The second half of the period was dominated by tensions in
European currency markets. At first, the dollar rose sharply

IV-12
WEIGHTED AVERAGE EXCHANGE VALUE OF THE DOLLAR
FDaily FFOMC
March 1973 = 100
SELECTED DOLLAR EXCHANGE RATESJune 1 = 100
Japanese Yen
\ A ev
German Mark
FOMCAug. 18
.--- \
\-^-'\
July AucustJune September

IV-13
against the mark and other European currencies in response to the
announcement that the Bundesbank would ease in connection with the
lira's realignment within the ERM of the EMS. The dollar later
gained on safe-haven concerns amid the high exchange rate volatility
in Europe, and on the expectation of further German easing to
stabilize the ERM. Toward the end of the period the dollar fell
sharply against the European currencies, as declining turmoil in the
EMS eroded the dollar's safe-haven premium and reduced expectations
for short-term German easing. Heightened expectations for further
Federal Reserve easing also contributed to the dollar's end-of-
period decline.
The dollar continued to depreciate against the yen for most of
the second-half of the period, setting a new low near ¥ 118.50.
Contributing to the dollar's decline were comments from U.S.
Treasury officials indicating that the dollar's rate against the yen
was not a cause for concern.
Currency tensions in Europe rose in the weeks before the French
vote, in part on uncertainty about the effects that a possible
French rejection of the Maastricht treaty would have on existing
currency arrangements. The increase in tensions was evident in
increasingly large sales of marks against other European currencies,
Finland's decision to float the markka on September 8, and the Bank
of Sweden's decision to raise its marginal lending rate to 75
percent the next day. One week before the French vote, following
unprecedentedly large sales of DM for lira by the central banks of
Italy and Germany, the central rate for the lira was devalued 7
percent, and it was announced that German interest rates would be
reduced the following day. The Bundesbank reduced the Lombard rate
25 basis points to 9-1/2 percent and the discount rate 50 basis

IV-14
points to 8-1/4 percent, and announced a fixed rate RP tender at
9.20 percent--50 basis points less than the previous week.
Instead of reducing tensions, the size of the Bundesbank's rate
cuts apparently strengthened the market's perception that the
Bundesbank would keep rates high, while the lira's devaluation
called into question the resolve of European central banks to
maintain the existing parity relationships. Large scale attacks on
sterling, the Italian lira, the French franc, the Spanish peseta,
the Portuguese escudo, the Irish pound, the Danish krone, and the
Swedish krona followed shortly.
As of this writing, the United Kingdom and Italy have withdrawn
their currencies from the ERM and allowed them to float. Over the
intermeeting period, sterling has declined about 11 percent against
the mark, and the lira has declined 15 percent. Neither currency is
expected to rejoin the ERM soon. Having withdrawn from the ERM, the
Bank of England lowered official interest rates 1 percentage point.
The French franc remained under attack following the narrow
affirmation of the Maastricht treaty.
.In addition, the German and French governments issued a joint
communique indicating that there is no need to devalue the franc.
The joint effect of these actions appears to have stabilized the
franc.
The weaker currencies in the ERM remain under pressure.
Although the central rate for the Spanish peseta was devalued 5
percent, the peseta remained under attack following the devaluation,
prompting the Bank of Spain to reinstate capital controls. The

IV-15
central banks of Ireland and Portugal have also imposed capital
controls.
Interest rates in Germany and mark-bloc countries have declined
on balance during the period. In Germany, call money and three-
month rates have declined by about 80 basis points to 9 percent
since the last FOMC meeting, with most of this reduction occurring
during the currency crisis. The yield on the bellwether bond has
declined 45 basis points. Large rate declines also occurred in
Switzerland, the Netherlands, and Belgium. The market had been
expecting further German rate cuts, but these expectations
diminished as ERM tensions subsided. Interest rates in other
European countries, especially those whose currencies have been
under attack, have been extremely volatile. For example, the
Swedish marginal lending rate had been as high as 500 percent at
one point, before being reduced to 24 percent, and overnight rates
in Portugal have soared as high as 1,000 percent. Since the FOMC
meeting, call money rates in France have risen 800 basis points, on
balance, to 18 percent, but were much higher during the currency
crisis. French three-month rates rose 275 basis points to 13
percent, with most of this increase occurring following the
Maastricht vote.
Interest rates in Japan were essentially unchanged during the
intermeeting period, with the call money rate hovering slightly
above 4 percent, and the three-month rate remaining near 3-3/4
percent. The yield on the bellwether bond in Japan remained steady,
slightly below 5 percent. The Japanese stock market posted a
significant recovery during the period, and had risen as much as 32
percent, but toward the end of the period the Nikkei weakened for a
net gain of 22 percent. The announcement of the Japanese fiscal

IV-16
stimulus package, and othr additional measures aimed primarily at
supporting the stock market, contributed to the Nikkei's rise.
The dollar rose 4-1/2 percent against the Canadian dollar
during the period. The Canadian dollar began weakening during the
period in response to Bank of Canada easing. Later, despite some
Bank of Canada tightening, the Canadian dollar continued to weaken
in response to polls that indicated that Canadian voters would
reject the unity proposition in the Constitutional referendum
scheduled for October 26. Toward the end of the period, these
uncertainties contributed to sharp increases in Canadian interest
rates. Canadian three-month interest rates rose nearly 250 basis
points on balance during the intermeeting period, with half of this
increase occurring on September 30.
Developments in Foreign Industrial Countries
Recent economic indicators in most major foreign industrial
countries point to slower growth. Sales and orders weakened in
Japan early in the third quarter, and leading indicators, such as
business confidence, inventories, and investment intentions, suggest
that weakness will persist in the near term. The Japanese
government announced a major fiscal stimulus package in late August
that should begin to have an impact later this year. In western
Germany, industrial production and new orders continued to fall in

IV-17
July, and the unemployment rate remained at 6.7 percent in August.
Unemployment rates have continued to increase in the United Kingdom
and have remained above 10 percent in France, Italy, and Canada.
Industrial production was sluggish in Japan, Canada, the United
Kingdom, and Sweden in the third quarter. Moderation in economic
activity has generally led to lower inflation, except in western
Germany.
French voters narrowly approved the Maastricht treaty on
September 20. However, in the weeks prior to the vote, concern
about the possible outcome contributed to intense pressures on the
weaker currencies in the exchange rate mechanism (ERM) causing U.K.
and Italian authorities to withdraw their currencies from the ERM.
Central banks in France and Sweden raised call money rates
substantially to defend their currencies. U.K. Prime Minister Major
called an emergency EC summit (to be held October 16) to discuss
necessary revisions to the Maastricht treaty and restoring stability
to the ERM. The exchange value of the ruble also fell sharply in
recent weeks as Russian production continued to drop and prices
increased at a fast clip.
Individual country notes. In Japan, real GDP rose 0.7 percent
(s.a.a.r.) in the second quarter, following a 3.6 percent increase
in the first quarter. Second-quarter growth was more than accounted
for by an increase in net exports, as imports (down at a 21.7
percent annual rate) fell by more than exports (down 12.7 percent).
Final domestic demand was about flat in the second quarter. Buoyed
by the acceleration of public works spending, government investment
rose sharply (up 32.6 percent). Private final domestic demand
declined at a 2.5 percent rate because of a sharp drop in plant and
equipment investment (down 9.4 percent). The only strong component

REAL GNP AND INDUSTRIAL PRODUCTION IN MAJOR INDUSTRIAL COUNTRIES(Percentage change from previous period, seasonally adjusted) 1
Q4/Q4 Q4/Q41990 1991
1991 1992 1992----------- ----------- ------ ----------------- Latest 3 months
Q3 Q4 Q1 Q2 Apr. May June July Aug. from year ago 2
Canada
GDPIP
France
GDPIP
WEST GERMANY
GDPIP
Italy
GDPIP
JAPAN
GDPIP
United Kingdom
GDPIP
UNITED STATES
GDPIP
-2.0 -.0-6.3 -1.4
1.5 1.7-.3 1.9
5.8 2.05.4 .3
1.6 1.8-3.8 -. 5
5.2 3.06.9 -1.6
-1.0 -1.6-3.1 -.7
-. 5 .1.3 -. 5
.1 .0 .3 .2
.7 -1.1 -.2 .1
1.1 .1 1.0 n.a..6 -.2 .1 -.2
-.2 -. 3 2.0 -. 3-.5 -1.2 2.8 -2.0
.3 .4 .6 n.a.-.3 1.1 2.5 n.a.
.4 -.0 .9 .2
.1 -1.2 -3.1 -2.3
.2 -.3 -.4 -.21.0 -.1 -.8 -.3
.3 .1 .7 .41.6 -.2 -.7 1.3
.2 -.5 -.1 -.6 n.a.
X X X x x1.3 -1.5 -.4 n.a. n.a.
K X X X X
-.7 -.1 -1.4 -.3 n.a.
-5.5 4.2 n.a. n.a. n.a.
.1 -1.9 2.5 .4 -3.7
.5 -.9 .0 1.0 n.a.
.5 .7 -4 .6 -.5,5 .7 -,4 .6 -. 5
1. Asterisk indicates that monthly data are not available.2. For quarterly data, latest quarter from year ago.
.6-1.5
2.7.3
1.1-2.0
2.02.1
1.5-5.8
-. 6-1 .1
1.6.9

CONSUMER AND WHOLESALE PRICES IN MAJOR INDUSTRIAL COUNTRIES(Percentage change from previous period) 1
Q4/Q4 Q4/Q4 4/1990 1991
1991 1992 1992------------------ ------------------- --------------------------- Latest 3 monthsQ2 Q3 Q4 Q1 Q2 Q3 June July Aug. Sept. from year ago
West Germany
CPIWPI
United Kingdom
CPIWPI
United States
CPI (SA)WPI (SA)
4.9 4.11.9 -3.2
3.6 2.9.7 -3.6
3.0 3.9.9 1.6
6.3 6.19.9 1.1
3.2 3.21.9 -1.3
10.0 4.25.9 4.9
6.3 3.06.4 -.1
.7 .6 -. 1-1.6 -. 9 -. 4
.7-1.5
.9 1.5
.3 .7
.9-1.0
.4 .5 n.a.
.5 .6 n.a.
.6 .7 n.a.
.1 n.a. n.a.
.7 1.2 1.1 .5
.2 .4 .5 n.a.
1.4 1.0 1.7 1.4 1.2-1.0 .5 1.4 .0 .8
2.11.9
.2 .2 .0 n.a.
.1 .3 .1 n.a.
.1 .3 .1 n.a.S X X X
.0-1.3
n.a.n.a.
.4 1.1 -.3 1.3 -.1-.4 -.7 -.4 .0 n.a.
.4 1.0 .5 2.2 n.a.
.6 .5 1.4 1.1 n.a.
.7 .9 .7 .8
.0 .5 .0 .7n.a.n.a.
.2-. 3
.0 -. 4
.1 .1
.2-. 7
.1n.a.
.3n.a.
n.a.n.a.
.1 .5
.1 na.
.1 n.a.
.1 n.a.
.1 n.a.
.3 .1 .3 n.a.
.2 .1 .1 n.a.
indicates that monthly data are not available.
2.9-3.1
3.5-. 1
5.32.5
2.0-1.3
3.11.7
--
1. Asterisk
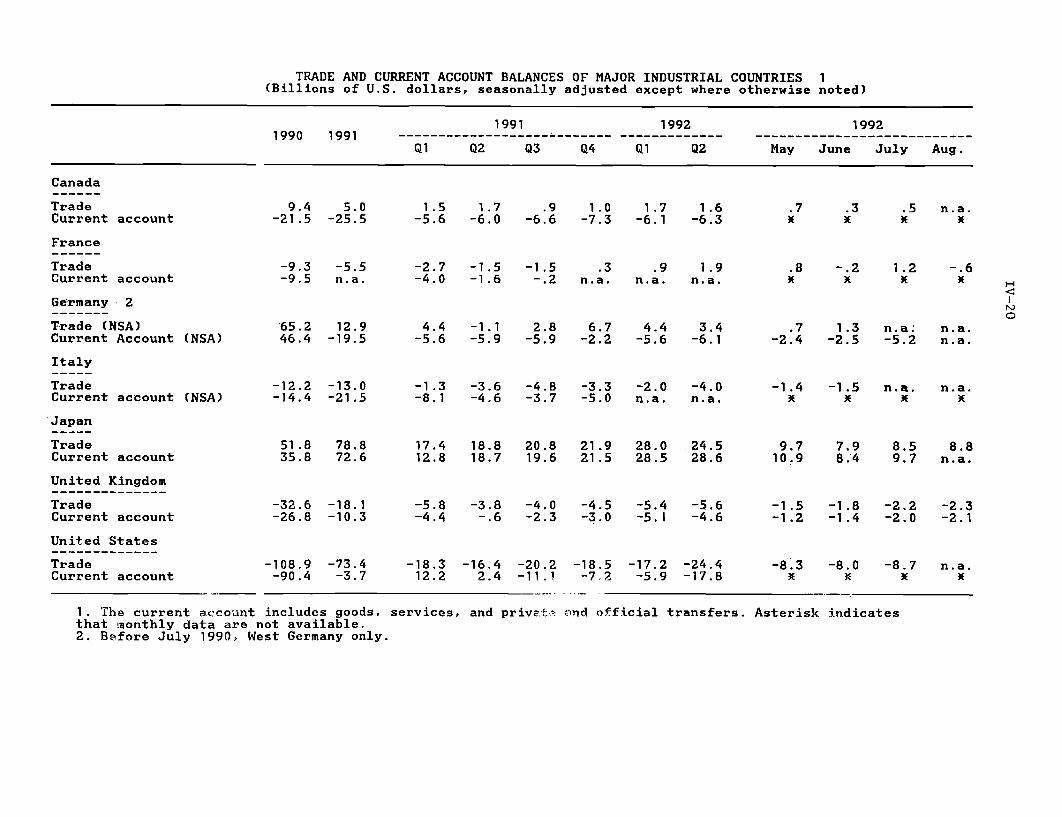
TRADE AND CURRENT ACCOUNT BALANCES OF MAJOR INDUSTRIAL COUNTRIES 1(Billions of U.S. dollars, seasonally adjusted except where otherwise noted)
1990 19911991 1992
-------------Q1 Q2 Q3 Q4 Q1 Q2
1992
May June July Aug.May June July Aug.
Canada
TradeCurrent account
France
TradeCurrent account
Germany 2
Trade (NSA)Current Account
Italy
TradeCurrent account
(NSA)
(NSA)
Japan
TradeCurrent account
United Kingdom
TradeCurrent account
United States
TradeCurrent account
9.4 5.0-21.5 -25.5
-9.3 -5.5-9.5 n.a.
65.2 12.946.4 -19.5
-12.2 -13.0-14.4 -21.5
51.8 78.835.8 72.6
-32.6 -18.1-26.8 -10.3
-108.9 -73.4-90.4 -3.7
1.5 1.7 .9 1.0 1.7 1.6-5.6 -6.0 -6.6 -7.3 -6.1 -6.3
-2.7 -1.5 -1.5-4.0 -1.6 -.2
.3n.a.
.9 1.9n.a. n.a.
4.4 -1.1 2.8 6.7 4.4 3.4-5.6 -5.9 -5.9 -2.2 -5.6 -6.1
-1.3 -3.6 -4.8 -3.3 -2.0 -4.0-8.1 -4.6 -3.7 -5.0 n.a. n.a.
17.4 18.8 20.8 21.9 28.0 24.512.8 18.7 19.6 21.5 28.5 28.6
-5.8 -3.8 -4.0 -4.5 -5.4 -5.6-4.4 -.6 -2.3 -3.0 -5.1 -4.6
-18.3 -16.4 -20.2 -18.5 -17.2 -24.412.2 2.4 -11.1 -7.2 -5.9 -17.8
.7 .3 .5 n.a.
.8 -.2 1.2 -.6X X M X
.7 1.3-2.4 -2.5
n.a. n.a.-5.2 n.a.
-1.4 -1.5 n.a. n.a.x x x x
9.7 7.9 8.5 8.810.9 8.4 9.7 n.a.
-1.5 -1.8 -2.2 -2.3-1.2 -1.4 -2.0 -2.1
-8.3 -8.0 -8.7X N x
n.a.X
1. The current account includes goods, services, and prive.tthat monthly data are not available.2. Before July 1990, West Germany only.
and official transfers Asterisk indicates
I~" " I'

IV-21
of private domestic demand was housing investment (up 10.3 percent,
after declining in the six previous quarters).
Recent monthly indicators of activity suggest continued
weakness in the third quarter. Industrial production (s.a.) fell
3.7 percent in August, and its 12-month decline widened to 7.6
percent. The inventories-to-shipments ratio (s.a.) increased 4.6
percent in August, and its cumulative rise from its low point in
October 1990 reached 21.6 percent. Retail sales continued to sag,
recording a 12-month decline of 2 percent in August. Sales of
durable goods, including autos, have been especially weak. New
passenger car registrations (s.a.) dropped 6.1 percent in August,
and were 18.2 percent below their year-earlier level.
JAPANESE ECONOMIC INDICATORS(percent change from previous period except where noted, s.a.)
1991 1992Q4 Q1 Q2 Q3 May Jun. Jul.
Machinery Orders -4.4 2.4 -14.3 -- -15.1 10.2 -0.5Capacity Utilization -2.3 -2.8 -2.0 -- -1.5 2.3 -0.4Unemployment Rate (%) 2.1 2.1 2.1 -- 2.1 2.1 2.2Business Sentiment* (%) 13 -5 -24 -37 -
* Manufacturing firms having a favorable view of businessconditions minus those with an unfavorable outlook.
Further weakness in plant and equipment investment is suggested by
the decline in new machinery orders (s.a.) in the second quarter and
July, when they fell 4.6 below their year-earlier level. The
unemployment rate (s.a.) has remained little changed. However, the
job offers to applicants ratio (s.a.), a more sensitive indicator of
labor market conditions, declined a further 3.7 percent in July,
falling 29.3 percent below its peak of March 1991. Another
indicator of labor market weakness has been the fall in overtime
hours, which showed a 12-month decline of 15.3 percent in June.

IV-22
The Bank of Japan's latest quarterly economic survey, conducted
in August before the announcement of the government's fiscal
stimulus package, reported a further deterioration in business
sentiment. Firms on average also predicted a 2.8 percent decline in
investment in the current fiscal year, lower than in the previous
survey. The survey also indicated that an increasing percentage of
firms viewed their inventory holdings as excessive.
Inflation pressures have remained subdued. The 12-month change
in Tokyo consumer prices increased to 2.2 percent in September,
mainly due to an increase in perishable food prices. Wholesale
prices showed a 12-month decline of 1.1 percent in August, as import
prices were down 2.9 percent over this period.
The trade surplus (s.a.) increased somewhat further in August.
For the first eight months of the year, the trade surplus was $104.6
billion (a.r.), 41 percent higher than in the same period last year.
On August 28, the government announced a package of measures to
expand government spending, increase lending, and stimulate the
economy. The total package amounts to ¥10.7 trillion (about 2-1/4
percent of GDP) of which ¥5.7 trillion involves increased spending
on public works projects and the remainder calls for an expansion of
various credit programs.
Real GDP in western Germany increased 3.4 percent (s.a.a.r.)
over the first half of 1992, as a significant boost to activity in
the first quarter was only partly offset by a downturn of 1.1
percent in the second quarter. Some reversal of the first-quarter
boom in construction, along with a decline in private consumption,
produced a downturn in domestic demand of 4.3 percent (s.a.a.r.).
Helping to offset the decline in domestic demand was the external
sector, as a 12 percent (s.a.a.r.) drop in imports more than offset
a moderate decline in exports. Industrial production has edged down

IV-23
monthly since February and began the third quarter well below its
second-quarter average. The volume of new orders for west German
manufactured goods (s.a.) fell through July, from a peak at the
beginning of the year. The unemployment rate (s.a.) in western
Germany has edged up since February and stood at 6.7 percent in
August.
WESTERN GERMAN ECONOMIC INDICATORS(percent change from previous period except where noted, s.a.)
1991 1992Q4 Ql Q2 May Jun. Jul. Aug.
Machinery Orders -1.5 2.2 -4.0 -0.3 -1.6 -0.5Capacity Utilization -0.9 -0.6 -0.7 --
Unemployment Rate (%) 6.3 6.2 6.5 6.5 6.6 6.7 6.7Business Sentiment* (%) -1.7 -3.7 -6.0 -9.0 -4.0 -3.0
* Mining and manufacturing firms that expect to increase productionminus those who expect to decrease it.
In September, consumer prices (n.s.a.) increased 0.3 percent to
a level 3.7 percent above the year-ago level. Producer prices were
unchanged in August and stood 1.1 percent above their year-earlier
level. Owing to appreciation of the mark, import prices fell in
June and July by 0.4 percent and 1.2 percent, respectively.
The current account deficit reached $5.2 billion (n.s.a.) in
July, primarily as a result of a drop in the value of exports. The
total deficit for the first seven months of the year was $16.8
billion compared with a deficit of $14.6 in the same period of 1991.
Through August, M3 in western and eastern Germany combined
increased 9.0 percent (s.a.a.r.) relative to the fourth quarter of
1991. Monetary expansion remains well above the Bundesbank's M3
target range of 3-1/2 to 5-1/2 percent growth for 1992. On
September 14, the Bundesbank reduced the discount and Lombard rates
by 1/2 and 1/4 points to 8.25 and 9.5 percent, respectively, in

IV-24
coordination with a realignment of the Italian lira within the
European Monetary System.
Just prior to the Munich Summit, the German cabinet approved a
draft 1993 budget and medium-term financial plan that would limit
the annual growth of Federal expenditures to 2.5 percent in nominal
terms over the next four years. In early September, this budget
package was presented to the German parliament; final passage is
expected before year-end. In his presentation to parliament,
Chancellor Kohl called for a "solidarity pact" with labor unions,
local government, business, and the Treuhandanstalt. This pact
would include no growth in real wages, limit growth in local
expenditure, as well as provide new measures to facilitate private
investment in eastern Germany.
Real marketable GDP, a preliminary indicator of French total
GDP that excludes most government services, rose 0.4 percent
(s.a.a.r.) in the second quarter, after rising 3.6 percent in the
first quarter. Net exports made a positive contribution to growth
in the second quarter while consumption and investment fell 0.1
percent (s.a.a.r.) and 1 percent respectively. The few monthly
indicators available for the third quarter are mixed but, on
balance, point to continued moderate growth. Consumption of
manufactured products (about a third of total consumption) was up 2
percent (s.a.) on average in July and August from its June level.
Unemployment (s.a.) decreased in July, although the rate remained
unchanged at 10.3 percent.
In August, the consumer price index was 2.7 percent above its
year-earlier level, down from an average of roughly 3 percent
earlier in the year. France's favorable inflation performance has-
been supported by a moderation of wage inflation. Hourly wages in
the July quarterly survey were only 3.1 percent (n.s.a.) above their

IV-25
year-earlier level, down significantly from the 4.3 percent rise
registered-in the April survey.
On September 20, French voters narrowly approved the Maastricht
treaty by 51 to 49 percent. Support for the treaty was concentrated
in regions on the periphery of France and in the Paris area.
Opposition was strong in rural areas and in the south. The
strongest opposition came from farmers (of whom 3/4 voted against
the treaty), artisans and shopkeepers, and among the working class.
In contrast, supporters tended to be professionals, better educated,
and more affluent.
The 1993 budget, which soon will be presented to parliament,
proposes that the increase in total expenditures be held to 3.5
percent, but that spending rise more in priority areas such as
employment and training, justice, and public security. The budget
deficit is projected to amount to 2 percent of GDP.
In Italy, economic growth remains weak. In June, industrial
production adjusted for the number of working days, was 4 percent
lower than in June 1991. Also, in June, new orders (n.s.a.) fell to
a level 3.5 percent below a year ago; this follows a 8.7 percent
decline in May from the previous year. The consumer confidence
index dipped in July and is 5.5 percent lower than the level in July
1991. A rebound in consumer confidence is unlikely in the near term
due to higher taxes, lower wage growth, and uncertainties related to
Italy's withdrawal from the ERM.
The year-on-year CPI inflation rate fell to 5.2 percent in
August, the fourth consecutive monthly decline. Wholesale and
producer price indices in June were, respectively, 2.3 and 2.1
percent higher than a year earlier. The abolition of the scala
mobile, Italy's system of wage indexation to the cost of living

IV-26
will freeze firm-level wage negotiations until the end of 1993.
Consequently, the only source of wage growth in the next sixteen
months will be existing multi-year contracts and a one-time wage
increase of 20,000 lire/month (about $16.00/month) effective January
through December 1993. This is expected to slow wage inflation from
about 6 percent in 1992 to 4 to 4-1/2 percent in 1993.
Market fears of a French rejection of the Maastricht Treaty and
concerns over Italy's budget deficit forced the lira to its ERM
floor in early September. Neither the Bank of Italy's move on
September 4 to increase the discount rate 175 basis points to 15
percent nor its massive intervention in support of the lira could
raise it off its ERM floor. After numerous statements reaffirming
Italy's commitment to defend the parity, the lira was devalued by 7
percent on September 13 and then allowed to float on September 17.
In the United Kingdom, real GDP contracted 0.7 percent
(s.a.a.r.) in the second quarter after declining 1.4 percent in the
first quarter, resulting in a cumulative fall of 4.1 percent since
its peak in the second quarter of 1990. Consumer spending rose for
the first time in two years in the second quarter, by 2.2 percent
(s.a.a.r.) after it had fallen 3.4 percent since the onset of the
recession. However, fixed investment fell 9.1 percent (s.a.a.r.) to
a level 17.5 percent below its peak in the first quarter of 1990.
Net exports of goods and services had a negative impact on second-
quarter growth; exports rose 5.8 percent (s.a.a.r.) but were more
than offset by a 9.5 percent increase in imports.
Industrial production (s.a.) rose 1.0 percent in July from the
previous month, but the increase was entirely accounted for by a
resumption in energy production after spring maintenance on North
Sea oilfields was completed. Manufacturing production (s.a.) was
stagnant at a level 1.5 percent below a year ago. In August,

IV-27
business confidence receded again to its weakest level since May
1991. An industrial survey suggested that capital spending will
remain flat at about its first-quarter level for the rest of the
year. Another indication of weak output growth in months ahead was
the level of unwanted inventories, which rose in the past three
months. Consumer spending picked up slightly in August; the volume
of retail sales (s.a.) rose 0.8 percent after falling in June and
July. Unemployment (s.a.) continued to rise in August to a rate of
9.9 percent, a 5-year high.
The recession has slowed inflation significantly. Consumer
prices (n.s.a.) rose 0.1 percent in August after falling 0.4 percent
in July. The 12-month inflation rate fell to 3.6 percent, the
lowest level since 1986. Excluding mortgage interest rates,
consumer prices stood 4.2 percent above their level of August 1991.
Producers' output prices (n.s.a.) edged up 0.1 percent in August, to
a level 3.3 percent above their year-earlier level. The prices of
producers' materials and fuels (n.s.a.) fell 2.2 percent in August
to a level 1.9 percent below a year earlier.
Record import volume and sluggish exports pushed up Britain's
trade deficit in August. The cumulative current account deficit for
the first two-thirds of 1992 was $19.9 billion (s.a.a.r.), compared
with a deficit of $8.9 billion in the same period of 1991.
The withdrawal of the pound from the ERM caused sterling to
depreciate by about 9-1/2 percent against the DM, and about 9
percent on a multilateral trade-weighted basis. The government
lowered its minimum lending rate by 1 percentage point to 9 percent
on September 22 and is expected to announce new plans for monetary
policy in the next few weeks. Prime Minister Major stated that it
would be some time before sterling reentered the ERM and that

IV-28
certain conditions, such as changes in the ERM and greater cyclical
convergence among ERM members, would need to be met before then.
In Canada, output continued to inch forward in the second
quarter, as GDP increased 0.7 percent (s.a.a.r.). Consumption
expenditure rose 1.5 percent (s.a.a.r.) and the external sector made
a positive contribution to growth, as export volume posted a healthy
gain. However, a sharp drop in expenditure on plant and equipment
caused total investment to fall 6.1 percent (s.a.a.r.), despite a
6.2 percent increase in residential construction. Although the
recovery is five quarters old, output has returned only about half
of the way back to its cyclical peak of early 1990. Consumer and
business confidence both rose in the second quarter, and the
personal savings rate increased to 10.5 percent.
Activity indicators for the third quarter suggest further
weakness. Housing starts (s.a.) dropped 14 percent in August, and
department store sales were down 3 percent from a year earlier.
Total employment (s.a.) rose 0.1 percent, but continued recovery in
labor force participation kept the unemployment rate at 11.6
percent. In July, GDP at factor cost was unchanged, factory
shipments (s.a.) decreased 2.1 percent, new orders (s.a.) fell 3.1
percent, and total retail sales (s.a.) slipped 0.2 percent.
Recent price data show continued success for the Bank of
Canada's efforts to reduce base inflation. The 12-month change in
the CPI, excluding food and energy, fell to 1.7 percent in August.
The all-items CPI was up 1.2 percent over this period, and wholesale
prices rose only 1.5 percent. Wage settlements increased an average
of 2.1 percent (a.r.) during the first seven months of the year,
compared with a 3.6 percent average for all of 1991 and 5.6 percent
in 1990.

IV-29
The current account deficit (s.a.a.r.) widened slightly in the
second quarter to $25.1 billion, as a rebound in imports caused a
moderate decline in Canada's merchandise trade surplus. In July,
the trade surplus (s.a.a.r.) was $6.3 billion, up from June but
virtually unchanged from its first half average, as both imports and
exports rose sharply.
The national unity crisis that has plagued Canada for the past
year may be close to resolution, as Prime Minister Mulroney and the
ten provincial premiers agreed to specific constitutional amendments
on August 28. The proposals will be put before the Canadian
electorate on October 26 in a non-binding referendum. The latest
poll showed more voters opposed to the agreement than supporting it
in Quebec, Alberta, and British Columbia, but a narrow plurality in
favor in Canada as a whole.
The Swedish economy has remained in recession with GDP
declining 2.9 percent (s.a.a.r.) in the second quarter after
declining 2.2 percent in the first quarter of this year. Industrial
production in July was nearly 8 percent below its level a year
earlier; in August, the unemployment rate (n.s.a.) climbed to 5.8
percent, an unusually high rate for Sweden. Weak growth has curbed
inflation; the 12-month CPI inflation rate dropped to about 2
percent in August from its 9-1/4 percent average last year.
The Swedish krona, which is unilaterally pegged to the ECU, has
come under downward pressure since the Danish referendum on EMU
(June 2). Pressure was further intensified by the Finnish decision
to allow the markka to float on September 8 and worries about
Swedish financial institutions. In mid-September the Swedish
Riksbank raised its marginal lending rate to an unprecedented 500
percent but later lowered the rate to 24 percent. To support the
ailing Swedish banking and financial system, the government recently

IV-30
proposed a broad system of guarantees, loans, and capital assistance
for banks and state-connected credit institutions.
In further attempts to defend the krona, on September 20 the
government announced major and permanent cuts to the ballooning
budget deficit (estimated to be near 7 percent of GDP). The
emergency package drastically cut welfare payments and raised taxes
on gasoline and tobacco. The tighter budget is expected to save
about $3-1/2 billion and increase tax revenue by about $1-1/2
billion in 1993.
On September 22, acting Russian Prime Minister Yegor Gaidar
addressed Parliament and outlined recent economic developments.
Industrial production was reported to have declined 21 percent in
July (year/year) and 27 percent in August, compared with a decline
of 13-1/2 percent in the first six months of the year. Retail
prices were reported to have increased 17 percent in July and
8 percent in August. The only bright spot in Gaidar's report was
agriculture, with the 1992 grain harvest forecast at 96 million
tons, compared with 89 million tons last year.
Gaidar also announced that the extension of all credit to
Ukraine had been suspended until a formal agreement specifying
mutual debts between Ukraine and the Russian Federation is signed.
Gaidar called for the elimination of restrictions on Ukrainian
exports to Russia, a step that should enhance the ability of Ukraine
to pay for its imports from Russia.
The exchange value of the ruble has fallen sharply in recent.
weeks. The ruble depreciated from 168 r/$ on August 25 to 254 r/$
on September 29. On September 18 domestic oil prices were more than
doubled from $0.90 per barrel at current exchange rates to $2.10 per
barrel. Prices for petroleum products and coal were also increased.
These price increases should raise government revenues, but the
IV-31
full fiscal impact is unclear because offsetting subsidies for
residential heating, transportation, and agricultural were also
introduced.
Published reports indicate that inter-enterprise arrears (which
had increased dramatically in the first half of the year) were
reduced substantially at the end of August through netting of
offsetting claims. The remaining arrears are estimated to be
between 500 billion and 1 trillion rubles, down from 3.2 trillion
rubles at the beginning of July. This suggests that losses in
state-owned enterprises during the first half of 1992 were 10 to 20
percent of GDP.
Economic Situation in Other Countries
Mexican real GDP growth slowed to 2.8 percent (year-over-year
basis) in the first half of 1992, reflecting sluggish U.S. economic
activity and a tightening of Mexican fiscal and monetary policies.
Political turmoil related to the upcoming impeachment trial of
Brazil's President Collor is delaying needed fiscal adjustments and
implementation of a recently agreed commercial bank debt
restructuring package. Argentina and its bank advisory committee
have agreed to increase the proportion of discount bonds in the
country's debt reduction package to 35 percent, from the 15 percent
initially opted for by the banks. On September 18, Argentina passed
a review of its compliance with its IMF program. Real GDP in
Venezuela in the first half of 1992 was 8-1/2 percent greater than
in the first half of 1991, and the government is acting to limit a
large fiscal deficit. In recent months, economic growth has
weakened substantially in Korea and slightly in Taiwan.
Individual country notes. In Mexico, real GDP growth in the
first half of 1992 slowed to 2.8 percent (H1/H1) after 4.1 percent
growth in the first half of 1991 (H1/H1) and 3.6 percent for 1991 as

IV-32
a whole. In manufacturing, real growth was 2.1 percent in the first
half of 1992 on a year-over-year basis, down from 3.7 percent for
1991 as a whole.
The slower growth rate reflects not only sluggish U.S. economic
activity, but also a tightening of Mexican fiscal and monetary
policies--intended to restrain inflation and limit the trade
deficit. Excluding privatization proceeds, there was an overall
public sector surplus of 7.8 trillion pesos in the first half of
1992, after a deficit of 5.8 trillion pesos in the first half of
1991. Interest rates rose by 500-600 basis points from mid-March to
early August, reflecting slower capital inflows after an April
measure limiting banks' external liabilities, uncertainty as to the
completion of the NAFTA negotiations, and the negative effect on
investor confidence of a stock market sell-off in June.
Capital inflows appear to have increased somewhat after mid-
July, helping to stabilize interest rates in August and early
September. However, rates rose again after mid-September,
apparently reflecting decreased capital inflows. The 28-day
Treasury bill rate was 19 percent at the auction of September 23,
compared with 17 percent on August 12. The peso appreciated from
3,123 per dollar at the end of June to 3,058 per.dollar on September
9, but weakened again and stood at 3,114 per dollar on September 29.
International reserves, including gold, were officially
reported as $18 billion on August 21, an estimated $1.6 billion less
than at the end of April. Mexican reserves are officially reported
only three times a year, and the next report is not expected until
November 1.
Completion of the NAFTA negotiations, announced on August 12,
did not have a lasting impact on the Mexico City stock market. The
stock market index, rose by about 7 percent in the last four days of

IV-33
July, partly in anticipation of a NAFTA announcement, but fell
thereafter. On September 29, it was 32.5 percent lower than the
all-time peak, in June of this year, and 10 percent lower than at
the end of 1991.
The CPI rose by 0.6 percent in August, leaving it 15.4 percent
higher than a year earlier.
In Brazil, the Chamber of Deputies voted on September 29 to
have President Collor undergo an impeachment trial in the Senate.
During the trial, which is expected to start in about a week, Collor
will be suspended from office and Vice-President Itamar Franco will
be the acting president.
The term sheet for a Brady-style commercial bank debt
restructuring package (covering $44 billion in bank debt) has been
completed. However, the fiscal reforms needed to reduce inflation,
bring Brazil into compliance with its IMF program, and facilitate
implementation of the bank debt restructuring are not likely to be
put in place until the present political turmoil is resolved.
Inflation remains about 22 percent per month, where it has been
since February. Cumulative retail sales in Sao Paulo were 16.5
percent lower for 1992 through June than in the first half of 1991,
and real GDP is expected to expand only about 1 percent this year.
Weakness in the domestic economy has slowed the growth of imports,
while exports, especially to Mexico and other Latin neighbors, have
remained robust. As a result, Brazil's cumulative 1992 trade
surplus through August was $10.3 billion, 23 percent greater than in
the same period in 1991. International reserves were unofficially
estimated to have been $20 billion in August. However, reserves
probably declined in the latter part of September, when the central
bank is reported to have spent over $1 billion to support the
cruzeiro.

IV-34
In Argentina, consumer prices rose 1.5 percent in August and
were 18.8 percent higher than a year earlier. No new trade data
have been released since the last Greenbook, but official statements
suggest that the authorities believe that only a small surplus or
rough balance on trade will be realized in 1992. Strong domestic
demand, coupled with an appreciating real exchange rate, has led to
rapid import growth. The real effective exchange rate appreciated
by more than 50 percent over the 18 months ending June 1992.
Argentina and its bank advisory committee have reached
tentative agreement on adjusting the proportion of par and discount
bonds to be issued in Argentina's bank debt reduction package. The
committee agreed to accept a 65/35 percent par/discount bond split,
compared with the 85/15 percent split initially opted for by the
banks. -The committee must now get the broader group of Argentina's
creditor banks to accept the split. The initial split was
unacceptable to Argentina because the par bonds are more costly to
collateralize and because a more balanced split allows Argentina to
borrow from the IMF, the World Bank, and other official lenders
greater resources to finance the collateral. On September 18,
Argentina passed a review of its compliance with its IMF program.
Real GDP in Venezuela in the first half of 1992 was 8-1/2
percent greater than in the first half of 1991. Output expanded 16
percent in the private sector but dropped 3 percent in the public
sector. During this period, Venezuela's consolidated public sector
deficit is estimated to have equaled 6-3/4 percent of GDP at an
annual rate. Since last year, when a small surplus was achieved,
the country's fiscal position has deteriorated sharply due to lower
oil export earnings and privatization revenues. To reduce the
fiscal imbalance, the government has cut spending (especially
outlays by the state oil company) and is seeking legislative

IV-35
approval of a long-delayed value-added tax. The government also
hopes to secure soon final legislative approval for laws to enhance
the independence of the Central Bank of Venezuela, improve bank
supervision and regulation, and restructure the banking system.
After the coup attempt in February, the Central Bank of
Venezuela raised interest rates and intervened in foreign exchange
markets in a successful effort to prevent a rapid depreciation of
the floating rate of the bolivar, which is now about 69 Bs/$,
compared with an end-January rate of 62 Bs/$. The yield on 91-day
central bank bills rose from 33 percent in January to 42 percent in
April, but had eased to 32 percent by mid-September. The consumer
price index rose 33 percent over the 12 months through August, and
inflation has been roughly constant in recent months.
Economic growth in Korea has been weakening in recent months.
GNP rose an estimated 6 percent in the second quarter of 1992
(Q2/Q2), compared with 7.4 percent in the first quarter of 1992 and
9.8 percent in the second quarter of 1991. Consumer prices were 5.9
percent higher in August than a year earlier, down from 9.5 percent
in the year ending August 1991. In the first seven months of this
year, Korea's current account deficit fell to $5 billion from $6.9
billion in the same period in 1991, due to a large deceleration in
import growth.
On September 1, 1992, the Korean governmen; implemented the
revised Foreign Exchange Control Act. In contrast to the previous
version of the Act, foreign exchange transactions are permitted in
principle under the new plan, with exceptions explicitly listed.
Key changes in the regulations appear to be aimed at reducing
constraints on export finance and overseas financing for Korean
firms.

IV-36
In Taiwan, real GDP in the first half of 1992 grew an estimated
6.6 percent (H1/H1), a growth rate about 1/4 of a percentage point
less than in the previous year. A decline in imported goods prices,
due to an appreciation of the NT dollar, has helped to moderate
inflationary pressure. In July, consumer prices were up 3.7 percent
from a year earlier, while wholesale prices fell 3.5 percent from a
year earlier. Taiwan's cumulative trade surplus in the first eight
months declined to $6.8 billion from $7.9 billion in the same period
of 1991, as export growth slowed somewhat and import demand remained
strong.