Embed Size (px)
Citation preview

APPENDIX

NOTES FOR FOMC MEETINGJuly 7, 1987
Sam Y. Cross
In recent weeks, the dollar has firmed and is now
trading between 4 and 9 percent above its lows of late April and
early May. The dollar's improved performance has continued
throughout the period, notwithstanding disturbances that at times
buffeted the currency.
Two such episodes occurred since your last meeting, and
they prompted us to intervene to buy dollars in our only
operations of the period. Both operations were financed equally
out of Federal Reserve and Treasury balances. And both involved
close cooperation with other central banks.
The first occasion, May 19, was associated with the
Citicorp action to increase its loan-loss reserves, when rumors
were circulating about problems in the U.S. banking system, and
speculative pressures were pushing the dollar down in nervous
markets. The Desk entered the market ahead of the Citicorp press
conference, purchasing $60 million against marks. Following
Citicorp's announcement, we continued to support the dollar,
buying a further $73 million against marks in late New York and
early Asia/Pacific trading. As trading began in Tokyo, we were
joined by the Bank of Japan which purchased a modest amount of
dollars against the sale of German marks. Given this support,
the dollar stabilized.
On the second occasion, the dollar came under intense
selling pressure on June 2 when Chairman Volcker announced that
he would not serve a third term. Soon after the announcement,
the dollar fell sharply and the Desk intervened to purchase $315

2
million against marks during that morning. The German Bundesbank
and the central banks of France and Italy operated at the same
time, intervening both in their own markets and in New York.
That afternoon, severe downward pressure on the dollar re-
emerged, accompanied by a continuing steep fall in U.S. bond
prices. As trading became nervous and choppy and prices gapped
downward we reentered the market, buying an additional $95
million against marks as well as $103 million against yen in New
York and in early trading in the Far East, for a total U.S.
intervention of $513 million that day. After the dollar fell as
low as DM 1.78-1/2 against the mark and Y 140-1/2 against the yen
in the Far East, and after Treasury bonds had fallen quite
sharply, selling pressure on the dollar began to subside. As
trading opened in Tokyo, the Bank of Japan intervened to purchase
dollars. Market participants seemed to be reassured by the
intervention operations conducted by the various central banks.
Against this background, there was a strong recovery in U.S. bond
prices and the dollar then recovered from its lows.
In the following weeks the dollar seemed to gain added
support from the resilience it demonstrated during these two
episodes of pressure. An important factor underlying this
strength was that market participants had been impressed by the
willingness of the Federal Reserve during May to adjust monetary
policy to support the dollar, and by the complementary monetary
policy adjustments taken in other industrial countries. Also, at
the end of May, our announcement that the Desk had bought more
than $4 billion during March and April to support the dollar
helped reassure the market of the U.S. commitment to the Paris

3
accord to stabilize exchange rates. Together with the
administrative moves of the Japanese Ministry of Finance to
discourage speculative dollar sales, these actions underscored
the official commitment to stabilize exchange rates.
With the dollar on a firmer footing, foreign investors
began to reappear in U.S. markets, attracted by the very
favorable interest differentials for dollar-denominated assets
that emerged as a result of sharp interest-rate moves both in the
U.S. and in other countries during April and early May. Once
market professionals sensed that private capital inflows were
again financing a significant portion of the U.S. current account
deficit, confidence in the near-term outlook for the dollar
improved and a greater sense of two-way risk developed in the
exchange markets. With the build-up in near-term inflation
expectations also moderating, long-term interest differentials
favoring the dollar narrowed from the very high levels reached in
mid-May.
These interest differentials continue to be strongly
favorable to the dollar. Nevertheless, recent experience shows
that investors can be quick to respond to a change in perceptions
about interest rates and exchange rates. While market
participants were impressed that the Federal Reserve was
concerned enough about the exchange rate to tighten monetary
policy this spring, they remain wary that economic or other
factors might limit the Fed's room to maneuver in the future.
Moreover, comments by foreign officials indicate that Japan and
Germany both face obstacles to further easing of their monetary
policy. On trade, recent statistics have given some comfort that

4
global adjustments are finally occurring, and the risks of a
trade war seem to be diminishing. But the long-term view of the
currency is uncertain and there is a recognition that we still
have a long way to go to restore greater balance to our external
position. Therefore, there is still a lot of negative sentiment
about the dollar for the longer term, and market professionals
understandably are concerned that the process of adjustment might
falter or that U.S. officials might again turn to the exchange
rate to seek reduction of those imbalances.
Intervention in recent months has been in support of
the dollar. But the net amount of dollars purchased by the other
central banks from the G-7 and the rest of Europe fell to $5
billion from $28 billion in the previous intermeeting period.
With the recent steadier performance of exchange rates, market
expectations about central bank intervention have changed
somewhat. Many dealers believe that the G-7 agreed at the Venice
Summit to exchange rate ranges, implying that intervention would
be directed to placing a top as well as a bottom to the dollar,
although in the past couple of days, there have been comments
from the Japanese suggesting they did not intend to intervene at
these levels to stop the dollar's rise. If the dollar should
meet tangible resistance on the up-side that seems to result from
official action, the sense of two-way risk that now exists in the
market may give way to a renewed test on the downside.

NOTES FOR FOMC MEETINGJULY 7-8, 1987
Peter D. Sternlight
Domestic Desk operations since the last meeting of the
Committee were directed at maintaining the somewhat greater
degree of restraint on reserve positions adopted at that meeting.
In effect, this amounted to approximately continuing the degree
of pressure actually prevailing in the weeks just prior to the
May 19 meeting, as that pressure had tended to exceed what was
sought by the Desk. In the background of this past intermeeting
period, there was a generally steady and then gradually
strengthening dollar, moderating growth or even declines in the
monetary aggregates, and an abatement in the signs of price
pressures that were a disturbing factor earlier. Business news
continued mixed, tending to suggest sluggish-to-moderate growth.
In this setting, most interest rates moved lower, reversing part
of the sharp run-up in April and early May.
Reserve paths incorporated a $500 million borrowing
level, compared with $400 million just before the last meeting.
Actual borrowing averaged about $580 million for the three full
reserve maintenance periods. The intermeeting average was
boosted in part by the nearly $800 million level in the two weeks
ended June 3, which largely reflected heavy use of the window
over the Memorial Day weekend, perhaps prompted by imminent
expectations of a higher discount rate. Federal funds averaged

2
close to 6-3/4 percent, though recently showing some tendency to
drift a little lower as market assessments of the extent of the
System's recent firming were moderated.
Compared with the previous intermeeting period,
implementation of policy in the latest interval was "a piece of
cake." We had to cope with high Treasury balances again after
the mid-June tax date, but it was nothing like the experience
after the April tax date, when unpredictedly high balances
combined with unruly upward revisions in reserve paths to upset
our reserve provision efforts time and again. Unlike the
previous period, revisions this time tended to lift reserve
availability and reduce the nonborrowed reserve path as weaker
than expected money growth dampened required reserves. Largely
as a result, nonborrowed reserves exceeded their path levels in
each maintenance period.
With relatively moderate needs, Desk operations were
much smaller in scale than in the previous intermeeting period.
The main outright activity was a $2.5 billion purchase of coupon
issues in mid-June, essentially to help deal with the reserve
impact of rising Treasury balances after the corporate tax date.
In choosing to buy coupon issues in preference to bills, the Desk
was again influenced, as earlier this year, by the relative
scarcity of bills. Up through about mid-June the Desk also
bought about $650 million of bills from foreign accounts. In the
last several days of the period, however, facing an abundance of
reserves in the current maintenance period and prospectively in

3
the next two periods, the Desk sold about $550 million of bills
to foreign accounts. In addition, up until the final several
days of the period, outright operations were supplemented with a
mixture of System and customer-related repurchase agreements to
provide reserves temporarily. There were also two occasions when
matched-sale purchase transactions in the market were used to sop
up reserves on a short-run basis.
Favored by a stable or strengthening dollar, an
abatement of imminent inflation fears, slow money growth, and
mixed news on the real economy that suggested sluggish-to-
moderate growth, most interest rates declined during the
intermeeting period, retracing an appreciable part of the April-
May run-up. The markets were jolted on June 2 by the news of
Chairman Volcker's near-term departure, but they soon recovered
as confidence was regained in the likelihood of continuity of
policy under the new Chairman-designate.
Yields on intermediate and long-term Treasury issues
fell about 40 to 60 basis points amid indications of some
resumption of foreign buying, including Japanese interest. The
Treasury raised about $19 billion in the coupon market, chiefly
in the quarterly 5- and 7-year issues. The Treasury has trimmed
the size of these issues a bit, but they continue to be
substantial net new money raisers.
Meantime, they have continued to pay down bills,
although to a lesser degree than earlier. Bill paydowns
cumulated to more than $7 billion over the period, while rates

4
declined by about 20 to 60 basis points, with the larger declines
in the 6- to 12-month range. The lesser decline for short
maturities partly reflected the fact that financing costs, like
the Federal funds rate, did not show great change over the
interval. Three- and six-month issues were auctioned yesterday
at about 5.62 and 5.68 percent, compared with 6.03 and 6.34
percent just before the last meeting.
In addition to the continuing paydowns and investor
demands, another shadow over the bill market just now is the
possibility that the Treasury may have to pay down one or more
entire issues if timely action is not taken on the debt ceiling.
The ceiling drops sharply after July 17 and without new action
the Treasury could issue no new debt after that date. They are
likely to have sufficient cash on hand to pay off one weekly bill
issue--in fact probably enough for two issues--the July 23 and 30
maturities--but not enough to repay two-year notes on July 31.
With feelings running high in the Congress on what to do about
budget restraint, the upcoming debt limit exercise could be quite
messy.
In other markets, Federal Agency paper continues to
come to market but in some cases at wider spreads over Treasuries
than before. This is particularly true of Farm Credit paper
where spreads on short issues widened to around a full percentage
point compared, say, with 30 to 40 basis points a few months ago.
To be sure, a considerable part of the widening spread reflected
the scarcity of Treasury bills rather than acute disaffection for

5
Farm Credit issues. The spread probably would be far wider but
for the fact that the financial community is well aware that the
Congress is now actively considering measures to support the Farm
Credit System. There has also been a modest widening of spreads
for Federal Home Loan Bank paper; here, too, the move would
undoubtedly be much greater but for the market's awareness that a
FSLIC support package is being developed.
In the course of this period, additional information
became available regarding the extent of dealer losses in the
market downdraft during April and early May. The huge Merrill
Lynch loss was unrivaled in size but some other well-established
and presumably sophisticated firms also incurred painful losses.
Even so, it appeared that the losses hit in places where they
could be withstood. It remains to be seen what sort of lessons
may have been learned about trading today's complex instruments,
but at least there seems to be a continued willingness to
participate in broad market-making activity, including new
Treasury auctions.
As to the state of current market sentiment, the
predominant feeling seems to be that the recent trading range
could well continue for some time, with no clear majority seeming
to favor a breakout toward the higher or lower rate side. Some
participants feel the greater likelihood is that the recent highs
in yields will be tested again as the year progresses, given some
probable strengthening of inflation as the impact of a lower
dollar works its way through the economy. Others are more

6
inclined to expect a further working down of rates given the
recently steadier or stronger dollar, and the likelihood of only
moderate growth in the economy. That's what makes markets.

Michael J. PrellJuly 7, 1987
Overview of the Staff Forecast
The first chart summarizes the principal assumptions that underlie
the staff's forecast. There have been a few changes since our February
presentation. On the financial side, despite the recent rally, interest
rates - particularly long-term rates - are higher than we anticipated they
would be at this point. It seems to us likely that the inflation concerns
and downward pressures on the dollar that led to the spring run-up in rates
will remain a recurrent feature of the economic scene. Consequently, we are
looking for rates to trend upward, with bond yields next year averaging above
their recent highs. In an environment of rising rates, we would expect the
velocity of M2 to increase, so that M2 growth might average about 5 percent
at an annual rate; consistent behavior of M3 probably would be growth in the
vicinity of 7 percent.
On the fiscal side, the assumption about policy action for fiscal 1988
is the same as in February - that is, some combination of spending cuts,
asset sales, and "revenue enhancements" that amount to roughly $25 billion.
Given the assumed economic policies here and abroad, and our view of
what it ultimately will take to achieve an adjustment of our external position
that is acceptable to both policymakers and market participants, we have built
into our forecast a further depreciation of the dollar averaging somewhat under
10 percent at an annual rate. And finally, we have assumed that the price of
imported oil will not change significantly between now and the end of 1988.
The next chart provides some additional information on the federal budget
picture. For fiscal 1987, we are projecting a deficit of about $170 billion.
This marked reduction from the preceding year reflects a combination of
purposeful action on the legislative front plus some favorable surprises,
most notably the big influx of tax revenues from capital gains realized before

-2-
the end of last year. Unfortunately, that surge in revenues is unlikely to
repeat itself: indeed, it may have drawn off some potential future revenues.
In addition, business firms seem to have found enough ways to limit their
liabilities that gains in corporate tax revenues under the new tax code may
fall short of expectations. These influences, along with the higher interest
rates we are now projecting, put our forecast of the fiscal '88 budget deficit
very close to that for this year.
This fiscal outlook clearly is much less favorable than is anticipated
in the budget resolution passed recently by the Congress. The resolution
puts the deficit at the Gramm-Rudman target of $108 billion. To achieve
that, the Congress has proposed a $37 billion package of deficit-reduction
measures, and based its budget estimates on the OMB's economic and technical
assumptions, which are considerably more favorable than those of the Congres-
sional Budget Office, let alone ours. As you know, the $37 billion figure
includes $19 billion of unspecified tax increases, which are to be assembled
in one reconciliation bill with certain outlay cuts; if that bill is rejected,
it is hard to say what the ultimate legislative outcome might be. The
deficit reduction package we have assumed is roughly in line with what was
accomplished last year on the FY 87 budget.
The bottom panel attempts to give some idea of the underlying thrust
of fiscal policy, of which the high employment budget is a traditional measure.
The year-to-year movements are being distorted by the one-time capital
gains revenues and other factors; however, the basic sense of a swing toward
restraint after 1986 has been preserved.
Chart 3 summarizes the major features of the staff forecast in terms of
the items that the Board normally reports to the Congress. Real GNP is

expected to rise 3 percent over the four quarters of 1987 and then 2-1/4
percent next year. As you can see, domestic spending - GNP minus net exports -
should rise appreciably less than domestic output, in contrast to the pattern
earlier in this economic expansion when the terms of trade were moving in our
favor. The deflator for GNP is projected to increase 3-1/2 percent this
year and 3-3/4 percent in 1988; these figures are considerably below what we
are forecasting for consumer prices, which are more directly affected by
rising import prices. And, finally, we are projecting an essentially stable
unemployment rate at about 6-1/4 percent.
As you know, the jobless rate fell last month to 6.1 percent, which was
below what we had built into our forecast. Because of the relatively early
time during the month in which the household survey was taken, it may not
have picked up fully the influx of students into the labor force. Thus, we
would not be surprised to see some bounceback in the next month or two. In
our thinking, 6.1 percent unemployment does not have significantly different
implications for wage and price pressures than 6.3 percent, but a more serious
question is raised by the magnitude of the decline in joblessness since last
fall. That decline has occurred in the face of GNP growth on a par with
what we are projecting for coming quarters. Should such a relationship
persist, counter to our expectation, it would imply a lower trend growth of
productivity and distinctly more inflationary labor market conditions.
Looking further at the recent economic data, chart 4 lays out some of the
indicators that have led us to estimate second-quarter GNP growth at about
2-1/4 percent. The June labor market report showed a second month of
comparatively sluggish growth in payroll employment, but the average monthly
increase for the quarter of about 150,000 is quite consistent with our output
forecast. Manufacturing employment has been inching upward, and our reading
of the payroll data and other available information suggests that industrial
production probably rose another couple of tenths of a percent in June.
The recent gains in overall industrial activity have been achieved
despite cutbacks in auto assemblies. Those cutbacks constituted a direct
drag on real GNP growth of around 1-1/2 percentage points in the second
quarter. As the middle left panel indicates, sales of domestic cars remained
unimpressive through June, and we expect that lower auto output will slice a
little off GNP growth in the current quarter as well. In this regard, I
should mention that we have not built into our forecast any disruption from
an auto strike.
Consumer spending on items other than motor vehicles has been lackluster
as well, as shown at the right, but combining this with a somewhat higher
average level of motor vehicle sales than earlier in the year, we think
there was a moderate increase in total consumer outlays in the second quarter.
With the upturn in interest rates after March, both total housing
starts and sales of new homes declined through May; thus, residential
construction probably contributed a small negative to real GNP last quarter.
Business fixed investment appears to have snapped back, however, after the
tax-related plunge at the beginning of the year. Shipments of nondefense
capital goods have risen above the first-quarter level, and equipment outlays
also were boosted by higher car and truck sales. Outlays on structures may
have been up a tad, judging by the construction figures in the chart and the
reported pickup in oil drilling.

-5-
The available pieces of the domestic spending picture don't add up to
what we see for second-quarter production. Our guess is that the gap was in
large part filled by a further significant gain in net exports. On that
note, let me turn things over to Ted for a discussion of international
developments.

E.M.TrumanJuly 7, 1987
FOMC Chart Show -- International Developments
The upper panel in Chart 5 presents a familiar picture
of the weighted-average foreign exchange value of the dollar
against the currencies of other G-10 countries in real (or price-
adjusted) terms and the differential in real long-term interest
rates between the United States and those countries.
Our revised assumptions about the future course of
monetary policy here and abroad coupled with the recent behavior
of the differential between U.S. and foreign real long-term
interest rates--the red line--have led us to alter our projection
for the dollar. As you can see on the chart, the interest rate
differential continued to decline through most of last year and
early this year, but it has since turned up again. We are
assuming that it will widen by a further 100 basis points or so
over the forecast horizon.
The black line on the chart shows the value of the
dollar adjusted for movements in consumer prices here and abroad.
On this measure, the dollar has declined almost 40 percent since
its peak in February of 1985 and by about 7 percent over the past
six months. As Mike indicated, we are projecting that the dollar
will continue to depreciate over the forecast period, but more
slowly--at an annual rate of somewhat less than 10 percent.
Because consumer prices are expected to be rising more in the
United States than on average abroad over the forecast period,

- 2 -
the rate of depreciation of the dollar in real (or price-
adjusted) terms would be around 7-1/2 percent at an annual rate,
this would be slower than the rate of depreciation over the past
two years. Meanwhile, we expect the dollar to depreciate at
about half that rate in real terms on average against the
currencies of our major trading partners in Asia and Latin
America--somewhat faster than over the past two years.
As can be seen in the lower panel of the chart, the
improvement in U.S. price competitiveness to date has essentially
halted the deterioration of the U.S. current account balance.
Our projection calls for the deficit to shrink from about 3-1/2
percent of GNP currently to about 2-1/2 percent of GNP by the
fourth quarter of 1988.
Turning to the next chart, progress against inflation
both here and abroad has been arrested. The turnaround in
petroleum prices since a year ago is one element common to these
trends. As can be seen in the upper left-hand panel, wholesale
prices in the United States--the black line--have been rising
relative to a year ago. Because of the offsetting influence of
currency appreciation, wholesale prices in the major foreign
industrial countries--the red line--are still declining on a
year-over-year basis, but to a lesser extent.
Not all the price pressures this year have come from the
oil market. The right-hand panel shows that the broad Economist
index of commodity prices, which excludes oil, has turned up
measured both in dollars--the black line--and even in foreign
currencies--the red line.

- 3 -
The lower panel shows our assumption about the U.S.
import price of oil and, for reference, the spot price of West
Texas Intermediate crude oil. The average price of U.S. imports
of crude oil and petroleum products was $16.80 in April. We are
assuming that the price will rise slightly further to $17.50 by
the fourth quarter of this year and will remain at that level
throughout 1988. This assumption is consistent with a scenario
in which the OPEC agreement holds and the members of OPEC respond
to pressures associated with growing demand by increasing their
production rather than by raising prices. However, this is
clearly one area of upside risk to our inflation projection.
The top panel on Chart 7 compares our outlooks for
consumer price inflation here and abroad. As you can see, over
the past three years the rate of increase in consumer prices was
slower in the United States than in the major foreign industrial
countries; last year, of course we all benefited as consumers
from lower petroleum prices. This year we are projecting that
U.S. consumer prices will rise at a rate almost 2 percentage
points faster than consumer prices on average in the major
foreign industrial countries. Next year, with less appreciation
of their currencies to offset their underlying rates of
inflation, the differential in inflation rates narrows to about
1-1/2 percentage points.
The middle panel presents our outlook for growth in
Europe and Japan--a potentially critical determinant of the
outlook for our own external accounts. Unfortunately, we
continue to see little reason to anticipate substantial help from

- 4 -
this area. We expect both real GNP and real domestic demand to
grow less on average this year than last, and growth of domestic
demand to slip further next year. This outlook is predicated on
implementation of announced policies in the fiscal area and only
slightly easier money market conditions on average. In general,
the authorities in the major foreign industrial economies are
unwilling or unable to offset the drag on their economies arising
from external developments.
Largely as a consequence of the slower growth in the
industrial world, economic activity in the rest of the world as a
whole, shown by the red bars in the bottom panel, has been on a
declining trend since 1984. It is expected to be less vigorous
than in the United States this year and no more vigorous next
year. Thus, in our forecast essentially all the adjustment of
the U.S. external sector comes via exchange rates and, to a much
lesser extent in 1988, from slower growth of spending in the
United States.
The two panels at the top of the next chart summarize
the evidence to date on that adjustment process as it has
affected U.S. merchandise imports of non-oil products. The left-
hand panel shows the acceleration in the prices of imports over
the past year in the broad categories of industrial supplies,
capital goods, and consumer goods. As is shown in the second
column of the right-hand panel, these increases in prices have
helped to induce a slowing in the growth of the volumes of our
non-oil imports. With the exception of industrial supplies, the
slower growth is apparent in all categories of non-oil imports.

- 5 -
The two panels at the bottom of the chart present our
forecast for non-oil imports in the aggregate. As is shown in
the left-hand panel, we expect the average price of those imports
to accelerate to almost a 10 percent annual rate of increase, as
the continuing effects of the dollar's depreciation are felt in
an environment in which foreign suppliers have to a large extent
exhausted the scope for further reductions in profit margins. As
is shown by the red line in the right-hand panel, these rapid
increases in prices along with somewhat slower growth in
underlying demands are expected to produce a slight decline in
the volume of non-oil merchandise imports over the next six
quarters. Of course, the value of such imports will continue to
increase, although more slowly, along with their price.
Turning to U.S. oil imports, the left-hand panel at the
top of Chart 9 illustrates the erratic quarterly pattern of these
imports in recent years. As shown by the red line, the volume of
U.S. imports of petroleum and products was very high in the third
quarter of 1986 as prices bottomed out on world markets. We saw
a quantity adjustment in the fourth quarter of last year and the
first quarter of this year. However, U.S. inventories have been
drawn down, and we expect the volume of such imports to resume
an upward trend under the influence of declining domestic
production and rising consumption needs. With the additional
effect of higher prices, the value of U.S. oil imports is
projected to reach about $45 billion in the fourth quarter of
next year, up about $12 billion from the average in 1986.

- 6 -
On the export side, we do not expect much improvement in
the area of agricultural exports--the right-hand panel. Although
the volume of such exports has recovered substantially from the
lows of last year, and we think there was a temporary blip as a
result of increased exports to the U.S.S.R. in the second
quarter, the medium-term trend is for only a gradual expansion in
volume. The value of U.S. agricultural exports is expected to
pick up somewhat more rapidly as prices of feedgrains, soybeans
and cotton recover from recent lows.
Given our projection for the other broad categories of
our merchandise trade account, we must rely'on nonagricultural
exports to produce most of the anticipated improvement. As is
shown in the lower left-hand panel, over the year ended in the
first quarter of this year, there was a smart acceleration in the
volume of most categories of nonagricultural exports, compared
with the previous four quarters. The most significant increases
have been registered in capital goods, especially business
machines, and industrial supplies, especially chemicals.
As the red line in the right-hand panel illustrates, we
are projecting continued rapid growth in the volume of U.S.
nonagricultural exports, largely as a consequence of the lagged
effects of the improved U.S. price competitiveness that we have
already seen and the further improvement that is built into our
forecast. The average price of our non-agricultural exports is
expected to increase at an annual rate of more than 4 percent,
giving a small extra boost to our projection of the value of
those exports.

- 7 -
I should note that there are two important uncertainties
in our forecast for the U.S. trade position, aside from the
standard uncertainties associated with the future course of
underlying determinants. First is the issue of protectionism:
we have assumed that enactment of U.S. trade legislation will not
produce a sharp break in the trend of our forecast, but we have
built into our forecast a presumption that, as a consequence of
the rising tide of protectionism around the world in recent
years, quantities will be somewhat less responsive to changes in
relative prices in the future than they have been in the past.
Second, the adjustment in exchange rates that we have had over
the past two years has just about reversed the dollar's
appreciation over the previous four years. Both were essentially
unprecedented. As a consequence, we lack the kind of experience
in our historical statistics that one would like to have in
constructing forecasts.
With those qualifications, Chart 10 summarizes our
projection for U.S. external balances. As Mike has already
noted, our forecast for real GNP continues to rely heavily on
the turnaround in our real net exports of goods and services, the
red line in the top panel. In February the projected turnaround
was an analytical presumption; now we have some concrete
evidence. We also expect that next year we will begin to see a
turnaround in the current account balance measured in current
dollars--the black line. But we anticipate that progress on this
measure will be slow, and it could well disappoint market
participants and/or policymakers.

- 8 -
The table at the bottom of the chart provides a summary
of U.S. capital transactions. I would make two points about the
data displayed. First, the role of official capital inflows--
line 3--is expected to increase compared with last year, but not
to the exceptional degree we saw in the first quarter of this
year. As the memorandum items at the bottom of the table show,
U.S. and G-10 intervention purchases of dollars equalled the U.S.
current account deficit--line 8--in the first quarter of this
year. However, official capital inflows registered in the U.S.
balance of payments statistics for that quarter were less than
half the amount of those intervention purchases. Second, we will
continue to rely heavily on net private capital inflows--line 2--
to finance our current account deficit directly or indirectly.
Mike will now continue our presentation with a review of
the domestic economic and financial outlook.

Michael J. PrellJuly 7, 1987
Domestic Economic and Financial Outlook
Chart 11 focuses on some of the domestic consequences of the external
adjustment Ted has been describing. A close inspection of the upper panel
indicates that those manufacturing industries where imports and exports
bulk larger than average relative to shipments have begun to show some greater
strength this year. The pickup in those sectors has been reflected in the
better growth of total industrial production in the past 12 months, which is
indicated in the figures at the right.
If that is the good news, the lower panels are the bad. The combination
of rising import prices and protectionist measures appears to be leaving a
greater mark on domestic inflation than we had anticipated. To be sure, at
the consumer level, the acceleration in prices overall in the first half of
1987 was largely a product of the backup in oil prices; this is evident in
the panel at the left. But, as may be seen at the right, the remainder of
the acceleration in the CPI was attributable to commodities other than food
and energy. Within this component, some of the sharpest increases have been
among items, such as as apparel, for which we depend heavily on'imports.
The available evidence suggests that domestic manufacturers have not
been especially aggressive in marking up their prices in response to reduced
foreign competition. Nonetheless, the bottom left panel shows the upturn in
producer prices of intermediate materials and supplies, on which the pressures
from rising dollar costs of basic commodities and high rates of capacity utili-
zation in some industries are manifesting themselves; the latest purchasing
managers report, released yesterday, suggested that this upswing may have
continued in June.

The broad acceleration in prices has not escaped the attention of the
public: as you can see at the right, the Michigan survey of households
showed an average one-year inflation expectation in May about a percentage
point above the level reported in March; the June figure, received too late
for inclusion, was down only two-tenths.
Inflation expectations are of course an important factor in wage
behavior. The drop in expected inflation last year undoubtedly contributed
to the deceleration in compensation, which is visible in the top left panel
of chart 12. We have as yet no comprehensive labor cost data beyond the
first quarter, and it may take a while for the recent pickup in price increases
and expectations to show through - but we expect that they will start to do
so in the second half of the year.
The reduced slack in labor markets is a factor in our thinking about
wage pressures. Aggregate unemployment most likely is now in the range of
the natural rate and thus can't be expected to exert much, if any, downward
force on wage inflation. The top and middle panels highlight some possible
pressure points. First, as you can see, the recent trend in employment costs
in the service-producing sector has been less favorable than that in the
goods-producing sector; the service industries are much more dependent on
female workers, and the jobless rate for women over 25 already is below its
level in the late 1970s when overall unemployment reached the low for that
cycle. On a regional basis, portrayed in the middle panels, compensation
increases have not diminished in the past couple of years in the Northeast,
where unemployment has been comparatively low. I might note that the chart
would look quite similar if the West or Midwest were substituted for the
South.

As indicated in the bottom panel, we are projecting only a mild step-up
in compensation increases this year. Next year, however, compensation will
be boosted about three-tenths of a percent by higher payroll taxes and the
faster consumer price increases will be feeding through to wages. We expect,
though, that compensation gains will fall short of consumer price increases,
cutting into real wage rates.
The result, in our forecast, is a retardation of growth in real labor
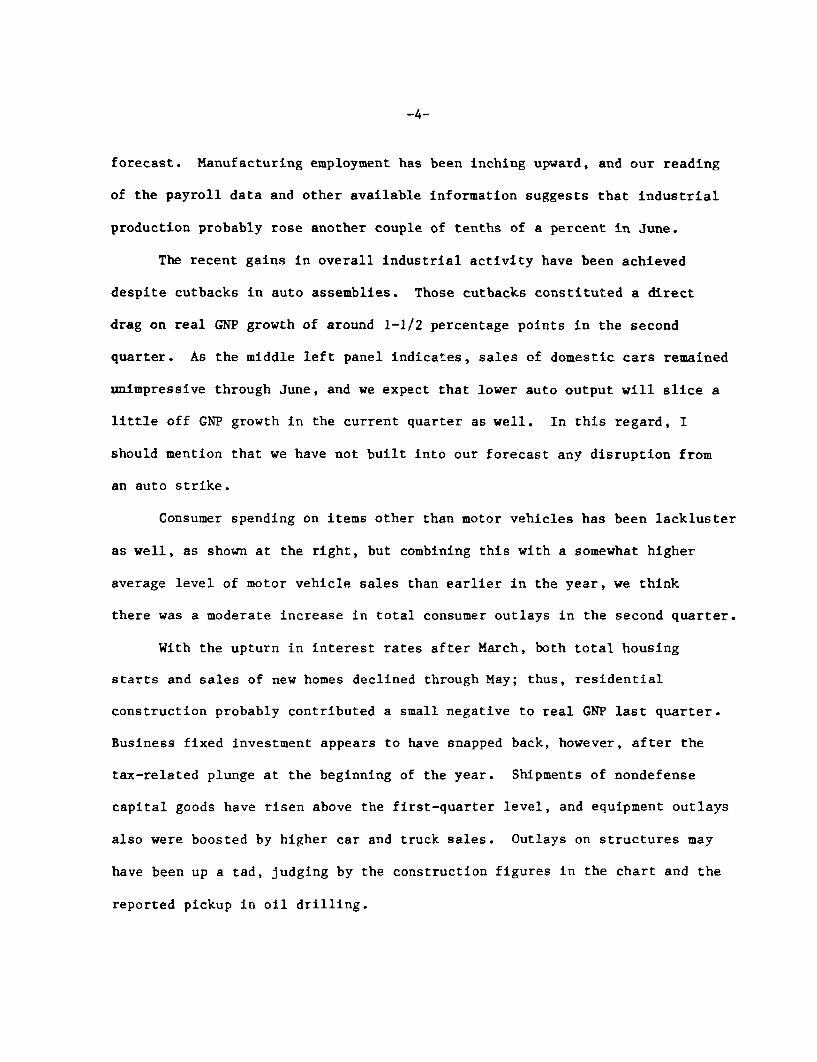
income and a weakening of consumer spending. The top panel of chart 13
shows that consumption expenditures moved up sharply as a percent of GNP
over the past several years - to an historically high level -- and that share
is expected to decline appreciably by the end of 1988, in effect making way
for a sizable increase in the share of net exports. As may be seen in the
middle left panel, a large portion of the spending slowdown is projected to
occur in outlays for durable goods, which were extremely strong during the
past few years. Overall, real consumer spending, as indicated at the right,
is expected to accelerate temporarily in the second half, as car manufacturers
step up their efforts to clear out '87 models, but we have an increase of only
1 percent next year. That is in line with projected growth in disposable
income and implies a continued low personal saving rate. Barring a substantial
reversal of recent gains in household wealth, persistence of a low saving rate
would be consistent with past experience, as suggested by the bottom panel.
One element in the anticipated sluggishness of spending on consumer durables
is the weakness of home building in our forecast - shown in the next chart.
Although interest rates on fixed-rate mortgages are currently about a 1-1/4
percentage points above the nine-year lows reached in March, and history
suggests that the full effects of a rate increase are not felt for several

months, we are not expecting a significant further drop in single-family
housing starts in the near term. One consideration, indicated at the middle
left, is that monthly payments associated with new fixed-rate loans are still
comparatively low relative to income. Moreover, rates on adjustable-rate
loans - shown at the right - have risen very little, so that many homebuyers
can hold down their initial payment burdens by using ARMs rather than fixed-
rate loans; in fact, the proportion of new conventional loans closed with
adjustable rates jumped from 22 to 36 percent between early April and early
June. As time passes in our projection, however, weak real income growth
and rising mortgage rates combine to produce a further erosion of single-
family starts. On the multifamily side, the adjustmentto high rental
vacancy rates and to adverse tax-law changes has been underway for a while;
but building activity in this sector is likely to remain subdued, especially
in the projected financial environment.
The outlook for income and spending flows points to growth in household
sector debt below the pace of the past few years; this may be seen in the
table in the bottom panel. The graph at the left points out the compositional
change that has occurred in borrowing - away from consumer installment credit
and toward mortgage credit. It seems likely that already heavy installment
debt burdens would have fostered a reduction in this form of borrowing, but
that influence has been augmented by the reduced deductibility of consumer
interest expenses and active promotion of home equity lines.
Turning now to the business sector, the top panel of chart 15 shows the
projected pattern of fixed investment. As I noted earlier, available indica-
tors point to a bounceback in capital spending in the second quarter. Over
the remainder of the forecast period, we expect to see moderate growth in the

-5-
equipment category and a generally weak performance by the structures compo-
nent. As noted in the middle left panel, hints of an upturn have appeared
recently in orders for nondefense capital goods; this is true even after one
strips away aircraft and parts which tend to have only a loose link to domestic
equipment outlays, especially in the shorter run. Moreover, a significant
part of the recent improvement in orders has been in computers and office
equipment, and because of the low deflator for this group it packs a big
wallop in terms of measured real spending. Survey evidence suggests that
businesses are still emphasizing modernization and productivity enhancement
in their capital spending plans, and this bodes well for equipment outlays.
The data on contracts, at the right, suggest some firmness in construction
activity as well in the near term. The rebound in contracts has been
attributable entirely to a strong upswing in the institutional category,
reflecting a surge in building by private schools. Spending on structures
also may be boosted further by gains in oil drilling. However, the overhang
of unused office and hotel space and excess utility capacity lead us to
predict a small further decline in 1988 for total structures outlays.
As for inventories, the only serious imbalances appear to be in the auto
area. The bottom left panel indicates that the stock-to-sales ratio for all
other manufacturing and trade maintained a slight downward trend through April.
We are looking for continued moderate accumulation in this broad grouping,
partially offset in the third quarter by a reduction in auto dealer inventories.
After that, stocks are projected to rise in step with sales.
Although the balance sheet posture of many firms looks less than robust,
businesses as a group are not expected to face significant financial constraint
on their spending. The top panel of the next chart shows that, among nonfinancial
corporations, outlays for inventories and fixed capital are projected to exceed

internal funds by only a moderate amount. Borrowing, however, is expected
to continue outstripping by a wide margin what is needed to cover the financing
gap. As indicated in the middle panels, corporations have been retiring huge
volumes of stock in connection with mergers, takeovers, and share buybacks.
Despite the disincentives imposed on' some types of transactions by tax
reform, such activity has been well maintained thus far in 1987 and we have
assumed only a gradual tailing off in coming quarters. As far as debt issuance
is concerned, the backup in interest rates in May prompted many firms to
turn away from the bond markets, but the more recent rate decline has brought
a revival in long-term financing. In the projected interest rate environment,
bond issuance may well occur in fits and starts as firms pick their spots,
and the predominance of long-term over short-term borrowing probably will
not be as great as it was in the more hospitable environment of the past
couple of years.
My final chart gives a brief overview of the government sector. State
and local real purchases rose at a 4 percent annual rate in the first quarter,
on the strength of a further surge in construction outlays. We are projecting
a slowing to the 2 to 2-1/2 percent range in subsequent quarters, with a
deceleration in construction activity. As indicated at the right, the
state and local budget position has deteriorated markedly over the past
couple of years. The second quarter probably saw a move back to surplus, owing
to the windfalls from federal tax reform; however, deficits are likely to be
the story for a while thereafter, in light of the economic problems of some
locales and the continued use of an accumulated bond proceeds for capital
outlays.

At the federal level, the momentum of defense procurement programs
is buoying growth of non-CCC outlays this year, but in calendar 1988 cutbacks
in defense appropriations are expected to show through in reduced total real
purchases. Under our assumptions, however, the federal deficit will not be
changing much, and - owing to movements in cash balances - federal borrowing
may increase slightly next year, State and local borrowing is expected be
comparatively moderate in coming quarters, with advance refunding activity
continuing to be discouraged by the higher level of interest rates. All
told, total borrowing by the domestic nonfinancial sectors is projected to
shrink considerably this year and to increase little in 1988. Translating
these figures into percentage changes in the outstanding stock of debt, and
measuring on a quarterly average basis, domestic nonfinancial sector debt
should decelerate to a 9-1/4 percent increase for 1987 and 8-3/4 percent for
1988. This would represent a considerable narrowing of the gap between
debt and GNP growth that has characterized this decade.
Ted will now conclude our presentation.

E.M. TrumanJuly 7, 1987
FOMC Chart Show - Conclusion
Chart 18, the last chart in your package, presents the economic
forecasts of Board members, Presidents, and the staff. The bottom panel
displays the forecasts for 1987 that were presented to Congress in
February. The general outlook for 1987 has not changed greatly over the
past five months. However, a close examination reveals the hint of more
rapid inflation now expected for this year and the surprisingly sharp
drop-off of the civilian unemployment rate.
For 1988, the forecasts suggest a further rise in inflation, as
measured by the GNP deflator, and a rather broad consensus that growth
next year will continue in the range of 2 to 3 percent. I should note
that, with the revision in our projection for the dollar, the further
depreciation has only a small effect on the staff's forecast for the
GNP deflator.
The Administration and CBO have not yet completed their updates
on the economic outlook-and may not until next month. We do not
anticipate much change to the outlooks that were released earlier in the
year-aside from recognizing the lower unemployment rates and, perhaps,
boosting the deflator somewhat.
By way of conclusion, I would note that the staff forecast
incorporates elements of optimism as well as elements of substantial
risk. On the optimistic side, we see the economic expansion continuing
into its seventh year, which would be a peacetime record, and we are
projecting significant progress in the adjustment of our external
accounts despite an unfavorable international economic environment.

-2-
However, our forecast also contains clear risks. Several relate to
inflation: oil prices, other commodity prices, the dollar, and possible
pressures in U.S. labor markets. In essence, our forecast portrays a
process of economic adjustment that avoids, at least for the next six
quarters, the financial stresses and recession conditions that might
normally be the fate of economies with severe external and internal
imbalances.
Mr. Chairman, that completes our presentation.

STRICTLY CONFIDENTIAL (FR) CLASS II-FOMC
Materials for
Staff Presentation to the
Federal Open Market Committee
July 7, 1987

Chart 1
Principal Assumptions
Monetary Policy
* interest rates rise appreciably over the projection period.
* M2 grows at around a 5 percent annual rate and M3 at about a 7 percentrate over the next six quarters.
Fiscal Policy
* Deficit-reducing actions of about $25 billion in FY1988.
Other
* Foreign exchange value of the dollar declines at somewhat less than a 10percent annual rate.
* Little further change in the price of crude oil.

Chart 2
Federal Budget
Outlays
Receipts
Deficit
memo:
Gramm-Rudman Target
FY86
(actual)
990
769
221
172
FY87
Staff
1014
845
169
Staff
1054
886
168
144
FY88Congressional
Resolution
1041
933
108
108
BUDGET DEFICIT RELATIVE TO GNPPercent of Potential GNP Percent of GNP
NIPA Deficit
NN
NN
High Employment Deficit
1984 1985 19861982 1983 1987 1988

Chart 3
REAL GNPPer
SGNP
GNP Less Net Exports (Secondbar)
1986 1987
GNP DEFLATORPer
1986 1987
CIVILIAN UNEMPLOYMENT RATE
cent change, Q4 to 04
1988
cent change, Q4 to Q4
1988
Percent
-4 6.5
6 1
1986
1987
1988
Q4 Level
6.9
6.3
6.3
1986
1987
1988
-1 7
1987 1988------
1987 19881986

Chart 4
NONFARM EMPLOYMENTAverage monthly change, thousands
S-- 4001 Total
- E Manufacturing (Second bar) -300
2-00
L
100
100
INDUSTRIAL PRODUCTIONIndex 1977 = 100
1986 1987 1986 1987
DOMESTIC AUTO MARKETMillions
Sales
/ AProduction
of units, arREAL CONSUMPTION LESS AUTOS
Percent change, ar
-- I 10
-- 6
1986 1987 1986 1987
HOUSING STARTS AND SALESMillions of units, ar Millions of units, ar
BUSINESS INVESTMENTBillions of dollars Billions of dollars
-- 2
Starts
New Home Sales
1.8 28
-- 1.6
1.4 24
1.2 221986 1987
* Shipments of nondefense capital goods.* Nonresidential construction put In place.
0.9
0.8
1986 1987

Chart 5
FOREIGN EXCHANGE VALUE OF U.S. DOLLAR AND INTEREST RATESPercent Index, March 1973=100
- 160
Price-Adjusted Value of U.S. Dollar *
140
Differential in Real Long-Term Interest Rates *
(U.S. minus other G-10) 120
/ I .i7 100
1974 1976 1978 1980
CURRENT ACCOUNT AS PERCENT OF GNP
I 7
1982 1984 1986 1988
Percent
p-
J f I 1 J J J 1 J J J J l 4
1974 1976 1978 1980 1982 1984 1986 1988
Real interest rates are calculated using a 36-month centered moving average of inflation rates,using staff forecasts where necessary.
**Weighted average dollar against other G-10 currencies using total 1972-76 average trade adjustedby relative consumer prices.

Chart 6
WHOLESALE PRICES
Percent change from year earlier
193 19 19 1101983 1985 1987 '
COMMODITY PRICES
Index, January 1982 = 100
In Foreign Currencies*
1983 1985 1987
OIL PRICESDollars per barrel
Spot Price ofWest Texas Intermediate
U.S. Import Price
*Weighted average of the six major foreign industrial countries using total 1972-76 average trade.
1982 1984 1986 1988

Chart 7
CONSUMER PRICESPercent change, Q4 to 04
F- United States-. Foreign Industrial Countries* (Second bar)
in -" "~"
II il^ ^OII *1984 1985 1986 1987 1988
ECONOMIC ACTIVITY: JAPAN AND EUROPE**Percent change, Q4 to 04
I Real GNP***
- Real Total Domestic Demand*** (Second bar)
1984 1985 1986
ECONOMIC ACTIVITY: WORLD
7 U.S. Real GNPF- All Foreign Countries Real GNP***
1984 1985 1986
1987 1988
Percent change, 04 to 04S6
(Second bar)
L....[llmff1987 1988
-iS
'4
S3
-2
-- 10-'0
* Weighted average of the six major foreign industrial countriesusing total 1972-76 average trade.
** Germany. France, Italy, and the United Kingdom.***Weighted average using U.S. non-agricultural exports, 1978-83.

Chart 8
Prices of Non-oil Imports*
Percent change
1986Q11985Q1
1. Food 5
2. Industrial Supplies -4
3. Capital Goods 2
4. Automotive 8
5. Consumer Goods 3
6. Total Non-oil 2
1987011986Q1
-1
1
10
8
8
6
* NIPA fixed-weight indexes
Volumes of Non-oil Imports*
Percent change, annual rate
1986Q3198503
1. Food 10
2. Industrial Supplies 8
3. Capital Goods 24
4. Automotive 10
5. Consumer Goods 14
6. Total Non-oil 13
*Excluding gold
PRICE OF NON-OIL IMPORTSRatio scale.
index, 1982 = 100
NON-OIL IMPORTSRatio scale.billions of 1982 dollars
Ratio scale,billions of dollars
// -
/
-1100
I I I I I
450 1-
360 k-
270 -
-- 450
Volume- - -
360
-- 270Value
I I I I l I90 1801984 1986
1987Q1198603
-1
8
1
0
6
4
1988 1984 1986 1988

Chart 9
OIL IMPORTSRatio scale,MBD
Ratio scale,billions of dollars
AGRICULTURAL EXPORTSRatio scale, Ratio scale,billions of 1982 dollars billions of dollars
S.6036A -- Volume
32 - \ .,...
/ - 40
28 - \ /Value
Value
I I I 20241984 1986 1988 1984 1986 1988
Volumes of Nonagricultural Exports*
NONAGRICULTURALRatio scale,billions of 1982 dollars
EXPORTSRatio scale,
billions of dollars
Percent change
1986Q1 1987Q11985Q1 198601
1. Industrial Supplies
2. Capital Goods(ex. aircraft)
3. Automotive
4. Consumer Goods
5. All Other
6. Total Nonagricultural
-1 9
4 10
-4 7
-1 17
13 11
2 10
*Excluding gold
300
250
200
Volume
1986
300
250
200
1984 1988

Chart 10
EXTERNAL BALANCESBillions of 1982 dollars
40Billions of dollars
Surplus
\ Deficit
Real GNP Net Exports of Goods and Services-- 40
Current Account Balance
1984 1986 1988
S120
160
200
U.S. Capital TransactionsBillions of Dollars, Net Inflows = +
1984 1985 1986 1987Q1 ** 1987P
1 Net Private and Official Capital 80 98 117 38 133
2 Private Capital 86 106 84 22 84
3 US and Foreign Official Capital -6 -8 33 16 49
4 United States* -9 -7 -2 2 2
5 G-10 Countries 3 0 31 15 45
6 Other 0 - 1 4 - 1 2
7 Statistical Discrepancy 27 18 24 -1 21
Memo
8. Current Account -107 -116 -141 -37 -154
Intervention
9 US Purchases of Dollars 0 -4 0 2 n.a.
10 G10 Purchases of Dollars -4 -14 21 35 n.a.
pProjected*Includes US official reserve assets and other U.S. government assets**Differs from data published by the Department of Commerce on June 16 because of later data revisions
40
80
120
160
200

Chart 11
MANUFACTURING OUTPUTIndex, 1984 Q1 = 100
Other- 110
- 105
Trade Sensitive Industries
1984 1985
CONSUMER PRICE INDEXESPercent
1986
change, ar
1987
CONSUMER
Total IP
Percent change
Year endedJune 1985 1.5
Year endedJune 1986 .5
Year endedJune 1987 3 .0 p
PRICE INDEXESPercent change, ar
Totalless Energy
Total
I V i1985 1986 1987
PRODUCER PRICES OF INTERMEDIATEMATERIALS AND SUPPLIES
Index, Dec. 1986 = 100
6
4
2
Servicesless Energy
1985
INFLATION EXPECTATIONS
Excluding Food and Energy
1985 1986 1987
6
4
2
1986 1987
Percent
1984 1985 1986 1987 1984

Chart 12
EMPLOYMENT COST INDEXPercent change from year earlier
Private Industry
Service-producing
Goods-producing
1984 1985 1986
EMPLOYMENT COST INDEXPercent change from
Private Industry
- South
1987
6
4
2
year earlier
1978 1981 1984 1987
COMPENSATION AND CONSUMER PRICESPercent change
F Compensation per Hour(04 to 04 change)
UNEMPLOYMENT RATES
Persons Aged 25 and Over
Percent
1978 1981 1984 1987
REGIONAL UNEMPLOYMENT RATESPercent
1978 1981
from year earlier
1986 1987 1988
1984 1987
Real Compensationper Hour
Percent change,Q4 to 04
1986 .6
1987 -1.6
1988 -. 2
1984 1985
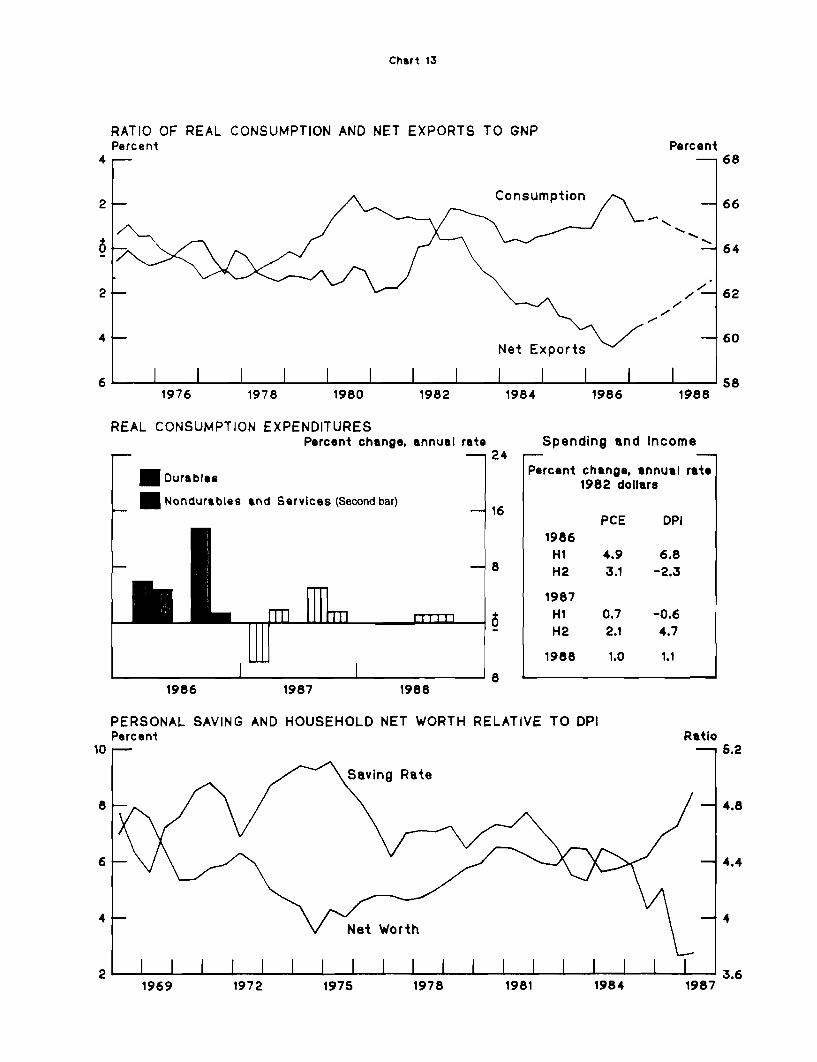
Chart 13
RATIO OF REAL CONSUMPTION AND NETPercent
EXPORTS TO GNP
1976 1978 1980 1982 1984 1986 1988
REAL CONSUMPTION EXPENDITURESPercent change,
Durables
Nondurables
annual rate
and Services (Second bar)
Spending and Income
Percent change, annual rate1982 dollars
PCE DPI1986H1H2
1987H1H2
1988
4.9 6.83.1 -2.3
0.7 -0.62.1 4.7
1.0 1.1
1986 1987 1988
PERSONAL SAVING AND HOUSEHOLD NET WORTH RELATIVE TO DPIPercent Ratio
Saving Rate
8 -
6 -
- 4.8
- 4.4
-14Net Worth
I I I I I I I I I I I I I I I I I I I
Percent
1969 1972 1975 1978 1981 1984 1987

Millions of units, annual rate
Single-family
Multifamily
I I I1984 1985 1986 1987
MORTGAGE PAYMENT AS PERCENT
OF HOUSEHOLD INCOME Percent
-Fixed-rate loan
1984 1985 1986 1987
SELECTED HOUSEHOLD BORROWINGBillions
Total Housing Starts2.5 -
Millions of units
2Total Single Multi
-~~~~ 1 -- .5
1988
NEW
-28
- 24
-20
1986
1987
1988
1.82
1.66
1.57
MORTGAGE COMMITMENT RATESPercent
1984 1985
of dollars, annual rate400
S300
-A 200Home Mortgages
Instal t 100
Installment Credit
I94 18 196 I8 198
1986 1987
Household SectorDebt Growth
Percent
1984 13.0
1985 14.2
1986 11.9
1987 9.6
1988 9.9
Chart 14
HOUSING STARTS
r--
c , - I ,,, ~r,
1987 19881984 1985 1986
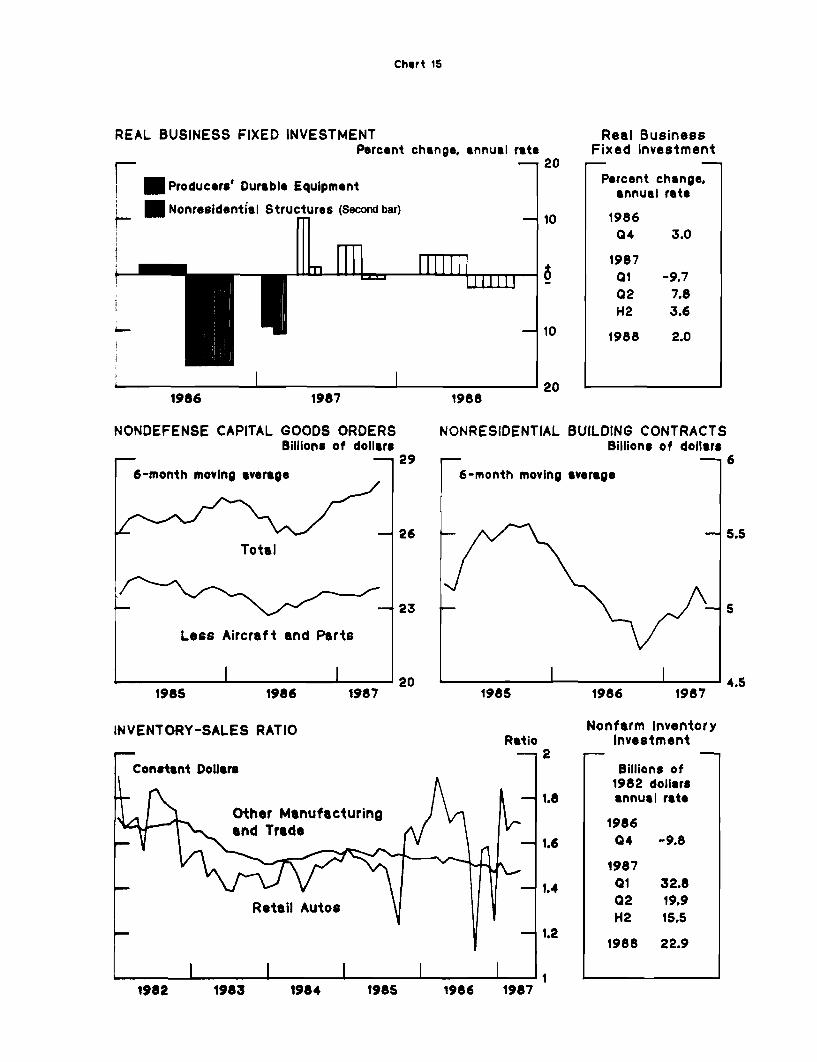
Chart 15
REAL BUSINESS FIXED INVESTMENTPercent change, annual rate
I Producers' Durable Equipment
I Nonresidential Structures (Second bar)
. -I I
1986 1987
NONDEFENSE CAPITAL GOODS ORDERSBillions of dollars
S- 296-month moving average
26Total
ss Aircraft and Parts23
Less Aircraft and Parts
1985 1986
INVENTORY-SALES RATIO
1987
10
10
1988
NONRESIDENTIAL
6-month moving
Real BusinessFixed Investment
Percent change,annual rate
1986Q4 3.0
1987Q1 -9.702 7.8H2 3.6
1988 2.0
BUILDING CONTRACTSBillions of dollars
- 6average
- 5.5
1985
Ratio
Other Manufacturingand Trade
1984 1985 1986 1987
on
"-5
1982 1983
Chart 16
FINANCING GAPBillions of dollars, annual rate
Nonfinancial Corporations
Capital Outlays
Internal Funds
1986 1987
NET FUNDS RAISED BY NONFINANCIAL CORPORATIONSBillions of dollars, annual rate
- 300
SEquity
* Debt (Second bar)
100
8-- 6-"--- 18 io1B 9
1001986 1987 1988
1988
Equities
Billions of dollars
GrossIssues Retirements
1986 38 119
1987 44 104
1988 40 80
COMPOSITION OF BORROWING
Nonfinancial Corporations
Billions of dollars, annual rate-- 300
-- 200
Bonds and Mortgages
------------------Loans-and-Paper
/ Loans and PaperfI
-- 100
1986 1987 1988
40S
- 400
-350
-300
250
1986 1987 1988

Chart 17
REAL STATE AND LOCALGOVERNMENT PURCHASES
Percent change, Q4 to Q4
I Ml I i 1 11111 1 11111 11985 1986 1987 1988
REAL FEDERAL PURCHASESPercent change, Q4 to Q4
* Total
STotal less CCC (Second bar)
STATE AND LOCAL SURPLUSBillions of dollars, ar
1985 1986 1987 1988
TOTAL BORROWING BY DOMESTICNONFINANCIAL SECTORS
Billions of dollars
IHouseholds and Businesses
- U.S., State andLocal Governments
I~HHI I
1985 1986 1987 1988
I I
1200
1000
- 800
- 600
- 400
- 200
j-LLL-- 0198819871985 1986
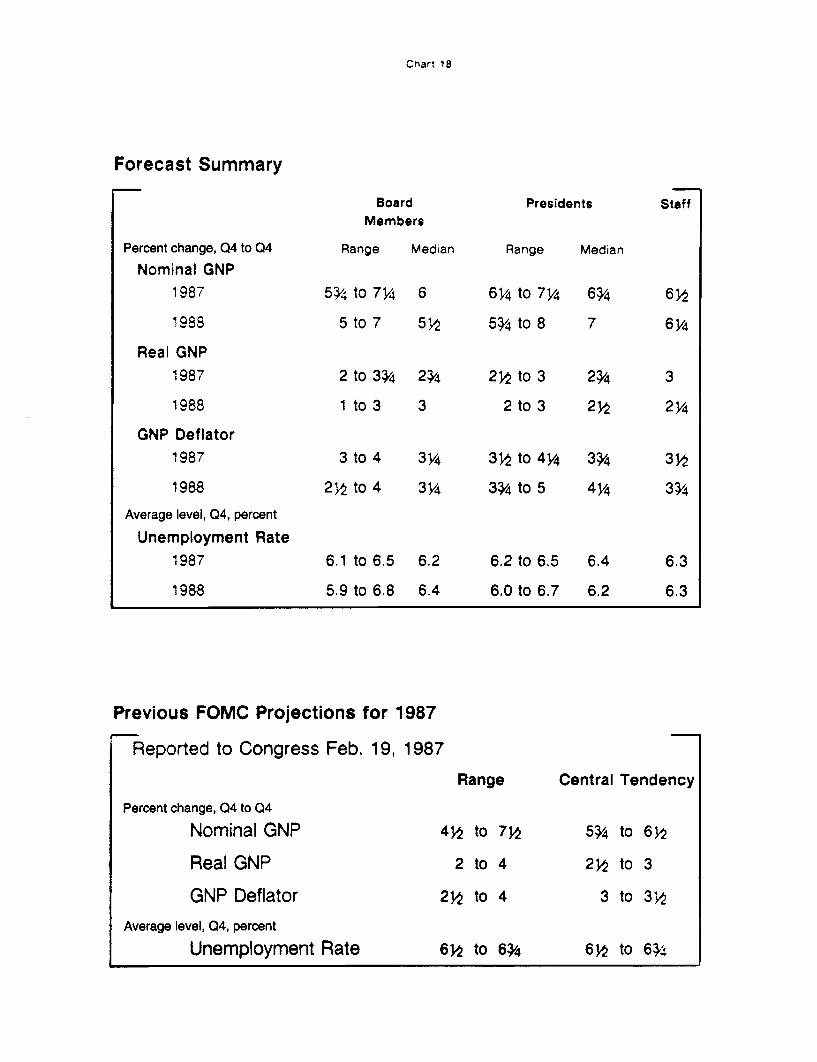
Chart 18
Forecast Summary
Percent change, Q4 to Q4
Nominal GNP1987
1988
Real GNP1987
1988
GNP Deflator1987
1988
Average level, Q4, percent
Unemployment Rate1987
1988
BoardMembers
Range Median
5¾ to 7¼
5 to 7
to 3¾
to 3
3 to
2 to
6.1 to 6.5
5.9 to 6.8
6
5
2¾
3
34
3 ¼
6.2
6.4
Presidents
Range Median
6¼ to 7¼ 6¾
5¾ to 8 7
2½ to
2 to
3 to 4¼
3¾ to 5
6.2 to 6.5
6.0 to 6.7
Previous FOMC Projections for 1987
SReported to Congress Feb. 19, 1987
Central Tendency
Percent change, Q4 to Q4
Nominal GNP
Real GNP
GNP DeflatorAverage level, Q4, percent
Unemployment Rate
4½ to 7½
2 to 4
2½ to 4
6½ to 6¾
5¾
2½
3
to 6
to 3
to 3½
6 to 6¾
Staff
6½
64
3
24
3
3¾
6.3
6.3
Range

FOMC BRIEFINGDonald L. KOHNJuly 7, 1987
LONG-RUN TARGETS
The period since the last FOMC meeting has been marked by
weakness in the aggregates -- especially M1 and M2. For the first half
as a whole, all the aggregates have decelerated sharply from last year
and the broad aggregates are running at rates below those anticipated by
the Committee at its February meeting. At that time, expectations were
for growth in M2 and M3 around the middle of their new ranges, assuming,
however, that there were no major changes in interest rates. In June M3
was around the lower end of its range and M2 well below its range, while
M1 had expanded at about half last year's pace. Clearly, this experience
raises questions about the kind of growth in the monetary aggregates
that would be compatible with acceptable performance of the economy and
inflation -- and in particular whether the current range for M2 for 1987
is likely to encompass such growth.
Three general points concerning developments in the first half
of the year seem relevant. First, the slowing of money growth this year
does not appear to signal a concurrent weakening of growth in nominal
income; nominal GNP in the first half of the year is estimated to have
expanded above the pace of last year, and is projected to continue to do
so in coming quarters as well. Second, some special factors, perhaps
related to tax reform, may have been at work in the deceleration of M2,
which is more than would be predicted by available models of money demand.
Also there were some unusual funding patterns that probably affected M3.
The staff has implicitly embodied in its forecast of money growth rates
given in this bluebook a tapering off or reversal of some of these effects.
However, for M2 they are not thought to be very large, and we don't anti-
cipate a spontaneous resurgence of M2 growth of sizable proportions.

-2-
Third, the available evidence does suggest that a substantial
portion of the slowing in money growth can be ascribed to the relative
movements of market and deposit interest rates, which raised opportunity
costs of holding money, after several years of decline. The increase in
opportunity costs has been particularly marked for M1, where the rise
has been accentuated by the steeper yield curve and faster adjustment
of time deposit rates. This has had a large impact on NOW accounts,
given their use as a saving vehicle, but demand deposits also have
weakened very substantially, including a large decline in June. The
reasons for this are not entirely clear, but these deposits seem to
have become increasingly sensitive to interest rate movements in recent
years, perhaps as the proportion linked to compensatory balance arrange-
ments has risen. This weakness in demand deposits probably is showing
through to M2, since it is less likely than with NOW accounts to involve
a shifting into other M2 assets. The sluggishness of offering rates or
other very liquid components of M2 -- such as savings accounts and
MMDAs -- also is thought to be contributing to the apparent interest
sensitivity of this aggregate over the short- and intermediate-runs.
This interest sensitivity is important in considering the
alternatives for 1987 and 1988. In the staff forecast the slower money
growth to date is not seen as impairing the outlook for the economy.
Implicitly, the rise in nominal rates that has occurred is not thought
to have resulted in levels of real rates that would unduly damp domestic
demand -- indeed a case can be made that real rates are not at historically
high levels given the worsening of inflation expectations earlier this
year. And, the decline in the exchange rate to date is expected to work

-3-
toward further improvement of our external imbalance, though as Mr.
Truman has indicated, further depreciation of the dollar is assumed to
be necessary at some point to sustain such progress. The downward move-
ment of the dollar puts upward pressure on prices, especially given a
projected robust expansion of net exports that keeps the unemployment
rate in the neighborhood of the natural rate. In this environment nomi-
nal interest rates are expected to rise further, both in reflection of
persisting price pressures and as policy makers act to restrain the
inflation process. The upward movement in nominal rates in turn damps
money demand and is reflected in rising velocity.
A set of charts distributed this morning shows the projected
movements in velocity implied by the interaction of interest rates, in-
come growth and monetary expansion in the staff forecast. As can be
seen in chart one, the increase in M2 velocity begun in the first half
of 1987 is projected to continue through 1988. M2 is expected to increase
at a little over a 5 percent rate for the balance of the year, as the
depressing effects of some special factors and recent declines in demand
deposits and the managed liability-linked components abates. Growth for
1987 would be between 4-1/2 and 5 percent -- below the lower end of its
current range -- and at a similar rate in 1988, about 1-1/2 percent below
the growth in nominal GNP over the two years. In effect, the pickup in
inflation and interest rates works to reverse a portion -- though by no
means all -- of the velocity declines of recent years associated with
the disinflationary process. Expansion of M3 is expected to rebound to
a bit over 7 percent in the second half of this year, reflecting primarily
a shift in funding patterns at banks toward elements in this aggregate.

Such growth would place this aggregate well up into its current range --
growth of about 6-1/2 percent is anticipated for this year and next.
The velocity of this aggregate would remain essentially unchanged over
the two years, in contrast to its long-term downtrend.
The next chart shows the velocities of M1 and M1A. Demand
deposits are projected to resume growing during the third quarter, but
with opportunity costs of both demand and NOW accounts rising, growth of
M1 and M1A would be quite damped -- on the order of 3 to 4 percent for
both aggregates over the next 6 quarters -- and their velocities would
increase. The recent focus on M1A in some circles seems to be keyed in
part to the persistence of the trend increase in its velocity past the
time when M1's velocity turned down. The jump in M1A's velocity in 1981
was associated with the advent of NOW accounts. Its subsequent smooth
trend until early 1985 is thought to have been largely a product of two
offsetting effects: continued shifts out of demand deposits as deregula-
tion proceeded and the support for demand deposits arising from declines
in interest rates. The trend was broken in 1985 once the shifting had
tapered off, allowing the underlying declines in velocity associated
with interest rate developments to emerge. The projected return to the
trend rate of velocity growth this year and next depends on the assumed
rise in rates.
Debt velocities are shown in the next chart. The staff pro-
jects debt growth of around 9-1/4 percent this year and 8-3/4 percent
next, still in excess of income growth, but by smaller margins than in
recent years.

-5-
In sum, if the staff's assessment of the forces at work is
about right, money growth would need to accelerate from its very recent
sluggish pace to maintain moderate income growth, but restraint on infla-
tionary forces may require slower growth in M2 in 1987 than now allowed
by its present range. The current ranges, along with the bluebook alter-
natives for 1987 and 1988 are shown for reference on the table on the
next page. Hitting the lower end of the current M2 range would require
a substantial acceleration of this aggregate over coming months. An
acceleration of this magnitude proably would require that interest rates
at least not increase noticeably over the second half of the year.
Stable or even declining rates may come about should underlying demands
on the economy or inflation pressures turn out weaker than the staff or
perhaps even the market expects, or should the dollar remain firm. But
if these conditions do not prevail the current range could come into
conflict with policy options that seemed consistent with other emerging
developments.
Alternative II would involve a full percentage point reduction
in the M2 range, while retaining the current ranges for M3 and debt. The
lower M2 range would give some room for a firming of policy, though prob-
ably not very much. Even the lower end of this range requires a consider-
able pickup in M2 growth from recent experience, and its adoption would
imply that the Committee did not expect these very recent growth rates to
continue. Another option might be to retain the current range but
announce that growth could fall short should inflation pressures and
other conditions seem to call for it. This could be seen as in effect
further deemphasizing money targets, however.

-6-
The issues for 1988 are similar to those for 1987. The 5-1/2
percent lower end of the current range -- given as alternative I -- would
seem to offer only a little room for a further increase in velocity should that
tend to emerge from the price and financial conditions accompanying an accept-
able outcome for the economy and prices. If there were considered to be
strong inflationary risks, some reduction in the ranges might be considered
approprate. Even in the absence of such risks, lower ranges could be seen
as another step in implementing the Federal Reserve's announced intention
to move over time to rates of money and credit growth consistent with
price stability. Alternatives II and III are two possible approaches.
In these alternatives the reductions of the M2 ranges are larger than
for the M3 ranges in recognition of the greater interest sensitivity of
the former. A higher range for M3 than for M2 is not unprecedented, and
is consistent with differences in the behavior of the velocity of these
two aggregates over the long run. The alternative II range for M2 is
the same as the alternative II range for 1987 for this aggregate, but
this alternative would embody lower ranges for M3 and debt. However,
the lower end of the alternative II range for M2 is not much below the
staff's expectation for growth in this aggregate next year, given the
presumed increases in interest rates. The alternative III range for M2
is more nearly centered on the staff forecast, allowing roan for slower
growth should that be appropriate. The midpoint of the range, at 5 to
5-1/2 percent is a little above where M2 is projected to come out this
year. The upper limit of the alternative III range has been lowered
only to 7 percent, to accommodate faster growth and possible further
declines in velocity should the economy or inflation turn out on the
weak side. Any of the alternatives would be consistent with the staff's

-7-
projection of debt growth of around 8-3/4 percent next year, although
alternatives II and III would allow more room for a shortfall from this
projection and the possibility that debt would again expand more in
line with income.
With respect to M1, while the staff is projecting a return to
an uptrend in velocity, as pointed out before, this is highly dependent
on the assumed rise in interest rates. This aggregate appears to remain
extraordinarily sensitive to interest rate changes, as indicated by the
swing from a 9 percent velocity decline last year to essentially no
change in the second quarter. In the model results M1 is from two to
three times as interest elastic as M2 over a 4-quarter span. Moreover
we are still gaining experience with the behavior of savers and deposi-
tory institutions in a deregulated environment. Under these circumstances,
an M1 range consistent with the M2 range in allowing for various contin-
gent outcomes for the economy in interest rates would have to be extra-
ordinarly wide -- perhaps 6 percentage points or more.

Strictly Confidential
Class I FOMC
Velocity Projections
and
Long Run Alternatives

wMrt
ACTUAL AND PROJECTED VELOCITY OF M2 AND M3¹
M2 VELOCITYRate Scale
-qua
-4I
I 1 I I I I I I I I I I I 1 I I I I1370
M3 VELOCITY
1978 3l2s ws
Ratio Scale-"IT
-42
1.5
I I I I I I I I I I 1 I I I I II I0.6
*74
97o0 74 *70 Ss
1. Projection based on staff forcast of GNP and money.

Chart 2
ACTUAL AND PROJECTED VELOCITY OF M1 AND M1A ¹
M1 VELOCITYRatio Scale
4- -.6
31970 1974 1978 1982 1986
M1A VELOCITYRatio Scale
12
6
1970 1974 1978 1982 1986
1. Projections based on staff forecast of GNP and money.

Chart 3
ACTUAL AND PROJECTED VELOCITY OF DOMESTIC NONFINANCIAL DEBT
Ratio Scale-~ - 1.25
-- 0.75
1 I I I I I I I I I I I I I I I I I1973 1976 1982 1986 1988
1. Projections based on staff forecast of GNP and debt.
1970
-- 41
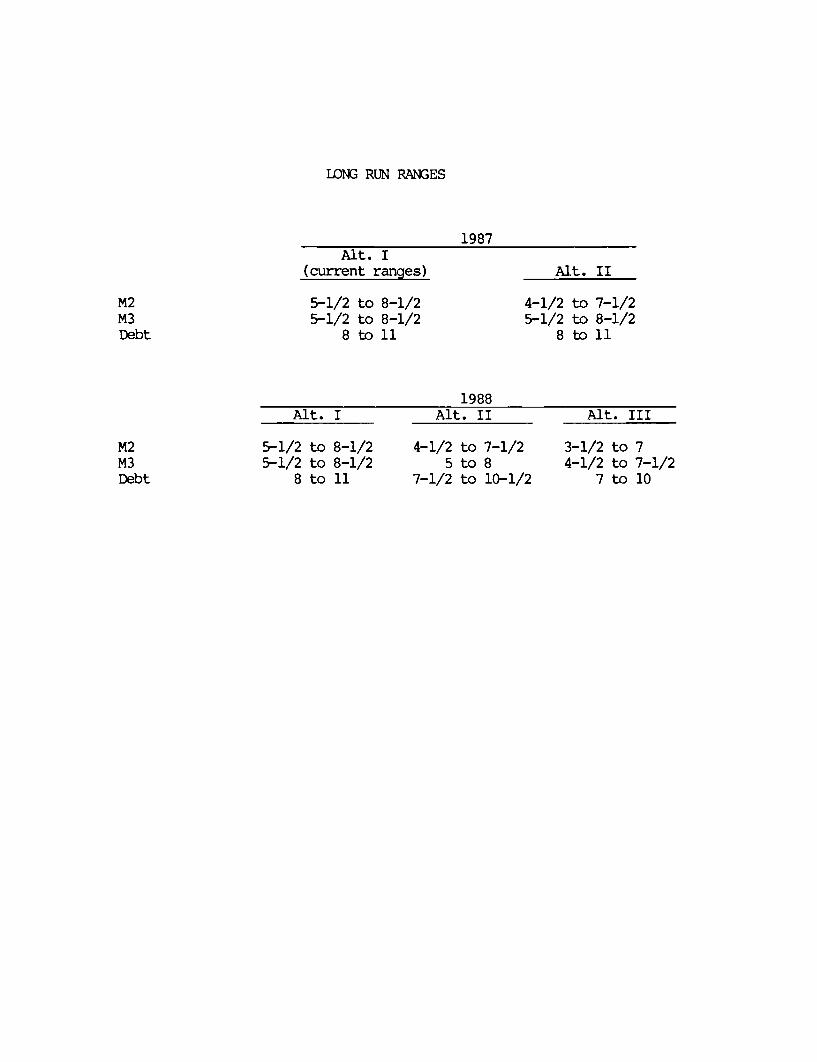
LONG RUN RANGES
Alt. I(current ranges)
5-1/2 to 8-1/25-1/2 to 8-1/2
8 to 11
M2M3Debt
1987
Alt. II
4-1/2 to 7-1/25-1/2 to 8-1/2
8 to 11
Alt. I
5-1/2 to 8-1/25-1/2 to 8-1/2
8 to 11
1988Alt. II
4-1/2 to 7-1/25 to 8
7-1/2 to 10-1/2
Alt. III
3-1/2 to 74-1/2 to 7-1/2
7 to 10
M2M3Debt