Embed Size (px)
Citation preview

Prefatory Note
The attached document represents the most complete and accurate version available based on original copies culled from the files of the FOMC Secretariat at the Board of Governors of the Federal Reserve System. This electronic document was created through a comprehensive digitization process which included identifying the best-preserved paper copies, scanning those copies,1 and then making the scanned versions text-searchable.2 Though a stringent quality assurance process was employed, some imperfections may remain.
Please note that this document may contain occasional gaps in the text. These gaps are the result of a redaction process that removed information obtained on a confidential basis. All redacted passages are exempt from disclosure under applicable provisions of the Freedom of Information Act.
1 In some cases, original copies needed to be photocopied before being scanned into electronic format. All scanned images were deskewed (to remove the effects of printer- and scanner-introduced tilting) and lightly cleaned (to remove dark spots caused by staple holes, hole punches, and other blemishes caused after initial printing). 2 A two-step process was used. An advanced optimal character recognition computer program (OCR) first created electronic text from the document image. Where the OCR results were inconclusive, staff checked and corrected the text as necessary. Please note that the numbers and text in charts and tables were not reliably recognized by the OCR process and were not checked or corrected by staff.
Confidential (FR) Class III FOMC
July 1, 1987
RECENT DEVELOPMENTS
Prepared for the Federal Open Market Committee
By the staff of the Board of Governors of the Federal Reserve System

DOMESTIC NONFINANCIAL DEVELOPMENTS
Recent developments. Economic activity has been growing at a moderate
pace in recent months as gains in net exports apparently have counterbalanced
some softness in domestic spending. Producer and consumer prices slowed a
bit in May, after sizable increases earlier in the year that were associated,
in part, with higher energy prices.
The index of industrial production rose 0.5 percent in May and, with
the upward revision to the three preceding months, it stood 2-1/2 percent
(annual rate) above the first-quarter average. The recent growth reflects,
in part, increased production of business equipment, especially high-
technology capital goods. The output of consumer goods also was up in May,
with increases widespread. In the motor-vehicle sector, auto assemblies
have slowed in recent months owing to the overhang of dealers' stocks,
while production of trucks was sluggish in the second quarter after the
brisk pace of assemblies in the first quarter.
The growth in the industrial sector so far this year has led to some
small gains in manufacturing employment. The service-producing industries
have continued to account for the preponderance of employment growth,
however, adding an average 200,000 nonfarm payroll jobs per month. The
civilian unemployment rate remained at 6.3 percent in May, after dropping
0.4 percentage point in April.
Consumer spending in real terms has been sluggish in recent months.
Domestic auto sales since early May have averaged only about a 7 million
unit annual rate, considerably below the pace in the past few years, and
sales of Japanese imports have been falling short of their voluntary export

limits. Excluding autos, outlays for durables have been flat, on balance,
since the end of last year, while spending on nondurable goods has edged
down. In contrast, outlays for services continue to advance steadily.
Wage and salary income has grown moderately in recent months, but in April
and May total personal income gains were cut by a dropoff in farm subsidy
payments, and real spending power has continued to be eroded by consumer
price increases.
Housing activity has dropped back from its elevated pace early this
year. Total housing starts fell to 1.62 million units in May, about 10
percent below their first-quarter pace. Single-family starts were down
appreciably, reflecting the runup in mortgage interest rates from the nine-
year low reached in March. Multifamily starts rose some in May, but
remained below the first-quarter average.
Business fixed investment has rebounded after a large tax-induced
decline in the first quarter. Shipments of nondefense capital goods were
about flat in April and May but, given earlier advances, the average level
of shipments during these two months was about 1-3/4 percent above the
first-quarter average. Outlays for nonresidential structures turned up in
May, with the gains fairly widespread; and petroleum drilling activity has
continued to recover. In addition, advance indicators of investment spending
have shown signs of improvement. New orders for nondefense capital goods
(excluding the aircraft group, where lead times run several years) picked
up in the spring; and, despite high vacancy rates in several sectors, new
commitments for nonresidential construction have moved up slightly, sug-
gesting some near-term firming in activity. The latest surveys of capital
spending plans point to an even more substantial pickup in nominal outlays

I-3
over the remainder of this year: however, these surveys have tended to
exhibit an upward bias in recent years.
Inventory investment appears to have slowed in the second quarter
from its rapid first-quarter pace. Production cutbacks have stemmed the
buildup in auto inventories, which had accounted for more than two-thirds
of the first-quarter accumulation in nonfarm business stocks. Nevertheless,
as of the end of May, the level of dealers' stocks was still high by
historical standards. Among nonauto establishments, inventory changes have
been relatively small in recent months, and inventory-sales ratios generally
appear comfortable. The available information for May indicates that manu-
facturers continue to maintain a conservative inventory stance.
The consumer price index rose 0.3 percent in May, after more rapid
increases earlier this year. Increases in retail energy prices, which had
boosted prices during the first quarter, were smaller in recent months and
accounted for much of the slowing in consumer price inflation. However,
crude oil costs have risen further since mid-April, portending some further
upward adjustment in retail energy prices in the near future. Excluding
food and energy, the CPI has risen at a 5 percent annual rate so far this
year, more than one percentage point above last year's pace. The pickup in
this component of inflation can be traced, in part, to more rapid increases
in categories of consumer goods that have higher import proportions. Wage
inflation, meanwhile, has remained quite low so far this year.

Outlook. The staff now estimates that real GNP grew at around a
2-1/4 percent annual rate in the second quarter and that the GNP fixed-
weighted price index increased at about a 3-3/4 percent rate. Growth in
GNP was retarded by cutbacks in automobile production, but output appears
to have been buoyed by a rise in net exports and a rebound in spending on
producers' durable equipment.
Looking ahead, the policy assumptions underlying the staff projection
have been altered in some respects. In light of emerging evidence on
inflation, associated, in part, with the impulse from the dollar's depre-
ciation, interest rates now are anticipated to drift up a bit faster over
the projection period. Although M3 is expected to grow at a rate well
within its target range for 1987, and to continue at about the same pace in
1988, M2 growth now is expected to pick up only a little from the relatively
low pace of the first half of this year. The exchange value of the dollar
against other G-10 currencies is expected to decline, on average, at
somewhat less than a 10 percent annual rate from recent levels.
The stance of federal fiscal policy still is viewed as moderately
restrictive. The FY1987 deficit is now expected to fall from last year's
$221 billion to just below $170 billion, reflecting the budget restraint
enacted last year and the substantial one-time windfall in revenues this
year from tax reform. For FY1988, revenues no longer will be benefiting
from the tax-reform windfall, and the deficit is expected to remain in the
$170 billion range, despite the assumption of $25 billion in deficit-reduction
measures. The FY1988 deficit has been revised up about $9 billion since the
last Greenbook, reflecting evidence that corporate tax receipts will be lower
than previously anticipated under the new tax code, the recently announced

reduction in the federal unemployment tax rate beginning in January, and
higher projected outlays for interest.
The staff continues to expect real GNP to increase at about a 2-1/2
percent annual rate over the second half of 1987. However, the growth of
GNP in 1988 has been scaled back to 2-1/4 percent, owing to the slightly
steeper climb in interest rates and the slower projected decline in the value
of the dollar.
Projected improvements in the external sector are expected to drive
overall output growth. With the competitiveness of U.S. products improving,
real exports of goods and services are anticipated to rise at a fairly robust
pace during the next year and a half. In addition, real imports of goods and
services are expected to be essentially unchanged, as declines in the volume
of non-oil merchandise imports are offset by increases in oil imports and in
payments on our expanding liabilities to foreigners.
In contrast, growth in domestic demand is anticipated to be sluggish
over the forecast period. In particular, the expected rise in import prices
associated with the fall in the dollar will continue to hold down real
income gains, limiting the growth in consumer spending. At the same time,
government purchases at both the federal and state and local levels are
expected to be damped by budgetary limitations. Business equipment spending
should rise moderately in coming quarters, reflecting continued modernization
efforts and expanding domestic production. Nevertheless, growth in overall
business investment is expected to remain quite sluggish, as high office
vacancy rates and excess capacity in the public utility sector continue to
constrain nonresidential construction activity. Residential construction
activity likely will be relatively soft as well, owing to the influence of

higher interest rates on the demand for single-family homes and the effects
of high rental vacancy rates on multifamily building.
Inflation rates are expected to edge down over the second half of this
year but then to move up again in 1988. The effects of energy price increases,
which accounted for much of the pickup in inflation earlier this year, are
likely to be less of a force in coming quarters. In contrast, increases in
nonpetroleum import prices associated with the expected dollar depreciation
will be substantial and will provide continuing impetus to inflation over
the projection period; moreover, with the civilian unemployment rate projected
to remain close to 6-1/4 percent, labor market slack no longer will provide
an offset to these inflationary pressures. Reflecting these influences,
the GNP fixed-weighted price index is projected to rise 3-1/2 percent in
1987 and 4-1/4 percent in 1988.
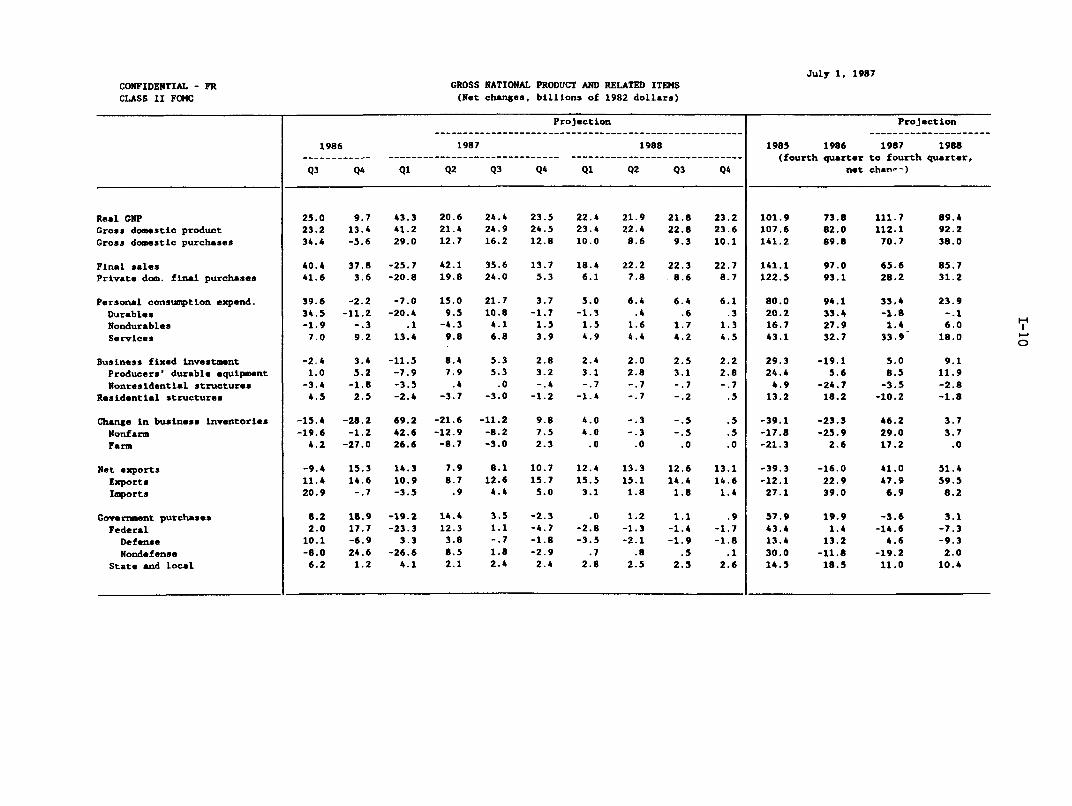
Details of the staff projection are shown on the tables that follow.

I-7
July 1, 1987CONFIDENTIAL - FRCLASS II FOMC STAFF GNP PROJECTIONS
Percent changes, annual rate
GNP fixed-weighted GNP UnemploymentNominal GNP Real GNP price index deflator rate
(percent)
5/13/87 7/1/87 5/13/87 7/1/87 5/13/87 7/1/87 5/13/87 7/1/87 5/13/87 7/1/87
Annual changes:
1985 <1> 6.2 6.2 2.7 2.7 3.7 3.7 3.3 3.3 7.2 7.21986 <1> 5.2 5.2 2.5 2.5 2.8 2.8 2.7 2.7 7.0 7.01987 5.4 5.7 2.6 2.7 3.0 3.2 2.7 3.0 6.5 6.41988 6.1 6.0 2.6 2.4 3.8 3.9 3.4 3.5 6.3 6.3
Quarterly changes:
1986 Q1 <1> 6.2 6.2 3.8 3.8 2.5 2.5 2.5 2.5 7.1 7.1Q2 <1> 2.6 2.6 .6 .6 1.7 1.7 1.8 1.8 7.1 7.1Q3 <1> 6.4 6.4 2.8 2.8 2.6 2.6 3.6 3.6 6.9 6.9Q4 <1> 1.7 1.7 1.1 1.1 2.7 2.7 .7 .7 6.9 6.9
1987 Q1 <1> 7.8 9.1 4.3 4.8 3.6 3.9 3.5 4.2 6.7 6.7Q2 6.3 6.1 2.5 2.2 3.5 3.7 3.6 3.8 6.4 6.3Q3 5 5 5.9 2.2 2.6 3.3 3.6 3.2 3.2 6.4 6.3Q4 5 5 5.3 2.8 2.5 3.2 3.3 2.6 2.8 6.4 6.3
1988 Q1 6.5 6.3 2.6 2.4 4.1 4.2 3.7 3.8 6.3 6.3Q2 6.3 6.0 2.6 2.3 4.0 4.0 3.6 3.6 6.3 6.3Q3 6.4 6.3 2.7 2.3 4.1 4.2 3.7 3.9 6.2 6.3Q4 6.6 6.5 2.7 2.4 4.3 4.3 3.8 4.0 6.2 6.3
Tvo-quarter changes: <2>
1986 Q2 <1> 4.3 4.3 2.2 2.2 2.1 2.1 2.1 2.1 .0 .0QA <1> 4.0 4.0 1.9 1.9 2.6 2.6 2.1 2.1 -.2 -.2
1987 Q2 7.0 7.6 3.4 3.5 3.5 3.8 3.6 4.0 -. 5 -. 6Q4 5.5 5.6 2.5 2.6 3.3 3.5 2.9 3.0 .0 .0
1988 Q2 6.4 6.1 2.6 2.3 4.0 4.1 3.7 3.7 -. 1 .0Q4 6.5 6.4 2.7 2.4 4.2 4.3 3.8 3.9 -.1 .0
Four-quarter changes: <3>
1985 Q4 <1> 6.3 6.3 2.9 2.9 3.6 3.6 3.3 3.3 -. 2 -. 21986 QA <1> 4.2 4.2 2.0 2.0 2.4 2.4 2.1 2.1 -. 2 -. 21987 Q4 6.2 6.6 2.9 3.0 3.4 3.6 3.2 3.5 -. 5 -. 61988 Q4 6.5 6.3 2.6 2.3 4.1 4.2 3.7 3.8 -. 2 .0
<1> Actual.<2> Percent change from two quarters earlier.<3> Percent change from four quarters earlier.

CONFIDENTIAL - FRCLASS II FOMC
GROSS NATIONAL PRODUCT AND RELATED ITEMS(Seasonally adjusted; annual rate)
Units
I- I
Billions of $Billions of 82$
Percent chaage
C ange in business inventories Billions of 82$Nonfarm Bll1ions of 82$
met exports Billions of 82$
EMPLOYMENT AND PRODUCTION
Nonfarm payroll employmentUnemployment rate
MillionsPercAnt*
Industrial production index IPercent chaneCapacity itilisation rate-Mfg. Percent*
Sousing StartsAuto salesDamesticForeign
INCOQE AND SAVING
Nominal personal incomeReal disposable incomePersonal saving rate
Corp. profits with IVA & CCAdjProfit share of GP
Federal govt. surplusldeficitState and local orvt. surplus
PRICES AND COSTS
GNP implicit deflatorGP fixed-weight price indexCons. L fixed invest. prices
CPIExc. food and energy
lonfarm business sectorOutput per hourCompensat ion per hourUnit labor costs
* Not at an annual rate.
MillionsNillioniMillionsMillions
Percent changePercent chanePercent*
Percent changePercent*
Billions of $
Percent chan*e
Projection
1986 1987 1988
Q3 Q4 Q1 Q2 Q3 Q4 Q1 Q2 Q3 Q4
EXPENDITURES
Nominal GIPReal GNP
Nominal GNPReal GNPGross domestic productGross domesti purchases
Final salesPrivate dom. final purchases
Personal consumption expend.DurablesNondurablesServices
Business fixed investmentProducers' durable equipmentNonresidential structures
Residential structures
ExportsImports
Government purchasesFederal. DefenseState and local
-. 3 -1.5 .52.3 2.7 .02.6 4.2 -.5
July 1, 1987
4240.7 4258.7 4352.1 4417.4 4481.4 4540.1 4609.5 4677.4 4749.3 4824.73686.4 3696.1 3739.4 3760.0 3784.4 3807.8 3830.3 3852.1 3874.0 3897.2
6.4 1.7 9.1 6.1 5.9 5.3 6.3 6.0 6.3 6.52.8 1.1 4.8 2.2 2.6 2.5 2.4 2.3 2.3 2.42.6 1.5 4.6 2.3 2.7 2.6 2.5 2.4 2.4 2.53.7 -.6 3.1 1.3 1.7 1.3 1.0 .9 .9 1.0
4.5 4.2 -2.7 4.6 3.9 1.5 2.0 2.3 2.4 2.45.6 .5 -2.7 2.6 3.1 .7 .8 1.0 1.1 1.1
6.7 --.4 -1.1 2.5 3.6 .6 .8 1.0 1.0 1.044.6 -11.0 -19.8 11.0 12.2 -1.8 -1.4 .4 .6 .3-.9 -. 1 .0 -2.0 1.9 .7 .7 .7 .8 .62.4 3.2 4.6 3.3 2.3 1.3 1.6 1.4 1.4 1.5
-2.1 3.0 -9.7 7.8 4.7 2.4 2.1 1.8 2.1 1.91.2 6.6 -9.2 10.2 6.6 3.9 3.7 3.3 3.7 3.3
-9.8 -5.4 -10.5 1.4 -. 1 -1.4 -2.3 -2.6 -2.2 -2.29.7 5.2 -4.7 -7.2 -6.1 -2.5 -2.8 -1.6 -.5 1.0
13.3 16.7 11.8 9.1 13.0 15.9 15.1 14.1 13.0 12.817.3 -. 5 -2.6 .7 3.4 3.8 2.3 1.3 1.3 1.1
4.5 10.5 -9.6 7.9 1.8 -1.2 .0 .6 .6 .52.5 23.2 -24.2 16.0 1.3 -5.4 -3.3 -1.6 -1.7 -2.117.2 -10.2 5.3 6.1 -1.1 -2.8 -5.3 -3.3 -3.0 -2.96.1 1.1 4.0 2.0 2.3 2.3 2.6 2.3 2.3 2.4
-.3 -28.5 40.7 19.1 7.9 17.7 21.7 21.6 20.9 21.4-8.6 -9.8 32.8 19.9 11.7 19.2 23.2 22.9 22.4 22.9
-163.3 -148.0 -133.7 -125.8 -117.7 -107.0 -94.6 -81.4 -68.8 -55.6
99.8 100.4 101.1 101.7 102.1 102.5 102.9 103.3 103.8 104.26.9 6.9 6.7 6.3 6.3 6.3 6.3 6.3 6.3 6.3
1.9 3.2 3.3 2.1 3.9 3.8 3.4 3.3 3.5 3.579.7 79.8 80.2 80.1 80.4 80.6 80.8 80.9 80.9 81.0
1.76 1.70 1.80 1.64 1.61 1.60 1.58 1.57 1.56 1.5612.91 11.32 9.66 10.08 11.00 10.70 10.40 10.50 10.70 10.709.43 7.66 6.86 7.09 7.76 7.50 7.30 7.40 7.55 7.553.47 3.66 2.80 2.99 3.24 3.20 3.10 3.10 3.15 3.15
1.8 3.4 7.0 5.6 5.4 6.9 7.0 4.7 5.9 6.8-3.1 -1.5 2.9 -4.0 7.2 2.3 2.5 -.8 1.7 1.22.8 2.5 3.5 2.0 2.8 3.2 3.5 3.1 3.2 3.3
12.7 12.8 34.9 3.5 3.8 3.0 -9.7 6.2 6.5 7.67.1 7.3 7.7 7.7 7.6 7.6 7.3 7.3 7.3 7.3
-197.4 -188.8 -170.4 -153.6 -186.9 -185.2 -186.0 -164.7 -163.3 -158.164.0 59.4 50.2 60.5 56.5 58.1 59.6 60.6 62.2 64.2

CONFIDENTIAL - FRCLASS II FOMC
GROSS NATIONAL PRODUCT AND RELATED ITEMS(Seasonally adjusted; annual rate)
July 1, 1987
Projection
Units 1980 1981 1982 1983 1984 1985 1986 1987 1988
EXPENDITURES
Nominal GNPReal GNP
Real GNPGross domestic productGross domestic purchases
Final salesPrivate dom. final purchases
Personal consumption expend.DurablesNondurablesServices
Business fixed investmentProducers' durable equipmentNonresidential structures
Residential structures
ExportsImports
Government purchasesFederal
DefenseState and local
Change in business inventoriesNonfarm
Net exports
Nominal GNP
EMPLOYMENT AND PRODUCTION
Nonfarm payroll employmentUnenployment rate
Industrial production indexCapacity utilization rate-mfg.
Housing StartsAuto sales
DomesticForeign
INCOME AND SAVING
Nominal personal incomeReal disposable incomePersonal saving rate
Corp. profits with IVA & CCAdjProfit share of GNP
Federal govt. surplus/deficitState and local govt. surplus
PRICES AND COSTS
GNP implicit deflatorGNP fixed-weight price index*Cons. & fixed invest. prices
CPIExc. food and energy
onfarm business sectorOutput per hourCompensation per hourUnit labor costs
Billions of $Billions of 82$
Percent chanGe*
Billions of 82$Billions of 82$Billions of 82$
Percent change*
MillionsPercent
Percent chanse*Percent
MillionsMillionsMillionsMillions
Percent change*Percent change*Percent
Percent change*Percent
Billions of $
Percent chnge*
2732.0 3052.63187.1 3248.8
-.1 .6.3 .3
-1.1 .8
-. 2 .1-1.7 -.3
-. 1 .2-5.6 -3.3-1.4 .52.4 .9
-A.8 5.6-6.5 2.2-1.8 '11.7
-14.2 -22.4
.5 2.4-8.8 4.9
1.0 2.93.1 9.53.1 7.6-.3 -1.3
-6.9 23.9-2.3 19.057.0 49.4
9.9 9.3
90.47.1
-. 879.3
1.309.046.622.42
12.01.17.1
-6.86.5
-61.326.8
9.99.8
10.112.512.2
91.27.6
-1.078.3
1.108.566.242.32
9.2.7
7.5
2.36.2
-63.834.1
8.78.58.29.6
10.2
3166.03166.0
-1.9-1.6
-. 8
.3.8
2.99.01.82.3
-11.3-12.5
-9.14.9
-13.8-5.9
3.88.28.8
.6
-24.5-23.126.3
3.1
89.69.7
-7.770.3
1.068.005.772.23
5.31.06.8
-19.14.7
-145.935.1
5.25.04.44.55.2
1.0 -.6 1.010.9 8.3 7.3
9.8 9.0 6.2
3405.73279.1
6.56.68.4
3.77.7
5.414.74.43.9
10.820.9-4.838.1
5.823.8
-2.7-8.15.11.5
-6.4-. 1
-19.9
10.4
90.29.6
14.374.0
1.719.186.772.41
7.85.15.4
70.16.3
-176.047.5
3.63.93.33.24.2
3.63.3-. 3
3765.03489.9
4.64.95.9
4.45.3
3.68.82.23.3
14.716.012.15.3
5.516.5
7.714.2
6.83.1
59.254.3
-83.6
8.5
94.57.5
6.680.5
1.7710.437.972.46
8.44.26.3
6.67.0
-170.068.5
3.63.93.64.14.7
1.04.33.2
3998.13585.2
2.93.13.9
4.04.2
3.56.22.03.9
6.58.13.37.8
-3.25.8
8.414.3
5.93.7
9.010.9
-108.2
6.3
97.57.2
1.780.1
1.7411.098.242.84
6.11.95.1
7.87.0
-198.061.7
3.33.63.43.54.3
.23.93.7
4206.13674.9
2.02.32.4
2.73.1
4.09.63.32.8
-4.01.7
-16.210.0
6.37.9
2.7.4
5.54.6
6.67.4
-147.8
4.2
99.67.0
1.179.7
1.8211.528.283.25
4.32.23.8
9.07.1
-203.363.1
2.12.42.01.33.9
.72.61.8
4447.83772.9
3.03.11.8
1.8.9
1.4-. 5.2
2.8
1.12.6
-2.8-5.1
12.41.3
-. 5-4.21.82.6
21.320.9
-121.0
6.6
101.96.4
3.380.3
1.6610.367.303.06
6.22.02.9
10.57.6
-174.056.3
3.53.64.34.74.7
1.03.02.0
4715.23863.4
2.32.41.0
2.31.0
1.0.0.7
1.5
2.03.5
-2.3-. 9
13.71.5
.4-2.2-3.62.4
21.422.9
-75.1
6.3
103.56.3
3.480.9
1.5710.587.453.13
6.11.13.3
2.47.3
-168.061.7
3.84.24.64.75.2
1.04.63.5
* Percent changes are fro fourth quarter to fourth quarter.
CONFIDENTIAL - FRCLASS II FOMC
Real GNPGross domestic product
Gross domestic purchases
Final salesPrivate dom. final purchases
Personal consumption expend.
DurablesNondurables
Services
Business fixed investmentProducers' durable equipment
Nonresidential structuresResidential structures
Change in business inventoriesNonfarmFarm
Net exports
ExportsImports
Government purchasesFederal
DefenseNondefense
State and local
GROSS NATIONAL PRODUCT AND RELATED ITEMS
(Net changes, billions of 1982 dollars)
July 1, 1987
Projection Projection
1986 1987 1988 1985 1986 1987 1988------------ - ----------------------- -------------- ------ (fourth quarter to fourth quarter,
Q3 Q4 Ql Q2 Q3 Q4 Q1 Q2 Q3 Q4 net chan-')
25.0 9.7 43.3 20.6 24.4 23.5 22.4 21.9 21.8 23.223.2 13.4 41.2 21.4 24.9 24.5 23.4 22.4 22.8 23.634.4 -5.6 29.0 12.7 16.2 12.8 10.0 8.6 9.3 10.1
101.9107.6
141.2
40.4 37.8 -25.7 42.1 35.6 13.7 18.4 22.2 22.3 22.7 141.141.6 3.6 -20.8 19.8 24.0 5.3 6.1 7.8 8.6 8.7 122.5
39.6 -2.2 -7.0 15.0 21.7 3.7 5.0 6.4 6.4 6.1
34.5 -11.2 -20.4 9.5 10.8 -1.7 -1.3 .4 .6 .3-1.9 -.3 .1 -4.3 4.1 1.5 1.5 1.6 1.7 1.3
7.0 9.2 13.4 9.8 6.8 3.9 4.9 4.4 4.2 4.5
-2.4 3.4 -11.5 8.4 5.3 2.8 2.4 2.0 2.5 2.2
1.0 5.2 -7.9 7.9 5.3 3.2 3.1 2.8 3.1 2.8
-3.4 -1.8 -3.5 .4 .0 -.4 -.7 -.7 -.7 -.74.5 2.5 -2.4 -3.7 -3.0 -1.2 -1.4 -.7 -.2 .5
-15.4 -28.2 69.2 -21.6 -11.2 9.8 4.0 -.3 -.5 .5
-19.6 -1.2 42.6 -12.9 -8.2 7.5 4.0 -.3 -.5 .54.2 -27.0 26.6 -8.7 -3.0 2.3 .0 .0 .0 .0
-9.4 15.3 14.3 7.9 8.1 10.7 12.4 13.3 12.6 13.1
11.4 14.6 10.9 8.7 12.6 15.7 15.5 15.1 14.4 14.620.9 -.7 -3.5 .9 4.4 5.0 3.1 1.8 1.8 1.4
8.2 18.9 -19.2 14.4 3.5 -2.3 .0 1.2 1.1 .9
2.0 17.7 -23.3 12.3 1.1 -4.7 -2.8 -1.3 -1.4 -1.710.1 -6.9 3.3 3.8 -.7 -1.8 -3.5 -2.1 -1.9 -1.8
-8.0 24.6 -26.6 8.5 1.8 -2.9 .7 .8 .5 .16.2 1.2 4.1 2.1 2.4 2.4 2.8 2.5 2.5 2.6
80.020.216.743.1
29.324.4
4.913.2
-39.1-17.8-21.3
-39.3
-12.127.1
57.943.413.430.014.5
73.8 111.782.0 112.1
89.8 70.7
89.492.2
38.0
97.0 65.6 85.793.1 28.2 31.2
94.133.427.932.7
-19.15.6
-24.718.2
-23.3-25.9
2.6
-16.022.939.0
19.9
1.413.2
-11.818.5
33.4-1.81.4
33.9
5.08.5-3.5
-10.2
46.2
29.017.2
41.047.96.9
-3.6-14.64.6
-19.211.0
23.9-.16.0
18.0
9.111.9-2.8-1.8
3.73.7
.0
51.459.58.2
3.1
-7.3-9.3
2.010.4

CONFIDENTIAL FR CLASS II
FEDERAL SECTOR ACCOUNTS(Billions of dollars)
FiscalYear1986*
Budget receipts2 769Budget outlays 990Surplus/deficit(-)to be financed -221
Means of financing:Borrowing from public 236Cash balance decrease -14Other -1
Cash operating balance,end of period 31
Memo: Sponsored agencyborrowing 14
NIPA Federal Sector
Receipts 815Expenditures 1025Purchases 368
Defense 275Nondefense 94
All other expend. 657Surplus/deficit(-) -211
High-employment surplus/deficit(-) evaluatedat 6 percent unemp. -173
FY1987eFRB
Admin1 Staff
8421016
-173
8451014
-169
16603
FY1988eFRB
Admin1 Staff
9171024
-108
10701
8861054
-168
15973
CY1987eCY FRB1986* Staff
782 859991 1034
-209 -175
215 1460 16-6 13
20 32 20 25 31 15
n.a. 13 n.a.
875106138529194
676-186
880105537828890
678-175
n.a. -138
*--actual
Note: Details may not add to totals
968108939530194
694-121
18 13 13
926110138829593
714-175
n.a. -141
827 8911030 1065
366 381278 291
89 89664 684
-203 -174
-165 -140
1986IV*
1987I* II
FRB Staff Estimates
1988III IV I I
Not seasonally adjusted
190 194 254 208 204 199253 252 250 258 273 249
-63 -59 3 -51 -69 -50
88I III
259 224262 270
-3 -47
31 9 40 32 15- 15 20 25
4 -2 7 4 4 4
855104337227993-
671-189
-146
e--estimated
Seasonally
873 9111043 1065365 385287 29278 93
679 680-170 -154
5 5
adjusted annual rates
884 897 921 9401071 1082 1107 1105390 384 388 389294 294 295 29596 90 93 94681 699 720 716
-187 -185 -186 -165
-135 -118 -154 -152 -153 -131
n.a.--not available
due to rounding
1. Budet of the United States Government. Ficla (January 1987). The Congressional Budget Office baseline estimatespublished in February indicated receipts of $834 and $901 billion, outlays of $1010 and $1071 billion, and deficits of $176and $171 billion in FY1987 and FY1988, respectively.
2. Includes outlays formerly classified as off-budget (e.g. Federal Financing Bank and Strategic Petroleum Reserve) and socialsecurity receipts and outlays classified as off-budget under current law.
3. Checks issued less checks paid accrued items and other transactions.4. Sponsored agency borrowing includes net debt Issuance by Federal Home Loan Banks, Federal Home Loan Mortgage Corporation
(excluding participation certificates), Federal National Hortgage Association (excluding mortgage-backed securities),Farm Credit Banks, and Student Loan Marketing Association marketable debt. The Administration s definition of borrowingby these agencies is somewhat broader.
947111039029595
721-163
-129
___ __ _
" "
July 1, 1987
DOMESTIC FINANCIAL DEVELOPMENTS
Recent developments. The bearish sentiment that had pervaded
the U.S. securities markets in the period leading up to the last FOMC
meeting dissipated to a degree in late May and June. Some abatement
of inflation fears and a firmer dollar on exchange markets fostered a
more constructive atmosphere in which such jolts as the announcement of
Citibank's loss provisions and Chairman Volcker's departure could be
quickly overcome. Taxable bond yields have declined roughly 1/4 to 1/2
percentage point from the highs reached in May. For most short-term money
market instruments, rate declines have been somewhat smaller--about 1/8
to 3/8 of a point. The federal funds rate has been about unchanged at
6-3/4 percent.
Since last fall, market rates in the short- to intermediate-maturity
range are up, on balance, by 1/2 to more than a full percentage point.
This rise has been a significant factor retarding monetary expansion this
year, as deposit rates have lagged behind. M2 is now estimated to have
grown at a 4-1/4 percent annual rate from the fourth quarter of last year
to June, placing it below the lower end of its annual growth cone. M3 is
estimated to have grown by 5-1/2 percent, bringing it just to the bottom
of its growth cone. Although M1 has expanded more rapidly than the
broader aggregates, its growth also has slowed markedly from last year.
After a tax-related surge in April, M1 growth slowed to 4-1/2
percent in May and this aggregate appears to have declined substantially
in June. M2 was virtually unchanged in May as tax payments also likely
depressed MMDA growth in late April and early May and probably played a
role in the runoff of money fund shares. In June, sizable growth in
I-12

I-13
small time deposits was prompted by sharp increases in offering rates and
a steepening of the retail deposit yield curve. Some of the growth in
small time deposits probably came from more liquid components of M2;
however, on balance, the nontransactions component of M2 was boosted more
than enough to offset the decline in M1. M3 growth has remained moderate
but appears to have strengthened a bit from the May pace of just under 5
percent. There were substantial increases in commercial bank large CDs;
at thrifts, CDs increased despite the problems of institutions in the
Southwest.
Credit growth at banks slackened somewhat over the past two months,
after an April bulge. Bank lending to businesses (including bookings
at foreign branches) has tapered off, after picking up in April, and
consumer loans also have weakened. However, real estate lending has
remained strong, likely bolstered to some degree by shifts from consumer
loans to home equity lines. Asset growth at S&Ls also was strong in
April, when borrowers rushed to close mortgage loans under previous
commitments at lower interest rates.
For the nonfinancial business sector in the aggregate, debt growth
appears to have picked up a little over the second quarter as a whole.
Commercial paper issuance lifted the total in April and May, more than
compensating for the diminished volume of gross bond issuance. As interest
rates declined in June, there was some return to bond financing, particu-
larly in the domestic market, but total net issuance for the quarter
apparently was still well below the second-quarter pace. Gross equity
issuance, on the other hand, has remained sizable, but so too have share
retirements.

I-14
In the household sector, revolving credit picked up sharply in April,
perhaps for tax-related reasons, boosting total consumer installment credit
growth from the minimal first quarter pace. However, preliminary data
point to little, if any, further growth in May. Home mortgage borrowing
in the second quarter likely also was greater than in the first quarter.
Issuance of FHLMC and FNMA pass-throughs was quite strong in April and,
in May, their volume was well maintained; the volume of GNMA pass-throughs
was reduced in May, however, probably because loan originators were
released from prior rate commitments on FHA/VA loans by the increases in
the VA ceiling rate.
The pace of tax-exempt bond issuance rebounded in June--but probably
not enough to bring net borrowing by states and localities for the quarter
as a whole up to the first-quarter rate. The pickup in bond offerings
last month was concentrated in issues for new capital; refunding volume
remained at only about one-third of the first-quarter pace, as interest
rates remained well above their earlier levels.
Net borrowing by the Treasury increased in the second quarter,
despite the April surge in tax collections that kept the total budget
deficit about zero. As a result, federal debt growth on a seasonally
adjusted basis surged in the second quarter while the Treasury raised its
cash balance by more than $25 billion. Nevertheless, paydowns of Treasury
bills continued to be substantial, resulting in a reduction of about
8-1/2 percent in the total outstanding stock of Treasury bills over the
first half of this year.
Outlook. Although the staff projections point to only moderate
economic growth in coming months, it is thought that, more likely than

I-15
not, interest rates will be somewhat higher by year-end, owing to pres-
sures stemming from occasional bouts of dollar weakness and from concerns
about inflation trends. Under the circumstances, the nonfinancial credit
aggregate is likely to remain well within the FOMC's monitoring range.
Federal debt expansion will slow from its elevated second-quarter
pace, as the Treasury works down its large cash balance. A disruption of
federal borrowing patterns could occur in mid-July if there is a delay in
completing congressional action on the debt ceiling, but this would almost
certainly be temporary and has no bearing on the staff's forecast. In
the state and local sector, also, borrowing may be a little slower in the
second half of the year, with the higher level of interest rates continuing
to depress advance refunding.
In the business and household sectors, the pace of debt growth is
likely to remain close to the second-quarter pace, and somewhat above the
average for the first half of the year. In the nonfinancial business
sector, the financing gap should remain small, but sizable net share
retirements will continue to require external financing.
In the household sector, consumer credit probably will continue to
register only meager growth. Net extensions of mortgage debt are likely
to ebb very gradually. The possibility of shifting from fixed-rate to
ARM financing will ease the effect of higher interest rates; such a shift
is hinted in data for early May.
During 1988, the staff is expecting about the same debt growth as
in 1987. It is likely that the federal deficit will be little changed as
the current year's tax windfall will not be repeated. In the business
sector, the financing gap will widen a bit but this boost to external

I-16
financing may be offset by a reduced pace of equity retirements. Household
debt growth, in particular mortgage borrowing, is likely to slacken in an
environment of somewhat higher interest rates and moderate growth of spending
for housing and consumer durables.

INTERNATIONAL DEVELOPMENTS
Recent developments. On balance the dollar strengthened during
the intermeeting period, as downward pressure abated despite some
reports of continuing negative sentiment for the long term. The dollar
rose early in the period and following the announcement on May 29 of
the Japanese economic stimulus package. The dollar subsequently
declined with the announcement of Chairman Volcker's resignation and
weakened further in the days prior to the Venice Summit. Late in the
period, the dollar recovered in response to better-than-expected
economic news for the United States and has since traded in a narrow
range. On balance, the weighted-average foreign exchange value of the
dollar against the other G-10 currencies has appreciated about 2-3/4
percent since the May FOMC meeting. The dollar rose nearly 5 percent
against the yen and 2-3/4 percent against the mark.
Since the May meeting of the FOMC, U.S. long-term interest rates
have declined about 50 basis points. This resulted in a narrowing of
the differential between U.S. and foreign rates, as long-term bond
rates rose almost 40 basis points in Germany and almost 70 basis points
in Japan.
The Desk intervened twice, following the
announcement by Citibank of the addition to its loan-loss reserves and
again after the announcement of Chairman Volcker's resignation,
purchasing a total of $543 million against marks and $103 million
against yen.
1-17
I-18
Economic activity in the foreign industrial countries has
generally remained sluggish so far this year. In Germany both real GNP
and industrial production fell sharply during the first quarter while
in France output growth was very weak. German industrial production in
April showed some rebound in activity. In Japan and the United Kingdom
real GNP did rise sharply during the initial quarter of the year.
Japanese industrial production declined in April and May, however.
Consumer price inflation has remained generally low abroad, although
the rate has recently increased slightly in Japan, France, Canada, and
Italy.
Brazil announced in mid-June a new package of stabilization
measures, including a devaluation of the cruzado, a freeze in prices
and wages, cuts in public expenditures, and tighter monetary controls.
Officials hope that the plan will win approval of the IMF and break the
deadlock with the commercial banks. Mexico's current account and
international reserves have shown considerable strength in the first
four months of the year. Phillipine authorities have announced that
they will not seek to reopen the loan negotiations with commercial
banks.
The U.S. merchandise trade deficit was about unchanged in the
first quarter from its value in the final quarter of last year. Both
exports and imports increased slightly on average during the three
months. Much of the increase in the latter was accounted for by a rise
in the value of oil imports, as the price of imported oil rose 23
percent during the quarter. The April trade data, measured on a not-
seasonally adjusted basis, show a deficit smaller than that in March
and well below the monthly average for the first quarter. The U.S.
current account deficit was reduced slightly in the first quarter from

I-19
its rate during the last quarter of 1986. Gains in transfer items more
than offset reduction of net service receipts to account for most of
the improvement in the first quarter.
Outlook. Consistent with higher U.S. interest rates contained in
the current outlook, the rate of decline in the exchange value of the
dollar will be more moderate over the forecast horizon than was
projected in the last Greenbook. However, there remains significant
risk that downward pressure on the dollar in exchange markets will be
greater than expected. If such pressures should emerge, perhaps as a
result of renewed impatience with the pace of external adjustment by
the United States or a changed perception on the part of market
participants of policy intentions both in the United States and in the
major foreign industrial countries, a greater decline in the exchange
value of the dollar could result. The staff has raised slightly its
forecast of GNP growth in the foreign industial countries to about
1-3/4 percent, annual rate, on average during 1987-88, in response to
the changed outlook for the real value of their currencies during the
forecast period and in the light of recent policy actions, particularly
in Japan. The U.S. current account deficit is projected to be about
$155 billion in 1987 and then to decline somewhat, reaching an annual
rate of about $125 billion in the fourth quarter of next year. The
change in the outlook from the previous forecast reflects the change in
the projected value of the dollar over the forecast horizon and
adjustment of the forecast for service transactions based on data for
the first quarter.

Strictly Confidential (FR)Class II FOMC
Outlook for U.S. Net Exports and Related Items(Billions of Dollars, Seasonally Adjusted Annual Rates)
1. GNP Exports and Imports 1/
Current $, NetExports of G+SImports of G+S
Constant 82 $, NetExports of G+SImports of G+S
2. U.S. Merchandise Trade Balance 2/
ExportsAgriculturalNon-Agricultural
ImportsPetroleum and ProductsNon-Petroleum
3. U.S. Current Account Balance
Of Which: Net Investment Income
4. Foreign Outlook 3/
Real GNP--Ten Industrial 4/Real GNP--NonOPEC LDC 5/
Consumer Prices--Ten Ind. 4/
-104.3 -106.6 -85.3373.0 420.7 499.3477.3 527.2 584.6
-147.8 -121.0 -74.9371.5 413.4 471.2519.2 534.3 546.1
-144.3 -152.6 -133.3
224.4 248.9 303.627.0 26.1 28.3
197.3 222.9 275.3
368.7 401.5 436.933.8 39.6 43.5
334.9 361.9 393.3
I I 19871936- Y98-P 8-P 1 QL 3-P QP
-108.9 -110.2370.8 383.5479.7 493.7
-163.3 -148.0371.2 385.8534.5 533.8
C--------------
-148.5
226.126.6
199.6
374.631.6
343.0
-154.4
228.128.1
200.0
382.532.0
350.4
-107.1 -109.1 -106.3 -102.9399.0 409.7 426.8 447.3506.9 518.8 533.1 550.2
-133.7 -125.8 -117.6 -106.9396.7 405.4 tl7.9 433.6530.3 531.0 535.4 540.4
-153.3 -154.5 -152.7 -149.7
232.8 241.8 253.6 267.526.3 26.1 25.5 26.5
206.6 215.8 228.1 241.0
386.2 396.3 406.3 417.234.8 39.3 41.5 43.0
351.4 357.0 364.8 374.3
U-P c i " --- P 4-P
-97.7 -89.9 -81.3 -72.3468.2 489.0 509.5 530.5565.8 578.9 590.9 602.8
-94.5 -81.2 -68.6 -55.5449.1 464.2 478.5 493.1545.5 545.3 547.1 548.5
-144.4
282.227.2
255.0
427.043.0384.0
-137.7
296.728.1
268.7
434.543.3
391.2
-129.4
310.628.7
281.8
439.943.8
396.2
-121.3
324.929.5
295.6
446.244.1
402.1--------------- --- ----------- ---------------------------------- --------------------
-141.4 -154.0 -138.3
20.8 10.0 3.1-- - - - - --------.. . ... . . _ _ _
2.4 2.0 1.84.4 3.8 4.1
2.0 2.2 2.8
-146.3 -151.9
21.4 18.0
---------
2.1 1.74.1 3.9
0.1 2.1
-148.5 -156.4 -156.5 L154.6 -148.7 -142.0 -134.6
15.3 9.6 8.4 6.8
1.3 2.2 1.8 1.93.6 3.7 3.8 3.9
2.4 3.5 2.1 2.4
-127.8
5.5 4.2 2.1 0.6
1.7 1.7 1.84.0 4.3 4.6
2.8 3.3 2.7
Economic activity and product account data.International accounts basis.Percent change, annual rates.Neighted by multilateral trade-weights of 0-10 countries plus Switzerland; prices are not seasonally adjusted.eighted by share in NonOPEC LDC ONP.
Projected