Embed Size (px)
Citation preview
Prefatory Note
The attached document represents the most complete and accurate version available based on original copies culled from the files of the FOMC Secretariat at the Board of Governors of the Federal Reserve System. This electronic document was created through a comprehensive digitization process which included identifying the best-preserved paper copies, scanning those copies,1 and then making the scanned versions text-searchable.2 Though a stringent quality assurance process was employed, some imperfections may remain.
Please note that this document may contain occasional gaps in the text. These gaps are the result of a redaction process that removed information obtained on a confidential basis. All redacted passages are exempt from disclosure under applicable provisions of the Freedom of Information Act.
1 In some cases, original copies needed to be photocopied before being scanned into electronic format. All scanned images were deskewed (to remove the effects of printer- and scanner-introduced tilting) and lightly cleaned (to remove dark spots caused by staple holes, hole punches, and other blemishes caused after initial printing). 2 A two-step process was used. An advanced optimal character recognition computer program (OCR) first created electronic text from the document image. Where the OCR results were inconclusive, staff checked and corrected the text as necessary. Please note that the numbers and text in charts and tables were not reliably recognized by the OCR process and were not checked or corrected by staff.
Confidential (FR) Class II FOMC
September 10, 1980
SUMMARY AND OUTLOOK
Prepared for the Federal Open Market Committee
By the staff of the Board of Governors of the Federal Reserve System
DOMESTIC NONFINANCIAL DEVELOPMENTS
Summary. The decline in overall economic activity has moderated
considerably in recent months, as residential construction activity and
auto sales have picked up. Payroll employment increased in August for
the first time since February, and the limited information available
on industrial production suggests a rise in August, following six months
of decline. Business investment spending, however, remains weak. Food
price increases have been particularly large in the past two months,
reflecting supply developments and the effects of weather conditions,
and strong upward price pressures persist in other areas as well.
The labor market surveys for August showed surprising strength in
employment. Payrolls rose 200,000, following a drop of more than 1-1/4
million over the preceding five months. About half of the August gain
in jobs occurred in the manufacturing sector, which had been hardest
hit by layoffs earlier in the year. The factory workweek also increased
considerably in August, after declining during the previous six months.
Total employment as measured by the household survey was about unchanged,
and the unemployment rate inched down to 7.6 percent.
Nominal consumer outlays rose in July, led by increased purchases
of motor vehicles. Spending for most other major types of goods also
increased, with retail sales excluding autos and nonconsumption goods
advancing about 1/2 percent--slightly less than June's 3/4 percent
gain. Over these two months, however, sales of these goods in real terms
remained relatively flat. In August, sales of domestic autos remained
well above the depressed second quarter pace; in contrast, sales of
foreign-made cars fell back after surging in July.
I-1
I-2
Personal income advanced sharply in July, following several months
of sluggish growth. Most of the increase, however, reflected larger
transfer payments as social security recipients received their annual
cost-of-living adjustment. Wage and salary disbursements declined
slightly in July, but should show a rise for August with the reported
gains in hours worked. Surveys of consumer attitudes in August
indicated less pessimism about future income and employment conditions.
Activity in the housing sector has picked up markedly since the
spring. In July sales of new homes rose sharply for the third conse-
cutive month and were well above the depressed rate of this past spring.
As a result, the inventory of unsold homes has been reduced to its
lowest level in more than four years. Sales of existing houses likewise
surged again in July. Housing starts and permits also increased, and
advance readings suggest that permits continued to rise rapidly early
in August. Mortgage rates, however, have risen considerably in recent
weeks, and qualitative reports suggest some retarding of the rebound
in housing activity.
In contrast to the pickup in the household sector, business
demands for fixed capital continued to show weakness in July, and
commitments data suggest some additional falloff in coming months.
Shipments of nondefense capital goods in nominal terms were little
changed in July, while nonresidential construction outlays fell
abruptly. Although new orders for capital goods and contracts for
new construction have both moved up recently, these indicators of
investment spending are still well below their recent peaks. Moreover,
in the second quarter capital appropriations by large manufacturers
I-3
fell substantially after rising sharply in the first. In addition, the
Commerce Department's August survey of business plans for new plant and
equipment investment in 1980 indicates an 8-3/4 percent increase from
1979, a cutback of more than 1 percent from the May survey. In real
terms, the survey indicates an appreciable decline in spending during
the second half of 1980.
Lower levels of production appear to have brought inventories
into better alignment with sales. In June total manufacturing and trade
stocks in real terms declined for the second month in a row. In July
the book value of manufacturers' inventories increased at a relatively
moderate pace for the third consecutive month, suggesting a further
decline in real terms. Manufacturers' shipments also advanced in July,
and, as a result, the stock-sales ratio for this sector fell for the
first time since January. In the wholesale trade sector, the ratio of
stocks to sales declined as well in July, despite a sizable increase
in the book value of inventories.
Price pressures generally have remained intense, with sporadic
signs of easing in consumer prices in recent months attributable pri-
marily to transitory developments in the housing and energy sectors.
A substantial decline in contracted mortgage rates kept the consumer
price index unchanged in July, while the dramatic slowdown in energy
price increases since the first quarter has exerted a moderating in-
fluence on both producer and consumer prices in recent months. Never-
theless, increases in producer prices in July and August returned
to the nearly 20 percent annual rate of the first quarter, largely as
a result of a weather- and supply-related acceleration in food prices.
Outlook. Overall economic activity is now projected to fall at a
3 percent annual rate in the third quarter and to edge slightly lower
in the fourth. These are more moderate declines than were indicated
last month, as recent data now suggest a stronger near-term rebound
in residential construction and an earlier firming of consumer spending
than had been anticipated. However, weaker capital spending, parti-
cularly in the current quarter, appears to be offsetting some of the
additional strength in the housing and consumer sectors. Reflecting the
smaller decline now expected in output and the recent labor market data,
the unemployment rate is now expected to rise somewhat more gradually
than projected last month--to a little over 8 percent by the end of the
year.
The staff continues to project a bottoming out of the recession
in the very near term, with weakness this fall concentrated in business
spending. Inventories, which still are high relative to sales, are
likely to be reduced through year end. The staff also anticipates a
further curtailment of real business investment outlays--particularly
for construction projects, which typically have long lead times. In
addition, weak income growth and efforts by households to build savings
are expected to restrain consumer spending.
The monetary policy assumptions underlying the projection are
essentially unchanged from the last Greenbook. M-1A growth is assumed
to lie in the lower part of the Committee's range for 1980 and to be
about 4-1/2 percent over 1981 (abstracting from the impact of nation-
wide NOW accounts). Interest rates are expected to rise moderately
further in 1981, reaching levels slightly higher than those previously
I-5
projected. The fiscal policy assumptions are also little changed, with
corporate and personal income taxes assumed to be cut by $28 billion
effective January 1. This is about the same magnitude as the tax reduc-
tion proposed by the administration. The budget deficits for fiscal
year 1980 and 1981 are each projected to be around $60 billion, roughly
similar to the last Greenbook.
The projected recovery in 1981 is sluggish by historical standards,
as real GNP is expected to rise only about 2 percent over the year--an
increase similar to that indicated last month. The relatively restric-
tive monetary policy stance suggests that credit market conditions will
impinge on housing construction. Also, the high cost of capital at a
time when there is likely to be considerable slack in industrial capa-
city is expected to hold down business fixed investment. In addition,
a climate of budget restraint is expected to provide little room for
growth in purchases by state or local government units. The small
advance in output anticipated for 1981 will limit employment gains, and
the jobless rate is therefore expected to remain about flat throughout
the year at a level slightly under 8-1/2 percent.
The staff outlook for inflation through the end of 1981 was revised
up about 1/4 percentage point, due primarily to a sharper rise in food
prices anticipated over the next six to nine months. As a result, the
gross business product fixed-weighted price index is now expected to
increase about 10 percent at an annual rate through the end of this
year, only about 1 percentage point below the pace experienced in the
first half. Over the four quarters of next year this index is projected
to rise 9-1/4 percent, as rapid increases in labor costs continue to
I-6
prevent a significant reduction in the rate of price inflation. Improve-
ment in the overall pace of inflation also will be constrained by the
acceleration of food prices and the reemergence of energy price pressures
as the cost of imported oil rises and the control of domestic oil prices
continues to be phased out.
Detailed data for these projections are shown in the following
tables.
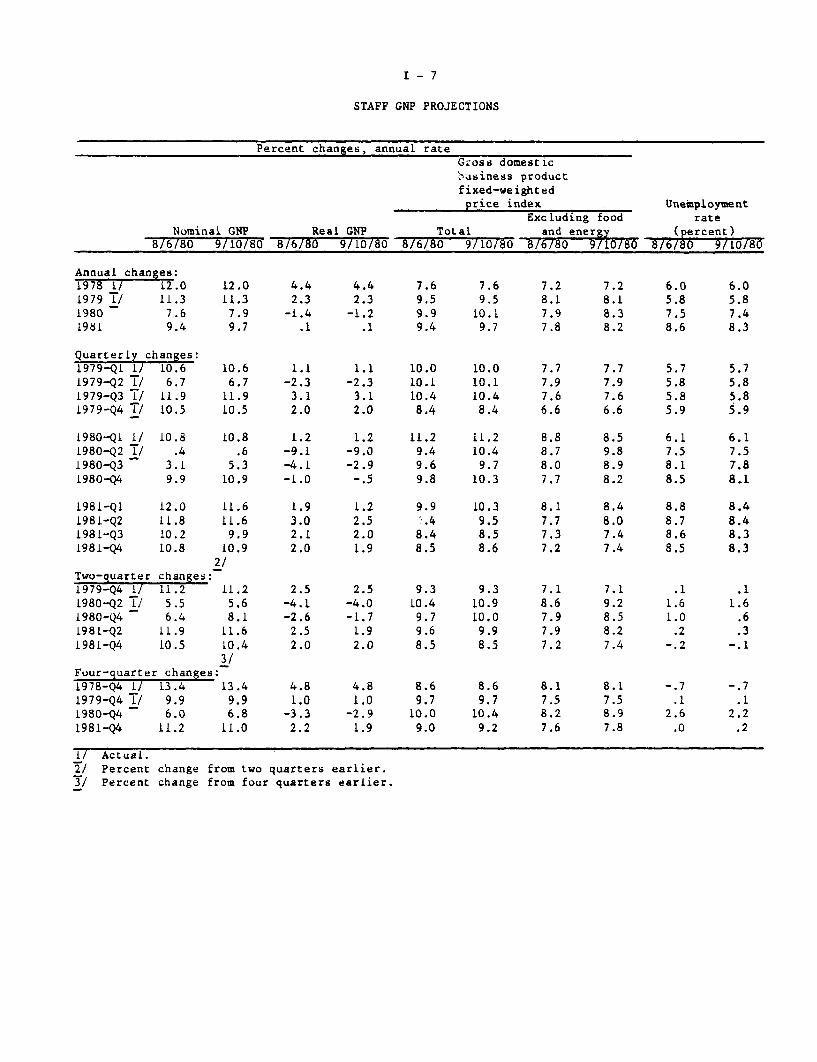
I-7
STAFF GNP PROJECTIONS
Percent changes, annual rateGross domesticbusiness productfixed-weighted
price index UnemploymentExcluding food rate
Nominal GNP Real GNP Total and energy (percent)8/6/80 9/10/80 8/6/80 9/10/80 8/6/80 9/10/80 8/6/80 9/10/80 86/80 9/10/80
Annual changes:1978 1/ 12.01979 1/ 11.31980 7.61981 9.4
Quarterly changes:1979-Q1 1/ 10.61979-Q2 1/ 6.71979-Q3 1/ 11.91979-Q4 1/ 10.5
1980-Q1 1/1980-Q2 1/1980-Q31980-Q4
1981-Q11981-Q21981-Q31981-Q4
10.8.4
3.19.9
12.011.810.210.8
Two-quarter changes:1979-Q4 1/ 11.21980-Q2 1/ 5.51980-Q4 6.41981-Q2 11.91981-Q4 10.5
12.011.37.99.7
10.66.7
11.910.5
10.8.6
5.310.9
11.611.6
9.910.92/
11.25.68.1
11.610.43/
Four-quarter changes:1978-Q4 1/ 13.4 13.41979-Q4 1/ 9.9 9.91980-Q4 6.0 6.81981-Q4 11.2 11.0
Actual.Percent change from two quarters earlier.Percent change from four quarters earlier.
4.42.3
-1.4.1
1.1-2.33.12.0
1.2-9.1-4.1-1.0
1.93.02.12.0
2.5-4.1-2.62.52.0
4.81.0
-3.32.2
4.42.3-1.2
.1
1.1-2.3
3.12.0
1.2-9.0-2.9-.5
1.22.52.01.9
2.5-4.0-1.7
1.92.0
4.81.0
-2.91.9
7.69.59.99.4
10.010.110.48.4
11.29.49.69.8
9.9S.48.48.5
9.310.4
9.79.68.5
8.69.7
10.09.0
7.69.5
10.19.7
10.010.110.4
8.4
11.210.4
9.710.3
10.39.58.58.6
9.310.910.0
9.98.5
8.69.7
10.49.2
I/T/
i
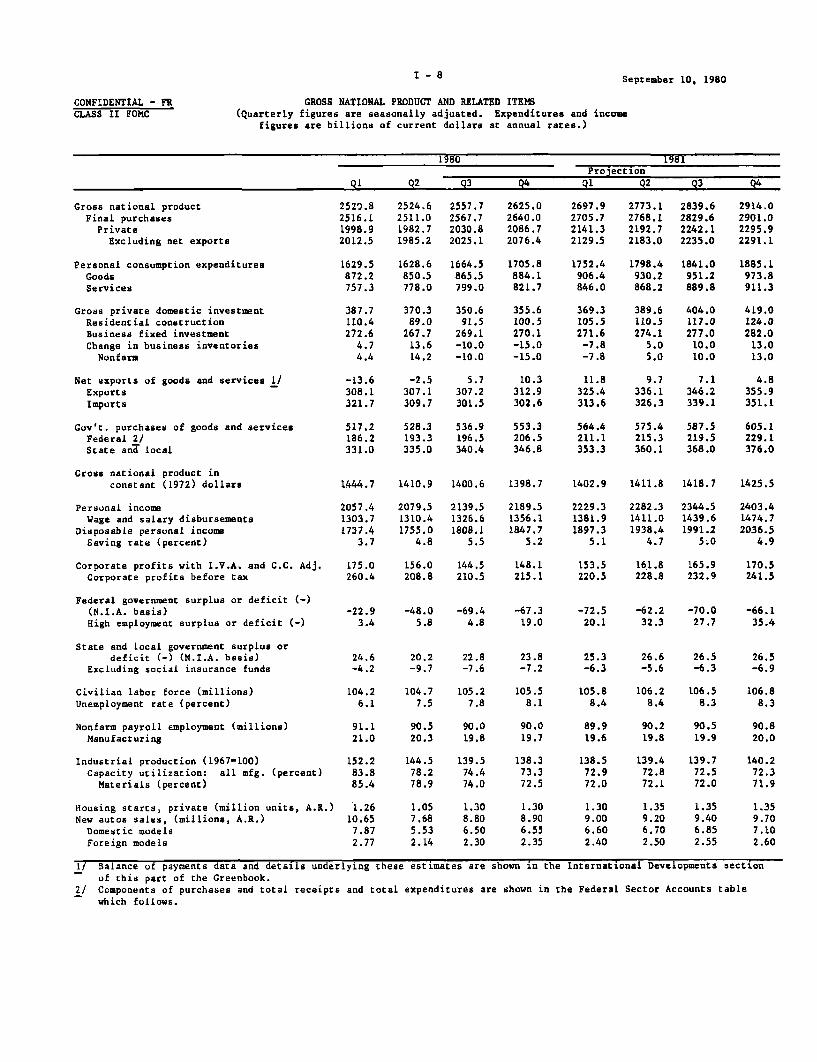
September 10, 1980
CONFIDENTIAL - FRCLASS II FOMC
GROSS NATIONAL PRODUCT AND RELATED ITEMS
(Quarterly figures are seasonally adjusted. Expenditures and incomefigures are billions of current dollars at annual rates.)
1980 1981Projection
Q1 Q2 Q3 Q4 Q1 Q2 Q3 Q4
Gross national productFinal purchasesPrivate
Excluding net exports
Personal consumption expendituresGoodsServices
Gross private domestic investmentResidential constructionBusiness fixed investmentChange in business inventories
Nonfarm
Net exports of goods and services I/ExportsImports
Gov't. purchases of goods and servicesFederal 2/State and local
Gross national product inconstant (1972) dollars
Personal incomeWage and salary disbursements
Disposable personal incomeSaving rate (percent)
Corporate profits with I.V.A. and C.C. Adj.Corporate profits before tax
Federal government surplus or deficit (-)(N.I.A. basis)High employment surplus or deficit (-)
State and local government surplus ordeficit (-) (N.I.A. basis)
Excluding social insurance funds
Civilian labor force (millions)
Unemployment rate (percent)
Nonfarm payroll employment (millions)Manufacturing
Industrial production (1967=100)Capacity utilization: all mfg. (percent)Materials (percent)
Housing starts, private (million units, A.R.)
New autos sales, (millions, A.R.)Domestic modelsForeign models
2520.82516.11998.92012.5
1629.5872.2757.3
387.7110.4272.6
4.74.4
-13.6308.1321.7
517.2186.2331.0
2524.62511.01982.71985.2
1628.6850.5778.0
370.389.0
267.713.614.2
-2.5307.1309.7
2557.72567.72030.82025.1
1664.5865.5799.0
350.691.5
269.1-10.0-10.0
5.7307.2301.5
2625.02640.02086.72076.4
1705.8884.1821.7
355.6100.5270.1-15.0-15.0
10.3312.9302.6
528.3 536.9 553.3193.3 196.5 206.5335.0 340.4 346.8
2697.92705.72141.32129.5
1752.4906.4846.0
369.3105.5271.6
-7.8-7.8
11.8325.4313.6
2773.12768.12192.72183.0
1798.4930.2868.2
389.6110.5274.1
5.05.0
9.7336.1326.3
564.4 575.4211.1 215.3353.3 360.1
2839.62829.62242.12235.0
1841.0951.2889.8
404.0117.0277.0
10.010.0
7.1346.2339.1
587.5219.5368.0
1444.7 1410.9 1400.6 1398.7 1402.9 1411.8 1418.7
2057.41303.71737.4
3.7
2079.51310.41755.0
4.8
2139.51326.61808.1
5.5
2189.51356.11847.7
5.2
175.0 156.0 144.5 148.1260.4 208.8 210.5 215.1
-22.9 -48.0 -69.4 -67.33.4 5.8 4.8 19.0
24.6 20.2 22.8 23.8-4.2 -9.7 -7.6 -7.2
104.26.1
104.7 105.27.5 7.8
105.58.1
91.1 90.5 90.0 90.021.0 20.3 19.8 19.7
152.2 144.583.8 78.285.4 78.9
1.2610.657.872.77
139.574.474.0
138.373.372.5
1.05 1.30 1.307.68 8.80 8.905.53 6.50 6.552.14 2.30 2.35
2229.31381.91897.3
5.1
2282.31411.01938.4
4.7
2344.51439.61991.2
5.0
2914.02901.02295.92291.1
1885.1973.8911.3
419.0124.0282.0
13.013.0
4.8355.9351.1
605.1229.1376.0
1425.5
2403.41474.72036.5
4.9
153.5 161.8 165.9 170.5220.5 228.8 232.9 241.5
-72.5 -62.2 -70.0 -66.120.1 32.3 27.7 35.4
25.3 26.6 26.5 26.5-6.3 -5.6 -6.3 -6.9
105.8 106.2 106.5 106.88.4 8.4 8.3 8.3
89.9 90.2 90.5 90.819.6 19.8 19.9 20.0
138.572.972.0
139.472.872.1
139.772.572.0
140.272.371.9
1.30 1.35 1.35 1.359.00 9.20 9.40 9.706.60 6.70 6.85 7.102.40 2.50 2.55 2.60
I/ Balance of payments data and details underlying these estimates areof this part of the Greenbook.
shown in the International Developments section
2/ Components of purchases and total receipts and total expenditures are shown in the Federal Sector Accounts table
which follows.
I - 8
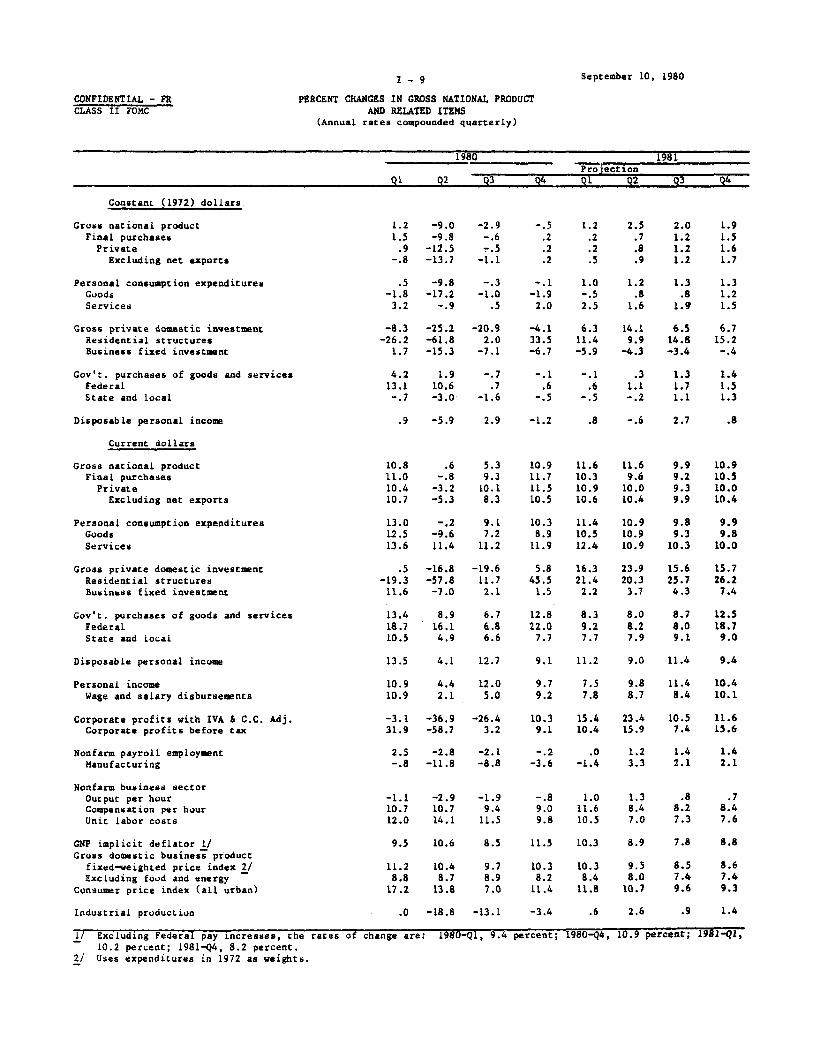
CONFIDENTIAL - FRCLASS II FOMC
I-9
PERCENT CHANGES IN GROSS NATIONAL PRODUCTAND RELATED ITEMS
(Annual rates compounded quarterly)
September 10, 1980
1980 1981Projection
Q1 Q2 Q3 Q4 Q1 Q2 Q3 Q4
Constant (1972) dollars
Gross national productFinal purchasesPrivate
Excluding net exports
-9.0-9.8
-12.5-13.7
Personal consumption expendituresGoodsServices
Gross private domestic investmentResidential structuresBusiness fixed investment
Gov't. purchases of goods and servicesFederalState and local
Disposable personal income
.5 -9.8-1.8 -17.23.2 -.9
-.3 -. 1 1.0-1.0 -1.9 -.5
.5 2.0 2.5
-8.3 -25.2 -20.9 -4.1 6.3 14.1 6.5 6.7-26.2 -61.8 2.0 33.5 11.4 9.9 14.8 15.2
1.7 -15.3 -7.1 -6.7 -5.9 -4.3 -3.4 -. 4
4.2 1.9 -. 7 -. 113.1 10.6 .7 .6-.7 -3.0 -1.6 -.5
.9 -5.9 2.9 -1.2 .8 -.6 2.7 .8
Current dollars
Gross national productFinal purchases
PrivateExcluding net exports
Personal consumption expendituresGoodsServices
Gross private domestic investmentResidential structuresBusiness fixed investment
Gov't. purchases of goods and servicesFederalState and local
Disposable personal income
Personal income
Wage and salary disbursements
Corporate profits with IVA & C.C. Adj.Corporate profits before tax
Nonfarm payroll employmentManufacturing
Nonfarm business sectorOutput per hourCompensation per hourUnit labor costs
GNP implicit deflator 1/Gross domestic business product
fixed-weighted price index 2/Excluding food and energy
Consumer price index (all urban)
Industrial production
10.8 .6 5.3 10.9 11.6 11.6 9.9 10.911.0 -. 8 9.3 11.7 10.3 9.6 9.2 10.510.4 -3.2 10.1 11.5 10.9 10.0 9.3 10.010.7 -5.3 8.3 10.5 10.6 10.4 9.9 10.4
13.0 -. 2 9.1 10.3 11.4 10.9 9.8 9.912.5 -9.6 7.2 8.9 10.5 10.9 9.3 9.813.6 11.4 11.2 11.9 12.4 10.9 10.3 10.0
.5-19.3
11.6
-16.8-57.8-7.0
-19.611.72.1
13.4 8.9 6.718.7 16.1 6.810.5 4.9 6.6
5.8 16.3 23.9 15.6 15.745.5 21.4 20.3 25.7 26.21.5 2.2 3.7 4.3 7.4
12.8 8.3 8.0 8.722.0 9.2 8.2 8.0
7.7 7.7 7.9 9.1
13.5 4.1 12.7 9.1 11.2 9.0 11.4 9.4
10.9 4.4 12.0 9.7 7.5 9.8 11.4 10.410.9 2.1 5.0 9.2 7.8 8.7 8.4 10.1
-3.1 -36.9 -26.4 10.3 15.4 23.4 10.5 11.631.9 -58.7 3.2 9.1 10.4 15.9 7.4 15.6
2.5 -2.8 -2.1 -.2 .0 1.2 1.4 1.4-.8 -11.8 -8.8 -3.6 -1.4 3.3 2.1 2.1
-1.1 -2.9 -1.9 -.810.7 10.7 9.4 9.012.0 14.1 11.5 9.8
1.0 1.311.6 8.410.5 7.0
.8 .78.2 8.47.3 7.6
10.6
10.48.7
13.8
.0 -18.8 -13.1 -3.4 .6 2.6 .9 1.4
i/ Excluding Federal pay increases, the rates of10.2 percent; 1981-Q4, 8.2 percent.
2/ Uses expenditures in 1972 as weights.
change are: 1980-Q1, 9.4 percent; 1980-Q4, 10.9 percent; 1981-Qi,
September 10, 1980
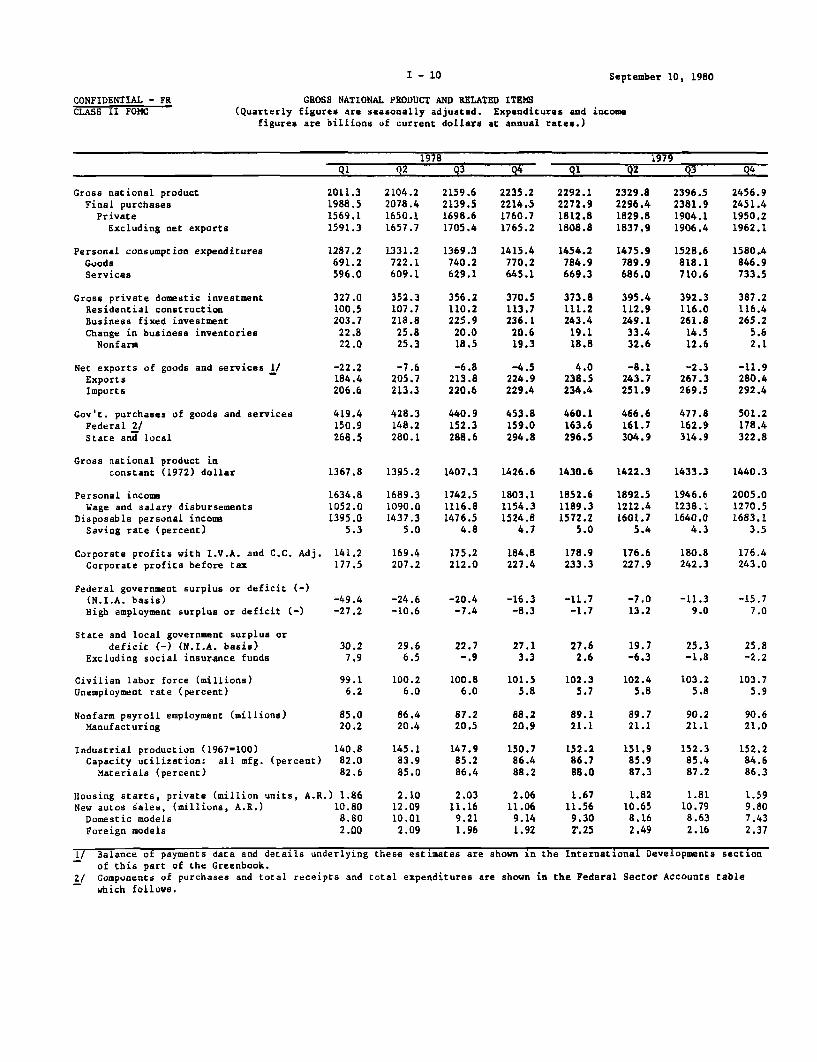
CONFIDENTIAL - FRCLASS II FOMC
GROSS NATIONAL PRODUCT AND RELATED ITEMS(Quarterly figures are seasonally adjusted. Expenditures and income
figures are billions of current dollars at annual rates.)
1978 1979
Q1 Q2 Q3 Q4 Q1 Q2 Q3 Q4
Gross national productFinal purchases
PrivateExcluding net exports
Personal consumption expendituresGoodsServices
Gross private domestic investmentResidential constructionBusiness fixed investmentChange in business inventoriesNonfarm
Net exports of goods and services 1/ExportsImports
Gov't. purchases of goods and servicesFederal 2/State and local
Gross national product inconstant (1972) dollar
Personal incomeWage and salary disbursements
Disposable personal incomeSaving rate (percent)
2011.31988.51569.11591.3
1287.2691.2596.0
327.0100.5203.7
22.822.0
-22.2184.4206.6
419.4150.9268.5
2104.22078.41650.11657.7
1331.2722.1609.1
352.3107.7218.825.825.3
-7.6205.7213.3
428.3148,2280.1
2159.62139.51698.61705.4
1369.3740.2629.1
356.2110.2225.9
20.018.5
-6.8213.8220.6
440.9152.3288.6
2235.22214.51760.71765.2
1415.4770.2645.1
370.5113.7236.1
20.619.3
-4.5224.9229.4
453.8159.0294.8
2292.12272.91812.81808.8
1454.2784.9669.3
373.8111.2243.419.118.8
4.0238.5234.4
460.1163.6296.5
2329.82296.41829.81837,9
1475.9789.9686.0
395.4112.9249.133.432.6
-8.1243.7251.9
466.6161.7304.9
2396.52381.91904.11906.4
1528.6818.1710.6
392.3116.0261.8
14.512.6
-2.3267.3269.5
477.8162.9314.9
2456.92451.41950.21962.1
1580.4846.9733.5
387.2116.4265.2
5.62.1
-11.9280.4292.4
501.2178.4322.8
1367.8 1395.2 1407.3 1426.6 1430.6 1422.3 1433.3 1440.3
1634.81052.01395.0
5.3
Corporate profits with I.V.A. and C.C. Adj. 141.2Corporate profits before tax 177.5
1689.31090.01437.3
5.0
1742.51116.81476.5
4.8
1803.11154.31524.8
4.7
1852.61189.31572.2
5.0
1892.51212.41601.7
5.4
1946.61238.11640.0
4.3
2005.01270.51683.1
3.5
169.4 175.2 184.8 178.9 176.6 180.8 176.4207.2 212.0 227.4 233.3 227.9 242.3 243.0
Federal government surplus or deficit (-)(N.I.A. basis)High employment surplus or deficit (-)
State and local government surplus or
deficit (-) (N.I.A. basis)Excluding social insurance funds
Civilian labor force (millions)Unemployment rate (percent)
Nonfarm payroll employment (millions)Manufacturing
Industrial production (1967=100)Capacity utilization: all mfg. (percent)
Materials (percent)
-49.4 -24.6 -20.4 -16.3 -11.7 -7.0 -11.3 -15.7-27.2 -10.6 -7.4 -8.3 -1.7 13.2 9.0 7.0
29.6 22.76.5 -. 9
100.26.0
100.86.0
27.6 19.7 25.3 25.82.6 -6.3 -1.8 -2.2
101.55.8
102.3 102.45.7 5.8
103.25.8
103.75.9
85.0 86.4 87.2 88.2 89.1 89.7 90.2 90.620.2 20.4 20.5 20.9 21.1 21.1 21.1 21.0
140.882.082.6
Housing starts, private (million units, A.R.) 1.86New autos sales, (millions, A.R.) 10.80
Domestic models 8.80Foreign models 2.00
145.183.985.0
2.1012.0910.01
2.09
147.985.286.4
2.0311.169.211.96
150.786.488.2
2.0611.069.141.92
152.286.788.0
1.6711.569.302.25
151.985.987.3
1.8210.658.162.49
152.385.487.2
1.8110.798.632.16
152.284.686.3
1.599.807.432.37
1/ Balance of payments data and details underlying these estimates areof this part of the Greenbook.
shown in the International Developments section
2/ Components of purchases and total receipts and total expenditures are shown in the Federal Sector Accounts table
which follows.
I - 10
CONFIDENTIAL - FRCLASS II FOMC
I - 11
PERCENT CHANGES IN GROSS NATIONAL PRODUCTAND RELATED ITEMS
(Annual rates compounded quarterly)
September 10, 1980
1978 1979Q1 Q2 Q3 Q4 Q1 Q2 Q3 Q4
Constant (1972) dollars
Gross national productFinal purchasesPrivate
Excluding net exports
Personal consumption expendituresGoodsServices
Gross private domestic investmentResidential structuresBusiness fixed investment
Gov't. purchases of goods and servicesFederalState and local
Disposable personal income
Current dollars
Gross national productFinal purchasesPrivate
Excluding net exports
Personal consumption expendituresGoodsServices
Gross private domestic investmentResidential structuresBusiness fixed investment
Gov't. purchases of goods and servicesFederalState and local
Disposable personal income
Personal income
Wage and salary disbursements
Corporate profits with IVA & C.C. Adj.Corporate profits before tax
Nonfarm payroll employmentManufacturing
Nonfarm business sectorOutput per hourCompensation per hourUnit labor costs
GNP implicit deflator.1/Gross domestic business product
fixed-weighted price index 2/Excluding food and energy
Consumer price index (all urban)
Industrial production
1.9.4.8
1.0
.8-4.7
7.9
12.3-4.74.6
-1.2-7.4
2.7
2.0
8.47.57.78.8
9.03.3
16.1
13.32.4
10.6
6.5-. 9
11.1
10.3
10.011.7
-27.5-11.5
4.75.4
8.38.7
10.77.9
5.69.21.4
15.711.023.2
.9-12.3
9.3
4.0
19.819.322.317.8
14.419.1
9.1
34.832.033.3
8.8-7.018.5
12.7
14.015.3
107.285.7
7.03.5
3.54.64.44.1
4.84.25.5
-5.0-4.93.9
5.08.23.3
4.2
10.912.312.312.0
11.910.413.8
4.59.5
13.7
12.311.712.6
11.4
13.210.2
14.49.6
3.72.6
5.65.76.76.9
6.89.93.2
6.6-1.111.3
1.83.21.0
6.4
14.814.815.414.8
14.217.210.6
17.113.519.3
12.218.7
8.9
13.8
14.714.1
23.832.4
4.76.3
-. 9 1.8 2.4 .711.4 7.3 8.5 8.712.4 5.4 5.9 7.9
6.3 10.6 7.2 8.7
6.6 10.5 8.8 8.75.5 9.4 8.9 8.77.8 10.2 8.8 9.1
1.4 12.8 7.9 7.8
1/ Excluding Federal pay increases, rates of change were:9.3 percent; 1979-Q4, 8.0 percent.
2/ Uses expenditures in 1972 as weights.
1978-Q1, 6.3 percent; 1978-Q4, 8.1 percent; 179-Ql,
1.11.11.8
.4
.6-4.4
7.1
-. 5-14.3
4.8
-1.87.2
-6.6
2.1
10.611.012.410.3
11.47.9
15.8
3.6-8.512.9
5.612.1
2.3
13.0
11.412.7
-12.210.8
4.34.6
-3.310.214.0
9.3
10.07.7
11.1
4.0
-2.3-3.9-4.1-2.9
-2.9-7.32.5
8.5-7.2
-. 8
-3.3-11.3
1.6
-1.4
6.74.23.86.6
6.12.6
10.4
25.26.19.6
5.8-4.611.9
7.7
8.98.0
-5.0-8.9
2.4.6
-3.98.1
12.5
9.3
10.17.9
13.6
-. 8
3.16.47.85.3
4.96.03.6
-12.8-1.510.7
1.0-2.6
3.1
.2
11.915.817.315.8
15.015.115.1
-3.011.722.0
10.03.1
13.8
9.9
11.98.8
9.927.8
2.3-. 6
-1.58.510.1
8.5
10.47.6
12.9
1.1
2.03.63.13.1
4.14.73.5
-11.6-4.5-. 3
6.016.0
.8
1.1
10.512.210.012.2
14.314.813.5
-5.11.45.4
21.143.810.4
10.9
12.610.9
-9.41.2
1.7-1.7
.89.58.6
8.4
8.47.713.2
-. 3
CONFIDENTIAL - FRCLASS II FOMC
I - 12
GROSS NATIONAL PRODUCT AND RELATED ITEMS(Expenditures and income figures are billions of current dollars.)
September 10, 1980
Gross national productFinal purchases
PrivateExcluding net exports
Personal consumption expendituresGoodsServices
Gross private domestic investmentResidential constructionBusiness fixed investmentChange in business inventories
Nonfarm
Net exports of goods and services 1/ExportsImports
Gov't. purchases of goods and servicesFederal 2/State and local
Gross national product inconstant (1972) dollars
Personal incomeWage and salary disbursements
Disposable personal incomeSaving rate (percent)
Corporate profits with I.V.A. and C.C. Adj.Corporate profits before tax
Federal government surplus or deficit(N.I.A. basis)High employment surplus or deficit (-)
State and local government surplus ordeficit (-) (N.I.A. basis)
Excluding social insurance funds
Civilian labor force (millions)Unemployment rate (percent)
Nonfarm payroll employment (millions)Manufacturing
Industrial production (1967=100)Capacity utilization: all manufacturing (percent)Materials (percent)
Housing starts, private (million units, A.R.)New auto sales, (millions, A.R.)
Domestic modelsForeign models
Projected1979 1980 1981
2368.8 2557.0 2806.12350.6 2558.7 2801.11874.2 2024.8 2218.01878.8 2024.8 2209.6
1509.8 1657.1 1819.2809.9 868.1 940.4699.8 789.0 878.8
387.2 366.0 395.5114.1 97.8 114.2254.9 269.9 276.218.2 -1.7 5.016.5 -1.6 5.0
-4.6 .0 8.3257.5 308.8 340.9262.1 308.9 332.6
476.4 533.9 583.1166.6 195.6 218.7309.8 338.3 364.3
1974
1412.91404.01101.31095.3
889.6498.3391.3
214.655.1
150.68.9
10.8
6.0137.9131.9
302.7111.1191.5
1217.8
1154.9764.6984.6
7.3
83.6126.9
1975
1528.81539.61201.21180.8
979.1541.5437.5
190.951.5
150.2-10.7-14.3
20.4147.3126.9
338.4123.1215.4
1202.3
1255.5805.9
1086.77.7
95.9120.4
-10.7 -70.6 -53.6 -46.3 -27.7 -11.4 -51.9 -67.78.9 -21.5 -17.8 -22.1 -13.4 6.9 8.2 28.9
7.6 6.2 17.9 26.8 27.4 24.6-2.9 -6.2 2.3 7.3 4.2 -1.9
91.0 92.6 94.8 97.4 100.4 102.95.6 8.5 7.7 7.0 6.0 5.8
78.3 77.0 79.4 82.5 86.7 89.920.1 18.3 19.0 19.7 20.5 21.1
129.3 117.8 130.5 138.2 146.1 152.283.8 72.9 79.5 81.9 84.4 85.787.1 73.4 81.1 82.7 85.6 87.2
1.34 1.16 1.54 1.99 2.02 1.758.91 8.66 10.12 11.13 11.28 10.707.49 7.08 8.63 9.07 9.29 8.381.42 1.58 1.50 2.06 1.99 2.32
22.9-7.2
104.97.4
90.420.2
143.677.477.7
1.239.016.612.39
26.2-6.3
106.38.3
90.419.8
139.472.672.0
1.349.326.812.51
1/ Balance of payments data underlying these estimates are shown in the International Developments section of thispart of the Greenbook.
2/ Components of purchases and total receipts and total expenditures are shown in the Federal Sector Accounts tablewhich follows.
- -
1976
1702.21692.11330.81322.8
1089.9601.3488.5
243.068.1
164.910.012.1
8.0163.3155.4
361.3129.7231.6
1273.0
1381.6890.0
1184.55.8
126.8156.0
1977
1899.51877.61481,41491.3
1210.0660.1549.8
303.391.9
189.421.920.7
-9.9175.9185.8
396.2144.4251.8
1340.5
1531.6984.0
1305.15.0
150.0177.1
1978
2127.62105.21669.6
.1679.9
1350.8730.9619.8
351.5108.0221.1
22.321.3
-10.3207.2217.5
435.6152.6283.0
1399.2
1717.41103.31458.4
4.9
167.7206.0
1431.6
1924.21227.61624.3
4.5
178.2236.6
1413.7
2116.51324.21787.1
4.8
155.9223.7
1414.7
2314.91426.81965.9
4.9
162.9230.9
I - 13
CONFIDENTIAL - FR PERCENT CHANGES IN GROSS NATIONAL PRODUCTCLASS 11 FOMC AND RELATED ITEMS
September 10, 1980
Projected1974 1975 1976 1977 1978 1979 1980 1981
Constant (1972) dollars
Gross national product -1.4 -1.3 5.9 5.3 4.4 2.3 -1.3 .1Final purchases -.7 .2 4.5 4.8 4.4 2.7 -.4 -.3Private -1.4 -.3 5.6 5.6 5.0 3.2 -1.1 -.4
Excluding net exports -2.3 -1.0 6.5 6.2 5.0 2.6 -2.0 -.5
Personal consumption expenditures -.9 1.8 5.9 5.0 4.5 2.6 -.7 .0Goods -3.4 .7 6.9 5.1 4.1 1.3 -3.1 -1.5Services 2.3 3.2 4.8 4.9 5.1 4.3 2.1 1.6
Gross private domestic investment -11.4 -22.3 21.6 15.4 7.1 .4 -13.2 -.5Residential structures -24.6 -13.9 23.3 20.7 4.2 -5.7 -21.9 6.5Business fixed investment -.3 -13.0 4.8 8.6 8.4 6.2 -2.8 -5.9
Gov't. purchases of goods and services 2.1 1.9 .2 2.0 1.8 .4 2.3 .3Federal -.8 .7 -.2 4.4 -2.0 .9 7.0 1.5State and local 3.8 2.6 .5 .6 4.0 .2 -. 3 -. 4
Disposable personal income -1.5 2.1 3.7 4.2 4.6 2.3 -.5 .2
Current dollars
Gross national product 8.1 8.2 11.3 11.6 12.0 11.3 7.9 9.7Final purchases 8.9 9.7 9.9 11.0 12.1 11.7 8.9 9.5
Private 8.1 9.1 10.8 11.3 12.7 12.3 8.0 9.5Excluding net exports 8.2 7.8 12.0 12.7 12.6 11.8 7.8 9.1
Personal consumption expenditures 9.8 10.1 11.3 11.0 11.6 11.8 9.8 9.8Goods 8.9 8.7 11.0 9.8 10.7 10.8 7.2 8.3Services 11.1 11.8 11.7 12.5 12.7 12.9 12.7 11.4
Gross private domestic investment -2.5 -11.0 27.3 24.8 15.9 10.2 -5.5 8.0Residential structures -16.7 -6.5 32.3 35.0 17.5 5.7 -14.3 16.8Business fixed investment 10.8 -.1 9.8 14.9 16.7 15.2 5.9 2.3
Gov't. purchases of goods and services 12.3 11.8 6.8 9.7 9.9 9.4 12.1 9.2Federal 8.7 10.7 -5.4 11.3 5.7 9.2 17.4 11.8State and local 14.5 12.5 7.5 8.7 12.4 9.5 9.2 7.7
Disposable personal income 9.2 10.4 9.0 10.2 11.7 11.4 10.0 10.0
Personal income 9.7 8.7 10.0 10.9 12.1 12.0 10.0 9.4Wage and salary disbursements 9.0 5.4 10.4 10.6 12.1 11.3 7.9 7.7
Corporate profits with IVA & C.C. Adj. -15.6 14.7 32.2 18.3 11.8 6.3 -12.5 4.5Corporate profits before tax 9.6 -5.1 29.6 13.5 16.3 14.9 -5.5 3.2
Nonfarm payroll employment 2.0 -1.7 3.1 3.9 5.1 3.7 .6 .0Manufacturing -.4 -8.7 3.7 3.6 4.2 2.8 -4.2 -2.0
Nonfarm business sectorOutput per hour -3.1 1.9 3.5 1.5 .5 -1.1 -1.7 .9Compensation per hour 9.1 9.9 8.3 7.9 8.6 9.0 9.9 9.2Unit labor costs 12.7 7.9 4.7 6.3 8.0 10.2 11.8 8.1
GNP implicit deflator 9.7 9.6 5.2 6.0 7.3 8.8 9.4 9.6Gross domestic business product
fixed-weighted price index 1/ 10.4 9.4 5.3 6.2 7.6 9.5 10.1 9.7Excluding food and energy 8.1 9.5 5.8 6.3 7.2 8.1 8.3 8.2
Consumer price index (all urban) 11.0 9.1 5.8 6.5 7.7 11.3 13.4 10.6
Industrial production -.4 -8.9 10.8 5.9 5.7 4.2 -5.6 -2.9
1/ Uses expenditures in 1972 weights.
September 10, 1980FEDERAL SECTOR ACCOUNTS(Billions of dollars)
I FRB Staff EstimatesFiscal FY 1980 e/ FY 1981 e2/ CY80Oe/ Calendar quarters; undajusted dataYear Admin. F.R. Admin. F.R. CY F.R. 1979 1980 19811979* 1/ Board 1I Board 1979* Board IV* I* II* III IV I II III
Unified budget receipts 465.9 517.9 519.1 604.0 574.2 480.5 531.6 114.0 114.6 156.2 134.2 126.5 126.8 171.3 149.5Unified budget outlays 493.7 578.8 578.6 633.8 637.1 508.7 595.6 138.6 141.8 148.1 150.1 155.6 154.7 160.6 166.2
Surplus(+)/deficit(-), unifiedbudget -27.7 -60.9 -59.5 -29.8 -62.9 -28.2 -64.0 -24.6 -27.2 8.2 -15.9 -29.1 -27.9 10.7 -16.7
Surplus (+)/deficit(-), off-budgetagencies 3/ -12.4 -16.1 -13.7 -21.7 -20.0 -13.2 -14.0 -1.0 -3.8 -4.4 -4.5 -1.3 -6.9 -6.6 -5.2
Combined deficit to be financed -40.2 -77.0 -73.2 -51.5 -82.9 -41.4 -78.0 -25.6 -31.0 3.8 -20.4 -30.4 -34.8 4.1 -21.9
Heans of financing combined deficits:Net borrowing from public 33.7 69.7 68.1 45.8 76.5 37.3 77.6 18.9 19.1 5.4 24.7 28.4 23.8 1.9 22.4Decrease in cash operating balance -1.8 4.2 4.2 5.0 5.0 0.4 -0.1 8.3 7.7 -5.9 -5.9 4.0 8.0 -4.0 -3.0Other 4/ 8.3 3.1 0.9 0.7 1.5 3.5 0.6 -1.7 4.1 -3.1 1.6 -2.0 3.0 -2.0 2.5
Cash operating balance, end of period 24.2 20.0 20.0 15.0 15.0 15.9 16.0 15.9 8.2 14.1 20.0 16.0 8.0 12.0 15.0
Memo: Sponsored agency borrowing 5/ 19.1 16.2 21.9 16.7 19.7 25.5 19.7 7.5 7.7 5.3 1.4 5.2 3.7 5.8 5.0
NIA Budget
Seasonally adjusted annual ratesReceipts 6/ 483.7 532.1 530.7 612.3 577.2 497.6 543.2 r4.7 338.4 331.4 543.3 559.5 566.6 585.6 60.7Expenditures 493.6 572.9 573.4 642.0 646.2 509.0 595.2 540.4 561.3 579.5 612.7 627.1 639.1 647.8 670.7
Purchases (total) 162.4 188.4 188.6 211.3 213.1 166.6 195.6 178.4 186.2 193.3 196.5 206.5 211.1 215.3 219.5Defense 105.9 121.6 121.7 143.1 143.1 108.3 127.4 114.6 119.6 124.1 128.4 137.3 141.2 145.1 148.7Nondefense 56.5 66.8 66.9 68.2 70.0 58.4 68.3 63.8 66.6 69.2 68.1 69.2 69.9 70.2 70.8
All other expenditures 331.2 384.5 384.8 430.7 433.1 342.4 399.6 362.0 375.1 386.2 416.2 420.6 428.0 432.5 451.2Surplus(+)/deficit(-) 6/ -9.9 -40.8 -42.7 -29.7 -69.0 -11.4 -52.0 -15.7 -22.9 -48.0 -69.4 -67.3 -72.5 -62.2 -70.0
High employment surplus(+)/deficit(-) (NIA basis) 3.0 n.a. 5.2 n.a. 24.8 6.9 8.2 7.0 3.4 5.8 4.8 19.0 20.1 32.3 27.7
*-actual e--estimated n.a.--not available
1. OMB Mid-Session Review of the 1981 Budget, July 1980 and BEA NIA translations, July 1980.2. In the First Concurrent Resolution on the Budget. Fiscal Year 1981, June 1980, the Congress called for receipts of $613.8 billion and outlays of $613.6 billion.3. Includes Federal Financing Bank, Postal Service Fund, Rural Electrification and Telephone Revolving Fund, Rural Telephone Bank, and Pension Benefit GuarantyCorporation..4. Checks issued less checks paid, accrued items and other transactions.5. FRB staff estimates include Federal Home Loan Banks, FNMA, Federal Land Banks, Federal Intermediate Credit Banks, and Banks for Cooperatives marketable debton an offerings basis.6. BEA NIA translations, July 1980. The fiscal year totals are based on unadjusted data and do not conform to the average of four seasonally adjusted quarters.The FRB staff estimates, therefore, have been adjusted in order to make the BEA and the staff estimates comparable.
I-15
DOMESTIC FINANCIAL DEVELOPMENTS
Summary. With the decline in economic activity slowing, demands for
money and credit have strengthened, exerting upward pressures on interest
rates. M-1A expansion, which had been quite rapid in June and July,
accelerated to a record 17-3/4 percent annual rate in August. The pick
up of the growth of this aggregate following declines early in the second
quarter may reflect not only faster increases in the nominal volume of
transactions, but also a lagged response to previous declines in interest
rates and a cessation of the unusual weakening of money demand evident
earlier. Growth of the non-transactions components of M-2, although
remaining robust in August, moderated substantially from earlier months.
Much of the weakening occurred at money market mutual funds, where upward
adjustments of returns to shareholders lagged increases in market interest
rates, prompting outflows in the latter part of August and early September.
Rising market yields also contributed to a slowing of growth of savings
deposits in August and a resumption of the expansion of small time deposits
as declines in MMCs apparently moderated.
The increasing demand for bank reserves associated with strength in
the monetary aggregates was reflected in a rise in the Federal funds rate
over the intermeeting period. In response to this increase, and to
incoming economic and financial data indicating further upward movements
might be forthcoming, short-term interest rates generally have risen about
1-1/4 to 1-1/2 percentage points since the August FOMC meeting. Bond
yields, by contrast, are on balance only about 1/4 of a percentage point
higher than in mid-August. This relatively small increase in bond yields
may indicate that a portion of the tightening in money market conditions
I-16
had been anticipated, and that long-term investors may be coming to the
view that rising interest rates could sap the vigor of the recovery.
Rising interest rates have reflected firming credit demands, as well
as developments in money markets. Household borrowing appears to have
rebounded in recent months from the depressed pace of the spring. New
extensions of consumer installment credit picked up substantially in July,
moderating the decline in credit outstanding. And, in August, the run
off of loans to individuals at large commercial banks slowed further.
Increases in consumer borrowing likely have been encouraged by the easier
terms and more ample availability of credit resulting from the dismantl-
ing of the special restraint program and earlier reductions in market
interest rates.
Mortgage borrowing by households also appears to have strengthened--
especially at depository institutions. Real estate loans at commercial
banks rose in August for the second consecutive month, and in July, new
mortgage commitments at S&Ls increased around 60 percent. On the other
hand, recent increases in average rates on new commitments for home mort-
gages to around 13 percent are reported to be discouraging some potential
borrowers, and activity in VA/FHA loans has been curtailed by large dis-
counts reflecting the wide spread between government rate ceilings on
such loans and market yields. State and local government support for
single family mortgages has tapered off a bit in recent months as funds
have become more readily available at traditional lenders and as
the rate on subsidized mortgages made with tax-exempt funds has risen
relative to yields on nonsubsidized mortgages.
I-17
Total borrowing by businesses also picked up in August. The increase
was centered entirely at banks, where business loans are estimated to have
increased at around a 20 percent annual rate. A portion of the strength
in bank business loans may have occurred in reaction to movements in mar-
ket interest rates. A rise in commercial paper rates relative to the
prime rate apparently contributed to a decline in commercial paper out-
standing of nonfinancial corporations. In addition, increases in bond
yields led to a fall off in offerings of longer-term securities and en-
couraged reliance on shorter-term borrowing.
Upward movements in bond yields also led to a substantial volume of
cancellations of tax-exempt bond sales--especially housing issues-and a
decline in total state and local borrowing. The federal government con-
tinued to tap the securities markets in volume to finance its deficit.
Outlook. With inflation continuing rapid, and the recession expected
to end soon, demands for money and credit are projected to continue to
increase in coming months. The strength of these demands, relative to the
System's targets for growth in the monetary aggregates, seems likely to
produce higher interest rates by year end.
Household borrowing is expected to rebound further in coming months.
Installment credit outstanding is likely to resume growing as purchases
of durable goods increase. Household mortgage borrowing should pick up
in association with the rebound in housing activity and lending commit-
ments. However, the increase in such credit may be limited by the reac-
tion of borrowers to recent upward movements in mortgage rates. Pressures
on these rates are likely to remain fairly intense, in light of the rela-
tively narrow spread of mortgage over bond yields and prospects that
I-18
higher short-term rates will be slowing the growth and raising the cost
of funds at S&Ls.
Business borrowing is likely to remain sizable in coming months,
despite the further liquidation of inventories, as external financing
needs remain historically large. With bond yields projected to edge
only slightly higher through year end, issuance of long-term securities
will probably remain substantial, as desires to restructure balance
sheets keep offerings well above the pace of 1979 and early 1980.
Borrowing by state and local governments is likely to rise sub-
stantially in the weeks immediately ahead, as indicated by a near-record
calendar of prospective offerings. Over the longer term, this sector's
need for funds will be bolstered by a deteriorated budget position.
With the Federal government deficit expected to remain close to third
quarter levels, the Treasury will also continue to require a sizable
volume of new credit in coming months.
I-19
INTERNATIONAL DEVELOPMENTS
Summary. The dollar has fluctuated over a narrow range over
the past five weeks, with the weighted average exchange rate of the dollar
easing by about 1/2 percent over this period. Sharp gains by the Japanese
yen and the pound against the dollar were partially offset by an apprecia-
tion of the dollar against continental currencies and the Canadian
dollar. The pound showed continued strength, reaching a $2.42 level
in early September, its highest rate against the dollar since early
1975. The pound's performance is attributable to a recent firming of
U.K. interest rates as well as apparent renewed demand by Middle Eastern
countries for sterling-denominated assets.
. Net U.S. intervention
amounted to about $730 million of dollar sales, primarily against
German marks, allowing the System to reduce its swap debt with the
Bundesbank by about $425 million equivalent and for the Treasury to
rebuild balances.
Latest output data for major foreign economies confirm a
widespread slowing in economic activity abroad, with Canada and the
United Kingdom recording negative GNP growth rates in the first two
quarters this year. Inflationary pressures in most foreign countries
continue to show some easing, but the average inflation rate for the
ten major foreign economies in recent months still hovers in the 10
percent range. With the exception of the 0.75 point reduction in the
Japanese discount rate in August, monetary authorities abroad have
I-20
not actively eased their monetary policies and continue to focus
attention on containing inflation.
The U.S. trade deficit of some $3 billion (a.r.) in July was
in sharp contrast to the $30 billion annual rate recorded in the second
quarter. While exports were essentially unchanged, imports declined
by some $26 billion (a.r.) from the second quarter. A 20 percent decline
in the volume of oil imports accounted for virtually the entire reduc-
tion in imports.
In international financial markets, the outflow of funds through
banks that has been underway since spring continued through July, although
at a reduced pace. Partial data for August show a continued outflow.
The cumulative outflow through banks for the first seven months of this
year amounted to $17 billion, compared with an inflow of nearly $15
billion through this channel for the full year 1979. Foreign official
reserve assets in the United States (excluding those of OPEC) increased
by nearly $6 billion over the June-July period. The total OPEC current-
account surplus in the first half this year reached some $60 billion,
a $20 billion increase from the preceeding half year. About an eighth
of this surplus was placed in OPEC official reserve holdings in the
United States. These holdings increased slightly further in July,
and OPEC holdings at the FRBNY rose by about an additional $1.5 billion
in August. The cumulative increase in OPEC reserve holdings in the
United States for the first eight months this year of about $9 billion
exceeds the $6.5 billion increase of such holdings recorded for the
full year 1979.
Outlook. The staff now foresees somewhat larger current-
account surpluses for the United States through 1981 than last month.
I-21
The current account is now expected to be in surplus by about $5 billion
this year and $11 billion next year. A major factor contributing to
this month's improved U.S. current-account outlook is a reassessment
of U.S. oil imports over the projection period. The slackening in oil
consumption here and abroad and a reduction in stockbuilding have
eased upward pressure on world oil prices. We now foresee somewhat
lower oil prices, higher than expected U.S. petroleum output, and a reduc-
tion in U.S..petroleum inventories for the projection period. The staff now
projects a 40 percent increase in oil prices this year (Q4/Q4) and a
13-1/2 percent increase next year (Q4/Q 4 ). This month's projection
assumes an average price per barrel of oil of $35.85 in 1981 compared
with a $37.79 price per barrel assumed in last month's projection.
The emerging current-account surplus this year is expected
to occur primarily as a reflection of the volume of imports declining
more rapidly than the volume of exports, in view of the relatively
weaker prospects for U.S. economic activity than that abroad. Next
year, the projected U.S. recovery will lead to a faster rise in U S.
imports than in U.S. exports, and, as a result, the current-account
position is expected to be reduced somewhat during the course of the
year, but to remain in surplus throughout the year.
The relatively strong U.S. current-account outlook compared
with that of other major countries, as well as the relative firmness of
U.S. interest rates expected over the projection period, are expected
to result in some appreciation of the average value of the dollar over
the year ahead.
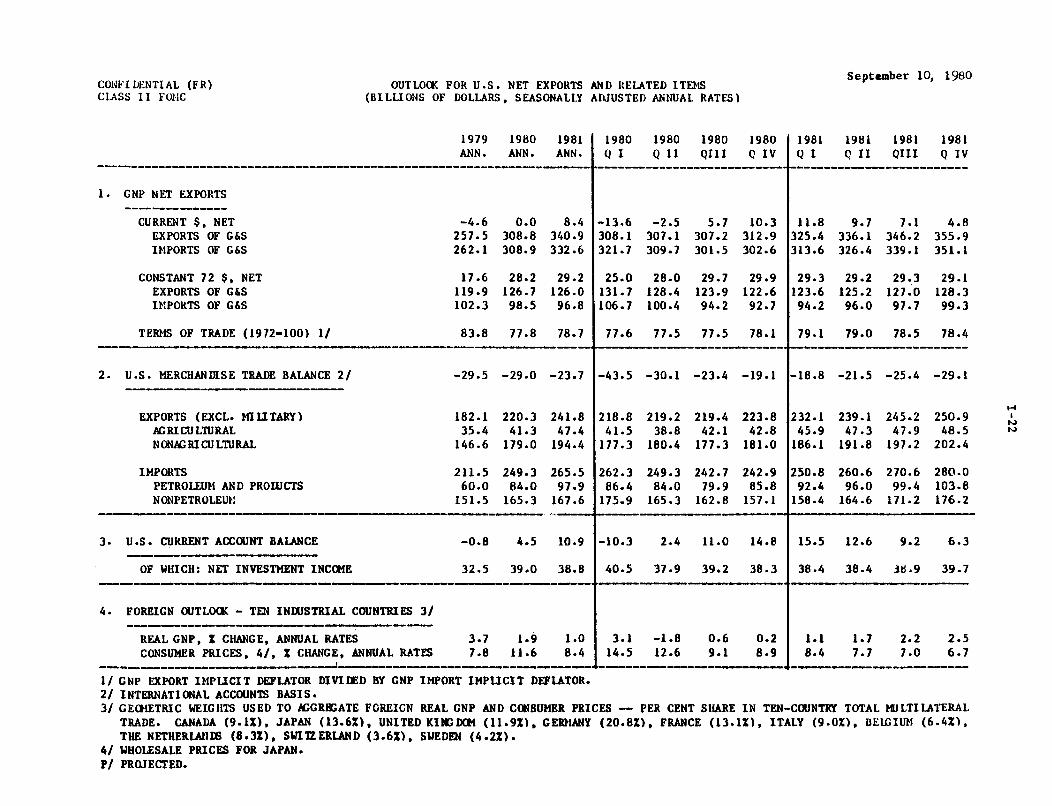
CONFIDENTIAL (FR)CLASS II FOMC
OUTLOOK FOR U.S. NET EXPORTS AND RELATED ITEMS(BILLIONS OF DOLLARS, SEASONALLY ADJUSTED ANNUAL RATES)
1979 1980 1981ANN. ANN. ANN.
1980 1980 1980 1980Q I Q II QIII Q IV
September 10, 1980
1981 1981 1981 1981Q I Q II QIII Q IV
1. GNP NET EXPORTS
CURRENT $, NET -4.6 0.0 8.4 -13.6 -2.5 5.7 10.3 11.8 9.7 7.1 4.8EXPORTS OF G&S 257.5 308.8 340.9 308.1 307.1 307.2 312.9 325.4 336.1 346.2 355.9IMPORTS OF G&S 262.1 308.9 332.6 321.7 309.7 301.5 302.6 313.6 326.4 339.1 351.1
CONSTANT 72 $, NET 17.6 28.2 29.2 25.0 28.0 29.7 29.9 29.3 29.2 29.3 29.1EXPORTS OF G&S 119.9 126.7 126.0 131.7 128.4 123.9 122.6 123.6 125.2 127.0 128.3IMPORTS OF G&S 102.3 98.5 96.8 106.7 100.4 94.2 92.7 94.2 96.0 97.7 99.3
TERMS OF TRADE (1972-100) 1/ 83.8 77.8 78.7 77.6 77.5 77.5 78.1 79.1 79.0 78.5 78.4
2. U.S. MERCHANDISE TRADE BALANCE 2/ -29.5 -29.0 -23.7 -43.5 -30.1 -23.4 -19.1 -18.8 -21.5 -25.4 -29.1
EXPORTS (EXCL. MILITARY) 182.1 220.3 241.8 218.8 219.2 219.4 223.8 232.1 239.1 245.2 250.9AGRICULTURAL 35.4 41.3 47.4 41.5 38.8 42.1 42.8 45.9 47.3 47.9 48.5NONAGRICULTURAL 146.6 179.0 194.4 177.3 180.4 177.3 181.0 186.1 191.8 197.2 202.4
IMPORTS 211.5 249.3 265.5 262.3 249.3 242.7 242.9 250.8 260.6 270.6 280.0PETROLEUM AND PRODUCTS 60.0 84.0 97.9 86.4 84.0 79.9 85.8 92.4 96.0 99.4 103.8NONPETROLEUM 151.5 165.3 167.6 175.9 165.3 162.8 157.1 158.4 164.6 171.2 176.2
3. U.S. CURRENT ACCOUNT BALANCE -0.8 4.5 10.9 -10.3 2.4 11.0 14.8 15.5 12.6 9.2 6.3
OF WHICH: NET INVESTMENT INCOME 32.5 39.0 38.8 40.5 37.9 39.2 38.3 38.4 38.4 38.9 39.7
4. FOREIGN OUTLOOK - TEN INDUSTRIAL COUNTRIES 3/
REAL GNP, % CHANGE, ANNUAL RATES 3.7 1.9 1.0 3.1 -1.8 0.6 0.2 1.1 1.7 2.2 2.5CONSUMER PRICES, 4/, % CHANGE, ANNUAL RATES 7.8 11.6 8.4 14.5 12.6 9.1 8.9 8.4 7.7 7.0 6.7
1/ GNP EXPORT IMPLICIT DEFLATOR DIVIDED BY GNP IMPORT IMPLICIT DEFLATOR.2/ INTERNATIONAL ACCOUNTS BASIS.3/ GEOMETRIC WEIGHTS USED TO AGGREGATE FOREIGN REAL GNP AND CONSUMER PRICES -- PER CENT SHARE IN TEN-COUNTRY TOTAL MULTILATERAL
TRADE. CANADA (9.1%), JAPAN (13.6%), UNITED KINGDOM (11.9%), GERMANY (20.8%), FRANCE (13.1%), ITALY (9.0%), BELGIUM (6.4%),THE NETHERLANDS (8.3%), SWITZERLAND (3.6%), SWEDEN (4.2%).
4/ WHOLESALE PRICES FOR JAPAN.P/ PROJECTED.


