Embed Size (px)
Citation preview
Prefatory Note The attached document represents the most complete and accurate version available based on original copies culled from the files of the FOMC Secretariat at the Board of Governors of the Federal Reserve System. This electronic document was created through a comprehensive digitization process which included identifying the best-preserved paper copies, scanning those copies,1
and then making the scanned versions text-searchable.2
Though a stringent quality assurance process was employed, some imperfections may remain. Please note that some material may have been redacted from this document if that material was received on a confidential basis. Redacted material is indicated by occasional gaps in the text or by gray boxes around non-text content. All redacted passages are exempt from disclosure under applicable provisions of the Freedom of Information Act. 1 In some cases, original copies needed to be photocopied before being scanned into electronic format. All scanned images were deskewed (to remove the effects of printer- and scanner-introduced tilting) and lightly cleaned (to remove dark spots caused by staple holes, hole punches, and other blemishes caused after initial printing). 2 A two-step process was used. An advanced optical character recognition computer program (OCR) first created electronic text from the document image. Where the OCR results were inconclusive, staff checked and corrected the text as necessary. Please note that the numbers and text in charts and tables were not reliably recognized by the OCR process and were not checked or corrected by staff.
Content last modified 6/05/2009.
CONFIDENTIAL (FR)
CURRENT ECONOMIC AND FINANCIAL CONDITIONS
December 13, 1972
By the StaffBoard of Governors
of the Federal Reserve System
TABLE OF CONTENTS
DOMESTIC NONFINANCIAL SCENE
Summary and GNP outlook . . . .Industrial production . . . . . . . . .Capacity utilization . . . . . .....Retail sales . . . . . . . . . . .Unit sales of consumer durables. . . . .Conference Board Consumer Survey . .Anticipated plant and equipment spending
Cyclical indicators. . . . . . . ....Construction and real estate .. . .. .Manufacturers' orders and shipments. . .Inventories . . . . . . . . . . . .Labor market . . . . . . . . . . . .Unemployment and labor force . . . .Wholesale prices . . .. . . . . .Consumer prices . . . . . . . .Agricultural developments. . . . . .
6
* .
* .
* .
* .
* *
DOMESTIC FINANCIAL SITUATION
Summary and outlook. . . . .Monetary aggregates . . . . .Bank credit . . . . . . . . .Nonbank thrift institutions. .Commercial paper outstanding .Consumer credit. . . . . . .Short-term interest rates. .Long-term security markets .Mortgage market. . . . . .
Federal finance. . . . .. . .
INTERNATIONAL DEVELOPMENTS
Summary and outlook. . . . .Foreign exchange markets .Euro-dollar market . ..Balance of payments. ....U.S. foreign trade . ....Interest rate developments in
. . . . . .
* . . . . .
. 6 6 * * *
* . . . * .
. . . * * .
. . . . . .
* * * * * ** . S 5 * .e oe
•o @•
,•
e,.s••
••o e•
o,..o.
o e. Be
• e e
e••
. . . . . . . . . .
selected countries
SectionI
Page No.
-1-6- 6-7-8-10-12-13-14-16-17-19-20-23-25-28
-1-2-3-7-8-10-13-15-18-21
- 1-2-4-7-9-14
II

DOMESTIC NONFINANCIALSCENE
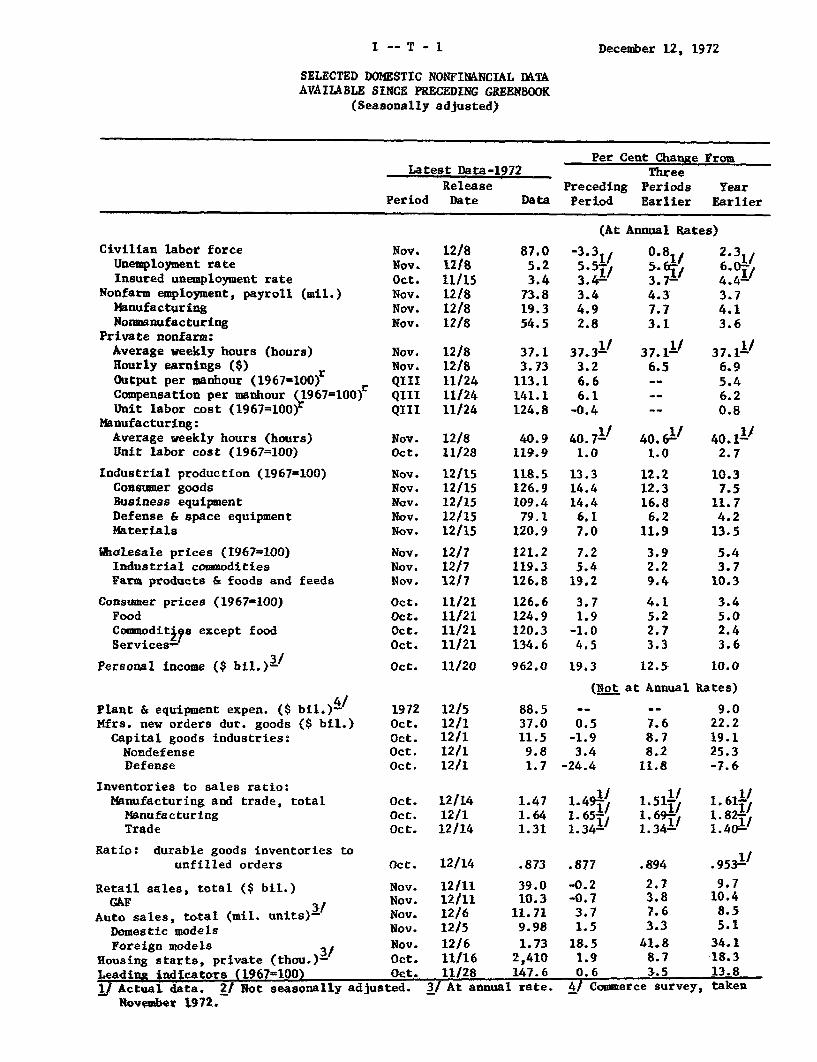
December 12, 1972
SELECTED DOMESTIC NONFINANCIAL DATAAVAILABLE SINCE PRECEDING GREENBOOK
(Seasonally adjusted)
Per Cent Change FromLatest Data-1972 Three
Release Preceding Periods YearPeriod Date Data Period Earlier Earlier
(At Annual Rates)
Civilian labor forceUnemployment rateInsured unemployment rate
Nonfarm employment, payroll (mil.)ManufacturingNomanufacturing
Private nonfarm:Average weekly hours (hours)Hourly earnings ($)Output per manhour (1967=100)r
Compensation per manhour (1967=100)Unit labor cost (1967=100)
Manufacturing:Average weekly hours (hours)Unit labor cost (1967=100)
Industrial production (1967=100)Consumer goodsBusiness equipmentDefense & space equipmentMaterials
Wholesale prices (1967=100)Industrial commoditiesFarm products & foods and feeds
Consumer prices (1967=100)FoodCommodit 7s except foodServices-
Personal income ($ bil.) 3-
Nov.Nov.Oct.Nov.Nov.Nov.
Nov.Nov.QIIIQIIIQIII
12/812/811/1512/812/812/8
12/812/811/2411/2411/24
Nov. 12/8Oct. 11/28
Nov.Nov.Nov.Nov.Nov.
Nov.Nov.Nov.
Oct.Oct.Oct.Oct.
12/1512/1512/1512/1512/15
12/712/712/7
11/2111/2111/2111/21
87.05.23.4
73.819.354.5
37.13.73
113.1141.1124.8
40.9 40.7-1119.9 1.0
118.5126.9109.4
79.1120.9
121.2119.3126.8
126.6124.9120.3134.6
Oct. 11/20 962.0 19.3
(Not at Annual Rates)
Plant & equipment expen. ($Mfrs. new orders dur. goods
Capital goods industries:NondefenseDefense
bil.) /
($ bil.)
Inventories to sales ratio:Manufacturing and trade, total
ManufacturingTrade
Ratio: durable goods inventories tounfilled orders
Retail sales, total ($ bil.)GAF
Auto sales, total (mil. units)-Domestic modelsForeign models 3/
fousing starts, private (thoU.)-Leading indicators (1967=100)yj Actual data.
November 1972.
1972Oct.Oct.Oct.Oct.
Oct.Oct.Oct.
12/512/112/112/112/1
12/1412/112/14
Oct. 12/14
Nov.Nov.Nov.Nov.
Nov.Oct.Oct.
12/1112/1112/612/512/611/1611128
88.537.011.5
9.81.7
1.471.641.31
0.5-1.93.4
-24.4
1.49.
1.36541.34- /
.873 .877
39.010.3
11.719.981.73
2,410147.6
2/ Not seasonally adjusted. 3/ At annual rate.
-0.2-0.7
3.71.5
18.51.90.6
7.68.78.2
11.8
1 511.35141.69-/1.34 -
.894
2.73.87.63.3
41.88.73.5
9.022.219.125.3-7.6
1/1.61 1/1.82-11.40-
.953--9.7
10.48.55.1
34.118.313.8
4/ Commerce survey, taken
-3.3./
5.54X3.4-3.44.92.8
37.33.26.66.1
-0.4
0.85. 613.7-'4.37.73.1
37. 116.5--
40.611.0
12.212.316.8
6.211.9
3.92.29.4
4.15.22.73.3
12.5
2.3 ,6.0-4.4-'3.74.13.6
37.116.95.46.20.8
40.11/2.7
10.37.5
11.74.2
13.5
5.43.7
10.3
3.45.02.43.6
10.0
13.314.414.4
6.17.0
7.25.4
19.2
3.71.9-1.04.5
--- ~ -- ~ - -- ~--
I -- T - 1
I- 1
DOMESTIC NONFINANCIAL DEVELOPMENTS
Strong recent gains in employment, production and retail
sales support earlier expectations of a large increase in overall
activity this quarter. Real GNP is projected to rise at an annual rate
of about 7-1/2 per cent, compared to the upward revised 6.3 per cent in
the third quarter. Private spending in the current quarter now appears
even stronger than it did four weeks ago, with consumer purchases
especially ebullient. However, defense purchases are now expected to
decline slightly further in the fourth quarter, based on the limited
data available.
With the rapid rise in industrial production and nonfarm
employment, margins of unused manpower and industrial resources are
being reduced significantly. Industrial production increased more than
1 per cent in November. The September and October indexes have been
revised up appreciably, moreover, so that the overall increase from
August to November was at an annual rate of 12 per cent. Nonfarm employ-
ment has increased at an annual rate of over 3 million since August.
In manufacturing, employment rose appreciably further in November and
the workweek was nearly one hour longer than a year earlier. The
unemployment rate, which had been on a plateau of about 5.5 per cent
since June, dropped to 5.2 per cent in November.
I-2
Retail sales in November, according to the advance report,
remained at the sharply advanced October level, and were about 3-1/2
per cent above the third quarter average. Sales of new domestic-type
autos in November continued at the 10 million annual rate of recent
months, while sales of imports increased. Consumer attitudes and
intentions to buy continue in a strengthening trend, according to the
latest Conference Board survey.
Business demands for inventories and fixed capital also
continue strong. In October, manufacturers' new orders for durable
goods rose further, with non-defense capital goods especially expansive.
Inventory accumulation was substantial, but sales rose even faster
and the stock-sales ratio dropped further to the lowest figure since June
1966. The Commerce plant and equipment survey, taken in November,
reported a substantial shortfall from earlier expectations in third
quarter outlays, but indicated a sharp further rise in business spending
in the current quarter and over the first half of 1973.
The increase in wage rates was rather small,in November,
according to preliminary data, following large increases in recent
months. Wholesale prices rose sharply in November following a very
small rise in October. Prices of both farm products and foods and of
industrial commodities were up appreciably. The consumer price index
in October rose at an annual rate of 3.8 per cent, close to the average
of the past six months.
I - 3
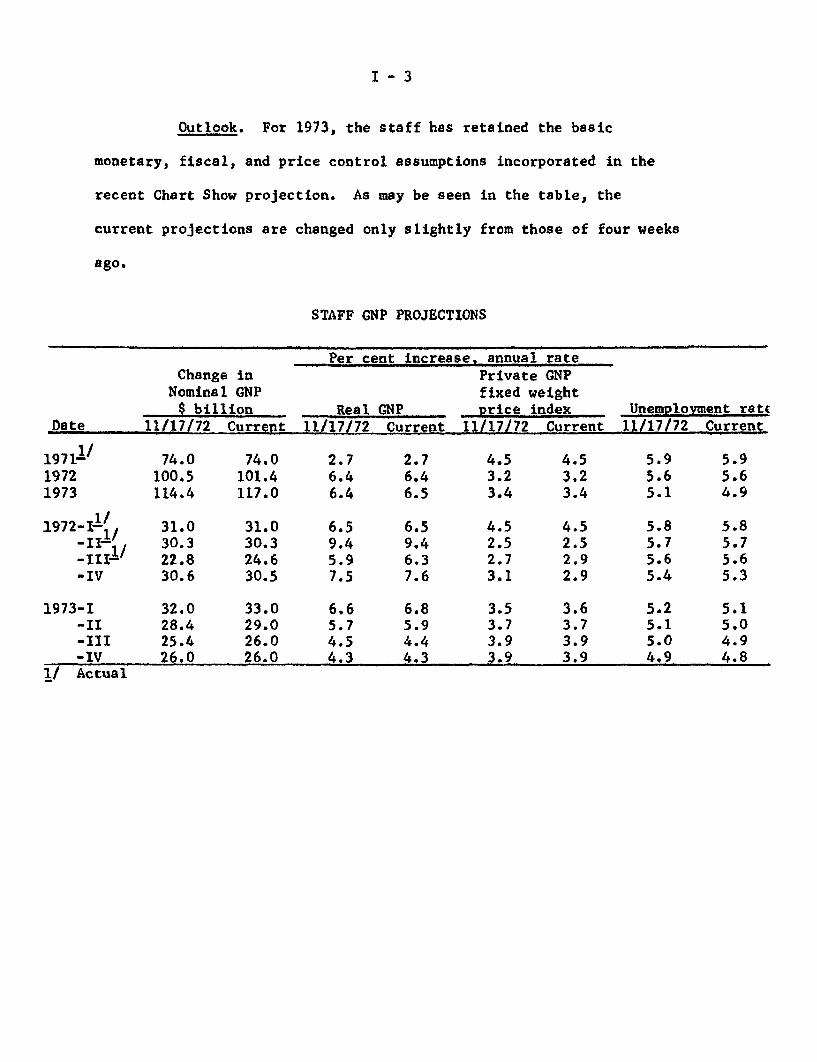
Outlook. For 1973, the staff has retained the basic
monetary, fiscal, and price control assumptions incorporated in the
recent Chart Show projection. As may be seen in the table, the
current projections are changed only slightly from those of four weeks
ago.
STAFF GNP PROJECTIONS
Per cent increase, annual rateChange in Private GNP
Nominal GNP fixed weight$ billion Real GNP price index Unemployment rate
Date 11/17/72 Current 11/17/72 Current 11/17/72 Current 11/17/72 Current
1971- 74.0 74.0 2.7 2.7 4.5 4.5 5.9 5.91972 100.5 101.4 6.4 6.4 3.2 3.2 5.6 5.61973 114.4 117.0 6.4 6.5 3.4 3.4 5.1 4.9
1/1972-1-, / 31.0 31.0 6.5 6.5 4.5 4.5 5.8 5.8
-II- 30.3 30.3 9.4 9.4 2.5 2.5 5.7 5.7-1II1 22.8 24.6 5.9 6.3 2.7 2.9 5.6 5.6-IV 30.6 30.5 7.5 7.6 3.1 2.9 5.4 5.3
1973-I 32.0 33.0 6.6 6.8 3.5 3.6 5.2 5.1-II 28.4 29.0 5.7 5.9 3.7 3.7 5.1 5.0-III 25.4 26.0 4.5 4.4 3.9 3.9 5.0 4.9-IV 26.0 26.0 4.3 4.3 3.9 3.9 4.9 4.8
1/ Actual
I - 4
CONFIDENTIAL - FR December 13, 1972
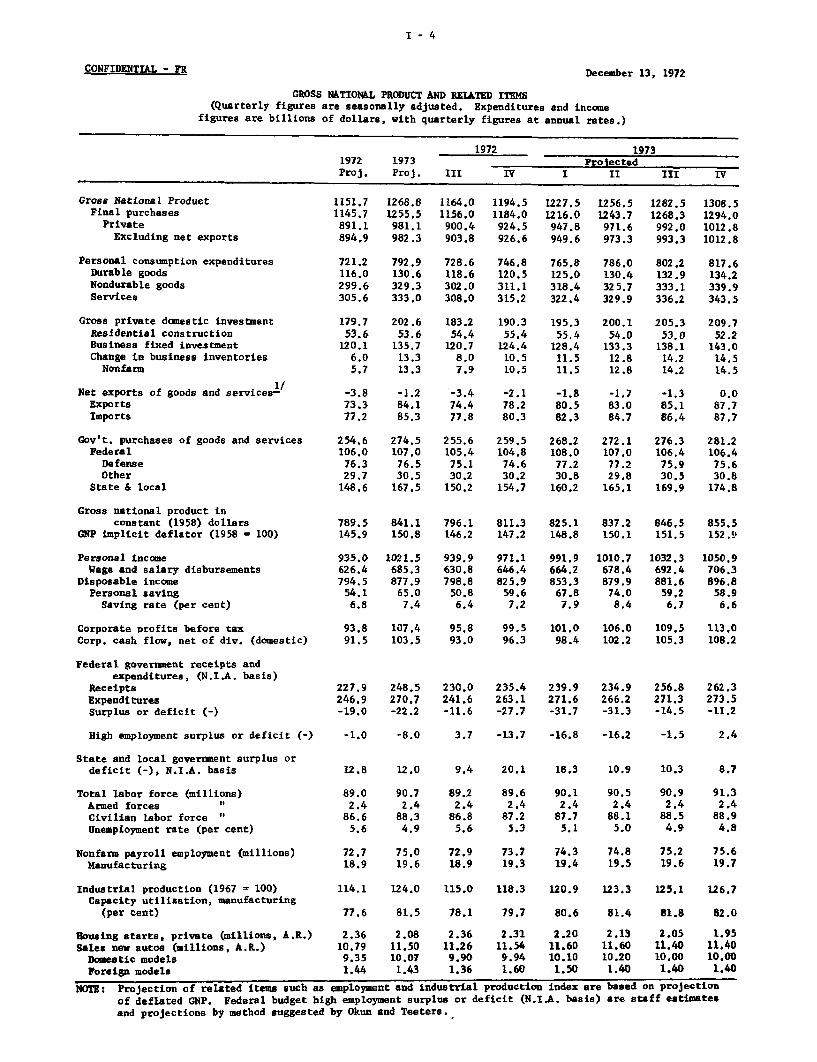
GROSS NATIONAL PRODUCT AND RELATED ITEMS(Quarterly figures are seasonally adjusted. Expenditures and income
figures are billions of dollars, with quarterly figures at annual rates.)
1972 19731972 1973 ProjectedProj. Proj. III IV I II III IV
Gross National ProductFinal purchases
PrivateExcluding net exports
Personal consumption expendituresDurable goodsNondurable goodsServices
Gross private domestic investmentResidential constructionBusiness fixed investmentChange in business inventories
Nonfarm
1/Net exports of goods and services-ExportsImports
Gov't. purchases of goods and servicesFederal
DefenseOther
State & local
Gross national product inconstant (1958) dollars
GNP implicit deflator (1958 = 100)
Personal incomeWage and salary disbursements
Disposable incomePersonal saving
Saving rate (per cent)
Corporate profits before taxCorp. cash flow, net of div. (domestic)
Federal government receipts andexpenditures, (N.I.A. basis)
ReceiptsExpendituresSurplus or deficit (-)
High employment surplus or deficit (-)
State and local government surplus ordeficit (-), N.I.A. basis
Total labor force (millions)Armed forcesCivilian labor force "Unemployment rate (per cent)
Nonfarm payroll employment (millions)Manufacturing
Industrial production (1967 = 100)Capacity utilization, manufacturing
(per cent)
Rousing starts, private (millions, A.R.)Sales new autos (millions, A.R.)Domestic modelsForeign models
1151.71145.7891.1894.9
721.2116.0299.6305.6
179.753.6
120.16.05.7
1268.81255.5981.1982.3
792.9130.6329.3333.0
202.653.6
135.713.313.3
1164.01156.0900.4903.8
728.6118.6302.0308.0
183.254.4
120.78.07.9
1194.51184.0924.5926.6
746.8120.5311.1315.2
190.355.4
124.410.510.5
1227.51216.0947.8949.6
765.8125.0318.4322.4
195.355.4
128.411.511.5
1256.51243.7971.6973.3
786.0130.4325.7329.9
200.154.0
133.312.812.8
1282.51268.3992.0993.3
802.2132.9333.1336.2
205.353.0
138.114.214.2
1308.51294.01012.81012.8
817.6134.2339.9343.5
209.752.2
143.014.514.5
-3.8 -1.2 -3.4 -2.1 -1.8 -1.7 -1.3 0.073.3 84.1 74.4 78.2 80.5 83.0 85.1 87.777.2 85.3 77.8 80.3 82.3 84.7 86.4 87.7
254.6106,076.329.7
148.6
274.5107.076.530.5167.5
255.6105.475.130.2
150.2
259.5104.874.630.2
154.7
268.2108,077.230.8160.2
272.1107.0
77.229.8
165.1
276.3106.475.930.5
169.9
281.2106.475.630.8
174.8
789.5 841.1 796.1 811.3 825.1 837.2 846.5 855.5145.9 150.8 146.2 147.2 148.8 150.1 151.5 152.9
935.0626.4794.554.16.8
1021.5685.3877.965.07.4
939.9630.8798.8
50.86.4
971.1646.4825.9
59.67.2
991.9664.2853.3
67.87.9
1010.7678.4879.9
74.08.4
1032.3692.4881.6
59.26.7
1050.9706.3896.8
58.96.6
93.8 107.4 95.8 99.5 101.0 106.0 109.5 113.091.5 103.5 93.0 96.3 98.4 102.2 105.3 108.2
227.9246.9-19.0
248.5270.7-22.2
230.0241.6-11.6
235.4263.1-27.7
239.9271.6-31.7
234.9266.2-31.3
256.8271.3-14.5
262.3273.5-11.2
-1.0 -8.0 3.7 -13.7 -16.8 -16.2 -1.5 2.4
12.8 12.0 9.4 20.1 18.3 10.9 10.3 8.7
89.0 90.7 89.2 89.6 90.1 90.5 90.9 91.32.4 2.4 2.4 2.4 2.4 2.4 2.4 2.4
86.6 88.3 86.8 87.2 87.7 88.1 88.5 88.95.6 4.9 5.6 5.3 5.1 5.0 4.9 4.8
72.7 75.0 72.9 73.7 74.3 74.8 75.2 75.618.9 19.6 18.9 19.3 19.4 19.5 19.6 19.7
114.1
77.6
2.3610.799.351.44
124.0
81.5
2.0811.5010.071.43
115.0
78.1
2.3611.269.901.36
118.3
79.7
2.3111.54
9.941.60
120.9
80.6
2.2011.6010.101.50
123.3
81.4
2.1311.6010.201.40
125.1
81.8
2.0511.4010.001.40
126.7
82.0
1.9511.4010.001.40
NOTE: Projection of related items such as employment and industrial production index are based on projection
of deflated GNP. Federal budget high employment surplus or deficit (N.I.A. basis) are staff estimatesand projections by method suggested by Okun and Teeters.
I - 5
CONFIDENTIAL - FR December 13, 1972
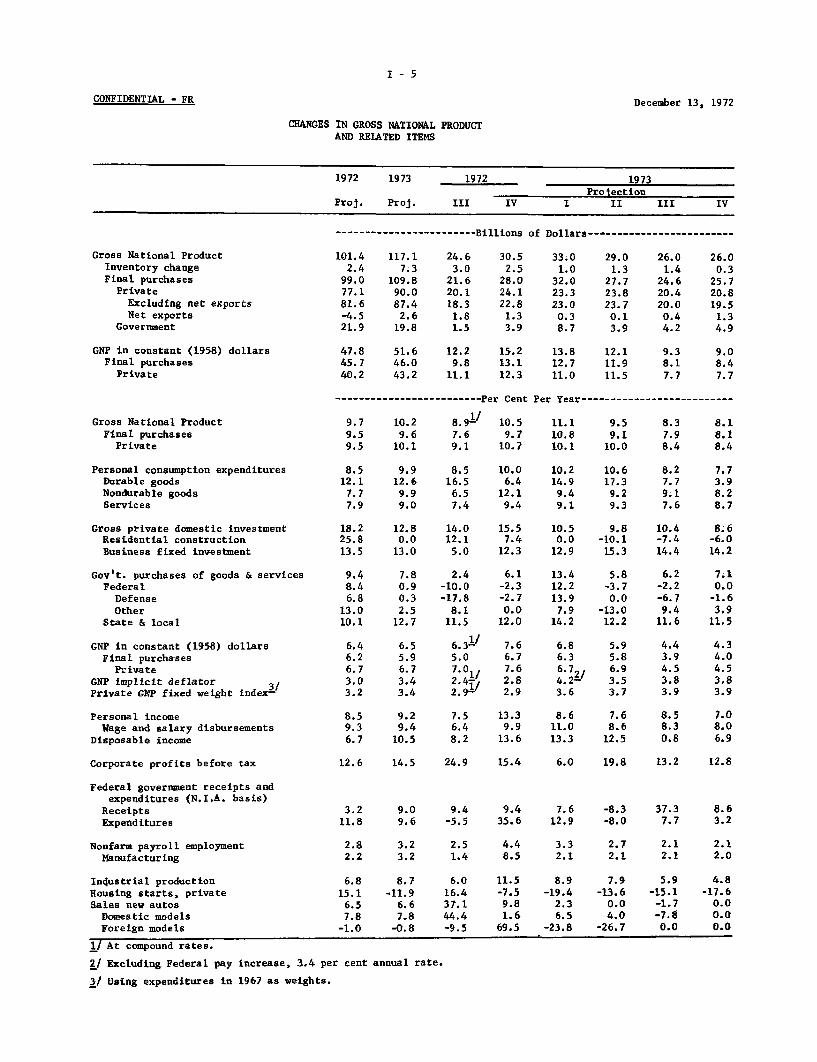
CHANGES IN GROSS NATIONAL PRODUCTAND RELATED ITEMS
1972 1973 1972 1973Projection
Proj. Proj. III IV I II III IV
------------------------Billions of Dollars------------------------
Gross National ProductInventory changeFinal purchases
PrivateExcluding net exportsNet exports
Government
GNP in constant (1958) dollarsFinal purchases
Private
101.4 117.1 24.6 30.5 33.0 29.0 26.0 26.02.4 7.3 3.0 2.5 1.0 1.3 1.4 0.3
99.0 109.8 21.6 28.0 32.0 27.7 24.6 25.777.1 90.0 20.1 24.1 23.3 23.8 20.4 20.881.6 87.4 18.3 22.8 23.0 23.7 20.0 19.5-4.5 2.6 1.8 1.3 0.3 0.1 0.4 1.321.9 19.8 1.5 3.9 8.7 3.9 4.2 4.9
47.8 51.6 12.2 15.2 13.8 12.145.7 46.0 9.8 13.1 12.7 11.940.2 43.2 11.1 12.3 11.0 11.5
9.3 9.08.1 8.47.7 7.7
------------------------- Per Cent Per Year-------------------------
Gross National ProductFinal purchases
Private
9.7 10.29.5 9.69.5 10.1
1/8.9- 10.5 11.1 9.57.6 9.7 10.8 9.19.1 10.7 10.1 10.0
Personal consumption expendituresDurable goodsNondurable goodsServices
Gross private domestic investmentResidential constructionBusiness fixed investment
Gov't. purchases of goods & servicesFederal
DefenseOther
State & local
GNP in constant (1958) dollarsFinal purchases
PrivateGNP implicit deflator 3/Private GNP fixed weight index-
Personal incomeWage and salary disbursements
Disposable income
Corporate profits before tax
Federal government receipts andexpenditures (N.I.A. basis)
ReceiptsExpenditures
Nonfarm payroll employmentManufacturing
Industrial productionHousing starts, privateSales new autos
Domestic modelsForeign models
8.5 9.9 8.5 10.0 10.2 10.612.1 12.6 16.5 6.4 14.9 17.37.7 9.9 6.5 12.1 9.4 9.27.9 9.0 7.4 9.4 9.1 9.3
8.2 7.77.7 3.99.1 8.27.6 8.7
18.2 12.8 14.0 15.5 10.5 9.8 10.4 8.625.8 0.0 12.1 7.4 0.0 -10.1 -7.4 -6.013.5 13.0 5.0 12.3 12.9 15.3 14.4 14.2
9.4 7.8 2.4 6.1 13.4 5.8 6.2 7.18.4 0.9 -10.0 -2.3 12.2 -3.7 -2.2 0.06.8 0.3 -17.8 -2.7 13.9 0.0 -6.7 -1.6
13.0 2.5 8.1 0.0 7.9 -13.0 9.4 3.910.1 12.7 11.5 12.0 14.2 12.2 11.6 11.5
1/6.31- 7.65.0 6.77.0 7.6"1/
2.4TI 2.82.9 = 2.9
8.5 9.29.3 9.46.7 10.5
6.8 5.96.3 5.86.7, 6.94.2" 3.53.6 3.7
7.5 13.3 8.6 7.66.4 9.9 11.0 8.68.2 13.6 13.3 12.5
12.6 14.5 24.9 15.4 6.0 19.8 13.2 12.8
3.2 9.0 9.4 9.4 7.6 -8.3 37.3 8.611.8 9.6 -5.5 35.6 12.9 -8.0 7.7 3.2
2.8 3.2 2.5 4.4 3.3 2.7 2.1 2.12.2 3.2 1.4 8.5 2.1 2.1 2.1 2.0
6.8 8.7 6.0 11.5 8.9 7.9 5.9 4.815.1 -11.9 16.4 -7.5 -19.4 -13.6 -15.1 -17.66.5 6.6 37.1 9.8 2.3 0.0 -1.7 0.07.8 7.8 44.4 1.6 6.5 4.0 -7.8 0.0
-1.0 -0.8 -9.5 69.5 -23.8 -26.7 0.0 0.0
1/ At compound rates.
2/ Excluding Federal pay increase, 3.4 per cent annual rate.
3/ Using expenditures in 1967 as weights.
I- 6
Industrial production. Industrial production rose 1.1
per cent further in November and at 118.5 per cent (1967=100) was
10.3 per cent above a year earlier. Gains in output over the month
were widespread among final products and materials. Furthermore, the
indexes for September and October each have been revised upwards by
0.4 per cent and the new levels bring the rise since August to a 12
per cent annual rate.
Among consumer goods, auto assemblies increased 6 per cent
in November to an annual rate of 9.6 million units. Auto production
schedules for December and the first quarter of 1973 indicate little
change from the advanced November rate. Output of some home goods and
nondurable consumer goods also increased in November.
Production of business equipment increased substantially to
a level only 0.8 per cent below the 1969 prerecession peak. Output of
defense and space equipment remained at the level prevailing since
July. Among materials, output of construction products, some durable
goods materials, and the textile, paper, and chemical group advanced
further. Output of steel, however, expanded less than seasonally.
(Confidential until release on Friday, December 15.)
Capacity Utilization. The preliminary estimate of manu-
facturing capacity utilization for November is 79.6 per cent. The
rate of increase in utilization has been appreciable in recent months,
--with a rise of 2 percentage points in the four months since July, 1972.
I-7
Retail sales. Sales in November were virtually unchanged
from the sharply advanced (revised) level attained in October, according
to the advance report. The GAAF group, which had done particularly
well in September,was off by 0.7 per cent. Apparel sales declined 1.5
per cent but changes in other components of the GAAF group were small.
Sales of the food group rose 0.4 per cent and sales of the automotive
group remained at the high October level.
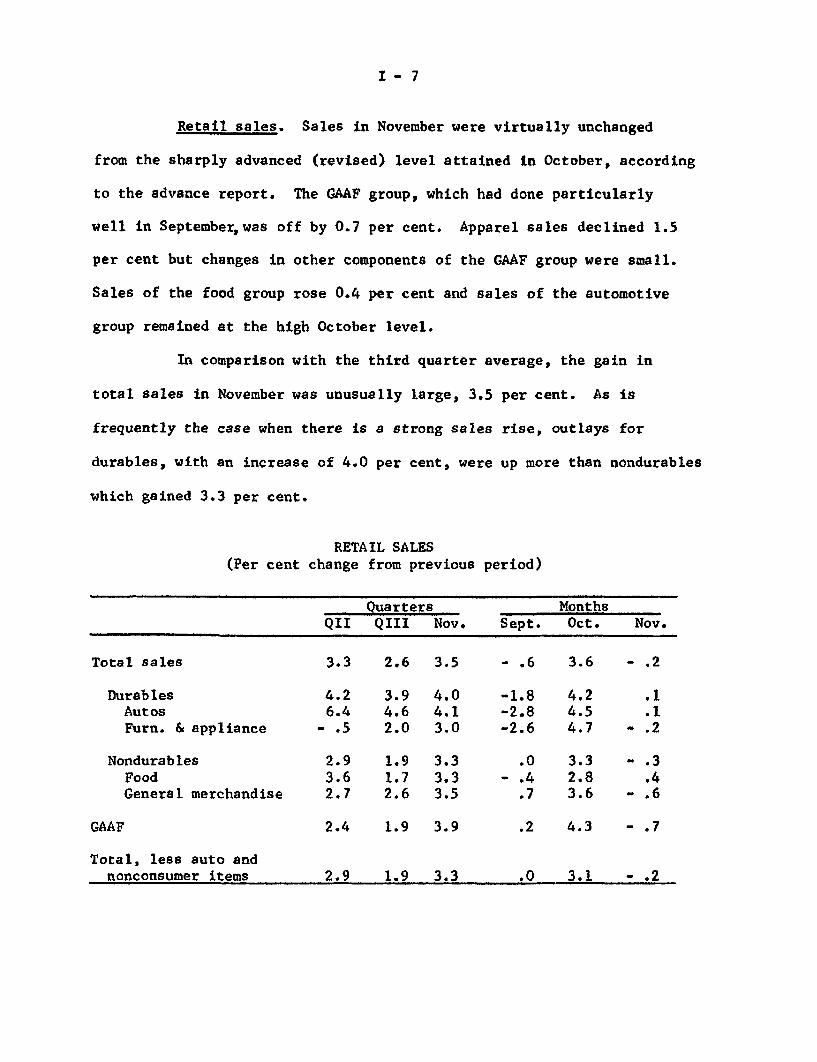
In comparison with the third quarter average, the gain in
total sales in November was unusually large, 3.5 per cent. As is
frequently the case when there is a strong sales rise, outlays for
durables, with an increase of 4.0 per cent, were up more than nondurables
which gained 3.3 per cent.
RETAIL SALES(Per cent change from previous period)
Quarters MonthsQII QIII Nov. Sept. Oct. Nov.
Total sales 3.3 2.6 3.5 - .6 3.6 - .2
Durables 4.2 3.9 4.0 -1.8 4.2 .1Autos 6.4 4.6 4.1 -2.8 4.5 .1Furn. & appliance - .5 2.0 3.0 -2.6 4.7 - .2
Nondurables 2.9 1.9 3.3 .0 3.3 - .3Food 3.6 1.7 3.3 - .4 2.8 .4General merchandise 2.7 2.6 3.5 .7 3.6 - .6
GAAF 2.4 1.9 3.9 .2 4.3 - .7
Total, less auto andnonconsumer items 2.9 1.9 3.3 .0 3.1 - .2
I - 8
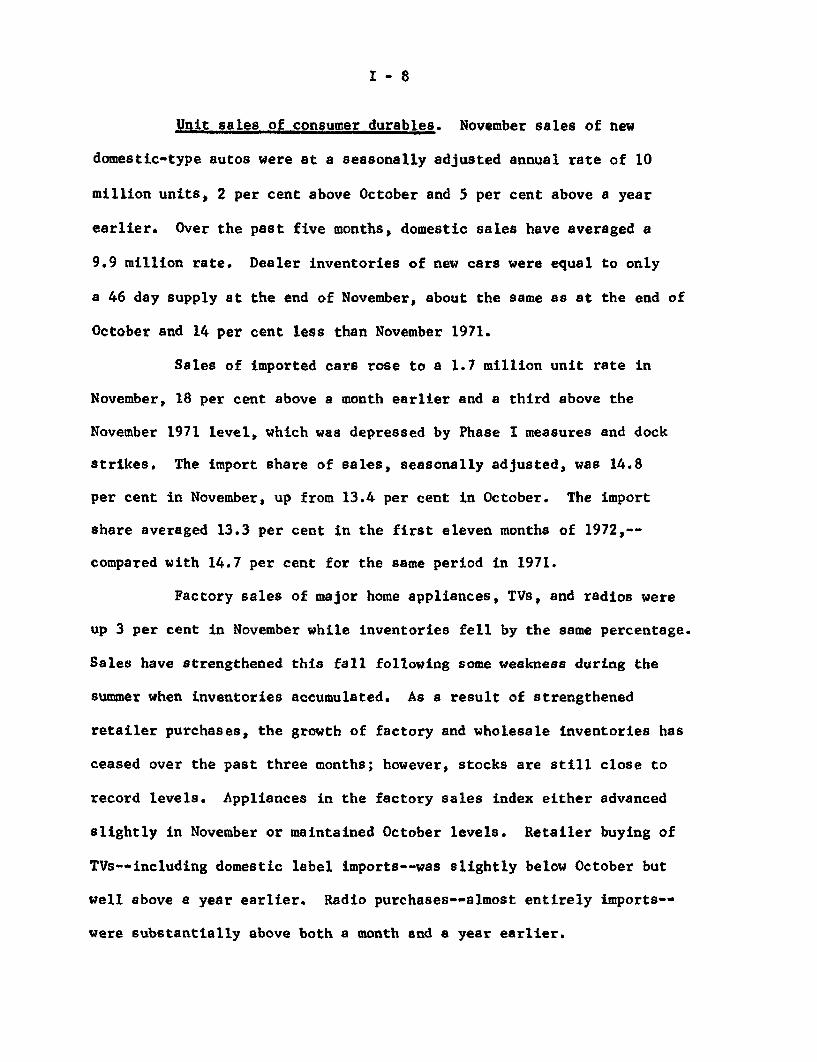
Unit sales of consumer durables. November sales of new
domestic-type autos were at a seasonally adjusted annual rate of 10
million units, 2 per cent above October and 5 per cent above a year
earlier. Over the past five months, domestic sales have averaged a
9.9 million rate. Dealer inventories of new cars were equal to only
a 46 day supply at the end of November, about the same as at the end of
October and 14 per cent less than November 1971.
Sales of imported cars rose to a 1.7 million unit rate in
November, 18 per cent above a month earlier and a third above the
November 1971 level, which was depressed by Phase I measures and dock
strikes. The import share of sales, seasonally adjusted, was 14.8
per cent in November, up from 13.4 per cent in October. The import
share averaged 13.3 per cent in the first eleven months of 1972,--
compared with 14.7 per cent for the same period in 1971.
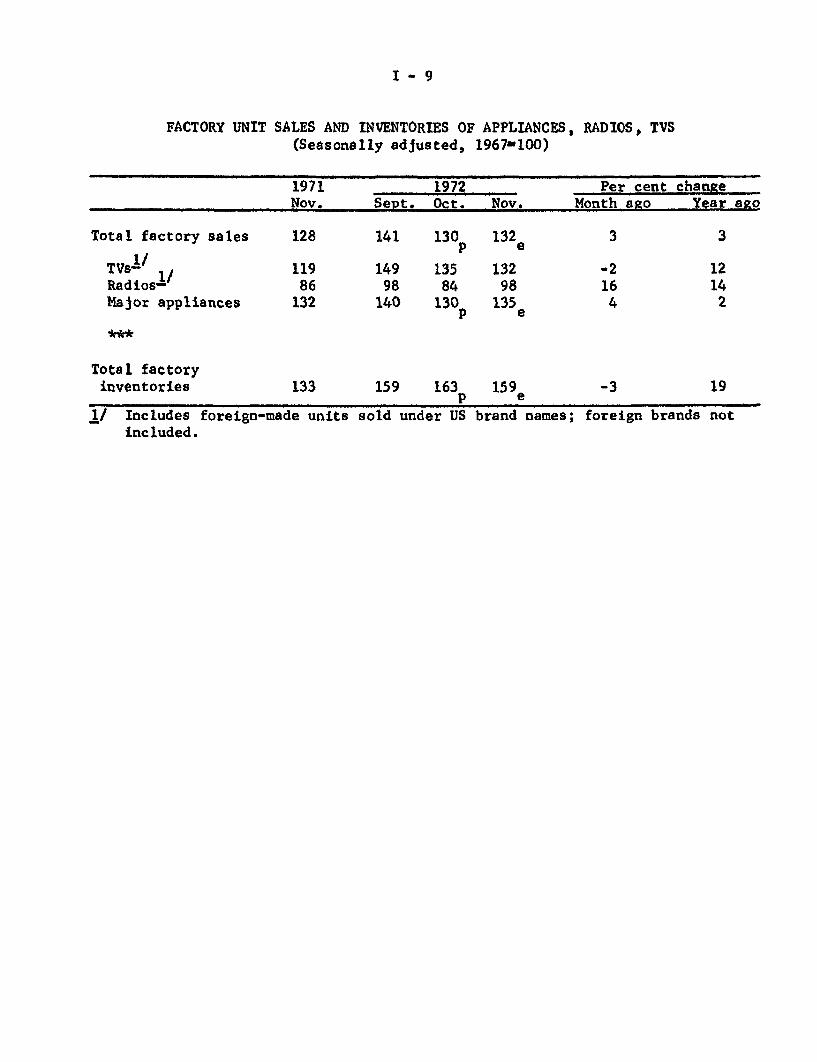
Factory sales of major home appliances, TVs, and radios were
up 3 per cent in November while inventories fell by the same percentage.
Sales have strengthened this fall following some weakness during the
summer when inventories accumulated. As a result of strengthened
retailer purchases, the growth of factory and wholesale inventories has
ceased over the past three months; however, stocks are still close to
record levels. Appliances in the factory sales index either advanced
slightly in November or maintained October levels. Retailer buying of
TVs--including domestic label imports--was slightly below October but
well above a year earlier. Radio purchases--almost entirely imports--
were substantially above both a month and a year earlier.
I-9
FACTORY UNIT SALES AND INVENTORIES OF APPLIANCES, RADIOS, TVS(Seasonally adjusted, 1967=100)
1971 1972 Per cent changeNov. Sept. Oct. Nov. Month ago Year ago
Total factory sales 128 141 130 132 3 3p e
TVs-/ 119 149 135 132 -2 12Radios-' 86 98 84 98 16 14Major appliances 132 140 130p 135 4 2
Total factoryinventories 133 159 163 15 9 -3 19
p e1/ Includes foreign-made units sold under US brand names; foreign brands not
included.
I-10
Conference Board Consumer Survey. The September-October
Conference Board survey is in line with the optimistic findings of
other recent surveys by the Census Bureau and the Michigan Survey
Research Center. In the Conference Board survey, there was strong
improvement in attitudes about the present business and employment
situation and a sharp increase in intentions to purchase cars. There
was also moderately greater optimism about business and income
expectations 6 months from now. In the August-September Michigan
survey, the increased optimism also was more centered on the
present--rather than expected--business and personal financial
conditions.
On the other hand, the Conference Board reported purchase
plans for homes unchanged from the previous survey, and below a year
ago. There was only a modest gain in purchase plans for all types
of appliances and answers to this question were also weaker than
a year earlier. However, the timing of this survey was changed
earlier this year and the seasonal factors for purchase plans must
still be considered tentative.

I-ll
CONFERENCE BOARDCONSUMER EXPECTATIONS & INTENTIONS
(Seasonally adjusted)
1971 1972September- July- September -October August October------Percentage of Households-----
Business conditionsgood
Employment andjobs plentiful
Business conditionsbetterworse
Employmentmore jobsfewer jobs
Incomeincreasedecrease
Automobilenew or usednew
Homenew or previously occupied
Major appliances
Appraisal of Present Situation
15.1 25.5 28.7
6.5 13.4 16.6
Expectations for Six Months Hence
25.9 25.1 25.710.5 7.4 6.6
20.3 21.0 19.719.2 15.3 14.4
24.2 28.1 28.47.8 6.4 5.5
Plans to Buy Within Six Months
7.94.6
3.237.9
7.74.8
2.733.7
9.65,6
2.734.7
I - 12
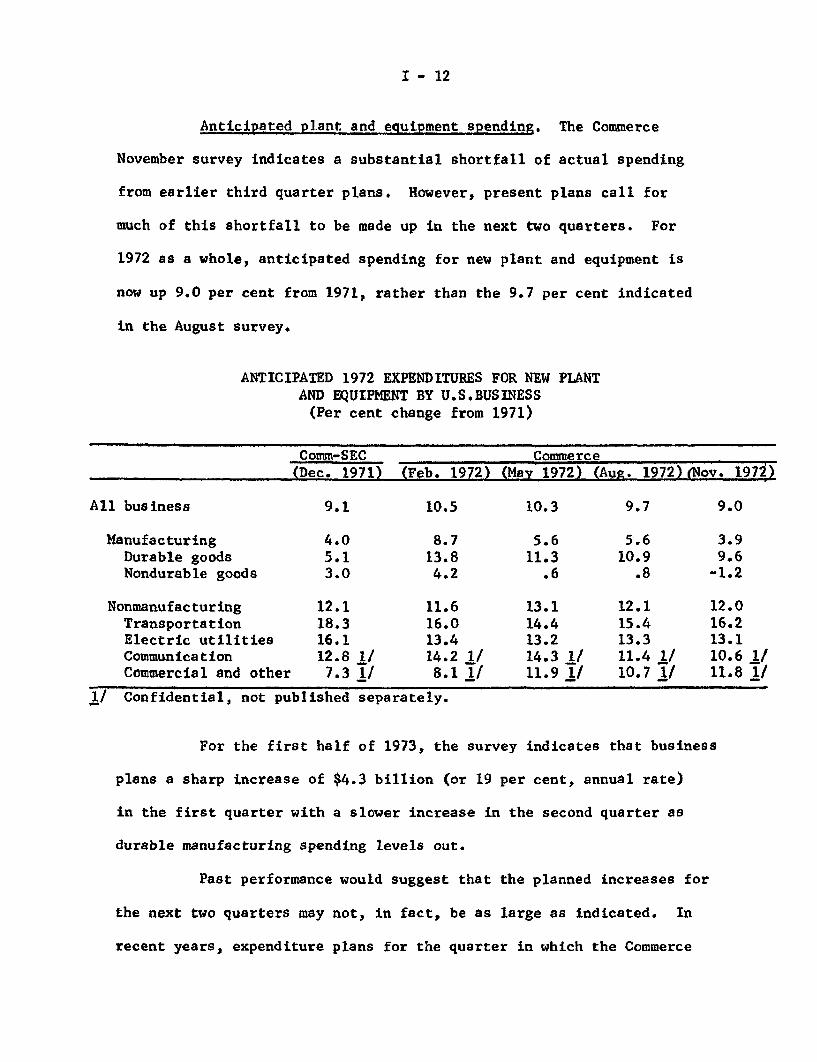
Anticipated plant and equipment spending. The Commerce
November survey indicates a substantial shortfall of actual spending
from earlier third quarter plans. However, present plans call for
much of this shortfall to be made up in the next two quarters. For
1972 as a whole, anticipated spending for new plant and equipment is
now up 9.0 per cent from 1971, rather than the 9.7 per cent indicated
in the August survey.
ANTICIPATED 1972 EXPENDITURES FOR NEW PLANTAND EQUIPMENT BY U.S.BUSINESS
(Per cent change from 1971)
Comm-SEC Commerce(Dec. 1971) (Feb. 1972) (May 1972) (Aug. 1972)(Nov. 1971)
All business 9.1 10.5 10.3 9.7 9.0
Manufacturing 4.0 8.7 5.6 5.6 3.9Durable goods 5.1 13.8 11.3 10.9 9.6Nondurable goods 3.0 4.2 .6 .8 -1.2
Nonmanufacturing 12.1 11.6 13.1 12.1 12.0Transportation 18.3 16.0 14.4 15.4 16.2Electric utilities 16.1 13.4 13.2 13.3 13.1Communication 12.8 1/ 14.2 1/ 14.3 1/ 11.4 1/ 10.6 1/Commercial and other 7.3 1/ 8.1 1/ 11.9 1/ 10.7 1/ 11.8 1/
1/ Confidential, not published separately.
For the first half of 1973, the survey indicates that business
plans a sharp increase of $4.3 billion (or 19 per cent, annual rate)
in the first quarter with a slower increase in the second quarter as
durable manufacturing spending levels out.
Past performance would suggest that the planned increases for
the next two quarters may not, in fact, be as large as indicated. In
recent years, expenditure plans for the quarter in which the Commerce
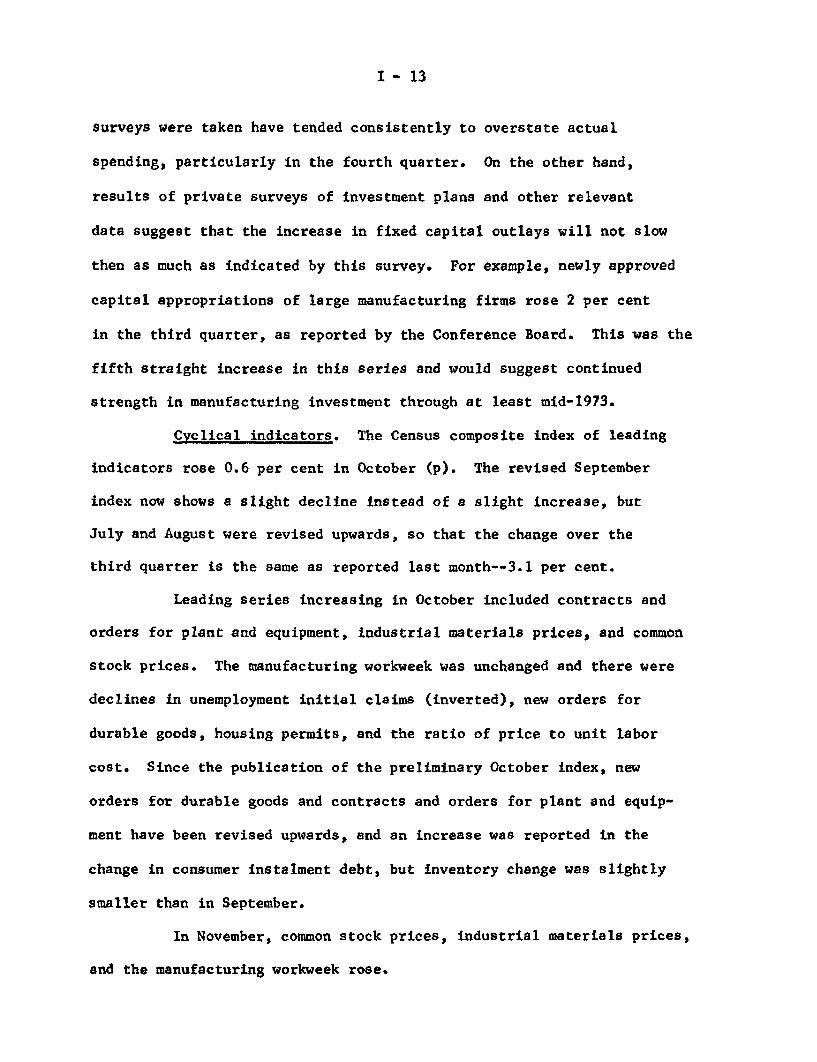
I - 13
surveys were taken have tended consistently to overstate actual
spending, particularly in the fourth quarter. On the other hand,
results of private surveys of investment plans and other relevant
data suggest that the increase in fixed capital outlays will not slow
then as much as indicated by this survey. For example, newly approved
capital appropriations of large manufacturing firms rose 2 per cent
in the third quarter, as reported by the Conference Board. This was the
fifth straight increase in this series and would suggest continued
strength in manufacturing investment through at least mid-1973.
Cyclical indicators. The Census composite index of leading
indicators rose 0.6 per cent in October (p). The revised September
index now shows a slight decline instead of a slight increase, but
July and August were revised upwards, so that the change over the
third quarter is the same as reported last month--3.1 per cent.
Leading series increasing in October included contracts and
orders for plant and equipment, industrial materials prices, and common
stock prices. The manufacturing workweek was unchanged and there were
declines in unemployment initial claims (inverted), new orders for
durable goods, housing permits, and the ratio of price to unit labor
cost. Since the publication of the preliminary October index, new
orders for durable goods and contracts and orders for plant and equip-
ment have been revised upwards, and an increase was reported in the
change in consumer instalment debt, but inventory change was slightly
smaller than in September.
In November, common stock prices, industrial materials prices,
and the manufacturing workweek rose.
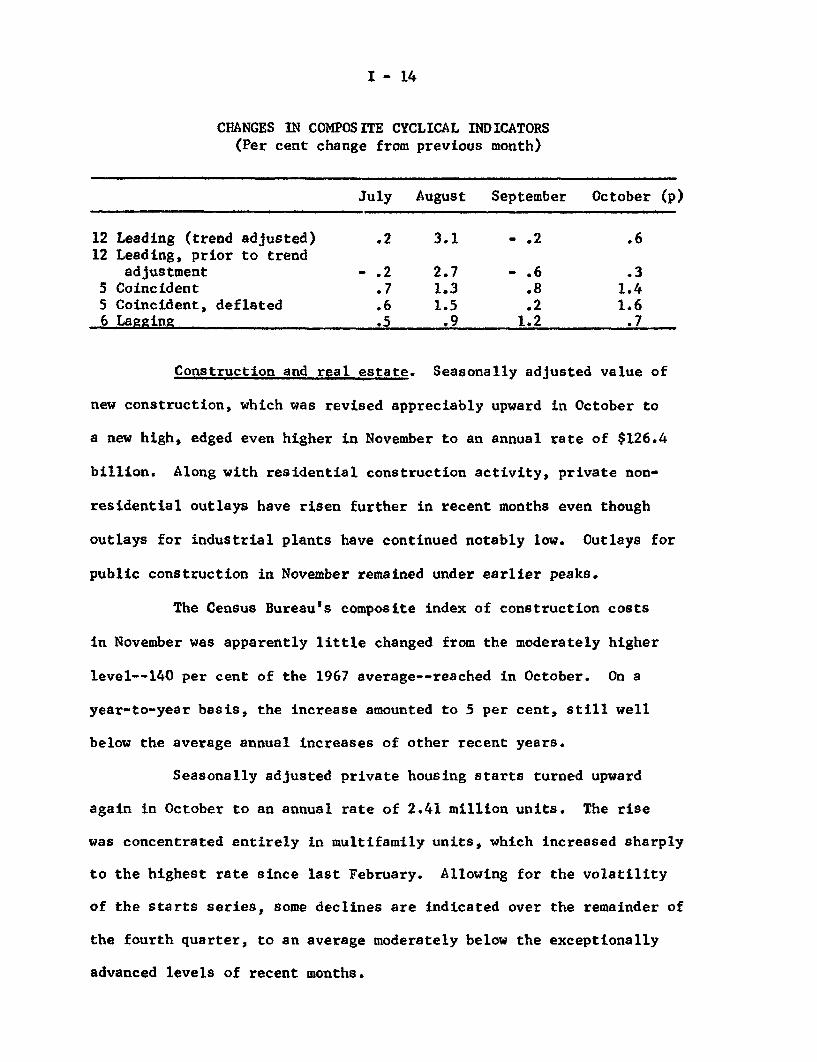
I - 14
CHANGES IN COMPOSITE CYCLICAL INDICATORS(Per cent change from previous month)
July August September October (p)
12 Leading (trend adjusted) .2 3.1 - .2 .612 Leading, prior to trend
adjustment - .2 2.7 - .6 .35 Coincident .7 1.3 .8 1.45 Coincident, deflated .6 1.5 .2 1.66 Lagging .5 .9 1.2 .7
Construction and real estate. Seasonally adjusted value of
new construction, which was revised appreciably upward in October to
a new high, edged even higher in November to an annual rate of $126.4
billion. Along with residential construction activity, private non-
residential outlays have risen further in recent months even though
outlays for industrial plants have continued notably low. Outlays for
public construction in November remained under earlier peaks.
The Census Bureau's composite index of construction costs
in November was apparently little changed from the moderately higher
level--140 per cent of the 1967 average--reached in October. On a
year-to-year basis, the increase amounted to 5 per cent, still well
below the average annual increases of other recent years.
Seasonally adjusted private housing starts turned upward
again in October to an annual rate of 2.41 million units. The rise
was concentrated entirely in multifamily units, which increased sharply
to the highest rate since last February. Allowing for the volatility
of the starts series, some declines are indicated over the remainder of
the fourth quarter, to an average moderately below the exceptionally
advanced levels of recent months.
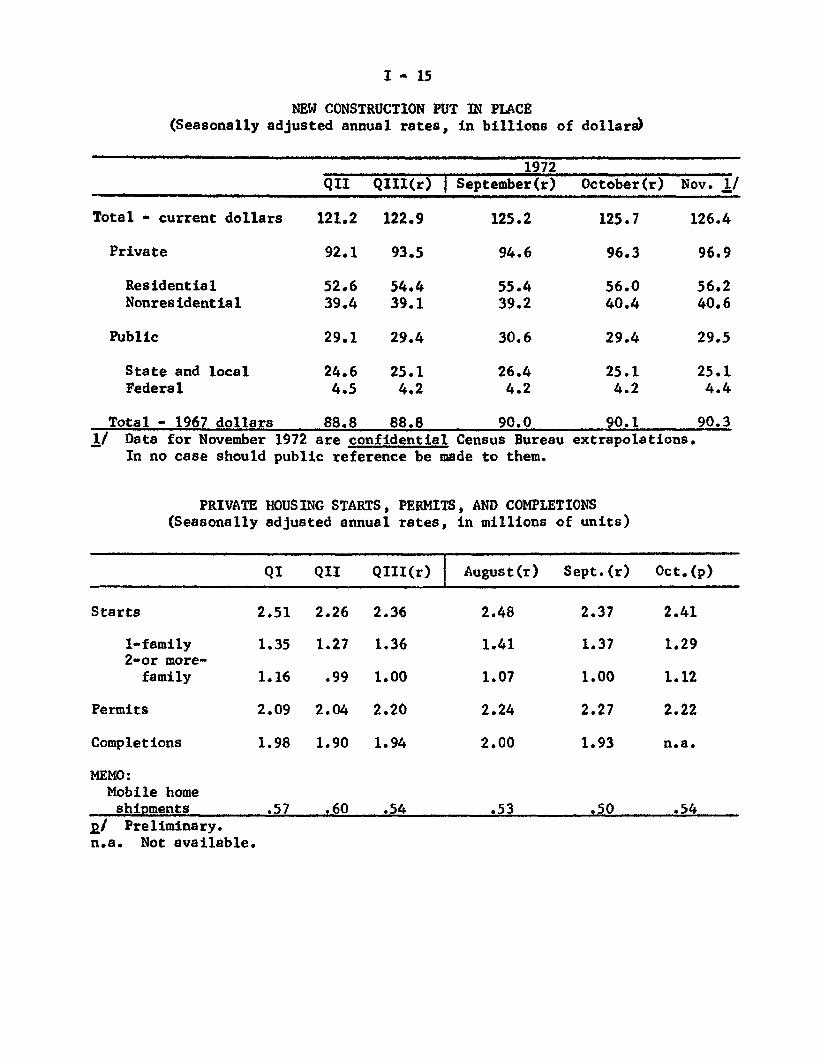
I - 15
NEW CONSTRUCTION PUT IN PLACE(Seasonally adjusted annual rates, in billions of dollars)
1972QII QIII(r) September(r) October(r) Nov. 1/
Total - current dollars 121.2 122.9 125.2 125.7 126.4
Private 92.1 93.5 94.6 96.3 96.9
Residential 52.6 54.4 55.4 56.0 56.2Nonresidential 39.4 39.1 39.2 40.4 40.6
Public 29.1 29.4 30.6 29.4 29.5
State and local 24.6 25.1 26.4 25.1 25.1Federal 4.5 4.2 4.2 4.2 4.4
Total - 1967 dollars 88.8 88.8 90.0 90.1 90.31/ Data for November 1972 are confidential Census Bureau extrapolations.
In no case should public reference be made to them.
PRIVATE HOUSING STARTS, PERMITS, AND COMPLETIONS(Seasonally adjusted annual rates, in millions of units)
QI QII QIII(r) August(r) Sept.(r) Oct.(p)
Starts 2.51 2.26 2.36 2.48 2.37 2.41
1-family 1.35 1.27 1.36 1.41 1.37 1.292-or more-
family 1.16 .99 1.00 1.07 1.00 1.12
Permits 2.09 2.04 2.20 2.24 2.27 2.22
Completions 1.98 1.90 1.94 2.00 1.93 n.a.
MEMO:Mobile homeshipments .57 .60 .54 .53 .50 .54
p/ Preliminary.n.a. Not available.
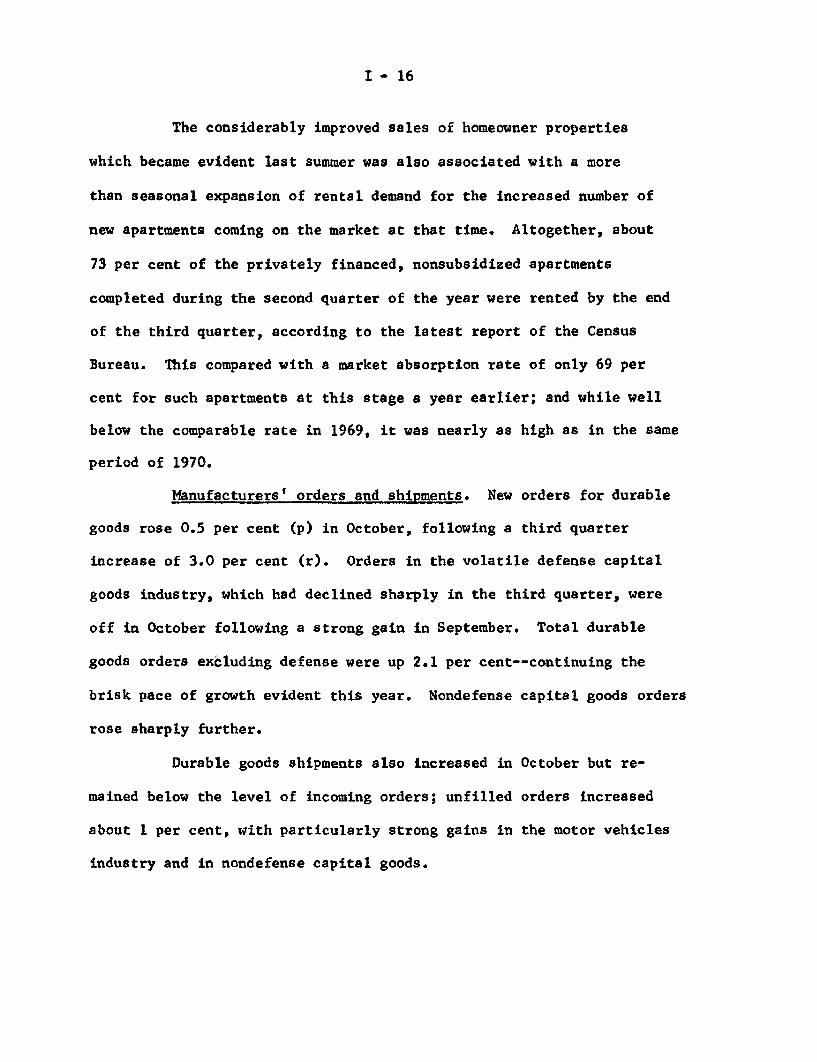
I- 16
The considerably improved sales of homeowner properties
which became evident last summer was also associated with a more
than seasonal expansion of rental demand for the increased number of
new apartments coming on the market at that time. Altogether, about
73 per cent of the privately financed, nonsubsidized apartments
completed during the second quarter of the year were rented by the end
of the third quarter, according to the latest report of the Census
Bureau. This compared with a market absorption rate of only 69 per
cent for such apartments at this stage a year earlier; and while well
below the comparable rate in 1969, it was nearly as high as in the same
period of 1970.
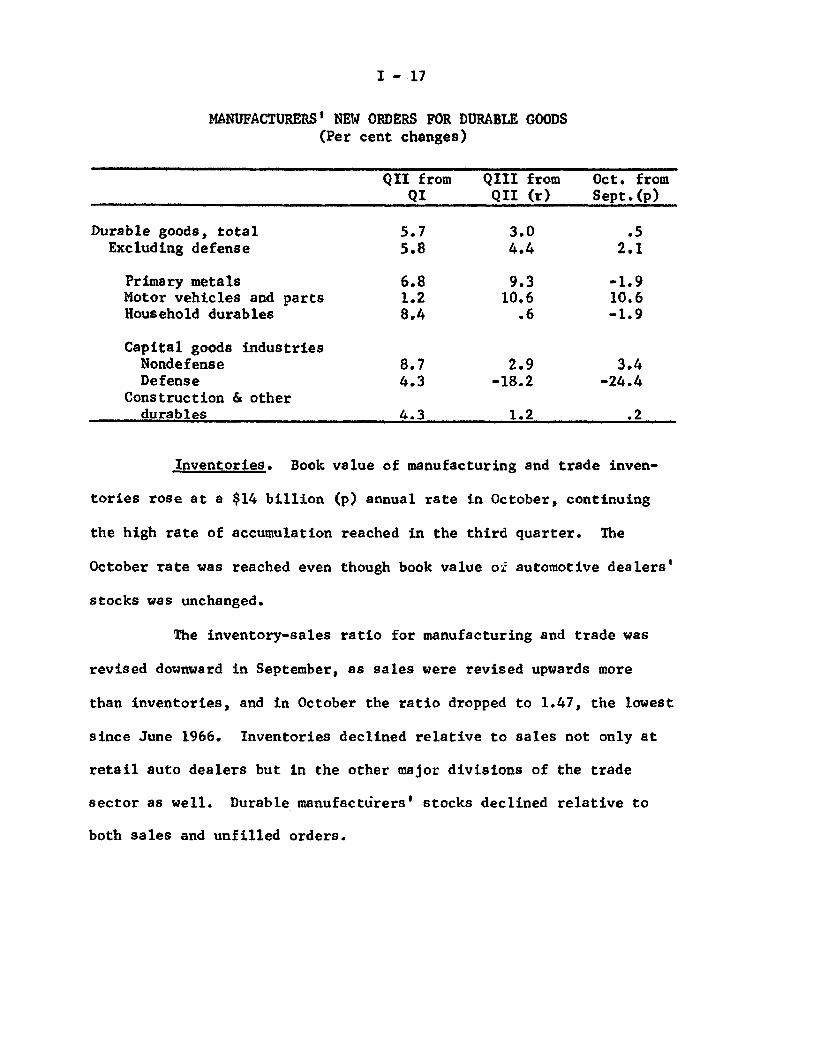
Manufacturers' orders and shipments. New orders for durable
goods rose 0.5 per cent (p) in October, following a third quarter
increase of 3.0 per cent (r). Orders in the volatile defense capital
goods industry, which had declined sharply in the third quarter, were
off in October following a strong gain in September. Total durable
goods orders excluding defense were up 2.1 per cent--continuing the
brisk pace of growth evident this year. Nondefense capital goods orders
rose sharply further.
Durable goods shipments also increased in October but re-
mained below the level of incoming orders; unfilled orders increased
about 1 per cent, with particularly strong gains in the motor vehicles
industry and in nondefense capital goods.
I - 17
MANUFACTURERS' NEW ORDERS FOR DURABLE GOODS(Per cent changes)
Durable goods, totalExcluding defense
Primary metalsMotor vehicles and partsHousehold durables
Capital goods industriesNondefenseDefense
Construction & otherdurables
QII fromQI
5.75.8
6.81.28.4
8.74.3
4.3
QIII fromQII (r)
3.04.4
9.310.6
.6
2.9-18.2
1.2
Oct. fromSept.(p)
.52.1
-1.910.6-1.9
3.4-24.4
.2
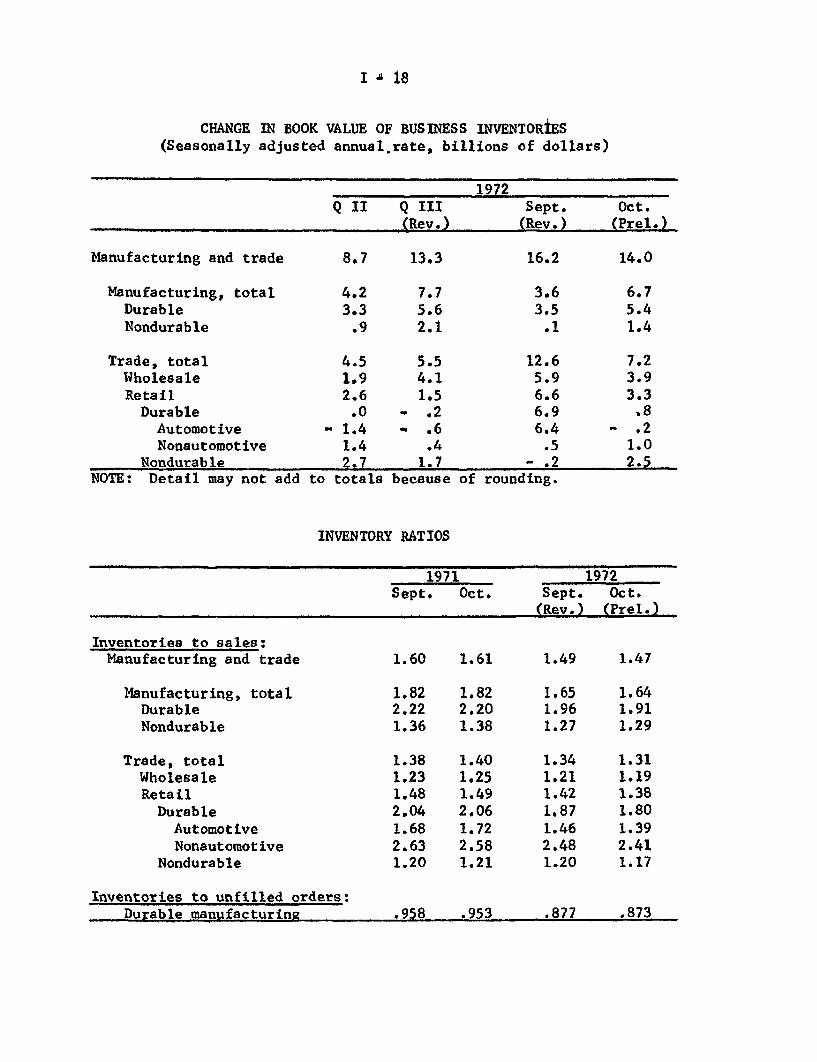
Inventories. Book value of manufacturing and trade inven-
tories rose at a $14 billion (p) annual rate in October, continuing
the high rate of accumulation reached in the third quarter. The
October rate was reached even though book value of automotive dealers'
stocks was unchanged.
The inventory-sales ratio for manufacturing and trade was
revised downward in September, as sales were revised upwards more
than inventories, and in October the ratio dropped to 1.47, the lowest
since June 1966. Inventories declined relative to sales not only at
retail auto dealers but in the other major divisions of the trade
sector as well. Durable manufacturers' stocks declined relative to
both sales and unfilled orders.
I 18
CHANGE IN BOOK VALUE OF BUSINESS INVENTORIES(Seasonally adjusted annual rate, billions of dollars)
1972Q II Q III Sept. Oct.
(Rev.) (Rev.) (Prel.)
Manufacturing and trade 8.7 13.3 16.2 14.0
Manufacturing, total 4.2 7.7 3.6 6.7Durable 3.3 5.6 3.5 5.4Nondurable .9 2.1 .1 1.4
Trade, total 4.5 5.5 12.6 7.2Wholesale 1.9 4.1 5.9 3.9Retail 2.6 1.5 6.6 3.3
Durable .0 .2 6.9 .8Automotive - 1.4 - .6 6.4 - .2Nonautomotive 1.4 .4 .5 1.0
Nondurable 2.7 1.7 - .2 2.5NOTE: Detail may not add to totals because of rounding.
INVENTORY RATIOS
1971 1972Sept. Oct. Sept. Oct.
(Rev.) (Prel.)
Inventories to sales:Manufacturing and trade 1.60 1.61 1.49 1.47
Manufacturing, total 1.82 1.82 1.65 1.64Durable 2.22 2.20 1.96 1.91Nondurable 1.36 1.38 1.27 1.29
Trade, total 1.38 1.40 1.34 1.31Wholesale 1.23 1.25 1.21 1.19Retail 1.48 1.49 1.42 1.38
Durable 2.04 2.06 1.87 1.80
Automotive 1.68 1.72 1.46 1.39Nonautomotive 2.63 2.58 2.48 2.41
Nondurable 1.20 1.21 1.20 1.17
Inventories to unfilled orders:Durable manufacturing .958 .953 .877 .873
I- 19
Labor market. There were signs in November of further
strong improvement in the labor market. The unemployment rate
declined by 0.3 percentage points, October manufacturing employment
was revised up substantially, November payroll employment advanced by
over 200,000, and the factory workweek increased.
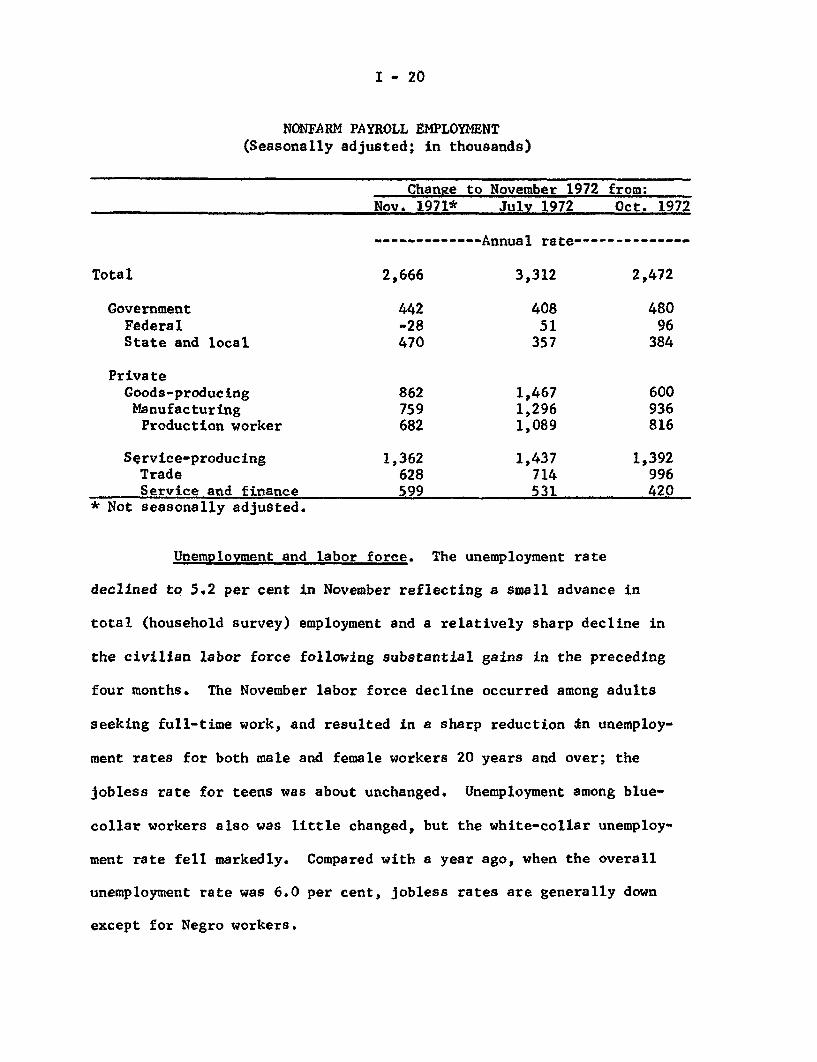
Growth of employment has been unusually strong in recent
months. The nonfarm payroll total in November--up 2.7 million from a
year earlier--has increased at a 3.3 million annual rate since July.
The largest gains have been in manufacturing industries, but factory
employment is still nearly one million below its mid-1969 peak. In the
nonmanufacturing sector, job growth in recent months has continued
brisk. Average weekly hours of manufacturing production workers rose
in November to 40.9 hours, 0.8 hours above a year ago and the highest
level since autumn 1968. Factory overtime hours advanced to 3.7
hours--0.7 hours above a year ago.
I - 20
NONFARM PAYROLL EMPLOYMENT(Seasonally adjusted; in thousands)
Total
GovernmentFederalState and local
PrivateGoods-producingManufacturingProduction worker
Service-producingTradeService and finance
* Not seasonally adjusted.
Change to November 1972 from;Nov. 1971* July 1972 Oct. 1972
------------- Annual rate--------------
2,666 3,312 2,472
442 408 480-28 51 96470 357 384
862759682
1,362628599
1,4671,2961,089
1,437714531
600936816
1,392996420
Unemployment and labor force. The unemployment rate
declined to 5.2 per cent in November reflecting a small advance in
total (household survey) employment and a relatively sharp decline in
the civilian labor force following substantial gains in the preceding
four months. The November labor force decline occurred among adults
seeking full-time work, and resulted in a sharp reduction in unemploy-
ment rates for both male and female workers 20 years and over; the
jobless rate for teens was about unchanged. Unemployment among blue-
collar workers also was little changed, but the white-collar unemploy-
ment rate fell markedly. Compared with a year ago, when the overall
unemployment rate was 6.0 per cent, jobless rates are generally down
except for Negro workers.

I - 21
SELECTED UNEMPLOYMENT RATES(Seasonally adjusted)
1971 1972Nov. April Oct. Nov.
Total 6.0 5.9 5.5 5.2
Men 20 years and over 4.4 4.3 3.9 3.6Women 20 years and over 5.8 5.4 5.5 5.0Teenagers 16.7 17.3 15.3 15.4
Household heads 3.6 3.4 3.4 2.9
White workers 5.6 5.4 5.0 4.6Negro workers 9.4 9.6 10.1 9.8
White-collar 3.4 3.4 3.6 3.1Blue-collar 7.5 6.8 5.9 5.8
Earnings. Average hourly earnings of production workers
on private nonfarm payrolls (adjusted for overtime in manufacturing and
inter-industry shifts) rose only slightly in November, according to
preliminary figures, following sizable increases in the preceding two
months. The pace of earnings increases over the past three months has
been somewhat faster than in the first part of the year. The most
notable step-up has been in construction and services--industries which
had shown quite moderate rates of increase in the earlier months of the
year.
The Pay Board has reported that the weighted average of
approved wage increases in the first year of the program for Category
I and II cases (firms with over 1,000 employees) amounted to 5.2
per cent and affected 21 million workers. For category I cases alone
(5,000 or more employees) the weighted average increase was 5.3 per cent
I - 22
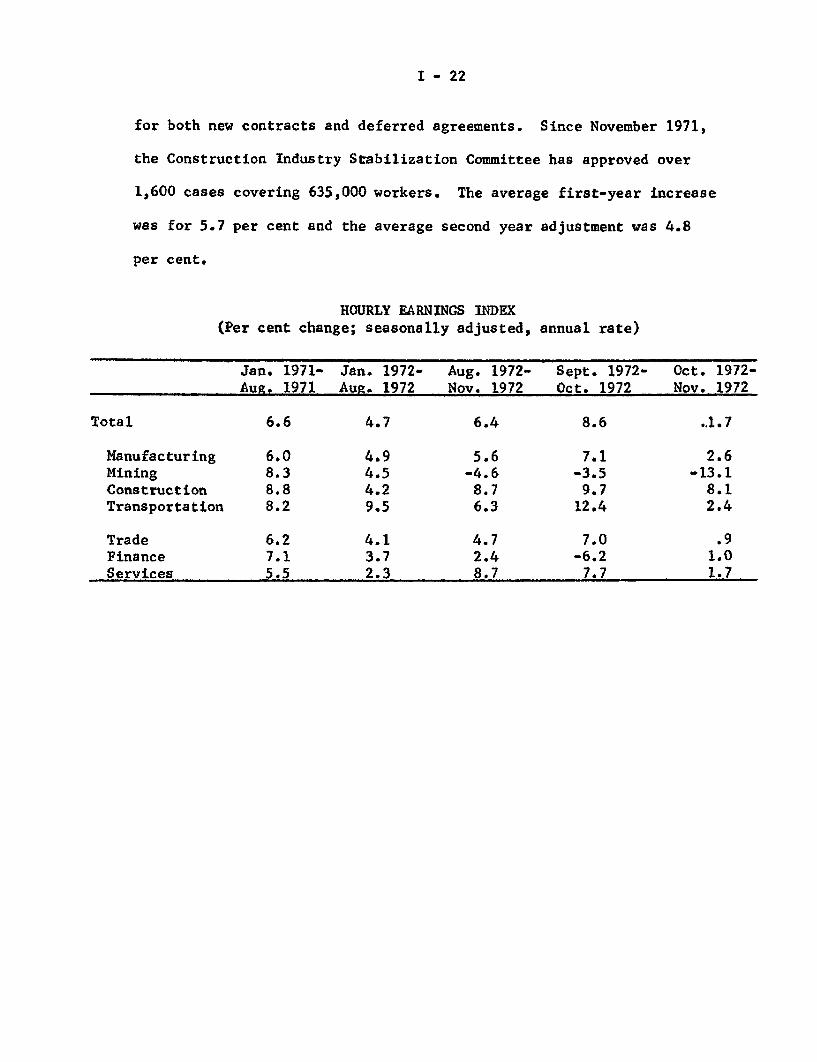
for both new contracts and deferred agreements. Since November 1971,
the Construction Industry Stabilization Committee has approved over
1,600 cases covering 635,000 workers. The average first-year increase
was for 5.7 per cent and the average second year adjustment was 4.8
per cent.
HOURLY EARNINGS INDEX(Per cent change; seasonally adjusted, annual rate)
Total
ManufacturingMiningConstructionTransporta t ion
TradeFinanceServices
Jan. 1971- Jan. 1972- Aug. 1972-Aug. 1971 Aug. 1972 Nov. 1972
6.6 4.7 6.4
6.0 4.9 5.68.3 4.5 -4.68.8 4.2 8.78.2 9.5 6.3
6.2 4.1 4.77.1 3.7 2.45.5 2.3 8.7
Sept. 1972- Oct. 1972-Oct. 1972 Nov. 1972
8.6 .1.7
7.1 2.6-3.5 -13.19.7 8.1
12.4 2.4
7.0 .9-6.2 1.07.7 1.7
I - 23
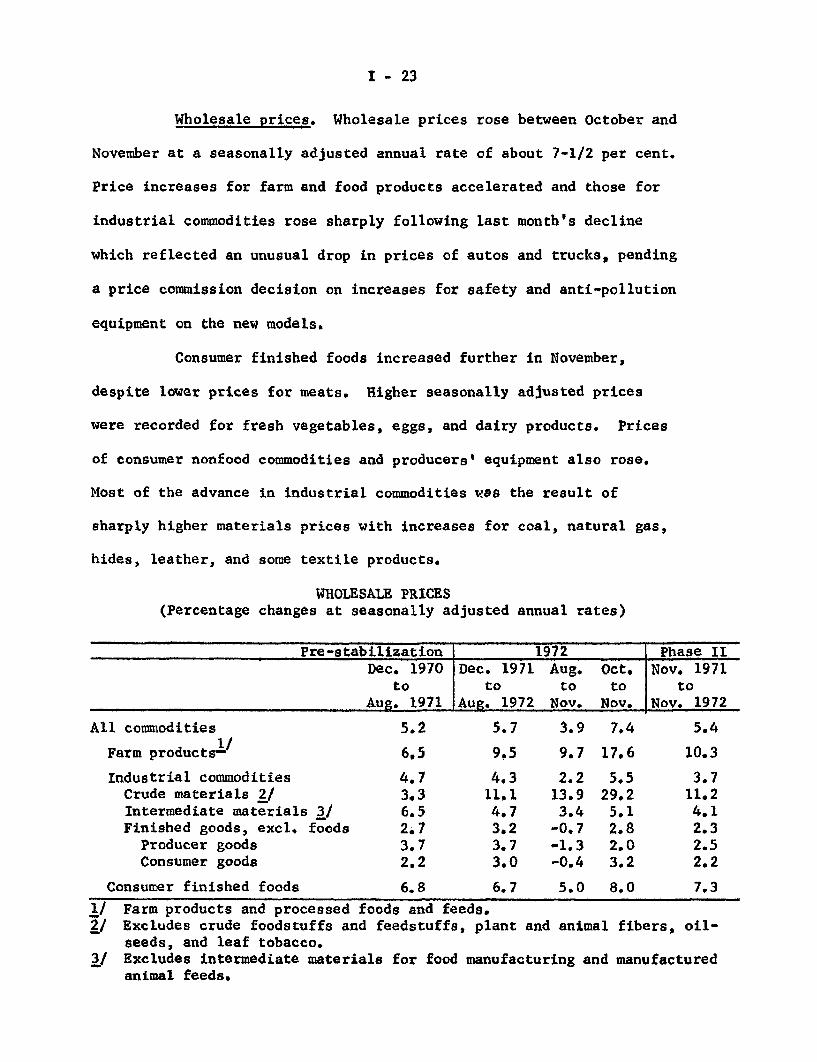
Wholesale prices. Wholesale prices rose between October and
November at a seasonally adjusted annual rate of about 7-1/2 per cent.
Price increases for farm and food products accelerated and those for
industrial commodities rose sharply following last month's decline
which reflected an unusual drop in prices of autos and trucks, pending
a price commission decision on increases for safety and anti-pollution
equipment on the new models.
Consumer finished foods increased further in November,
despite lower prices for meats. Higher seasonally adjusted prices
were recorded for fresh vegetables, eggs, and dairy products. Prices
of consumer nonfood commodities and producers' equipment also rose.
Most of the advance in industrial commodities was the result of
sharply higher materials prices with increases for coal, natural gas,
hides, leather, and some textile products.
WHOLESALE PRICES(Percentage changes at seasonally adjusted annual rates)
Pre-stabilization 1972 Phase IIDec. 1970 Dec. 1971 Aug. Oct. Nov. 1971
to to to to toAug. 1971 Aug. 1972 Nov. Nov. Nov. 1972
All commodities 5.2 5.7 3.9 7.4 5.4
Farm products /- 6,5 9,5 9.7 17.6 10.3
Industrial commodities 4.7 4.3 2.2 5,5 3.7Crude materials 2/ 3.3 11.1 13.9 29.2 11.2Intermediate materials 3/ 6.5 4.7 3.4 5.1 4.1Finished goods, excl, foods 2.7 3.2 -0.7 2.8 2.3
Producer goods 3.7 3.7 -1.3 2.0 2.5Consumer goods 2.2 3.0 -0.4 3.2 2.2
Consumer finished foods 6.8 6.7 5.0 8.0 7.3
1/ Farm products and processed foods and feeds.2/ Excludes crude foodstuffs and feedstuffs, plant and animal fibers, oil-
seeds, and leaf tobacco.3/ Excludes intermediate materials for food manufacturing and manufactured
animal feeds.
I - 24
November marked the end of the first year of Phase II, and
the WPI showed a rise over the period of 5.4 per cent, a rate of
increase slightly above that in the period during 1971 before the
inauguration of the price-wage freeze. Farm and food products rose
more sharply but industrial commodity price increases moderated some-
what. Widespread and large increases were registered by most groups
included in the farm and food products index over the year; livestock,
meat, grain, and manufactured animal feeds accounted for more than
one-half of the rise. All commodity groups in the industrial commodities
price index increased over this period, but fuels, lumber and plywood,
metals, textiles and apparel, and hides and leather accounted for more
than one-half of the over-all increase.
Producers' equipment prices rose at a slower rate during
the first year of Phase II than in the 8 months prior to the freeze,
and consumer nonfood finished goods increased at the same rate in
both periods. However, this reflected the unusual October development
noted earlier. If October is excluded, the indexes for both producer
and consumer nonfood finished goods show much larger increases during
the first year of Phase II; producers' finished goods show an increase
of 3.4 per cent and consumer finished goods an increase of 3.2 per
cent.
The December WPI will reflect the price increases for passenger
cars recently approved by the Price Commission and, on the basis of
I - 25
recent data, will probably show more-than-seasonal increases for
grains, livestock, and meat.
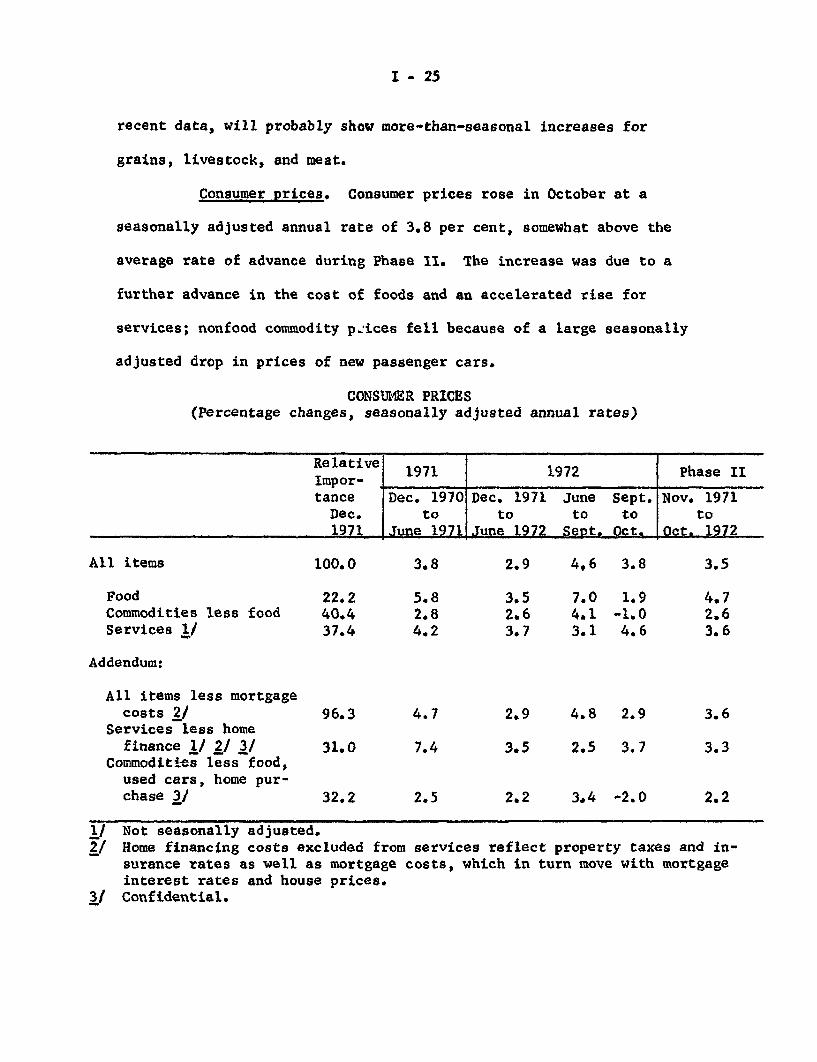
Consumer prices. Consumer prices rose in October at a
seasonally adjusted annual rate of 3.8 per cent, somewhat above the
average rate of advance during Phase II. The increase was due to a
further advance in the cost of foods and an accelerated rise for
services; nonfood commodity prices fell because of a large seasonally
adjusted drop in prices of new passenger cars.
CONSUMER PRICES(Percentage changes, seasonally adjusted annual rates)
Relative 1971 1972 Phase IIImpor-tance Dec. 1970 Dec. 1971 June Sept. Nov. 1971Dec. to to to to to1971 June 1971 June 1972 Sept. Oct. Oct. 1972
All items 100.0 3.8 2.9 4,6 3.8 3.5
Food 22.2 5.8 3.5 7.0 1.9 4.7Commodities less food 40.4 2.8 2.6 4.1 -1.0 2.6Services 1/ 37.4 4.2 3.7 3.1 4.6 3.6
Addendum:
All items less mortgagecosts 2/ 96.3 4.7 2.9 4.8 2.9 3.6
Services less homefinance 1/ 2/ 3/ 31.0 7.4 3.5 2.5 3.7 3.3
Commodities less food,used cars, home pur-chase 3/ 32.2 2.5 2.2 3.4 -2.0 2.2
1/ Not seasonally adjusted.2/ Home financing costs excluded from services reflect property taxes and in-
surance rates as well as mortgage costs, which in turn move with mortgageinterest rates and house prices.
3/ Confidential.
I - 26
The decline in new car prices accompanied the introduction
of 1973 models at manufacturers' list prices hardly changed from 1972
but with new safety and emission control equipment which, is considered
a quality improvement. Dealers' prices rose, as they usually do in
October when new models come in, but most of the increase was offset
by the BLS allowance for quality improvement. Seasonally unadjusted
prices thus rose relatively little and on a seasonally adjusted basis
there was a decline. The effect of the more recently approved increases
should appear mainly in early 1973 when new car prices usually fall
seasonally. Moreover, the producers have asked for additional increases
to cover higher costs.
Among nondurables there was a further rise in apparel prices
which have increased since November 1971 at a 2.6 per cent rate.
Gasoline prices fell somewhat, after their record climb of the pre-
ceding three months, but remained above earlier levels.
The acceleration in service prices reflects the annual adjust-
ment--upward this year--to the health insurance component which brought
the 12-month increase for medical care services to nearly 4 per cent.
Property taxes posted another substantial increase and were nearly 11
per cent above the October 1971 level.
A sharp advance in pork prices contributed to the rise in
food costs, as did less than seasonal declines for beef, poultry and
I - 27
fresh fruits. Fresh vegetable prices, however, dropped contra-
seasonally and the rise in the index for restaurant meals and snacks
slowed markedly.
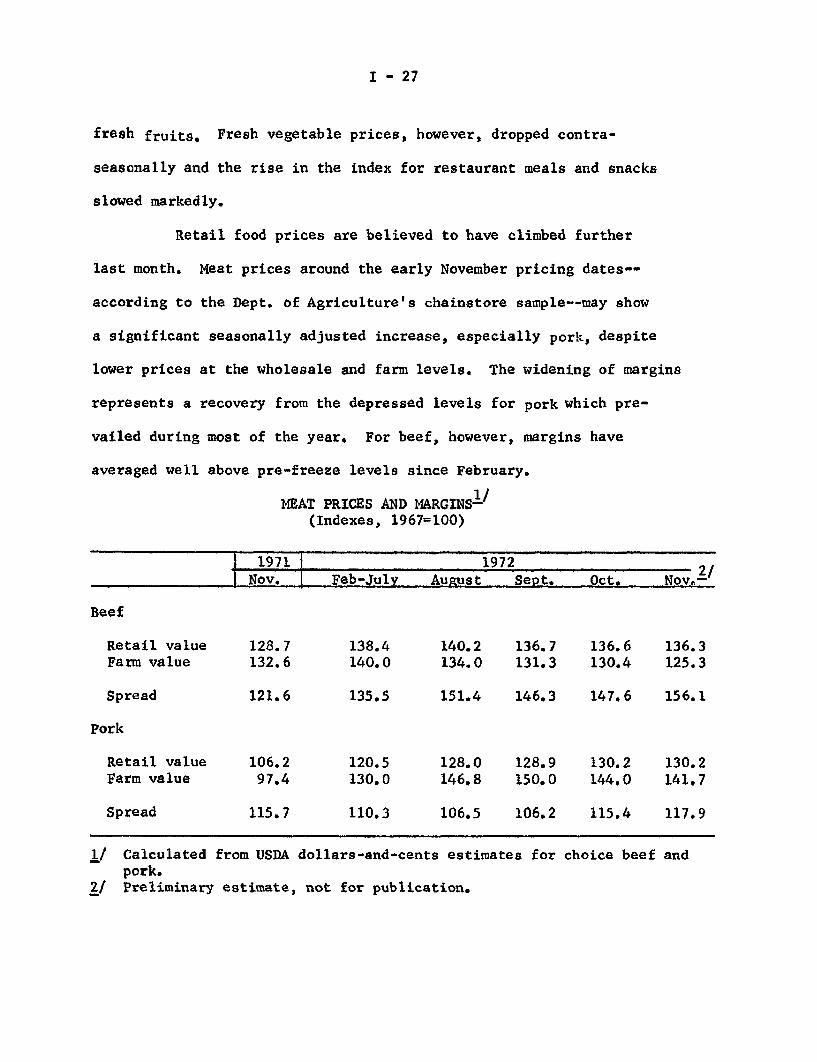
Retail food prices are believed to have climbed further
last month. Meat prices around the early November pricing dates--
according to the Dept. of Agriculture's chainstore sample--may show
a significant seasonally adjusted increase, especially pork, despite
lower prices at the wholesale and farm levels. The widening of margins
represents a recovery from the depressed levels for pork which pre-
vailed during most of the year. For beef, however, margins have
averaged well above pre-freeze levels since February.
MEAT PRICES AND MARGINS 1 /
(Indexes, 1967=100)
1971 1972Nov. Feb-July Auust Sept. Oct. Nov. 2/
Beef
Retail value 128.7 138.4 140.2 136.7 136.6 136.3Farm value 132.6 140.0 134.0 131.3 130.4 125.3
Spread 121.6 135.5 151.4 146.3 147.6 156.1
Pork
Retail value 106.2 120.5 128.0 128.9 130.2 130.2Farm value 97.4 130.0 146.8 150.0 144.0 141.7
Spread 115.7 110.3 106.5 106.2 115.4 117.9
1/ Calculated from USDA dollars-and-cents estimates for choice beef andpork.
2/ Preliminary estimate, not for publication.
I - 28
Agricultural developments. Prices received by farmers
increased 1 per cent during the month ending November 15. Higher
prices for eggs, milk, soybeans, wheat, and cotton were partially
offset by lower livestock and citrus prices. In late November and
early December, however, livestock prices turned upward, with hogs
reaching a 25-year high. Prices of soybeans, wheat, corn, and cotton
continued to increase through early December due partly to wet weather,
suggesting that the index of farm prices for the mid-December period
will rise further.

DOMESTIC FINANCIALSITUATION
II-T-1
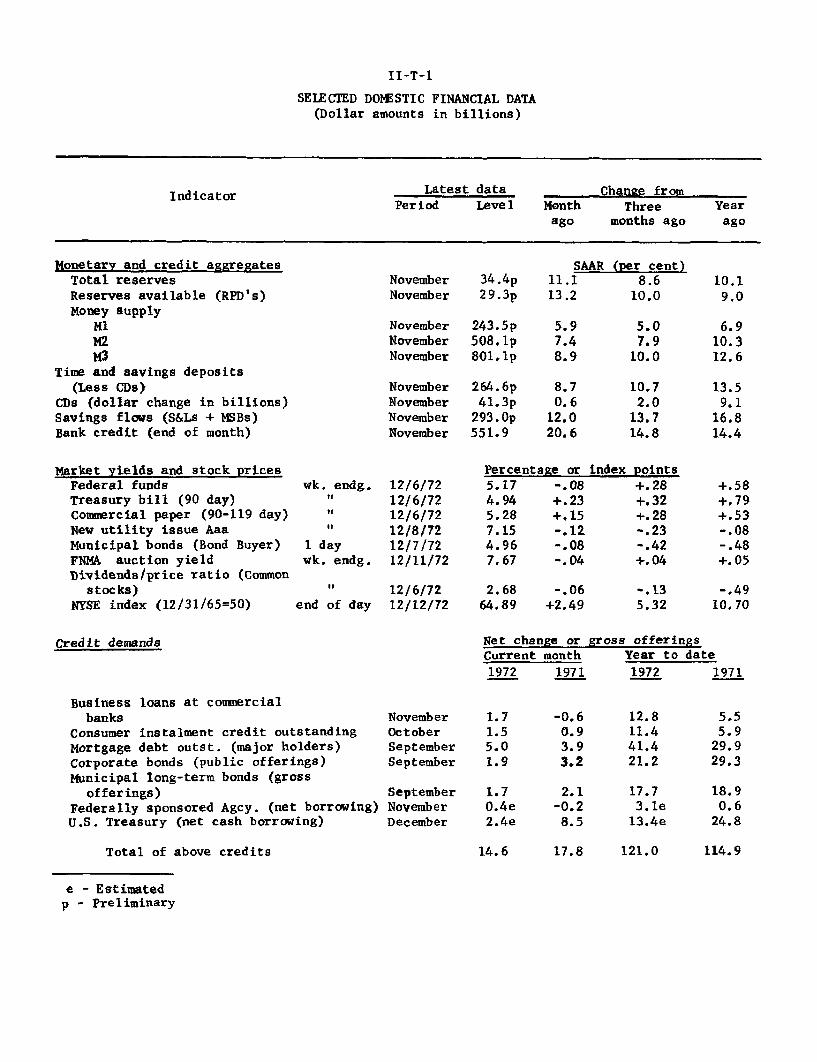
SELECTED DOMESTIC FINANCIAL DATA(Dollar amounts in billions)
Indicator Latest data Change fromPeriod Level Month Three Year
ago months ago ago
Monetary and credit aggregatesTotal reservesReserves available (RPD's)Money supply
M1M2M3
Time and savings deposits(Less CDs)
CDs (dollar change in billions)Savings flows (S&Ls + MSBs)Bank credit (end of month)
Market yields and stock pricesFederal fundsTreasury bill (90 day)Commercial paper (90-119 day)New utility issue AaaMunicipal bonds (Bond Buyer)FNMA auction yieldDividends/price ratio (Common
stocks)NYSE index (12/31/65=50)
November 34 .4pNovember 2 9 .3p
wk. endg.It
I
1 daywk. endg.
end of dayend of day
NovemberNovemberNovember
NovemberNovemberNovemberNovember
12/6/7212/6/7212/6/7212/8/7212/7/7212/11/72
2 43 .5p50 8 .lp801.lp
264.6p41.3p
293. 0p551.9
SAAR (per cent)11.1 8.613.2
5.97.48.9
8.70.6
12.020.6
10.0
5.07.9
10.0
10.72.0
13.714.8
Percentage or index points5.17 -. 08 +.284.94 +.23 +.325.28 +.15 +.287.15 -. 12 -. 234.96 -. 08 -. 427.67 -. 04 +.04
12/6/72 2.68 -. 0612/12/72 64.89 +2.49
-.135.32
Credit demands Net change orCurrent month
1972 1971
gross offeringsYear to date
1972 1971
Business loans at commercialbanks
Consumer instalment credit outstandingMortgage debt outst. (major holders)Corporate bonds (public offerings)Municipal long-term bonds (gross
offerings)Federally sponsored Agcy. (net borrowing)U.S. Treasury (net cash borrowing)
Total of above credits
NovemberOctoberSeptemberSeptember
SeptemberNovemberDecember
1.71.55.01.9
1.70.4e2.4e
14.6
-0.60.93.93.2
2.1-0.2
8.5
12.811.441.421.2
17.73.1e
13.4e
17.8 121.0
e - Estimatedp - Preliminary
10.19.0
6.910.312.6
13.59.1
16.814.4
+.58+.79+.53-. 08-. 48+.05
-. 4910.70
5.55.9
29.929.3
18.90.6
24.8
114.9
II - 1
DOMESTIC FINANCIAL SITUATION
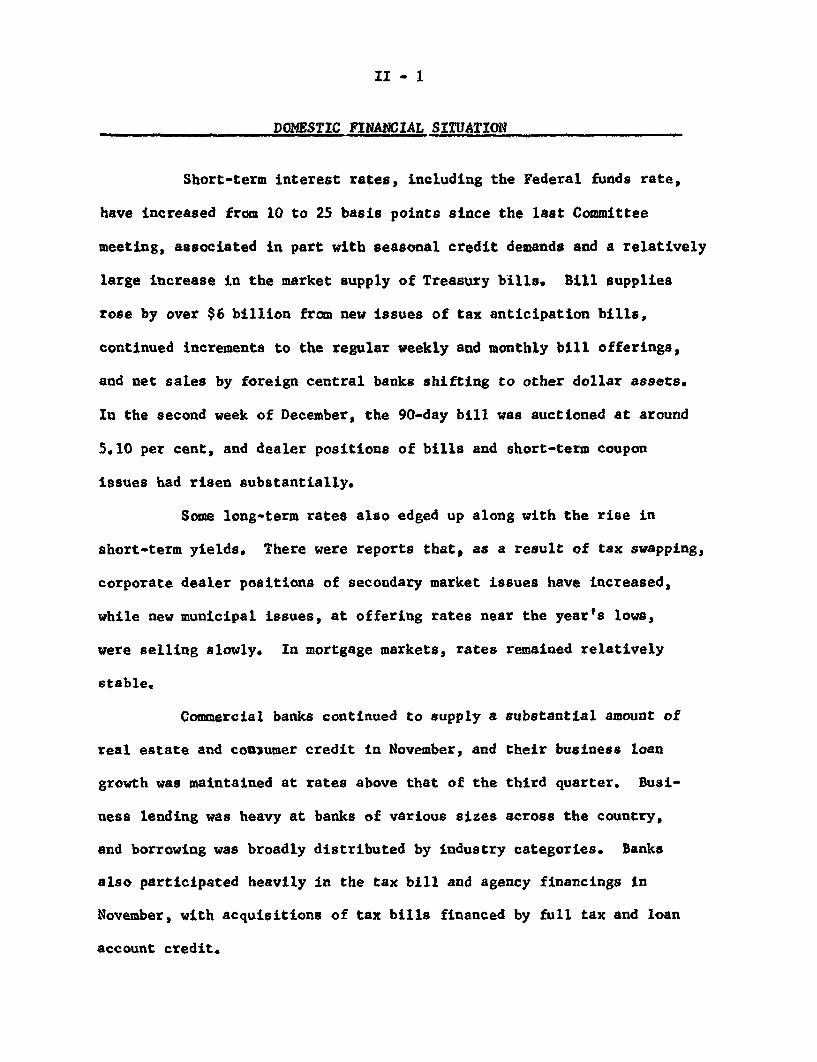
Short-term interest rates, including the Federal funds rate,
have increased from 10 to 25 basis points since the last Committee
meeting, associated in part with seasonal credit demands and a relatively
large increase in the market supply of Treasury bills. Bill supplies
rose by over $6 billion from new issues of tax anticipation bills,
continued increments to the regular weekly and monthly bill offerings,
and net sales by foreign central banks shifting to other dollar assets.
In the second week of December, the 90-day bill was auctioned at around
5.10 per cent, and dealer positions of bills and short-term coupon
issues had risen substantially.
Some long-term rates also edged up along with the rise in
short-term yields. There were reports that, as a result of tax swapping,
corporate dealer positions of secondary market issues have increased,
while new municipal issues, at offering rates near the year's lows,
were selling slowly. In mortgage markets, rates remained relatively
stable.
Commercial banks continued to supply a substantial amount of
real estate and consumer credit in November, and their business loan
growth was maintained at rates above that of the third quarter. Busi-
ness lending was heavy at banks of various sizes across the country,
and borrowing was broadly distributed by industry categories. Banks
also participated heavily in the tax bill and agency financings in
November, with acquisitions of tax bills financed by full tax and loan
account credit.
II - 2
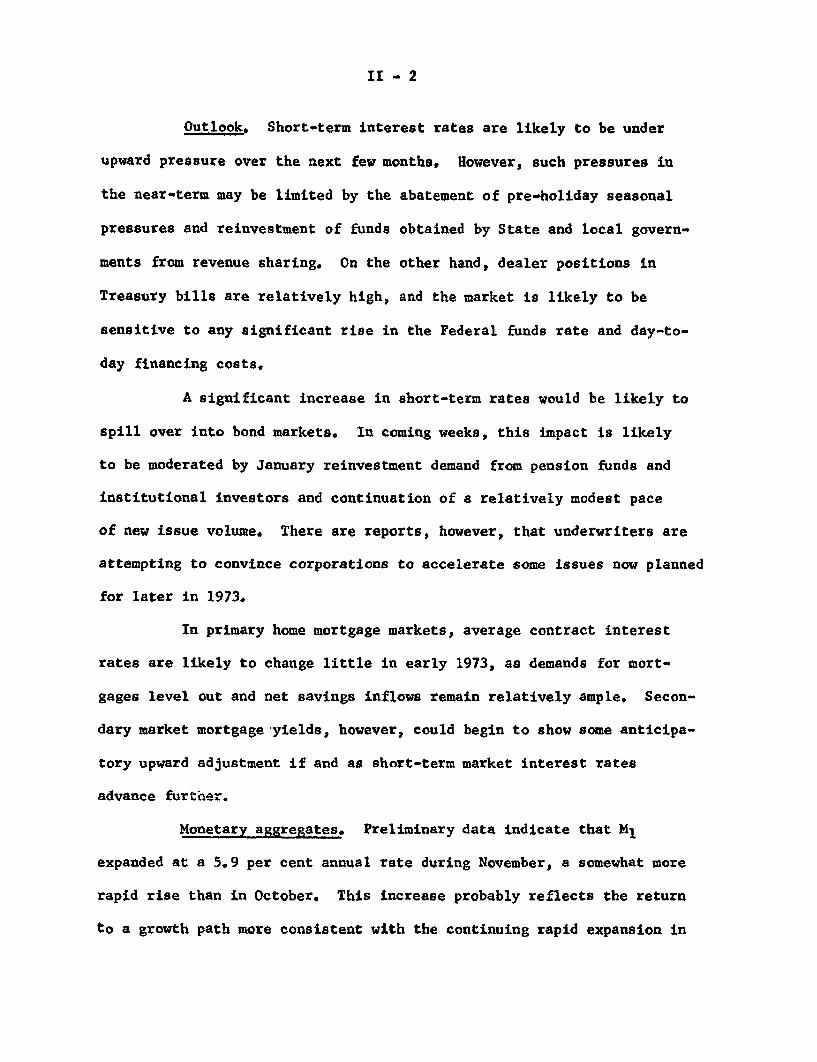
Outlook. Short-term interest rates are likely to be under
upward pressure over the next few months. However, such pressures in
the near-term may be limited by the abatement of pre-holiday seasonal
pressures and reinvestment of funds obtained by State and local govern-
ments from revenue sharing. On the other hand, dealer positions in
Treasury bills are relatively high, and the market is likely to be
sensitive to any significant rise in the Federal funds rate and day-to-
day financing costs.
A significant increase in short-term rates would be likely to
spill over into bond markets. In coming weeks, this impact is likely
to be moderated by January reinvestment demand from pension funds and
institutional investors and continuation of a relatively modest pace
of new issue volume. There are reports, however, that underwriters are
attempting to convince corporations to accelerate some issues now planned
for later in 1973.
In primary home mortgage markets, average contract interest
rates are likely to change little in early 1973, as demands for mort-
gages level out and net savings inflows remain relatively ample. Secon-
dary market mortgage yields, however, could begin to show some anticipa-
tory upward adjustment if and as short-term market interest rates
advance further.
Monetary aggregates. Preliminary data indicate that M 1
expanded at a 5.9 per cent annual rate during November, a somewhat more
rapid rise than in October. This increase probably reflects the return
to a growth path more consistent with the continuing rapid expansion in
II - 3
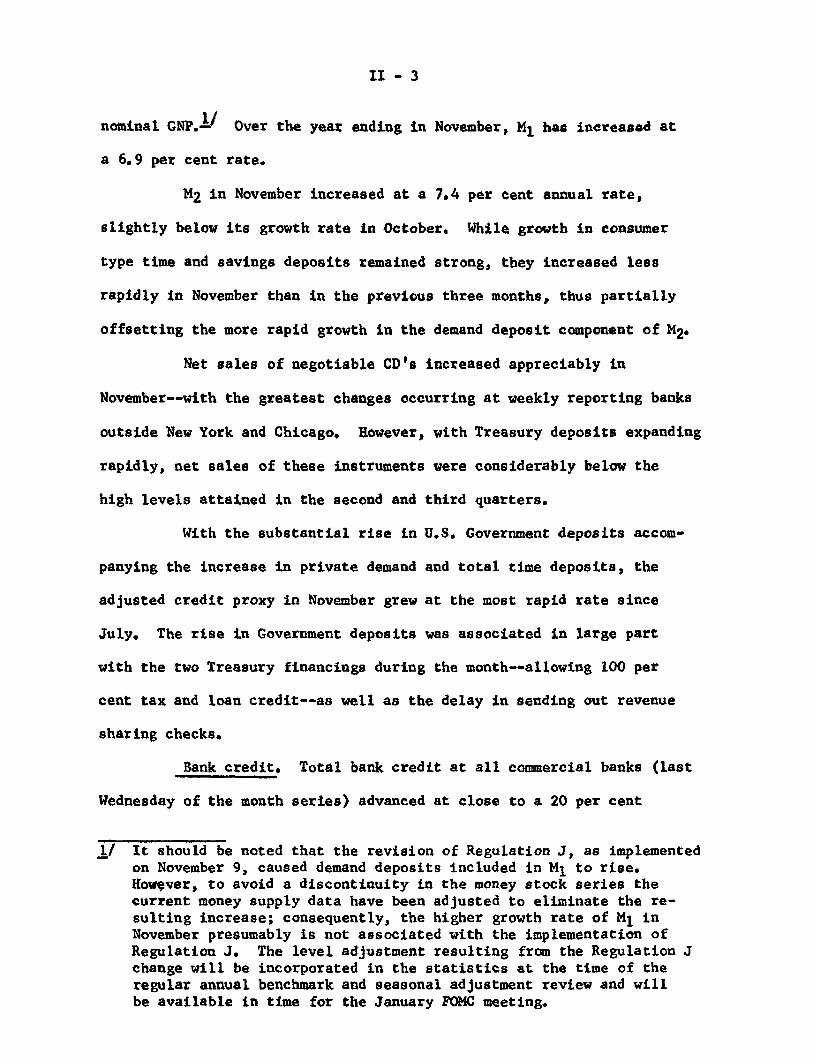
nominal GNP.1/ Over the year ending in November, M1 has increased at
a 6.9 per cent rate.
M2 in November increased at a 7.4 per cent annual rate,
slightly below its growth rate in October. While growth in consumer
type time and savings deposits remained strong, they increased less
rapidly in November than in the previous three months, thus partially
offsetting the more rapid growth in the demand deposit component of M2.
Net sales of negotiable CD's increased appreciably in
November--with the greatest changes occurring at weekly reporting banks
outside New York and Chicago. However, with Treasury deposits expanding
rapidly, net sales of these instruments were considerably below the
high levels attained in the second and third quarters.
With the substantial rise in U.S. Government deposits accom-
panying the increase in private demand and total time deposits, the
adjusted credit proxy in November grew at the most rapid rate since
July. The rise in Government deposits was associated in large part
with the two Treasury financings during the month--allowing 100 per
cent tax and loan credit--as well as the delay in sending out revenue
sharing checks.
Bank credit. Total bank credit at all commercial banks (last
Wednesday of the month series) advanced at close to a 20 per cent
1/ It should be noted that the revision of Regulation J, as implementedon November 9, caused demand deposits included in M1 to rise.However, to avoid a discontinuity in the money stock series thecurrent money supply data have been adjusted to eliminate the re-sulting increase; consequently, the higher growth rate of M 1 inNovember presumably is not associated with the implementation ofRegulation J. The level adjustment resulting from the Regulation Jchange will be incorporated in the statistics at the time of the
regular annual benchmark and seasonal adjustment review and willbe available in time for the January FOMC meeting.
II - 4
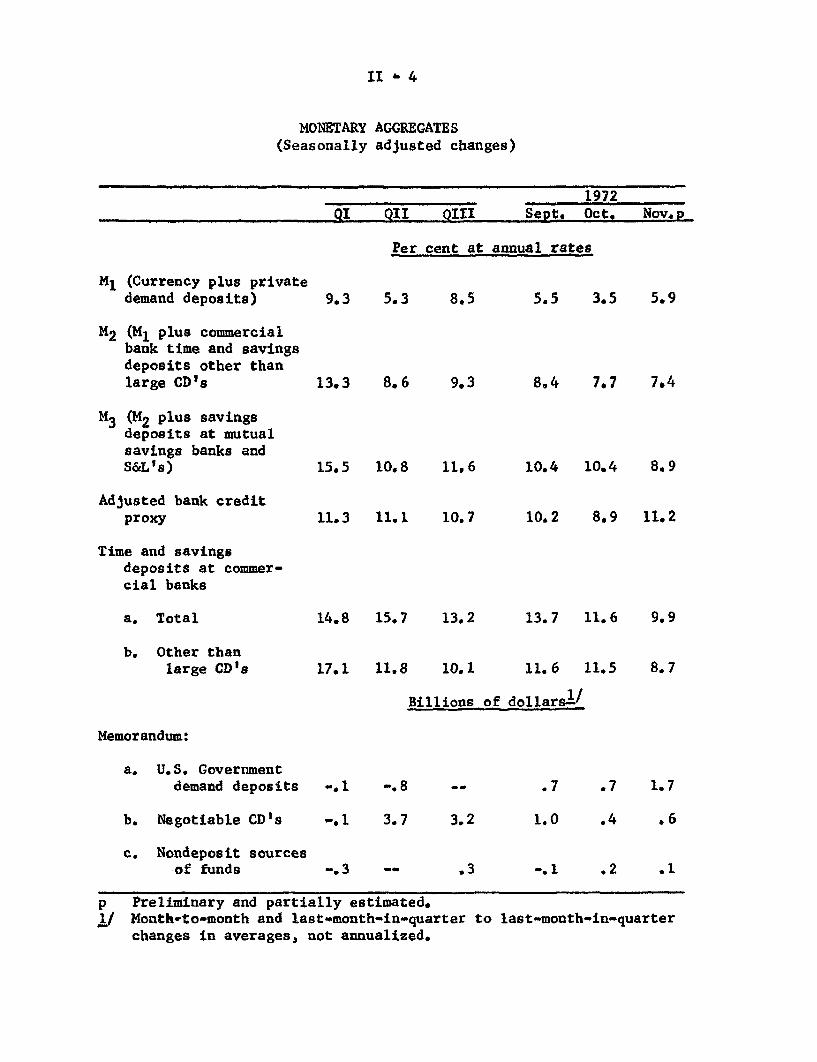
MONETARY(Seasonally
AGGREGATESadjusted changes)
1972
QI QII QIII Sept. Oct. Nov.p
Per cent at annual rates
M1 (Currency plus privatedemand deposits)
M 2 (M1 plus commercialbank time and savingsdeposits other thanlarge CD's
M 3 (M2 plus savingsdeposits at mutualsavings banks andS&L's)
Adjusted bank creditproxy
Time and savingsdeposits at commer-cial banks
a. Total
b. Other thanlarge CD's
9.3 5.3
13.3 8.6
8.5
9.3
15.5 10.8 11,6
11.3 11.1 10.7
14.8 15.7 13.2
17.1 11.8 10.1
5.5 3.5 5.9
8.4 7.7 7.4
10.4 10.4 8.9
10.2 8.9 11.2
13.7 11.6 9.9
11.6 11.5 8.7
Billions of dollars 1/
Memorandum:
a. U.S. Governmentdemand deposits
b. Negotiable CD's
c. Nondeposit sourcesof funds
-. 1 -. 8
-. 1 3.7
.7 .7 1.7
3.23.2 1.0
-. 3
.4 .6
.2 .1
p Preliminary and partially estimated.1/ Month-to-month and last-month-in-quarter to last-month-in-quarter
changes in averages, not annualized.
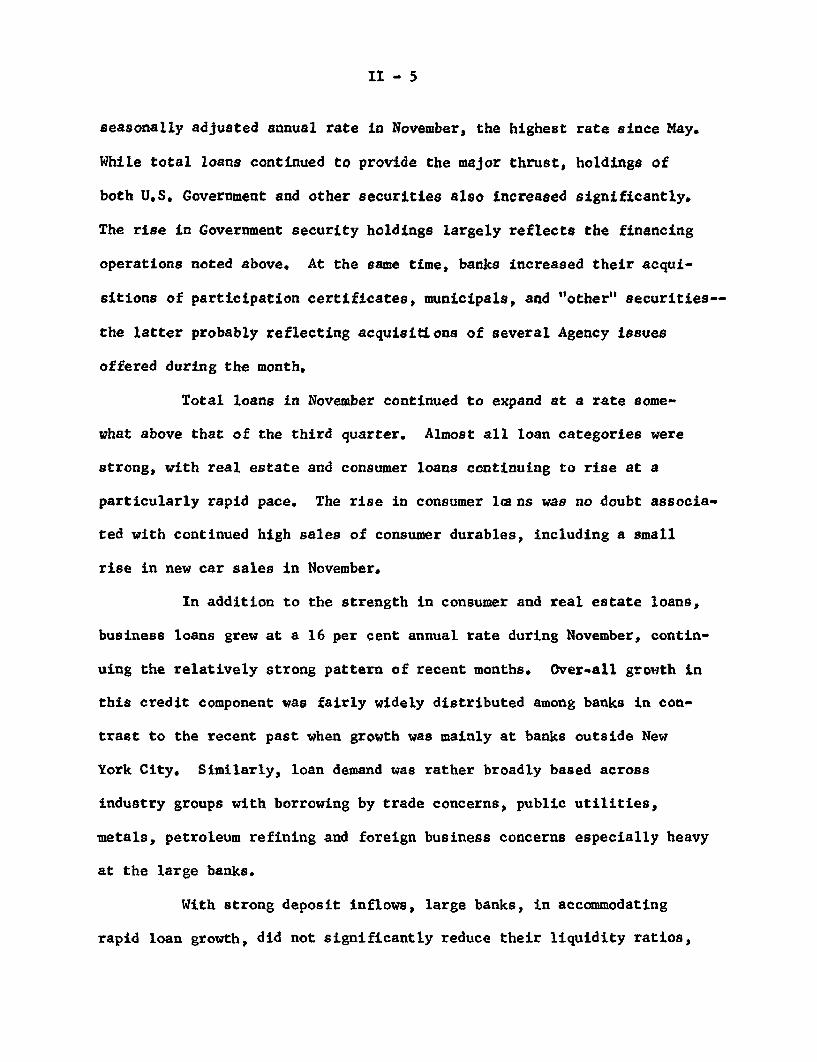
II - 5
seasonally adjusted annual rate in November, the highest rate since May.
While total loans continued to provide the major thrust, holdings of
both U.S. Government and other securities also increased significantly.
The rise in Government security holdings largely reflects the financing
operations noted above. At the same time, banks increased their acqui-
sitions of participation certificates, municipals, and "other" securities--
the latter probably reflecting acquisitions of several Agency issues
offered during the month.
Total loans in November continued to expand at a rate some-
what above that of the third quarter. Almost all loan categories were
strong, with real estate and consumer loans continuing to rise at a
particularly rapid pace. The rise in consumer loans was no doubt associa-
ted with continued high sales of consumer durables, including a small
rise in new car sales in November.
In addition to the strength in consumer and real estate loans,
business loans grew at a 16 per cent annual rate during November, contin-
uing the relatively strong pattern of recent months. Over-all growth in
this credit component was fairly widely distributed among banks in con-
trast to the recent past when growth was mainly at banks outside New
York City, Similarly, loan demand was rather broadly based across
industry groups with borrowing by trade concerns, public utilities,
metals, petroleum refining and foreign business concerns especially heavy
at the large banks.
With strong deposit inflows, large banks, in accommodating
rapid loan growth, did not significantly reduce their liquidity ratios,
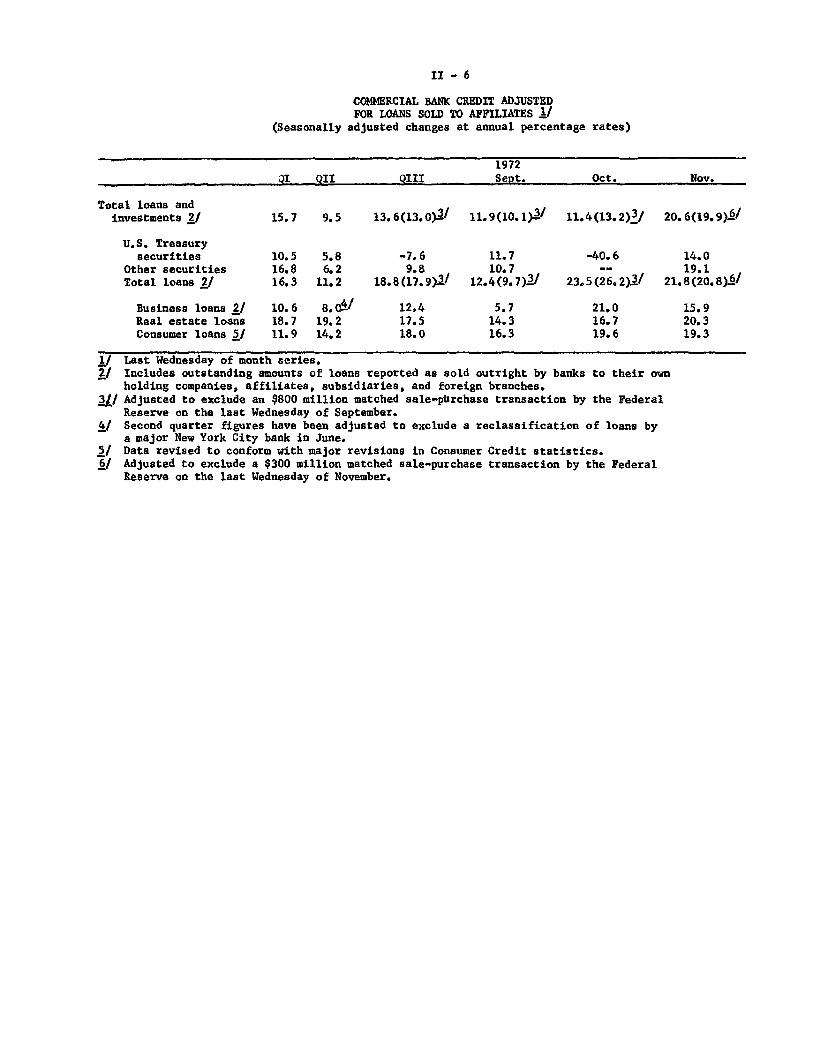
II - 6
COMMERCIAL BANK CREDIT ADJUSTEDFOR LOANS SOLD TO AFFILIATES 1/
(Seasonally adjusted changes at annual percentage rates)
1972QI QII QIII Sept. Oct. Nov.
Total loans andInvestments 2/ 15.7 9.5 13.6(13.0)>1 11.9(10.1) 11.4(13.2)1/ 20.6(19.9)./
U.S. Treasurysecurities 10.5 5.8 -7.6 11.7 -40.6 14.0
Other securities 16.8 6.2 9.8 10.7 - 19,1Total loans 2/ 16.3 11.2 18.8(17.9)1/ 12.4(9.7)>/ 23.5(26.2)2/ 21.8(20.8)±/
Business loans 2/ 10.6 8.04/ 12,4 5.7 21.0 15.9Real estate loans 18.7 19.2 17.5 14.3 16.7 20.3Consumer loans 1/ 11.9 14.2 18.0 16.3 19.6 19.3
1/ Last Wednesday of month series.2/ Includes outstanding amounts of loans reported as sold outright by banks to their own
holding companies, affiliates, subsidiaries, and foreign branches.3// Adjusted to exclude an $800 million matched sale-purchase transaction by the Federal
Reserve on the last Wednesday of September.4/ Second quarter figures have been adjusted to exclude a reclassification of loans by
a major New York City bank in June.5/ Data revised to conform with major revisions in Consumer Credit statistics.6/ Adjusted to exclude a $300 million matched sale-purchase transaction by the Federal
Reserve on the last Wednesday of November.
II -7
which remained near the peak levels attained earlier in the year. However,
liquidity ratios at New York City banks declined moderately for the
second consecutive month while those at banks outside New York increased
slightly.
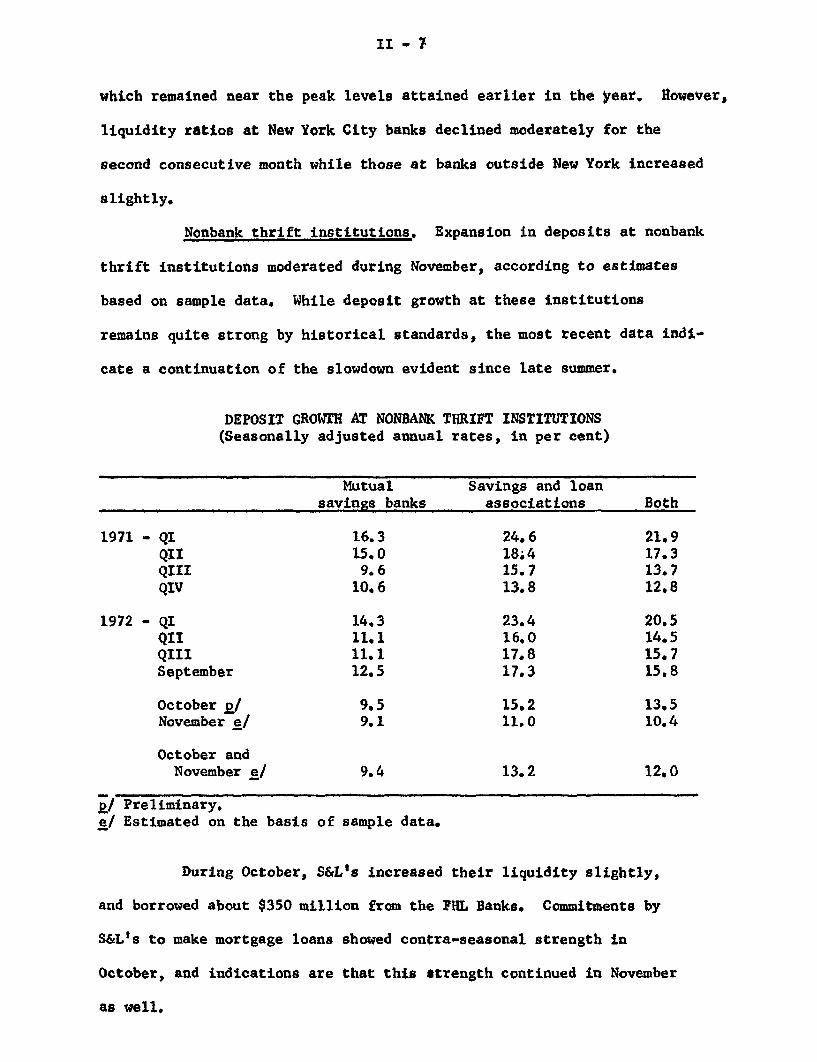
Nonbank thrift institutions. Expansion in deposits at nonbank
thrift institutions moderated during November, according to estimates
based on sample data. While deposit growth at these institutions
remains quite strong by historical standards, the most recent data indi-
cate a continuation of the slowdown evident since late summer.
DEPOSIT GROWTH AT NONBANK THRIFT INSTITUTIONS(Seasonally adjusted annual rates, in per cent)
Mutualsavings banks
1971 - QI 16.3QII 15.0QIII 9.6QIV 10.6
1972 - QI 14.3QII 11.1QIII 11.1September 12.5
October p/ 9.5November e/ 9.1
October andNovember e/ 9.4
p/ Preliminary.
e/ Estimated on the basis of sample data.
Savings and loanassociations
24. 618.415.713.8
23.416,017.817.3
15.211.0
13.2
During October, S&L's increased their liquidity slightly,
and borrowed about $350 million from the PHL Banks. Commitments by
S&L's to make mortgage loans showed contra-seasonal strength in
October, and indications are that this strength continued in November
as well.
Both
21.917.313.712.8
20.514.515.715.8
13.510.4
12.0
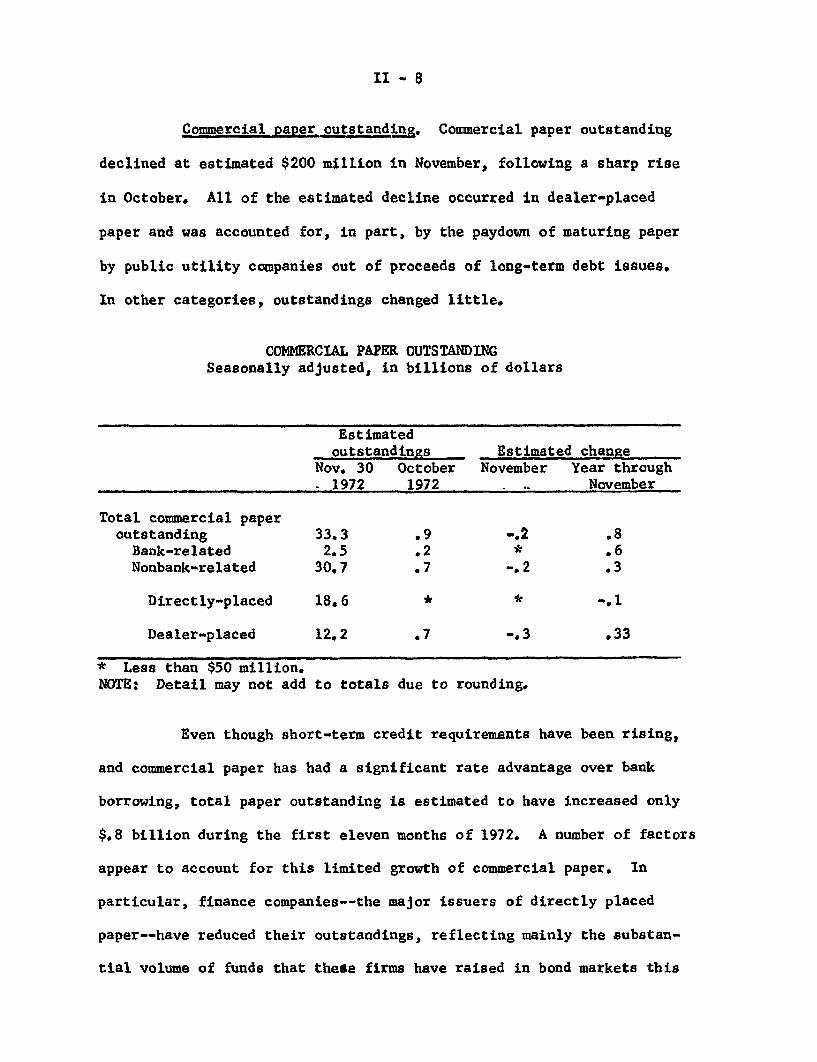
II - 8
Commercial paper outstanding. Commercial paper outstanding
declined at estimated $200 million in November, following a sharp rise
in October. All of the estimated decline occurred in dealer-placed
paper and was accounted for, in part, by the paydown of maturing paper
by public utility companies out of proceeds of long-term debt issues.
In other categories, outstandings changed little.
COMMERCIAL PAPER OUTSTANDINGSeasonally adjusted, in billions of dollars
Estimatedoutstandings Estimated change
Nov. 30 October November Year through1972 1972 November
Total commercial paperoutstanding 33.3 .9 -.2 .8
Bank-related 2.5 .2 * .6Nonbank-related 30.7 .7 -.2 .3
Directly-placed 18.6 * * -. 1
Dealer-placed 12.2 .7 -.3 .33
* Less than $50 million.NOTE: Detail may not add to totals due to rounding.
Even though short-term credit requirements have been rising,
and commercial paper has had a significant rate advantage over bank
borrowing, total paper outstanding is estimated to have increased only
$.8 billion during the first eleven months of 1972. A number of factors
appear to account for this limited growth of commercial paper. In
particular, finance companies--the major issuers of directly placed
paper--have reduced their outstandings, reflecting mainly the substan-
tial volume of funds that these firms have raised in bond markets this

II - 9
year. Prime industrial firms, the major users of dealer-placed paper,
apparently have been able to finance a large part of their working
capital needs from internally generated funds.
II - 10
Consumer credit. Consumer credit outstanding advanced by
a record seasonally adjusted annual rate of over $23 billion or
18 per cent in October, with widespread increases both by type of
credit and by type of lender. So far this year monthly growth in
credit has averaged a seasonally adjusted annual rate of $17.3 billion,
as compared with a $10.3 billion rate in the first 10 months of 1971.
Strong retail sales during October were reflected in consumer
instalment credit growth at an annual rate of $18.0 billion. Non-
automotive consumer goods debt rose at a record high rate of $7.4
billion, bolstered partly by continued heavy credit purchases of
appliances and other household items. Other major types of instal-
ment credit, except personal loans, showed somewhat smaller increases
than in September, but gains in noninstalment credit were larger.
Retail charge account balances--a form of noninstalment credit--
were up $1 billion, after declining $1.4 billion in September.
Commercial banks have continued to increase their share
of the consumer credit market. At the end of October, banks held
47.6 per cent of consumers' instalment receivables, an increase of
1.6 percentage points since the end of last year. Commercial banks
accounted for 54 per cent of the net increase in consumer instalment
credit that occurred in the first 10 months of 1972.
Consumer borrowing has been expanding relatively faster
than income for seven consecutive quarters and the ratio of instal-
ment credit extensions to disposable personal income reached a new
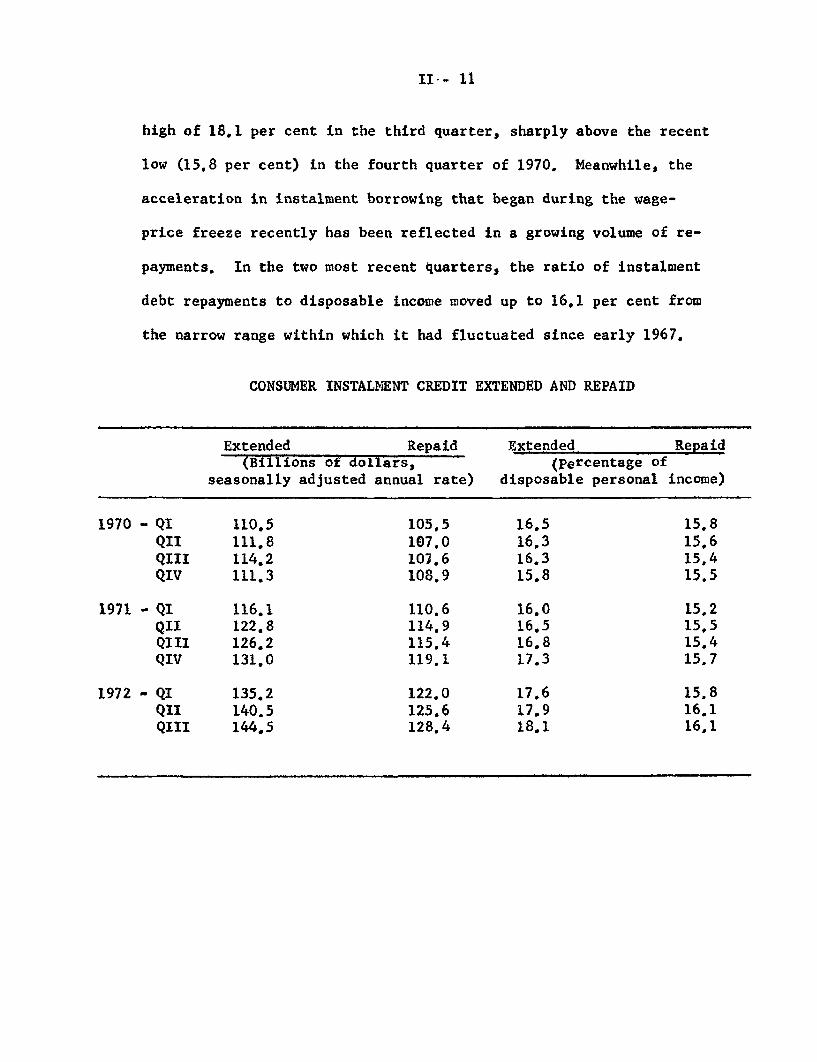
II - 11
high of 18.1 per cent in the third quarter, sharply above the recent
low (15.8 per cent) in the fourth quarter of 1970. Meanwhile, the
acceleration in instalment borrowing that began during the wage-
price freeze recently has been reflected in a growing volume of re-
payments. In the two most recent quarters, the ratio of instalment
debt repayments to disposable income moved up to 16.1 per cent from
the narrow range within which it had fluctuated since early 1967.
CONSUMER INSTALMENT CREDIT EXTENDED AND REPAID
Extended Repaid Extended Repaid(Billions of dollars, (Percentage of
seasonally adjusted annual rate) disposable personal income)
1970 - QI 110.5 105,5 16.5 15.8
QII 111.8 107.0 16.3 15.6
QIII 114.2 107.6 16.3 15,4QIV 111.3 108.9 15.8 15.5
1971 - QI 116.1 110.6 16.0 15.2QII 122.8 114.9 16.5 15.5QIII 126.2 115.4 16.8 15.4QIV 131,0 119.1 17.3 15.7
1972 - QI 135.2 122.0 17.6 15.8
QII 140.5 125.6 17.9 16.1QIII 144.5 128.4 18.1 16.1
II - 12
Repayments on outstanding consumer instalment debt may
already have reached the burdensome point for some marginal borrowers.
Delinquency rates on bank loans have risen steadily so far this year--
to the highest rate since 1949--and delinquencies on automobile loans
at finance companies have turned up slightly this fall. Delinquency
rates on bank loans are usually declining at this stage of a business
upturn.
II - 13
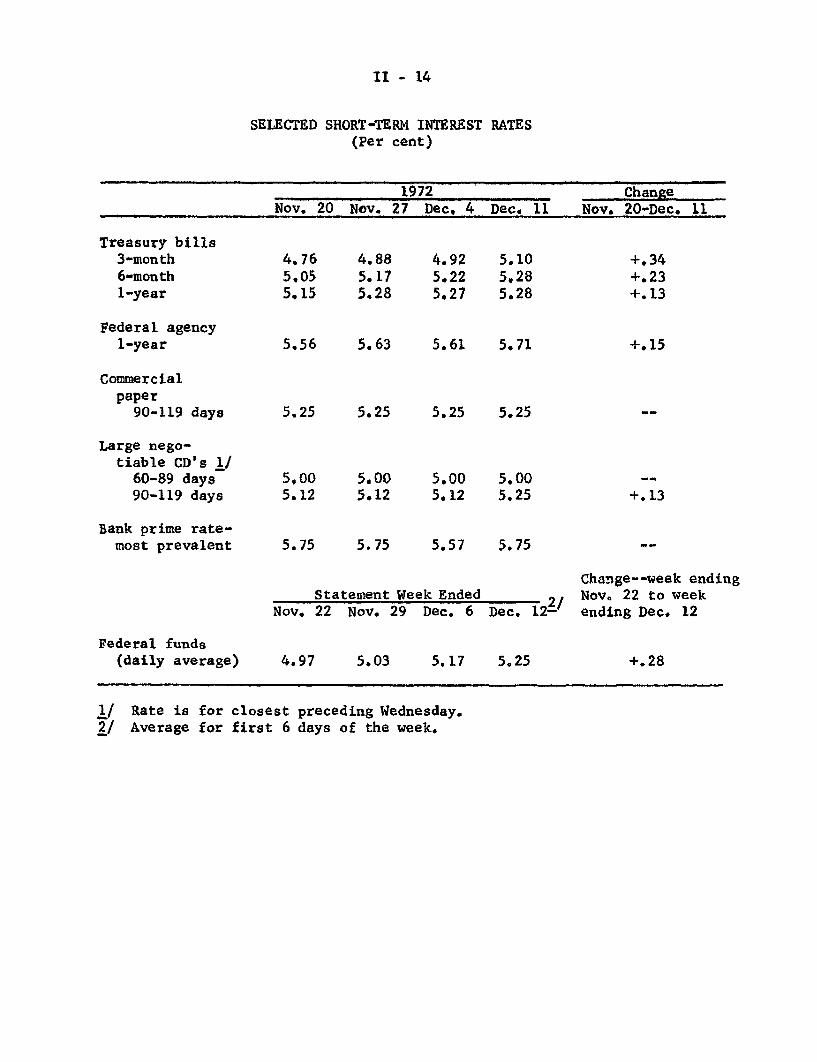
Short-term Interest Rates. Rates on Federal funds and short-
term Treasury bills have risen about 25 basis points since the November
meeting of the Committee, moving the yield on the 3-month bill up to
about 5.10 per cent--the highest level since announcement of the New
Economic Program in August 1971. While other short-term rates also
have risen generally since late November, their advance has lagged
behind the more sensitive Federal funds and short-term bill rates.
Short-term rates frequently show some seasonal advance in the
weeks just prior to Christmas. But this year seasonal advances have
been accentuated by the firming of money market conditions and sizeable
increases in the floating supply of bills. Since the November meeting,
the Treasury has issued $4.5 billion of tax anticipation bills, and
has or will add by the end of December nearly $1.3 billion to the supply
of regular weekly and monthly bills. In addition, from November 21
to date foreign central banks have been net sellers of about $600
million of bills in the market.
Recent growth in the supply of Treasury bills has also
contributed to a sharp build-upin dealer bill positions. To some extent
this apparently represents pre-positicning of inventories in anticipa-
tion of the temporary reinvestment of revenue sharing funds by State
and local governments. In the past week these governments have
received $2.7 billion of revenue sharing payments, and they will
receive an equivalent amount again in early January.
II - 14
SELECTED SHORT-TERM INTEREST RATES(Per cent)
1972 ChangeNov. 20 Nov. 27 Dec. 4 Dec. 11 Nov. 20-Dec. 11
Treasury bills3-month6-month1-year
Federal agency1-year
Commercialpaper
90-119 days
Large nego-tiable CD's 1/
60-89 days90-119 days
Bank prime rate-most prevalent
4,765.055.15
5.56
5.25
5,005.12
5.75
4.885.175.28
5.63
5.25
5.005.12
5.75
4.925.225.27
5.105.285.28
5.61 5.71
5.25 5.25
5.00 5.005.12 5.25
5.57 5.75
Statement Week EndedNov. 22 Nov. 29 Dec. 6 Dec. 12- /
Change--week endingNov. 22 to weekending Dec. 12
Federal funds(daily average) 4.97 5.03 5.17 5.25
Rate is for closest preceding Wednesday.Average for first 6 days of the week.
+.34+.23+.13
+.15
+.13
+.28
II - 15
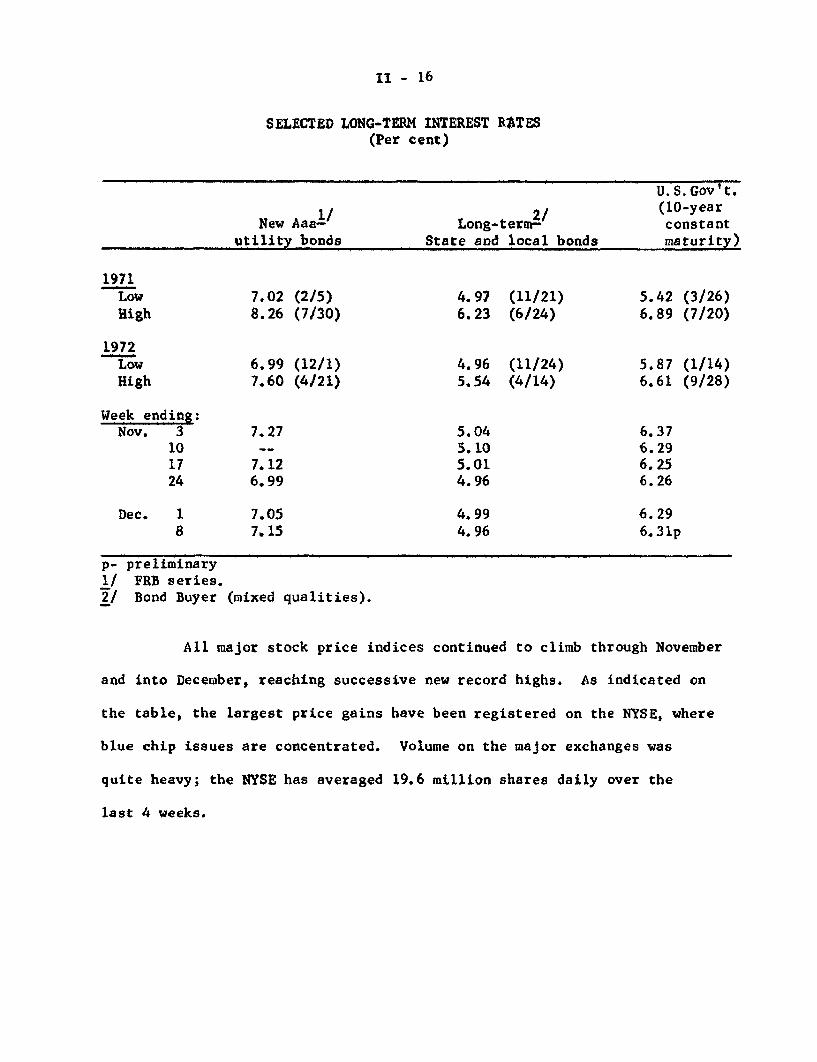
Long-term security markets. Recent advances of short-term
interest rates have been reflected in sympathetic rate increases in
most sectors of longer-term securities markets. Yields on intermediate-
and long-term U. S. Government securities have moved up 5 to 10 basis
points from their late November lows, and yields on newly issued
corporate bonds have risen about 15 basis points. The relatively
light fall calendar of corporate issues had encouraged underwriters
to price new offerings aggressively and pushed rates to the lowest
point of the year around late November. But institutional investors
resisted these low rates, and with the upturn in short rates, syndicates
on a number of recent offerings broke and led to somewhat higher
secondary market yields. Although tax-exempt yields have continued
to fluctuate narrowly around their lows for the year, underwriters and
dealers currently hold large amounts of unsold municipal bonds.
Apparently rates have held steady despite the rise in inventories
because dealers expect the large revenue-sharing payments to be
reflected both in some pay-off of maturing debt and a slowing in the
pace of new offerings.
II - 16
SELECTED LONG-TERM INTEREST RATES(Per cent)
U.S.Gov't.
1/ 2/ (10-yearNew Aaa- Long-term- constant
utility bonds State and local bonds maturity)
1971Low 7.02 (2/5) 4.97 (11/21) 5.42 (3/26)High 8.26 (7/30) 6.23 (6/24) 6.89 (7/20)
1972Low 6.99 (12/1) 4.96 (11/24) 5.87 (1/14)High 7.60 (4/21) 5.54 (4/14) 6.61 (9/28)
Week ending:Nov. 3 7.27 5.04 6.37
10 -- 5.10 6.2917 7.12 5.01 6.2524 6.99 4.96 6.26
Dec. 1 7.05 4.99 6.298 7.15 4.96 6.31p
p- preliminary1/ FRB series.2/ Bond Buyer (mixed qualities).
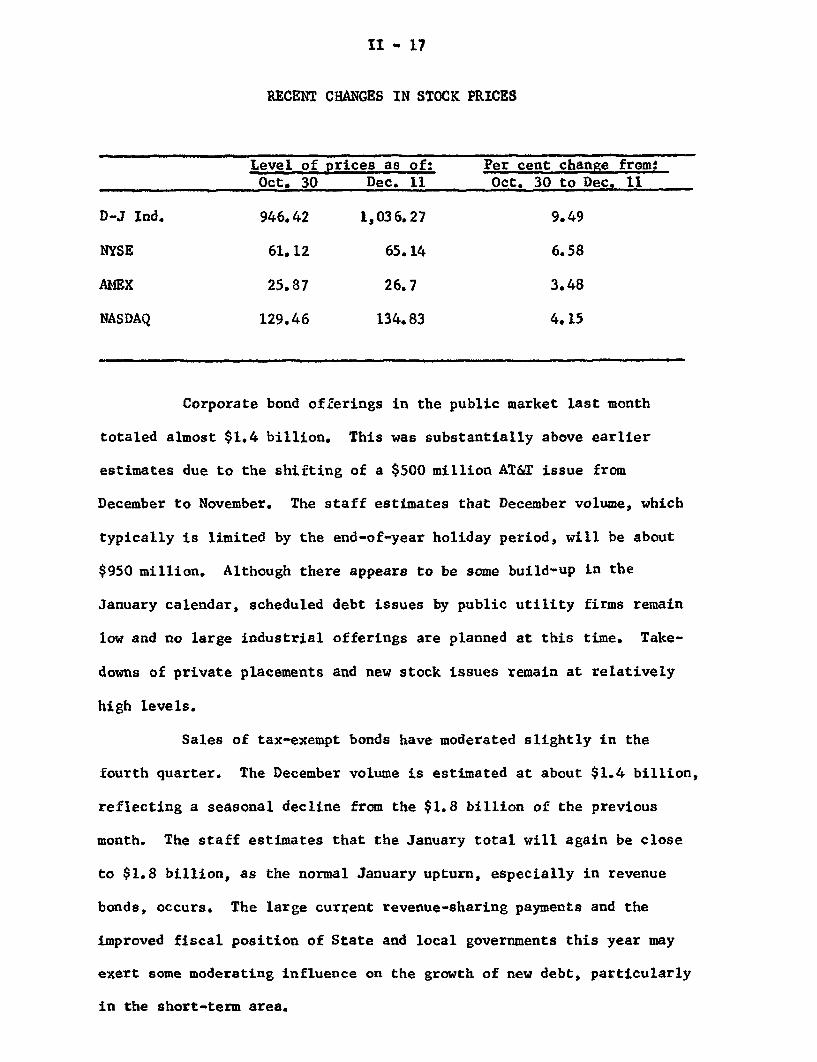
All major stock price indices continued to climb through November
and into December, reaching successive new record highs. As indicated on
the table, the largest price gains have been registered on the NYSE, where
blue chip issues are concentrated. Volume on the major exchanges was
quite heavy; the NYSE has averaged 19.6 million shares daily over the
last 4 weeks.
II - 17
RECENT CHANGES IN STOCK PRICES
Level of prices as of: Per cent change from:Oct. 30 Dec. 11 Oct. 30 to Dec. 11
D-J Ind. 946.42 1,036.27 9.49
NYSE 61.12 65.14 6.58
AMEX 25.87 26.7 3.48
NASDAQ 129.46 134.83 4.15
Corporate bond offerings in the public market last month
totaled almost $1.4 billion. This was substantially above earlier
estimates due to the shifting of a $500 million AT&T issue from
December to November. The staff estimates that December volume, which
typically is limited by the end-of-year holiday period, will be about
$950 million. Although there appears to be some build-up in the
January calendar, scheduled debt issues by public utility firms remain
low and no large industrial offerings are planned at this time. Take-
downs of private placements and new stock issues remain at relatively
high levels.
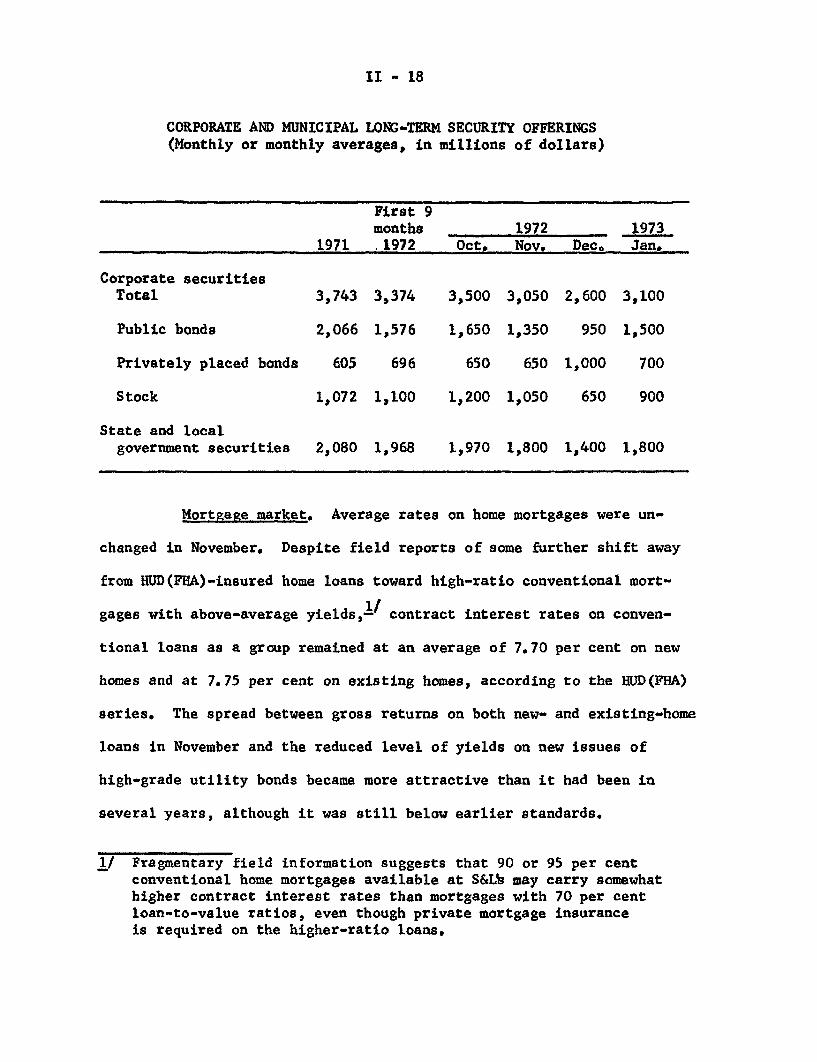
Sales of tax-exempt bonds have moderated slightly in the
fourth quarter. The December volume is estimated at about $1.4 billion,
reflecting a seasonal decline from the $1.8 billion of the previous
month. The staff estimates that the January total will again be close
to $1.8 billion, as the normal January upturn, especially in revenue
bonds, occurs. The large current revenue-sharing payments and the
improved fiscal position of State and local governments this year may
exert some moderating influence on the growth of new debt, particularly
in the short-term area.
II - 18
CORPORATE AND MUNICIPAL LONG-TERM SECURITY OFFERINGS(Monthly or monthly averages, in millions of dollars)
First 9months 1972 1973
1971 .1972 Oct. Nov. Dec. Jan.
Corporate securitiesTotal 3,743 3,374 3,500 3,050 2,600 3,100
Public bonds 2,066 1,576 1,650 1,350 950 1,500
Privately placed bonds 605 696 650 650 1,000 700
Stock 1,072 1,100 1,200 1,050 650 900
State and local
government securities 2,080 1,968 1,970 1,800 1,400 1,800
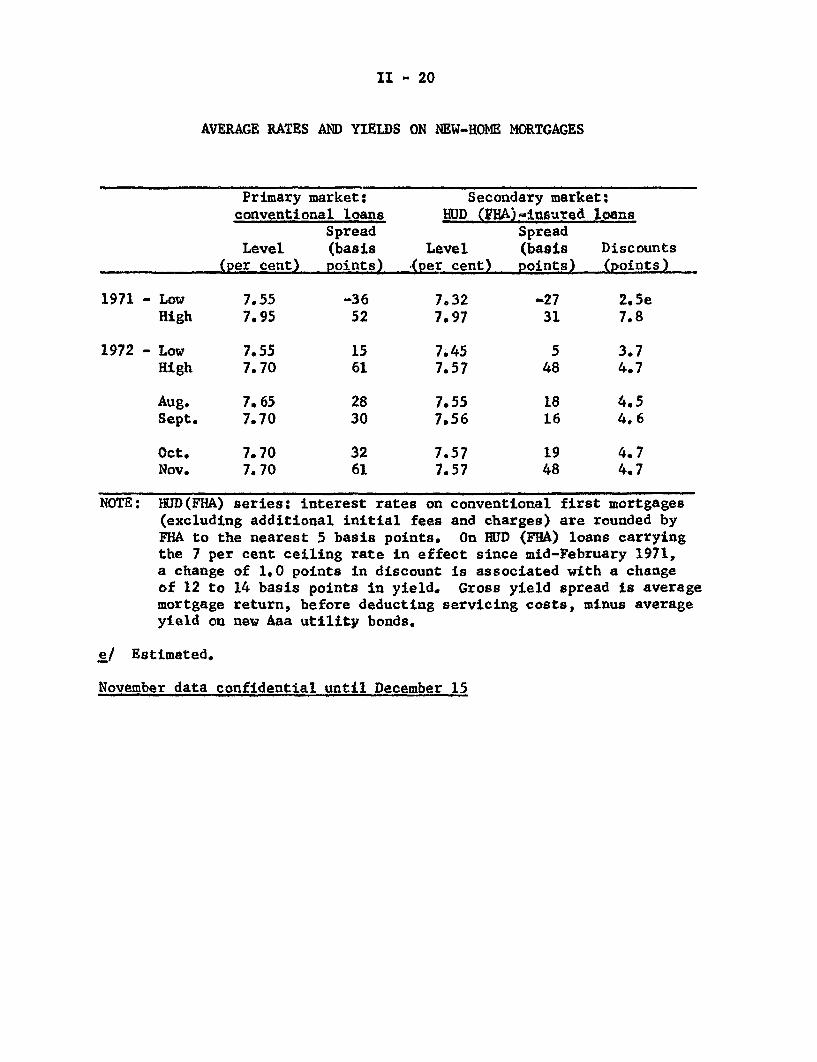
Mortgage market. Average rates on home mortgages were un-
changed in November. Despite field reports of some further shift away
from HUD(FHA)-insured home loans toward high-ratio conventional mort-
gages with above-average yields,1/ contract interest rates on conven-
tional loans as a group remained at an average of 7.70 per cent on new
homes and at 7.75 per cent on existing homes, according to the HUD(FHA)
series. The spread between gross returns on both new- and existing-home
loans in November and the reduced level of yields on new issues of
high-grade utility bonds became more attractive than it had been in
several years, although it was still below earlier standards.
1/ Fragmentary field information suggests that 90 or 95 per centconventional home mortgages available at S&L may carry somewhathigher contract interest rates than mortgages with 70 per centloan-to-value ratios, even though private mortgage insuranceis required on the higher-ratio loans.
II - 19
In the secondary market, yields remained at 7.57 per cent on
Government underwritten home mortgages. Secondary-market transactions
in conventional loans reportedly continued active. In the third quar-
ter conventional loans accounted for one-third of the volume of all
home mortgages purchased in the secondary market by reporting investors.
Based on bi-weekly information, a slight downtrend in secon-
dary market mortgage yields has been under way since early last month,
judging from results of FNMA's auction of forward commitments to pur-
chase FHA and VA loans. The average yield in the latest (December 11)
auction was 2 basis points below the level of November 27, and 5 basis
points below the recent October high. The volume of mortgages offered
to FNMA in the latest auction, while up slightly from the previous auc-
tion, was still quite low, suggesting the continuance of strong private
demand for FHA/VA loans and industry expectations of further increases
in mortgage prices over the near term.
During the third quarter, the average delinquency rate on
home mortgages (MBA series) increased to a new postwar high for the
quarter of 3.8 per cent. However, most of the rise was concentrated in
HUD(FHA)-insured loans, both subsidized and unsubsidized. On HUD(FHA)
Sec. 235 interest-rate-subsidy mortgages, where defaults are expected
to reflect the higher underwriting risks involved, the 30-day-and-over
delinquency rate reached a record 10.8 per cent.
II - 20
AVERAGE RATES AND YIELDS ON NEW-HOME MORTGAGES
Primary market: Secondary market:conventional loans HUD (FHA)-insured loans
Spread SpreadLevel (basis Level (basis Discounts
(per cent) points) (per cent) points) (points)
1971 - Low 7.55 -36 7.32 -27 2.5eHigh 7.95 52 7.97 31 7.8
1972 - Low 7.55 15 7.45 5 3.7High 7.70 61 7.57 48 4.7
Aug. 7.65 28 7.55 18 4.5Sept. 7.70 30 7.56 16 4.6
Oct. 7.70 32 7.57 19 4.7Nov. 7.70 61 7.57 48 4.7
NOTE: HUD(FHA) series: interest rates on conventional first mortgages(excluding additional initial fees and charges) are rounded byFHA to the nearest 5 basis points. On HUD (FHA) loans carryingthe 7 per cent ceiling rate in effect since mid-February 1971,a change of 1.0 points in discount is associated with a changeof 12 to 14 basis points in yield. Gross yield spread is averagemortgage return, before deducting servicing costs, minus averageyield on new Aaa utility bonds.
e/ Estimated.
November data confidential until December 15
II - 21
Federal finance. Preliminary evidence indicates that Federal
purchases of goods and services in the fourth quarter of calendar 1972
will be less than was projected in the chart show, with the shortfall
mainly occurring in the area of defense. Consequently, we have revised
downward our estimate of total Federal spending for fiscal year 1973 by
$1 billion, resulting in an NIA total expenditure estimate of $260.6
billion, and budget outlays of $252 billion. It is possible that the
$250 billion spending goal of the Administration can be achieved (even
while holding to this level of NIA spending) if, for example, sales of
financial assets by Federal agencies are increased. A case in point
is the sale of approximately $400 million in Participation Certificates
sponsored by the G.S.A., half of which was made in October and $227
million of which is expected to be announced in December. This sale
will allow the construction of Federal buildings without the incurrence
of budget outlays for construction costs. Moreover, the debt created
by the sale of these Participation Certificates will not be treated as
Federal debt, but rather as debt of the trustee.
The staff's estimate of receipts for fiscal year 1973 is
$226.5 billion, the same as reported in the November Greenbook. Given
our new outlays projection, the budget deficit for this fiscal year is
now estimated to be $25.5 billion.
We are projecting high employment deficits of $1.0 billion
for calendar 1972, $10.7 billion for fiscal 1973, and $8.0 billion for
calendar 1973. However, fiscal policy appears to be considerably less
II - 22
stimulative in this period when allowance is made for the surplus
expected in the State and local government sector. The Federal sector
projections show a strong shift toward fiscal restraint in the last
two quarters of calendar 1973, with the budget moving from a high
employment deficit of $16.2 billion (annual rate) in Q-II 1973 to a
surplus of $2.4 billion (annual rate) in Q-IV 1973. This shift is
partly attributable to the swing from large tax refunds in the first
half of calendar 1973 to overwithholding in the second half; in the
first half of calendar 1974 the budget is expected to shift again toward
deficit--by perhaps 10 billion dollars (annual rate)--because of another
large volume of tax refunds.
The end-of-November Treasury cash balance was $8.3 billion.
We anticipate an auctioning of a $2 billion two-year note in late
December, and continuation of additions to the weekly bill auctions at
least through January 25. Projected net cash borrowing in the first
quarter of calendar 1973 is nearly $8.0 billion, a record amount for
that period of the year.
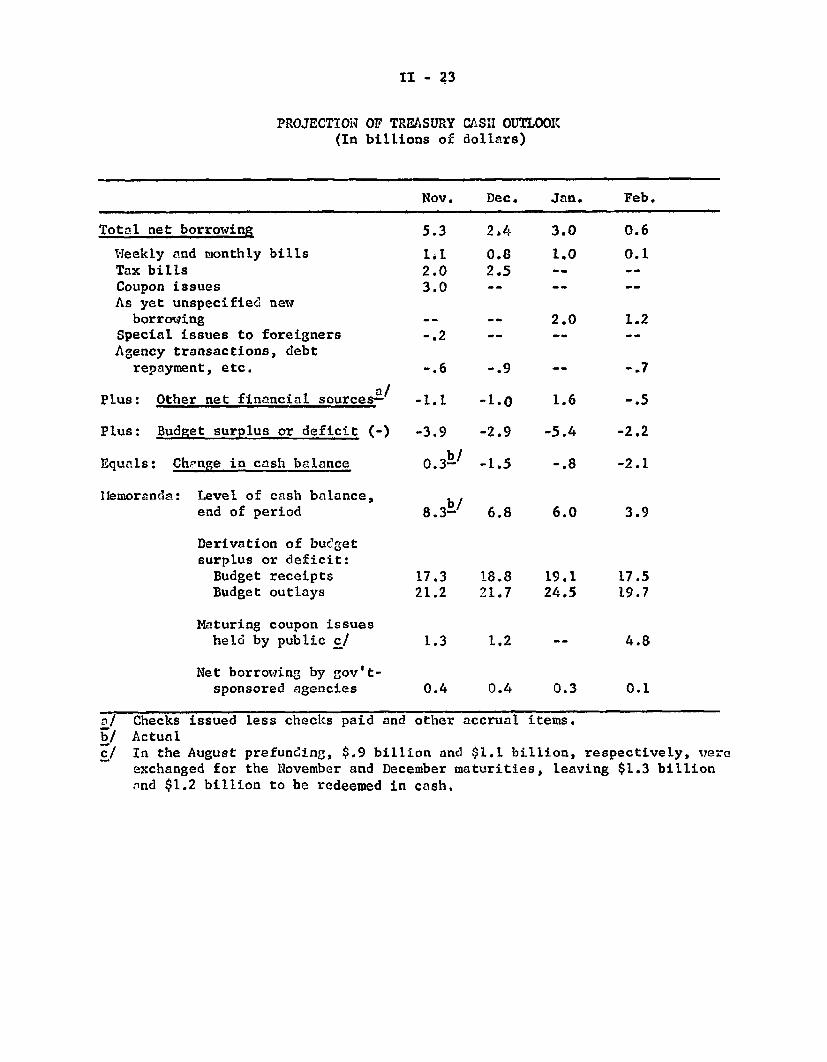
II - 23
PROJECTION OF TREASURY CASH OUTLOOK(In billions of dollars)
Nov. Dec. Jan. Feb.
Total net borrowing
Weekly and monthly billsTax billsCoupon issuesAs yet unspecified new
borrowingSpecial issues to foreignersAgency transactions, debt
repayment, etc.
Plus: Other net financial sources-
Plus: Budget surplus or deficit (-)
Equals: Change in cash balance
Memoranda: Level of cash balance,end of period
Derivation of budgetsurplus or deficit:
Budget receiptsBudget outlays
Maturing coupon issuesheld by public c/
Net borrowing by gov't-sponsored agencies
5.3
1.12.03.0
--
-.2
-. 6
-1.1
0.82.5
3.0
1.0
--
-- 2.0
-. 9 --
-1.0 1.6
-3.9 -2.9 -5.4
0. 3 b/
8.3
-1.5
6.8
-. 8
6.0
17.3 18.8 19.121.2 21.7 24.5
0.3
ChecksActual
issued less checks paid and other accrual items.
In the August prefunding, $.9 billion and $1.1 billion, respectively, wereexchanged for the November and December maturities, leaving $1.3 billionand $1.2 billion to be redeemed in cash.
0.6
0.1
1.2--
-2.2
-2.1
17.519.7
4.8
0.1
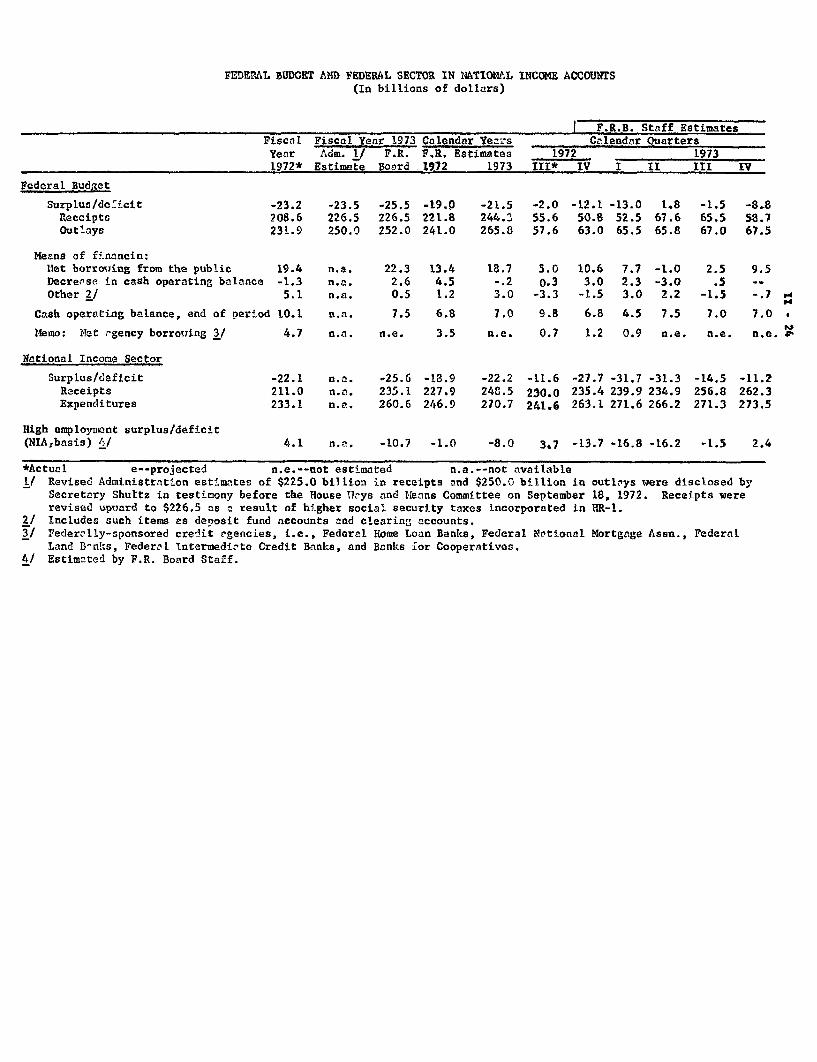
FEDERAL BUDGET AND FEDERAL SECTOR IN NATIONAL INCOME ACCOUNTS(In billions of dollars)
I F.R.B. Staff EstimatesFiscal Fiscal Year 1973 Calendar Years Calendar QuartersYear Adm. I/ F.R. F.R. Estimates 1972 19731972* Estimate Board 1972 1973 III* IV I II III IV
Federal Budget
Surplus/deicitReceiptsOutlays
Means of financin:Het borrowing from the publicDecrease in cash operating balanceOther 2/
-23.2208.6231.9
19.4-1.3
5.1
Cash operating balance, end of period 10.1
Memo: Net rgency borrowing 3/ 4.7
-23.5226.5250.0
-25.5226.5252.0
n.a. 22.3n.a. 2.6n.a. 0.5
-19.0221.8241.0
13.44.51.2
-21.5244.3265.8
-2.055.657.6
-12.150.863.0
18.7 5.0 10.6-. 2 0.3 3.03.0 -3.3 -1.5
-13.052.565.5
1.867.665.8
7.7 -1.02.3 -3.03.0 2.2
7.5 6.8 7.0 9.8 6.8 4.5 7.5
-1.565.567.0
-8.858.767.5
2.5 9.5.5 -
-1.5 -. 7 o
7.0 7.0 1
n.a. n.e. 3.5 n.e. 0.7 1.2 0.9 n.e. n.e. ne. ss
National Income Sector
Surplus/deficitReceiptsExpenditures
-22.1211.0233.1
n.a. -25.6n.a. 235.1n.a. 260.6
-18.9227.9246.9
-22.2248.5270.7
-11.6 -27.7230.0 235.4241.6 263.1
-31.7 -31.3 -14.5239.9 234.9 256.8271.6 266.2 271.3
High employment surplus/deficit(NIAbasis) 1/ 4.1 n.a. -10.7 -1.0 -8.0 3.7 -13.7 -16.8 -16.2 -1.5
*Actual e--projected n.e.--not estimated n.a.--not available1/ Revised Administration estimates of $225.0 billion in receipts and $250.0 billion in outlays were disclosed by
Secretary Shultz in testimony before the House Ways and Means Committee on September 18, 1972. Receipts wererevised upward to $226.5 as a result of higher social security taxes incorporated in HR-1.
2/ Includes such items as deposit fund accounts and clearing accounts.3/ Federally-sponsored credit agencies, i.e., Federal Home Loan Banks, Federal National Mortgage Assn., Federal
Land Banks, Federal Intermediate Credit Banks, and Banks for Cooperatives.4/ Estimated by F.R. Board Staff.
-11.2262.3273.5

INTERNATIONALDEVELOPMENTS
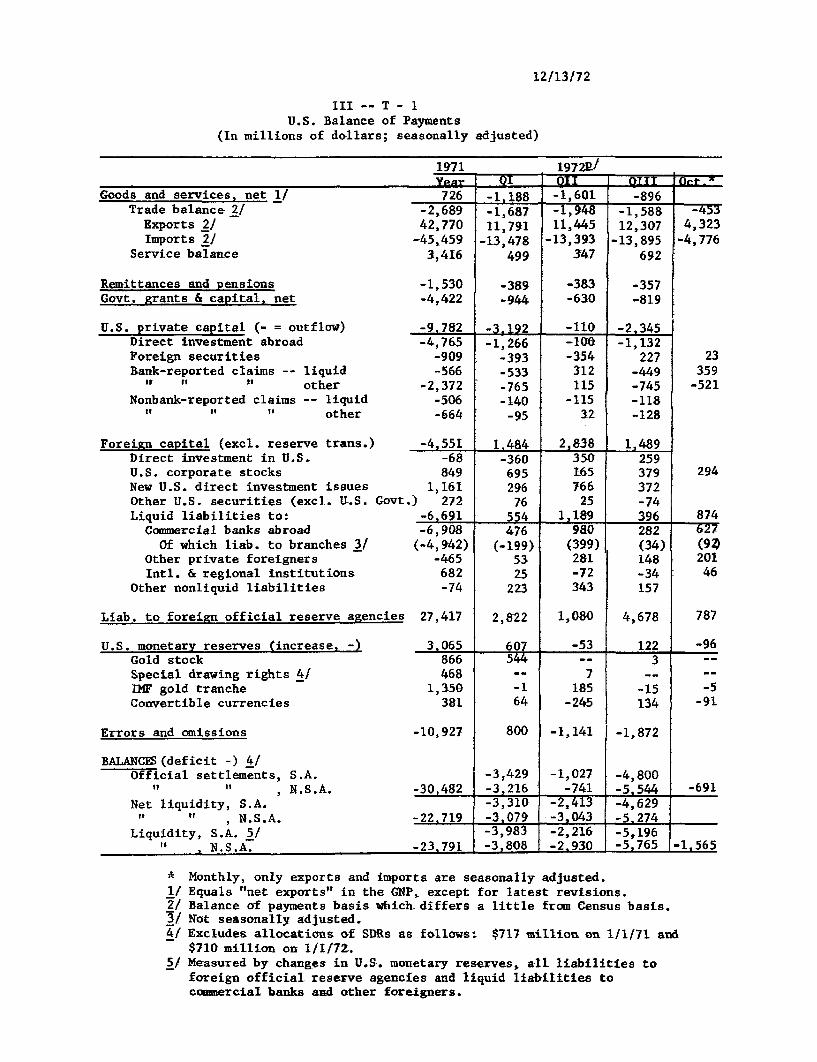
-23.791
12/13/72
III -- T -U.S. Balance of Payments
(In millions of dollars; seasonally adjusted)
1971 1972p/YPnar Qt I OT I TT tOt.726
-2,68942,770
-45,4593,416
-1,530-4,422
-9 7R2
-1. 18 -1,601 -896- -8 6
-1,68711,791-13,478
499
-389-944
- 1Q9
-1,94811,445
-13,393347
-383-630
-110
-1,58812,307
-13,895692
-357-819
-2 3L5i
-4,765 -1,266 -100 -1,132-909 -393 -354 227-566 -533 312 -449
-2,372 -765 115 -745-506 -140 -115 -118-664 -95 32 -128
-4,551 1.484 2,838 1,489-68849
1,161Govt.) 272
-6.691
-36069529676iUS
35016576625
1.189
Goods and services, net 1/Trade balance 2/
Exports 2/Imports 2/
Service balance
Remittances and pensionsGovt. grants & capital, net
U.S. private capital (- = outflow)Direct investment abroadForeign securitiesBank-reported claims -- liquid
t " " otherNonbank-reported claims -- liquid
" " " other
Foreign capital (excl. reserve trans.)Direct investment in U.S.U.S. corporate stocksNew U.S. direct investment issuesOther U.S. securities (excl. U.S.Liquid liabilities to:
Commercial banks abroadOf which liab. to branches 3/
Other private foreignersIntl. & regional institutions
Other nonliquid liabilities
Liab. to foreign official reserve agencies
U.S. monetary reserves (increase, -)Gold stockSpecial drawing rights 4/IMF gold trancheConvertible currencies
Errors and omissions
BALANCES (deficit -) 4/Official settlements, S.A.
" " , N.S.A.Net liquidity, S.A." " , N.S.A.
Liquidity, S.A. 5/SSIA
-4534,323
-4,776
23359-521
294
-6,908 476 980 282 677(-4,942) (-199) (399) (34) (94
-465 53 281 148 201682 25 -72 -34 46-74 223 343 157
27,417 2,822 1,080 4,678 787
3,065 607 -53 122 -96866 544 -- 3468 -- 7 --
1,350 -1 185 -15 -5381 64 -245 134 -91
-10,927 800 -1,141 -1,872
-3,429 -1,027 -4,800-30,482 -3,216 -741 -5.544 -691
-3,310 -2,413 -4,629-22.719 -3,079 -3,043 -5,274
-3,983-3.808
-2,216-2 930
-5,196-5.765 -1-565
* Monthly, only exports and imports are seasonally adjusted.1/ Equals "net exports" in the GNP, except for latest revisions.2/ Balance of payments basis which differs a little from Census basis.3/ Not seasonally adjusted.4/ Excludes allocations of SDRs as follows: $717 million on 1/1/71 and
$710 million on 1/1/72.5/ Measured by changes in U.S. monetary reserves, all liabilities to
foreign official reserve agencies and liquid liabilities tocommercial banks and other foreigners.
III - 1
INTERNATIONAL DEVELOPMENTS
Summary and outlook. Exchange markets have not encountered
any major disturbances in the past month and the dollar has been firm.
The Japanese yen has continued to be strong, reflecting a huge trade
surplus, though revaluation rumors have tended to subside. Some
downward pressure developed on the Italian lira (reflecting political
uncertainties and rising interest rates elsewhere in Europe) and the
Canadian dollar (partly reflecting a drop in deposit rates of Canadian
banks).
The over-all U.S. balance of payments deficit on the official
settlements basis apparently was about $300 million in November, and
has averaged about $400 million a month since the end of the speculative
flurry in late June and early July. On the liquidity basis the monthly
deficits since July have averaged about $1 billion. The official
settlements deficit has been held below the liquidity deficit by large
borrowings from the Euro-dollar market, mainly by the agencies and
branches of foreign banks in this country.
The deficit in the basic balance (current account plus long-
term capital) in the third quarter, according to confidential pre-
liminary tabulations, was at an annual rate of about $9.0 billion --
slightly higher than in the second quarter. In the fourth quarter a
further improvement in the trade balance is occurring, as well as
heavy foreign purchases of U.S. corporate stocks. These factors should
III - 2
serve to offset an increase in outflows for direct investment; the
customary fourth-quarter window dressing reflows of direct investment
funds may be small this year, since the outflows in the first three
quarters were relatively low.
In most other industrial countries a striking feature of
the current situation is the continuing high price inflation and
the policy response, generally relying heavily on tighter monetary
policy. Interest rates have been rising steeply -- apart from a few
countries, especially Canada and Japan where economic activity is
still substantially below par. So far these measures do not seem to
have resulted in increases in interest rates (taking into account
forward exchange rates) sufficient to induce major disequilibrating
capital flows. Of course the barriers to inflows of capital established
in many countries earlier in the year are helping to deter such move-
ments.
Foreign exchange markets. Exchange markets turned fairly
active toward the end of November, following the latest round of
restrictive monetary actions in Europe and a move toward lower interest
rates in Canada (see pp. III -14-15).
The German mark advanced by nearly 1/2 percent and the Swiss
franc by 3/4 percent between November 24 and December 1, but, since
both currencies were initially well away from their upper limits,
neither central bank was required to intervene. The restrictive monetary
III - 3
measures elsewhere in Europe served to increase the selling pressures
on the Italian lira, already regarded by the market as a fairly
weak currency. On November 30 and December 1, rumors circulated in
the markets concerning a possible floating of the lira, or at least
allowing it to drop out of the EC narrow band, and heavy Bank of Italy
intervention support was required to keep the lira within the band.
On Monday, December 4, the Bank of Italy announced an increase in its
rate for fixed-term advances and offered to purchase dollars from
Italian commercial banks on a swap basis at rates favorable to the
banks. These two actions seemed to have had a calming influence on
the market, and the selling pressures abated. It would appear that
the Bank of Italy's swap dollar purchases in the week ending December 8
were nearly sufficient to finance its reserve losses of the previous
week. As the speculation against the lira subsided, the mark and the
Swiss franc turned easier, and by December 8, those two currencies had
lost almost half of their previous week's gain.
Among other major European currencies, sterling and the French
franc eased moderately over the past few weeks, despite interest rate
increases in the U.K. and France in line with those elsewhere in Europe.
The softness of the French franc has generally been attributed to the
market's uneasiness over political opinion polls which show large gains
for the left-wing parties at the expense of the Gaullist government.
While interest rates in Europe were rising, a move toward
lower interest rates in Canada precipitated heavy market sales of
III - 4
Canadian dollars. Between November 27 and December 7, the Bank of
Canada sold U.S. $300 million, while the exchange rate declined from
101.20 to 99.84. Subsequently, the Canadian dollar stabilized,
the rate moved back above 100.00 on December 12, and the Bank of
Canada purchased nearly U.S. $150 million on December 12 and 13.
The Bank of Japan has continued to purchase on the order of
$40 - $50 million per day, and six-month forward yen continue to trade
at about 10 percent above par.
The System repaid an additional $15 million equivalent of
Belgian franc and $30 million equivalent of Swiss franc swap drawings
between November 15 and December 13, using balances previously pur-
chased in the market. Outstanding swaps in Belgian and Swiss francs
now total $435 million and $1,170 million equivalent, respectively.
Euro-dollar market. Rates on most maturities of dollar
deposits abroad came under upward pressure in the final week of
November, mostly in reaction to discount rate increases by several
European central banks in addition to seasonal factors. In the period
from November 22 to December 1 the discount rate was increased in
Belgium (1/2 percent), France (1 percent) and Germany (1/2 percent)
and the Bank of England raised its new "minimum lending rate by
1/4 percent. These actions caused Euro-dollar rates to advance,
their impact being felt largely because they confirmed earlier
increases in market rates in those countries and called attention to
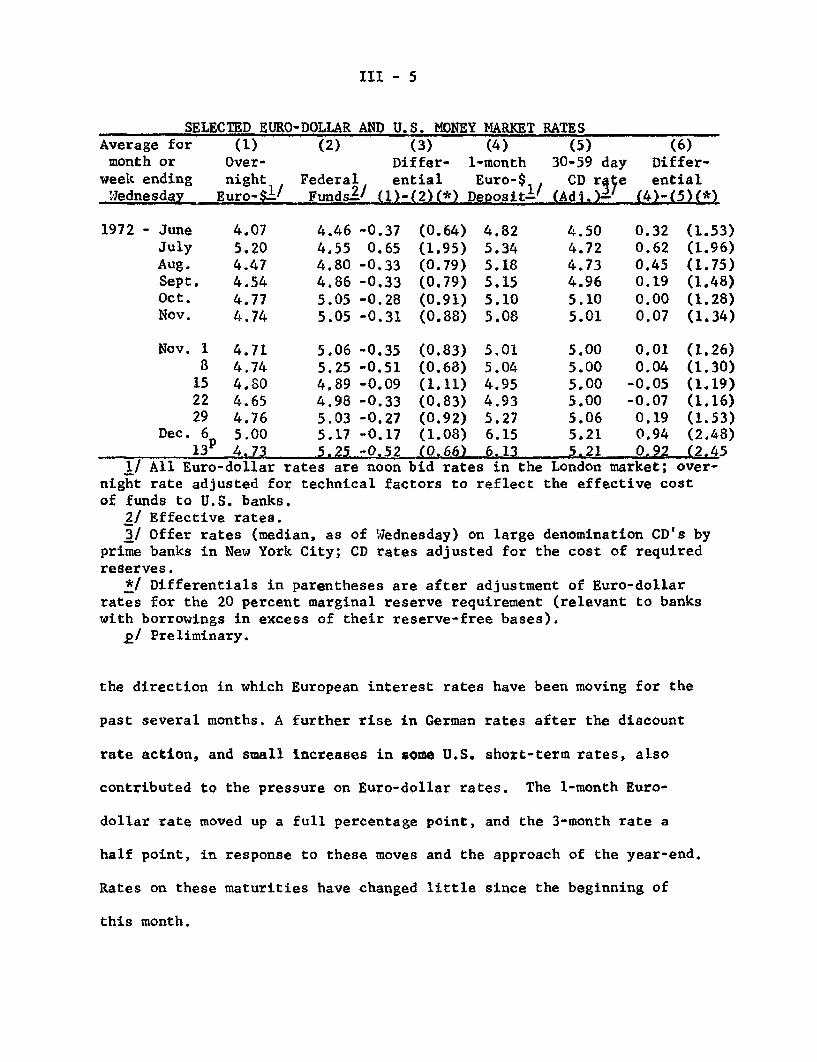
III - 5
SELECTED EURO-DOLLAR AND U.S. MONEY MARKET RATESAverage for (1) (2) (3) (4) (5) (6)month or Over- Differ- 1-month 30-59 day Differ-
week ending night Federal ential Euro-$ CD rate entialWednesday Euro-$/ Funds2/ (1)-(2)(*) Depositl/ (AdJ.)-' (4)-(5)(*)
1972 - June 4.07 4.46 -0.37 (0.64) 4.82 4.50 0.32 (1.53)July 5.20 4.55 0.65 (1.95) 5.34 4.72 0.62 (1.96)Aug. 4.47 4.80 -0.33 (0.79) 5.18 4.73 0.45 (1.75)Sept. 4.54 4.86 -0.33 (0.79) 5.15 4.96 0.19 (1.48)Oct. 4.77 5.05 -0.28 (0.91) 5.10 5.10 0.00 (1.28)Nov. 4.74 5.05 -0.31 (0.88) 5.08 5.01 0.07 (1.34)
Nov. 1 4.71 5.06 -0.35 (0.83) 5.01 5.00 0.01 (1.26)8 4.74 5.25 -0.51 (0.68) 5.04 5.00 0.04 (1.30)15 4.80 4,89 -0.09 (1.11) 4.95 5.00 -0.05 (1,19)22 4.65 4.98 -0.33 (0.83) 4.93 5.00 -0.07 (1.16)29 4.76 5.03 -0.27 (0.92) 5.27 5.06 0.19 (1.53)
Dec. 6 5.00 5.17 -0.17 (1.08) 6.15 5.21 0.94 (2.48)413 4.73 5. 25 .-0.52 (0,66) 6.13 5.21 0.92 (2.45
1/ All Euro-dollar rates are noon bid rates in the London market; over-night rate adjusted for technical factors to reflect the effective cost
of funds to U.S. banks.2/ Effective rates.3/ Offer rates (median, as of Wednesday) on large denomination CD's by
prime banks in New York City; CD rates adjusted for the cost of requiredreserves.
*/ Differentials in parentheses are after adjustment of Euro-dollarrates for the 20 percent marginal reserve requirement (relevant to bankswith borrowings in excess of their reserve-free bases).
p/ Preliminary.
the direction in which European interest rates have been moving for the
past several months. A further rise in German rates after the discount
rate action, and small increases in some U.S. short-term rates, also
contributed to the pressure on Euro-dollar rates. The 1-month Euro-
dollar rate moved up a full percentage point, and the 3-month rate a
half point, in response to these moves and the approach of the year-end.
Rates on these maturities have changed little since the beginning of
this month.
III - 6
Even with their recent rise Euro-dollar rates are not
generally above levels that prevailed in the third quarter (after
allowing for the tendency of rates to harden at this time of the
year), and this despite the substantial increases in short-term
rates in European national markets in recent months. Euro-dollar
rates declined during most of October and November. A principal
explanation for this is the strengthening of the forward dollar that
has occurred since last summer on the exchange markets, partly
generated by greater confidence in the continuation of present dollar
parities. The reduced discounts or higher premiums on the forward
dollar vis-à-vis other currencies have prevented or minimized
incentives to shift funds from the Euro-dollar market to the Euro-DM
market and to European national markets. In addition, the supply of
Euro-dollars presumably has continued to be augmented by infusions of
dollars from official institutions in Japan.
The cost to U.S. banks of borrowing reserve-free Euro-dollars,
relative to issuing CD's of comparable maturity, has increased to
about 90 and 75 basis points, respectively, for 1-month and 3-month
Euro-dollars. But the differential favoring overnight Euro-dollars
over Federal funds has continued, and has widened in the past week
to about 1/2 percent. Banks' liabilities to their foreign branches
have continued at about the level of their reserve-free bases.
III - 7
Balance of payments. The over-all balance on the official
settlements basis registered a deficit of about $300 million in
November, following an October deficit of $750 million (not seasonally
adjusted). Average monthly deficits since the speculative crisis in
June-July have been about $400 million, with considerable monthly
variation. On the liquidity basis the November deficit was probably
about $800 million -- down from $1.5 billion in October -- and for the
four months August-November the monthly average was over $1 billion.
The difference between these liquidity and official settlements deficits
results from increased borrowings by U.S. agencies and branches of
foreign banks from foreign money markets. These inflows are largely
from the Euro-dollar market where very short-term interest rates remain
below the rates on Federal funds.
Details on international transactions in October and November
are sparse. As noted below, the trade deficit was further reduced in
October (November data are not yet available), and lending by U.S.
banks to foreigners appears to have been moderate in both October and
November. Foreign purchases of U.S. corporate stocks were extremely
large; preliminary data indicate net purchases of $300 million in
October and again in November. These would be the largest monthly
purchases since last December and indicates increased confidence of
III - 8
foreigners in the U.S. economy. Foreign purchases of U.S. bonds in
October and November were about the same as the average monthly amounts
purchased in the third quarter.
Relatively complete data for the third quarter balance of
payments accounts indicate that the deficit in the basic balance
(current account plus private long-term capital flows) was nearly
$9 billion at an annual rate, moderately larger than in the second quarter.
There were contrary movements in the current and capital accounts. The
balance on goods and services showed marked improvement as the trade
deficit fell by $1-1/4 billion (at annual rate) while the net surplus
on income and services increased. Private long-term capital flows,
however, were less favorable than in the second quarter; direct
investment outflow by U.S. companies recovered from the exceptionally
low amount reported in the second quarter and there was some reduction
in foreign purchases of the offshore bond issues of U.S. corporations.
For the first three quarters of the year the basic balance
was a deficit of $7.7 billion (not at an annual rate) -- about the same
as in the like period of 1971. Within this total the balance on
goods and services worsened by nearly $5 billion, mainly because of
the deepening of the trade deficit. However, this was nearly matched
by a $4 billion reduction in outflows of long-term private capital.
III - 9
Of this improvement, about $1-1/2 billion resulted from lower outflows
of U.S. private long-term capital and about $2-1/2 billion from
larger inflows of foreign private capital.
Flows of short-term private capital have been erratic this
year. Sizable inflows during calm periods in the exchange markets
(induced by U.S. and foreign interest rate differentials) were offset
by outflows during market disruptions, as in the June-July period.
Recorded flows of private short-term capital showed a small net inflow
for the first nine months of the year. On the other hand, short-
term outflows (largely speculative) are probably reflected in the
residual errors and omission item which was negative by $1 and $2 billion,
respectively, in the second and third quarters. Such speculative
outflows were probably concentrated at the end of the second quarter
and the first part of the third quarter. It should be noted that the
third quarter data are still preliminary estimates for many items.
U.S. foreign trade. The U.S. trade balance improved in
October as exports rose more than imports. For the two months
September-October the trade deficit was at an annual rate of $5-1/2 billion
(balance of payments basis). Though still high, the trade deficit in
the last two months is considerably below the peak level of $7-3/4
billion recorded in the second quarter of the year.
The pattern of changes in U.S. trade in October was about the
same as that of the third quarter. Prices (unit-value) of imports
III - 10
continued their upward movement, accounting for more than one-third of
the increased value of October imports. The rise in prices of imported
finished goods in October was particularly strong, mainly in consumer
durable items. Although unit-value indexes customarily show considerable
month-to-month variations, the strong rise in the index for finished
manufactures in October suggests either a greater pass-through of the
effects of the exchange rate changes of last year, increased internal
prices abroad, or a combination of the two.
In contrast, prices (unit-values) of exports rose only
marginally from September to October, so that almost all of the increased
value of exports in October was in real terms. Export prices of
wheat and corn rose sharply in October, partly from the reduction of
the wheat export subsidy and its termination in September, and
partly because of higher domestic grain prices following the grain
sales to the Soviet Union. The increase in foodstuffs prices was offset
by a decline in prices of exports of finished manufactures and crude
materials.
As in the third quarter, the expansion in exports in October
continued to be broadly based by commodities. Shipments of agricultural
commodities -- soybeans, tobacco, cotton -- accounted for nearly two-
fifths of the total export rise, and reached an annual rate of over
$10 billion compared to less than $8 billion in calendar 1971. Exports
III - 11
of agricultural commodities to Western Europe and Japan rose strongly
but grain exports to the Soviet Union did not increase. There were
small shipments of wheat to Communist China in September and October.
Exports of machinery and nonagricultural industrial materials
(particularly chemicals and metals) also expanded further in October.
Foreign orders for machinery have been strong; in July-October the value of
such orders averaged about 15 percent higher than in the first half
of the year, and the backlog of unfilled orders has begun to rise.
Deliveries of commercial aircraft also picked up in October from the
relatively low level of the third quarter as initial deliveries of the
DC-10 were made to foreign airlines. Exports of nonfood consumer goods
(other than autos), which have ordinarily been stable (and relatively
small) among U.S. export categories, rose again in October following
a moderate gain in the third quarter. By areas, the most significant
advance in exports in October was in shipments to Japan. Large
shipments of agricultural commodities accounted for about half of the
increase to that country, but exports of non-agricultural materials
continued to expand above the already high third-quarter levels.
The increase in value of imports in October was, as in the
immediately preceding months, largely in industrial materials. Imports
of fuels fell back from their record September value but still remain
high relative to past periods. Imports of steel and other metals,
paper and lumber all continued to rise. Imports of finished goods --
III - 12
capital goods and consumer goods (other than automobiles) -- were
generally flat and unchanged from their third quarter levels. Imports
of autos, particularly from Europe, were up sharply in October from the
relatively low level of September, but were no higher than the monthly
average of the third quarter. Dealer sales of foreign cars in the
United States rose steeply in November, however, and accounted for a
larger share of total domestic car sales than they have in recent months.
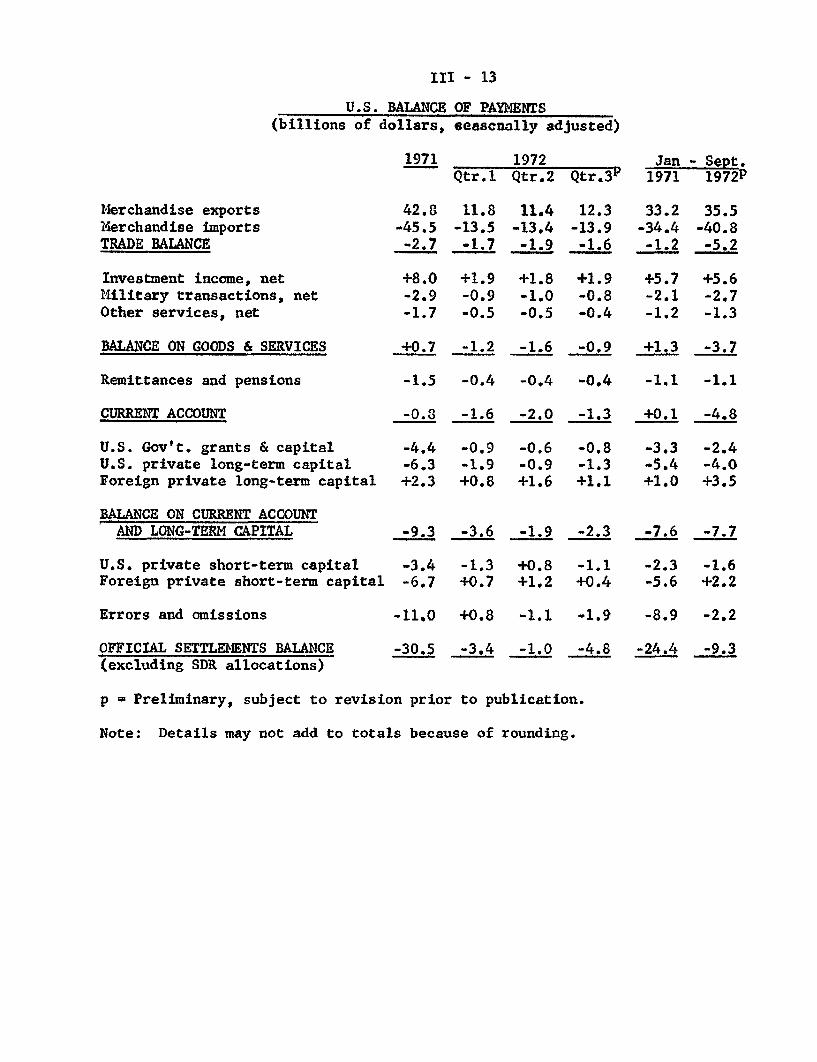
III - 13
U.S. BALANCE OF PAYMENTS(billions of dollars, seasonally adjusted)
1971
Merchandise exportsMerchandise importsTRADE BALANCE
Investment income, netMilitary transactions, netOther services, net
BALANCE ON GOODS & SERVICES
Remittances and pensions
CURRENT ACCOUNT
U.S. Gov't. grants & capitalU.S. private long-term capitalForeign private long-term capital
BALANCE ON CURRENT ACCOUNTAND LONG-TERM CAPITAL
U.S. private short-term capitalForeign private short-term capital
Errors and omissions
OFFICIAL SETTLEMENTS BALANCE(excluding SDR allocations)
42.8-45.5-2.7
+8.0-2.9-1.7
+0.7
-1.5
-0.8
-4.4-6.3+2.3
-9.3
-3.4-6.7
-11.0
-30.5
Qtr.1
11.8-13.5-1.7
+1.9-0.9-0.5
-1.2
-0.4
-1.6
-0.9-1.9+0.8
-3.6
-1.3+0.7
+0.8
-3.4
1972Qtr.2
11.4-13.4-1.9
+1.8-1.0-0.5
-1.6
-0.4
-2.0
-0.6-0.9+1.6
-1.9
+0.8+1.2
-1.1
-1.0
Qtr.3v
12.3-13.9-1.6
+1.9-0.8-0.4
-0.9
-0.4
-1.3
-0.8-1.3+1.1
-2.3
-1.1+0.4
-1.9
-4.8
Jan - Sept.1971 1972P
33.2 35.5-34.4 -40.8-1.2 -5.2
+5.7 +5.6-2.1 -2.7-1.2 -1.3
+1.3 -3.7
-1.1 -1.1
+0.1 -4.8
-3.3 -2.4-5.4 -4.0+1.0 +3.5
-7.6
-2.3-5.6
-8.9
-24.4
-7.7
-1.6+2.2
-2.2
-9.3
p = Preliminary, subject to revision prior to publication.
Note: Details may not add to totals because of rounding.
III - 14
Interest rate developments in selected countries. Short-
term interest rates have been rising in the major European countries,
with particularly sharp increases in Germany, the United Kingdom and
France. In Canada and a few smaller European countries, such as
Sweden and Denmark, rates have remained relatively flat in recent
months, while in Japan, some short-term rates in December increased
slightly. (See Table 1.)
The upward trend in rates earlier this fall was mainly a
reflection of rising economic activity which generated a stronger demand
for funds. Recently, however, monetary authorities have moved to
tighten policy, partly reflecting a concerted move by the EEC countries
to slow the persistent price inflation. Central bank discount rates
have been increased since October in Germany, France, Belgium, the
Netherlands and Austria, and the new minimum lending rate of the Bank
of England also increased. Italy also increased one of its Lombard
rates. (See Table 2.) Most of the official actions to raise interest
rates followed earlier uptrends in market rates in the various countries.
In addition to the recent monetary measures, certain fiscal
measures were taken -- or are planned -- in France, Switzerland and
Belgium as part of the anti-inflationary effort. These vary from a
reduction in certain value-added taxes in France, to a more restrictive
budget in Belgium. Since the economic recovery in its early stages
had been strongly supported by government demand, fiscal policy might
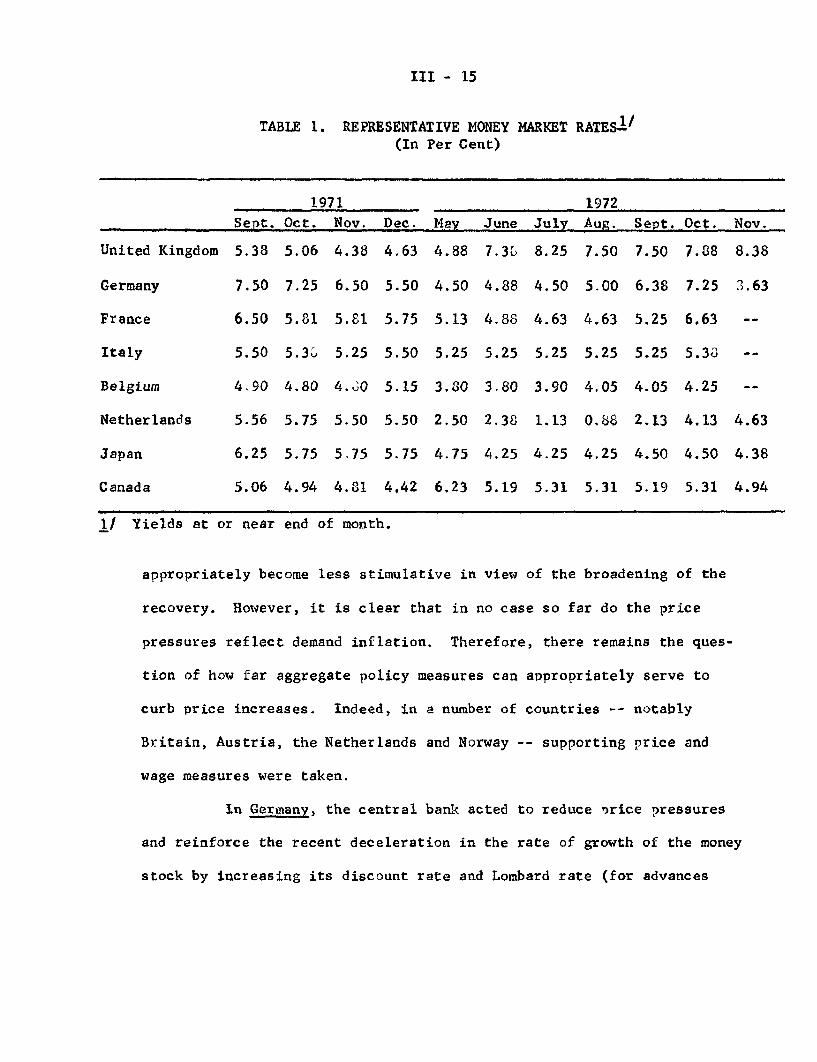
III - 15
TABLE 1. REPRESENTATIVE MONEY MARKET(In Per Cent)
Sept.
United Kingdom 5.38
Germany 7.50
France 6.50
Italy 5.50
Belgium 4.90
Netherlands 5.56
Japan 6.25
Canada 5.06
1/ Yields at or near
1971
Oct. Nov. D
5.06 4.38 4
7.25 6.50 5
5.81 5.81 5
5.38 5.25 5
4.80 4.80 5
5.75 5.50 5
5.75 5.75 5
4.94 4.81 4
end of month.
ec.
.63
.50
.75
.50
.15
.50
.75
.42
May
4.88
4.50
5.13
5.25
3.80
2.50
4.75
6.23
June
7.3
4.88
4.88
5.25
3.80
2.38
4.25
5.19
July
8.25
4.50
4.63
5.25
3.90
1.13
4.25
5.31
1972
Aug.
7.50
5.00
4.63
5.25
4.05
0.88
4.25
5.31
Sept.
7.50
6.38
5.25
5.25
4.05
2.13
4.50
5.19
Oct.
7.88
7.25
6.63
5.38
4.25
4.13
4.50
5.31
Nov.
8.38
3.63
4.63
4.38
4.94
appropriately become less stimulative in view of the broadening of the
recovery. However, it is clear that in no case so far do the price
pressures reflect demand inflation. Therefore, there remains the ques-
tion of how far aggregate policy measures can appropriately serve to
curb price increases. Indeed, in a number of countries -- notably
Britain, Austria, the Netherlands and Norway -- supporting price and
wage measures were taken.
In Germany, the central bank acted to reduce rice pressures
and reinforce the recent deceleration in the rate of growth of the money
stock by increasing its discount rate and Lombard rate (for advances
RATES-1
I ~-
~II
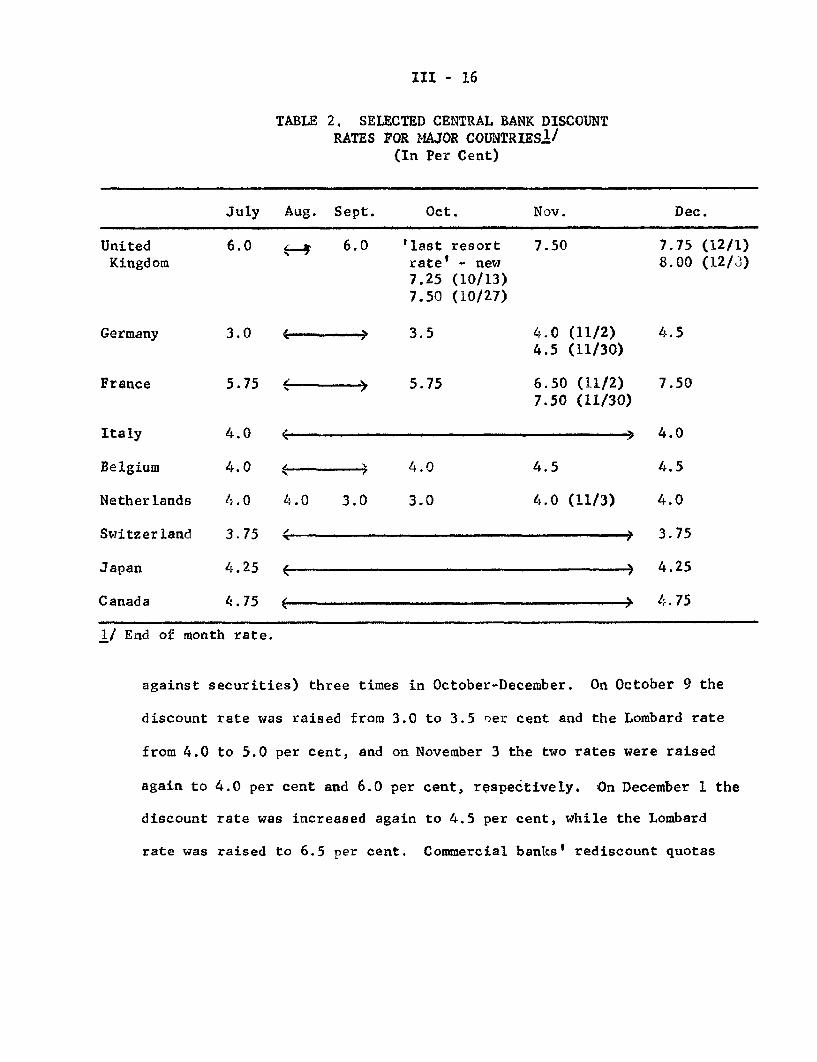
III - 16
TABLE 2. SELECTED CENTRAL BANK DISCOUNTRATES FOR MAJOR COUNTRIES 1/
(In Per Cent)
July
UnitedKingdom
Germany
France
6.0
Aug. Sept.
6.0
3.0 .-- >
5.75 ---
Italy 4.0
Belgium 4.0
Netherlands 4.0
Switzerland 3.75
Japan 4.25
Canada 4.75
1/ End of month rate.
Oct.
'last resortrate' - new7.25 (10/13)7.50 (10/27)
3.5
5.75
Nov.
7.50
Dec.
7.75 (12/1)8.00 (12/3)
4.0 (11/2)4.5 (11/30)
6.50 (11/2)7.50 (11/30)
-- 7 4.0 4.5
4.0 3.0 3.0 4.0 (11/3)
(<-----------------(-----------------
4.5
7.50
4.0
4.5
4.0
3.75
4.25
4.75
against securities) three times in October-December. On October 9 the
discount rate was raised from 3.0 to 3.5 per cent and the Lombard rate
from 4.0 to 5.0 per cent, and on November 3 the two rates were raised
again to 4.0 per cent and 6.0 per cent, respectively. On December 1 the
discount rate was increased again to 4.5 per cent, while the Lombard
rate was raised to 6.5 per cent. Commercial banks' rediscount quotas
III - 17
are also to be cut by 10 per cent, or roughly $665 million, on
February 1, 1973.
The Bundesbank felt it could safely raise its rates without
triggering an undesired inflow of capital since the covered differen-
tial between German and foreign rates had narrowed substantially. In
particular, the discount on forward sales of U.S. dollars against DM
had decreased sharply. Thus, while Euro-dollar interest rates had
risen only a little, the interbank 3-month Euro-DM rate had risen from
1 per cent last July to about 4 per cent by mid-October, and rates on
Euro-DM loans to German borrowers had risen correspondingly. With the
50 per cent cash deposit ("Bardepot") requirement doubling the cost
of such loans, it became more expensive for German enterprises to
borrow abroad than at home. On December 6 the authorities tightened
the Bardepot requirement by reducing from DM 500,000 to DM 50,000 the
amount of borrowings exempted from the requirement.
Market rates were already beginning to rise in August. The
Bundesbank's actions in October-December have been accompanied by sharp
increases in the level of short-term rates. The interbank call money
rate rose more than seasonally from 2.30 per cent in July to 5.75 per
cent in November, while the three-month interbank deposit rate increased
from 4.50 per cent in July to 8.63 per cent in November.
Short-term interest rates in the United Kingdom have increased
sharply since early June, with the average tender rate for treasury bills
III - 18
rising from 4.39 per cent on June 2 to 7.47 per cent on December 8.
This increase mainly reflects the general rise in economic activity
and very strong demand for funds from all sectors of the economy, but
was reinforced in November by a Bank of England call for Special
Deposits and by the Bank's forcing the discount houses to borrow from
the Bank at its new minimum lending rate, which is automatically set
each week at a penalty level. The Bank of England hopes that control
of bank liquidity, as well as the substantial rise in interest rates
since June, will help to reduce further the rate of growth in the stock
of money (broad definition), which earlier declined from an annual rate
of 31 per cent in the first half of 1972 to 18 per cent in August-
October. Bank lending rates rose this week, and in view of the Bank's
current policy objectives and the general upswing in economic activity,
short-term rates are likely to rise somewhat further in the coming
months.
Accelerating price increases in France have caused the
authorities to take various restrictive measures in recent months.
From late September through December 1 the Bank of France increased
its money market intervention rate from 3.75 per cent to 6.875 per
cent. Also, on November 17 the marginal cash reserve requirement for
bank loans was raised from 15 to 33 per cent. This requirement applies
to increases in bank loans above the level outstanding on April 5,
1972. Finally, the Bank of France increased its discount rate from
III - 19
5.75 to 6.50 per cent on November 2, and from 6.50 to 7.50 per cent on
November 30. Because the discount rate has been kept well above the
money market intervention rate since January of 1971, accommodation at
the open market window has replaced rediscounts in the extension of
Bank of France credit. Nevertheless, the increases in the discount
rate will have some psychological impact, as well as insuring that the
discount rate remains above money market rates.
On December 7 the French Government announced that further
monetary and fiscal measures would be taken to curb rising inflation.
New credit ceilings will be imposed on the banks, requiring them not
to expand their credit by more than 19 per cent by March 31, 1973,
over the same date a year earlier, and by 17 per cent by June 30,
1973, over the same date a year earlier. Penalties will be applied in
case the ceilings are exceeded. In addition, the nationalized banks
will be enjoined from further increasing the interest rate on loans
that they make, and it is expected their lead will set the behavior
pattern for the entire banking system.
As a direct measure to hold prices down, the basic value-
added tax rate will be reduced from 23 to 20 per cent, while the rate
for "essential" goods will be cut from 7.5 to 7.0 per cent. France
also plans to issue 5 billion francs of 15-year bonds in early 1973,
with an exchange value guaranty against any devaluation of the franc.
III - 20
In Belgium, the rising level of economic activity contributed
to a gradual increase in short-term interest rates in July-September
and a more rapid increase in October-November. By November 23 short-
term rates were 55-65 basis points above the June 30, 1972, level.
Largely in response to the higher level of domestic interest rates and
interest rate increases in several other European countries, the
central bank on November 23 raised its discount and lending rates by
0.5 percentage points. Earlier in August and November the central
bank took steps to reduce bank liquidity that had increased as a result
of speculative capital inflows following the floating of the pound
sterling. In August commercial banks were required to place BF 10
billion in special non-interest bearing deposits with the central bank,
and on November 10 an additional BF 7.5 billion had to be placed with
the central bank by the commercial banks, savings banks and semi-
official credit agencies.
The Bank of Italy on December 5 raised its rate on fixed-
term advances from 3.5 to 5.5 per cent. The Bank's rediscount rate
and its rate on open-end advances were left unchanged. The rise in
the rate on fixed-term advances is designed to discourage commercial
bank financing of advance payments for imports and speculative purchases
of Italian equities, both of which have increased sharply of late. The
acceleration of import payments is related to the anxieties persisting
since last June over a possible devaluation of the lira, and has been
III - 21
an important part of the stepped-up capital outflow from Italy in recent
weeks. The latest monetary policy measures have mainly been dictated
by the desire to reduce the capital outflow, and not by any basic desire
to tighten domestic monetary conditions since easy monetary and fiscal
policies are still thought necessary in view of the slack in the economy.
Rising economic activity in Switzerland and a reversal of short-
term inflows as the forward premium on the Swiss franc declined contributed
to a reduction in bank liquidity in recent months. As a result, banks
have increased the rate paid on three-month deposits on four occasions
since October 12. By November 29 the rate stood at 4.0 per cent, as
compared to 1.5 per cent prior to October 12. Concerned about the grow-
ing inflationary pressures, the Swiss authorities announced on December
4 that they plan to reimpose credit ceilings and enact other anti-
inflationary measures soon. These include the authority to impose
reserve requirements for banks' domestic and foreign liabilities, to
revise the depreciation tax schedule, to impose export deposit require-
ments, to control the domestic issue of public securities, and to
establish price guidelines.
Interest rates in Japan have generally been declining since
November of 1970 and are now at postwar lows. Rates have declined
mainly because of the Bank of Japan's easy money policy, slack demand
for investment funds during the 1970-71 recession, and the excess
liquidity created by the surpluses in Japan's balance of payments.
III - 22
Although average bank lending rates declined steadily through
September 1972 (6.8 per cent as compared to the October 1970 peak of
7.7 per cent), the call loan rate has been generally stable at 4.25 per
cent since June of this year. The Bank of Japan's basic discount rate
has also remained unchanged since the last reduction on June 24, 1972,
to 4.25 per cent.
In recent months the authorities have become concerned about
an acceleration in the rate of increase in prices, as well as the excess
liquidity caused by the balance-of-payments surpluses. It is doubtful
that they will increase the central bank's discount rate soon for fear
of damping the economic recovery, but some tightening measures, such as
an increase in commercial bank reserve requirements, may be taken. Un-
less reserve requirement increases are much larger than now seems likely,
interest rates will probably remain at relatively low levels in the
coming months because of the highly liquid position of most businesses
and banks.
Canadian monetary policy has been expansionary this year, in
order to sustain the economic expansion now in progress and to reduce
the high (6.6 per cent) rate of unemployment. Major short-term interest
rates have moved within a relatively narrow range since early September,
the rate for three-month finance comoany paper having fluctuated between
5.12 and 5.25 per cent. Earlier, money market and bank deposit rates
had moved up sharply in January-May, and then declined rapidly in June.
III - 23
The main reason for the sharp drop in June (the rate on the three-month
finance company paper fell from 6.13 per cent on May 26 to 4.88 per cent
on June 23) was the announcement on June 12 of the Winnepeg Agreement to
put a ceiling on CD rates. Under this Agreement, the commercial banks,
with the concurrence of the Minister of Finance, agreed that they would
pay no more than 5.5 per cent on deposits of $100,000 or more for terms
of less than one year. On November 27, the CD ceilings for various
maturities under 270 days were lowered by 1/8 to 1/4 percentage points.