Embed Size (px)
Citation preview

Prefatory Note The attached document represents the most complete and accurate version available based on original copies culled from the files of the FOMC Secretariat at the Board of Governors of the Federal Reserve System. This electronic document was created through a comprehensive digitization process which included identifying the best-preserved paper copies, scanning those copies,1
and then making the scanned versions text-searchable.2
Though a stringent quality assurance process was employed, some imperfections may remain. Please note that some material may have been redacted from this document if that material was received on a confidential basis. Redacted material is indicated by occasional gaps in the text or by gray boxes around non-text content. All redacted passages are exempt from disclosure under applicable provisions of the Freedom of Information Act. 1 In some cases, original copies needed to be photocopied before being scanned into electronic format. All scanned images were deskewed (to remove the effects of printer- and scanner-introduced tilting) and lightly cleaned (to remove dark spots caused by staple holes, hole punches, and other blemishes caused after initial printing). 2 A two-step process was used. An advanced optical character recognition computer program (OCR) first created electronic text from the document image. Where the OCR results were inconclusive, staff checked and corrected the text as necessary. Please note that the numbers and text in charts and tables were not reliably recognized by the OCR process and were not checked or corrected by staff.
Content last modified 6/05/2009.

CONFIDENTIAL (FR)
CURRENT ECONOMIC AND FINANCIAL CONDITIONS
June 14, 1972By the Staff
Board of Governorsof the Federal Reserve System
TABLE OF CONTENTS
Page No.
Section
DOMESTIC NONFINANCIAL SCENE I
Summary and outlook 1.................Industrial production ........ ........ -7
Retail sales *.e...ea... .o. s........es 8Unit sales of consumer durables . .. ....... . - 9Conference Board survey of consumer expectations
Cyclical indicators .... .. ................ -13Manufacturers' orders and shipments ........... -14
Construction and real estate ..............- 1,6Anticipated plant and equipment pedig ...... -17Labor market................................ -19Unemployment and labor force -............. 20Earnings...s... ...4q~ -9 .... 4944~44444 21
Wholesale prcs- .................... *24
DOMESTIC FINANCIAL SITUATION II
Summary and outlook 0..................0.. 1Monetary aggregates ....... ...............- 3
Nonbank financial institutions and mortgage markets .....- 9
Short-term security markets ... .. .. ..... -1Federal finance ... ... . . .............- 1
INTERNATIONAL DEVELOPM4ENTS I
Summary and outlook .. ........ ............-
U.S. balance of payments........ ........... - 2U.S. foreign trade.... . . . ... .. * ............ o.. . .. - 4
Foreign exchange markets 9-0 .~....... 0....... of. - 6Euro-dollar market .... *......... 000444e.*.*.. *90 - 9Financial development in selected industrial countries..-12

DOMESTIC NONFINANCIALSCENE

June 14, 1972
I -- T - 1
SELECTED DOMESTIC NONFINANCIAL DATAAVAILABLE SINCE PRECEDING GREENBOOK
(Seasonally adjusted)
Per Cent Change FromLatest Data-1972 Three
Release Preceding Periods YearPeriod Date Data Period Earlier Earlier
(At annual rates)
Unemployment rate (%)Nonfarm employment, payroll (mil.)ManufacturingNonmanufacturing
Private nonfarm:Average weekly hours (hours)Hourly earnings ($)Output per manhour (1967=100)Compensation per manhour (1967=100)Unit labor cost (1967=100)
Manufacturing:Average weekly hours (hours)Unit labor cost (1967=100)
Industrial production (1967=100)Consumer goodsBusiness equipmentDefense & space equipmentMaterials
Wholesale prices (1967=100)Industrial commoditiesFarm products & foods and feeds
Consumer prices (1967=100)FoodCommodities except foodServices 2/
Retail sales, total ($ bil.)GAF
Auto sales, total (mil. units) 3/Domestic modelsForeign models
MayMayMayMay
May
May /QI /
QI
6/26/26/26/2
6/26/25/265/265/26
5.972.519.053.5
37.03.61
109.4136.8125.1
[5.9] 1 /-!3.45.92.6
[37.2]1
3.33.99.45.3
May 6/2 40.5 [40.8] 1-/Apr. 5/25 120.7 10.0
MayMayMayMayMay
MayMayMay
Apr.Apr.Apr.Apr.
MayMayMayMayMay
Plant & equipment expen. ($ bil.)- 1972Mfrs. new orders dur. goods ($ bil.) Apr.
Capital equipment Apr.
Defense products Apr.Leading indicators (1967=100) Apr.1/ Actual data.2/ Not seasonally adjusted.3/ At annual rate4/ Planned--Commerce survey (the February, 1972
cent).
6/146/146/146/146/14
6/26/26/2
5/195/195/195/19
6/25/315/315/315/25
111.6121.2101.576.2113.1
117.9117.5119.4
124.3122.5118.6132.4
36.89.9
11.139.601.53
89.6135.59.11.9
140 2
5.410.08.3
-1.6-3.2
5.44.28.7
2.0-1.02.03.6
15.711/4.25.83.6
[37.2] 1/6.8
{40.5]19.5
8.08.8
11.34.89.4
3.44.21.3
3.17.02.42.7
[6.1]! /
2.41.42.8
[36.9]1/5.93.46.63.1
[40.0]1/4.1
4.34.87.5
-0.93.9
3.93.45.0
3.43.92.34.4
(Not at annual rates)
2.33.46.2,6.44.7
1.21.4
11.11 .4
4.14.69.9
10.37.1
1.13.7
-37.74.-4
9.812.112.414.0
3.8
10.317.418.629.812.8
survey indicated an increase of 10.7 per
-'-~-

I - 1
THE ECONOMIC PICTURE IN DETAIL
Domestic Nonfinancial Scene
Summary. The overall economic situation continues strongly
expansive. Retail sales rose sharply in May, according to the advance
report, and were substantially above the first-quarter average. Strength
was widespread among durable and nondurable goods. Sales of domestic-
type autos accelerated to an annual rate of 9.6 million units, the highest
this year, and sales of imported models were at a 1.5 million rate.
Industrial production rose 0.5 per cent further in May, with
gains in consumer goods, business equipment, and materials. Total
industrial output was 2 per cent above the first quarter average and
virtually back to its pre-recession high in September 1969. Manufacturers'
new orders for durable goods rose futher in April, with orders for
capital equipment up for the seventh consecutive month. Book value of
manufacturing and trade stocks increased only moderately in April,
according to the preliminary estimates, and the stocks/sales ratio was
the lowest in six years.
Employment showed a further strong gain in May, but the un-
employment rate--reflecting another large addition to the civilian
labor force--remained at 5.9 per cent for the third consecutive month.
In manufacturing, the rise in employment continued sizable, but the
workweek declined following the sharp April advance. The rise in
average hourly earnings in the private nonfarm economy was reported to
be small in May, bringing the average increase since January down to an

I - 2
annual rate of 4.7 per cent, compared with 6.7 per cent in the pre-
freeze months of 1971.
Wholesale prices rose substantially in May. Prices of
industrial commodities increased at an annual rate of more than 4
per cent, about the average rate prevailing since last November.
Prices of farm products and foods were up sharply, following little
change in April. The consumer price index, which had been stable in
March, increased quite moderately in April.
Outlook. Recent economic data support the staff projection
of a step-up in the rate of real GNP growth this quarter. Current
expectations are for a 6.5 per cent annual rate of gain, compared with
5.6 per cent in the first quarter. Further acceleration is projected
in the second half of this year, to an average of around 7-1/2 per
cent.1 / The monetary aggregates are assumed to grow at rates consis-
tent with a 6 per cent expansion in M1 during this period, and this
is expected to be associated with some increase in short-term interest
rates.
The rise in the GNP deflator is expected to slow in the
current quarter, and to moderate somewhat further in the second half of
the year--to an annual rate of about 3-1/2 per cent. The anticipated
slowing reflects a moderation in the rise in unit labor costs. The
staff is now projecting the unemployment rate at 5.3 per cent in the
fourth quarter, about the same as in the greenbook four weeks ago.
1/ Projections through calendar year 1973 are being distributedseparately and will be described in detail in the Chart Show.

I - 3
STAFF GNP PROJECTIONS
Per cent increase, annual rateChange in Private GNP
Nominal GNP fixed weight Unemployment$ billion Real GNP price index Rate
5/17/72 Current 5/17/72 Current 5/17/72 Current 5/17/72 Current
Actual
1971-IV 19.5 19.5 5.8 5.8 1.8 1.8 5.9 5.9
1972-I 30.7 30.7 5.6 5.6 4.4 4.4 5.8 5.8
Projected
1972-II 30.2 28.9 6.9 6.4 4.0 4.0 5.7 5.8
1972-III 32.3 31.5 7.9 7.7 3.4 3.4 5.5 5.6
1972-IV 32.7 31.8 7.8 7.5 3.4 3.4 5.2 5.3
The staff GNP projection for the second and subsequent quarters
is slightly lower than four weeks ago, as can be seen in the table. The
downward revision is primarily attributable to the smaller increase
now projected for business capital outlays--12.6 per cent from 1971 to
1972, rather than the 14.0 per cent of the preceding projection. In
this sector, staff expectations have been reduced as a result of the
latest Commerce Survey, which indicated a smaller increase than did the
recent McGraw-Hill survey. Projections for other demand sectors have
changed very little.
For the current quarter, in addition to the smaller increase
projected for business fixed investment, we now expect somewhat less
improvement in net exports than earlier. However, consumer spending is

I-4
at least as strong as we have been projecting, and inventory investment
is still expected to be appreciably larger than the close-to-zero
figure of the first quarter.
In the second half of the year, all demand sectors are
expansive--except for residential construction, which appears to be
near or at its peak now. The staff still expects a rise in defense
outlays in lagged response to the recent escalation in Vietnam and a
rise of 12-1/2 per cent in social security benefits, effective July 1.
Recent official statements on defense spending and Congressional develop-
ments with respect to social security legislation appear to support
these assumptions.

I-5
CONFIDENTIAL - FR June 14, 1972
GROSS NATIONAL PRODUCT AND RELATED ITEMS(Quarterly figures are seasonally adjusted. Expenditures and income
figures are billions of dollars, with quarterly figures at annual rates.)
1971 1972 1971 1972Proj. Projected
III IV I II III IV
Gross National ProductFinal purchasesPrivateExcluding net exports
Personal consumption expendituresDurable goodsNondurable goodsServices
Gross private domestic investmentResidential constructionBusiness fixed investmentChange in business inventoriesNonfarm
Net exports of goods and services 1/ExportsImports
Gov't. purchases of goods and servicesFederalDefenseOther
State & local
Gross national product inconstant (1958) dollars
GNP implicit deflator (1958 = 100)
Personal incomeWage and salary disbursements
Disposable incomePersonal saving
Saving rate (per cent)
Corporate profits before taxCorp. cash flow, net of div (domestic)
Federal government receipts andexpenditures (N.I.A basis)
ReceiptsExpendituresSurplus or deficit (-)
High employment surplus or deficit (-)
Total labor force (millions)Armed forcesCivilian labor forceUnemployment rate (per cent)
Nonfarm payroll employment (millions)
Manufacturing
Industrial production (1967 = 100)Capacity utilization, manufacturing
(per cent)
Housing starts, private (millions, A R.)
Sales new autos (millions, A R.)Domestic modelsForeign models
1046.81044.5
811.5811.5
662.1100.5278.6282.9
151.640.6
108.72.21.7
1149.01142.7883.9887.8
715.7112.2298.2305.3
178.449.7
122 4636.1
1053.41054.6820.8820.8
668.8102.8280.2285.8
150.842.7
109.3-1.2-2.0
1072.91070.4829.6834.2
677.2103.6283.3290.3
159.444.4
112.62.42.0
1103.61103.0853.4859.6
691.8107.6288.0296.2
168.349.0
118.70.60.1
1132.51129.0873.7878.5
707.2110.6294.6302.0
174.850.3
121.03.53.3
1164.01156.0894.3897.2
723.3113.6301.5308.2
181.950.4
123.58.08.0
1195.81182.8914.1915.8
740.4117.0308.7314.7
188.448.9
126.513.013.0
0.0 -3 9 0.0 -4.6 -6.2 -4.8 -2.9 -1.765.3 70.5 68.2 60.4 69.2 68.9 70.8 73.265.3 74.4 68.2 65.0 75 4 73.7 73.7 74.9
233.097.671.426.2
135.5
258 8107.377.529.7
151.6
233.897.670.227.4
136.2
240.8100.3
71.428.9
140.5
249.6104.975.829.0
144.8
255.3106 3
76.829.5
149.0
261.7108.2
78.030.2
153 5
268.7109.7
79.530.2
159.0
739.4 781.9 740.7 751.3 761.6 773.8 788 7 803.4141.6 146.9 142.2 142 8 144.9 146.3 147 6 148.8
857.0574.2741.3
60.58.2
931.7629.6793.959 0
7.4
864.6577.3748.5
61.08.1
876.7587.0755.0
59.07.8
900.1608.9764.353.5
7.0
917.8621.5781.8
55.47.1
943 9636 1806.1
63 47 9
965.0652 0823.563.5
7.7
85 5 100.9 85.8 86.0 91.6 96 0 104 0 112.081.0 97.4 82.4 85.6 90.0 94.0 100.1 105.5
198.8221.9-23.1
227.4248.8-21.4
197.8224.6-26.7
203.0228.7-25.7
222.1235.5-13.3
224.0244 1-20.1
228.6255.7-27.1
235.0259.9-24.9
2.9 -2.0 1.3 6.6 8.3 0.3 -8.1 -8.7
86.9. 89.1 87.0 87.7 88.4 88.8 89.3 89.72.8 2.4 2.8 2.7 2.5 2.4 2.4 2.484.1 86.6 84.2 85.0 85.9 86.4 86.9 87.3
5.9 5.6 6.0 5.9 5.8 5.8 5.6 5.3
70.7 72.7 70.6 71.0 71.8 72.4 73.0 73.618.6 19.0 18.5 18.6 18.7 18.9 19.1 19.3
106.3
74.6
2.0510.138.681.46
113.1
76.7
2.2810.659.171.48
105.9
74.1
2.1110.298.761.53
107.0
74.1
2.2410.479.201.27
109.3
74.9
2.5110.098.691.40
111.6
76.2
2.3010.75
9 251.50
114.4
77.3
2.2010.759.251.50
117.2
78.3
2.1011.009.501.50
1/ The projected GNP exports and imports of goods and services, and their net,changes projected in balance of payments exports and imports, shown below.
'71-IV figures not yet incorporated in the GNP accounts.
Net exports of goods and services 0.8 -1 3 0.2 -2.1Exports 66.0 72.8 68.3 62 7Imports 65.2 74 1 68 1 64.8
are based on quarter-to-quarterThese are consistent with revised
-3.6 -2.3 -0.3 0.971.5 71.2 73.1 75.575.1 73.4 73.4 74.6

I-6
CONFIDENTIAL - FR June 14, 1972
CHANGES IN GROSS NATIONAL PRODUCTAND RELATED ITEMS
1971 1972 1971 1972Proj. Projected
III IV I II III IV
--------------------------Billions Of Dollars---------------------------
Gross National ProductInventory changeFinal purchasesPrivate
Excluding net exportsNet exports
Government
GNP in constant (1958) dollarsFinal purchasesPrivate
102.24.1
98.272.476.3-3.925.8
19.4 42.5 4.919.6 39.1 9.519.8 32.0 6.9
12.2 14.9 14.79.4 10.9 10.38.3 8.9 8.6
---------------------------- Per Cent Per Year---------------------------
Gross National ProductFinal purchasesPrivate
Personal consumption expendituresDurable goodsNondurable goodsServices
Gross private domestic investmentResidential constructionBusiness fixed investment
Gov't. purchases of goods & servicesFederalDefenseOther
State & local
GNP in constant (1958) dollarsFinal purchasesPrivate
GNP implicit deflatorPrivate GNP fixed weight index 2/
Personal incomeWage and salary disbursements
Disposable income
Corporate profits before tax
Federal government receipts andexpenditures (N.I.A. basis)
ReceiptsExpenditures
5. 27.47.4
7.616.04.3
12.0 1 112.211.5
7.5 8.1 7.0 5.0 8.613.4 11.6 14.9 3.1 15.45.3 7.0 3.5 4.4 6.67.8 7.9 7.6 6.3 8.1
12.0 17.7 -5.5 22.8 22.333.6 22.4 27.0 15.9 41.46.5 12.6 3.7 12.1 21.7
7.36.7
-6.745.5
7.8
2.715.24.62.51/3. 6
12.011.1
6.821.912.6
5.81/4.22.7
1/ /
1.811
10.5 11.1 10.99.4 9.6 9.39.5 9.4 8.9
8.9 9.1 9.511.2 10.8 12.09.2 9.4 9.67.8 8.2 8.4
15.4 16.2 14.310.6 0.8 -11.9
7.8 8.3 9.7
14.618.324.6
1.412.2
5.6-6.67.2
4.4 1 /
13.4 18.0 -5.1 0.9 26.0
3.8 14.4 0.2 10.58.2 12.1 5.8 7.3
7.9 11.4 8.98.3 9.4 10.09.2 12.4 8.6
19.2 33.3 30.8
3.4 8.2 11.214.6 19.0 6.6
Nonfarm payroll employmentManufacturing
Industrial productionHousing starts, privateSales new autosDomestic modelsForeign models
0.1 2.8 -0.2 2.2 4.3 3.4 3.3 3.4-3.9 2.3 -2.5 0.9 2.5 5.3 3.9 4.2
4.224.2
7.420.1
-66.4
8.647.8-14.5-22.237.9
8.4-33.5
26.225.830.0
10.0-17.40.00.00.0
9.8-18.2
9.310.80.0
I/ At compound rates.
2/ Using expenditures in 1967 as weights.
3/ Excluding the first $1.2 billion, annual rate, of the volunteer army pay increase, 1.2 per cent per year.
4/ Excluding the remaining $1.2 billion, annual rate, ofFederal employees pay increase, 4.3 per cent per year.
the volunteer army pay increase and the general

I - 7
Industrial production. Industrial production rose 0.5 per
cent further in May to 111.6 per cent (1967=100). This was 4.3 per cent
above a year earlier and only 0.3 per cent below the previous high in
September 1969. Gains in May were widespread among consumer goods,
business equipment, and durable materials. The indexes for February,
March, and April were revised up slightly--by 0.2 percentage point in
each month. Since last December, the index has advanced at an annual
rate of nearly 9 per cent.
Output of most appliances, furniture, and consumer nondurable
goods increased in May. Auto assemblies, however, were off a little
from April, despite strong retail sales in May, and were at an annual rate
of 8.8 million units compared with a 9.0 million unit rate in April.
Production of most business equipment industries rose further in May;
the total was 7.5 per cent above the low of a year earlier but still 8
per cent below the 1969 peak. Output of defense equipment was unchanged
in May. Production of construction products, steel, and other durable
goods materials increased, while nondurable materials changed little.

I-8
INDUSTRIAL PRODUCTION(1967=100, seasonally adjusted)
Per cent changesApril 1972 May 1971 Sept.*1969
1972 to to to
April(r) May(e) May 1972 May 1972 May 1972
Total index
Consumer goodsAutosHome goodsApparel & staples
Business equipmentDefense equipment
IntermediateproductsConstructionproducts
Materials, totalDurable
SteelNondurable
* Pre-recession peak
111.1
120.2114.3121.0119.4
100.876.3
116.6
116.4
113.4108.0103.5119.8
for total
111.6
121.2111.3122.2120.2
101.576.2
117.3
117.0
113.1108.6105.5119.7
index.
.5
.8-2.61.0.7
.7-.1
.6
.5
-.3.6
1.9-.1
4.3
4.82.87.34.4
7.5- .9
3.3
1.3
3.93.6
-6.66.1
-.3
7.9-4.59.58.0
-8.0-25.4
4.6
-1.7
-1.1-5.5-9.85.2
Retail sales. Sales in May rose 2.3 per cent from April to
a new high, 3.5 per cent above the first quarter average and 9.8 per cent
above a year earlier. Strength was widespread in May but durable
goods sales were relatively stronger than nondurable, with an increase
from the first quarter average of 4.6 per cent largely reflecting a
7.2 per cent increase in the sales of the automotive group. Furniture
and appliances sales rebounded after an April drop, and were 17 per
cent above a year earlier.

I - 9
Nondurable goods sales in May were up 1.8 per cent from
April and 2.9 per cent from the first quarter, led by general mer-
chandise group. Food sales were also strong, with an advance of 3.1
per cent from the first quarter average.
RETAIL SALES, 1972(Seasonally adjusted, percentage change)
Total sales
Durable goodsAutomotiveFurniture andappliances
Nondurable goodsFoodGeneral
merchandise
Total, less autos andnonconsumption items
GAAF
Real* sales
QIV toQI
1.2
.3-3.1
9.2
1.61.7
2.3
2.1
3.0
QI toMay
3.5
4.67.2
.6
2.93.1
4.6
3.1
4.1
Feb. toMarch
3.1
5.55.7
3.0
2.0.7
2.1
2.3
2.1
.3 NA 3.0
March toApril
-1.3
-2.1- .9
-3.5
- .9
- .3
-1.0
- .9
-1.0
-1.3
April toMay
2.3
3.33.7
2.4
1.81.7
3.7
1.9
3.4
* Deflated by all commodities CPI, seasonally adjusted.
Unit sales of consumer durables. Sales of new domestic-
type autos in May were at an annual rate of 9.6 million units, 6 per
cent above a month earlier and 14 per cent above a year earlier. April-
May sales were at a 9.3 million unit rate compared with an 8.7 million
unit rate in the first quarter. Dealer inventories at the end of May
were at a 52 day supply, down 5 per cent from a month earlier and 10
per cent from a year ago. The decline in the stock-sales ratio resulted

I - 10
from the higher sales rate, since stocks in absolute terms were the
same as last month and above those of a year earlier.
May sales of imported autos were at a 1.5 million unit rate,
up 5 per cent from both a month and a year earlier. The import share
of total sales was 14 per cent, the same as in April but below the
16 per cent of May last year.
According to partially complete data, unit purchases of
major home appliances by retailers fell 6 per cent between April and
May but were 9 per cent above a year ago. With the exception of
freezers, which showed another sharp monthly gain, dealer purchases of
other items declined from April levels. Compared with a year earlier,
however, all items showed gains, except air conditioners. Similar
trends held for unit purchases of TVs, which in May were below a month
earlier but up from a year ago. Purchases of monochrome sets were 20
per cent above May 1971 while color set purchases were up 4 per cent.
UNIT PURCHASES BY RETAILERS OF SELECTED HOME GOODS(Seasonally adjusted, 1967=100)
1971 1972 Per cent changeMay March April May Month ago Year ago
TVs 1/ 123 121 141 131 -7 6Radios 105 83 105 89 -15 -15Home appliances 2/ 126 129 146 137p -6 9
1/ Includes foreign-made units sold under U.S. brand names. Foreign-made sold under foreign brands are not included.
2/ Weighted average of indexes for air conditioners, dishwashers,dryers, freezers, electric ranges, gas ranges, refrigerators, wash-ing machines, and vacuum cleaners. Weights are 1967 values ofretail sales.

I - 11
Conference Board Survey of Consumer Expectations and Intentions.
The March-April Conference Board survey was somewhat weaker than the
previous bi-monthly report which had indicated a significant improvement
in some of the more important consumer attitudes and was in sharp
contrast to recent retail sales reports. In the latest survey--taken
at the end of March and in early April--an increased percentage of
households reported present business conditions were bad and there was a
sharp drop in households expecting an increase in income. Present
employment conditions were appraised somewhat better, however; this was
also true of business conditions expected six months hence.
Buying plans for autos within the next six months were lower,
with purchase plans declining from 7.7 per cent of households in January-
February to 7.2 in March-April. A year earlier 8.6 per cent of house-
holds were planning to buy a car. Intentions to purchase major
appliances dropped sharply, compared with both the previous survey and a
year earlier. Plans to purchase a house remained relatively high.

I - 12
CONSUMER EXPECTATIONS AND INTENTIONS 1 /
(Seasonally adjusted)
1971 1972March- July- September- November- January- March-April August October December February April
Business ConditionsGoodBad
EmploymentJobs plentifulJobs hard to get
Business ConditionsBetterWorse
EmploymentMore jobsFewer jobs
IncomeIncreaseDecrease
Appraisal of Present Situation
13.1 14.8 15.1 15.4 20.9 21.034.3 28.9 28.1 26.5 19.8 21.2
5.9 7.6 6.5 6.8 8.9 9.845.0 43.1 42.7 41.5 39.4 38.6
Expectations for Six Months Hence
25.4 26.2 25.9 25.3 24.7 26.313.0 10.4 10.5 8.4 6.1 7.5
21.7 21.9 20.3 20.5 20.4 20.221.0 18.3 19.2 16.0 16.2 16.3
23.8 23.1 24.2 24.8 28.2 23.77.2 7.3 7.8 6.9 6.0 6.3
Plans to Buy Within Six Months
AutomobileYes
NewHome
YesMajor appliances
Total plans
1/ Source: Conference
8.65.3
3.0
39.2
Board
8.44.7
3.4
7.94.6
3.2
35.0 37.9
Survey of Consumer
8.14.5
3.1
7.7 7.24.7 4.2
3.8 3.8
37.5 37.4 32.4
Expectations and Intentions.

I - 13
Cyclical indicators. The Census trend-adjusted composite
index of leading indicators rose 1.4 per cent in April (p), after an
upward-revised 1.9 per cent increase in March. The coincident and
lagging composites also rose.
Leading series increasing in April were the manufacturing
workweek, initial claims for unemployment insurance (inverted), new
orders for durable goods, contracts and orders for plant and equipment,
housing permits, industrial materials prices, and common stock prices.
The only series to decline was the ratio of price to unit labor cost
in manufacturing, as the index of unit labor costs increased faster
than the price index.
CHANGES IN COMPOSITE CYCLICAL INDICATORSApril 1972 (p)
Per cent change from:Previous Three monthsmonth earlier
12 Leading (trend adjusted) 1.4 4.412 Leading, prior to trend
adjustment 1.2 3.35 Coincident .8 2.55 Coincident, deflated .7 2.16 Lagging 1.3 2.1
April was the tenth consecutive month of increase for the
leading composite, which is now 23 per cent above November, 1970.
This rise is similar to the 17-month increases from the 1954 and 1958
troughs and greater than the increase from the 1961 trough. However,
the amount of increase from the trough does not appear to be highly
correlated with the strength or duration of expansion in the following
period.

I- 14
Manufacturers' orders and shipments. New orders for durable
goods rose 1.2 per cent from March to April (p), following a 1.7 per
cent increase in March. Orders for capital equipment--which had de-
clined according to the earlier advance report--now are shown to
have risen for the seventh straight month. April orders for all
major groups except defense were above the first quarter average.
MANUFACTURERS' NEW ORDERS FOR DURABLE GOODS(Per cent change)
April from April fromMarch (p) QI average (p)
Durable goods, total 1.2 1.7
Primary metals - .9 2.6Motor vehicles & parts 2.5 2.5Household durables .9 7.7
Defense products 11.1 -12.3Capital equipment 1.4 2.4Construction and other durables - .3 1.7
Shipments rose 1.9 per cent in April but were still below
incoming orders, and the order backlog rose 0.3 per cent--a somewhat
lower rate of increase than in the previous five months. The order
backlog for capital equipment rose for the third straight month.
Inventories. Book value of business inventories rose at a
$6.6 billion annual rate in April (p) following an upward-revised
March increase of $5.4 billion. Trade stocks rose sharply, especially
at wholesale. The increase in wholesale stocks followed a slight
decline in March and reflected, in part, restocking by auto and other
importers following the end of the dock strike. Partly offsetting this
was a decline in manufacturing.

I - 15
CHANGE IN BOOK VALUE OF BUSINESS INVENTORIES(Seasonally adjusted annual rate, billions of dollars)
1971Q IV
Manufacturing and trade 4.1
Manufacturing, total 1.1Durable -1.3Nondurable 2.4
Trade, total 2.9Wholesale 4.4Retail -1.5
NOTE: Detail may not add to total
1972Q I March(r) (r)
5.5 5.4
2.8 2.52.8 2.2
- .1 .4
2.7 2.81.0 - .11.7 2.9
because of rounding.
The inventory-sales ratio for manufacturing and trade was
unchanged in April from a downward-revised March level of 1.47--the
lowest level in six years. The trade ratio increased--reflecting in
part both the jump in stocks in wholesale trade and the temporary
decline in retail sales in April--but the manufacturing ratio declined.
The ratio of inventories to unfilled orders at durable goods manu-
facturers declined further.
INVENTORY RATIOS
1971March April
1972March April(r) (p)
Inventories to sales:Manufacturing and trade 1
Manufacturing, total 1Durable 2Nondurable 1
Trade, total 1Wholesale 1Retail 1
Inventories to unfilled orders:Durable manufacturing
.56
.74
.06
.35
.37
.24
.45
1.56
1.742.081.34
1.371.241.45
1.47
1.611.881.28
1.331.221.40
1.47
1.591.841.28
1.351.231.42
.823 .834 .837 .833
April(p)
6.6
-1.9- .9
-1.0
8.54.73.9
.823 .834 .837 .833

I - 16
Construction and real estate. Seasonally adjusted outlays
for new construction changed little in May from a downward revised
but still record rate now reported for April. Residential construction
declined for the second consecutive month, but the May rate remained
above the advanced first quarter level. Outlays for private non-
residential construction edged higher, while those for public con-
struction showed essentially no change.
Despite little further rise so far this year, construction
costs in May were about 5 per cent above a year earlier, according to
the Census Bureau's composite index. This compared with a corre-
sponding year to year increase of 7 per cent in May of last year.
NEW CONSTRUCTION PUT IN PLACE(Seasonally adjusted annual rates, in billions of dollars)
Total
Private
ResidentialNonresidential
Public
State and localFederal
1/ Data for May 1972In no case should
1971 19721971
QI QIV
102,0 115.7
71.4 84.6
36.6 46.934.8 37.6
30.6 31,1
26.8 27.03,8 4.1
are confidentialpublic reference
1972QI Apr.p/ May 1/
121.1 122.6 122.1
89.7 91.5 90.9
51.5 52.5 51.638.2 39.0 39.4
31.4 31.1 31.2
26.9 26.9 26.94.5 4,2 4.3
Census Bureau extrapolations.be made to them.
Seasonally adjusted sales of new homes by merchant builders
turned upward again in April to virtually the record rate in the first
quarter. As a result, while stocks of homes for sale increased somewhat

I - 17
further, they amounted to only 5.5 months' supply in April compared
with 5.9 months' in March. The improved sales rate in April was
associated with a shift toward less expensive units. Even so, at $26,700,
the median price for new homes sold continued above that for homes
still awaiting sale. Moreover, unlike prices of new homes sold,
prices of existing homes sold in April rose somewhat further to a
median of $26,450.
NEW SINGLE-FAMILY HOMES SOLD AND FOR SALE
Homes Homes Median price of:sold 1/ for sale 2/ Homes sold Homes for sale
(Thousands of units) (Thousands of dollars)
1971
QIII 666 265 25.3 26.1QIV 682 284 25.5 25.9
1972
QI 698 317 26.1 26.1
February (r) 724 309 26.3 26.2March (r) 648 317 27.3 26.1April (p) 697 320 26.7 26.4
1/ SAAR.2/ SA, end of period.
Anticipated plant and equipment spending. The May Commerce
capital expenditures survey indicates that business now plans a 10.3
per cent increase in 1972 spending for new plant and equipment as
compared to an actual increase of only 2 per cent in 1971. This is
essentially unchanged from the 10.5 per cent planned increase reported

I - 18
in the February Commerce survey but is well below the 14.5 per cent rise
shown in the April McGraw-Hill survey. Manufacturers now anticipate
a 5-1/2 per cent gain--down from the earlier reported 9 per cent rise--
with durable goods producers' plans up 11 per cent instead of 14 per
cent. There was a small upward revision in plans of nonmanufacturing
concerns.
ANTICIPATED 1972 EXPENDITURES FOR NEW PLANTAND EQUIPMENT BY U.S. BUSINESS(Per cent change from 1971)
Comm-SEC McGraw-Hill Commerce McGraw-Hill Commerce(Dec. 1971) (Feb. 1972) (Feb. 1972) (Apr. 1972) (May '72)
All business 9.1 11.4 10.5 14.5 10.3
Manufacturing 4.0 12.0 8.7 15.1 5.6Durable goods 5.1 13.1 13.9 14.8 11.3Nondurable goods 3.0 11.1 4.2 15.4 .6
Nonmanufacturing 12.1 11.0 11.6 14.1 13.1Transportation 18.3 23.6 16.0 31.6 14.4Electric utilities 16.1 8.0 13.4 11.0 13.2Communication 12.8 1/ 10.0 14.2 1/ 8.0 14.2 1/Commercial and other 7.3 1/ 11.0 8.1 1/ 13.0 11.9 1/
1/ Confidential, not published separately.
The Commerce survey further reports that overall spending is
anticipated to rise sharply in the first half of 1972 with a slowing to
about a 4 per cent annual rate of increase in the second half.

I - 19
In contrast, the Conference Board survey of new capital
appropriations by 1,000 large manufacturing concerns indicated
considerable renewed strength--with an 11 per cent rise in the first
quarter following a decline of 2 per cent in the fourth quarter.
The rise in first quarter appropriations was largely in nondurable
goods where the increase was 18 per cent; in durable goods, the
increase was 5 per cent.
This increase in new appropriations should offer some
support to spending by manufacturers in the second half of the year
if historical performance is a guide. Substantial second half gains
in outlays, however, would require a further appropriations rise in
the second quarter.
Labor market. The labor market continued to strengthen
in May. Payroll employment increased by 210,000--about the same as
in April (revised up by 100,000). About half the increase was in
manufacturing industries with the largest gains in durable goods
particularly major metal-using industries. The number of jobs has
increased rapidly since August, at an annual rate of 2.6 million.
Factory employment, which has displayed no growth in 1971, has
accelerated since December, but still remains 1.3 million below the
high reached in the summer of 199. Accompanying the recent increase
in factory jobs has been a gain in the workweek; although down in
May to 40.5 hours, it was about half an hour above the average for
the fourth quarter of 1971.

I - 20
NONFARM PAYROLL EMPLOYMENT(Seasonally adjusted)
Total
ManufacturingProduction workers
NonmanufacturingFederal governmentState and local government
Jan. 1971 - Aug. 1971- Dec. 1971-Aug. 1971 May 1972 May 1972--Change in thousands, annual rates--
129 2,595 3,096
-497 669 943-309 627 881
626 1,925 2,153- 19 24 - 2231 580 622
Unemployment and labor force. The unemployment rate was
unchanged in May at 5.9 per cent for the third consecutive month, as
both total employment and the civilian labor force increased by about
200,000. The jobless rate for adult males was unchanged while the
rate for adult females moved up, returning to the level of last fall;
the volatile teenage rate dropped sharply, due entirely to a decline
in unemployment among teenage girls.
SELECTED UNEMPLOYMENT RATES(Seasonally adjusted)
1971 1972May November April May
Total 6.1 6.0 5.9 5.9
Men 20 years and overWomen 20 years and overTeenagers
Households heads
White workersNegro workers
4.55.9
17.4
3.8
5.610.5
4.45.8
16. 7
3.6
5.69.4
4.3 4.35.4 5.9
17.3 15.7
3.4 3.6
5.4 5.39.6 10.7

I - 21
After showing virtually no change in the first half of
1971, the civilian labor force has grown rapidly, and in May was 2.1
million above a year earlier. About two-thirds of the increase
occurred among women and teenagers, apparently due in part to a
return of so-called "discouraged workers" to active job seeking.
Large increases in the labor force are not unusual in this stage of
a recovery when job opportunities are increasing.
Earnings. Average hourly earnings of production workers
on private nonfarm payrolls (adjusted for inter-industry shifts)
increased at an annual rate of 5.8 per cent from last August (just
before the freeze) to May; during the pre-freeze months of 1971,
earnings rose at an annual rate of 6.7 per cent. Since this January,
earnings have risen at only a 4.7 per cent annual rate, but this
figure is strongly influenced by the usually small April-to-May
increase--3.5 per cent (annual rate). Recent increases in manu-
facturing have been near the Pay Board guideline of 5.5 per cent while
the rise in trade, finance and services has been much smaller.
HOURLY EARNINGS INDEX*(Per cent change; seasonally adjusted, annual rate)
Jan. 1971- Aug. 1971- Jan. 1972-
Aug. 1971 May 1972 May 1972
Private nonfarm 6.7 5.8 4.7
Manufacturing 6.1 6.2 5.7Mining 8.0 6.5 3.1Construction 9.0 6.0 4.8Transportation & P.U. 8.0 9.7 6.8
Trade 6.5 4.1 2.5Finance 7.6 4.2 3.7Services 4.4 5.5 3.6
* Adjusted for inter-industry shifts and, in manufacturing only, forovertime hours.

I - 22
Meat prices. In May, beef and pork prices at the farm and whole-
sale levels reversed their earlier decline. They continued to rise after
the WPI pricing date in the second week of the month, reaching levels
by late May and early June that were around their February peaks. Retail
prices--according to the Department of Agriculture's chainstore sample
(confidential)--fell from their February-March peak through the first
week of May. The CPI, which is priced during the first week of the
month, may reflect this low for May and then begin in June to reflect
the advances at farm and wholesale levels; some of this increase, however,
would reflect the usual seasonal rise in retail beef and pork prices
after April to a peak in August.
BEEF AND PORK-ESTIMATED PRICES AND MARGINSIndexes 1/, 1967=100 1/
1971 Percentage change
Nov. Feb. Mar. Apr. May 2/ Nov. 1971 to
May 1972 2/
BeefRetail valueCarcass value 3/Net farm value
Spread:Farm-retailCarcass-retail
orkRetail valueWholesale valueNet farm value
Spread:Farm-retailWholesale-retail
128.7130.6132.6
121.6123.7
106.2105.697.4
115.7108.3
140.2139.1141.5
140.2133.0135.7
135.6130.1132.5
137.8 148.3 141.2143.1 158.6 149.6
121.0122.5132.8
118.2117.9120.1
116.4113.2116.1
108.3 116.0 116.7115.9 119.1 126.8
133.9135.9137.2
128.0128.9
116.1118.6129.6
4.04.13.5
5.34.2
9.312.333.1
101.5 -12.3107.6 -. 6
1/ Calculated from USDA dollars-and-cents estimates for choice beef and pork.2/ Not for publication; preliminary four-week estimates based on chainstore sample
for retail prices. (Department of Agriculture).3/ Average wholesale price multiplied by "carcass equivalent" (the average carcass
weight required per pound of retail beef sold).

I - 23
Retail meat prices tend to lag wholesale prices and to
fluctuate less. Between November and February, however, retail beef
prices rose about parallel with wholesale prices and then, more
typically, declined less. Margins therefore rose sharply and, although
they have since declined, still appear well above last November levels
and nearly 30 per cent above those in 1967. The advance in retail beef
prices in the next few months may be significantly less than recent
increases in farm and wholesale prices if widening of margins is limited.
(The margin--or spread--between beef prices at the farm and at retail,
as estimated by the Department of Agriculture, has averaged 34 per cent
of retail prices over the past decade). In addition, the usual seasonal
rise amounts to 1.4 per cent between April and August.
Some improvement in margins for pork can be expected in view
of the squeeze indicated by the preliminary (confidential) May estimates.
Seasonal influences, as measured for the CPI, however, allow for an
increase in pork prices of about 4 per cent between April and their
August high.
For the second half of the year, the Department of Agriculture
still expects an improvement in beef supplies; projections will be
revised in mid-July taking into account new cattle-on-feed data.
So far this year,marketings have been smaller than projected on the
basis of recent cattle-on-feed reports; the hypothesis is that the
cattle are being fed longer in view of the profitable feeding margin
and this will eventually help swell marketings.

I- 24
Wholesale prices. Wholesale prices increased at a season-
ally adjusted annual rate of 5.6 per cent from April to May, close
to the average rate of rise in the first six months of Phase II.
Industrial commodities continued to rise at about the
post-freeze annual rate of 4.1 per cent. Advances for textile
products, lumber and plywood, machinery and equipment, and fuels
and power contributed most to the rise although increases were
widespread.
Prices of consumer and producer non-food finished goods
increased more slowly in May than in April, but the rates of
increase since the end of last year's freeze still exceed those
for the pre-freeze period in 1971. Crude materials prices have
advanced rapidly since November; in May, higher prices for cattle
hides and a less-than-seasonal decline for nonferrous scrap mainly
accounted for the large increase.
The May advance in the index of farm and food products,
at a rate of 9.5 per cent, included large increases for livestock,
meat, eggs, cotton, and wool. More recently prices of livestock
and meat have climbed further.

I - 25
WHOLESALE PRICES
(Percentage changes, at seasonally adjusted annual rates)
All commodities
Farm products 1/
Industrial commoditiCrude material 2/Intermediate mate]Finished goods 4/
ProducerConsumer
Pre-stab.periodDec.1970
tobAug. 1971
5.2
6.5
Les 4,73/ 3.3
rials 4 6.52.73.72.2
Phase IAug. 1971
to
Nov. 1971
-.2
1.1
".52.3-. 7-. 9-2.0
-. 4
PhaseNov.1971
toMay 1972
5.2
7.8
4.18.84.43.34.33.1
IIApr. 1972
toMay 1972
5,6
9.5
4.315.1
6.32,12.02.1
Phase I +Phase IAug. 1971
toMay 1972
3.4
5.5
2.66.62.71.92.21.9
1/ Farm products and processed foods and feeds.2/ Excludes foods, plant and animal fibers, oilseeds, and leaf tobacco.3/ Excludes intermediate materials for food manufacturing and manufactured animal feed4/ Excludes foods.
Increases in prices of industrial commodities have been
widespread during Phase II, with a few groups showing especially sharp
advances. Those five groups (out of 13) with the largest contributions
to the increase on a seasonally unadjusted basis accounted for 68 per
cent of the rise in the six months following the freeze compared with
83 per cent in the six months prior to the freeze. Estimates using
seasonally adjusted data suggest, however, that the proportion of
prices showing increases was not so different in the two periods.

I - 26
PERCENTAGE CONTRIBUTIONS TO THE INCREASE IN PRICEOF INDUSTRIAL COMMODITIES
Feb. 1971 to Nov. 1971 toAug. 1971 May 1972
(Seasonally unadjusted)
Metals and metal products 31.6 17.4Lumber and wood products 22.3 14.2Textile products and apparel 11.0 12.4Machinery and equipment 9.9 12.1Nonmetallic minerals products 8.2 --Transportation equipment -- 11.4
83.0 67.5

DOMESTIC FINANCIALSITUATION

II-T-1
SELECTED DOMESTIC FINANCIAL DATA(Dollar amounts in billions)
Latest data Net change fromIndicator Period Level Month Three Year
ago months ago ago
Monetary and credit aggregatesTotal reserves
Reserves available (RPD's)Money supply
M1M2M3
Time and savings deposits(Less CDs)
CDs (dollar change)Savings flows (S&Ls + MSBs)Bank credit (end of month)
Market yields and stock pricesFederal funds wk. endg.Treasury bill (90 day) "
Commercial paper (90-119 day) "New corporate bonds Aaa "
Municipal bonds (Bond Buyer) 1 dayFNMA auction yield wk. endg.Dividends/price ratio (Common
stocks) "NYSE index (12/31/65=50) end of day
MayMay
MayMayMay
MayMayMayMay
6/76/76/76/96/86/126/7
6/14
32.930.0
235.7486.5759.1
250.836.2
272.6516.5
4.483.864 .487.255.327.622.88
59.66
8.47.9
3.68.7
10.2
13.11.5
12.917.7
SAAR <per cent)
15.910.3
7.89.2
11.8
10.62.4
16.513.2
Percentage or index points.24.25
-. 02-. 03-. 07-.01-. 04
1.05.34.60.11.14.08.02
-. 33
Credit demands
Business loans at commercialbanks (dollar change)
Consumer instalment credit outstandingMortgage debt outst. (major holders)Corporate bonds (public offerings)Municipal long-term bonds (gross
offerings)Federally sponsored Agcy. (net borrowing)U.S. Treasury (net cash borrowing)
MayAprilAprilJune
JuneJuneJune
Net changeCurrent month1972 1971
1.1 0.91.1 0.74.3 e 3.11.6 e 2.1
1.9O .6 e
-3.8 e
2.2-0.4-3.1
Total of above items
or gross offeringsYear to date
1972 1971
5.1 2.84.1 1.3
15.0 10.3
8 .6 e 12.6
9.9e2 .d
-2.4
42.3
10.9-2.0
3.2
39.1
e - Estimated.
8.77.4
5.38.9
11.5
12.67.7
16.312.4
.29-. 57-. 75-.80
-. 69-. 29
.21
4.30

II - 1
DOMESTIC FINANCIAL SITUATION
Interest rates have changed little on balance since the last
Committee meeting, although the Federal funds rate has edged higher.
In the corporate and tax-exempt bond markets, underwriters in May had
been pricing issues aggressively in view of the moderating forward
calendar of public offerings. Although investor hesitancy led to an
accumulation of underwriter inventories and syndicate terminations in
early June, the resultant increase in yields simply returned rates to
their mid-May levels.
Total deposit growth at banks continued to be rapid in May,
even though expansion in private demand balances moderated further, as
total time and savings deposit growth accelerated to the most rapid
rate since January. As in April, outstanding negotiable CD's rose
sharply in May, particularly at those banks experiencing sustained
business loan demands; anticipation of June tax date run-offs also
appeared to be a factor in these sales. Other time deposits continued
their post-April-tax-date strength, suggesting that at least some of
the slowdown of such inflows in March-April was associated with final
payments on personal income taxes. The most recent survey of time and
savings deposits indicates no significant change in bank offering rates
on consumer-type CD's.
With funds inflows large, all categories of bank loans and
investments rose in May. Banks stepped up their purchases of longer-
term municipals, real estate and consumer loans continued to expand
rapidly, and business loans outside of New York City showed significant
growth for the fifth consecutive month.

II - 2
Inflows to the nonbank thrift institutions on the other hand,
appear to be moderating somewhat. Nevertheless, outstanding mortgage
commitments at savings and loan associations rose further in April, and
mortgage credit remains readily available. In mid-June the lessening
of earlier marginal pressures in the mortgage market was evidenced by
a leveling off in FNMA auction yields and a decline in lender demands
for forward commitments from FNMA.
Outlook. The projected increase in the pace of economic
activity, along with renewed Treasury demands on the securities markets,
is likely to be associated with upward pressures on short-term interest
rates as the third quarter progresses. While the amount of net cash
borrowing that the Treasury will need to undertake in the third quarter
is uncertain, the staff feels that it could be as large as $9 billion,
financed mainly in the short-term area. The increased bill supply, when
coupled with the current unusually large spread of the Federal funds
rate over the 3-month Treasury bill, suggests that the largest increase
in market rates is likely to occur in the bill market.
Barring a significant change in investor expectations regarding
inflation or monetary policy, rising short-term rates this summer may
have a less than usual impact on long-term rates. The spread between
short- and long-term rates is quite wide and capital market credit
demands--particularly public bond offerings--are likely to remain
significantly below the first quarter pace as the refinancing of bank
and other short-term borrowing by corporations of the past two years
now appears to be over. In contrast to public corporate bond offerings,
tax-exempt volume is expected to remain large, and some additional upward

II - 3
rate pressure could develop in this market, particularly if bank funds
are diverted by business loan demands, Treasury issues, or a reduced
rate of deposit inflows.
As inventory and other working capital needs of businesses
expand, business loan demands at banks should continue to be relatively
strong this summer. Although bank inflows of time and savings deposits
other than CD's are likely to slow from their recent pace as short-term
market interest rates rise, banks have ample portfolio liquidity and
access to negotiable CD's to meet these increased business loan demands
and simultaneously to absorb some of the Treasury's new issues. However,
as short-term rates rise, upward pressure on the prime rate is likely
to develop.
With short-term market rates rising, inflows to nonbank
thrift institutions this summer should also remain below the unusually
rapid pace of earlier this year. Nevertheless, with mortgage credit
demands expected to abate along with the anticipated reduction in
housing starts, mortgage interest rates should be under only modest
upward pressure in the immediate months ahead. Consequently, the
Federal housing agencies are unlikely to be called upon for any
substantial increase in market support operations this summer.
Monetary Aggregates. Growth in M1 decelerated further in
May to an annual rate of about 3.5 per cent. While M1 growth has been
moderating since early April, the slowdown in May appears to be largely
associated with delayed processing of individual income tax payment
checks by Internal Revenue. Had these checks cleared shortly after
receipt instead of early May, private demand balances would have been

II - 4
lower in late April and higher in early May. Over April-May combined,
M1 expanded at a 5.7 per cent rate, and for the first five months of
the year grew at a 7.9 per cent rate.
MONETARY AGGREGATES(Seasonally adjusted changes)
1971 1972QIII QIV QI March April May p
Per cent at annual rates
M1 (Currency plus privatedemand deposits)
M2 (M1 plus commercial banktime and savings depositsother than large CD's)
M3 (M2 plus savings depositsat mutual savings banksand S&L's)
Adjusted bank credit proxy
Time and savings depositsat commercial banks
a. Total
b. Other than large CD's
3.7 1.1 9.3 11.9 8.2 3.6
4.4 8.0 13.3 11.6 7.7 8.7
7.8 9.6 15.5 13.8 11.1 10.2
7.6 9.7 11.3 17.7 13.9 15.0
8.2 15.9 14.8 7.8 12.4 17.8
5.3 14.7 17.1 10.8 7.8 13.1
Billions of dollars 1/
Memorandum:
a. U.S. Governmentdemand deposits
b. Negotiable CD's
c. Nondeposit sourcesof funds
2.3 -.4 .1 2.4 1.3
2.3 1.8 -. 1 -. 4 1.3 1.5
-. 4 -- -. 3 .1 -. 2
p Preliminary and partially estimated.1/ Month-to-month and last-month-in-quarter to last-month-in-quarter
changes in averages, not annualized.

II - 5
Since the April tax date, inflows of consumer-type time deposits
have been strong in almost all parts of the country, despite essentially
unchanged differentials between yields on market instruments and bank
offering rates. This rapid deposit growth follows a slowing in March
and early April, when individuals needed funds to meet large income tax
payments. Time and savings deposits other than CD's grew at a 13 per cent
rate in May, bringing the month's expansion of M2 to about an 8.5 per
cent rate.
Net sales of large CD's also continued strong in May, with
expansion broadly based at banks outside New York City, where business
loans continued to show strength; in early June New York banks also
increased their CD's significantly. Some of the CD growth--particularly
the most recent expansion in New York--may reflect bank positioning for
large expected CD run-offs around the June tax-date.
With moderation of growth in private demand balances more
than offset by rapid expansion in total time and savings deposits, and
with Treasury balances not declining from their high level, the adjusted
credit proxy in May expanded at a rapid rate (15.0 per cent) for the
third consecutive month. For the first five months of 1972, this
measure of growth in total member bank funds has grown at a 12.7 per
cent annual rate.
Bank Credit. Growth in bank credit, as measured by the last-
Wednesday-of-month series, rebounded to over an 18 per cent rate in
May, following a sharp drop in April. Since the April growth rate had
been distorted by credit movements late in that month, the 11 per cent
rate of growth for April and May combined is probably more indicative

II - 6
of growth trends in this series. Increases were large in all categories
of earning assets in May. Growth in security loans, not shown separately
in the table, showed substantial growth as both dealer inventory positions
and margin credit increased.
COMMERCIAL BANK CREDIT ADJUSTED FOR LOANSSOLD TO AFFILIATES 1/
(Seasonally adjusted changes at annual percentage rates)
1971QIII QIV
2/Total loans & investments 2/ 9.7 11.1
U.S. Treasury securities -18.5 5.3Other securities 12.0 20.1Total loans 2/ 14.7 9.4
Business loans 2/ 14.4 -3.4Real estate loans 14.2 14.2Consumer loans 13.3 13.6
1/ Last-Wednesday-of-month series.2/ Includes outstanding amounts of loans
banks to their own holding companies,foreign branches.
QI
15.1
9.916.115.79.6
14.711.7
1972Apr. May
3.6 18.4
3.9 7.7-1.1 23.25.0 18.8
12.0 10.914.2 16.98.5 10.6
Apr. -May
11.0
5.811.012.011.515.6
9.6
reported as sold outright byaffiliates, subsidiaries, and
Business loans continued the growth pattern that began early
this year, with substantial expansion at banks outside of New York City
and relative weakness at large New York City banks. The small increase
in business loans at these latter institutions presumably reflects the
previous high level of market financing and improved cash flows of
large corporations, and their resultant high liquidity and reduced
need to seek bank credit. Press reports and market analysts have
suggested that the weakness in business loans at New York City banks
also reflects substantial repayments by foreign and domestic borrowers
of loans obtained last summer to speculate against the dollar. Staff

II - 7
analysis of the industrial categories of loans thought to be associated
with such speculation last year 1/ fails to find confirmation of this
hypothesis, although our data are not adequate for drawing firm con-
clusions. Repayments of such loans so far this year have held back
net growth in all business loans--perhaps by 1.5 per cent (annual rate)--
but reductions of loans in these categories were just as large outside
as in New York City.
GROWTH IN BUSINESS LOANS ADJUSTED FOR LOANSSOLD TO AFFILIATES 1/
First Five Months of the Year, 1968-72(Billions of dollars, not seasonally adjusted)
1968 1969 1970 1971 1972
Large banks in New York City2 / -. 9 .1 .2 -. 9 -. 9
Other large banks- / .5 2.7 -. 4 -. 2 1.3
Total large banks/ -,4 2.8 -. 2 -1.1 .4
All other banks-2 .7 1.3 .8 .8 1.3
Total all banks .3 4.1 .6 -. 3 1.7
1/ Includes outstanding amounts of business loans reported as sold outrightby banks to their own holding companies, affiliates, subsidiaries, andforeign branches.
2/ Weekly reporting banks.3/ Estimated.
1/ Foreign commercial and industrial loans, bankers' acceptances,and loans to firms in wholesale trade.

II - 8
Even with the weakness at New York City banks, aggregate busi-
ness loans so far this year have shown significant growth, as shown in
the table. Although a step-up in bank credit demands is to be expected
with the expansion in economic activity and the moderation in capital
market financing, the growth in total business loans appears to be
somewhat larger than might be expected in the light of corporate finan-
cial positions and expenditures. This strength may be reflecting a
more rapid growth in the book value of inventories than indicated by
preliminary data. In addition, it could be associated with nonfinancial
corporate hesitancy to use the commercial paper market after their 1970
experience; outstanding dealer placed commercial paper, after declining
from 1970 to mid-1971, has been essentially unchanged for about a year.
Consumer credit. The April increase in consumer instalment
credit outstanding amounted to nearly $13.2 billion, seasonally adjusted
annual rate. This advance followed a record $16.4 billion rise in
March. All types of credit showed substantial further growth in April,
but the rate of expansion moderated for the three largest categories--
automobile, other consumer goods, and personal loans.
Extensions of instalment credit decreased slightly from March
but remained well above any other previous month. Extensions of automo-
bile credit increased for the fourth month in a row, but this rise was
more than offset by decreasesin non-automotive goods and personal loans.
Repayments on outstanding debt edged up to a new high in April.

II - 9
NET CHANGE IN CONSUMER INSTALMENT CREDIT OUTSTANDING(Billions of dollars, seasonally adjusted annual rates)
Other Home repairconsumer Personal and
Total Automobile goods loans modernization
1971 - QI 2.7 .4 .6 1.7 .1QII 6.7 2.3 1.8 2.3 .3QIII 10.3 3.7 2.8 3.5 .3QIV 12.4 4.5 4.0 3.5 .3
1972 QI 11.9 4.1 4.0 3.4 .4
April 13.2 5.1 3.5 3.9 .6
Nonbank financial institutions and mortgage markets. Savings
inflows to nonbank thrift institutions slowed during May, according to
estimates based on sample data, but an average of April and May probably
provides a better measure of recent experience. This average shows a
less pronounced moderation in inflows than suggested by the May figure
alone.
Although commercial banks experienced an increase in deposit
growth during May, there is little likelihood that this represented a
shift of funds out of thrift institutions, since some loss in yield
would accompany the transfer of funds to commercial banks.
The seasonally adjusted volume of outstanding commitments
at the thrift institutions continued to rise in April. However, new
commitment activity slowed somewhat from the extraordinarily high
March pace. Reflecting a rise in commitments earlier in the year,
total mortgage debt held by the major financial institutions and by
FNMA and GNMA increased at a seasonally adjusted monthly rate of $4.3
billion in April, 2 per cent more than in March. One measure of the
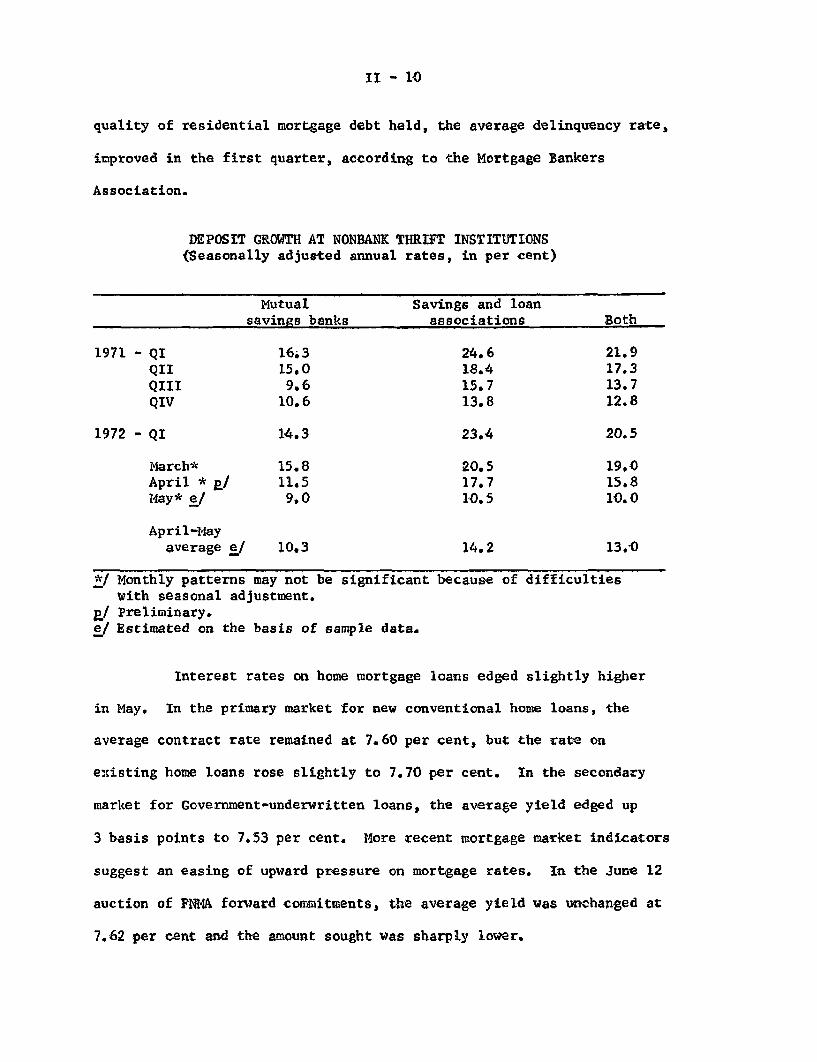
II - 10
quality of residential mortgage debt held, the average delinquency rate,
improved in the first quarter, according to the Mortgage Bankers
Association.
DEPOSIT GROWTH AT NONBANK THRIFT INSTITUTIONS(Seasonally adjusted annual rates, in per cent)
Mutual Ssavings banks
1971 - QI 16.3QII 15.0QIII 9.6QIV 10.6
1972 - QI 14.3
March* 15.8April * p/ 11.5May* e/ 9.0
April-Mayaverage e/ 10.3
*/ Monthly patterns may not be significanwith seasonal adjustment.
p/ Preliminary.e/ Estimated on the basis of sample data.
avings and loanassociations
24.618.415.713.8
23.4
20.517.710.5
14.2
t because
13.0
of difficulties
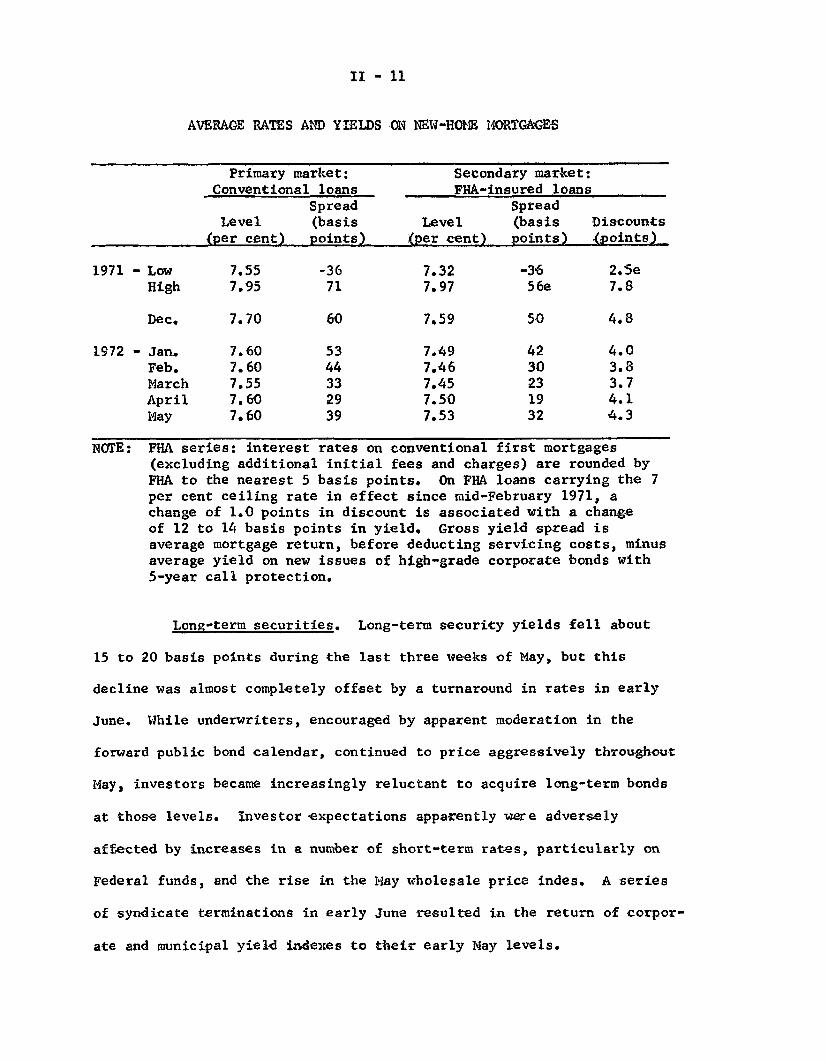
Interest rates on home mortgage loans edged slightly higher
in May. In the primary market for new conventional home loans, the
average contract rate remained at 7.60 per cent, but the rate on
existing home loans rose slightly to 7.70 per cent. In the secondary
market for Government-underwritten loans, the average yield edged up
3 basis points to 7.53 per cent. More recent mortgage market indicators
suggest an easing of upward pressure on mortgage rates. In the June 12
auction of FNMA forward commitments, the average yield was unchanged at
7.62 per cent and the amount sought was sharply lower.
Both
21.917.313.712.8
20.5
19.015.810.0
II - 11
AVERAGE RATES AND YIELDS ON NEW-HOME MORTGAGES
1971 -
1972 -
NOTE:
Long-term securities. Long-term security yields fell about
15 to 20 basis points during the last three weeks of May, but this
decline was almost completely offset by a turnaround in rates in early
June. While underwriters, encouraged by apparent moderation in the
forward public bond calendar, continued to price aggressively throughout
May, investors became increasingly reluctant to acquire long-term bonds
at those levels. Investor expectations apparently were adversely
affected by increases in a number of short-term rates, particularly on
Federal funds, and the rise in the May wholesale price indes. A series
of syndicate terminations in early June resulted in the return of corpor-
ate and municipal yield indexes to their early May levels.
Primary market: Secondary market:Conventional loans FHA-insured loans
Spread SpreadLevel (basis Level (basis Discounts
(per cent) points) (per cent) points) (points)
Low 7.55 -36 7.32 -36 2.5eHigh 7.95 71 7.97 56e 7.8
Dec. 7.70 60 7.59 50 4.8
Jan. 7.60 53 7.49 42 4.0Feb. 7.60 44 7.46 30 3.8March 7.55 33 7.45 23 3.7April 7.60 29 7.50 19 4.1May 7.60 39 7.53 32 4.3
FHA series: interest rates on conventional first mortgages(excluding additional initial fees and charges) are rounded byFHA to the nearest 5 basis points. On FHA loans carrying the 7per cent ceiling rate in effect since mid-February 1971, achange of 1.0 points in discount is associated with a changeof 12 to 14 basis points in yield. Gross yield spread isaverage mortgage return, before deducting servicing costs, minusaverage yield on new issues of high-grade corporate bonds with5-year call protection.

II - 12
SELECTED LONG-TERM INTEREST RATES(Per cent)
U.S. Gov't.Long-term (10-year
New Aaa State and constant
corporate bonds 1/ local bonds maturity)
1971Low 6.76 (1/25) 4.97 (10/21) 5.42 (3/26)High 8.23 (5/21) 6.23 (6/24) 6.89 (7/30)
1972Low 6.36 (1/14) 4.99 (1/14) 5.87 (1/14)High 7.42 (4/4) 5.54 (4/4) 6.22 (4/21)
Week of:May 5 7.20 5.35 6.16
12 7.20 5.39 6.1819 7.25 5.29 6.1426 7.19 5.19 6.05
June 2 7.09 5.15 6.059 7.25 5.31 6.12
1/ With call protection (includes some issues with 10-year protection).2/ Bond Buyer (mixed qualities).p/ Preliminary.
Stock prices since the end of May have declined on balance,
following appreciable increases in the last 3 weeks of May. Press
reports indicate investors may have been concerned about the increased
pressure for tax reform, the outcome of the Presidential primaries, and
the sharp run-up in gold prices. Volume on all exchanges has remained
moderate, with trading on the NYSE averaging 15.3 million shares daily
during May and somewhat less most recently.
With industrial corporations virtually absent from the
market, public bond offerings in May were about $1.6 billion. The
staff estimates that June public bond volume will be $1.5 billion,

II - 13
and the July total could be as low as $1.2 billion. At least two
large previously scheduled issues were placed privately in May, and
negotiations for a number of such placements by other industrial
corporations have been announced recently. Since no information on
the takedown pattern of these private placements is available, the
estimates of current and future private bond volume are subject to
an unusual degree of uncertainty. Staff estimates indicate a continued
high level of corporate stock and private bond issues in May and June,
as shown in the accompanying table. Total corporate securities offerings
are expected to show some seasonal decline in July.
SELECTED STOCK PRICE INDEXES(Per cent change)
D-JIndustrials NYSE AMEX NASDAQ
March 29 - April 12 +3.6 +3.6 +2.7 +4.4
April 12 - May 9 -4.3 -5.3 -5.1 -5.5
May 9 - June 12 +1.3 +2.1 +1.3 +3.7
June 1 - June 12 -2.5 -2.4 -1.4 -2.1

II - 14
CORPORATE AND MUNICIPAL LONG-TERM SECURITY OFFERINGS(Monthly or monthly averages, in millions of dollars)
1972First
1971 quarter May e/ June f/ July-
Corporate securities - Total 3,758 3,268 3,300 3,500 2,600
Public bonds 2,065 1,787 1,600 1,500 1,200Privately placed bonds 613 531 700 800 550Stock 1,080 950 1,000 1,200 850
State and local gov't.securities 2,080 1,985 1,870 1,900 1,800
e/ Estimated.f/ Forecast.
Yields on long-term municipal bonds, after declining almost
25 basis points during May, rose sharply in the second week of June
and now stand at about the level prevailing just before the May 23
Committee meeting. Both commercial banks and casualty insurance
companies continued to acquire tax-exempt bonds at a high rate during
May. In recent days, however, yields on tax-exempts have risen in
response to the same factors influencing other long-term markets.
The May volume of State and local long-term offerings was
almost $1.9 billion, with a number of revenue bonds brought to market,
apparently in response to the rate declines in late May. The staff
expects June volume to remain close to the May level, as several
large pre-refunding offerings have been accelerated by the issuance
of Treasury regulations about arbitrage bonds, which became effective
in July. The impact of these rulings on future volume of pre-refunding
issues is indeterminate at this time.

II - 15
Short-term security markets. Most short-term rates
have drifted up slightly since early June. However, over the inter-
meeting interval they have generally increased by less than the 1/4 per
cent rise in the Federal funds rate.
Rate advances averaging about 1/8 per cent in the commercial
paper market have been accompanied by an increase of about $700 million
in the volume of non-bank related commercial paper in May on a seasonally
adjusted basis. The entire increase occurred in directly placed paper.
The overall increase for the January to May period now totals about
$450 million, $400 million of which has been in directly-placed paper.
The bill rate, however, is now quoted around 3.84 per cent,
about the same as at the time of the last meeting. Upward rate pressure
in this market was moderated by the Treasury's decision (announced
May 31) not to refund the maturing $1.2 billion June 15 bond, which
is expected to generate demand for bills, and indications that new
cash will not be needed until well into July. Also, the supply of
bills will be reduced by the runoff of June tax bills.
Desk activity in the open market for System Account has
been unusually light since about mid-April. The last bill purchase
on an outright basis in the market was on April 14. For some of the
period since then the reserve effect of swings in the Treasury's
balance at the Federal Reserve has lessened the need for Desk action.
System activity in the form of market transactions was also reduced
by direct bill purchases from foreign accounts; some of these accounts
were selling bills and switching into coupon issues.

II - 16
SELECTED SHORT TERM INTEREST RATES(Per cent)
Federal funds
Treasury bills
3 month
6 month
1 year
Federal agency
1 year
Commercial paper
90-119 day
60-89 day CD's
May 24
4.241/
3.84
4.21
4.51
4,93
4.38
4.38
1972June 7
4.481/
3.88
4.26
4.61
4.96
4.50
4.38
June 13
4.48/
3.84
4.23
4.59
4.96
4.501/
4.383 /
Basis point changeMay 24 - June 13
24
--
2
8
3
12
Weekly average.
6-day average.
Latest available data are for June 7.

II - 17
Federal finance. The mid-year Budget review, released June 5,
projects unified budget deficits of $26.0 billion in the current fiscal
year and $27.0 billion in fiscal year 1973. Compared to the January
Budget, the mid-year review anticipates faster growth in receipts in
fiscal 1972 and a slower increase in fiscal 1973, largely as a result
of overwithholding this year and larger refunds next spring. However,
the projected budget deficit will not significantly increase from fiscal
1972 to fiscal 1973, because of plans to reduce sharply the rate of
growth of outlays from 10.2 per cent in fiscal 1972 to 7.3 per cent in
fiscal 1973. An even sharper deceleration in spending growth had been
estimated in the January Budget. The NIA translation of the unified
budget, however, indicates a different pattern of expenditures.
Applying the timing adjustments incorporated in the January Budget
to the outlays shown in the mid-year review suggests that NIA ex-
penditures may increase by about 11 per cent in fiscal 1973.
The Staff estimates of both receipts and outlays (unified
budget basis) for fiscal 1973 are about $2.0 billion higher than those
shown in the mid-year review. The Staff projects higher outlays for
defense ($2.0 billion), social security benefits ($3.0 billion) and
interest ($1.0 billion) but lower amounts for revenue sharing
(-$2.2 billion), unemployment compensation (-$1.0 billion) and other
grants (-$0.8 billion). Our estimate of defense outlays reflects
Secretary Laird's resent statement that accelerated activity in the
II - 18
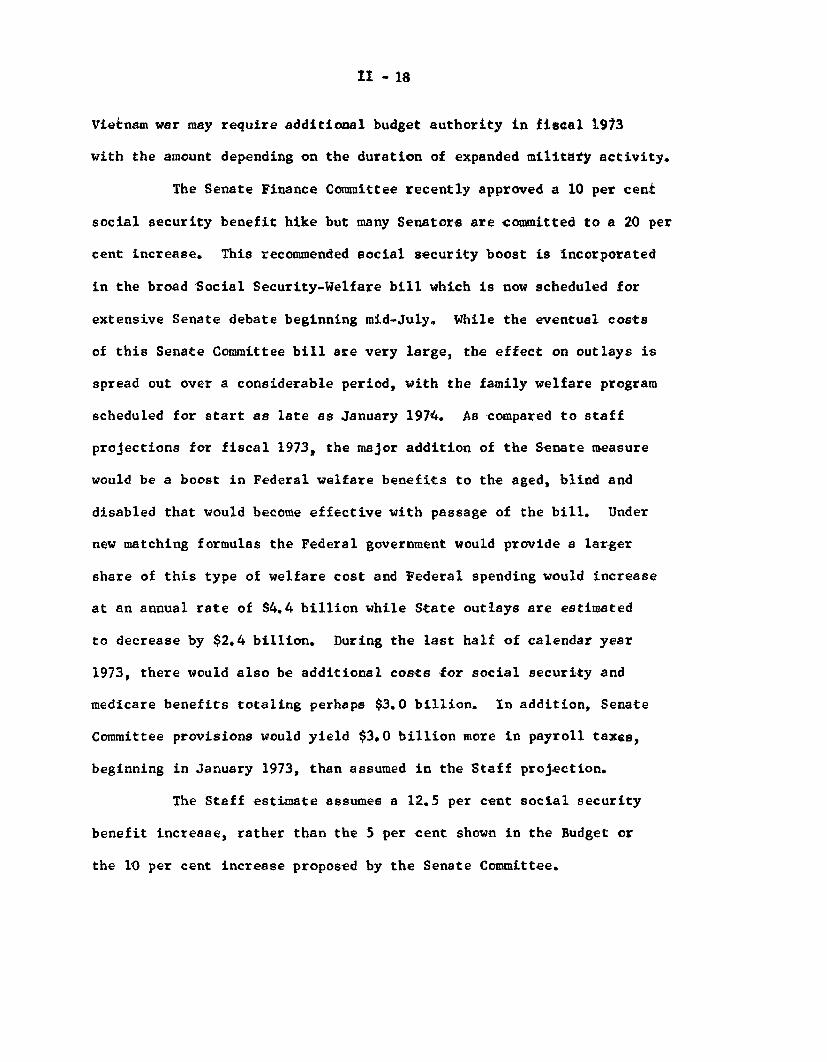
Vietnam war may require additional budget authority in fiscal 1973
with the amount depending on the duration of expanded military activity.
The Senate Finance Committee recently approved a 10 per cent
social security benefit hike but many Senators are committed to a 20 per
cent increase. This recommended social security boost is incorporated
in the broad Social Security-Welfare bill which is now scheduled for
extensive Senate debate beginning mid-July. While the eventual costs
of this Senate Committee bill are very large, the effect on outlays is
spread out over a considerable period, with the family welfare program
scheduled for start as late as January 1974. As compared to staff
projections for fiscal 1973, the major addition of the Senate measure
would be a boost in Federal welfare benefits to the aged, blind and
disabled that would become effective with passage of the bill. Under
new matching formulas the Federal government would provide a larger
share of this type of welfare cost and Federal spending would increase
at an annual rate of $4.4 billion while State outlays are estimated
to decrease by $2.4 billion. During the last half of calendar year
1973, there would also be additional costs for social security and
medicare benefits totaling perhaps $3.0 billion. In addition, Senate
Committee provisions would yield $3.0 billion more in payroll taxes,
beginning in January 1973, than assumed in the Staff projection.
The Staff estimate assumes a 12.5 per cent social security
benefit increase, rather than the 5 per cent shown in the Budget or
the 10 per cent increase proposed by the Senate Committee.

II - 19
The staff also assumes that the social security benefit hike
and revenue sharing will be retroactive to July 1, 1972. The mid-year
budget review assumes that revenue sharing will be retroactive to
January 1, 1972. In the Staff projections retroactive payments are
made in late September, but unless the social benefit hike is enacted
within the next few weeks, further slippage of the retroactive social
securities payments is likely.
On the receipts side, the staff assumes that the retroactive
(to January 1972) increase in the social security wage base, which adds
$2.3 billion to the Administration estimate of fiscal 1973 receipts, will
be postponed until January 1973. Our higher estimate of fiscal 1973
receipts is due mostly to higher income assumptions.
As shown in the table below, the high employment budget as
measured by the staff, showed little change from the last half of
calendar 1971 to the first half of calendar 1972. The shift toward
deficit in the first half of 1972 that was anticipated in the January
Budget did not develop because the scheduled tax cuts and stepped-up
expenditures were largely offset by the unanticipated overwithholding.
STAFF ESTIMATE OF ACTUAL AND HIGHEMPLOYMENT SURPLUS/DEFICIT (-)
(Billions of dollars, annual rates, NIA accounts)
NIA High employmentCalendar years deficit surplus/deficit
1971 H-2 -26.2 4.0
1972 H-le -16.9 4.3
H-2e -26.0 -8.3
1973 H-le -32.0 -17.5
H- 2 e -13.3 1.0
e - estimated.

II - 20
From the first to the second half of this calendar year,
however, the high employment budget is expected to shift toward
deficit by nearly $13 billion. This shift reflects the rapid
increase in expenditures--especially for Vietnam, social security
and revenue sharing--and some reduction in overwithholding. To a
large extent the further shift toward deficit in the first half
of 1973 reflects the net reduction in receipts because of large
refunds resulting from overwithholding. By the last half of 1973,
however, our projections suggest a marked reduction in fiscal stimulus.
Of course, this estimate rests on the assumption that Congress will
not institute new expenditure programs beyond the measures discussed
above.
It should be noted that traditionally the high employment
budget has incorporated the full effect of temporary tax and
expenditure changes.1 / However, the economic impact of such
temporary measures is less certain than that of permanent tax or
expenditure adjustments and, thus, the high employment budget may
not accurately reflect the degree of fiscal stimulus. Similarly
the revenue effect of the investment tax credit may be a poor
indicator of the amount of stimulation provided by that measure.
1 The Administration has not revised its estimate of high employmentreceipts (unified budget basis) as a result of overwithholdingand, hence, the shift toward deficit in fiscal 1973, shownin the Staff projections, does not appear in the Administrationhigh employment estimates.

II - 21
The Treasury's cash balance at the end of this fiscal year
is now expected to be about $7.8 billion, about $ .6 billion higher
than estimated in the May 17 Greenbook. The Staff continues to
expect that the Treasury will need to raise large amounts of funds,
perhaps $18 billion, in the second half of this calendar year. In
the near-term the Treasury has some flexibility because it still
holds about $1.5 billion of Treasury bills previously acquired from
the German central bank in an exchange of special issues for marketable
issues. These bills can be sold at the Treasury's discretion. Never-
theless, Treasury borrowing in July and August may total $8-9 billion,
with the first financing not expected until the second half of July.

II - 22
PROJECTION OF TREASURY CASH OUTLOOK(In billions of dollars)
May June July Aug.
Total net borrowing -.4 -3.8 4.8 3.7
Weekly and monthly bills -.2 - .4 -- --Tax bills -- -3.0 --Coupon issues -.7 -1.2 -- -.3As yet unspecified new
borrowing -- -- 4.0 4.0Other (debt repayments, etc.) .5 0.8 .8 -
a/ b/Plus: Other net financial sources- 1.8 -- -.4 -.7
Plus: Budget surplus or deficit (-) -3.4 1.9 -6.2 -3.2
c/Equals: Change in cash balance -2.0-/ -1.9 -1.8 -.2
Memoranda: Level of cash balanceend of period 9.7 /' 7.8 6.0 5.8
Derivation of budgetsurplus or defict:
Budget receipts 16.5 24.8 14.8 18.5Budget outlays 19.9 22.9 21.0 21.7
Maturing coupon issuesheld by public 2.4 1.1 -- 2.3
iet agency borrowing .4 .6 .3 .4
a/ Checks issued less checks paid and other accrual items.b/ Includes $0.8 billion of capital gains from gold revaluation.c/ Actual.d/ The Treasury auctioned $1.8 billion of notes and bonds in a partial
refunding of the $2.4 billion maturing. The remaining $700million was redeemed in cash.

FEDERAL BUDGET AND FEDERAL SECTOR IN NATIONAL INCOME ACCOUNTS(In billions of dollars)
Fiscal 1972 e/Mid-year F.R.Review Board
Fiscal 1973 e/Mid-year F.R.Review Board
CalendarYear
1972 1/
I Calendar QuartersF. R. B. Staff Estimates
1972 1973I* II III IV I II
Pederal Budget
(Quarterly data, unadjusted)Surplus/deficit
ReceiptsOutlays
Means of financing:Net borrowing from the publicDecrease in cash operating balanceOther 2/
Cash operating balance, end of period
3/Memo: Net agency borrowing-3
National Income Sector
(Seasonally adjusted annual rate)Surplus/deficitReceiptsExpenditures
High employment surplus/deficit(NIA basis) 1/
-26.0207.0233.0
n.a.n.a.n.a.
n.a.
n.a.
n.a.n.a.n.a.
b.a.
-24.5207.0231.5
19.21.04.3
-27.0223.0250.0
n.a.n.a.n.a.
7.8 n.a.
5.2 n.a.
-21.5211.7233.2
n.a.
n.e.n.a.
4.1 n.a.
-26.5225.5252.0
25.3.5.7
7.3
n.e.
-29.0232.5261.5
-12.8
-23.5222.6246.2
15.63.74.3
-10.548.158.6
4.565.861.4
3.9 -6.33.6 -. 13.0 2.0
7.6 7.7 7.8 8.5
n.e.
-21.4227.4248.8
-8.457.265.6
-9.151.560.6
-12.550.963.4
9.2 8.8 8.3-. 7 .9 2.2-. 1 -. 6 2.0
3.566.62.5
-1.0 H-1.9 t
-. 6
7.6 5.4 7.3
.4 1.5 1.1 n.e. n.e. n.e.
-13.3 -20.1222.1224.0235.5 24.1
-27.1228.6255.7
-24.9235.0259.9
-2.0 8.3 .3 -8.1 -8.7
* Actual e--projected n.e.--not estimated1/ Estimated by F. R. Board Staff.2/3/
n.a.--not available
Includes such items as deposit fund accounts and clearing accounts.Federally-sponsored credit agencies, i.e., Federal Home Loan Banks, Federal National Mortgage Assn., FederalLand Banks, Federal Intermediate Credit Banks, and Banks for Cooperatives.
-29.6-34.4234.9231.6264.5266.
-15.1-19.4

INTERNATIONALDEVELOPMENTS

6/14/72
Goods and services, net 1/Trade balance 2/
Exports 2/Imports 2/
Service balance
Remittances and pensionsGovt. grants & capital, net
III -- T - 1U.S. Balance of Payments
In millions of dollars; seasonally adjusted
1971 1972 p/Year QI Feb.* Mar.* Apr.
U.S. private capital (- = outflow)Direct investment abroadForeign securitiesBank-reported claims -- liquid
" " " otherNonbank-reported claims -- liquid
" " " other
Foreign capital (excl. reserve trans.)Direct investment in U.S.U.S. corporate stocksNew U.S. direct investment issuesOther U.S. securities (excl. U.S. Govt.)Liquid liabilities to:
Commercial banks abroadOf which liab. to branches
Other private foreignersIntl. & regional institutions
Other nonliquid liabilities
Reserve liab. to foreign official institutions
U.S. monetary reserves (increase, -Gold stockSpecial drawing rights 3/IMF gold trancheConvertible currencies
Errors and omissions
BALANCES (deficit -) 3/Official settlements, S.A.
"I " , N.S.A.Net liquidity, S.A." " , N.S.A.
Liquidity, S.A. 4/" , N.S.A.
727-2,68942,770
-45,4593,416
-1,529-3,937
-1,147-1,67311,809
-13,482
-387-802
-6283,793
1-4,421
-6553,835-4,490
-7353,711
-4,446
-9.782 -2.879-4,765 -994
-909 -388 -81 -46 42-566 -518 -215 -174 318
-2,372 -764 -296 -367 -184-506 -175 -83 -137-664 -40
-5.037 1.280-68 -335849 679 153 273 80
1,161 309272 78
-6.691 528 183 -5 868-6,90 "- 438 202 58 929
(-4,942' (-238) (-425) (331) (437)-465 61 42 -1 46682 29 -61 -62 -107
-560 21
27,417 2,848 772 1,011 277
3,065 607 549 60 -15-=T 544 544 -- Tr
468 -- -- -- 71,350 -1 5 -4 195
381 64 -- 64 -217
-10,928 480
-3,455-30.482 -3 258 -1 31 -1.071 -262
-3,290-22,719 -3.075 -1.206 -755
-23. 791-3,983-3 824 -1.504 1-1.066 -1.130
S----J- - - -* Monthly, only exports and imports are seasonally adjusted.1/ Equals "net exports" in the GNP, except for latest revisions.2/ Balance of payments basis which differs a little from Census basis.3/ Excludes allocations of SDRs as follows: $717 million on 1/1/71 and $710 million
on 1/1/72.4/ Measured by changes in U.S. monetary reserves, all liabilities to foreign official
reserve agencies and liquid liabilities to commercial banks and other foreigners.Noce - Firct quarter data are prelirinary and Strictly Confidential (F-).

III - 1
INTERNATIONAL DEVELOPMENTS
Summary and outlook. The improvement in the U.S. balance of
payments noted four weeks ago has been maintained since then. In the
four weeks through June 7 there were surpluses on both the official
settlements basis and the net liquidity basis, the former over $400
million and the latter apparently at least as large.
The latest available merchandise trade data are for April.
These show an even larger excess of imports that month than in February
or March. Publication of the April trade results late in May may
have been a factor in the recent weakening of exchange market quota-
tions for the dollar. Nevertheless, in the first week of June,
despite large repayments of liabilities by commercial banks to their
branches and other banks abroad, foreign official reserves showed
little increase in total over the week.
It appears virtually certain that some unwinding of last
year's shift in leads and lags of commercial payments, along with other
unidentified transactions as well as known short-term inflows, is
helping to equilibrate international receipts and payments, which
otherwise would be tending to produce large monthly deficits in the
U.S. balance of payments. Possibly these equilibrating inflows have
become much larger than earlier in the year.
In the first quarter of this year -- according to preliminary
data to be published near the end of June -- there was a deficit on
current and long-term capital accounts of $3.3 billion and net outflows
of recorded short-term capital amounting to $0.7 billion. The over-all

III - 2
deficit (before SDR allocation) was nevertheless no more than $3.5
billion, as the errors and omissions account showed a positive balance
(of $0.5 billion) for the first time in several years.
The outlook as described four weeks ago included a gradual
improvement in the current account extending on into 1973-74; and
further net private capital inflows in coming months, so long as
confidence in the viability of the Smithsonian realignment holds and
interest rate relationships remain about as at present. No significant
change in this description of the outlook is needed now, but the
disappointingly poor April trade results lead us to change the estimate
of net exports of goods and services in the current half year from
about minus $2-1/2 billion (annual rate) to about minus $3 billion.
The recent experience also casts some doubt on the considerable improve-
ment expected later this year. The staff's present net export projection
for the second half year is a small positive balance (less than $1/2
billion, annual rate).
U.S. balance of payments. Preliminary data for April and
May indicate a considerable improvement in the overall balance on
the official settlements basis in these months. In April the balance
was a small deficit of $250 million; in May the balance shifted into
a surplus on the order of $500 million. These balances compare with
a monthly average deficit of $1.1 billion in the first quarter. Since
the trade deficit increased further in April (described below) and
foreign purchases of U.S. stocks in April fell from the very high

III - 3
levels of the first quarter, it would appear that little of this
improvement can be attributed to a decrease in the deficit on current
account and long-term capital transactions, which amounted to about
$3-1/4 billion in the first quarter.
Some part of the improvement in April and May stemmed from
inflows of short-term capital, which more than offset the continuing
large deficit on current account and long-term capital transactions.
U.S. banks reduced their claims on foreigners in April, though weekly
data show no further reduction in May. Probably more important was
the reversal of last year's unrecorded outflow. Preliminary confidential
data for the first quarter accounts show net "errors and omissions"
positive by $500 million, compared with the exceptionally high
negative quarterly average of $2.7 billion in 1971. Such reflows
may have risen in April and May as advance payments for imports were
worked down and interest rates shifted in a favorable direction.
If confidence in the new exchange rate structure is sustained, even
larger positive "errors and omissions" in the months ahead should
help to equilibrate the overall balance.
Another factor reducing the official settlements deficit
in April was a sizable increase in liabilities to foreign branches
of U.S. banks and in liabilities reported by U.S. agencies of foreign
banks. There appears to have been a further inflow of short-term
funds from foreign banks in May, but on a reduced scale. In the

III - 4
first week of June, however, there was a reduction of nearly $500 million
in liabilities to foreign banks, of which about half was a reduction
in liabilities to foreign branches at the end of a reserve computation
period. Nevertheless, there was little change in that week in
aggregate liabilities to foreign official accounts.
Other data available on first quarter transactions indicate
that the outflow of U.S. capital for direct investment abroad was
about $1 billion, still substantial but less than the $1-1/4 billion
outflow recorded in each of the first and second quarters of 1971.
There was also a large outflow of funds -- about $300 million --
from foreign direct investors in the United States, principally by
Japanese trading companies. These companies were also responsible for
large outflows of funds last year -- probably in order to pay in
advance for imports when the yen was expected to be revalued. These
outflows should be reversed in the course of the year.
U.S. foreign trade. The U.S. trade deficit in April increased
further over the very high deficits of the preceding two months.
Imports in April dipped only slightly from the very strong level in
March while exports fell more sharply, principally because of much
lower deliveries of commercial aircraft.
Prices of both exports and imports -- as measured by unit
values -- rose at about equal rates in April so that the effect of
prices on the trade balance was not significant. The rise in the

III - 5
April import unit-value index was less than the rise in either
February and March, and was mainly in prices of foodstuffs and
semi-finished materials; prices of imports of finished manufactures
were unchanged. In February and March, finished manufactures did
account for most of the overall increase in import unit values, but
the March-April level of the index for this group was up only 6 per-
cent from a year earlier. This was less of a rise than in each of
the preceding two 12-month periods.
For the four months January-April the trade deficit was at
an annual rate of about $7 billion (balance of payments basis) com-
pared with a $4-1/2 billion rate in the last half of 1971. Imports
in the first four months averaged about 16 percent higher than in the
second half of 1971; exports were about 11 percent higher. The levels
of both exports and imports in the first four months were inflated, to
some degree, by a catchup in shipments delayed by dock strikes.
Although trade movements in the first four months of this
year were distorted by the effects of dock strikes, it appears that
much of the current strength in exports is in shipments to Canada
(affected only slightly by the strikes), particularly in machinery
and automotive equipment. Exports to Western Europe in January-April
were little changed from those of a year ago while increased deliveries
of aircraft accounted for most of the rise in exports to Japan.
The rise in imports this year has been widespread, covering
all major product categories. The sharp expansion in domestic

III - 6
automobile sales has resulted in increasing entries of cars from
Canada. While sales of foreign cars (other than those from Canada)
in the United States in the first five months have slipped below
year-earlier levels, imports have risen, resulting in larger
inventories. Though some of the inventory increase probably stems
from the introduction of new models, part of the increase probably
was involuntary. Deliveries of light trucks, made in Japan for Ford
and General Motors, also boosted imports of automotive equipment this
year. Imports of other consumer goods, as well as capital equipment
(office machines, textile machinery) also are up sharply this year.
While imports of textiles continued their long-term uptrend in the
first three months of this year, there was a sharp drop in arrivals
in April, probably reflecting the first effects of the "voluntary"
textile agreement reached at the beginning of the year. Much of the
increase in imports of industrial materials this year has been in
petroleum and lumber.
Merchandise imports in the first four months were much
greater than can be readily explained by the economic variables
normally used in forecasting equations. Possibly such temporary
factors as heavy bunching of deliveries of goods ordered and paid
for last year may help to explain this development.
Foreign exchange markets. Over the past month, the dollar
weakened against most major currencies, and, as of June 14, is

III - 7
generally at its lowest levels since early March. The release of
U.S. trade figures for April -- showing a further increase in the
trade deficit -- combined with the Commerce Department's forecast
that the 1972 trade deficit would exceed last year's and press
reports of statements by Under Secretary Volcker which seemed not
to rule out further devaluations of the dollar, all tended to
weaken confidence and depress exchange rates for the dollar.
Exchange rates for the Canadian dollar and the French
franc have been particularly firm in recent weeks, reflecting
tight money market conditions in Canada and France, as well as the
general weakness of the dollar. The Canadian dollar reached a high
of $1.0263 on June 9, nearly 2 percent higher than a month ago.
During that one-month period the Bank of Canada purchased $260
million. On June 12, the Canadian dollar backed off as Canadian
banks, under pressure from the government, lowered their rates paid
on large term deposits to 5-1/2 percent from as high as 6-1/4 percent,
and the Bank of Canada sold $35 million, moderating the decline in
the Canadian dollar's exchange rate. Subsequently, however, the
rate rebounded and the Bank of Canada again purchased U.S. dollars
in the market.
The French franc has been at or close to its ceiling for
the past three weeks, and Bank of France intervention purchases
haveamounted to $140 million. On June 2, the Bank of France,

III - 8
concerned about excessive domestic monetary expansion, announced
an increase in marginal reserve requirements on certain commercial
bank assets.
In contrast to other European currencies, sterling has
eased against the dollar in the past month, mainly in response to
an actual and prospective further reduction in the U.K. trade and
current account balances. As of June 14, sterling was near its
(EEC) lower limit against the French franc.
The Japanese yen has remained fairly steady over the past
several weeks, about mid-way between its central rate and its upper
limit. Japan's continuing large current account surplus is apparently
being offset by capital outflows, including repayment of loans from
foreign banks, encouraged by official Japanese dollar deposits with
Japanese commercial banks. (These deposit transactions initially show up
as decreases in Japanese official reserves and as a reduction in
the U.S. official settlements deficit.)
In the six-week period since May 3, reserves of 9 major
foreign countries have declined by about $200 million, with Japanese
reserve decreases of $500 million more than offsetting Canadian and
French reserve gains, mentioned above. Swiss reserves fell by over
$80 million, with most of this decline accounted for by System swap
repayments from the proceeds of Swiss franc purchases in the exchange
markets.

III - 9
The gold market continued to experience large fluctuations
in price in recent weeks as speculative demand alternately waxed and
waned. A peak of $66.75 was reached in London on June 8. By June 12,
the price had fallen as low as $59.00, but subsequently has come
back to around $61.00. For the most part, speculation in gold seemed
unrelated to any expectation of an increase in the official monetary
price of gold, but rather to views about the scarcity of gold as a
commodity, in the face of rising industrial and commercial demands
and dwindling South African supplies.
In official transactions, the System repaid $300 million
equivalent of Swiss franc and $20 million equivalent of Belgian franc
swap drawings. All of the Belgian francs and $250 million equivalent
of Swiss francs were purchased directly from the respective central
banks of issue, while the balance of the Swiss franc payment was
made from proceeds of market purchasesof that currency. Outstanding
System swap obligations now amount to a little over $2-1/2 billion,
down by $1/2 billion from August 1971.
Euro-dollar market. Near the end of May interest rates
for Euro-dollar deposits of one-month and shorter maturities began
to rise moderately and have continued to move up through the first
half of June. Rates on three-month and longer deposits have not
changed substantially since early May.
The recent advances in the shorter-term Euro-dollar rates
have somewhat outpaced increases in U.S. interest rates of comparable

III - 10
maturity over the same period. For example, the overnight Euro-
dollar rate, which has been about 4-1/4 percent in recent days
(compared to about 3-5/8 percent in mid-May),is presently only
about 1/4 percent below the Federal funds rate (versus about 5/8
percent before both rates began to rise toward the end of last
month). The table below presents additional details and makes
rate differential comparisons after adjustment of Euro-dollar rates
to reflect the additional cost to U.S. banks of maintaining
borrowings in excess of their reserve-free bases.
SELECTED EURO-DOLLAR AND U.S. MONEY MARKET RATES
Average for (1) (2) (3) (4) (5) (6)month or Over- 1-month 30-59 dayweek ending night Federal Differential Euro-$ CD rate DifferentialWednesday Euro-$./ Fundsl/ (l)-(2) (*) Depositi/ (Adi.) 3 / (4)-(5) (*)
1972 - Jan. 4.58 3.50 1.08 (2.23) 5.02 3.81 1.21 (2.47)Feb. 4.02 3.29 0.73 (1.74) 4.46 3.43 1.03 (2.15)Mar. 3.87 3.83 0.04 (1.01) 5.05 3.80 1.25 (2.51)Apr. 3.92 4.17 -0.25 (0.73) 4.72 4.44 0.28 (1.46)May 3.79 4.27 -0.48 (0.47) 4.25 4.21 0.04 (1.10)
May 24 3.64 4.24 -0.60 (0.31) 4.14 4.21 -0.07 (0.97)31 3.81 4.38 -0.57 (0.57) 4.38 4.21 0.17 (1.27)
June 7 4.06 4.48 -0.42 (0.60) 4.52 4.34 0.18 (1.31)14214.15 4.47 -0.32 (0.72) 4,60 4.34 0.26 (1.41)
1/ All Euro-dollar rates are noon bid rates in the London market; over-night rate adjusted for technical factors to reflect the effective cost of
funds to U.S. banks.2/ Effective rate.3/ Offer rates (median, as of Wednesday) on large denomination CD's by
prime banks in New York City; CD rates adjusted for the cost of requiredreserves.
*/ Differentials in parentheses are after adjustment of Euro-dollarrates for the 20 percent marginal reserve requirement (relevant to bankswith borrowings in excess of their reserve-free bases).
p/ Preliminary.

III - 11
The greater rise in very short Euro-dollar rates relative
to U.S. rates may reflect the firmer tone in foreign national
money markets that normally tends to develop as the end of the
second quarter approaches. In addition, French and Canadian
money markets have been tight in recent weeks, independently of
seasonal influences. (See discussion beginning on page III - 12).
Over the coming quarter-end, Swiss banks are expected to repatriate
perhaps as much as $3/4 billion for balance sheet window dressing.
But these temporary reflows will be accommodated by BNS swaps with
the banks (under which the BNS will place the dollar proceeds of the
swaps in the Euro-dollar market); thus, these repatriations should
have little net impact on the Euro-dollar market or the U.S. balance
of payments.
U.S. banks' Euro-dollar positions subject to Regulations
M and D totaled about $2.2 billion in the four-week computation
period ended May 10, essentially unchanged from the two previous
computation periods. U.S. banks raised their Euro-dollar borrowings
early in the computation period ended June 7 but reduced these
borrowings in the last week of May and the first week of June to
avoid incurring required reserves; partial data indicate little
change in these borrowings on average in the four-week period
ended June 7.

III - 12
Financial developments in selected industrial countries.
Except in Japan and Italy, it seems that the decline in short-term
interest rates abroad has about run its course; indeed, given the
outlook for faster expansion in several major countries, an upward
movement seems likely. Long-term rates have been rising in recent
months in Germany, the United Kingdom, Canada, the Netherlands, and
Switzerland.
It seems fairly clear that the active use of monetary
policy to stimulate economic recovery, together with the influence
of declining rates in the United States, were important factors in
bringing down short-term rates abroad. But the continuation of
unacceptably high rates of inflation has presumably been a factor
in the earlier turn-around of long-term rates.
The following paragraphs set forth the staff view regard-
ing the trend of interest rates in principal countries in the near
future, in the light of the prevailing conjunctural situation.
Interest rates in Germany are likely to begin to rise in
response to cyclical pressure, even if monetary policy is not overtly
tightened. German interest rates have come down considerably further
since the Smithsonian meeting and are now back to early 1969 levels.
The downward movement of long-term rates began to be reversed in
March. A rising budget deficit and stronger economic activity combine
to augur for a continuation of the upward movement of recent weeks.

III - 13
The underlying economic situation has improved a great deal
in recent months. Activity, as reflected by industrial output and
labor market statistics, has picked up. Order inflows and upward re-
visions of investment intentions indicate that the recovery is
spreading.
The liquidity position of the private sector in Germany is
no longer being augmented by large inflows of funds from abroad, and
the Bundesbank, in an effort to slow what the authorities think may
be too fast a recovery in view of the inflation problem, has moved to
neutralize the liquidity effect of the DM 6 billion tax repayments
that the government is making from accounts that had been frozen at
the Bundesbank. Effective with the repayment, rediscount quotas are
being reduced and reserve requirements raised. The announcement of
these measures has already produced a stiffening of rates for 30 and
90 day credit, while intermediate rates have moved up even more sharply,
indicating that the market anticipates a further tightening of monetary
conditions.
Short-term rates have been tending to rise in the United
Kingdom since January, though they fell back in March and early April
before turning up again. Long-term rates have been rising since March
and particularly strongly since early May. Factors that will continue
to exert upward pressure on interest rates are the huge public sector
borrowing requirement in fiscal year 1972-73 and the current and
III - 14
forecast upswing in economic activity. The London clearing banks
raised their base rates (to which deposit and lending rates are
tied) from 4-1/2 to 5% on June 9. The base rate rise reflects the
strong demand for loans at a time when the growth of deposits is
slowing and the banks' reserve ratios are approaching the new mini-
mum level of 12-1/2 per cent.
Expectations of inflation have clearly been an important
factor in keeping long-term interest rates relatively high in the
United Kingdom. Indeed, the recent rise in long-term rates might
be attributed very largely to price expectations that have been
revised upward (a) because of the outlook for wage increases in the
wake of the miners' strike, and (b) by the rapid rate of growth of the
money supply since the end of 1971 -- 20 per cent at an annual rate,
which is lower than in the fourth quarter of 1971 but higher than in
the first quarter of last year.
Canadian interest rates have been rising since the beginning
of the year and both short- and long-term interest rates will probably
continue to rise as the economy proceeds along the upswing of the
business cycle. At the same time, the monetary aggregates have been
increasing rapidly and the new budget is on balance expansionary.
Canadian GNP is projected to grow at 6-6-1/2% in real terms in 1972;
the annual rate reached 6.2% in the second half of 1971. Although
there is concern about inflationary pressures in Canada, the reduction

III - 15
of the unemployment rate, which remains unacceptably high, is a major
goal of government policy. For this reason, and in order to mitigate
upward pressure on the exchange rate, Canadian monetary policy is
expected to remain basically accommodating, as exemplified by official
pressure on banks that resulted in the lowering of their borrowing
rates for large time deposits by as much as one percentage point on
June 12.
The already low level of interest rates in France and the
prospect of some pick-up in economic activity make a further reduction
in French short-term interest rates unlikely.
The French government has recently revised upward its economic
forecasts. Real GDP is now expected to grow at a somewhat faster rate
in 1972 than in 1971. But the rate of inflation is also expected to
be somewhat higher this year than last. The recent increase in the
marginal reserve requirements on banks' assets (reserves against assets
were first introduced in France in April 1971) was interpreted at the
time as a sign of official concern about the implication for prices of
the recent rapid rate of monetary expansion; M 2 increased about 20 per
cent at an annual rate, seasonally adjusted, in the first quarter of
this year.
Short-term interest rates in Switzerland have also risen
somewhat following moves by the Swiss National Bank to reduce the
banks' liquidity through the imposition of a marginal reserve

III - 16
requirement on their domestic liabilities and a more restrictive
interpretation of the 100 per cent marginal reserve requirement on
net foreign liabilities. The main preoccupation of the Swiss
authorities is still inflation. Reports of a new acceleration in the
rate of rise in aggregate demand in early 1972 have increased their
anxiety in this matter.
Interest rates in Japan have generally been declining since
November 1970 and are likely to continue to do so in the near future.
Such a movement would be appropriate for both domestic and inter-
national reasons. Reductions in bank loan and deposit rates have
been proposed as part of Japan's seven point yen "defense" program
approved by the cabinet on May 23.
Japan's long-awaited economic upswing has apparently begun,
though so far only at a relatively modest pace. Industrial production
has generally been increasing since last November. Producers' ship-
ments have been rising and inventories of finished goods have been
declining. New orders for machinery, however, remain weak.
A higher level of interest rates in Italy is not likely in
the foreseeable future. The late-1971 revival in economic activity
seems to have halted. Industrial production, which had recovered
briskly from August 1971 to January 1972, declined sharply in February
and apparently changed little in March. The substantial volume of
unutilized plant capacity, together with political uncertainties,

III - 17
continue to have a depressing effect on investment demand. Although
business surveys show industrialists becoming less pessimistic in
recent weeks, Governor Carli has recently presented a quite gloomy
picture of the economic outlook and the Bank of Italy seems unlikely
to act to raise interest rates or to allow market forces to raise
them.