Embed Size (px)
Citation preview
Hydraulic Laboratory Report HL-2009-02
Folsom Dam Joint Federal Project Existing Spillway Modeling Discharge Capacity Studies AMERICAN RIVER DIVISION CENTRAL VALLEY PROJECT MID-PACIFIC REGION
U.S. Department of the Interior Bureau of Reclamation Technical Service Center Hydraulic Investigations and Laboratory Group Denver, Colorado September 2009
REPORT DOCUMENTATION PAGE Form Approved OMB No. 0704-0188
The public reporting burden for this collection of information is estimated to average 1 hour per response, including the time for reviewing instructions, searching existing data sources, gathering and maintaining the data needed, and completing and reviewing the collection of information. Send comments regarding this burden estimate or any other aspect of this collection of information, including suggestions for reducing the burden, to Department of Defense, Washington Headquarters Services, Directorate for Information Operations and Reports (0704-0188), 1215 Jefferson Davis Highway, Suite 1204, Arlington, VA 22202-4302. Respondents should be aware that notwithstanding any other provision of law, no person shall be subject to any penalty for failing to comply with a collection of information if it does not display a currently valid OMB control number. PLEASE DO NOT RETURN YOUR FORM TO THE ABOVE ADDRESS. 1. REPORT DATE (DD-MM-YYYY) January 2008
2. REPORT TYPE Technical
3. DATES COVERED (From - To)
5a. CONTRACT NUMBER 5b. GRANT NUMBER
4. TITLE AND SUBTITLE Folsom Dam Joint Federal Project Existing Spillway Modeling - Discharge Capacity Studies
5c. PROGRAM ELEMENT NUMBER 5d. PROJECT NUMBER 5e. TASK NUMBER
6. AUTHOR(S) K. W. Frizell, J. P. Kubitschek, and R. F. Einhellig
5f. WORK UNIT NUMBER
7. PERFORMING ORGANIZATION NAME(S) AND ADDRESS(ES) U.S. Department of the Interior Bureau of Reclamation, Technical Service Center Hydraulic Investigations and Laboratory Services Group DFC, 86-86460, PO Box 25007, Denver, CO 80225-0007
8. PERFORMING ORGANIZATION REPORT NUMBER HL-2009-02
10. SPONSOR/MONITOR'S ACRONYM(S)
9. SPONSORING/MONITORING AGENCY NAME(S) AND ADDRESS(ES)
11. SPONSOR/MONITOR'S REPORT NUMBER(S)
12. DISTRIBUTION/AVAILABILITY STATEMENT National Technical Information Service (NTIS), 5285 Port Royal Road, Springfield, VA 22161. http://www.ntis.gov 13. SUPPLEMENTARY NOTES 14. ABSTRACT Several collaborative studies were performed in order to further study the discharge capacity for the existing spillway at Folsom Dam. Physical and numerical models were used in order to supply data for use in revised rating curves. Comparison of new data with existing data proved quite good with the exception of new data that includes the effect of the spillway bridge deck on large gated, high pool, discharges. In addition, the numerical model was used to provide improved estimates of per gate discharges depending on the particular gate. 15. SUBJECT TERMS Folsom Dam, Joint Federal Project, stepped spillways, energy dissipation, computational fluid dynamics 16. SECURITY CLASSIFICATION OF: 19a. NAME OF RESPONSIBLE PERSON
Robert Einhellig, Group Manager Hydraulic Investigations and Laboratory Services Group
a. REPORT
b. ABSTRACT a. THIS PAGE
17. LIMITATION OF ABSTRACT
18. NUMBER OF PAGES 33
19b. TELEPHONE NUMBER (Include area code) 303.445-2151
Standard Form 298 (Rev. 8/98) Prescribed by ANSI Std. Z39.18
Mission Statements
The mission of the Department of the Interior is to protect and provide access to our Nation's natural and cultural heritage and honor our trust responsibilities to Indian Tribes and our commitments to island communities.
___________________________
The mission of the Bureau of Reclamation is to manage, develop, and protect water and related resources in an environmentally and economically sound manner in the interest of the American public.
Acknowledgments Internal peer review of the computational approach and methods was provided by J. Higgs, Hydraulic Engineer and overall technical review was provided by T. Wahl, Hydraulic Engineer, both of the Bureau of Reclamation, Hydraulic Investigations and Laboratory Services Group. B. Dressel contributed significantly to the design and construction of both physical models, as well as the testing on those models. R. Campbell provided AutoCAD support and CFD model geometry files development.
Hydraulic Laboratory Reports The Hydraulic Laboratory Report series is produced by the Bureau of Reclamation’s Hydraulic Investigations and Laboratory Group (Mail Code 86-68460), PO Box 25007, Denver, Colorado 80225-0007. At the time of publication, this report was also made available online at http://www.usbr.gov/pmts/hydraulics_lab/pubs/HL/HL-2009-02.pdf
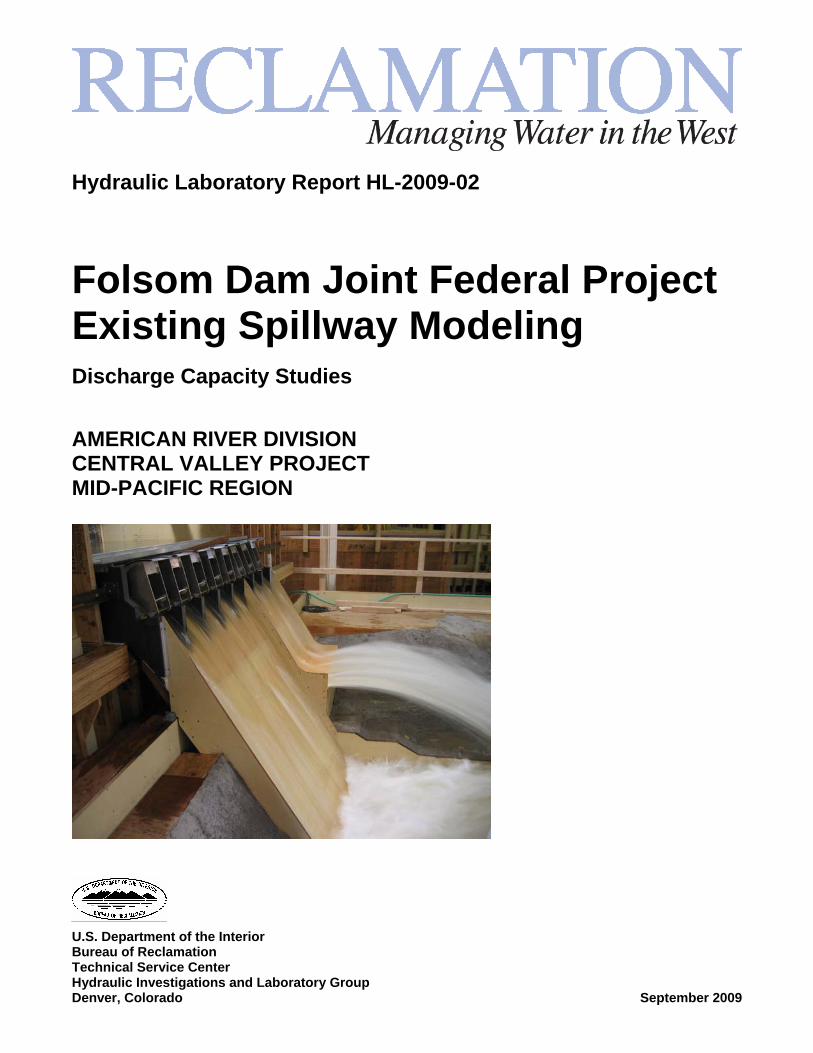
Disclaimer The information provided in this report is believed to be appropriate and accurate for the specific purposes described herein, but users bear all responsibility for exercising sound engineering judgment in its application, especially to situations different from those studied. References to commercial products do not imply endorsement by the Bureau of Reclamation and may not be used for advertising or promotional purposes. Cover Photo: 1:48 scale model of Folsom Dam during service spillway releases.
CONTENTS ELEVATION DATUM .......................................................................................... 1
PROJECT DESCRIPTION..................................................................................... 1
APPROACH ........................................................................................................... 5 Modeling Descriptions........................................................................................ 5
1:36 Scale Sectional Physical Model .............................................................. 5
1:48 Scale Physical Model.............................................................................. 8
CFD Model ..................................................................................................... 9
RESULTS ............................................................................................................. 12 1:36 Scale Sectional Physical Model................................................................ 12 1:48 Scale Physical Model................................................................................ 14 CFD Model ....................................................................................................... 16
Free-Discharge Capacity............................................................................... 16
Gate-Controlled Discharge Capacities.......................................................... 18
DISCUSSION....................................................................................................... 21 Maximum Spillway Capacity ........................................................................... 21 Transition Zone................................................................................................. 21 Generalized Design Criteria.............................................................................. 21 Physical Model Accuracy ................................................................................. 22
CONCLUSIONS................................................................................................... 22
REFERENCES ..................................................................................................... 23
TABLES
Table 1. Summary of CFD results for existing spillway discharge capacities..... 18
Table 2. Variation in multi-gate discharges as fraction of combined four-gate discharge. ...................................................................................................... 20
FIGURES
Figure 1. Elevation view of Folsom Dam concrete gravity section, viewed from downstream looking upstream. ....................................................................... 3
Figure 2. Profile of Folsom Dam spillway and stilling basin. .............................. 4
iii
Figure 3. 1:36-scale sectional model under construction in 4-ft-wide flume. ...... 6
Figure 4. Profile of 1:36 scale sectional model showing crest section and long-throated flume placement, flow from left to right........................................... 7
Figure 5. Folsom 1:48-scale confluence model. ................................................... 8
Figure 6. Folsom Dam CFD model geometry viewed from upstream and downstream. .................................................................................................. 10
Figure 7. CFD model geometry showing the nested 2-ft mesh (orange) through the crest section with the coarse 6-ft mesh (blue) for the reservoir. ............. 11
Figure 8. Long-throated flume calibration data from flows measured by the lab system and head measured using the hook gage/stilling well compared to WinFlume (theoretical) calibration............................................................... 13
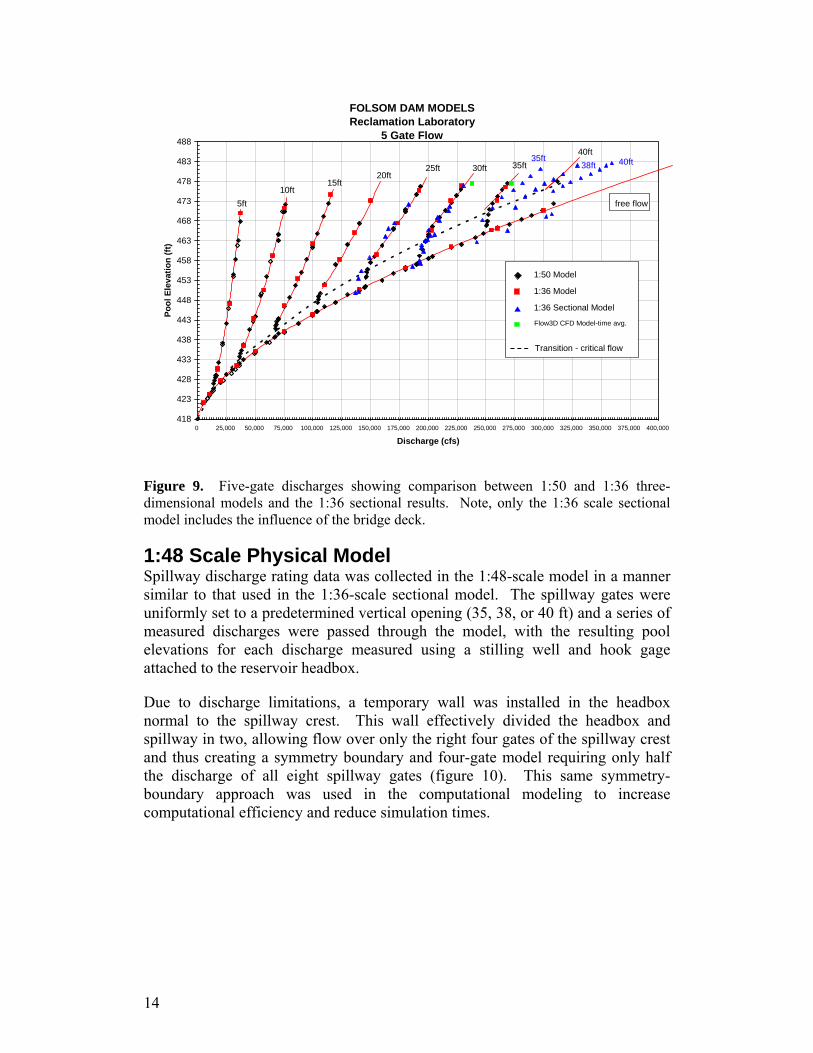
Figure 9. Five-gate discharges showing comparison between 1:50 and 1:36 three-dimensional models and the 1:36 sectional results. Note, only the 1:36 scale sectional model includes the influence of the bridge deck. ................. 14
Figure 10. 1:48-scale model with symmetry-boundary wall and 4-gate discharge........................................................................................................................ 15
Figure 11. Total existing service and emergency spillway capacity at Folsom Dam (8 gates) comparing 1:36-scale sectional model data with 1:48-scale confluence model. ......................................................................................... 16
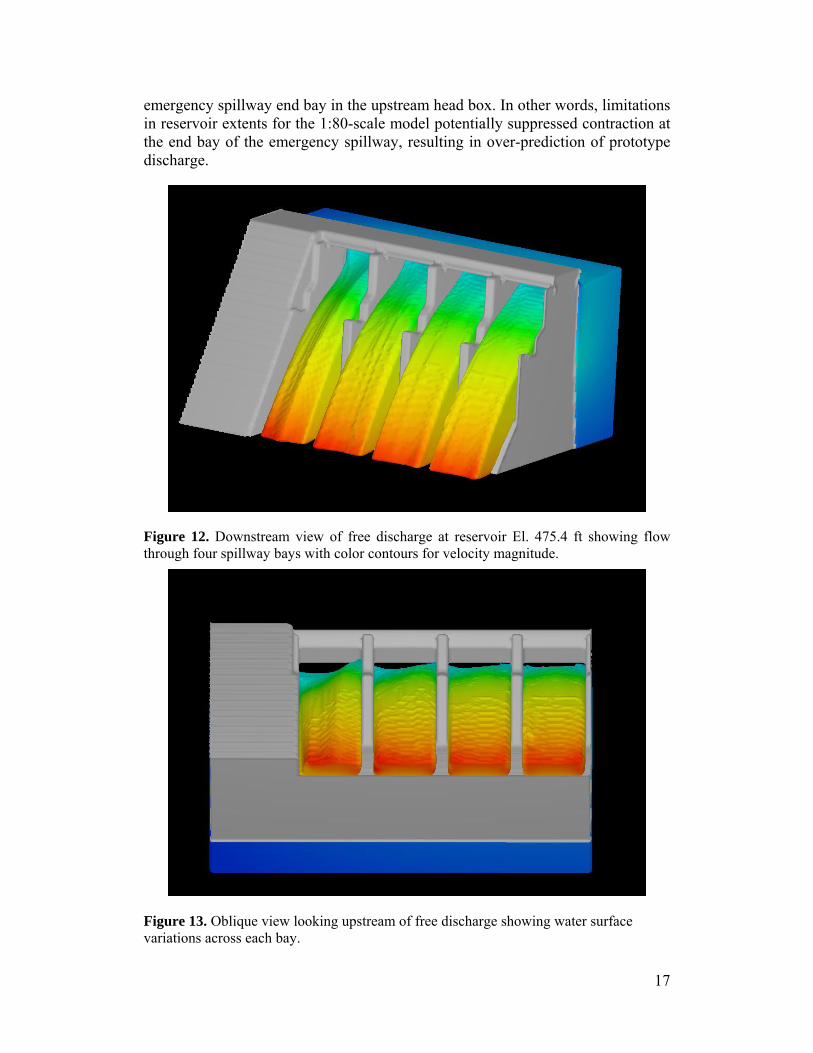
Figure 12. Downstream view of free discharge at reservoir El. 475.4 ft showing flow through four spillway bays with color contours for velocity magnitude........................................................................................................................ 17
Figure 13. Oblique view looking upstream of free discharge showing water surface variations across each bay. ............................................................... 17
Figure 14. 40-ft vertical gate opening discharge time series for Gates No. 1-4 at Res. El. 477.5 ft. Time averages were acquired over the last 150 seconds of simulation time.............................................................................................. 19
Figure 15. Free discharge time series for Gates No. 1-4 at Res. El. 475.4 ft....... 19
iv
LIST OF SYMBOLS AND ACRONYMS 3D Three dimensional CFD Computational Fluid Dynamics ft3/s Cubic feet per second GMRES Generalized Minimum Residual Method JFP Joint Federal Project NAVD88 North American Vertical Datum of 1988 NGVD29 National Geodetic Vertical Datum of 1929 PMF Probable Maximum Flood RNG Renormalization Group turbulence model USACE U.S. Army Corps of Engineer
v

This page was intentionally left blank
vi
1
Elevation Datum The Folsom project was originally designed and constructed using the National Geodetic Vertical Datum of 1929 (NGVD29) as an elevation reference. Design and construction documents for the current Joint Federal Project (JFP) at Folsom Dam are being prepared using the North American Vertical Datum of 1988 (NAVD88) as an elevation reference. In the vicinity of the Folsom project, the difference in numerical value between the two elevation references is approximately 2.34 ft (i.e., 0 ft NGVD29 equals 2.34 ft NAVD88). This difference in reference elevation between the original project drawings and the JFP drawings presents significant potential for confusion. At the request of the U.S. Army Corps of Engineers (USACE), all hydraulic modeling and reporting activities related to the JFP are to be done using the original NGVD29 elevation reference. Thus, all elevations in this document, unless otherwise noted, are referenced to the NGVD29 as used in the original project design documents and drawings.
Project Description Folsom Dam, located upstream of Sacramento on the American River in central California, was designed and constructed by the USACE. The Bureau of Reclamation (Reclamation) has operated Folsom Dam since construction was completed in 1956. Various hydrologic analyses which include the period of record since the project’s completion have led to a substantial increase in the identified Probable Maximum Flood (PMF) for the facility, as well as an increase in the identified flood risk for the Sacramento area. To address the dam safety and flood protection concerns raised by the most recent hydrologic information and analyses, Reclamation and the USACE agreed to work together on a Folsom Dam Joint Federal Project (JFP). The current JFP plan includes increasing both the low-level and total release capacities of Folsom Dam through the addition of an auxiliary spillway.
As part of the JFP, Reclamation’s Hydraulic Investigations and Laboratory Services Group in Denver, Colorado conducted scale physical and three-dimensional (3D) computational fluid dynamics (CFD) modeling of the existing service and emergency spillways to improve estimates of maximum gate-controlled discharge capacity for flood routing. The primary objective of these modeling activities was to identify the main spillway discharge capacities for eight-gate (service and emergency spillway) operation with large (35-40 ft) gate openings and a specified maximum reservoir water-surface elevation of 477.5 ft. A secondary objective was to observe which conditions resulted in fully gate-controlled flow, and which conditions were in the transition zone between gate control and free flow.
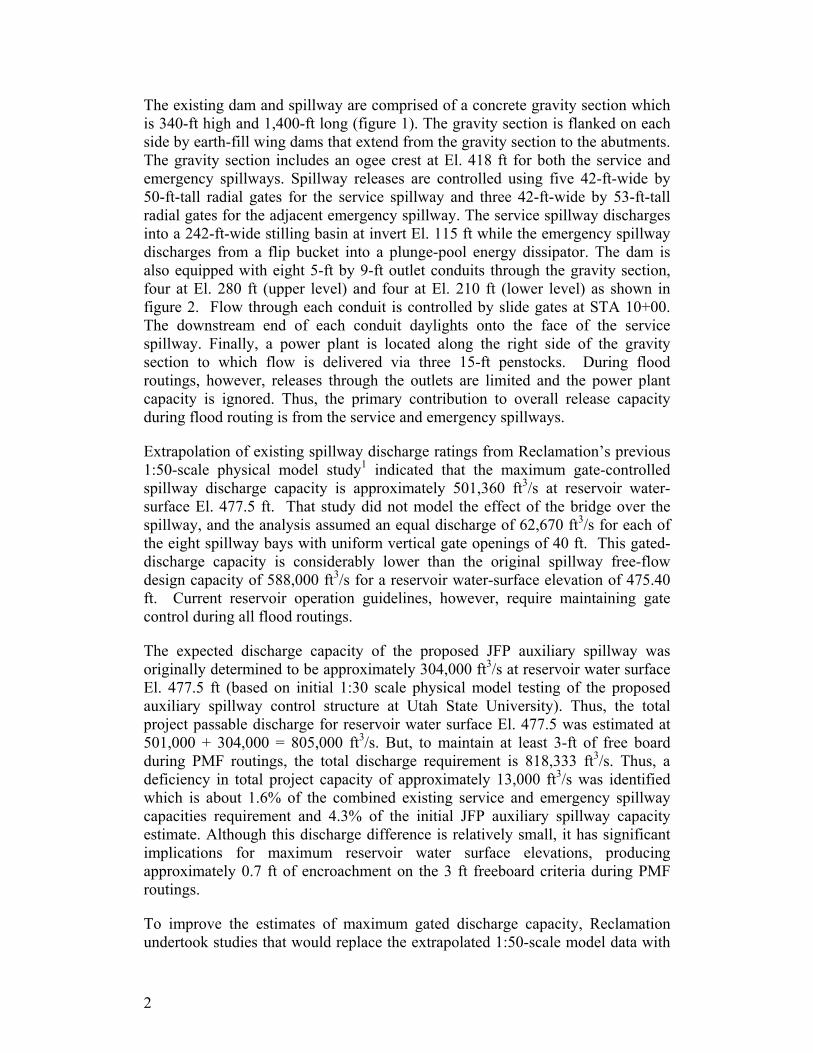
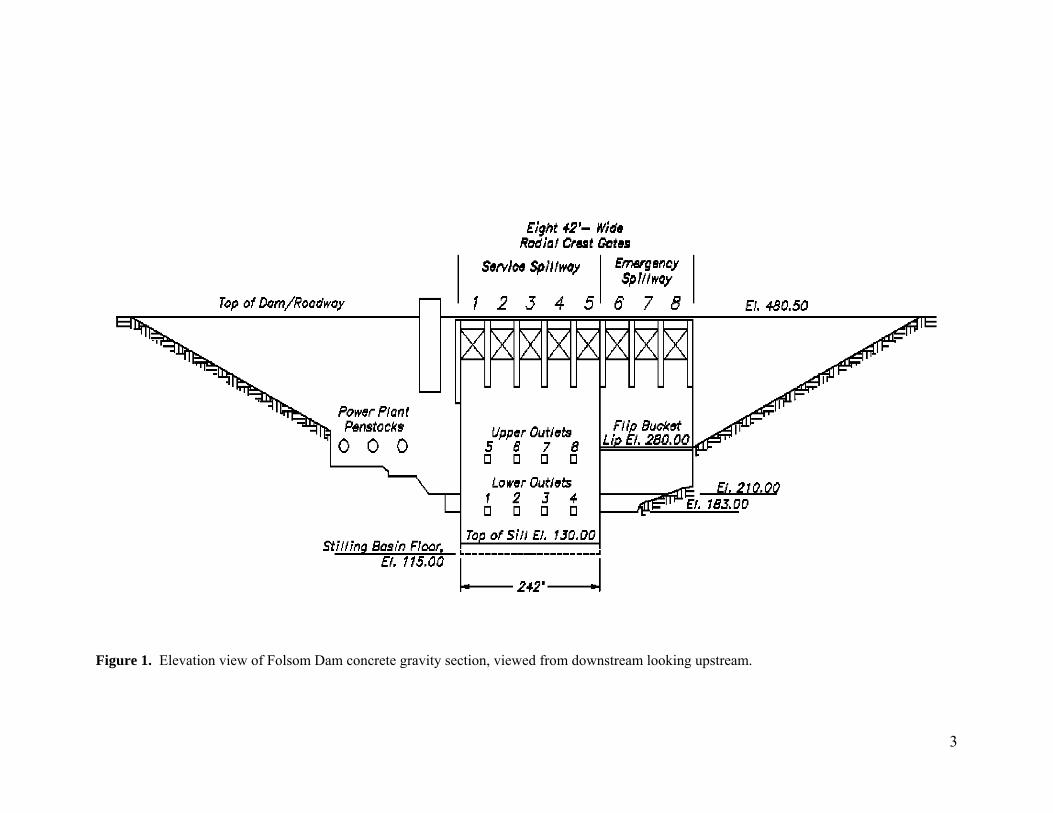
The existing dam and spillway are comprised of a concrete gravity section which is 340-ft high and 1,400-ft long (figure 1). The gravity section is flanked on each side by earth-fill wing dams that extend from the gravity section to the abutments. The gravity section includes an ogee crest at El. 418 ft for both the service and emergency spillways. Spillway releases are controlled using five 42-ft-wide by 50-ft-tall radial gates for the service spillway and three 42-ft-wide by 53-ft-tall radial gates for the adjacent emergency spillway. The service spillway discharges into a 242-ft-wide stilling basin at invert El. 115 ft while the emergency spillway discharges from a flip bucket into a plunge-pool energy dissipator. The dam is also equipped with eight 5-ft by 9-ft outlet conduits through the gravity section, four at El. 280 ft (upper level) and four at El. 210 ft (lower level) as shown in figure 2. Flow through each conduit is controlled by slide gates at STA 10+00. The downstream end of each conduit daylights onto the face of the service spillway. Finally, a power plant is located along the right side of the gravity section to which flow is delivered via three 15-ft penstocks. During flood routings, however, releases through the outlets are limited and the power plant capacity is ignored. Thus, the primary contribution to overall release capacity during flood routing is from the service and emergency spillways.
Extrapolation of existing spillway discharge ratings from Reclamation’s previous 1:50-scale physical model study1 indicated that the maximum gate-controlled spillway discharge capacity is approximately 501,360 ft3/s at reservoir water-surface El. 477.5 ft. That study did not model the effect of the bridge over the spillway, and the analysis assumed an equal discharge of 62,670 ft3/s for each of the eight spillway bays with uniform vertical gate openings of 40 ft. This gated-discharge capacity is considerably lower than the original spillway free-flow design capacity of 588,000 ft3/s for a reservoir water-surface elevation of 475.40 ft. Current reservoir operation guidelines, however, require maintaining gate control during all flood routings.
The expected discharge capacity of the proposed JFP auxiliary spillway was originally determined to be approximately 304,000 ft3/s at reservoir water surface El. 477.5 ft (based on initial 1:30 scale physical model testing of the proposed auxiliary spillway control structure at Utah State University). Thus, the total project passable discharge for reservoir water surface El. 477.5 was estimated at 501,000 + 304,000 = 805,000 ft3/s. But, to maintain at least 3-ft of free board during PMF routings, the total discharge requirement is 818,333 ft3/s. Thus, a deficiency in total project capacity of approximately 13,000 ft3/s was identified which is about 1.6% of the combined existing service and emergency spillway capacities requirement and 4.3% of the initial JFP auxiliary spillway capacity estimate. Although this discharge difference is relatively small, it has significant implications for maximum reservoir water surface elevations, producing approximately 0.7 ft of encroachment on the 3 ft freeboard criteria during PMF routings.
To improve the estimates of maximum gated discharge capacity, Reclamation undertook studies that would replace the extrapolated 1:50-scale model data with
2
3
Figure 1. Elevation view of Folsom Dam concrete gravity section, viewed from downstream looking upstream.
Figure 2. Profile of Folsom Dam spillway and stilling basin.
4
5
data from a CFD model and two different scale physical models (1:36 and 1:48) that included bridge effects and were operated at higher water surface elevations. During the course of these studies, modifications to the 1:30 scale physical model studies at Utah State University demonstrated improvements in passable discharge capacity for the auxiliary spillway. Those findings suggest an increased auxiliary spillway capacity of approximately 312,000 ft3/s at the JFP specified maximum reservoir water surface El. 477.5 ft, gaining 8,000 ft3/s of discharge capacity towards the project requirements. It was hoped that a similar improvement in the service and emergency spillway capacity would be identified by the studies described in this report.
Approach Modeling Descriptions The modeling included in this report was conducted at Reclamation’s hydraulics laboratory in Denver, Colorado.
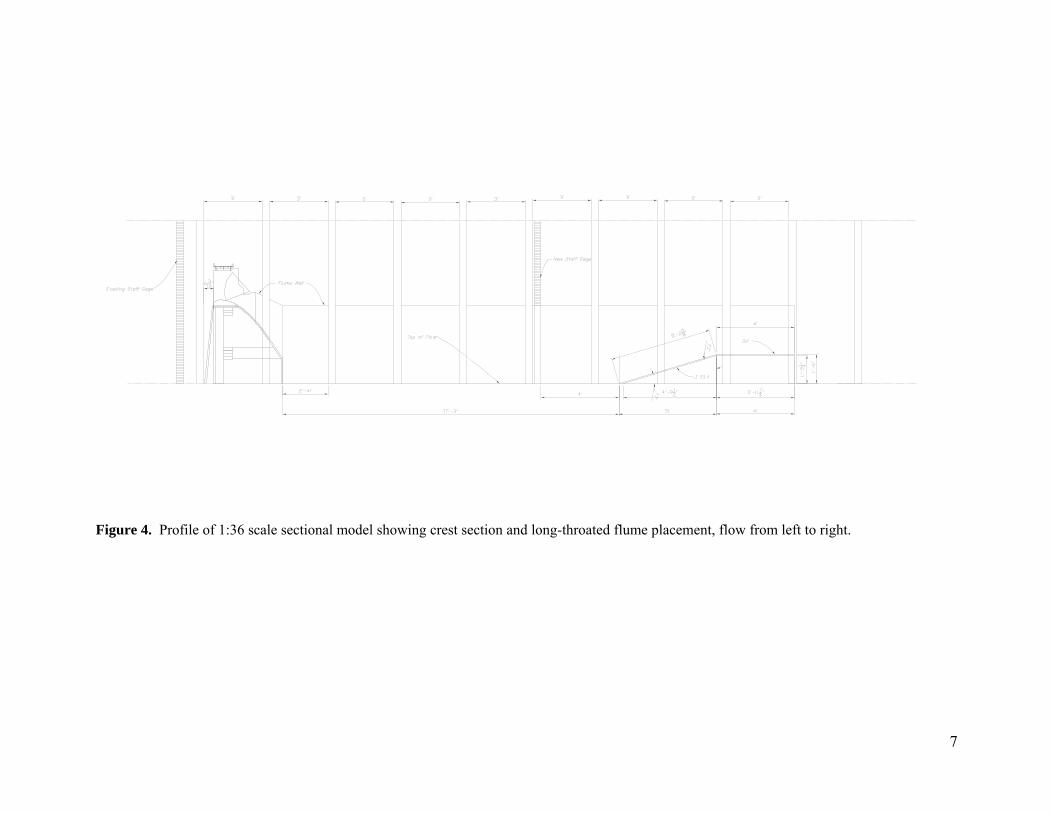
1:36 Scale Sectional Physical Model A 1:36 scale Froude-based sectional model was constructed in the laboratory’s large 4-ft flume facility (figure 3). This model featured a 144-ft-wide section of the main dam spillway with two full spillway gates centered in the flume and partial gate bays on either side. The model construction was simplified by reusing a section of the main spillway that was constructed for another model built in the laboratory in 2002 to study the proposed enlarged outlets that were never constructed. The main features of the sectional model included the upstream or reservoir area, the dam section with radial gates, piers and the highway bridge, and the downstream area where flow passing through the 2 full center gates was captured in a channel and measured using a custom long-throated flume (figure 4) that was calibrated using the laboratory venturi meters throughout the range of flows expected. Gate openings were set using templates and the reservoir elevation and the head in the downstream flume were measured using stilling wells and hook gages.
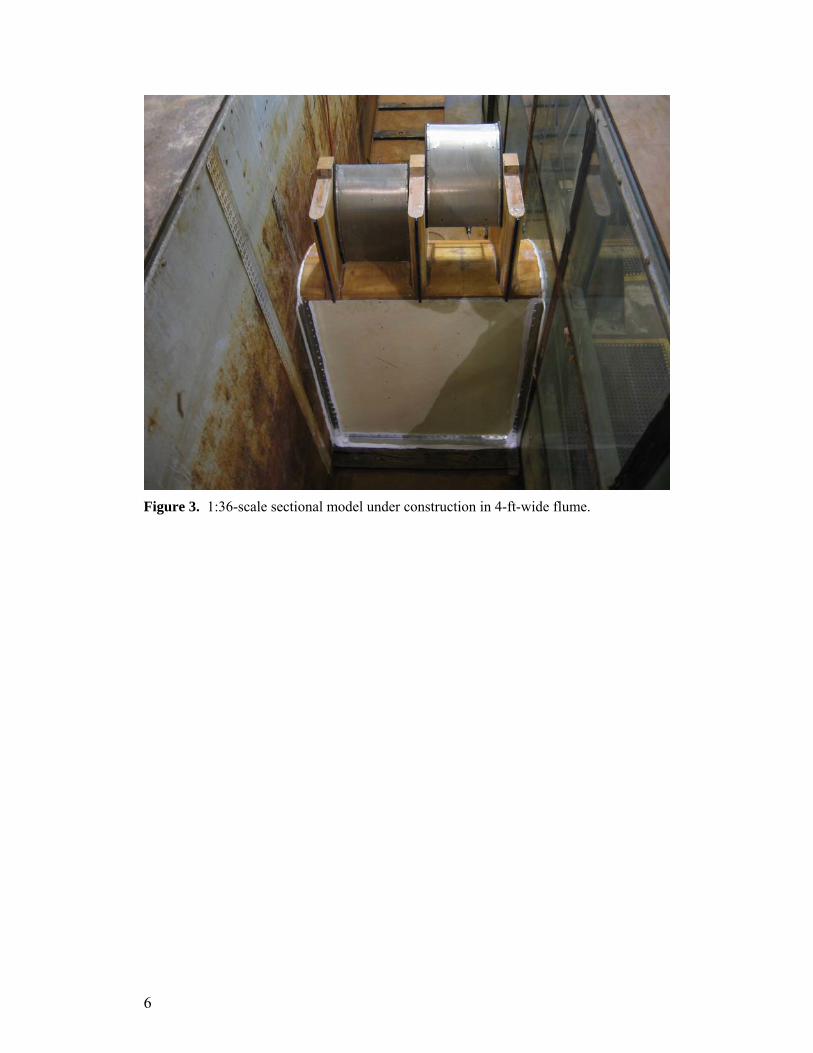
Figure 3. 1:36-scale sectional model under construction in 4-ft-wide flume.
6
7
Figure 4. Profile of 1:36 scale sectional model showing crest section and long-throated flume placement, flow from left to right.
8
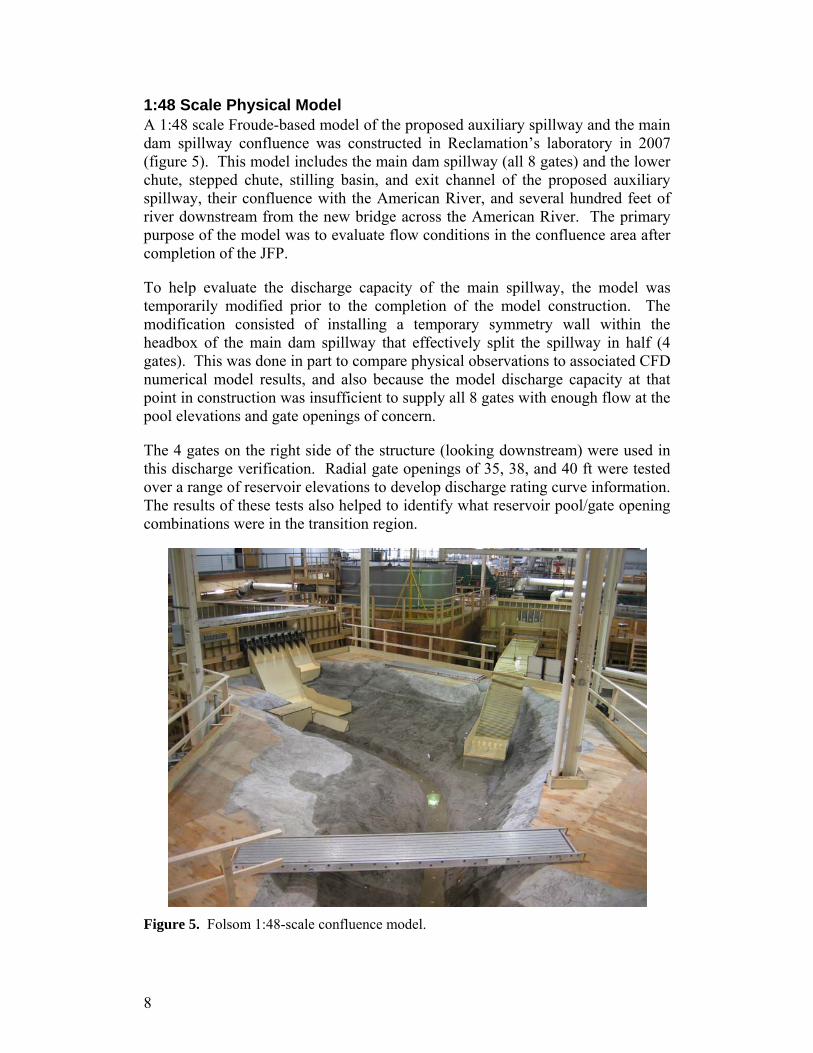
Figure 5. Folsom 1:48-scale confluence model.
The 4 gates on the right side of the structure (looking downstream) were used in this discharge verification. Radial gate openings of 35, 38, and 40 ft were tested over a range of reservoir elevations to develop discharge rating curve information. The results of these tests also helped to identify what reservoir pool/gate opening combinations were in the transition region.
To help evaluate the discharge capacity of the main spillway, the model was temporarily modified prior to the completion of the model construction. The modification consisted of installing a temporary symmetry wall within the headbox of the main dam spillway that effectively split the spillway in half (4 gates). This was done in part to compare physical observations to associated CFD numerical model results, and also because the model discharge capacity at that point in construction was insufficient to supply all 8 gates with enough flow at the pool elevations and gate openings of concern.
1:48 Scale Physical Model A 1:48 scale Froude-based model of the proposed auxiliary spillway and the main dam spillway confluence was constructed in Reclamation’s laboratory in 2007 (figure 5). This model includes the main dam spillway (all 8 gates) and the lower chute, stepped chute, stilling basin, and exit channel of the proposed auxiliary spillway, their confluence with the American River, and several hundred feet of river downstream from the new bridge across the American River. The primary purpose of the model was to evaluate flow conditions in the confluence area after completion of the JFP.
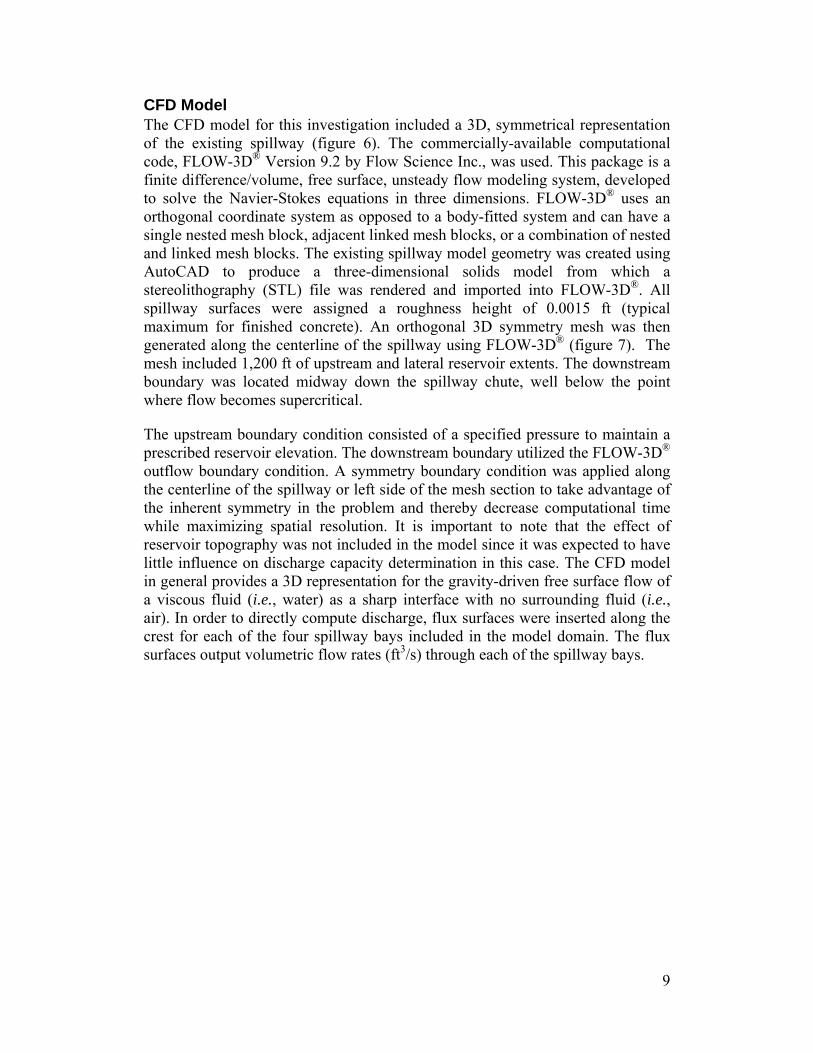
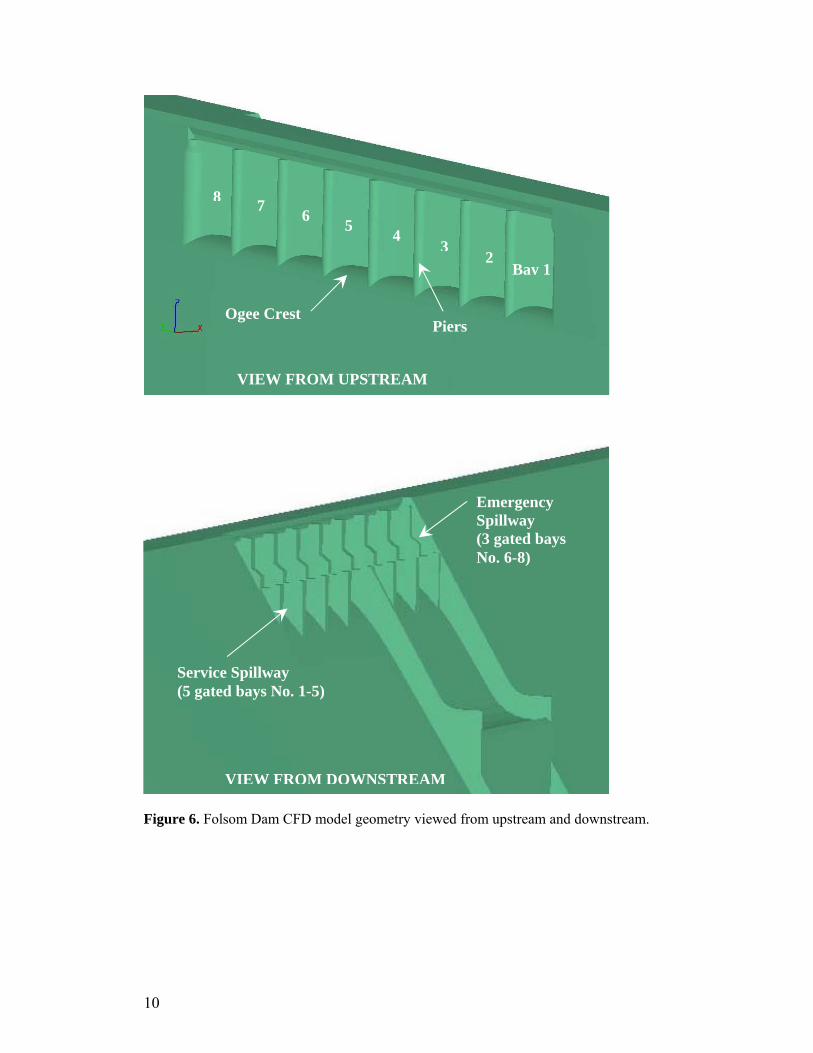
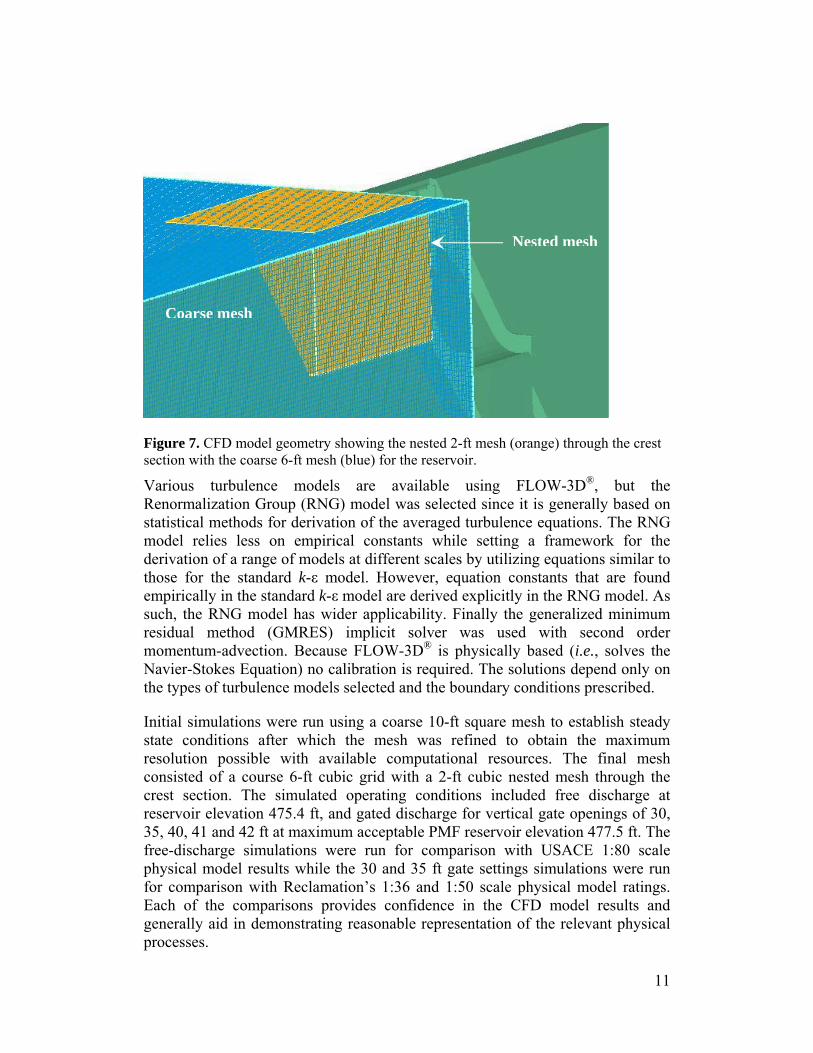
CFD Model The CFD model for this investigation included a 3D, symmetrical representation of the existing spillway (figure 6). The commercially-available computational code, FLOW-3D® Version 9.2 by Flow Science Inc., was used. This package is a finite difference/volume, free surface, unsteady flow modeling system, developed to solve the Navier-Stokes equations in three dimensions. FLOW-3D® uses an orthogonal coordinate system as opposed to a body-fitted system and can have a single nested mesh block, adjacent linked mesh blocks, or a combination of nested and linked mesh blocks. The existing spillway model geometry was created using AutoCAD to produce a three-dimensional solids model from which a stereolithography (STL) file was rendered and imported into FLOW-3D®. All spillway surfaces were assigned a roughness height of 0.0015 ft (typical maximum for finished concrete). An orthogonal 3D symmetry mesh was then generated along the centerline of the spillway using FLOW-3D® (figure 7). The mesh included 1,200 ft of upstream and lateral reservoir extents. The downstream boundary was located midway down the spillway chute, well below the point where flow becomes supercritical.
The upstream boundary condition consisted of a specified pressure to maintain a prescribed reservoir elevation. The downstream boundary utilized the FLOW-3D® outflow boundary condition. A symmetry boundary condition was applied along the centerline of the spillway or left side of the mesh section to take advantage of the inherent symmetry in the problem and thereby decrease computational time while maximizing spatial resolution. It is important to note that the effect of reservoir topography was not included in the model since it was expected to have little influence on discharge capacity determination in this case. The CFD model in general provides a 3D representation for the gravity-driven free surface flow of a viscous fluid (i.e., water) as a sharp interface with no surrounding fluid (i.e., air). In order to directly compute discharge, flux surfaces were inserted along the crest for each of the four spillway bays included in the model domain. The flux surfaces output volumetric flow rates (ft3/s) through each of the spillway bays.
9
8 7 6 5 43
2Bay 1
Ogee Crest Piers
VIEW FROM UPSTREAM
Emergency Spillway (3 gated bays No. 6-8)
Service Spillway (5 gated bays No. 1-5)
VIEW FROM DOWNSTREAM
Figure 6. Folsom Dam CFD model geometry viewed from upstream and downstream.
10
Nested mesh
Coarse mesh
Figure 7. CFD model geometry showing the nested 2-ft mesh (orange) through the crest section with the coarse 6-ft mesh (blue) for the reservoir.
Various turbulence models are available using FLOW-3D®, but the Renormalization Group (RNG) model was selected since it is generally based on statistical methods for derivation of the averaged turbulence equations. The RNG model relies less on empirical constants while setting a framework for the derivation of a range of models at different scales by utilizing equations similar to those for the standard k-ε model. However, equation constants that are found empirically in the standard k-ε model are derived explicitly in the RNG model. As such, the RNG model has wider applicability. Finally the generalized minimum residual method (GMRES) implicit solver was used with second order momentum-advection. Because FLOW-3D® is physically based (i.e., solves the Navier-Stokes Equation) no calibration is required. The solutions depend only on the types of turbulence models selected and the boundary conditions prescribed.
Initial simulations were run using a coarse 10-ft square mesh to establish steady state conditions after which the mesh was refined to obtain the maximum resolution possible with available computational resources. The final mesh consisted of a course 6-ft cubic grid with a 2-ft cubic nested mesh through the crest section. The simulated operating conditions included free discharge at reservoir elevation 475.4 ft, and gated discharge for vertical gate openings of 30, 35, 40, 41 and 42 ft at maximum acceptable PMF reservoir elevation 477.5 ft. The free-discharge simulations were run for comparison with USACE 1:80 scale physical model results while the 30 and 35 ft gate settings simulations were run for comparison with Reclamation’s 1:36 and 1:50 scale physical model ratings. Each of the comparisons provides confidence in the CFD model results and generally aid in demonstrating reasonable representation of the relevant physical processes.
11
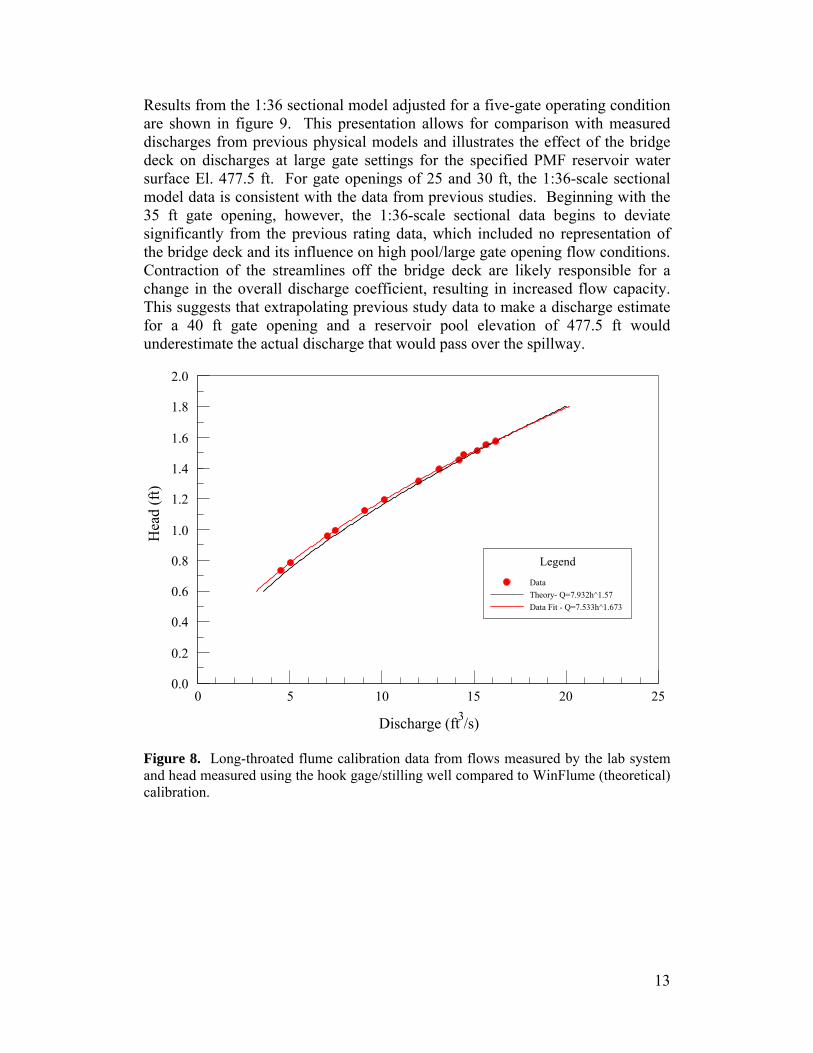
Results 1:36 Scale Sectional Physical Model Testing the sectional model consisted of setting gate openings then recording reservoir elevations and discharges for a range of flows in order to generate a set of data points. Gate openings were selected, and then set in the model using templates. A series of flows were run where both the reservoir elevation and the discharge through the two center gates were measured, and observations concerning flow conditions at the gates were recorded. The discharge through the two center gates was measured using a long-throated flume calibrated using the laboratory venturi system (figure 8). Vertical gate openings of 25, 30, 35, 38, and 40 ft were tested. This range of gate openings allowed comparison to existing model data as well as extending the range of gate openings, all while having the influence of the bridge deck.
One of the common concerns with sectional models can be velocity of approach effects. At high discharges, the area upstream from the dam does not behave much like a reservoir due to the relatively narrow flume section. This does not mean that data collection is not possible, just that care must be taken in interpreting the results. Kinetic energy corrections must be applied to the measured head. An additional concern for the Folsom spillway configuration was the effect of the reservoir approach on flow conditions that are reservoir-elevation critical. These would include the flow interaction with the bridge section, and also the interpretation of gate control/transition at the very largest gate openings. Head corrections were computed by using the measured discharge entering the flume and the reservoir head measured at the upstream stilling well. A mean velocity head was calculated and added to the observed water level to determine the effective reservoir elevation. This methodology produced rating curves that were generally consistent with those obtained by other methods, but did not accurately predict the onset of transitional flow and bridge deck interaction with the flow, since the approach water surface in the sectional model was lower for a specific discharge than in the 3D models.
In addition, because of measuring only two-gate discharges, some interpretation is necessary when scaling these up to five-gate or eight-gate discharges. Lacking any additional information, what might be done is to assume equal discharge per gate and just scale up with the number of gates. However, this method for the Folsom spillway includes significant error as the two end gates generally have lower discharges than a center gate due to contraction of the water surface at the end piers. Since we were not able to measure each gate discharge individually, we relied on the CFD model to give us the appropriate fractional discharges for each spillway gate. The numerical model results predicted that all gates except the end gates were within 2.5 percent of one another in discharge. The end gate variation was greater and did depend on the actual gate opening. Table 2 shows the corrections that were derived from the CFD results and used to estimate the five- and eight-gate discharges from a normal center gate.
12
Results from the 1:36 sectional model adjusted for a five-gate operating condition are shown in figure 9. This presentation allows for comparison with measured discharges from previous physical models and illustrates the effect of the bridge deck on discharges at large gate settings for the specified PMF reservoir water surface El. 477.5 ft. For gate openings of 25 and 30 ft, the 1:36-scale sectional model data is consistent with the data from previous studies. Beginning with the 35 ft gate opening, however, the 1:36-scale sectional data begins to deviate significantly from the previous rating data, which included no representation of the bridge deck and its influence on high pool/large gate opening flow conditions. Contraction of the streamlines off the bridge deck are likely responsible for a change in the overall discharge coefficient, resulting in increased flow capacity. This suggests that extrapolating previous study data to make a discharge estimate for a 40 ft gate opening and a reservoir pool elevation of 477.5 ft would underestimate the actual discharge that would pass over the spillway.
Discharge (ft3/s)
0 5 10 15 20 25
Hea
d (f
t)
0.0
0.2
0.4
0.6
0.8
1.0
1.2
1.4
1.6
1.8
2.0
Legend
DataTheory- Q=7.932h^1.57Data Fit - Q=7.533h^1.673
Figure 8. Long-throated flume calibration data from flows measured by the lab system and head measured using the hook gage/stilling well compared to WinFlume (theoretical) calibration.
13
FOLSOM DAM MODELSReclamation Laboratory
5 Gate Flow
418
423
428
433
438
443
448
453
458
463
468
473
478
483
488
0 25,000 50,000 75,000 100,000 125,000 150,000 175,000 200,000 225,000 250,000 275,000 300,000 325,000 350,000 375,000 400,000
Discharge (cfs)
Pool
Ele
vatio
n (ft
)
1:36 Sectional Model
Transition - critical flow
1:50 Model
1:36 Model
Flow3D CFD Model-time avg.
5ft10ft
15ft20ft
25ft 30ft 35ft 38ft40ft
free flow
35ft 40ft
Figure 9. Five-gate discharges showing comparison between 1:50 and 1:36 three-dimensional models and the 1:36 sectional results. Note, only the 1:36 scale sectional model includes the influence of the bridge deck.
1:48 Scale Physical Model Spillway discharge rating data was collected in the 1:48-scale model in a manner similar to that used in the 1:36-scale sectional model. The spillway gates were uniformly set to a predetermined vertical opening (35, 38, or 40 ft) and a series of measured discharges were passed through the model, with the resulting pool elevations for each discharge measured using a stilling well and hook gage attached to the reservoir headbox.
Due to discharge limitations, a temporary wall was installed in the headbox normal to the spillway crest. This wall effectively divided the headbox and spillway in two, allowing flow over only the right four gates of the spillway crest and thus creating a symmetry boundary and four-gate model requiring only half the discharge of all eight spillway gates (figure 10). This same symmetry-boundary approach was used in the computational modeling to increase computational efficiency and reduce simulation times.
14
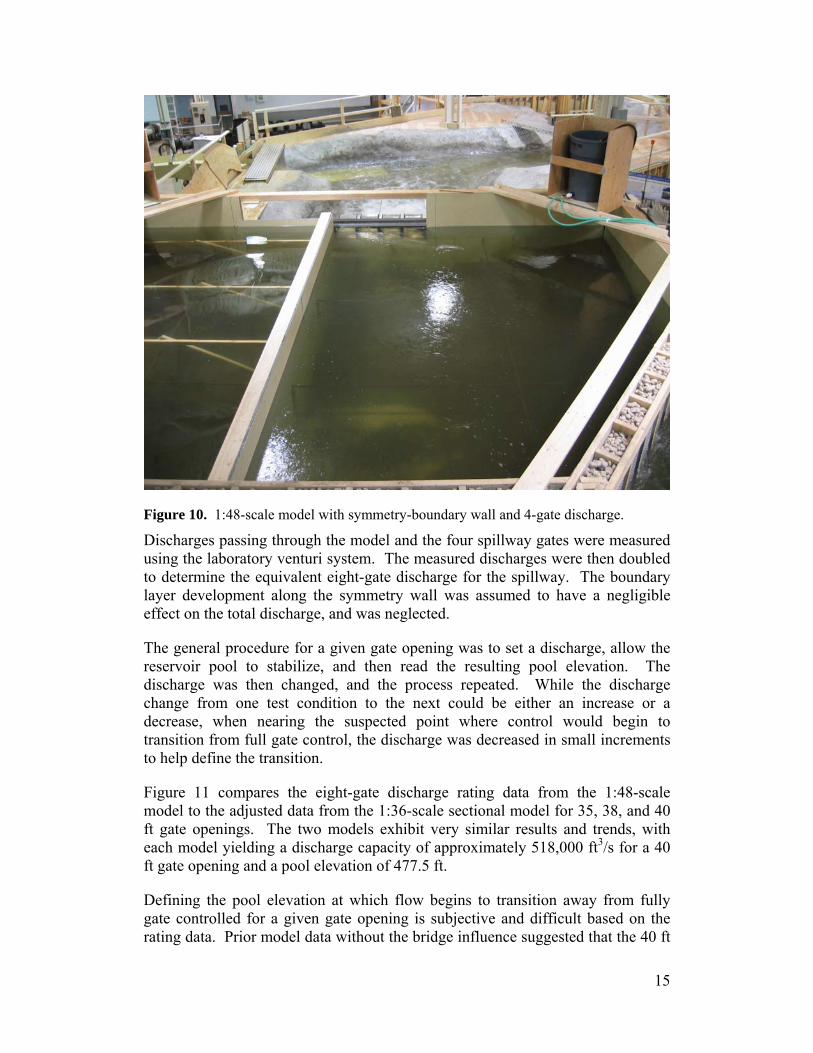
Figure 10. 1:48-scale model with symmetry-boundary wall and 4-gate discharge.
Discharges passing through the model and the four spillway gates were measured using the laboratory venturi system. The measured discharges were then doubled to determine the equivalent eight-gate discharge for the spillway. The boundary layer development along the symmetry wall was assumed to have a negligible effect on the total discharge, and was neglected.
The general procedure for a given gate opening was to set a discharge, allow the reservoir pool to stabilize, and then read the resulting pool elevation. The discharge was then changed, and the process repeated. While the discharge change from one test condition to the next could be either an increase or a decrease, when nearing the suspected point where control would begin to transition from full gate control, the discharge was decreased in small increments to help define the transition.
Figure 11 compares the eight-gate discharge rating data from the 1:48-scale model to the adjusted data from the 1:36-scale sectional model for 35, 38, and 40 ft gate openings. The two models exhibit very similar results and trends, with each model yielding a discharge capacity of approximately 518,000 ft3/s for a 40 ft gate opening and a pool elevation of 477.5 ft.
Defining the pool elevation at which flow begins to transition away from fully gate controlled for a given gate opening is subjective and difficult based on the rating data. Prior model data without the bridge influence suggested that the 40 ft
15
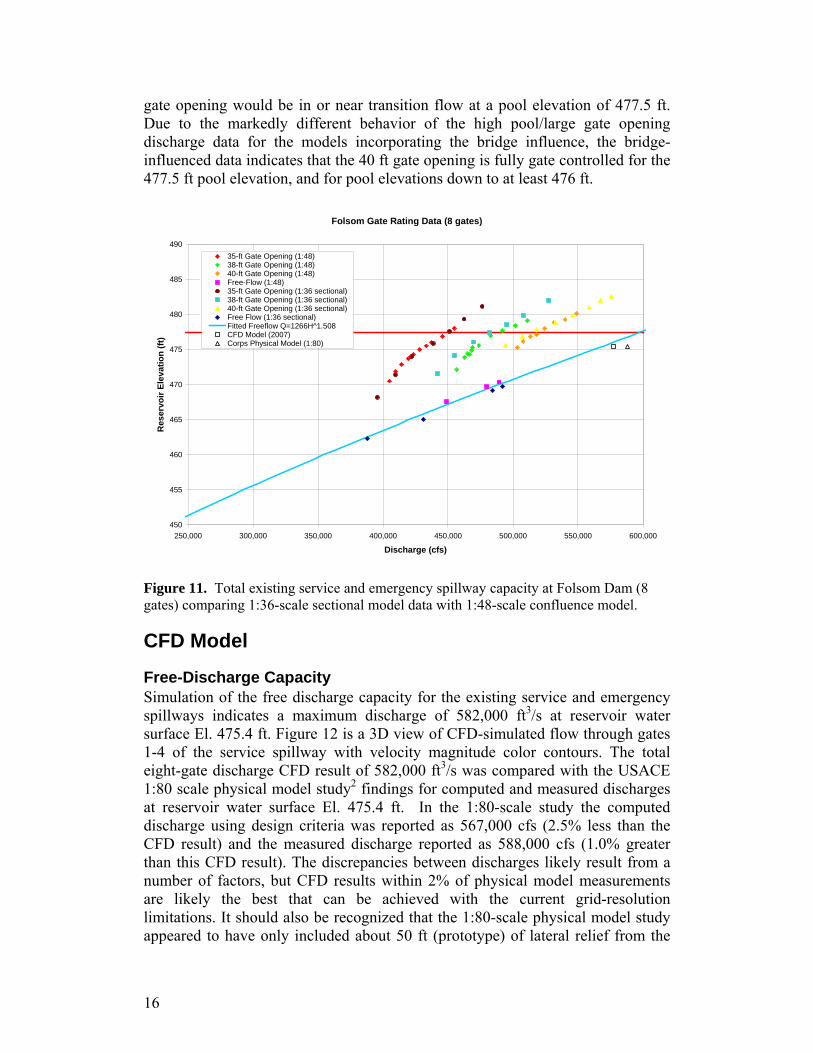
gate opening would be in or near transition flow at a pool elevation of 477.5 ft. Due to the markedly different behavior of the high pool/large gate opening discharge data for the models incorporating the bridge influence, the bridge-influenced data indicates that the 40 ft gate opening is fully gate controlled for the 477.5 ft pool elevation, and for pool elevations down to at least 476 ft.
Folsom Gate Rating Data (8 gates)
450
455
460
465
470
475
480
485
490
250,000 300,000 350,000 400,000 450,000 500,000 550,000 600,000
Discharge (cfs)
Res
ervo
ir El
evat
ion
(ft)
35-ft Gate Opening (1:48)38-ft Gate Opening (1:48)40-ft Gate Opening (1:48)Free-Flow (1:48)35-ft Gate Opening (1:36 sectional)38-ft Gate Opening (1:36 sectional)40-ft Gate Opening (1:36 sectional)Free Flow (1:36 sectional)Fitted Freeflow Q=1266H^1.508CFD Model (2007)Corps Physical Model (1:80)
Figure 11. Total existing service and emergency spillway capacity at Folsom Dam (8 gates) comparing 1:36-scale sectional model data with 1:48-scale confluence model.
CFD Model
Free-Discharge Capacity Simulation of the free discharge capacity for the existing service and emergency spillways indicates a maximum discharge of 582,000 ft3/s at reservoir water surface El. 475.4 ft. Figure 12 is a 3D view of CFD-simulated flow through gates 1-4 of the service spillway with velocity magnitude color contours. The total eight-gate discharge CFD result of 582,000 ft3/s was compared with the USACE 1:80 scale physical model study2 findings for computed and measured discharges at reservoir water surface El. 475.4 ft. In the 1:80-scale study the computed discharge using design criteria was reported as 567,000 cfs (2.5% less than the CFD result) and the measured discharge reported as 588,000 cfs (1.0% greater than this CFD result). The discrepancies between discharges likely result from a number of factors, but CFD results within 2% of physical model measurements are likely the best that can be achieved with the current grid-resolution limitations. It should also be recognized that the 1:80-scale physical model study appeared to have only included about 50 ft (prototype) of lateral relief from the
16
emergency spillway end bay in the upstream head box. In other words, limitations in reservoir extents for the 1:80-scale model potentially suppressed contraction at the end bay of the emergency spillway, resulting in over-prediction of prototype discharge.
Figure 12. Downstream view of free discharge at reservoir El. 475.4 ft showing flow through four spillway bays with color contours for velocity magnitude.
Figure 13. Oblique view looking upstream of free discharge showing water surface variations across each bay.
17
Gate-Controlled Discharge Capacities Preliminary CFD simulations were also completed for gate settings including 30 and 35-ft gate settings (bottom of gate El.s 447.17 and 452.17 ft, respectively) at reservoir water surface El. 477.5 ft. These simulations were intended for comparison with 1:50-scale physical model measurements to provide additional confidence in CFD results for gate controlled conditions. Those studies considered only five-gate service spillway operation in which case, with emergency spillway gates closed, considerable contraction occurs from the pier separating gates 5 and 6. Hence it was necessary to convert the four-gate CFD discharges, representative of the full eight-gate operation, to comparable five-gate discharges. This was done by taking Qt = 2(Q1 + Q2) + Q4 to account for end gates contraction. Simulations were then extended to gate settings of 41.0 and 42.0 ft (bottom of gate El.s 458.17 and 459.17 ft) for all gates at the PMF reservoir water surface El. 477.5 ft. Based on the physical model results determining the transition zone limit, a maximum vertical gate opening of 40 ft was identified as the limit to maintain gate control at reservoir water surface El. 477.5 ft. A final simulation was then run for this 40-ft gate setting. The CFD model results for the various operating conditions simulated are summarized in Table 1 as single gate discharges for bays No. 1-4 with corresponding 5- and 8-gate total discharges.
Table 1. Summary of CFD results for existing spillway discharge capacities.
Gate Opening
(ft)
Gate 1 Q (ft3/s)
Gate 2 Q (ft3/s)
Gate 3 Q (ft3/s)
Gate 4 Q (ft3/s)
TOTAL Qt (ft3/s)
30.0* 46,300 47,000 47,400 47,500 234,000 † 35.0* 53,700 54,600 54,900 55,200 272,000 † 40.0* 62,600 66,300 67,300 67,700 525,000 †† 41.0* 64,600 68,000 68,800 69,900 543,000 †† 42.0* 66,800 71,700 72,000 73,300 568,000 †† Free** 67,900 73,300 74,600 75,000 582,000 ††
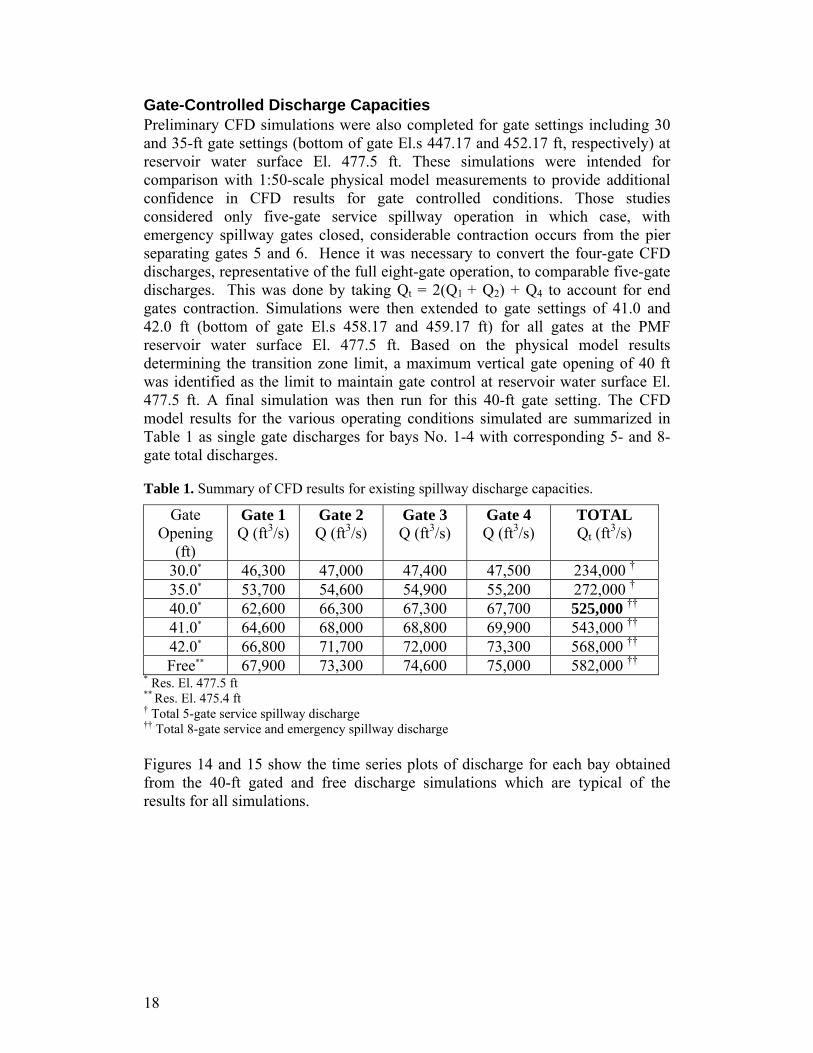
* Res. El. 477.5 ft ** Res. El. 475.4 ft † Total 5-gate service spillway discharge †† Total 8-gate service and emergency spillway discharge Figures 14 and 15 show the time series plots of discharge for each bay obtained from the 40-ft gated and free discharge simulations which are typical of the results for all simulations.
18
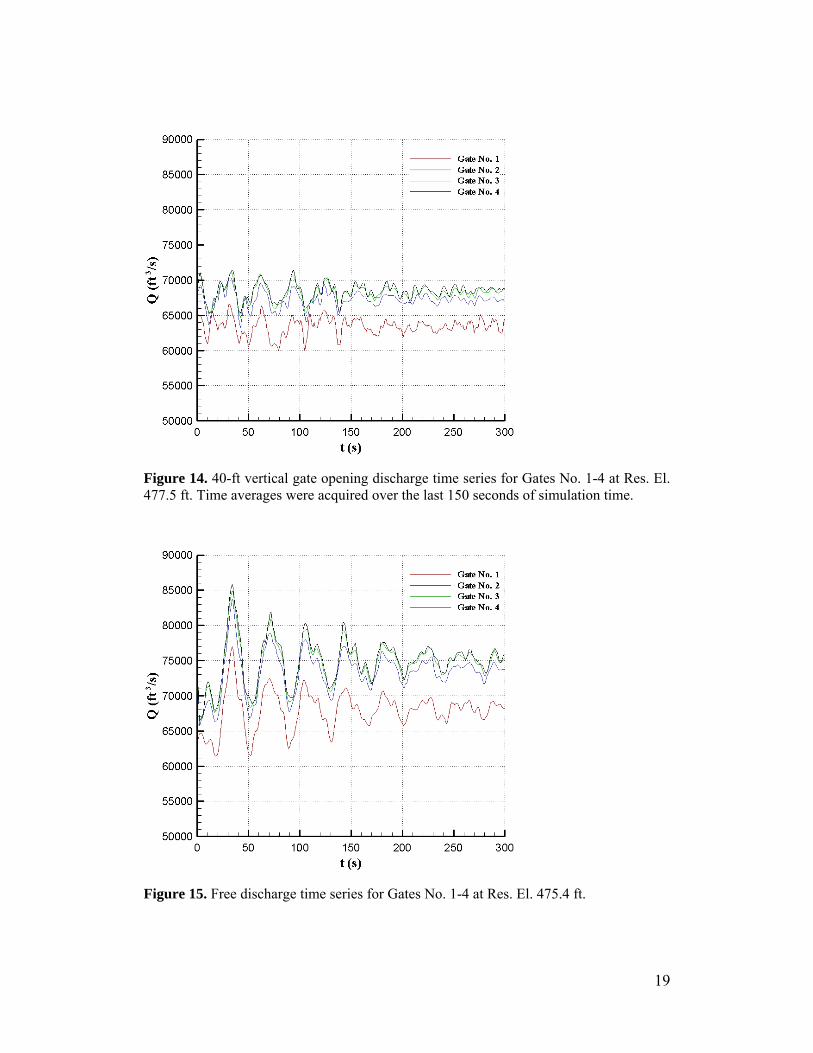
Figure 14. 40-ft vertical gate opening discharge time series for Gates No. 1-4 at Res. El. 477.5 ft. Time averages were acquired over the last 150 seconds of simulation time.
Figure 15. Free discharge time series for Gates No. 1-4 at Res. El. 475.4 ft.
19
Single-bay discharges computed for uniform gate operation shown in Table 1, though not surprising, also reveal significant variations in discharge for each of the gates No.1-4 during multi-bay operation. The lowest single-bay discharge was found, in all cases, for the end bay (Gate No. 1). Such variations in discharge are due to approach flow conditions that produce increased contraction at the end piers resulting in reduction of effective area and additional energy losses. Alternatively, contraction is considerably reduced for the center bay (Gate No. 4) which produces the largest single-gate discharge in all cases. Due to the symmetry in approach flow conditions inherent to the spillway, equivalent discharges for certain gate pairs are expected. For eight-gate operation, gates 4&5, 3&6, 2&7, and 1&8 are expected to produce comparable discharges.
The variations in gate discharges can be determined from the time-averaged results reported in Table 1. These variations are included in Table 2 as the fraction of center Gate No. 4 discharge assuming eight-gate symmetrical operation. It was observed that the lateral variation in gate discharges changed with gate opening (or submergence) as the results showed less variation for a 30-ft gate opening as compared with free discharge operation. In all cases Gate No. 1 discharges were significantly lower that the center gate discharge and in the case of free discharge this amounted to almost 10% less capacity.
Table 2. Variation in multi-gate discharges as fraction of combined four-gate discharge.
Gate Opening
(ft)
Gate 1
Gate 2
Gate 3
Gate 4
30.0* 0.975 0.989 0.997 1.000 35.0* 0.972 0.989 0.995 1.000 40.0* 0.925 0.979 0.994 1.000 41.0* 0.924 0.973 0.985 1.000 42.0* 0.911 0.978 0.982 1.000 Free** 0.905 0.977 0.995 1.000
* Res. El. 477.5 ft ** Res. El. 475.4 ft Comparison of the Service Spillway five-gate discharge capacity for 30-ft vertical gate settings at reservoir water surface El. 477.5 ft shows the CFD result, 234,000 ft3/s, is within 1.5% of the 1:50 scale physical model result, 232,000 ft3/s. Similarly, for a 35-ft vertical gate opening, the computed CFD result of 272,000 ft3/s, is within 1% of the measured physical model result, 270,000 ft3/s. In both cases the CFD model provided slightly higher estimates of discharge. The results of the 41-ft gate openings simulation indicated a total (combined service and emergency spillways) passable discharge of 543,000 ft3/s at reservoir water surface El. 477.5 ft. Further extending the gate settings to 42 ft suggests a total passable discharge of 572,000 ft3/s. However, the 41- and 42-ft gate settings appear to be well within the transition zone as demonstrated by the physical model results.
20
Discussion
Maximum Spillway Capacity
To retain gate control at reservoir water surface El. 477.5 ft, a maximum vertical gate opening of 40-ft appears possible and provides a total discharge capacity of 518,000 ft3/s (based on the most recent physical model measurements). This is approximately 17,000 ft3/s (or 3.4%) more than the original estimate of 501,000 ft3/s based on extrapolation from 1:50 scale physical model results and more than accommodates the originally identified project deficiency. Thus, the total project capacity that can be expected at reservoir water surface El. 477.5 ft is 830,000 ft3/s provided the auxiliary spillway passes 312,000 ft3/s. Extensions to higher gate openings up to 42 ft provide an additional safety margin of approximately 50,000 ft3/s to offset uncertainties in flood routing predictions should additional capacity and transition zone operation become necessary.
Transition Zone
Defining the demarcation between full gate control and transition zone flow based on the behavior of the model data is a subjective exercise. The shape of the curves formed by the rating data are evaluated in hopes of defining a break in shape/slope where the data points fall away steeply towards the free-flow discharge curve. For the 40-ft gate opening, this point is indistinct, but seems to occur at around pool elevation 476 ft. For the 38-ft gate opening, the critical pool elevation appears close to elevation 475 ft, while at the 35 ft gate opening the critical elevation is near elevation 474 ft.
Section 311 of the USACE Hydraulic Design Criteria3 indicates that the orifice equation applied to partial tainter gate openings on spillway crests is believed to be valid for gate openings less than 60 percent of the upstream head. Conversely, the minimum upstream head to maintain gate control for a given gate opening would be 1.67 times the gate opening. While the observed onset of the transition zone for smaller gate openings seems to track this relationship relatively well1, for the larger gate openings considered in this study the minimum gate-controlled pool elevation is somewhat lower than this relationship suggests. As with the discharge capacity rating, this appears to be the result of the influence of the bridge deck on gate control.
Generalized Design Criteria
The realization that the generalized design criteria and extrapolated results from the 1:50 scale physical model predict lower discharge capacities than both the physical and CFD modeling calls for discussion. The primary explanation is that
21
the bridge deck is influencing the approach flow, guiding it into the gate opening with lower losses than normal. This is also reflected in the fact that the gate ratings for gate openings less than 30 ft can be mathematically modeled by a standard orifice equation, while larger gate openings require a more flexible curve-fitting approach that is adaptable to a flow exhibiting a mixture of control influences.
Physical Model Accuracy
The 1:48- and 1:36-scale physical models employed in this study used similar systems for both discharge and water-level measurement. Water-level measurement for each model was accomplished using a stilling well with a hook gage. Each hook gage was equipped with a vernier allowing the water level to be read to the nearest 0.001 ft. Discharge to each of the models was measured with the laboratory venturi system which is calibrated to 0.25% accuracy. The two-gate discharge measurement from the 1:36-scale sectional model was measured using a long-throated flume. A preliminary long-throated flume discharge rating was determined theoretically using the WinFlume program, with a final rating calibration performed in place using a series of discharges determined from the laboratory venturi system as shown previously in figure 8.
Conclusions • The maximum vertical gate opening to maintain gate control at reservoir
water surface El. 477.5 ft was found to be 40 ft. At this gate opening a passable discharge of 518,000 ft3/s is possible based on physical model measurements. The results of the CFD model indicate a slightly larger passable discharge of 525,000 cfs.
• With the above discharge capacity and the latest auxiliary spillway physical model study findings showing an auxiliary spillway capacity of 312,000 ft3/s, the total JFP Project passable discharge is expected to be on the order of 830,000 ft3/s at reservoir water surface El. 477.5 ft which is approximately 12,000 ft3/s (or 1.5%) more than the specified requirement of 818,333 ft3/s.
• Extending gate settings to vertical gate openings of 42 ft is expected to increase the above identified discharge capacity by approximately 50,000 ft3/s (or 6%) if operation in the transition zone is allowed, providing an additional safety margin to offset uncertainties in freeboard encroachment during PMF routings.
22
23
References 1 Einhellig, R.F., Hydraulic Model Study of Folsom Dam Spillway Performance and Stilling Basin Abrasion, U.S. Bureau of Reclamation, Report No. R-99-08 (1999)
2 U.S. Army Corps of Engineers, Spillway for Folsom Dam – Hydraulic Model Investigation, Technical Memorandum No. 2-369 (1953)
3 U.S. Army Corps of Engineers, Hydraulic Design Criteria, Volume 1, (updated November, 1987)