Embed Size (px)
Citation preview
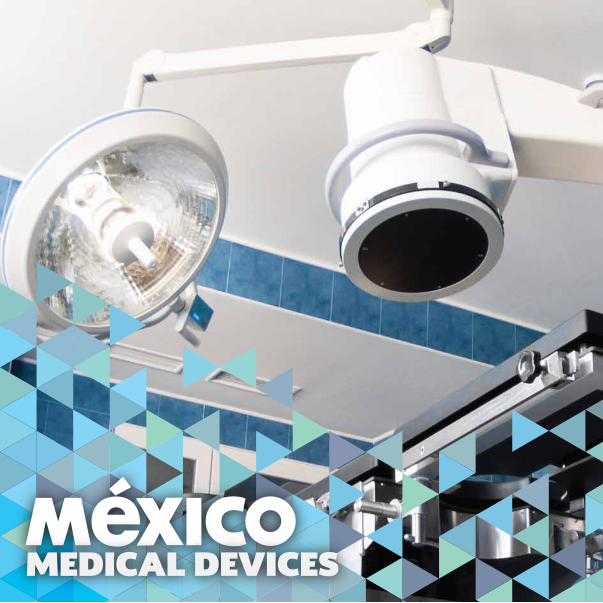
WHEREVER you ARE, it’s HIGHLYPROBABLE that SOMETHING AROUNDyou has BEEN MADE in MEXICO.
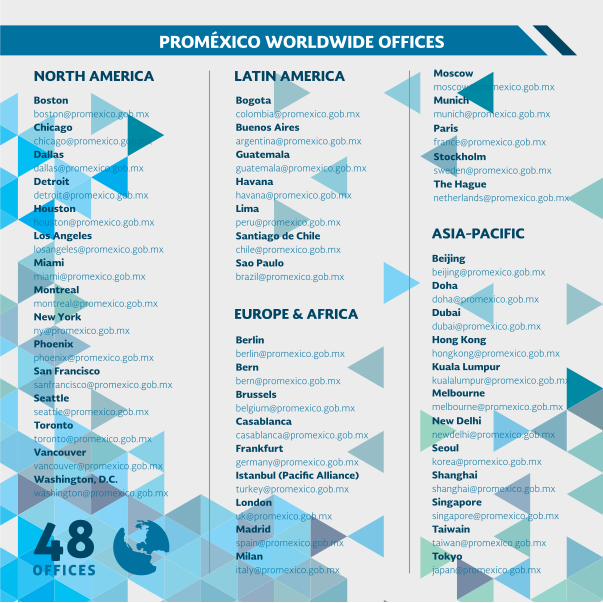
is the Mexican Government institution that promotes the export of Mexican products and services, the internationalization of national companies, and the attraction of foreign investment. ProMéxico drives Mexico’s active participation in the international economic arena. Through a network of 48 of�ces in 31 countries and 29 of�ces in the country it offers a wide range of specialized services and support.
TAMQUAM PLACERAT IUSINDUSTRY INDICATORS IN MEXICO
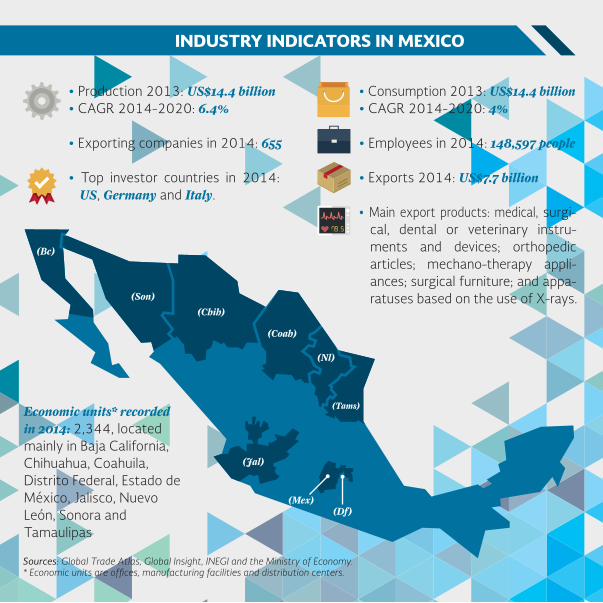
Sources: Global Trade Atlas, Global Insight, INEGI and the Ministry of Economy.* Economic units are of�ces, manufacturing facilities and distribution centers.
(Bc)
(Son)
(Jal)
(Chih)
(Coah)
(Nl)
(Tams)
(Df)(Mex)
Economic units* recorded in 2014: 2,344, located mainly in Baja California, Chihuahua, Coahuila, Distrito Federal, Estado de México, Jalisco, Nuevo León, Sonora and Tamaulipas
• Production 2013: US$14.4 billion• CAGR 2014-2020: 6.4%
• Exporting companies in 2014: 655
• Top investor countries in 2014: US, Germany and Italy.
• Consumption 2013: US$14.4 billion• CAGR 2014-2020: 4%
• Employees in 2014: 148,597 people
• Exports 2014: US$7.7 billion
• Main export products: medical, surgi-cal, dental or veterinary instru-ments and devices; orthopedic articles; mechano-therapy appli-ances; surgical furniture; and appa-ratuses based on the use of X-rays.
88.879.5
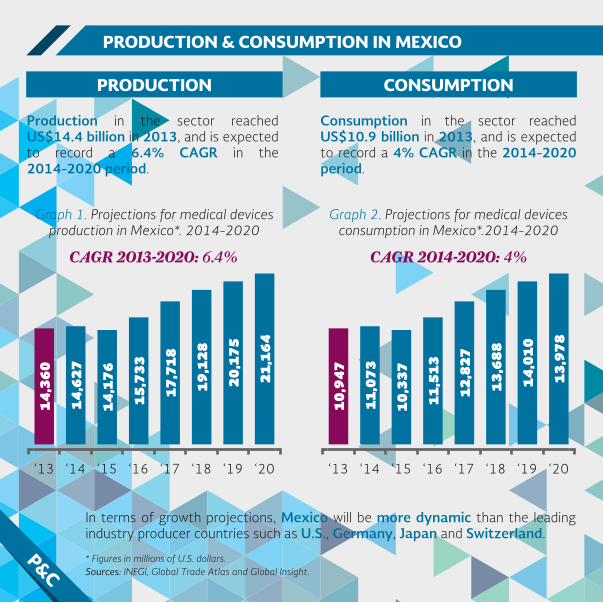
Production in the sector reached US$14.4 billion in 2013, and is expected to record a 6.4% CAGR in the 2014-2020 period.
Consumption in the sector reached US$10.9 billion in 2013, and is expected to record a 4% CAGR in the 2014-2020 period.
Sources: INEGI, Global Trade Atlas and Global Insight.
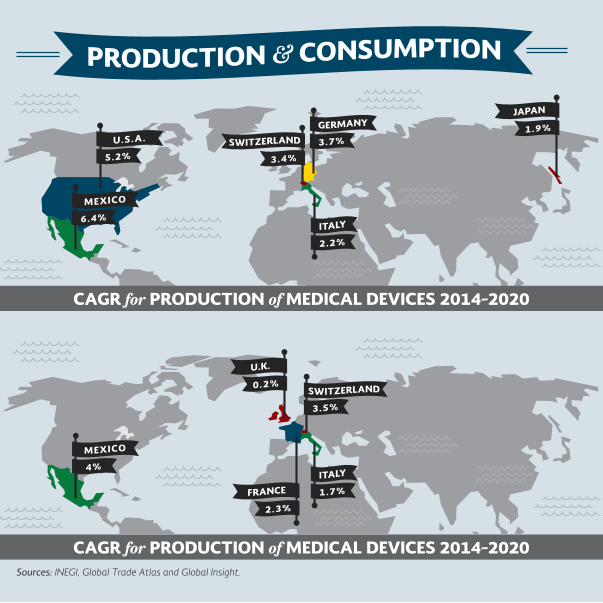
In terms of growth projections, Mexico will be more dynamic than the leading industry producer countries such as U.S., Germany, Japan and Switzerland.
* Figures in millions of U.S. dollars.
PRODUCTION & CONSUMPTION IN MEXICO
PRODUCTION CONSUMPTION
10,9
47
11,0
73
‘13 ‘14 ‘15 ‘16 ‘17 ‘18 ‘19 ‘20
10,3
37
11,5
13
12,8
27
13,6
88
14,0
10
13,9
78
CAGR 2014-2020: 4%
Graph 2. Projections for medical devices consumption in Mexico*.2014-2020
P&C
Graph 1. Projections for medical devices production in Mexico*. 2014-2020
14,3
60
14,6
27
‘13 ‘14 ‘15 ‘16 ‘17 ‘18 ‘19 ‘20
14,1
76
15,7
33
17,7
18
19,1
28
20,1
75
21,1
64CAGR 2013-2020: 6.4%
Sources: INEGI, Global Trade Atlas and Global Insight.
CAGR for PRODUCTION of MEDICAL DEVICES 2014-2020
CAGR for PRODUCTION of MEDICAL DEVICES 2014-2020
MEXICO'S INTERNATIONAL TRADE
2,44
8 5,06
4
2,48
9 5,13
8
2,78
25,
798
3,03
26,
072
3,18
86,
343
3,47
36,
886
3,74
57,
699
2,18
3 4,56
0
4,04
82,
159
‘06 ‘07 ‘08 ‘09 ‘10 ‘11 ‘12 ‘13 ‘14
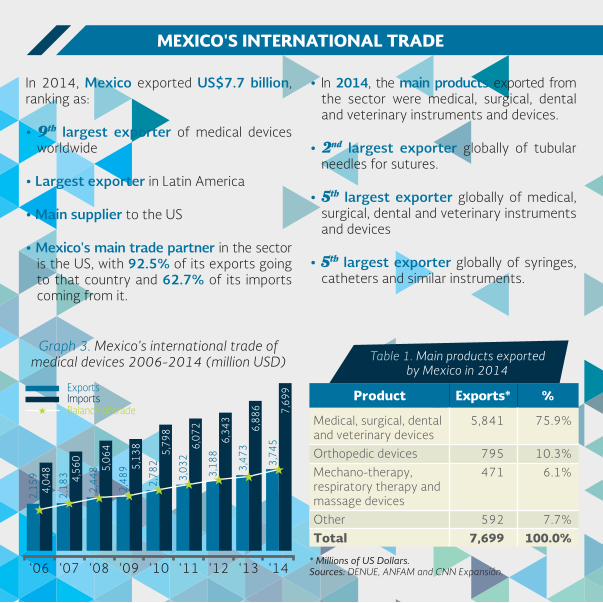
Graph 3. Mexico's international trade of medical devices 2006-2014 (million USD)
* Millions of US Dollars.Sources: DENUE, ANFAM and CNN Expansión.
Product %Exports*
Medical, surgical, dental and veterinary devicesOrthopedic devicesMechano-therapy, respiratory therapy and massage devicesOtherTotal
5,841
795471
5927,699
75.9%
10.3%6.1%
7.7%100.0%
Table 1. Main products exportedby Mexico in 2014
In 2014, Mexico exported US$7.7 billion, ranking as:
• 9th largest exporter of medical devices worldwide
• Largest exporter in Latin America
• Main supplier to the US
• Mexico's main trade partner in the sector is the US, with 92.5% of its exports going to that country and 62.7% of its imports coming from it.
• In 2014, the main products exported from the sector were medical, surgical, dental and veterinary instruments and devices.
• 2nd largest exporter globally of tubular needles for sutures.
• 5th largest exporter globally of medical, surgical, dental and veterinary instruments and devices
• 5th largest exporter globally of syringes, catheters and similar instruments.
ExportsImportsBalance of trade
FOREIGN DIRECT INVESTMENT (FDI)
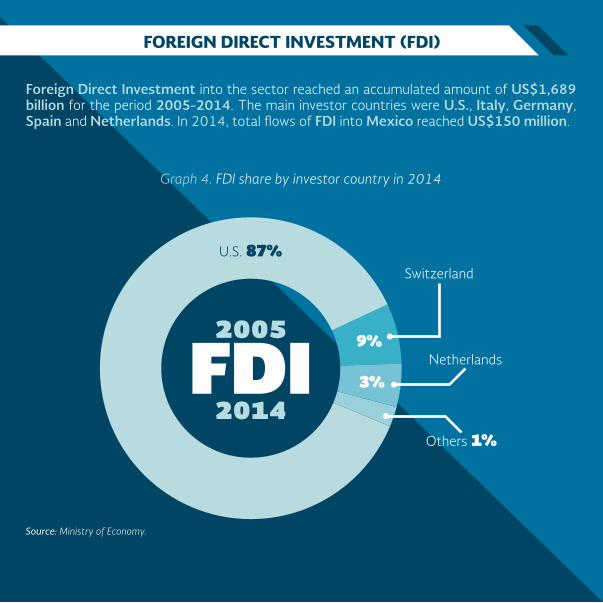
Foreign Direct Investment into the sector reached an accumulated amount of US$1,689 billion for the period 2005-2014. The main investor countries were U.S., Italy, Germany, Spain and Netherlands. In 2014, total �ows of FDI into Mexico reached US$150 million.
Graph 4. FDI share by investor country in 2014
2005
FDI2014
U.S. 87%
9%
3%
Switzerland
Netherlands
Others 1%
Source: Ministry of Economy.
MEXICO'S INTERNATIONAL TRADE
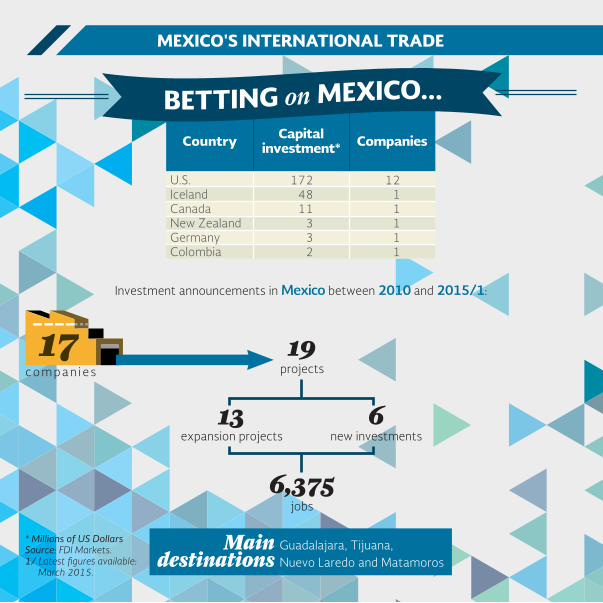
* Millions of US Dollars Source: FDI Markets.1/ Latest �gures available:
March 2015.
Country CompaniesCapitalinvestment*
U.S.IcelandCanadaNew ZealandGermanyColombia
1724811
332
1211111
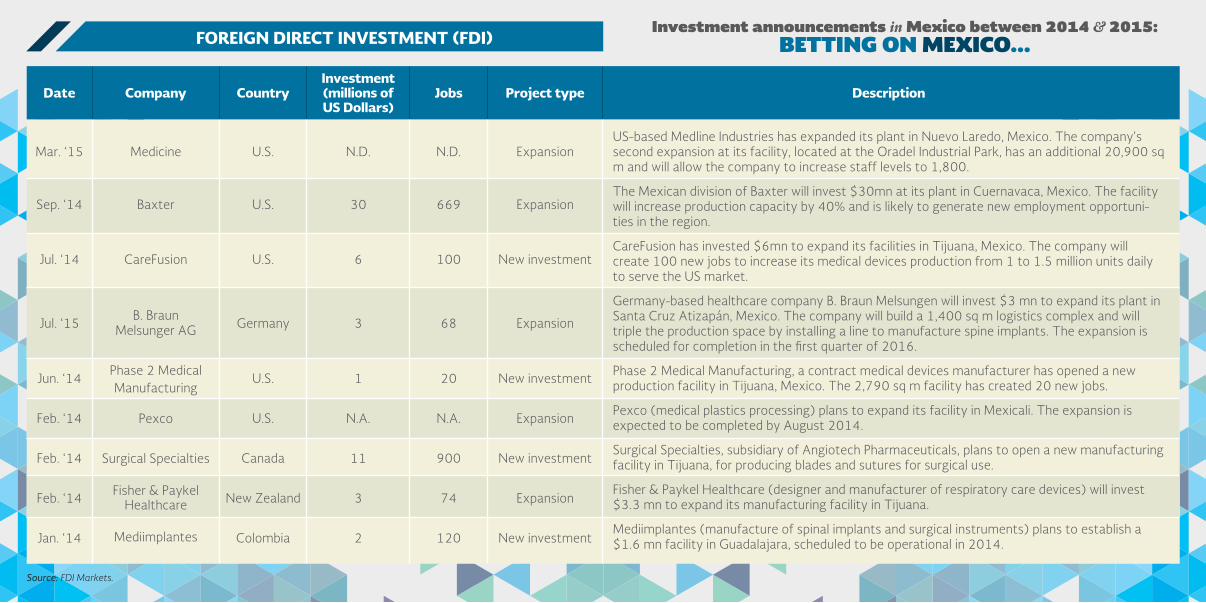
Investment announcements in Mexico between 2010 and 2015/1:
19projects
6,375jobs
6new investments
13expansion projects
c o m p a n i e s
17
Maindestinations
Guadalajara, Tijuana,Nuevo Laredo and Matamoros
* Includes companies, plants, commercial and sales of�cesSources: INEGI, Global Trade Atlas and Global Insight.
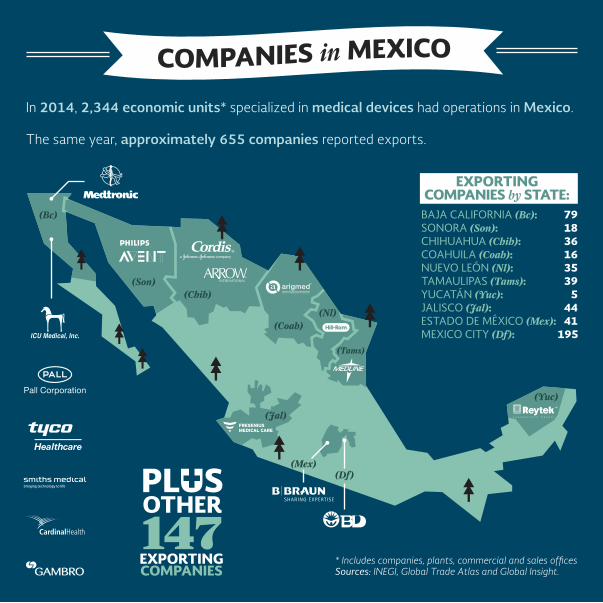
In 2014, 2,344 economic units* specialized in medical devices had operations in Mexico.
The same year, approximately 655 companies reported exports.
BAJA CALIFORNIA (Bc): 79SONORA (Son): 18CHIHUAHUA (Chih): 36COAHUILA (Coah): 16NUEVO LEÓN (Nl): 35TAMAULIPAS (Tams): 39YUCATÁN (Yuc): 5JALISCO (Jal): 44ESTADO DE MÉXICO (Mex): 41MEXICO CITY (Df): 195
EXPORTINGCOMPANIES by STATE:
(Bc)
(Son)
(Jal)
(Mex)(Df)
(Chih)
(Coah)(Nl)
(Tams)
(Yuc)
SUCCESSFUL R&D PROJECTS IN MEXICO
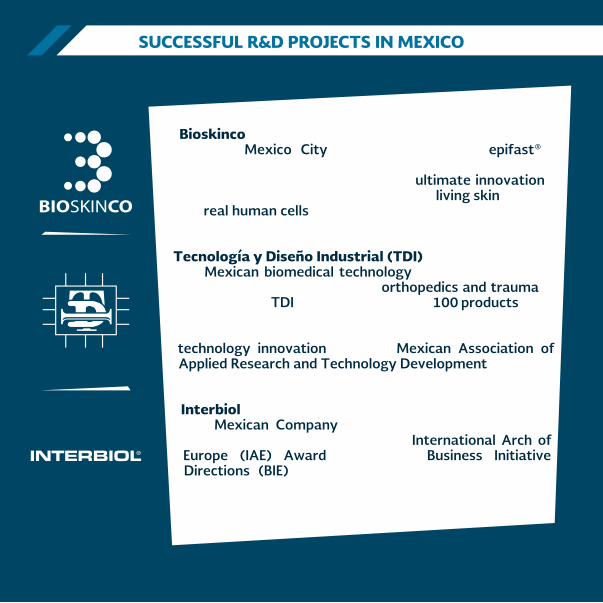
• Bioskinco:Located in Mexico City, Bioskinco created the epifast®, a biological coating that helps the skin grow more quickly when applied to an injury. It is considered the ultimate innovation in reepithelization, being the �rst equivalent of living skin produced from real human cells.
• Tecnología y Diseño Industrial (TDI):This Mexican biomedical technology company develops and manufactures medical devices for orthopedics and trauma. In the last decade, TDI has developed close to 100 products: it has a device for practically every part of the human skeleton. Thanks to its innovative products, the company received the award for technology innovation from the Mexican Association of Applied Research and Technology Development in 2010.
• Interbiol:This Mexican Company manufactures reagents for quick tests and diagnoses. It received the International Arch of Europe (IAE) Award, granted by Business Initiative Directions (BIE). The award recognizes the quality and technology innovation of several areas of the company, from customer satisfaction to human resources.
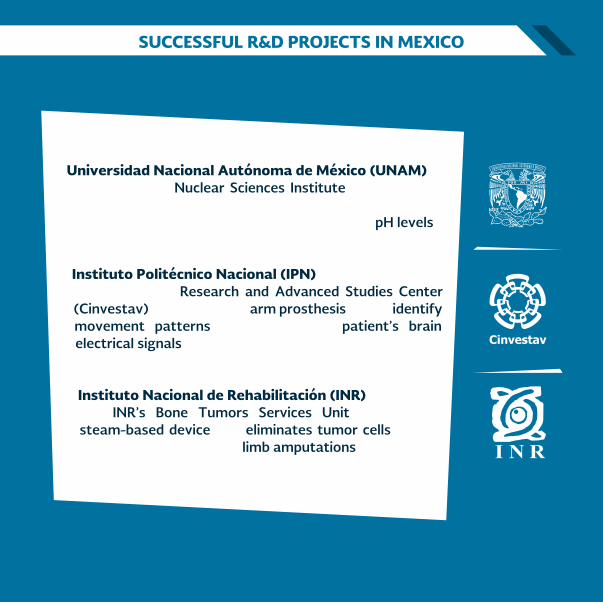
• Universidad Nacional Autónoma de México (UNAM):Scientists at the Nuclear Sciences Institute have developed “intelligent” gauzes for suturing wounds; which have been modi�ed for reacting to patients’ temperatures or pH levels.
• Instituto Politécnico Nacional (IPN):Scientists at the Research and Advanced Studies Center (Cinvestav) are designing an arm prosthesis able to identify movement patterns derived form the patient’s brain electrical signals.
• Instituto Nacional de Rehabilitación (INR):The INR’s Bone Tumors Services Unit developed a steam-based device that eliminates tumor cells for the purpose of avoiding future limb amputations.
SUCCESSFUL R&D PROJECTS IN MEXICO
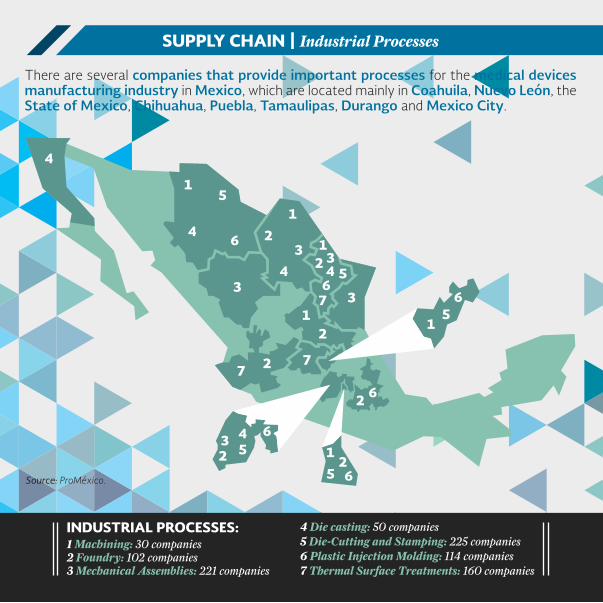
There are several companies that provide important processes for the medical devices manufacturing industry in Mexico, which are located mainly in Coahuila, Nuevo León, the State of Mexico, Chihuahua, Puebla, Tamaulipas, Durango and Mexico City.
1
1
3
12 3
4 56
73
12
7
6
2 12
5 6
3 4 65
65
1
2
27
23
4
4
4
5
6
Source: ProMéxico.
INDUSTRIAL PROCESSES:1 Machining: 30 companies2 Foundry: 102 companies3 Mechanical Assemblies: 221 companies
4 Die casting: 50 companies5 Die-Cutting and Stamping: 225 companies6 Plastic Injection Molding: 114 companies7 Thermal Surface Treatments: 160 companies
SUPPLY CHAIN | Industrial Processes
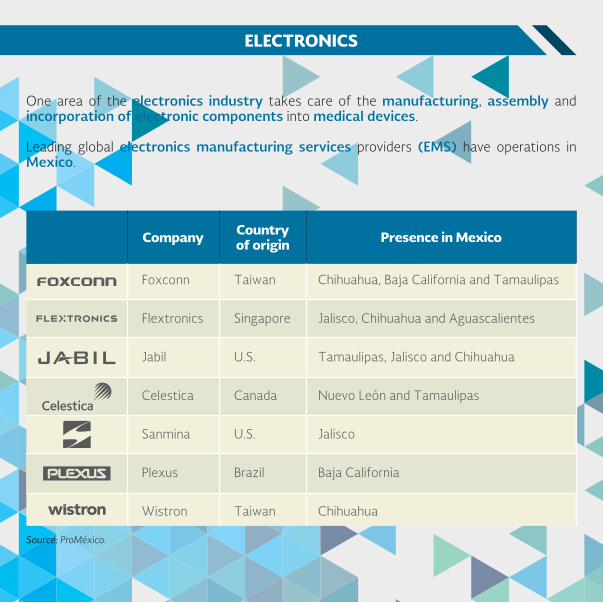
One area of the electronics industry takes care of the manufacturing, assembly and incorporation of electronic components into medical devices.
Leading global electronics manufacturing services providers (EMS) have operations in Mexico.
ELECTRONICS
Company Countryof origin Presence in Mexico
Chihuahua, Baja California and Tamaulipas
Jalisco, Chihuahua and Aguascalientes
Tamaulipas, Jalisco and Chihuahua
Nuevo León and Tamaulipas
Jalisco
Baja California
Chihuahua
Taiwan
Singapore
U.S.
Canada
U.S.
Brazil
Taiwan
Foxconn
Flextronics
Jabil
Celestica
Sanmina
Plexus
Wistron
Source: ProMéxico.
TAMQUAM PLACERAT IUSSECTOR-RELATED CHAMBERS AND ASSOCIATIONS
• Nuevo Leon State Manufacturing Industry Chamber (CAINTRA):CAINTRA is an organization dedicated to represent, promote and serve the interests of the industrial community of Nuevo Leon. It encourages its members to form a common front in order to have in�uence in public policies that can help foster industrial growth in the state.
• National Council for the Export Manufacturing Maquila Industry (Index):Represents the Export Manufacturing and Maquila Industry. The leading export companies of medical devices in Mexico belong to the council.
• Mexican Medical Devices Innovation Industry Association (AMID):AMID is a group of global medical device leaders committed to the growth of the sector in Mexico.
SECTOR-RELATED CHAMBERS AND ASSOCIATIONS
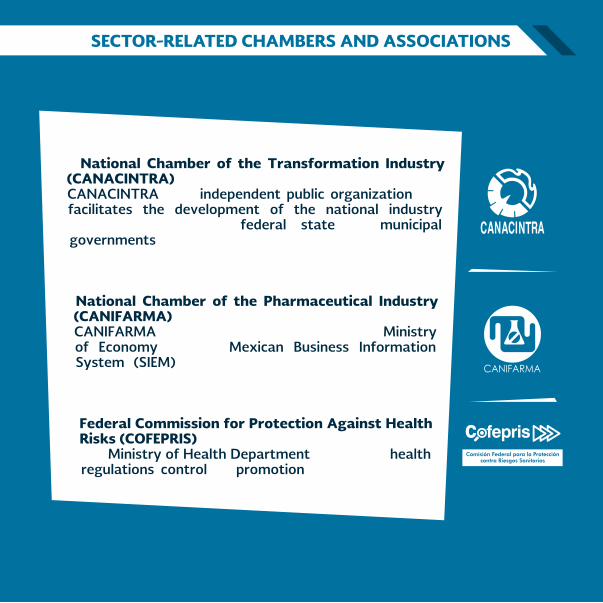
• National Chamber of the Transformation Industry (CANACINTRA):CANACINTRA is an independent public organization that facilitates the development of the national industry through interaction with federal, state and municipal governments, as well as with legislators, to make proposals in favor of companies.
• National Chamber of the Pharmaceutical Industry (CANIFARMA):CANIFARMA operates under the supervision of the Ministry of Economy and the Mexican Business Information System (SIEM), and represents health care companies through policies, programs, instruments and promotion.
• Federal Commission for Protection Against Health Risks (COFEPRIS):The Ministry of Health Department in charge of health regulations, control and promotion.
TAMQUAM PLACERAT IUSNAFTA PLATFORM
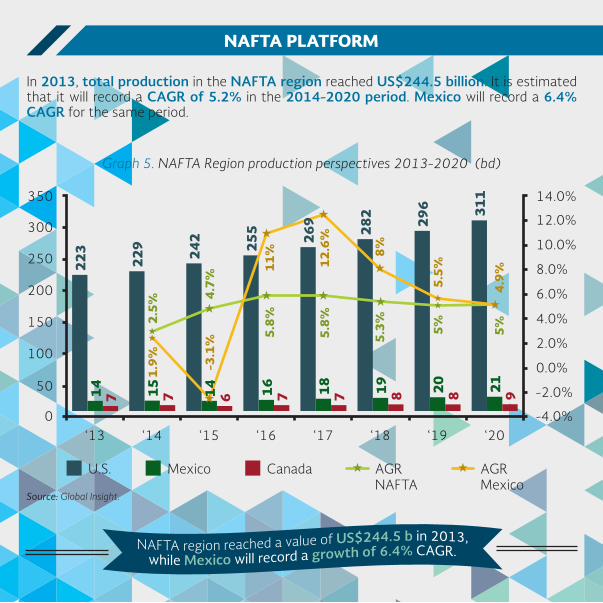
In 2013, total production in the NAFTA region reached US$244.5 billion. It is estimated that it will record a CAGR of 5.2% in the 2014-2020 period. Mexico will record a 6.4% CAGR for the same period.
‘130
50
100
150
250
200
300
350
0.0%
2.0%
4.0%
-4.0%
-2.0%
6.0%
8.0%
10.0%
12.0%
14.0%
‘14 ‘15 ‘16 ‘17 ‘18 ‘19 ‘20
U.S. Mexico Canada AGRNAFTA
AGRMexico
223
229
242
255
269
282
296 31
121 920 819 818 716 714 615 714 7
4.9%
5%
5.5%
5%
8%5.
3%
12.6
%5.
8%
11%
5.8%
4.7%
-3.1
%
2.5%
1.9%
Source: Global Insight.
Graph 5. NAFTA Region production perspectives 2013-2020 (bd)
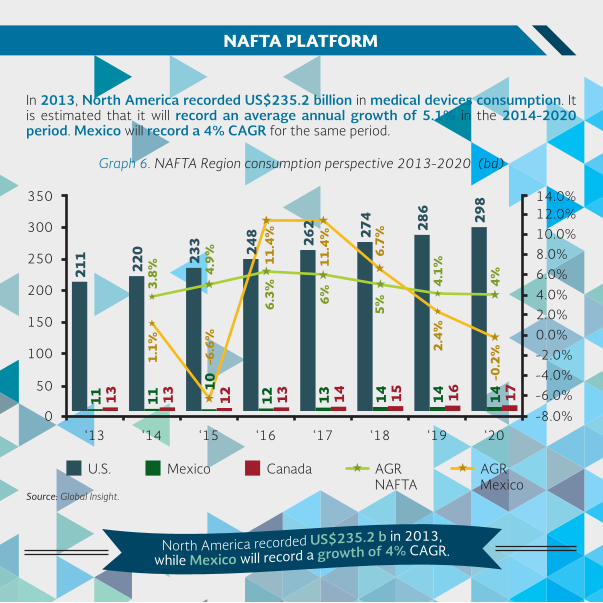
In 2013, North America recorded US$235.2 billion in medical devices consumption. It is estimated that it will record an average annual growth of 5.1% in the 2014-2020 period. Mexico will record a 4% CAGR for the same period.
NAFTA PLATFORM
Source: Global Insight.
Graph 6. NAFTA Region consumption perspective 2013-2020 (bd)
‘130
50
100
150
250
200
300
350
0.0%2.0%4.0%
-8.0%
-4.0%-6.0%
-2.0%
6.0%8.0%10.0%12.0%14.0%
‘14 ‘15 ‘16 ‘17 ‘18 ‘19 ‘20
U.S. Mexico Canada AGRNAFTA
AGRMexico
211
220
233 24
8 262
274
286
298
14 1714 1614 1513 1412 13
101211 1311 13
-0.2
%4%
2.4%
4.1%
6.7%
5%
11.4
%6%
11.4
%6.
3%
4.9%
-6.6
%
3.8%
1.1%
TAMQUAM PLACERAT IUSNAFTA PLATFORM
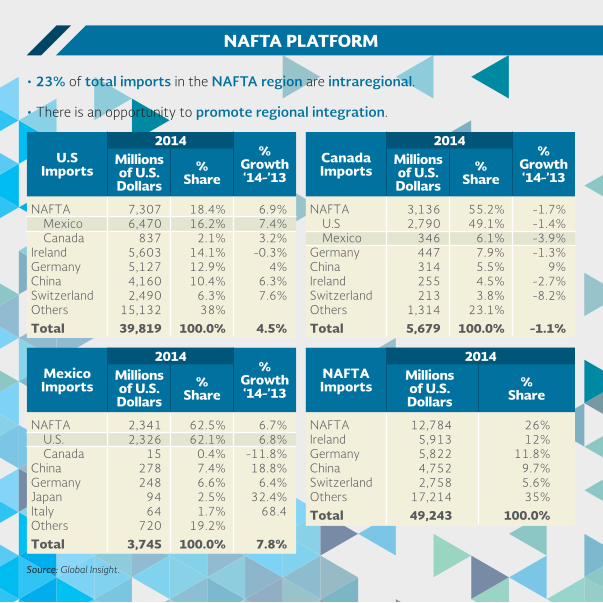
• 23% of total imports in the NAFTA region are intraregional.
• There is an opportunity to promote regional integration.
Source: Global Insight.
U.SImports %
Share
2014Millionsof U.S. Dollars
NAFTA Mexico CanadaIrelandGermanyChinaSwitzerlandOthersTotal
7,3076,470
8375,6035,1274,1602,490
15,13239,819
18.4%16.2%
2.1%14.1%12.9%10.4%
6.3%38%
100.0%
%Growth‘14-’13
6.9%7.4%3.2%
-0.3%4%
6.3%7.6%
4.5%
CanadaImports %
Share
2014Millionsof U.S. Dollars
NAFTA U.S MexicoGermanyChinaIrelandSwitzerlandOthersTotal
3,1362,790
346447314255213
1,3145,679
55.2%49.1%
6.1%7.9%5.5%4.5%3.8%
23.1%100.0%
%Growth‘14-’13
-1.7%-1.4%-3.9%-1.3%
9%-2.7%-8.2%
-1.1%
MexicoImports %
Share
2014Millionsof U.S. Dollars
NAFTA U.S. CanadaChinaGermanyJapanItalyOthersTotal
2,3412,326
15278248
9464
7203,745
62.5%62.1%
0.4%7.4%6.6%2.5%1.7%
19.2%100.0%
%Growth‘14-’13
6.7%6.8%
-11.8%18.8%
6.4%32.4%
68.4
7.8%
NAFTAImports %
Share
2014Millionsof U.S. Dollars
NAFTAIrelandGermanyChinaSwitzerlandOthersTotal
12,7845,9135,8224,7522,758
17,21449,243
26%12%
11.8%9.7%5.6%35%
100.0%
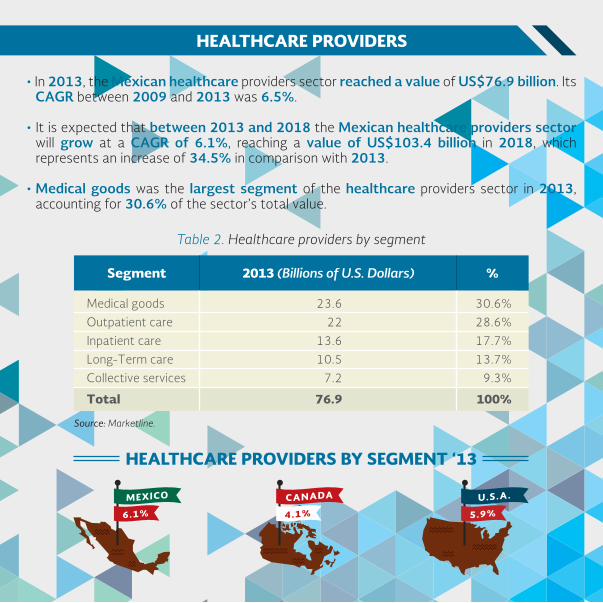
• In 2013, the Mexican healthcare providers sector reached a value of US$76.9 billion. Its CAGR between 2009 and 2013 was 6.5%.
• It is expected that between 2013 and 2018 the Mexican healthcare providers sector will grow at a CAGR of 6.1%, reaching a value of US$103.4 billion in 2018, which represents an increase of 34.5% in comparison with 2013.
• Medical goods was the largest segment of the healthcare providers sector in 2013, accounting for 30.6% of the sector’s total value.
HEALTHCARE PROVIDERS
HEALTHCARE PROVIDERS BY SEGMENT ‘13
Table 2. Healthcare providers by segment
Source: Marketline.
Segment %2013 (Billions of U.S. Dollars)
Medical goodsOutpatient careInpatient careLong-Term careCollective services
Total
23.622
13.610.5
7.2
76.9
30.6%28.6%17.7%13.7%
9.3%
100%
TAMQUAM PLACERAT IUSCOSTS
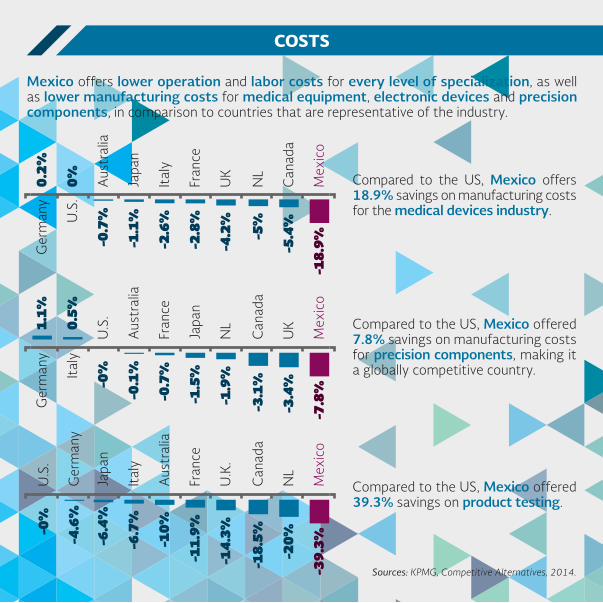
Mexico offers lower operation and labor costs for every level of specialization, as well as lower manufacturing costs for medical equipment, electronic devices and precision components, in comparison to countries that are representative of the industry.
Compared to the US, Mexico offers 18.9% savings on manufacturing costs for the medical devices industry.
Compared to the US, Mexico offered 7.8% savings on manufacturing costs for precision components, making it a globally competitive country.
Compared to the US, Mexico offered 39.3% savings on product testing.
Sources: KPMG, Competitive Alternatives, 2014.
0.2%
0%
-18.
9%-4.2
%
-2.8
%
-2.6
%
-1.1
%
-0.7
%
-5.4
%
-5%
Ger
man
y
Mex
ico
U.S
.
Aus
tral
ia
Japa
n
Ital
y
Fran
ce
UK
NL
Can
ada
1.1%
0.5%
-7.8
%
-1.9
%
-1.5
%
-0.7
%
-0.1
%
-0%
-3.4
%
-3.1
%
Ger
man
y
Mex
ico
Ital
y
U.S
.
Aus
tral
ia
Fran
ce
Japa
n
NL
Can
ada
UK
-39.
3%
-14.
3%
-11.
9%
-10%
-6.7
%
-6.4
%
-4.6
%
-0%
-20%
-18.
5%
Mex
ico
Japa
n
Ger
man
y
U.S
.
Ital
y
Aus
tral
ia
Fran
ce
U.K
.
Can
ada
NL
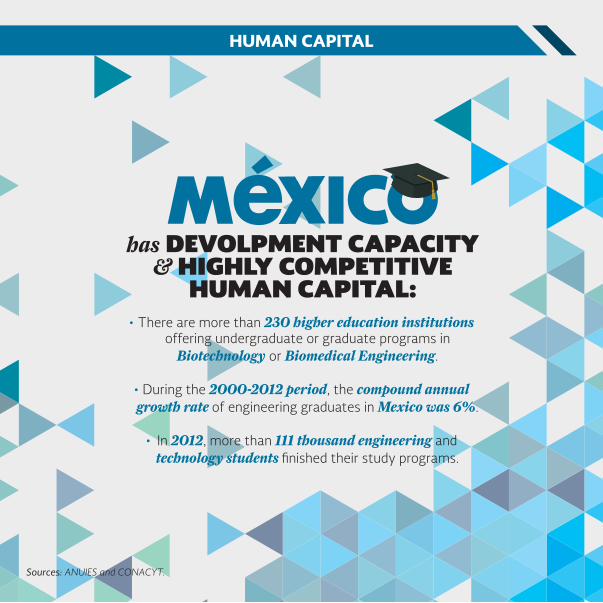
HUMAN CAPITAL
Sources: ANUIES and CONACYT.
• There are more than 230 higher education institutions offering undergraduate or graduate programs in
Biotechnology or Biomedical Engineering.
• During the 2000-2012 period, the compound annual growth rate of engineering graduates in Mexico was 6%.
• In 2012, more than 111 thousand engineering and technology students �nished their study programs.
has DEVOLPMENT CAPACITY& HIGHLY COMPETITIVE
HUMAN CAPITAL:
TAMQUAM PLACERAT IUS
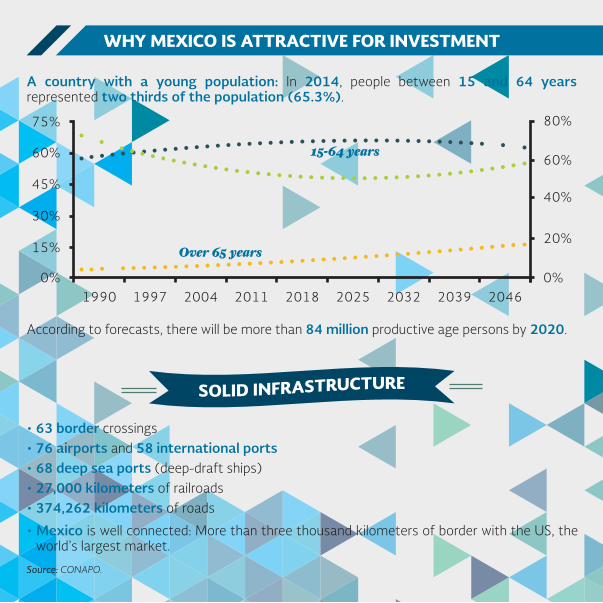
A country with a young population: In 2014, people between 15 and 64 years represented two thirds of the population (65.3%).
According to forecasts, there will be more than 84 million productive age persons by 2020.
• 63 border crossings• 76 airports and 58 international ports• 68 deep sea ports (deep-draft ships)• 27,000 kilometers of railroads• 374,262 kilometers of roads
• Mexico is well connected: More than three thousand kilometers of border with the US, the world’s largest market.
Source: CONAPO.
WHY MEXICO IS ATTRACTIVE FOR INVESTMENT
19900%
15%
45%
30%
60%
75%
20%
60%
40%
80%
0%1997 2004 2011 2018 2025 2032 2039 2046
15-64 years
Over 65 years
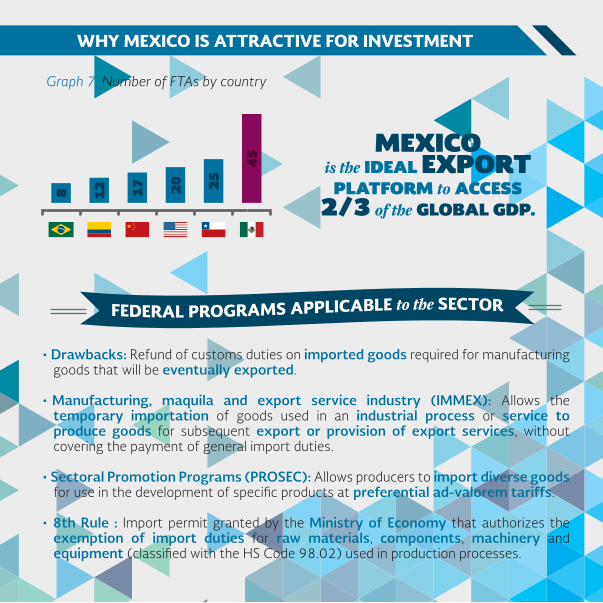
• Drawbacks: Refund of customs duties on imported goods required for manufacturing goods that will be eventually exported.
• Manufacturing, maquila and export service industry (IMMEX): Allows the temporary importation of goods used in an industrial process or service to produce goods for subsequent export or provision of export services, without covering the payment of general import duties.
• Sectoral Promotion Programs (PROSEC): Allows producers to import diverse goods for use in the development of speci�c products at preferential ad-valorem tariffs.
• 8th Rule : Import permit granted by the Ministry of Economy that authorizes the exemption of import duties for raw materials, components, machinery and equipment (classi�ed with the HS Code 98.02) used in production processes.
WHY MEXICO IS ATTRACTIVE FOR INVESTMENT
Graph 7. Number of FTAs by country
MEXICOis the IDEAL EXPORT
PLATFORM to ACCESS2/3 of the GLOBAL GDP.
45
252017128
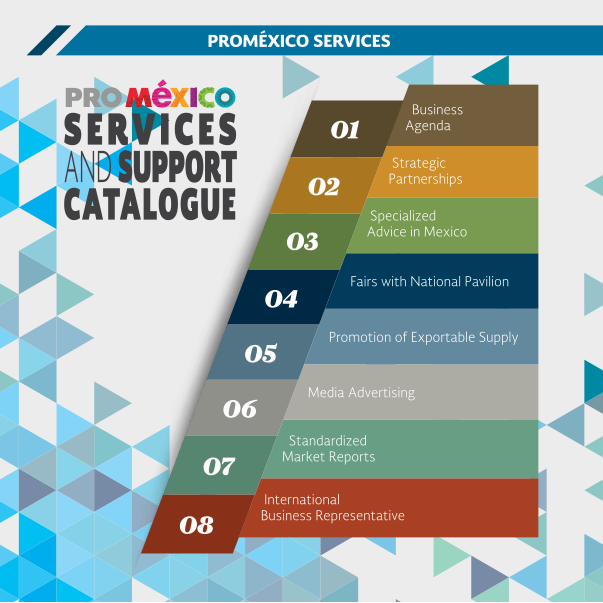
PROMÉXICO SERVICES
StrategicPartnerships
BusinessAgenda
Promotion of Exportable Supply
SpecializedAdvice in Mexico
Fairs with National Pavilion
StandardizedMarket Reports
Media Advertising
InternationalBusiness Representative08
07
06
05
04
03
02
01S E R V I C E SAND SUPPORTCATALOGUE
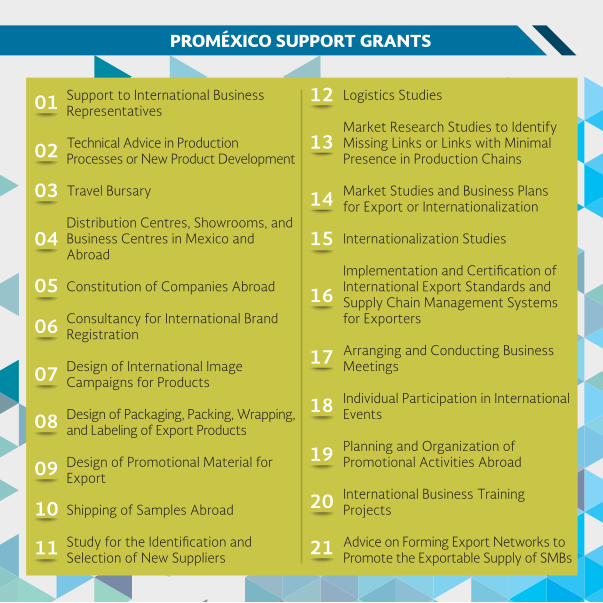
PROMÉXICO SUPPORT GRANTS
10
01
05
02
03
04
08
09
11
06
07
13
14
15
16
17
18
19
12
20
21
Support to International Business Representatives
Technical Advice in Production Processes or New Product Development
Travel Bursary
Distribution Centres, Showrooms, and Business Centres in Mexico and Abroad
Constitution of Companies Abroad
Consultancy for International Brand Registration
Design of International Image Campaigns for Products
Design of Packaging, Packing, Wrapping, and Labeling of Export Products
Design of Promotional Material for Export
Shipping of Samples Abroad
Study for the Identi�cation andSelection of New Suppliers
Logistics Studies
Market Research Studies to Identify Missing Links or Links with Minimal Presence in Production Chains
Market Studies and Business Plansfor Export or Internationalization
Internationalization Studies
Implementation and Certi�cation of International Export Standards andSupply Chain Management Systems for Exporters
Arranging and Conducting Business Meetings
Individual Participation in International Events
Planning and Organization ofPromotional Activities Abroad
International Business Training Projects
Advice on Forming Export Networks to Promote the Exportable Supply of SMBs