Embed Size (px)
Citation preview
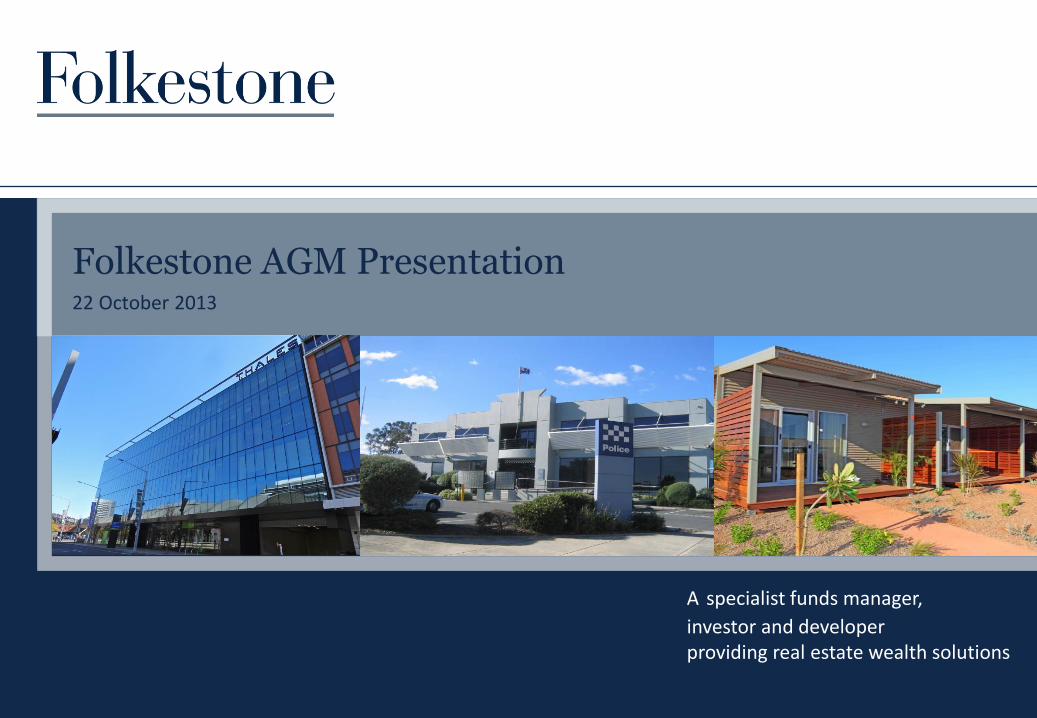
A specialist funds manager,
investor and developer providing real estate wealth solutions
Folkestone AGM Presentation 22 October 2013

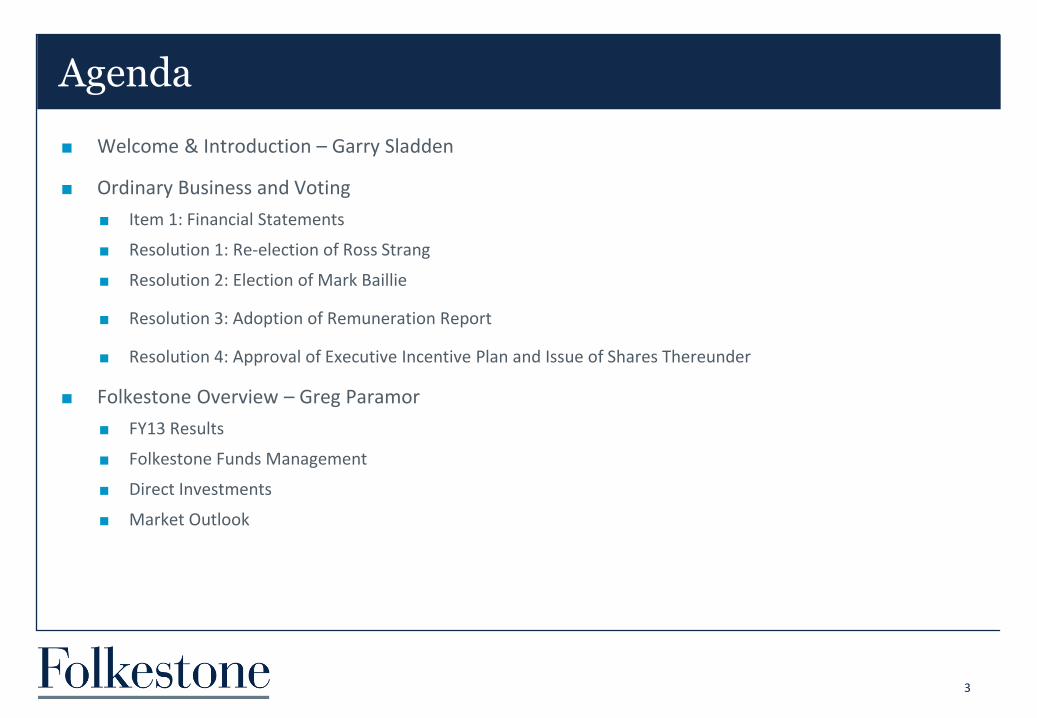
Welcome & Introduction – Garry Sladden
Welcome & Introduction – Garry Sladden
Ordinary Business and Voting
Item 1: Financial Statements
Resolution 1: Re-election of Ross Strang
Resolution 2: Election of Mark Baillie
Resolution 3: Adoption of Remuneration Report
Resolution 4: Approval of Executive Incentive Plan and Issue of Shares Thereunder
Folkestone Overview – Greg Paramor
FY13 Results
Folkestone Funds Management
Direct Investments
Market Outlook
Agenda
3

Ordinary Business & Voting
Financial Statements
“To receive and consider the Directors’ Report, Financial Statements and Independent Auditor’s Report for the year ended 30 June 2013.”
Item 1
5
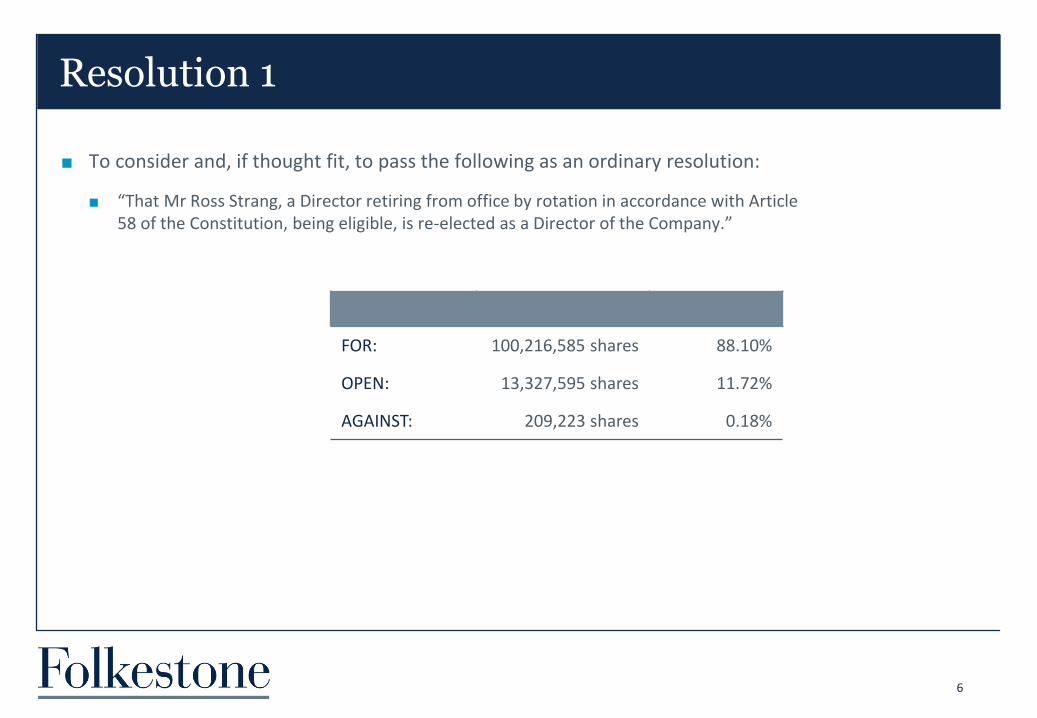
To consider and, if thought fit, to pass the following as an ordinary resolution:
“That Mr Ross Strang, a Director retiring from office by rotation in accordance with Article 58 of the Constitution, being eligible, is re-elected as a Director of the Company.”
Resolution 1
6
FOR: 100,216,585 shares 88.10%
OPEN: 13,327,595 shares 11.72%
AGAINST: 209,223 shares 0.18%
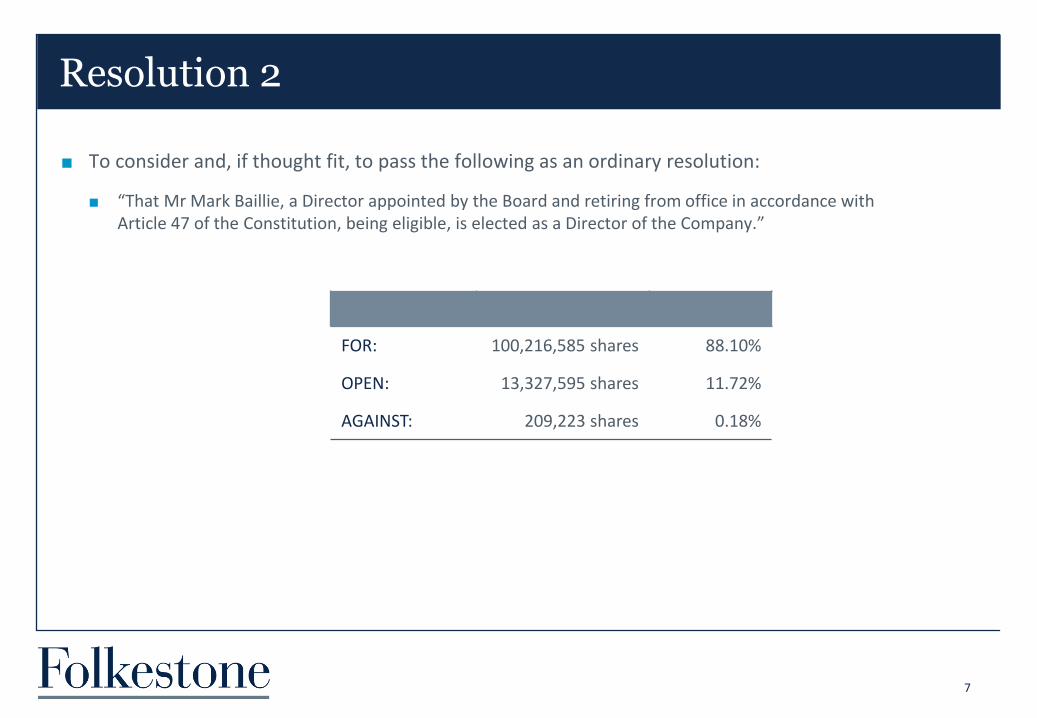
To consider and, if thought fit, to pass the following as an ordinary resolution:
“That Mr Mark Baillie, a Director appointed by the Board and retiring from office in accordance with Article 47 of the Constitution, being eligible, is elected as a Director of the Company.”
Resolution 2
7
FOR: 100,216,585 shares 88.10%
OPEN: 13,327,595 shares 11.72%
AGAINST: 209,223 shares 0.18%
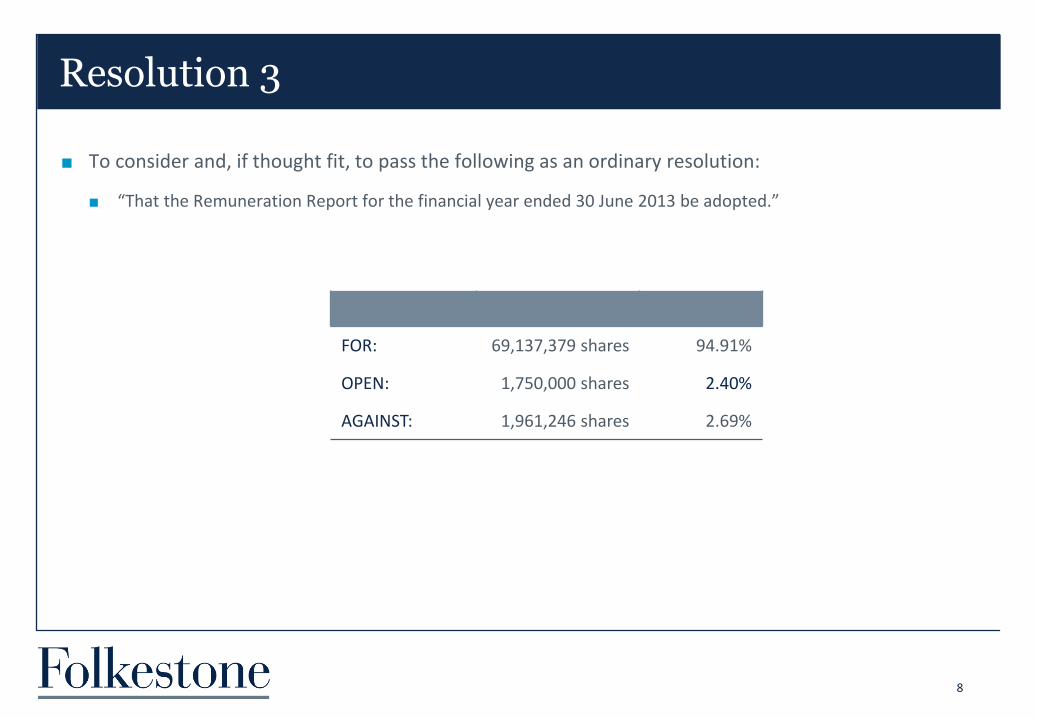
To consider and, if thought fit, to pass the following as an ordinary resolution:
“That the Remuneration Report for the financial year ended 30 June 2013 be adopted.”
Resolution 3
8
FOR: 69,137,379 shares 94.91%
OPEN: 1,750,000 shares 2.40%
AGAINST: 1,961,246 shares 2.69%

To consider and, if thought fit, to pass the following as an ordinary resolution:
“That for purposes of Listing Rule 7.2, exemption 9 and for all other purposes, approval is given:
a. in respect of the Executive Incentive Plan (Amended Plan) for the provision of incentives to officers, employees, executives and senior management whom the Board determines to be eligible to participate in the Amended Plan (Participants); and
b. for the grant of performance rights and/or share appreciation rights to Participants, and the subsequent issue of transfer of Shares to, or in relation to, Participants under the Plan.”
Resolution 4
9
FOR: 59,589,033 shares 77.46%
OPEN: 121,200 shares 0.92%
AGAINST: 4,219,910 shares 5.49%
EXCLUDED: 12,998,666 shares 16.13%
Folkestone Overview – Greg Paramor
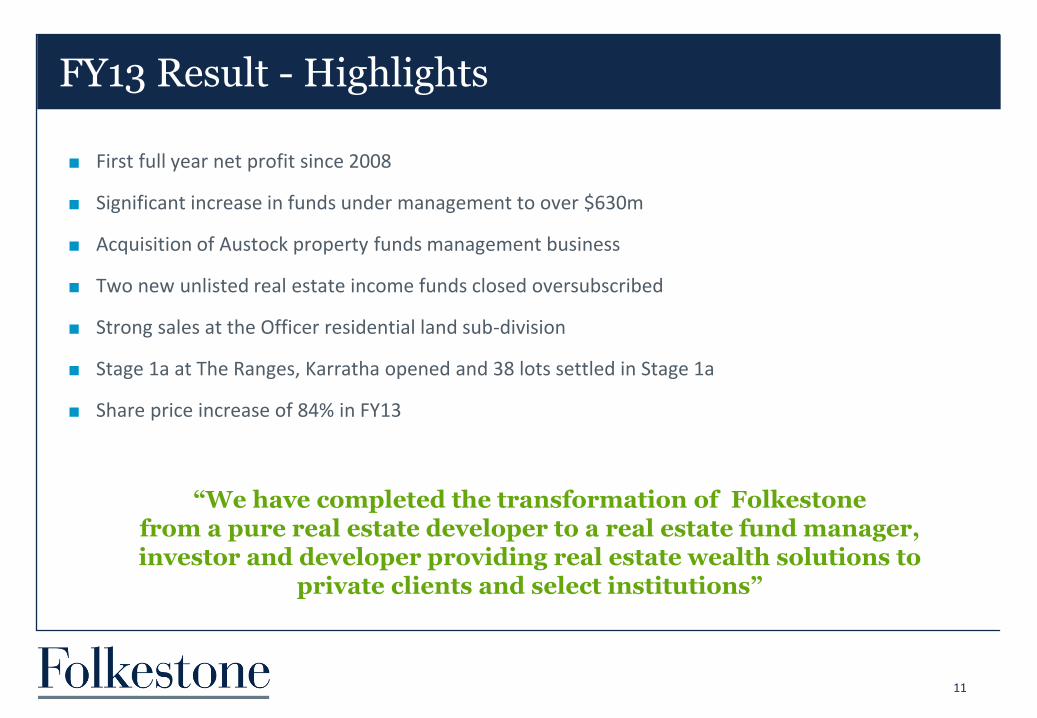
First full year net profit since 2008
Significant increase in funds under management to over $630m
Acquisition of Austock property funds management business
Two new unlisted real estate income funds closed oversubscribed
Strong sales at the Officer residential land sub-division
Stage 1a at The Ranges, Karratha opened and 38 lots settled in Stage 1a
Share price increase of 84% in FY13
FY13 Result - Highlights
11
“We have completed the transformation of Folkestone from a pure real estate developer to a real estate fund manager, investor and developer providing real estate wealth solutions to
private clients and select institutions”
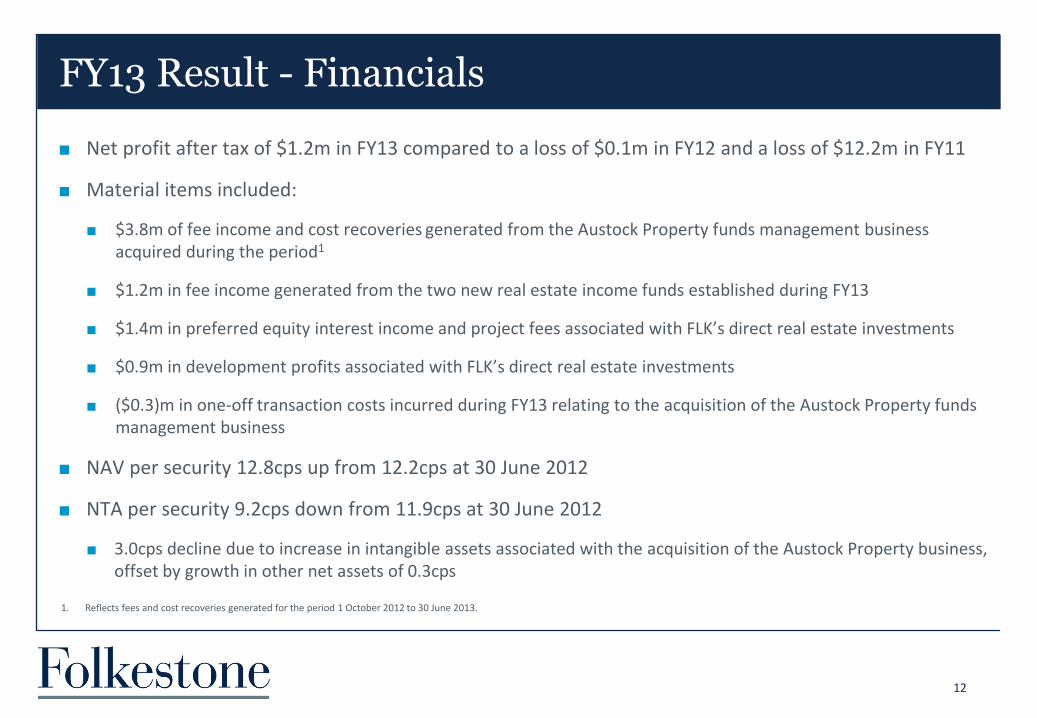
Net profit after tax of $1.2m in FY13 compared to a loss of $0.1m in FY12 and a loss of $12.2m in FY11
Material items included:
$3.8m of fee income and cost recoveries generated from the Austock Property funds management business acquired during the period1
$1.2m in fee income generated from the two new real estate income funds established during FY13
$1.4m in preferred equity interest income and project fees associated with FLK’s direct real estate investments
$0.9m in development profits associated with FLK’s direct real estate investments
($0.3)m in one-off transaction costs incurred during FY13 relating to the acquisition of the Austock Property funds management business
NAV per security 12.8cps up from 12.2cps at 30 June 2012
NTA per security 9.2cps down from 11.9cps at 30 June 2012
3.0cps decline due to increase in intangible assets associated with the acquisition of the Austock Property business, offset by growth in other net assets of 0.3cps
FY13 Result - Financials
12
1. Reflects fees and cost recoveries generated for the period 1 October 2012 to 30 June 2013.
FY13 Result – Financials (continued)
13
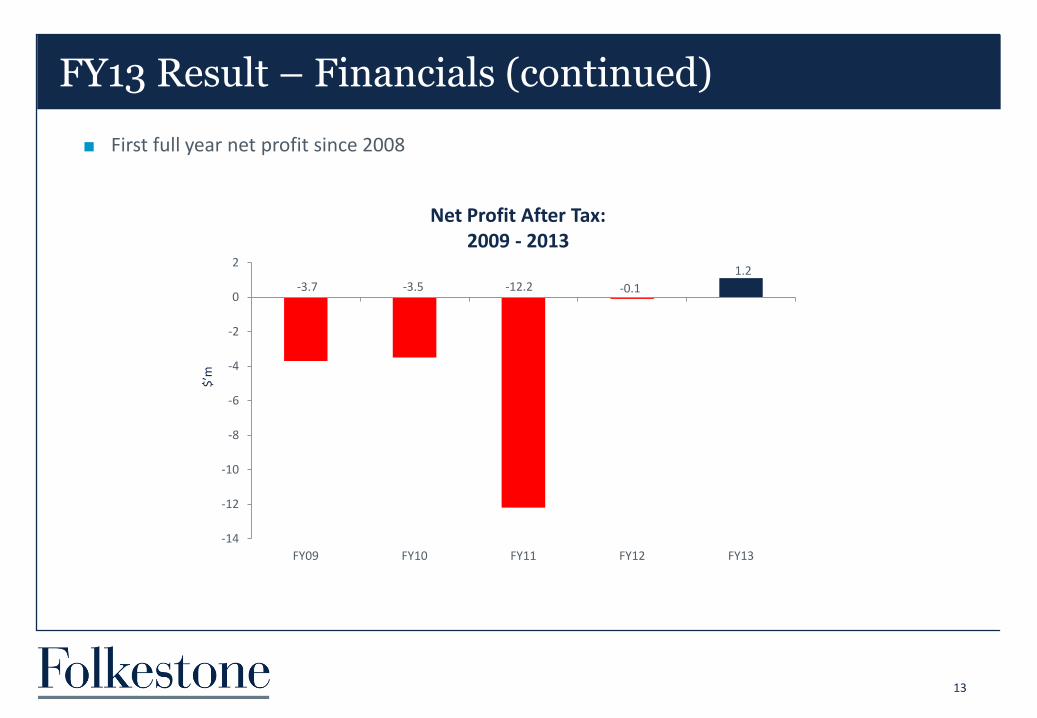
-3.7 -3.5 -12.2 -0.1
1.2
-14
-12
-10
-8
-6
-4
-2
0
2
FY09 FY10 FY11 FY12 FY13
Net Profit After Tax: 2009 - 2013
$’m
First full year net profit since 2008
FY13 Result – Revenue
14
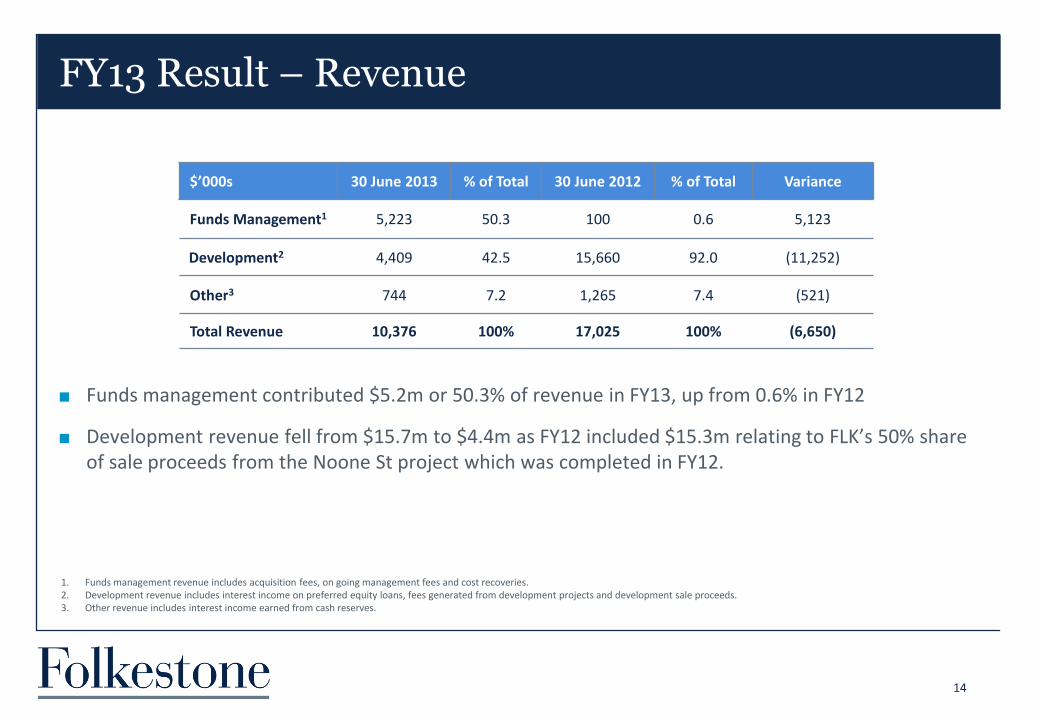
$’000s 30 June 2013 % of Total 30 June 2012 % of Total Variance
Funds Management1 5,223 50.3 100 0.6 5,123
Development2 4,409 42.5 15,660 92.0 (11,252)
Other3 744 7.2 1,265 7.4 (521)
Total Revenue 10,376 100% 17,025 100% (6,650)
Funds management contributed $5.2m or 50.3% of revenue in FY13, up from 0.6% in FY12
Development revenue fell from $15.7m to $4.4m as FY12 included $15.3m relating to FLK’s 50% share of sale proceeds from the Noone St project which was completed in FY12.
1. Funds management revenue includes acquisition fees, on going management fees and cost recoveries. 2. Development revenue includes interest income on preferred equity loans, fees generated from development projects and development sale proceeds. 3. Other revenue includes interest income earned from cash reserves.
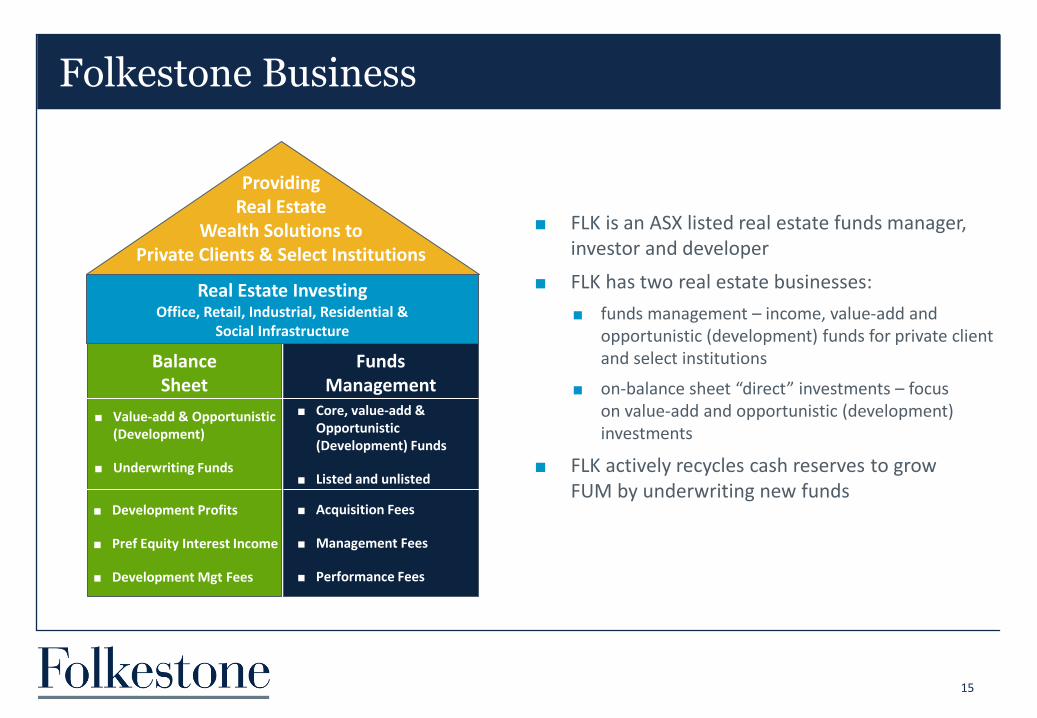
Funds Management
Balance Sheet
Folkestone Business
15
FLK is an ASX listed real estate funds manager, investor and developer
FLK has two real estate businesses:
funds management – income, value-add and opportunistic (development) funds for private client and select institutions
on-balance sheet “direct” investments – focus on value-add and opportunistic (development) investments
FLK actively recycles cash reserves to grow FUM by underwriting new funds
Real Estate Investing Office, Retail, Industrial, Residential &
Social Infrastructure
Value-add & Opportunistic (Development)
Underwriting Funds
Core, value-add & Opportunistic (Development) Funds
Listed and unlisted
Development Profits
Pref Equity Interest Income
Development Mgt Fees
Acquisition Fees
Management Fees
Performance Fees
Providing Real Estate
Wealth Solutions to Private Clients & Select Institutions
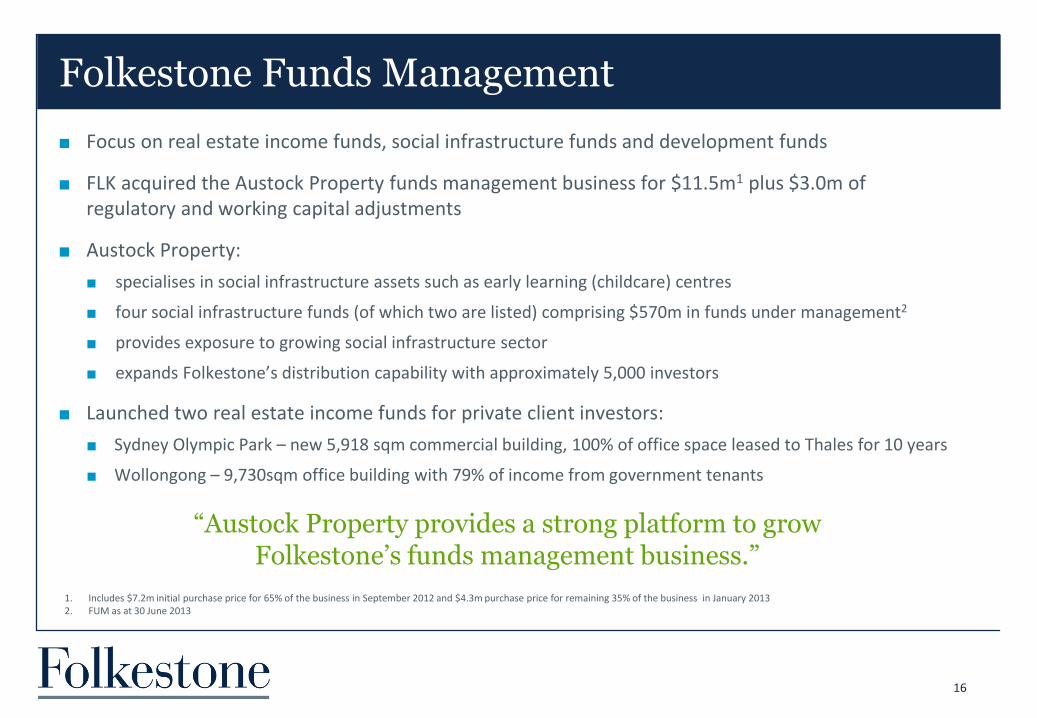
Focus on real estate income funds, social infrastructure funds and development funds
FLK acquired the Austock Property funds management business for $11.5m1 plus $3.0m of regulatory and working capital adjustments
Austock Property:
specialises in social infrastructure assets such as early learning (childcare) centres
four social infrastructure funds (of which two are listed) comprising $570m in funds under management2
provides exposure to growing social infrastructure sector
expands Folkestone’s distribution capability with approximately 5,000 investors
Launched two real estate income funds for private client investors:
Sydney Olympic Park – new 5,918 sqm commercial building, 100% of office space leased to Thales for 10 years
Wollongong – 9,730sqm office building with 79% of income from government tenants
Folkestone Funds Management
16
“Austock Property provides a strong platform to grow Folkestone’s funds management business.”
1. Includes $7.2m initial purchase price for 65% of the business in September 2012 and $4.3m purchase price for remaining 35% of the business in January 2013 2. FUM as at 30 June 2013
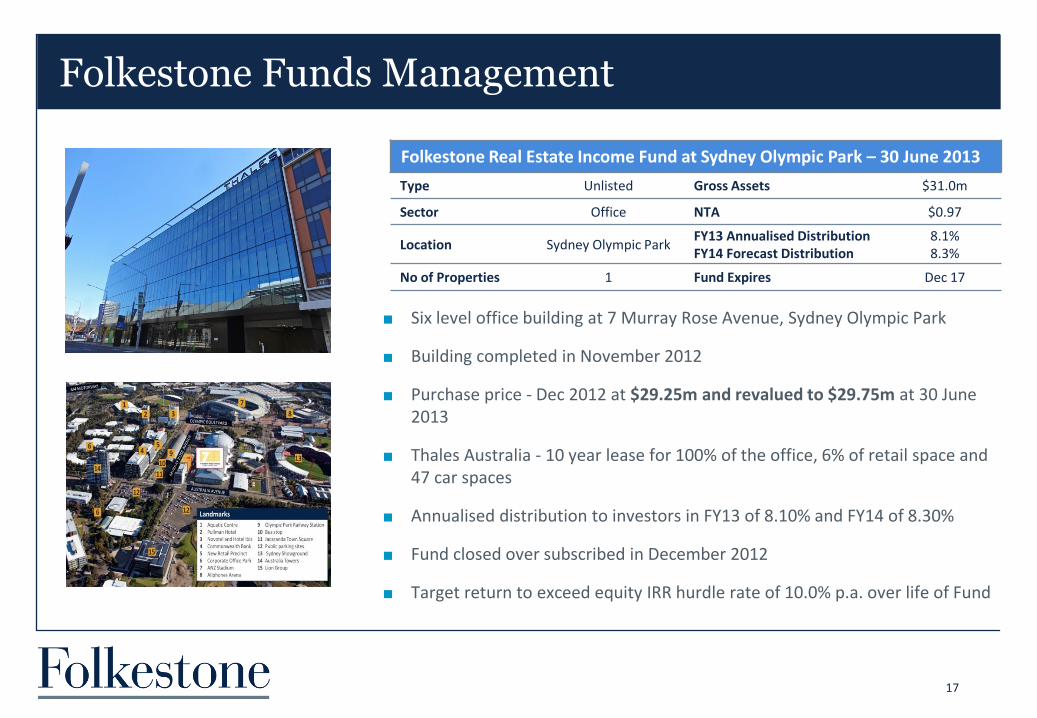
Six level office building at 7 Murray Rose Avenue, Sydney Olympic Park
Building completed in November 2012
Purchase price - Dec 2012 at $29.25m and revalued to $29.75m at 30 June 2013
Thales Australia - 10 year lease for 100% of the office, 6% of retail space and 47 car spaces
Annualised distribution to investors in FY13 of 8.10% and FY14 of 8.30%
Fund closed over subscribed in December 2012
Target return to exceed equity IRR hurdle rate of 10.0% p.a. over life of Fund
Folkestone Funds Management
17
Folkestone Real Estate Income Fund at Sydney Olympic Park – 30 June 2013
Type Unlisted Gross Assets $31.0m
Sector Office NTA $0.97
Location Sydney Olympic Park FY13 Annualised Distribution FY14 Forecast Distribution
8.1% 8.3%
No of Properties 1 Fund Expires Dec 17

A six level commercial office building at 43 Burelli Street and 34 Stewart Street, Wollongong
Acquisition price - $23.27m1 reflecting a 12.00% passing yield and 5.80% discount to independent valuation
High yield – forecast distribution yield of 10.50% in FY14 paid quarterly
Strong lease covenants – approximately 79% of the income is currently sourced from Commonwealth and State Government tenants
Fund closed circa 50% oversubscribed in June 2013
Target return to exceed equity IRR hurdle rate of 12.0% p.a. over life of Fund
Folkestone Funds Management
18
Folkestone Real Estate Income Fund at Wollongong - 30 June 2013
Type Unlisted Gross Assets $26.4m
Sector Office NTA $0.96
Location Wollongong FY13 Annualised Distribution FY14 Forecast Distribution
10.5% 10.5%
No of Properties 1 Fund Expires June 19
1. The Acquisition Price may be reduced to $23.070 million if by 1 July 2014 a new Family Court of Australia (FCA) lease is not executed or FCA vacates the premises.
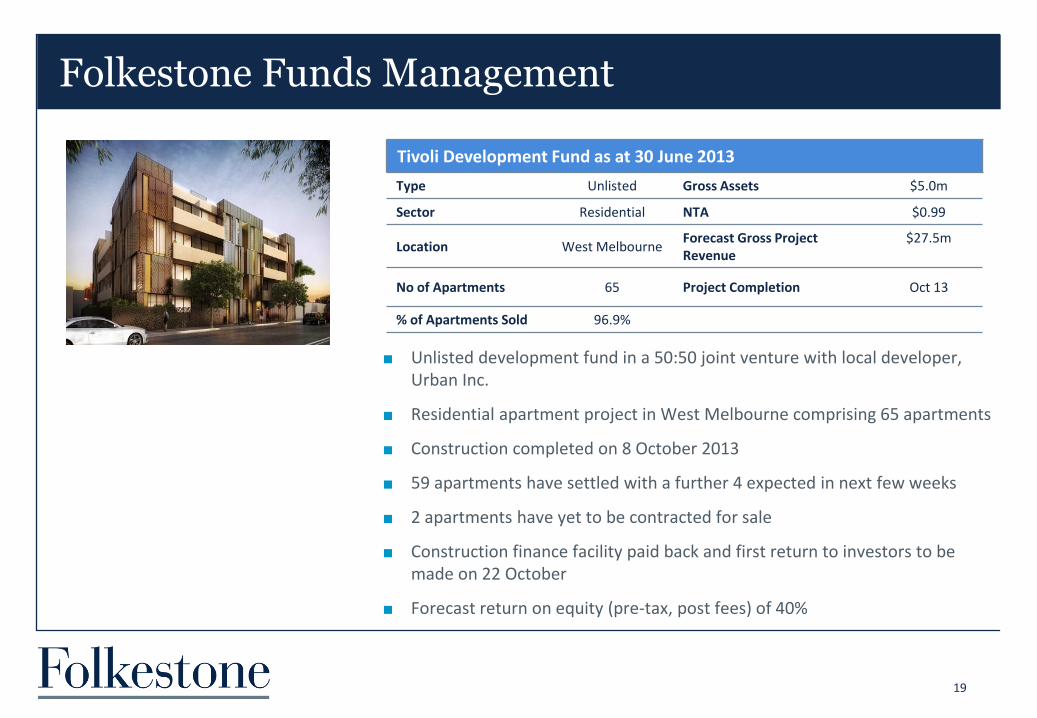
Unlisted development fund in a 50:50 joint venture with local developer, Urban Inc.
Residential apartment project in West Melbourne comprising 65 apartments
Construction completed on 8 October 2013
59 apartments have settled with a further 4 expected in next few weeks
2 apartments have yet to be contracted for sale
Construction finance facility paid back and first return to investors to be made on 22 October
Forecast return on equity (pre-tax, post fees) of 40%
Folkestone Funds Management
19
Tivoli Development Fund as at 30 June 2013
Type Unlisted Gross Assets $5.0m
Sector Residential NTA $0.99
Location West Melbourne Forecast Gross Project Revenue
$27.5m
No of Apartments 65 Project Completion Oct 13
% of Apartments Sold 96.9%
Folkestone Funds Management
20
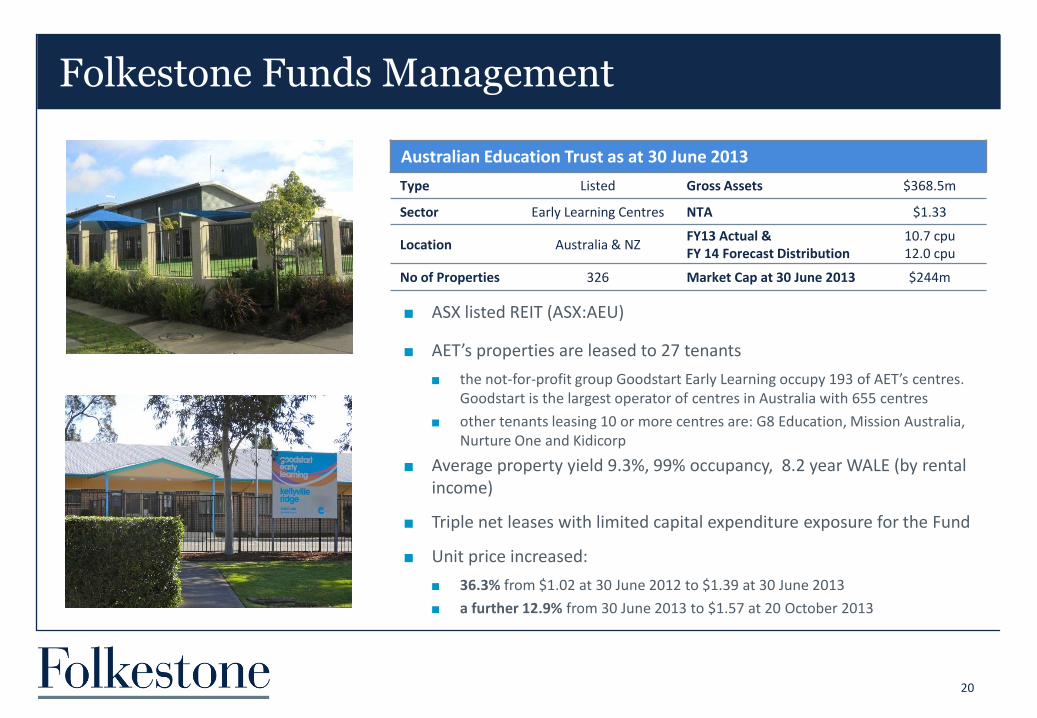
Australian Education Trust as at 30 June 2013
Type Listed Gross Assets $368.5m
Sector Early Learning Centres NTA $1.33
Location Australia & NZ FY13 Actual & FY 14 Forecast Distribution
10.7 cpu 12.0 cpu
No of Properties 326 Market Cap at 30 June 2013 $244m
ASX listed REIT (ASX:AEU)
AET’s properties are leased to 27 tenants
the not-for-profit group Goodstart Early Learning occupy 193 of AET’s centres. Goodstart is the largest operator of centres in Australia with 655 centres
other tenants leasing 10 or more centres are: G8 Education, Mission Australia, Nurture One and Kidicorp
Average property yield 9.3%, 99% occupancy, 8.2 year WALE (by rental income)
Triple net leases with limited capital expenditure exposure for the Fund
Unit price increased:
36.3% from $1.02 at 30 June 2012 to $1.39 at 30 June 2013
a further 12.9% from 30 June 2013 to $1.57 at 20 October 2013

Folkestone Funds Management
21
Australian Social Infrastructure Fund as at 30 June 2013
Type Listed Gross Assets $107.3m
Sector Social Infrastructure NTA $2.48
Location Australia FY13 Actual Distribution FY14 Forecast Distribution
17.6 cpu 19.0 cpu
No of Properties 50 Market Cap at 30 June 2013 $61m
ASX listed REIT (ASX:AZF)
Diversified social infrastructure fund – 48 early learning centres, a self storage facility and a medical centre
Average property yield 9.3%, 98% occupancy and 7.8 year WALE (by rental income)
Triple net leases with limited capital expenditure exposure for the Fund
Portfolio of holdings in four property securities with book value of $19.9m - 19% of ASIF’s total assets
Unit price increased:
19.6% from $1.79 at 30 June 2012 to $2.14 at 30 June 2013
a further 5.0% from 30 June 2013 to $2.25 at 20 October 2013
Folkestone Funds Management
22
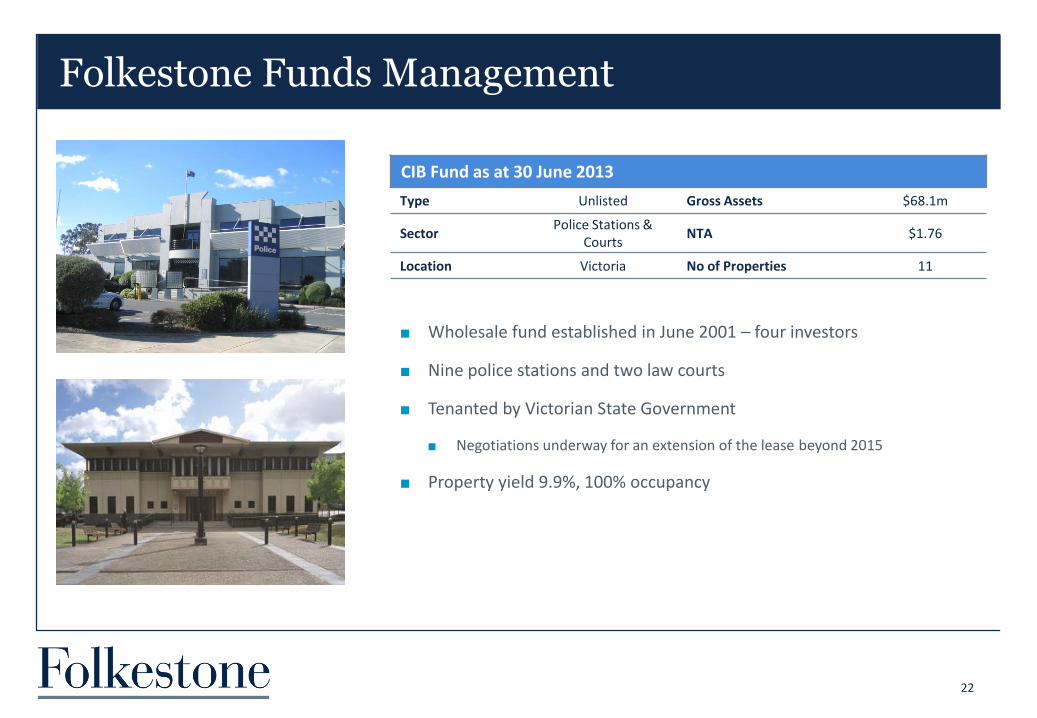
CIB Fund as at 30 June 2013
Type Unlisted Gross Assets $68.1m
Sector Police Stations &
Courts NTA $1.76
Location Victoria No of Properties 11
Wholesale fund established in June 2001 – four investors
Nine police stations and two law courts
Tenanted by Victorian State Government
Negotiations underway for an extension of the lease beyond 2015
Property yield 9.9%, 100% occupancy
Folkestone Funds Management
23
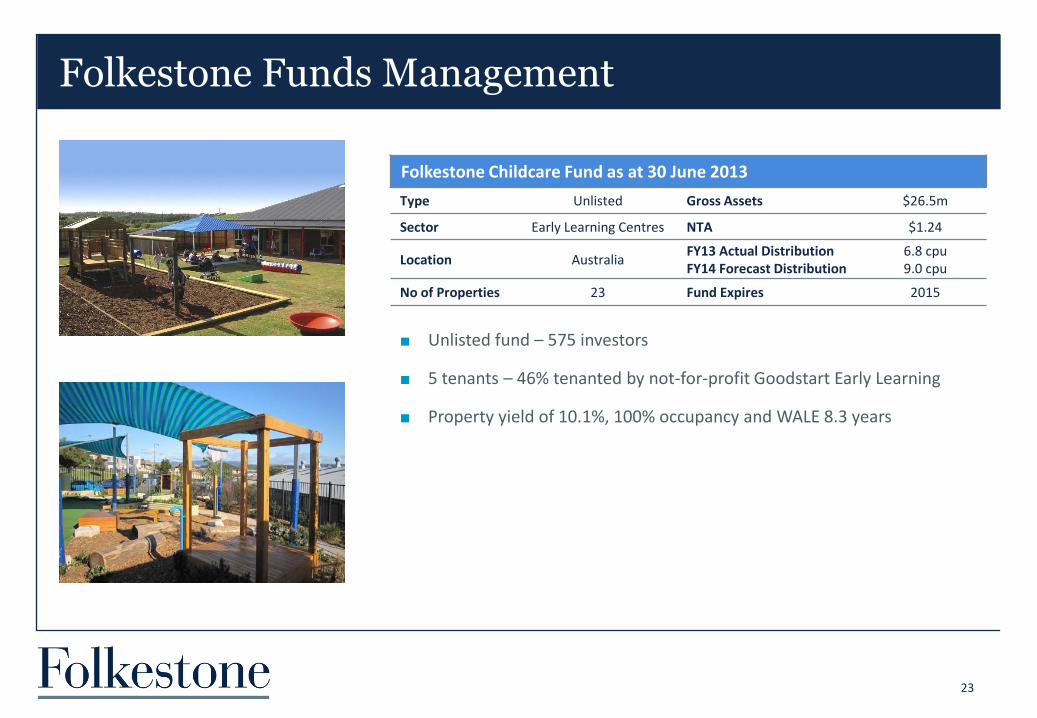
Folkestone Childcare Fund as at 30 June 2013
Type Unlisted Gross Assets $26.5m
Sector Early Learning Centres NTA $1.24
Location Australia FY13 Actual Distribution FY14 Forecast Distribution
6.8 cpu 9.0 cpu
No of Properties 23 Fund Expires 2015
Unlisted fund – 575 investors
5 tenants – 46% tenanted by not-for-profit Goodstart Early Learning
Property yield of 10.1%, 100% occupancy and WALE 8.3 years
Stage 1 (56 lots) started construction in October 2012 and was completed in April 2013
Stage 2 (43 lots) started construction in July 2013 with completion expected early 2014
As at 30 June 2013, 65 lots (53 in Stage 1 and 12 in Stage 2) under contract. Of the Stage 1 lots, 43 were settled by 30 June with a further 10 settled post 30 June (total value of settlements - $9.8m at average price $185,000)
Post 30 June – a further 3 lots in Stage 1, 22 lots in Stage 2 and 3 lots in Stage 3 are now under contract
Forecast FLK equity IRR – 29.0%
Direct Investments
24
Potters Grove, Officer as at 30 June 2013
Sector Residential Ownership Interest 50%
Location Officer, Vic JV Partner ID Land
Area/Size 14.1ha FLK Equity Invested $4.8m
Acquired June 2011 FLK Preferred Equity Invested1 $2.7m
Total Lots 227 Debt Provider Bank of Melbourne
% of Lots Sold 28.6% Debt Amount (FLK Share) $1.6m
Forecast Project Value – Gross Revenue
$44.0m Debt Expiry Post 30 June debt
refinanced to Sept 14
Settlements Started May 2013 FLK Gross Book Value $9.1m
Price Range of Lots $129,000 - $244,000
1. FLK has provided $2.0m in preferred equity to this project. The preferred equity is subject to a fixed rate of interest which is calculated and recognised as income on a monthly basis. The loan balance at 30 June 2013 includes $0.7m of accrued interest.
Providing short and long-term accommodation in Karratha
Stage 1 consists of 108 one bedroom villas:
Stage 1a (41 villas) - 38 sold and settled at 30 June, 1 settled post and 2 are under contract
Stage 1a opened for trade on 3 December 2012
Stage 1b (35 villas) - 16 are under contract with construction to commence early 2014
Adjoining 7.1ha site with potential for circa 261 dwellings settled on 24 January 2013
FLK exposure - $4.8m or 10.0% of FLK net assets and FLK share of project debt on look through basis is $450,000 or 0.95% of FLK net assets
Direct Investments
25
The Ranges, Karratha as at 30 June 2013
Sector Accommodation Ownership Interest1 25%
Location Karratha, WA JV Partner Various Parties
Area/Size Stage 1 - 2.2ha/ Stage 2 - 7.1ha
FLK Equity Invested $1.9m
Acquired Stage 1 - June 2011
Stage 2 – January 2013 FLK Preferred Equity Invested2 $2.9m
Total Villas Stage 1 – 108 FLK Gross Book Value $4.8m
% of Villas Sold Stage 1 – 51% Settlements Start March 2013
Forecast Project Value – Gross Revenue
Stage 1 – $64.4m Price Range of Villas $525,000 to
$565,000
1. FLK’s 25% interest in this project is reflected in the balance sheet as units in associated entities. This project has a debt facility with St George Bank which was drawn to $1.8m as at 30 September 2013. 2. FLK has provided $2.0m in preferred equity to this project. The preferred equity is subject to a fixed rate of interest which is calculated and recognised as income on a monthly basis. The loan balance at 30 June 2013
includes $0.9m of accrued interest.
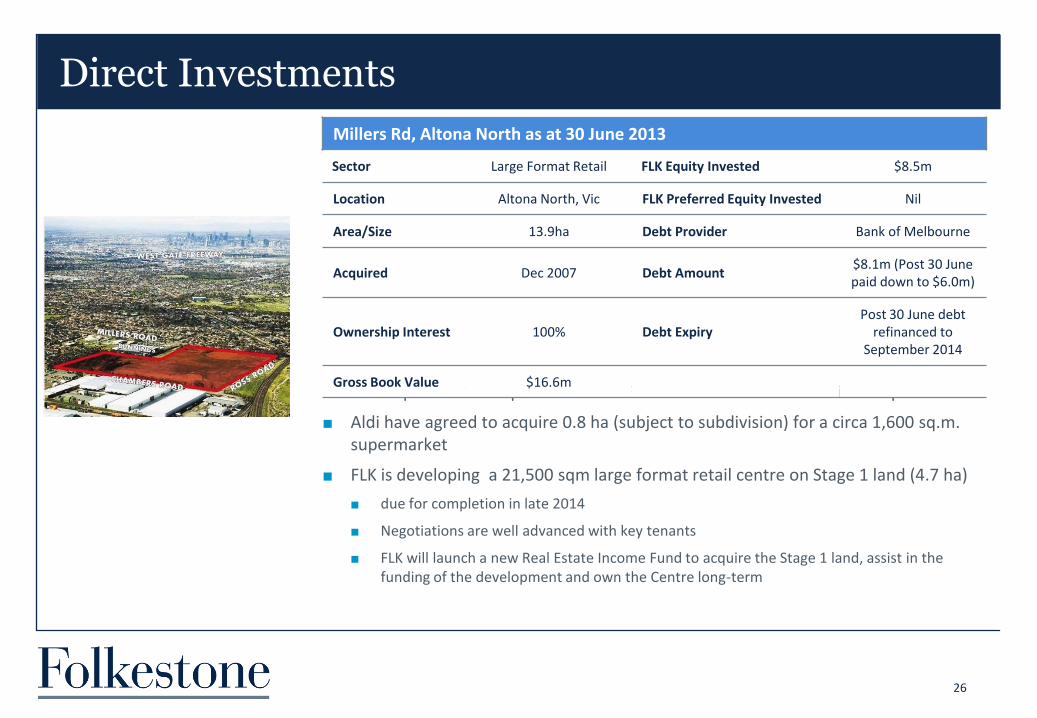
FLK acquired AMP Capital Investors’ 50% interest in the 13.9ha site in April 2013
Aldi have agreed to acquire 0.8 ha (subject to subdivision) for a circa 1,600 sq.m. supermarket
FLK is developing a 21,500 sqm large format retail centre on Stage 1 land (4.7 ha)
due for completion in late 2014
Negotiations are well advanced with key tenants
FLK will launch a new Real Estate Income Fund to acquire the Stage 1 land, assist in the funding of the development and own the Centre long-term
Direct Investments
26
Millers Rd, Altona North as at 30 June 2013
Sector Large Format Retail FLK Equity Invested $8.5m
Location Altona North, Vic FLK Preferred Equity Invested Nil
Area/Size 13.9ha Debt Provider Bank of Melbourne
Acquired Dec 2007 Debt Amount $8.1m (Post 30 June paid down to $6.0m)
Ownership Interest 100% Debt Expiry Post 30 June debt
refinanced to September 2014
Gross Book Value $16.6m
Well positioned to continue to deliver on the strategy of:
growing its suite of listed and unlisted real estate funds
seeking value-add and opportunistic investments on balance sheet activities
Grow recurring earnings through funds management
actively source product for existing and new income and development funds
take advantage of strong demand from investors for yield based product
opportunity to capitalise on the growing social infrastructure space – social and demographic changes plus government increasingly looking at public-private partnerships
Deliver on existing balance sheet projects - Altona North - Victoria, Officer - Victoria and Karratha - Western Australia
Undertake earnings accretive opportunistic acquisitions
Folkestone Outlook
27
Market Outlook – Greg Paramor
Australian Market Conditions – Office
29
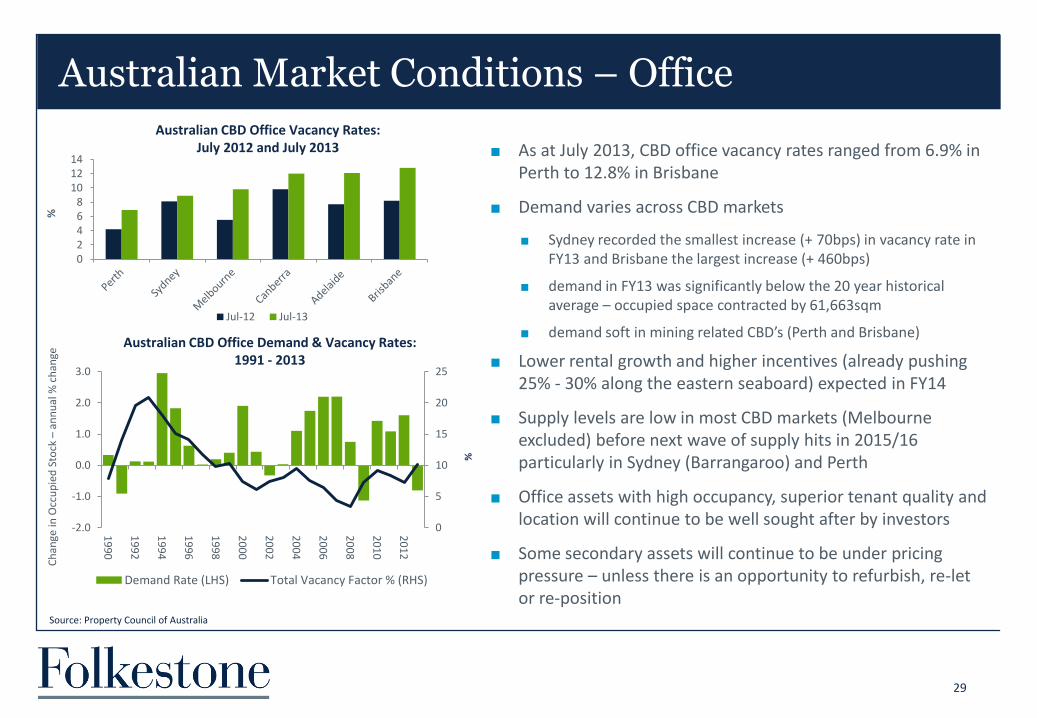
As at July 2013, CBD office vacancy rates ranged from 6.9% in Perth to 12.8% in Brisbane
Demand varies across CBD markets
Sydney recorded the smallest increase (+ 70bps) in vacancy rate in FY13 and Brisbane the largest increase (+ 460bps)
demand in FY13 was significantly below the 20 year historical average – occupied space contracted by 61,663sqm
demand soft in mining related CBD’s (Perth and Brisbane)
Lower rental growth and higher incentives (already pushing 25% - 30% along the eastern seaboard) expected in FY14
Supply levels are low in most CBD markets (Melbourne excluded) before next wave of supply hits in 2015/16 particularly in Sydney (Barrangaroo) and Perth
Office assets with high occupancy, superior tenant quality and location will continue to be well sought after by investors
Some secondary assets will continue to be under pricing pressure – unless there is an opportunity to refurbish, re-let or re-position
Australian CBD Office Vacancy Rates: July 2012 and July 2013
Source: Property Council of Australia
%
Ch
ange
in O
ccu
pie
d S
tock
– a
nn
ual
% c
han
ge
02468
101214
Jul-12 Jul-13
Australian CBD Office Demand & Vacancy Rates: 1991 - 2013
%
0
5
10
15
20
25
-2.0
-1.0
0.0
1.0
2.0
3.0
19
90
19
92
19
94
19
96
19
98
20
00
20
02
20
04
20
06
20
08
20
10
20
12
Demand Rate (LHS) Total Vacancy Factor % (RHS)
Australian Market Conditions – Retail
30
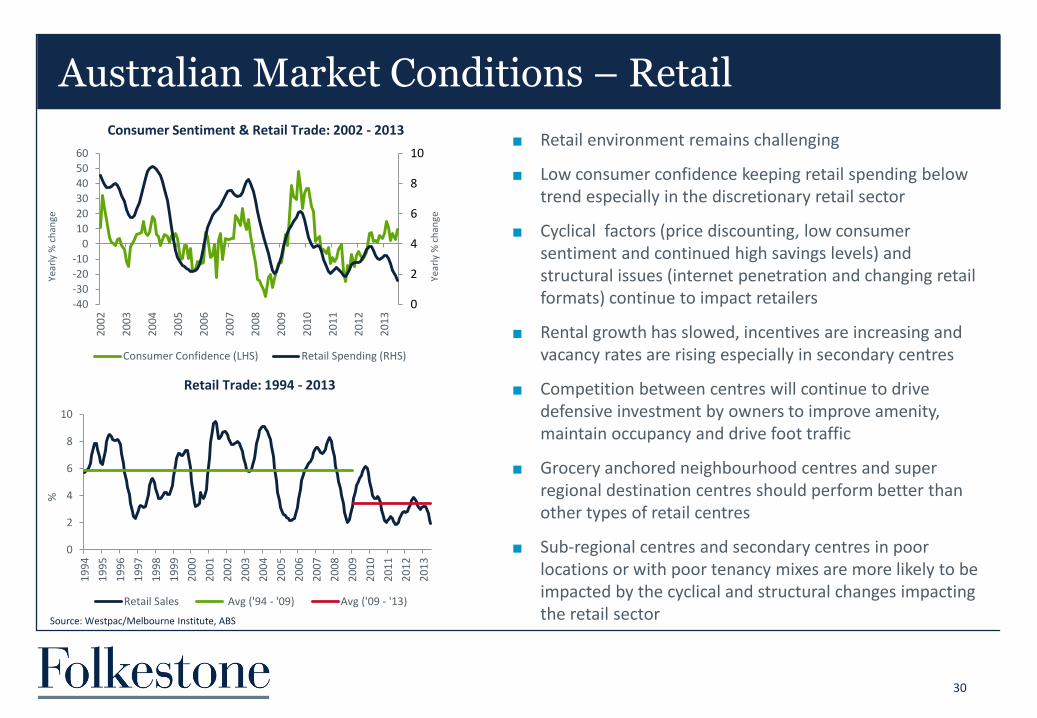
Retail environment remains challenging
Low consumer confidence keeping retail spending below trend especially in the discretionary retail sector
Cyclical factors (price discounting, low consumer sentiment and continued high savings levels) and structural issues (internet penetration and changing retail formats) continue to impact retailers
Rental growth has slowed, incentives are increasing and vacancy rates are rising especially in secondary centres
Competition between centres will continue to drive defensive investment by owners to improve amenity, maintain occupancy and drive foot traffic
Grocery anchored neighbourhood centres and super regional destination centres should perform better than other types of retail centres
Sub-regional centres and secondary centres in poor locations or with poor tenancy mixes are more likely to be impacted by the cyclical and structural changes impacting the retail sector
Source: Westpac/Melbourne Institute, ABS
Year
ly %
ch
ange
0
2
4
6
8
10
-40
-30
-20
-10
0
10
20
30
40
50
60
20
02
20
03
20
04
20
05
20
06
20
07
20
08
20
09
20
10
20
11
20
12
20
13
Consumer Confidence (LHS) Retail Spending (RHS)
%
Consumer Sentiment & Retail Trade: 2002 - 2013
Retail Trade: 1994 - 2013
0
2
4
6
8
10
19
94
19
95
19
96
19
97
19
98
19
99
20
00
20
01
20
02
20
03
20
04
20
05
20
06
20
07
20
08
20
09
20
10
20
11
20
12
20
13
Retail Sales Avg ('94 - '09) Avg ('09 - '13)
Year
ly %
ch
ange
Australian Market Conditions – Industrial
31
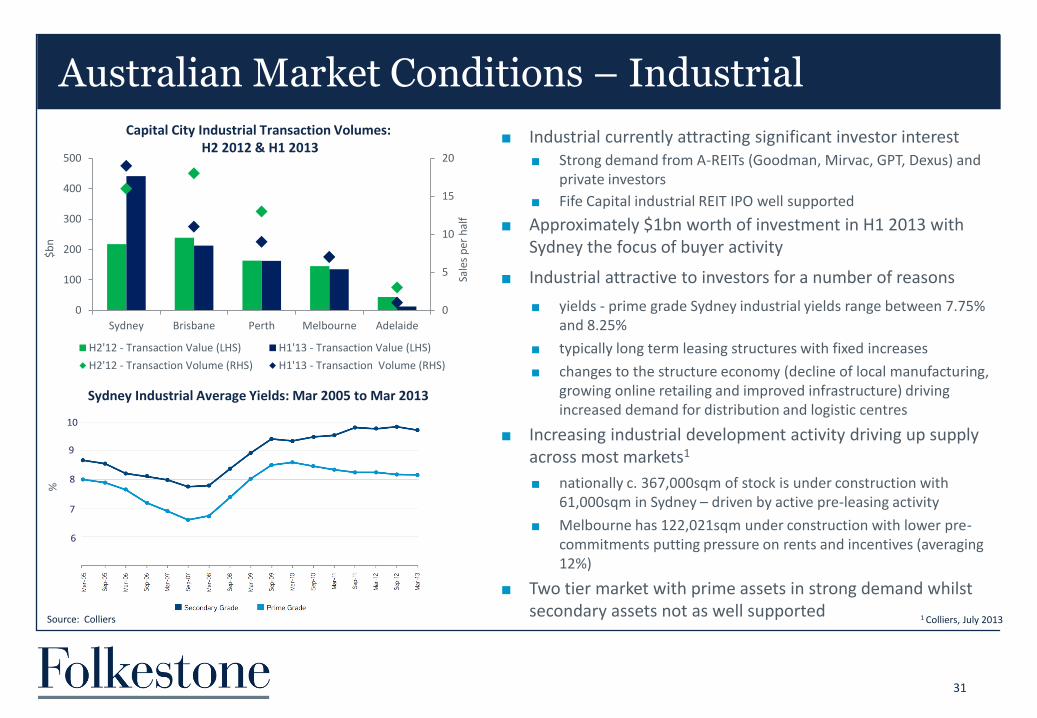
Industrial currently attracting significant investor interest Strong demand from A-REITs (Goodman, Mirvac, GPT, Dexus) and
private investors
Fife Capital industrial REIT IPO well supported
Approximately $1bn worth of investment in H1 2013 with Sydney the focus of buyer activity
Industrial attractive to investors for a number of reasons
yields - prime grade Sydney industrial yields range between 7.75% and 8.25%
typically long term leasing structures with fixed increases
changes to the structure economy (decline of local manufacturing, growing online retailing and improved infrastructure) driving increased demand for distribution and logistic centres
Increasing industrial development activity driving up supply across most markets1
nationally c. 367,000sqm of stock is under construction with 61,000sqm in Sydney – driven by active pre-leasing activity
Melbourne has 122,021sqm under construction with lower pre-commitments putting pressure on rents and incentives (averaging 12%)
Two tier market with prime assets in strong demand whilst secondary assets not as well supported
Sale
s p
er h
alf
$b
n
Capital City Industrial Transaction Volumes: H2 2012 & H1 2013
Sydney Industrial Average Yields: Mar 2005 to Mar 2013
Source: Colliers
10
9
8
7
6
%
1 Colliers, July 2013
0
5
10
15
20
0
100
200
300
400
500
Sydney Brisbane Perth Melbourne Adelaide
H2'12 - Transaction Value (LHS) H1'13 - Transaction Value (LHS)
H2'12 - Transaction Volume (RHS) H1'13 - Transaction Volume (RHS)
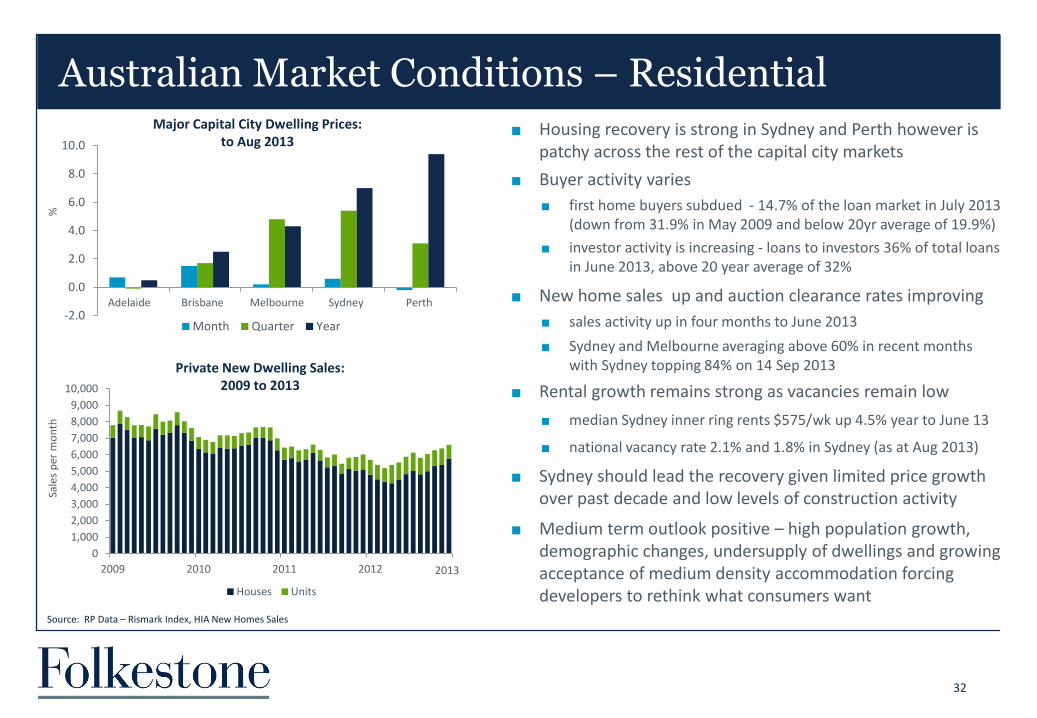
Australian Market Conditions – Residential
32
Housing recovery is strong in Sydney and Perth however is patchy across the rest of the capital city markets
Buyer activity varies
first home buyers subdued - 14.7% of the loan market in July 2013 (down from 31.9% in May 2009 and below 20yr average of 19.9%)
investor activity is increasing - loans to investors 36% of total loans in June 2013, above 20 year average of 32%
New home sales up and auction clearance rates improving
sales activity up in four months to June 2013
Sydney and Melbourne averaging above 60% in recent months with Sydney topping 84% on 14 Sep 2013
Rental growth remains strong as vacancies remain low
median Sydney inner ring rents $575/wk up 4.5% year to June 13
national vacancy rate 2.1% and 1.8% in Sydney (as at Aug 2013)
Sydney should lead the recovery given limited price growth over past decade and low levels of construction activity
Medium term outlook positive – high population growth, demographic changes, undersupply of dwellings and growing acceptance of medium density accommodation forcing developers to rethink what consumers want
Major Capital City Dwelling Prices: to Aug 2013
%
Source: RP Data – Rismark Index, HIA New Homes Sales
0
1,000
2,000
3,000
4,000
5,000
6,000
7,000
8,000
9,000
10,000
2009 2010 2011 2012
Houses Units
Private New Dwelling Sales: 2009 to 2013
Sale
s p
er m
on
th
2013
-2.0
0.0
2.0
4.0
6.0
8.0
10.0
Adelaide Brisbane Melbourne Sydney Perth
Month Quarter Year

Early Learning Sector
33
Graph Source: ABS 1 Department of Education, Employment and Workplace Relations – Childcare in Australia - August 2013
The key drivers of the early learning sector:
demand for childcare services remain strong
birth rates has grown steadily - 2012 birth rate at an all time high
increased female participation rate in the labour force, supporting demand for long day care
recognition of social and educational benefits of early learning in children aged 1-5 years
government assisting with access to childcare, largely through Child Care Benefit and Child Care Rebate schemes, with the government forecast to spend $22bn to 2016-171
population of children less than 5 years in the catchment area of a centre drives occupancy and profitability
State of the market:
there are 6,192 long day care centres in Australia, an increase of 1,635 centres or 35.9% since 20041
since 2004, the number of children using long day care centres has increased by 39.5 per cent to 615,630 children1
49.2% of 3 to 5 year olds used childcare in 2012, up from 43.0% in 2006. In the 0-2 years age cohort, 31.4% used childcare compared to 26.9% in 20061
there continues to be unmet demand, as evidenced by healthy waiting lists, in many areas across Australia.
Australian Birth Rates by Year: 2001 - 2012
200,000
220,000
240,000
260,000
280,000
300,000
320,000
20
01
20
02
20
03
20
04
20
05
20
06
20
07
20
08
20
09
20
10
20
11
20
12
40
45
50
55
60
65
70
75
80
85
19
78
19
80
19
81
19
83
19
85
19
87
19
89
19
91
19
93
19
95
19
97
19
99
20
01
20
03
20
04
20
06
20
08
20
10
20
12
20-24 25-34 35-44
Female Participation % by Age-Group: 1978 - 2012
%

34
Market Outlook
Weight of capital to support values
Residential market recovery underway
Mixed fortunes across the non-residential real estate sectors
Office – subdued demand and future supply increases to limit upside
Retail – difficult trading conditions and structural changes to continue
Industrial – currently favourite asset class
Higher global bond yields will provide a challenge across all sectors
Development of niche real estate sectors to continue
Longer term trends supportive of continued investment into real estate from both
domestic and global institutions
private client investors especially SMSF’s
Sources: IbisWorld Industry Report July 2012, DEEWR 2012

A specialist funds manager,
investor and developer providing real estate wealth solutions
Folkestone AGM Presentation 22 October 2013

Disclaimer
This paper has been published for information purposes only. The information contained in this paper is of a general nature only and does not constitute financial product advice. This presentation has been prepared without taking account of any person's objectives, financial situation or needs. Because of that, each person should, before acting on this presentation, consider its appropriateness, having regard to their own objectives, financial situation and needs. You should consult a professional investment adviser before making any decision regarding a financial product.
In preparing this presentation the author has relied upon and assumed, without independent verification, the accuracy and completeness of all information available from public sources or which has otherwise been reviewed in preparation of the paper. The information contained in this paper is current as at the date of this paper and is subject to change without notice. Past performance is not an indicator of future performance.
Neither Folkestone Limited, nor any of their associates, related entities or directors, give any warranty as to the accuracy, reliability or completeness of the information contained in this paper. Except insofar as liability under any statute cannot be excluded, Folkestone Limited and its associates, related entities, directors, employees and consultants do not accept any liability for any loss or damage (whether direct, indirect, consequential or otherwise) arising from the use of this paper.
If a product managed by Folkestone Limited or its associates is acquired, Folkestone Limited or its associates and related entities may receive fees and other benefits. The author of this paper does not receive commissions or remuneration from transactions involving the financial products mentioned in this paper.
Folkestone Limited Level 10, 60 Carrington Street Level 12, 15 William St
Sydney NSW 2000 Melbourne VIC 3000
T: +612 8667 2800 T: +613 8601 2092
www.folkestone.com.au
36