Embed Size (px)
Citation preview

Fo)J ENERCON
Prepared by:
Reviewed by:
Approved by:
Decommissioning Cost Estimate
Prepared for:
Honeywell Metropolfa Works 2768 North U.S. State Route 45
Metropolis, IL 62960
neywell Prepared by:
Enercon Services, Inc. 319 Paintersville Road
New Stanton, PA 15639
___ \ ......... _1.:_, __ -'-___ I. __ , _-"-) __ +~~--...,,__\-"-::'.>-6-=--- Date: , i / c4 / 2 C 19 Shaun Kline, P.E., Engineering Lead
~(i1.Jl.~ Date I t 4 '7o J '"z Gerald E. Williams, P.E., Senior Project Manager

Q ENERCON
TABLE OF CONTENTS
MTW Decommissioning Cost Estimate January 4, 2019
EXECUTIVE SUMMARY ....................................................................................................................... iii 1.0 INTRODUCTION ......................................................................................................................... 1
1.1 Purpose ................................................................................................................................... 1 1.2 Background ............................................................................................................................ 1 1.3 Changes Since the 2015 Update ............................................................................................. 2 1.4 Scope ...................................................................................................................................... 2 1.5 Assumptions and Bases .......................................................................................................... 3
2.0 MTW LOCATION, HISTORY, AND CURRENT STATUS .................................................... 5 2.1 MTW Location and Description ............................................................................................ 5 2.2 MTW History ......................................................................................................................... 5 2.3 MTW Physical Description .................................................................................................... 5
2.3 .1 Main Production and Plant Operations Buildings ..................................................... 5 2.3 .2 Miscellaneous Production Buildings ......................................................................... 6 2.3.3 Drum Storage Pads and Uranium Settling Ponds .................................. : ................... 6 2.3 .4 Outdoor Areas, Drains, and Sewers .......................................................................... 6 2.3.5 Calcium Fluoride Ponds ............................................................................................ 6
2.4 MTW Process Operations ...................................................................................................... 7 2.4.1 Uranium Hexafluoride Conversion Process Flow Diagram ...................................... 7 2.4.2 Pretreatment and Ore Concentration Preparation ...................................................... 8 2.4.3 Uranium Reduction ................................................................................................... 9 2.4.4 Uranium Hydrofluorination ...................................................................................... 9 2.4.5 Uranium Fluorination .............................................................................................. 10 2.4.6 Cold Traps and Off-Gas Cleanup ............................................................................ 10 2.4.7 Uranium Hexafluoride Distillation ......................................................................... 10 2.4.8 Uranium Recovery .................................................................................................. 11 2.4.9 Uranium Hexafluoride Cylinder Cleaning .............................................................. 11 2.4.10 Fluorine Production ................................................................................................. 11 2.4.11 Plant and Non-Plant Area Delineation .................................................................... 11
3.0 ASSESSMENT OF PLANT RADIOLOGICAL CONDITIONS ............................................ 13 3.1 Radiological Criteria for License Termination .................................................................... 13 3 .2 Prior Assessment of Plant Radiological Conditions ............................................................ 14 3 .3 Identification of Potential Radionuclides of Concern .......................................................... 15 3.4 Characterization Data for Prior Assessments of Radiological Conditions .......................... 16
3.4.1 Main Production Buildings ..................................................................................... 16 3.4.2 Miscellaneous Production Buildings ....................................................................... 17 3.4.3 Drum Storage Pads and Ponds ................................................................................ 17 3 .4.4 Outdoor Areas, Drains, and Sewers ........................................................................ 17 3.4.5 Administrative Areas .............................................................................................. 18 3.4.6 Calcium Fluoride Ponds B, C, D, and E ................................................................. 19 3.4.7 Roads ................................................................................................................ 19 3.4.8 Aisle No. 5 of the Uranium Hexafluoride Pad ........................................................ 19 3.4.9 Support Trailers ....................................................................................................... 19 3.4.10 RCRA KOH Muds Drums Storage Building .......................................................... 20 3.4.11 Sheet Metal Buildings ............................................................................................. 20 3.4.12 Calcium Fluoride Pond Removal Rail Spur. ........................................................... 20
Rev. 0

•
Q ENERCON MTW Decommissioning Cost Estimate January 4, 2019
4.0 DECOMMISSIONING COST ESTIMATION METHODS ................................................... 21 4.1 Cost Escalation Factor ......................................................................................................... 21 4.2 Summary of Decommissioning Costs .................................................................................. 21 4.3 Radioactive Waste Disposal Cost ........................................................................................ 22 4.4 Remediation Methods .......................................................................................................... 22 4.5 Unit Costs ............................................................................................................................. 23 4.6 Final Status Surveys ............................................................................................................. 24
5.0 DESCRIPTION OF THE DECOMMISSIONING PROCESS ............................................... 25 5 .1 Asbestos Removal ................................................................................................................ 25 5.2 Wipe Down and Application of Fixative ............................................................................. 25 5.3 Lead Survey ......................................................................................................................... 25 5.4 Characterization Surveys ..................................................................................................... 25 5 .5 Remediation ......................................................................................................................... 26
5.5.1 Main Production Buildings ..................................................................................... 26 5.5.2 Production Support Buildings ................................................................................. 26 5.5.3 Miscellaneous Building and Structures to be Demolished ...................................... 27 5.5.4 Drum Storage Pads and Uranium Settling Ponds .................................................... 27 5.5.5 Outdoor Areas, Drains, and Sewers ........................................................................ 27 5 .5 .6 Final Status Surveys ................................................................................................ 29 5.5.7 Survey Instrumentation ........................................................................................... 29
6.0 REFERENCES ............................................................................................................................. 30 TABLES
Table 2-1: Listing of Plant and Non-Plant Areas ........................................................................................ 11 Table 3-1: Acceptable Surface Contamination Levels ................................................................................ 14 Table 4-1: Decommissioning Cost Summary - Honeywell Facility ........................................................... 21 Table 4-2: Productivity Loss Factors .......................................................................................................... 23 Table 4-3: Decommissioning Estimate Selected Unit Cost Factors ........................................................... 24 Table 5-1: Typical Final Status Survey Instrumentation ............................................................................ 29 FIGURES - Security Related Information: Withheld under 10CFR2.390
Figure 1 - Aerial Photo Figure 2 - Plant Areas Figure 3 - Non-Plant Areas Figure 4-Drawing No. MTW-2800 (Rev. AF)
APPENDICES
Appendix A-1 - Duration Appendix A-2 - Cost Summary Appendix A-3 - Waste Summary Appendix A-4 - Labor Summary
ii Rev. 0
Q ENERCON MTW Decommissioning Cost Estimate January 4, 2019
EXECUTIVE SUMMARY
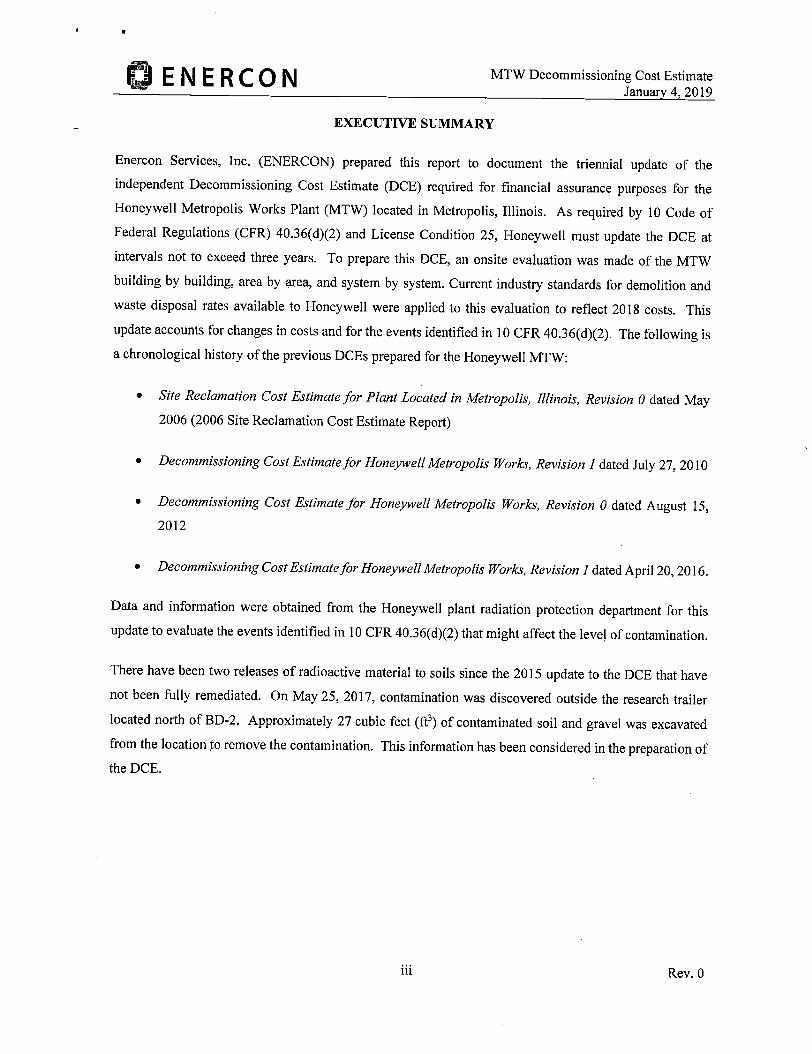
Enercon Services, Inc. (ENERCON) prepared this report to document the triennial update of the independent Decommissioning Cost Estimate (DCE) required for financial assurance purposes for the Honeywell Metropolis Works Plant (MTW) located in Metropolis, Illinois. As required by 10 Code of Federal Regulations (CFR) 40.36(d)(2) and License Condition 25, Honeywell must update the DCE at
intervals not to exceed three years. To prepare this DCE, an onsite evaluation was made of the MTW
building by building, area by area, and system by system. Current industry standards for demolition and
waste disposal rates available to Honeywell were applied to this evaluation to reflect 2018 costs. This
update accounts for changes in costs and for the events identified in 10 CFR 40.36(d)(2). The following is
a chronological history of the previous DCEs prepared for the Honeywell MTW:
• Site Reclamation Cost Estimate for Plant Located in Metropolis, Illinois, Revision O dated May
2006 (2006 Site Reclamation Cost Estimate Report)
• Decommissioning Cost Estimate for Honeywell Metropolis Works, Revision I dated July 27, 20 IO
• Decommissioning Cost Estimate for Honeywell Metropolis Works, Revision O dated August 15,
2012
• Decommissioning Cost Estimate for Honeywell Metropolis Works, Revision I dated April 20, 2016.
Data and information were obtained from the Honeywell plant radiation protection department for this
update to evaluate the events identified in 10 CFR 40.36( d)(2) that might affect the leve) of contamination.
There have been two releases of radioactive material to soils since the 2015 update to the DCE that have
not been fully remediated. On May 25, 2017, contamination was discovered outside the research trailer
located north of BD-2. Approximately 27 cubic feet (ft3) of contaminated soil and gravel was excavated
from the location to remove the contamination. This information has been considered in the preparation of
the DCE.
iii Rev. 0
Q ENERCON MTW Decommissioning Cost Estimate January 4, 2019
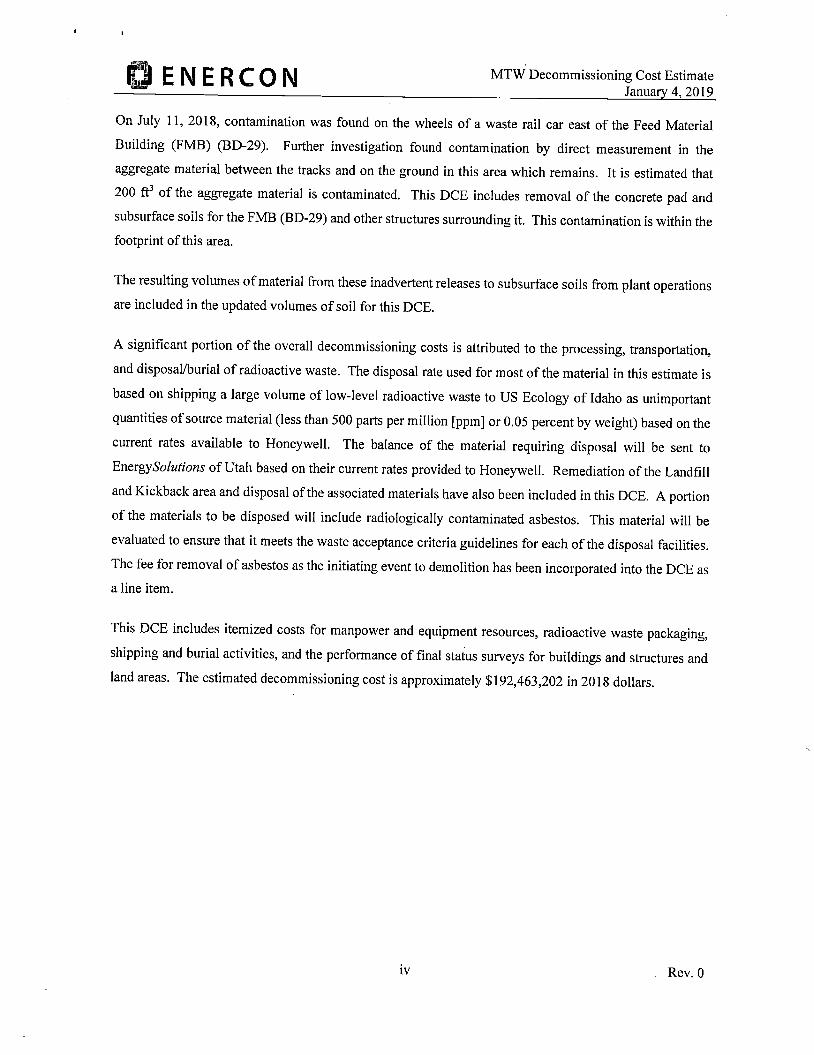
On July 11, 2018, contamination was found on the wheels of a waste rail car east of the Feed Material Building (FMB) (BD-29). Further investigation found contamination by direct measurement in the aggregate material between the tracks and on the ground in this area which remains. It is estimated that 200 ft3 of the aggregate material is contaminated. This DCE includes removal of the concrete pad and subsurface soils for the FMB (BD-29) and other structures surrounding it. This contamination is within the
footprint of this area.
The resulting volumes of material from these inadvertent releases to subsurface soils from plant operations
are included in the updated volumes of soil for this DCE.
A significant portion of the overall decommissioning costs is attributed to the processing, transportation,
and disposal/burial of radioactive waste. The disposal rate used for most of the material in this estimate is
based on shipping a large volume of low-level radioactive waste to US Ecology of Idaho as unimportant
quantities of source material (less than 500 parts per million [ppm] or 0.05 percent by weight) based on the
current rates available to Honeywell. The balance of the material requiring disposal will be sent to
Energy Solutions of Utah based on th(;!ir current rates provided to Honeywell. Remediation of the Landfill
and Kickback area and disposal of the associated materials have also been included in this DCE. A portion
of the materials to be disposed will include radiologically contaminated asbestos. This material will be
evaluated to ensure that it meets the waste acceptance criteria guidelines for each of the disposal facilities.
The fee for removal of asbestos as the initiating event to demolition has been incorporated into the DCE as
a line item.
This DCE includes itemized costs for manpower and equipment resources, radioactive waste packaging,
shipping and burial activities, and the performance of final status surveys for buildings and structures and
land areas. The estimated decommissioning cost is approximately $192,463,202 in 2018 dollars.
iv Rev. 0
0 ENERCON
1.0
1.1 Purpose
MTW Decommissioning Cost Estimate January 4, 2019
INTRODUCTION
Enercon Services, Inc. (ENERCON) is providing this report to document the triennial update of the
independent Decommissioning Cost Estimate (DCE) required for financial . assurance purposes for the
Honeywell Metropolis Works Plant (MTW) located in Metropolis, Illinois as required by 10 Code of
Federal Regulations (CFR) 40.36(d)(2) and License Condition 25.
This DCE is a triennial Decommissioning Cost Estimate for Honeywell Metropolis Works, Revision O dated
2018. Data and information were obtained from the Honeywell plant radiation protection department for
this update to evaluate the events identified in IO CFR 40.36(d)(2) that might affect the level of
contamination. This update to the DCE accounts for current costs and facility status as of August 2018
incorporating data from, the Honeywell MTW Radiological Characterization Report for Site Soils,
Revision O (2009 Radiological Characterization Report). The results of the Historical Site Assessment,
Revision O dated April 2009 are included in the 2009 Radiological Characterization Report.
1.2 Background
The volumes of materials and/or building rubble to be sent to disposal have been estimated for each
structure and the anticipated pathway for disposal considered to determine the cost for disposal.
A radiological characterization survey of surface and subsurface soils was performed as documented in the
2009 Radiological Characterization Report to determine the horizontal and vertical extent of radionuclide
concentrations in soil. The data from this characterization report were used as the basis for determining the
volume of surface and subsurface soils to be removed and the pathway for disposal of soils.
During the summer of 2018, an evaluation was undertaken of each of the open areas such as the employee
parking lot, Ore Storage Pads, roadways, and the Uranium Hexafluoride (UF6) Cylinder Storage Area to
determine the means for ensuring they meet the decommissioning criteria and the expected volume of
material to be disposed, if required.
Finally, this evaluation includes costs for characterization, a remediation pathway, and the volumes of
materials in the Landfill and Kickback area and closure.
Rev. 0

Q ENERCON MTW Decommissioning Cost Estimate January 4, 2019
1.3 Changes Since the 2015 Update
Facility changes that have occurred which impact this update to the decommissioning costs are as follows:
• The SF6 Building (BD-12) and its contents have been removed.
• The calcium fluoride ponds-B, C, D, and E-are being removed.
• To support the removal of the calcium fluoride ponds, a new rail spur and security impoundment are being installed.
• The newly installed septic system has been upgraded with a chlorination system and is fully operational.
1.4 Scope
The scope of this report is to present the triennial update for site decommissioning costs of the Honeywell MTW. The specific areas covered by this estimate include:
, /
• Feeds Material Building (BD-29) • Fluorine Plant (BD-3, BD-4, BD-5) • Ion Exchange Building (BD-37) • Liquid Fluorine (BD-14) and Nitrogen Facilities (BD-83) • Sodium Removal Building (BD-17) • Potassium Hydroxide (KOH) Muds Building (BD-20) • Calcium Fluoride Building (BD-11) • Uranium Recovery Building (BD-19) • Surface Treatment Facility (BD-42) • FMB Pads • Administrative Areas (BD-1) • Sampling Plant (BD-23) • Sanitary Wastewater Treatment Plant (U-1041) • Ore Storage Pads • Ore Storage Building (BD-18) • Drum Storage Pad • Bed Materials and Filter Fines Building (BD-33) • Waste Storage Pad • Pond Muds Filter Calciner Building (BD-16) • Drains and Sewers • Cylinder Wash Building (BD-15) • Outdoor Areas • Drum Crusher Building (BD-24 and BD-41) • Discharge Ditch to River • The open areas both inside and outside the Security Fence • The Landfill and Kickback Area
2 Rev.O

..
0 ENERCON MTW Decommissioning Cost Estimate January 4, 2019
Decommissioning costs are directly related to the degree of remediation required and the amount of radioactive waste generated. The extent ofremediation is based on radioiogical data, application of proven decontamination processes, and data from similar projects.
1.5 Assumptions and Bases
The following are assumptions and bases utilized in creating this DCE:
• The estimate includes only activities and cost factors necessary to reduce residual radioactivity to levels that will permit unrestricted release of the associated structures, buildings, and grounds.
• Decommissioning activities will be completed sequentially building by building and area by area.
• Costs associated with the demolition and removal of non-contaminated equipment or structures are not included in this cost estimate unless such activities are required to support decommissioning. An actual date to perform the site decommissioning has not been selected. Therefore, the cost estimate provided herein is in 2018 dollars.
• The older, more contaminated structures will be removed completely. Structures with minimal or no contamination will remain in place after decommissioning. These structures will be decontaminated as required and free released. No building refurbishment is included.
• Uncontaminated processing equipment may have intrinsic value. No credit was taken for any salvage value. Contaminated equipment will be sent directly to an authorized waste disposal site.
• Molyflush cylinders will be shipped off-site for processing.
• Waste meeting the definition of unimportant quantities will be sent to US Ecology.
• Wastes not meeting the waste acceptance criteria of US Ecology qualify for disposal at EnergySolutions under their current license and waste acceptance criteria. No Class B or C radioactive wastes are present on-site.
• Removal and packaging of asbestos will be-done by an independent contractor licensed to perform this work in the State of Illinois.
• For disposal of asbestos, the applicable waste acceptance criteria require the material to be double bagged.
3 Rev. 0
Q ENERCON MTW Decommissioning Cost Estimate January 4, 2019
• The costs for disposal for both Energy Solutions and US Ecology are based on pounds per rail car. This results in volumes of waste not being a factor of cost. Where v~lumes of material have been developed, this has been converted to pounds for each material considered.
• The independent third-party site remediation contractor will provide the demolition equipment and survey instrumentation at prevailing rates.
• Non-local contractors will be utilized for all aspects of the decommissioning process. Travel and living expenses are included for all project management, supervisors, and craft support.
• The data developed in the 2009 Radiological Characterization Report have been incorporated in this DCE.
• The site-specific release criterion used as the basis in this report is 110 picocuries per gram (pCi/g) which would support achieving the unrestricted release criterion of 25 millirems per year (mrem/yr). This value is consistent with the site-specific release criteria approved by the U.S. Nuclear Regulatory Commission (NRC) at the closed Sequoyah Fuels Corporation (Sequoyah Fuels) UF6 conversion plant.
• Of the materials excavated from the I I-acre radiological portion of the Landfill and Kickback area, 10 percent will be radioactive waste to be shipped to US Ecology.
• To account for the volume contributed by miscellaneous items such as office equipment and supplies, forklifts, golf carts, tools, and other unspecified materials anticipated to be present at the beginning of decommissioning, IO percent of the gross weight of waste for that structure was added to the total. This weight was added to Jhe metals waste volumes when present. If no metals were present, the percentage was added to the soil weights.
• As a method to account for items such as booties, gloves, disposable coveralls, filters, blades, empty lockdown containers, and similar items to be disposed of as dry active waste, an additional 50 pounds was added to estimated waste for various structures.
• For the cost ofNRC oversight, the NRC billing rate of $275 per hour was applied. For review of the Decommissioning Plan, the estimate is 400 hours or $110,000. For quarterly inspection by two inspectors for five days, the estimate is $88,000 per year for 12 years or $1,056,000 for a total of $1,166,000.
4 Rev. 0

Q ENERCON MTW Decommissioning Cost Estimate January 4, 2019
2.0 MTW LOCATION, HISTORY, AND CURRENT STATUS
2.1 MTW Location and Description
MTW is the holder ofNRC License No. SUB-526. The plant address listed on the license is as follows:
Honeywell 2768 N U.S Route 45 Metropolis, IL 62960-6700
The plant is located on U.S. Highway 45, approximately 1.8 miles northwest of downtown Metropolis, Illinois. MTW is located on approximately 1,000 acres of land in Massac County at the southern tip of Illinois (Figure 1). The primary site perimeter is formed by U.S. Highway 45 to the north, the Ohio River to the south, an industrial coal blending plant to the west, and privately-owned, developed land to the east. Plant operations are conducted in a fenced, restricted area covering approximately 59 acres in the northcentral portion of the site. MTW also owns approximately 100 acres of land directly across U.S. Highway 45, north-northeast of the plant.
2.2 MTW History
Initial construction of the facility was completed in 1958, and the first UF6 was produced in 1959 as part of a five-year contract for conversion services with the former Atomic Energy Commission (AEC). The AEC conversion contract expired in 1964 and the conversion process was placed in an idle state. Continued increase in demand for conversion services resulted in rehabilitation of the UF6 facility in 1967, and commercial conversion started in 1968. In 1968-1969, capacity for the facility was expanded to 9,000 metric tons. Capacity was increased to 11,500 metric tons and 12,700 metric tpns in 1975 and 1995, respectively. Re-engineering in 2001 increased capacity to approximately 14,000 metric tons. Additional re-engineering iii 2007 further increased the capacity to approximately 15,000 metric tons. To date, the highest production has been approximately 13,000 metric tons.
2.3 MTW Physical Description
Figure 3 (Drawing No. MTW-2800) shows the approximate location of the following areas on the MTW site.
2.3.1 Main Production and Plant Operations Buildings
Main production buildings include the following: FMB (BD-29), Ion Exchange Building (BD-37), Sodium Removal Building (BD-17), KOH Muds Building (BD-20), Uranium Recovery Building (BD-19),
5 Rev. 0

Q ENERCON MTW Decommissioning Cost Estimate January 4, 2019
Sampling Plant (BD-23), Fluoride Production Facility (BD-3, BD-4, BD-5, and BD-35), Waste Treatment Plant, and UF6 Cylinder Storage Area. The plant operations buildings include the Administration Building (BD-1), Laboratory and HP Building (BD-2), Maintenance Shop/Store/Office Building (BD-6), and Powerhouse (BD-7).
2.3.2 Miscellaneous Production Buildings
The miscellaneous production buildings include the Ore Storagt;! Building (BD-18), Bed Materials and Filter Fines Building (BD-33), Pond Muds Filter Calciner Building (BD-16), Cylinder Wash Building (BD-15), Drum Crusher Building (BD-41), Liquid Fluorine Facility (BD-14), and Calcium Fluoride Building (BD-11).
2.3.3 Drum Storage Pads and Uranium Settling Ponds
The Drum Storage Pads and Uranium Settling Ponds are in the (plant) eastern portion of the restricted area and include the five Ore Storage Pads, the Drum Storage Pads, the Waste Storage Area, and Uranium Settling Pond Nos. 3 and 4.
2.3.4 Outdoor Areas, Drains, and Sewers
The outdoor areas, drains, and sewers include the employee parking lot, paved roads on-site, Railroad Spur Nos. 1 through 5, the land between two parallel property exclusion fences, site drains/sewers/underground process lines, and MTW land outside the fenced operations area.
2.3.5 Calcium Fluoride Ponds
There are currently four calcium fluoride ponds located at the site designated Ponds B, C, D, and E. Pond A (which was located north of Pond B) was removed and the Surface Treatment Facility was constructed in the area previously occupied by Pond A. Historically, calcium hydroxide was used to precipitate fluorides as insoluble calcium fluoride into these ponds. The ,Surface Treatment Facility is currently used to treat fluoride materials prior to a permitted discharge; therefore, fluoride materials are no longer added to the calcium fluoride ponds. Preparations for removal of these ponds were underway during the summer of 2018. The materials in these ponds and their removal are not included in this DCE. The final status survey of the area during decommissioning is included in this DCE as part of Land Areas P-21, P-22, P-23 and P-24. No additional soils are expected to be encountered.
6 Rev.O

0 ENERCON 2.4 MTW Process Operations
MTW Decommissioning Cost Estimate January 4, 2019
MTW was designed to convert uranium ore concentrates into UF6, which is then shipped to U.S. and foreign plants for enrichment of the Uranium-235 (U-235) isotope. The facility, which uses the fluoride volatility process, has the capacity to convert approximately 15,000 metric tons of uranium per year from ore concentrates into UF6. Assays of the uranium ore concentrates show approximately 75 percent uranium. The distilled UF 6 product contains less than 300 parts per million (ppm) impurities. A process flow diagram of the conversion process is provided, and each significant step of the conversion process is described in the following sections of this report.
2.4.1 Uranium Hexafluoride Conversion Process Flow Diagram
The UF 6 conversion process flow diagram for the plant operations is as follows.
7 Rev. 0

ENERCON
N .1 •~
-
MTW Decommissioning Cost Estimate January 4, 20 19
LJq---1
The plant receives uranium ore concentrates in 55-gallon drums. Each drum of ore concentrate is weighed
and then stored on storage pads until accountability procedures and the uranium and impurity analyses are
completed.
2.4.2 Pretreatment and Ore Concentration Preparation
Uranium compounds from the uranium recovery processes contain contaminants that must be minimized
before the concentrates are converted to UF6. The method of pretreatment used is a two-stage sulfuric acid
leach fo llowed by aqueous ammonia precipitation. After precipitation, the uranium-bearing solids are
settled and filtered into a calciner prior to introduction into the ore preparation process.
8 Rev. 0

Q ENERCON MTW Decommissioning Cost Estimate January 4, 2019
The pretreatment facility is also equipped to process ore concentrates that have absorbed moisture or
become hard. These drums cannot be processed through the normal drum dumping station.
Incoming ore concentrates are charged into the system through a drum dumping station and then a calciner.
Following the calciner, the ore concentrates are blended, agglomerated, dried, crushed, and sized for
uniformity. In the agglomeration step, water, sulfuric acid, magnesium hydroxide, and/or sodium hydroxide
are used depending on the concentrate characteristics. Dusts and fumes from this process are controlled by
use of dust collectors.
2.4.3 Uranium Reduction
The sized uranium concentrates enter one of two fluid-bed reactors (reductors). In the reductor, the mixed
uranium oxides (U30s) are reduced to a uranium dioxide (U02) form utilizing hydrogen. A liquid hydrogen
system is used as a source of hydrogen. This system, located within a gated enclosure south · of the
Maintenance Building (BD-6), consists of a cryogenic storage tank and vaporizers. This system is owned
and maintained by the vendor. Outside the liquid hydrogen system's fence, a nitrogen/hydrogen mixing
station provides the appropriate fluidizing and reactive gas mixtures to the Green Salt reductors. The
reductor off-gas (principally nitrogen, water vapor, hydrogen, and hydrogen sulfide) is passed through
filters to remove particulate uranium and the residual gas is then incinerated to convert the hydrogen sulfide
into sulfur dioxide and water and to burn the excess hydrogen.
2.4.4 Uranium Hydrofluorination
The U02 from the reductor is fed into one of two fluid-bed hydrofluorinators operated in series; two trains
are available for operation. A counter-current flow of anhydrous hydrogen fluoride (HF) fluidizing gas,
supplied from on-site rail cars, converts the U02 into uranium tetrafluoride (UF4). Through a system of
vaporizers and heat exchangers, the HF is changed to a gaseous form and brought to the proper reaction
temperature before being introduced into the fluid-bed reactors.
The off-gas is filtered to remove particulate uranium and scrubbed with water and a potassium hydroxide
solution to remove HF before being vented to the atmosphere. The HF scrubber liquors are pH-adjusted
and treated to remove fluoride. This waste fluoride is subsequently converted into a recyclable synthetic
calcium fluoride product.
9 Rev. 0
Q ENERCON 2.4.5 Uranium Fluorination
MTW Decommissioning Cost Estimate January 4, 2019
The UF 4 is fed into a fluid-bed fluorinator that also contains inert bed material. Elemental fluorine is used
as the fluidizing gas to convert solid UF4 to gaseous UF6 which is volatilized from the fluorinator. A cobalt
catalyst may be used to enhance the reactivity and improve the fluorine yields. The cobalt is added during
ore preparation. Some residual uranium, non-volatile impurities, and uranium daughter products remain in
the bed material, which is recycled and reused until the buildup of contaminants prohibits further use. The
bed material is then retired for radioactive decay and subsequently shipped to a contractor for reprocessing
of the uranium. The volatilized gas containing UF6, excess fluorine, and HF is passed through a series of
filters for particulate removal and through a series of cold traps for UF 6 desublimation.
2.4.6 Cold Traps and Off-Gas Cleanup
The bulk of the UF6 is desublimated in a series of primary cold traps which are operated at approximately
-20 degrees Fahrenheit to O degrees Fahrenheit. The secondary and tertiary traps operate at lower
temperatures and remove essentially all of the remaining UF6, The secondary and tertiary cold traps are not
essential for the process. One or both could be bypassed without adversely affecting the operation. Crude
UF6 is removed from the cold traps intermittently following liquefaction by heating and then transferred to
still feed tanks to awaifpurification by fractional distillation.
Uncondensed gas from the cold traps, consisting of fluorine, air, HF, nitrogen, and traces ofUF6, is routed
into scrubbers where contact with potassium hydroxide solution removes fluorides and traces of uranium
prior to release to the atmosphere. The spent scrubbing solutions are routed through wet process, where the
potassium diuranate is precipitated and filtered. The filtrate (spent KOH) is sent to the Environmental
Protection Facility (BD-10) where it is regenerated and subsequently reused.
The potassium diuranate is further treated and the uranium is then re-introduced into the ore preparation
process.
2.4.7 Uranium Hexafluoride Distillation
Crude UF6 from the still feed tanks is fed into a low boiler distillation column. The UF6 that has been
stripped of low boiling impurities is then fed into a high boiler distillation column where high boiling
impurities are eliminated. The product, which meets or exceeds purity requirements, is condensed and
packaged into approved product cylinders. Gaseous effluents from this process are fed back to fluorination
and are treated along with the fluorination off-gas.
10 Rev. 0

Q ENERCON 2.4.8 Uranium Recovery
MTW Decommissioning Cost Estimate January 4, 2019
Different types of uranium-bearing liquors are processed in wet process/uranium recovery to recover as
much uranium as possible. These include FMB (BD-29) and cylinder wash liquors, rainwater from certain
storage pads, and fluorination scrubber liquors. Regardless of the origin of the uranium-bearing liquors, the
uranium is precipitated from solution by pH adjustment, separated from the solution using rotary drum
vacuum filtration at the Pond Muds Calciner and drummed for future use in ore preparation. The liquors in
each case are treated in the Environmental Protection Facility (BD-10) to remove fluorides and then
discharged into the plant effluent. Fluorination scrubbing liquors, which contain potassium diuranate solids,
may also be shipped to a mill for toll reprocessing.
2.4.9 Uranium Hexafluoride Cylinder Cleaning
Periodically, UF6 product cylinders must be washed and pressure-tested to assure that there has been no
significant degradation of design integrity and to comply with the recertification requirements of American
National Standards Institute Nl4. l, "Packaging of Uranium Hexafluoride for Transport. The cylinders are
washed with sodium carbonate or sodium hydroxide solution to recover uranium. The leach liquors are then
filtered and the uranium-bearing liquid transferred to the uranium recovery facility. The filter residue, which
contains daughter products of uranium, principally 234Th and 234Pa, is stored on-site and eventually disposed
of at a licensed waste disposal facility.
2.4.10 Fluorine Production
Fluorine, which is one of the raw materials required for the UF6 process, is produced on-site by electrolysis
using HF as the source.
2.4.11 Plant and Non-Plant Area Delineation
In 2009, ENERCON assessed the plant and non-plant areas at MTW as part of the Historical Site
Assessment, Revision O dated April 2009. The plant area was divided into 29 separate areas or systems of
interest. Non-plant areas were divided into 5 separate areas or systems. Table 2-1 provides a list of the
34 areas of interest (Figures I and 2).
Table 2-1: Listing of Plant and Non-Plant Areas
Area·•.. · ·.·· ... · Desi natioJ'
P-1 Administration Buildin and Parkin
11 Rev. 0

Q ENERCON MTW Decommissioning Cost Estimate January 4, 2019
Area .. :'
_; l)esiena tion ' .•
• ·DescriptiQii ... .. •'. ''..· -· ... .. ,, .t
P-2 Laboratory Building and Adjacent Storage Area P-3 Former Cold Trash Storage Area P-4 Fluorination Preparation P-5 Ore Staging Area/Drum Dumping Area/Sodium Removal Building/KOH Muds
Building/Wet Process Building/Calciner P-6 FMB and South Pad P-7 Powerhouse, Nitrogen Generation, Laundry, Flammable Storage Building, and Storage
Area P-8 Liquid Fluorine Facility, Sulfur Hexafluoride Plant, Antimony Pentafluoride, Iodine
Pentafluoride Plant, and the Loading Docks P-9 Ore Sampling Area P-10 Ore Storage Building P-11 Ore Storage Pads P-12 Tank Farm, Pond Muds Filter Calciner, and Fuel Oil Storage P-13 Cylinder Wash Area P-14 Uranium Settling Ponds P-15 Bed Materials and Filter Fines Building P-16 Drum Storage Pad P-17 Waste Storage Area P-18 UF6 Cylinder Storage Area P-19 Drum Crushing Facility P-20 Environmental Protection Facility P-21 Calcium Fluoride Ponds P-22 Maintenance Storage Area/Trash Compactor/Switchyard/Fuel Depot P-23 Maintenance Shop/Stores/Loading Dock I
P-24 Liquid Propane Gas Area P-25 Roadways and Ground Surface P-26 Plant Exclusion Area P-27 Sanitary Drain Lines P-28 Process Drain Lines P-29 Storm Water Drain Lines NP-I Non-Plant Area I - NPDES Outfalls NP-2 Non-Plant Area 2 - Surface Drainage Pathways to the Ohio River NP-3 Non-Plant Area 3 - On-Site Landfill and Kickback Area NP-4 Non-Plant Area 4- River Road NP-5 Non-Plant Area 5 - Remainder of the Property
The 2009 site characterization activities evaluated the site soils in 26 (P-1 through P-26) of the 29 designated plant areas and 5 (NP-I through NP-5) designated non-plant areas. Plant Areas P-27, P-28, and P-29 were not characterized due to the inability to access the various subsurface lines due to ongoing plant operations. Details are provided in the Historical Site Assessment, Revision O and the 2009 Radiological Characterization Report.
12 Rev. 0

' '
Q ENERCON MTW Decommissioning Cost Estimate January 4, 2019
3.0 ASSESSMENT OF PLANT RADIOLOGICAL CONDITIONS
3.1 Radiological Criteria for License Termination
The overall objective of MTW decommissioning ·is to remediate the site to an unrestricted use condition that corresponds to a calculated dose to the public that is less than 25 mrem/yr from applicable dose pathways. The site can then be used without any radiological restrictions. The 25 mrem/yr dose limit is codified at 10 CFR 20.1402, Radiological Criteria for Unrestricted Use.
The Derived Concentration Guideline Level (DCGL) is defined in the Multi-Agency Radiation Survey and Site Investigation Manual (MARSSIM) as the radionuclide-specific concentration within a survey unit corresponding to the release criterion. The DCGL is dependent upon several factors, including the radionuclides of concern (ROCs), applicable dose pathways, area occupancy, and the future use of the facility. The DCGL assumes a uniform level of residual radioactivity across the survey unit. For the )
Honeywell MTW, it was assumed that site-specific release criteria would be developed. The 2009 Radiological Characterization Report cited as an example the release criterion of 110 pCi/g for the Sequoyah Fuels facility. The Sequoyah Fuels facility was a uranium conversion plant similar to MTW that closed in the· 1990s. ENERCON believes that 110 pCi/g is a reasonable DCGL for planning purposes.
The NRC criteria for acceptable surface contamination levels historically were 5,000 disintegrations per minute per 100 square centimeters (dpm/100 cm2
) average for natural uranium (U-nat) and 1,000 dpm/100 cm2 removable for U,-nat as stated in Policy and Guidance Directive FC 83-23, "Guidelines for Decontamination of Facilities and Equipment Prior to Release for Unrestricted Use or Termination of Byproduct, Source, or Special Nuclear Materials Licenses." These acceptable levels are presented in Table 3-1. The current NRC guidance for acceptable activity levels for specific radionuclides is presented in NUREG-1757, Volume I, Appendix 8, Table 8.1. The NRC declined to provide specific guidance for alpha emitting radionuclides, including U-nat. ENERCON expects that MTW will apply for site-specific release criteria using the guidance in NUREG-1757, Volume 2, Appendix I and the As Low As Reasonably Achievable (ALARA) analysis guidance in NUREG-1757, Volume 2, Appendix N.
13 Rev. 0

Q ENERCON MTW Decommissioning Cost Estimate January 4, 2019
Table 3-1: Acceptable Surface Contamination Levels ,,
' ' ', . ·: 'Av·erageh,c,r · ". Maximumb,il,f · RemOvable~•";r ' ,: ,. ', ,,
(dpm/100 cm2) ( dpm/100. cm2) (dpmiloo cm2). Nuclidesa
U-nat, U-235, U-238, and associated 5,000 (a) 15,000 (a) 1,000 (a) decay products Transuranics, Ra-226, Ra-228, 100 300 20 Th-230, Th-228, Pa-231, Ac-227, 1-125, 1-129 Th-nat, Th-232, Sr-90, Ra-223, 1,000 3,000 200 Ra-224, U-232, 1-126, 1-131, 1-133 Beta-gamma emitters (nuclides with 5,ooo (Py) 15,ooo (Py) 1,000 (Py) decay modes other than alpha emission or spontaneous fission) except Sr-90 and others noted above.
awhere surface contamination by both alpha- and beta-gamma emitting nuclides exists, the limits established for alpha- and beta-gamma emitting nuclides should apply independently. b As used in this table, dpm means the rate of emission by radioactive material as determined by correcting the counts per minute observed by an appropriate detector for background, efficiency, and geometric factors associated with the instrumentation. CMeasurements of average contaminant should not be averaged over more than 1 square meter. For objects of less surface area, the average should be derived for each such subject. dThe maximum contamination level applies to an area not more than 100 cm2 •
eThe amount ofremovable radioactive material per 100 cm2 of surface area should be determined by wiping that area with dry filter or soft absorbent paper, applying moderate pressure, and assessing the amount of radioactive material on the wipe with an appropriate instrument of known efficiency. When removable contamination on objects of less surface area is determined, the pertinent levels should be reduced proportionally and the entire surface should be wiped. f The average and maximum radiation levels associated with surface contamination resulting from betagamma emitters should not exceed 0.2 mrad/hr at 1 cm and 1.0 mrad/hr at 1 cm, respectively, measured through not more th.an 7 milligrams per cm2 of total absorber.
3.2 Prior Assessment of Plant Radiological Conditions
Based on a review ofNRC criteria, the following conclusions regarding potential release criteria for MTW are provided:
• NRC criterion for residual depleted uranium (DU) in soil was formerly 35 pCi/g.
• NRC guidance for acceptable license termination screening values for specific radionuclides was available in NUREG-1757, Volume 1, Appendix B, Table B.2.
• Honeywell will apply for site-specific release criteria using the guidance in NUREG-1757, Volume 2, Appendix I and the ALARA analysis guidance in NUREG1757, Volume 2,
14 Rev. 0
Q ENERCON MTW Decommissioning Cost Estimate January 4, 2019
Appendix N. The outcome of this effort would be a release criterion for residual DU in soil in excess of35 pCi/g.
Other sites have performed evaluations and obtained site-specific release criteria using a DCGL for soil in excess of35 pCi/g. For example, the DCGL for uranium at the Sequoyah Fuels site was 110 pCi/g for a release criterion of25 mrem/yr. A corresponding ALARA evaluation indicated an ALARA action level of 4,780 pCi/g uranium, thus demonstrating that the 110 pCi/g value was ALARA. Therefore, it is assumed that a site-specific release level of 110 pCi/g or greater for soils could be established using the release criteria for surface contamination levels discussed in the following sections.
3.3 Identification of Potential Radionuclides of Concern
A list of potential ROCs has been developed.
The ROCs in incoming ore concentrate and the plant-specific waste streams were assessed. Evaluating the various forms of uranium found in the incoming ore concentrate and the plant waste streams, the following was concluded:
• Dose exposure from the incoming ore concentrate is primarily (more than 90 percent) driven by the presence of Radionuclides Uranium-234 (U-234), U-235, and Uranium-238 (U-238).
• Dose exposure based on on-site and off-site environmental air monitoring data is primarily driven (more than 90 percent) by the presence ofRadionuclides U-234, U-235, and U-238.
• Dose exposure based on uranium recovery solid wastes is primarily driven by the presence of Radionuclides Radium-226 (Ra-226), Thorium-230 (Th-230), and Thorium-232 (Th-232).
• Dose exposure based on water effluent monitoring data is primarily driven by the presence of Radionuclides Ra-226, U-234, and U-238.
Radionuclides U-234, U-235, and U-238 were identified as the base ROC group. Radionuclides Ra-226, Th-230, and Th-232 were designated as modified ROC Group 1. Radionuclides Ra-226, U-234, and U-238 were designated as modified ROC Group 2.
Within the plant operational processes, the uranium recovery process occurs in the following locations:
• FMB (BD-29) (P-6) • Cylinder Wash Area (BD-15) (P-13) • Bed Materials and Filter Fines Building (BD-33) (P-15)
15 Rev.O

Q ENERCON • Waste Storage Area (BD-80) (P-17).
MTW Decommissioning Cost Estimate January 4, 2019
Thus, 4 of the 29 plant areas were assessed using the base ROC group and modified ROC Group I. The remaining plant operational areas (25 of the 29 plant areas) were assessed using the base ROC group.
The water effluent location is the National Pollutant Discharge Elimination System (NPDES) outfall (NP- I), and this area was assessed using the modified ROC Group 2. All remaining non-plant areas (NP-2 through NP-5) were assessed using the base ROC group.
3.4 Characterization Data for Prior Assessments of Radiological Conditions
Available data and previous experience were used to estimate the extent of remediation that will be required during decommissioning. The characterization data used to estimate the decommissioning costs in the Site Reclamation Cost Estimate for Plant Located in Metropolis, Illinois, Revision O dated May 2006 (2006 Site Reclamation Cost Estimate Report) included removable activity survey data and environmental sampling data.
The removable activity s4rvey data were utilized to help determine which buildings and indoor areas required remediation. Fixed activity data were not available. The average and maximum activity levels measured for each building were provided in the 2006 Site Reclamation Cost Estimate Report. The limit used for removable activity for U-nat was 1,000 dpm/100 cm2
• No additional data from buildings and indoor areas were collected during this evaluation.
This report uses data collected during the 2009 Radiological Characterization Report site characterization assuming a site-specific soil release level of 110 pCi/g.
3.4.1 Main Production Buildings
Survey data included in the 2006 Site Reclamation Cost Estimate Report for the main production buildings indicated that (in general) these buildings were contaminated and would require remediation. Specifically, the FMB (BD-29), Uranium Recovery Building (BD-19), KOH Muds Building (BD-20), and Sampling Plant (BD-23) exceeded the release level assumed for the 2006 Site Reclamation Cost Estimate Report. This DCE assumes no change in the radiological status of these buildings.
16 Rev. 0

Q ENERCON 3.4.2 Miscellaneous Production Buildings
MTW Decommissioning Cost Estimate January 4, 2019
Survey data included in the 2006 Site Reclamation Cost Estimate Report for the miscellaneous production buildings indicated that (in general) these buildings were not contaminated and would not require extensive remediation.
Based on prior history, the Pond Muds Filter Calciner Building (BD-16) is assumed to require remediation in the 2006 Site Reclamation Cost Estimate Report. This DCE assumes no change in the radiological status of these buildings.
3.4.3 Drum Storage Pads and Ponds
The Drum Storage Pad, the former KOH Muds Storage Pad (which now serves as a Drum Storage Pad), the Waste Storage Pad, and the Ore Storage Pads were assumed in the 2006 Site Reclamation Cost Estimate Report to require remediation. Uranium Settling Pond Nos. 3 and 4 were assumed in the 2006 Site Reclamation Cost Estimate Report to require remediation based upon data from Uranium Settling Pond Nos. 1 and 2 that required remediation at closure. This DCE assumes no change in the radiological status of these areas.
3.4.4 Outdoor Areas, Drains, and Sewers
Prior to the 2009 site characterization, there were limited data available for surface and subsurface soils in the plant and non-plant areas. The site characterization completed in 2009 focused on plant and non-plant surface and subsurface soils. Characterization activities excluded subsurface piping systems to eliminate disruptions to plant operations. Assumptions were made to estimate the potential impacts to subsurface piping systems. A significant volume of impacted soil was identified beyond the volume estimated in the 2006 Site Reclamation Cost Estimate Report.
The volume of impacted soil in Plant Areas P-1 through P-25 estimated during the 2009 characterization is as follows:
-• Plant area soil impacted to a depth of approximately foot below grade was identified in an estimated footprint area of 489,435 square feet (ft2
). Therefore, an additio.nal 489,435 ft3 of impacted soil was added to the 2009 DCE.
17 Rev. 0

Q ENERCON MTW Decommissioning Cost Estimate January 4, 2019
• Plant area soil impacted to a depth of approximately 3 feet below grade was identified in an estimated footprint area of 69,609 ft2
• Therefore, an additional 139,218 ft3 (69,609 ft2 by 2 feet) of impacted subsurface soil was added to the 2009 DCE.
• Plant area soil impacted to a depth of approximately 6 feet below grade was identified in an estimated footprint area of 30,013 ft2. Therefore, an additional 90,039 ft3 (30,013 ft2 by 3 feet) of impacted subsurface soil was added to the 2009 DCE.
The volume of impacted soil in the non-plant areas (NP-1 through NP-5 and P-26) estimated during the 2009 characterization is as follows:
• NP-1 - Impact of 7,649 ft3 of soil was estimated based on the 2009 characterization. • NP-2 - No additional impacts were discovered based on the 2009 characterization. • NP-3 - Impact of 16,020 ft3 of soil was estimated based on the 2009 characterization. • NP-4 - Impact of37,500 ft3 of soil was estimated based on the 2009 characterization. • P-26 and NP-5 - Impact of 49,025 ft3 of soil was estimated based on the 2009 characterization.
In summary, the volume of impacted soil adjacent in the non-plant areas (NP-1 through NP-5 and P-26) was estimated during the 2009 characterization to be approximately 110,194 ft3
•
The volume of impacted soil adjacent to subsurface piping was estimated during the 2009 characterization to be approximately 129,622 ft3.The additional impacted soil volume for plant areas (P-1 through P-25), non-plant areas (P-26 and NP-1 through NP-5), and impacted soil adjacent to subsurface piping identified in the 2009 DCE was estimated to be 718,692 ft3, 110,194 ft3
, and 129,622 ft3, respectively. Routine characterization surveys performed since 2009 do not indicate that the amount of impacted surface and subsurface soil material needs to be revised.
3.4.5 Administrative Areas
The Administration Building (BD-1 ), the Laboratory and HP Building (BD-2), the Maintenance Shop/Store/Office Building (BD-6), and the Power House (BO-7) were previously identified as not contaminated. Because radioactive materials were used in the Laboratory and HP Building (BD-2), some remediation in this area would be required. This DCE assumes the Laboratory and HP Building (BD-2) in its entirety will be demolished and the resulting debris will be sent for disposal. At the same time, the roof above the laundry in the Administration Building (BD-1) will be removed if found to be contaminated.
18 Rev. 0

Q ENERCON 3.4.6 Calcium Fluoride Ponds B, C, D, and E
MTW Decommissioning Cost Estimate January 4, 2019
Ponds B, C, D, and E are Resource Conservation and Recovery Act (RCRA)-regulated surface impoundments. Characterization of the ponds was completed by Honeywell in 2009. Pond closure requirements are currently being undertaken. RCRA financial assurance for the calcium fluoride pond closures is accounted for separately and is not part of this DCE.
3.4.7 Roads
Based on the 2009 characterization data, the subgrade material under the roads (P-25) inside the restricted area was characterized as having little or no radiological impact. Therefore, no adjustment to the impacted volume of soil was made.
In 2012, Honeywell replaced most of the asphalt roads inside the restricted area with concrete. The project required removal of approximately 6 inches of asphalt and subgrade material so that the concrete roadway cc:iuld be constructed.
Prior to the removal of the asphalt paving material, a walkover survey was performed. The walkover survey results showed little to no radiological impact to the asphalt paving material. Therefore, the material which was removed was managed as non-impacted material. Subsequently, Honeywell used the asphalt and subgrade material as fill within the plant.
3.4.8 Aisle No. 5 of the Uranium Hexafluoride Pad
In August 2011, ENERCON performed a radiological survey of Aisle No. 5 of the UF6 pad. The details of this survey are provided in Radiological Characterization Report of the UF6 Pad (prepared by ENERCON). This survey was performed because the existing concrete in Aisle No. 5 was scheduled to be removed so that the areas could be repaved. The results of the survey showed some elevated activity in the concrete and no impacts to the aggregate beneath the existing concrete pad. The clean concrete in Aisle No. 5 was removed, crushed, and utilized as fill in the Waste Storage Area.
3.4.9 Support Trailers
In 2011, Honeywell installed a 12-wide trailer (BD-69) and an additional training trailer (BD-58) in the old Liquid Petroleum Gas Area (northwestern corner of the restricted area) to provide office space to support ongoing site operations. The administrative activities being conducted in the trailers are not expected to
19 Rev. 0

Q ENERCON MTW Decommissioning Cost Estimate January 4, 2019
result in any impacts to building surfaces or soil. Therefore, no adjustments were made to the DCE due to the installation of these trailers.
3.4.10 RCRA KOH Muds Drums Storage Building
In 2009, Honeywell installed the RCRA KOH Muds Storage Building (BD-26) (an opened wall structure) in the southern portion of the Ore Storage Pad area. The location ofBD-26 is depicted in Figure 3 (Drawing No. MTW-2800, Rev AF). The original concrete pad is still in place and was only cut at the
footer/foundation locations for the building column installation. The Ore Storage Pads are considered impacted, and the volume of impacted concrete was not adjusted for this update. The building is comprised
of steel columns, trusses, and a sheet metal roof. It is assumed for this DCE that the building will be demolished.
3.4.11 Sheet Metal Buildings
In 2012, Honeywell installed two sheet metal buildings. The Waste Sorting Building (BD-92) was installed west of the Surface Treatment Facility. The Capital Fabrication Building (BD-93) was installed south of the Sampling Plant (BD-23). It has a poured concrete floor with industrial coating to prevent migration of
contamination into the concrete. Based on historical knowledge of the activities that occur in these buildings and contamination control measures, it is assumed that there will be no radiological impacts.
3.4.12 Calcium Fluoride Pond Removal Rail Spur
In preparation for load out of the calcium fluoride ponds, a new rail spur was installed parallel to and outside
the western fence line from the main rail line to a point west of Ponds C and E. When completed, the section of rail spur directly west of the ponds will have a fenced security impoundment. Rail cars will be
pulled into this impoundment, loaded with materials from the calcium fluoride ponds, undergo the
necessary radiological and security evaluations, and then be released to be transported for disposal.
Prior to the work commencing on the land area, ENERCON performed a radiological evaluation documented in the Preconstruction Radiological Survey Report Surface Impoundment Closure dated January 25, 2018. This evaluation identified one location approximately 1 meter in diameter near NPDES Outfall 005 which was subsequently removed by Honeywell.
20 Rev. 0

QENERCON MTW Decommissioning Cost Estimate January 4, 2019
4.0 DECOMMISSIONING COST ESTIMATION METHODS
This section of the DCE report documents the considerations and factors used to prepare this DCE.
The estimated cost to decommission the Honeywell MTW is approximately $192,463,202. Appendix A-2
provides a summary of the costs for each area of the facility.
4.1 Cost Escalation Factor
The cost escalation methodology specified in NUREG-1307, Revision 15, was not utilized.
4.2 . Summary of Decommissioning Costs
The summary of decommissioning costs is shown in Table 4-1.
Table 4-1: Decommissioning Cost Summary- Honeywell Facility
•,
Lab«>,r P~us Equipine{lt, . .. . ,
'·. .. .. •' " •' . ', •' "''a' .,,,':~ \. ~a·n~· ·Triivel & .' ,c' · . §uppit~~ .~:, ... : ~ ,)r . ~, ', ' ··;·, . ' Oro~';' ~· . ·~ ,".;: '. ' . '·' :;,~ Operation ·. : .
' ,-: -. : ' ,. · Waste'Disoo;al Total:Cosf
,'. . hou'rs· · Livine Stibco{ltracts Main Production Buildings 41,639 $2,613,279 $51,880,942 $540,319 $55,034,540 Misc. Production Buildings 31,744 $2,089,565 $4,202,990 $299,892 $6,592,446 Drum Storage Pads and Ponds 4,880 $298,634 $482,333 $39,364 $820,330 Outdoor Areas, Drains, & Sewers 8,948 $599,898 $26,261,254 $195,762 $27,056,913 Administrative Areas 4,592 $315,613 $249,760 $24,850 $590,223 Additional Soil Plant Areas Pl-P25 28,228 $1,837,131 $14,874,688 $472,089 $17,183,907 Decommissioning Planning 736 $91,555 $0 $0 $91,555 Planning, Training & Mobilization 24,572 $1,648,611 $0 $0 $1,648,611 Oversight, Reporting & Licensing 93,392 $19,498,013 $0 $18,364,770 $37,862,783 NRC Fees ----- ----- ----- $1,166,000 $1,166,000 Asbestos Removal and Disposal ----- ----- $1,602,000 $1,084,560 $2,686,560
Totals 238,731 $28,992,297 $99,553,966 $22,187,606 $150,733,869 25% CONTINGENCY $37,683,467
ILLINOIS RAD WASTE FEE ($3/ft3) $4,045,866
GRAND TOTAL $192,463,202
21 Rev. 0
\

Q ENERCON 4.3 Radioactive Waste Disposal Cost
MTW Decommissioning Cost Estimate January 4, 2019
This report reflects the current estimated waste on-site and whether it is going to the EnergySolutions
disposal facility or to the US Ecology disposal facility. The following sections describe the costs provided
to Honeywell for the various disposal pathways.
For purposes of the DCE, the following were applied for terms of disposal:
• Lidded high-sided gondola rail cars for disposal to EnergySolutions at $220,000 each at
150,000 pounds per gondola car or $1.47 per pound.
• Lidded low-sided gondola cars for disposal at US Ecology at $17,500 per gondola car at
75,000 pounds per gondola car, including asbestos at $0.24 per pound.
Appendix A-2 provides a summary of the disposal costs and Appendix A-3 provides a summary of the
labor unit cost information.
4.4 Remediation Methods
Remediation methods considered contamination levels, degree of penetration of contamination into
substrate material, equipment cost, support equipment costs, material and chemical costs, the generation of
secondary waste volumes (waste in addition to the removed contaminated material), processing rates, labor
requirements, and applicability to various tasks. The process consists of removing all components and
equipment with unimportant quantities of contamination from each structure or area and placing them in
rail cars for dis'posal primarily at US Ecology facilities.
This is followed by survey of the remaining structures and areas in a manner that the surveys will meet the
requirement for final status survey. For the main production buildings, the process is the same except that
the structures will also be demolished along with the components placed in rail cars. These structures and
components will be treated as having contamination exceeding levels that would qualify as unimportant
quantities and will be disposed at EnergySolutions. All the remaining pads throughout the site will be
scabbled to remove residual surface contamination, and the resulting material is anticipated to meet the
definition of unimportant quantities and will be disposed at US Ecology.
Productivity loss factors (Table 4-2) have been applied to demolition tasks to adjust for the various
constraints to efficiency because of working with radioactive materials.
22 Rev. 0

Q ENERCON MTW Decommissioning Cost Estimate January 4, 2019
Table 4-2: Productivity Loss Factors
. ' , ,, , ·,; ",,,:','"'_, · .,llesp .. · Rael(,, ,,, . frotectiv~ '. '" '·TOTAL.
.,
" ' 't~, ,, .. Hei2ht Protection ALARA Subtotal . Clothin2 Subtotal Breaks PLF.
... • C 15.00% 38.00%: 15.00%:·· .... 23.00%' :s;OO%· All factors 0.15 0.38 0.15 0.68 0.23 2.07 0.08 2.23 All except Height 0.38 0.15 0.53 0.23 1.88 0.08 2.03 Protective Clothing, Radiological Work, and Respirator Onlv 0.38 0.15 0.53 0.23 1.88 1.88 All factors except Respirator 0.15 0.15 0.30 0.23 1.60 0.08 1.73 Height, Protective Clothing, and Radiological Work only 0.15 0.15 0.30 0.23 1.60 1.60 Protective Clothing, Radiological Work, and Breaks 0.15 0.15 0.23 1.41 0.08 1.53 Protective Clothing and Rad only 0.15 0.15 0.23 1.41 1.41 Height and Breaks only 0.15 0.15 1.15 0.08 1.24 Height only 0.15 0.15 1.15 1.15 Breaks only 0.00 1.00 0.08 1.08
Source: AIF/NESP-036
The productivity loss factor of 2.23 was applied to the summary tables for each of the buildings listed below:
• Laboratory and HP Building (BD-2) • Cylinder Wash Building (BD-15) • Pond Muds Filter Calciner Building (BD-16) • Sodium Removal Building (BD-17) • Uranium Recovery Building (BD-19) • KOH Muds Building (BD-20) • Drum Dumping Area and Sampling Plant (BD-21) • Sampling Plant (BD-23) • RCRA KOH Muds Storage Building (BD-26) • Safety Building (BD-28) • FMB (BD-29)
• Bed Materials and Filter Fines Building (BD-33) • Drum Crusher Building (BD-34) • Ion Exchange Building (BD-37) • Sand Blast Building (BD-39) • Drum Crusher Building (BD-41) • Drum Wash Building (BD-79)
( • H2S Incinerators Control (BD-89) • Tank Yard
4.5 Unit Costs
Select 2018 unit cost rates are shown in Table 4-3. Rates listed in Table 4-3 are prevailing rates.
23 Rev. 0

0 ENERCON MTW Decommissioning Cost Estimate January 4, 2019
Table 4-3: Decommissioning Estimate Selected Unit Cost Factors
,, ,,,,-,, ,, ' .. ,Rate Units· .Unit Cost Factor :2918 _Unit Cost
Radioactive Soil and Rubble Disposal at Energy Solutions of Utah $220,000.00 150,000 lb.
Rail Car
Waste Transportation to US Ecology includes Asbestos $17,500.00 75,000 lb. Rail Car
Waste Transportation to EnergySolutions of Utah $4.30 mile Management and Supervision $160.00 hour Engineer $120.00 hour Radiation Protection Supervisor $110.00 hour Laborer Foreman $92.60 hour Administrative Assistant $60.00 hour Equipment Operator $81.05 hour Instrument Technician $85.00 hour Radiation Protection Technician $85.00 hour Laborer $60.70 hour
4.6 Final Status Surveys
This report assumes that a post-remediation survey of each structure or area is completed. These post
remediation surveys are to be performed in such a manner that if no contamination is found, the results may
be used as final status survey data or to augment final survey data.
24 Rev.O

Q ENERCON MTW Decommissioning Cost Estimate January 4, 2019
5.0 DESCRIPTION OF THE DECOMMISSIONING PROCESS
Decommissioning of the Honeywell facility will require that residual radioactive materials be removed or remediated to meet the unrestricted release criteria to allow removal of the decommissioned facilities from the site's radioactive materials license. The unrestricted release means no restrictions are imposed upon
the site after license termination. Numerous structures will remain after license termination. These
structures will not have had their structural soundness compromised by decommissioning activities.
5.1 Asbestos Removal
The initiating event for decommissioning is to remediate all the asbestos sitewide utilizing the services of
an asbestos abatement contractor licensed to perform work in the State of Illinois. After a structure has
been remediated or identified as asbestos free, the radiological decommissioning tasks can begin. All waste
generated during the asbestos remediation is anticipated to go to US Ecology for disposal.
5.2 Wipe Down and Application of Fixative
After the asbestos removal has been completed for a structure or area, a crew will wipe down all the interior
surfaces of the buildings and equipment in each of the structures. For the structures designated for
demolition, a fixative will be applied to all accessible surfaces of the buildings and equipment.
5.3 Lead Survey
After the wipe down and fixative application has been completed, an equipment and structure evaluation
will take place to determine if there is any lead-based paint present.
5.4 Characterization Surveys
Areas of the facility that are not anticipated to be demolished and have a history of radioactive materials
use or storage will have radiological surveys conducted. Survey results will determine the extent of
remediation, if any, required to achieve release of these areas for unrestricted use. Characterization surveys
are normally performed in such a manner that ifno contamination is found, the results may be used as final
status survey data or to augment final survey data.
25 Rev. 0

0 ENERCON 5.5 Remediation
MTW Decommissioning Cost Estimate January 4, 2019
The general remediation approach assumes that source material and waste will be removed from process areas and that no remediation is required in administrative areas except for the Laboratory and HP Building (BD-2).
Further discussion of the individual remediation tasks follows.
5.5.1 Main Production Buildings
The entire FMB (BD-29) structure, concrete slab, building pads, and all the equipment are considered to be contaminated. The building and associated encased equipment will be demolished and removed from the site for processing or disposal at an authorized waste disposal facility.
The Ion Exchange Building (BD-37), Sodium Removal Building (BD-17), KOH Muds Building (BD-20), Uranium Recovery Building (BD-19), Drum Dumping Area and Sampling Plant (BD-21), the Production Offices on the eastern side of SGF2/Anode Prep Building (BD-3), the Safety Building (BD-28), FMB South Pad, and H2S Incinerators Control (BD-89) will be demolished. The structures and all the equipment housed within are considered to be contaminated and will be demolished and removed from the site for disposal at an authorized waste disposal facility.
After all the buildings are removed to the concrete slab, the slabs and the basement of the FMB (BD-29) will be removed along with the subsurface soil to a depth of 3 feet. It is anticipated that these materials will go to US Ecology.
5.5.2 Production Support Buildings
The Ore Storage Building (BD-18), Bed Materials and Filter Fines Building (BD-33), Pond Muds Filter Calciner Building (BD-16), Cylinder Wash Building (BD-15), and Drum Crusher Building (BD-34) are considered to be contaminated. The Pond Muds Filter Calciner Building (BD-16) and associated equipment will be demolished and removed from the site for processing or disposal at an authorized waste disposal facility. Building concrete slabs will be left in place after being decontaminated using surface removal methods.
The South GF2 Plant Building (BD-3), GF2 Plant (BD-4), Liquid Fluorine Facility (BD-14), Surface Treatment Facility (BD-42), and Calcium Fluoride Building (BD-25) are not anticipated to require remediation. The duct work associated with the heating, ventilation, and air conditioning (HV AC) system
26 Rev. 0

0 ENERCON MTW Decommissioning Cost Estimate January 4, 2019
for these buildings will be surveyed and, if contaminated, will be removed and disposed of at the appropriate waste site.
5.5.3 Miscellaneous Building and Structures to be Demolished
In the footprint of the Environmental Protection Facility Building (BD-10), three tanks (801, 804, and 915) will be demolished based on their use during operation and disposed at an authorized waste disposal facility.
The Drum Wash Building (BD-79), Break Room Shed (BD-80), Bed Materials and Filter Fines Building (BD-33), Drum Crusher Building (BD-34), Ion Exchange Building (BD-37), and Drum Crusher Building (BD-41) all will be demolished, and their debris treated as radioactive waste.
5.5.4 Drum Storage Pads and Uranium Settling Ponds
The Ore Storage Pads, the former KOH Muds Storage Pad (which now serves as a Drum Storage Pad),
Drum Storage Pad, and Waste Storage Pad are considered to be contaminated. The concrete slabs will be left in place aft~r surface contamination is mechanically removed.
Uranium Settling Pond Nos. 3 and 4 are contaminated and will be remediated by removing the pond
sediments, pond liner, and contaminated soil under the ponds for disposal at an authorized waste disposal facility.
The balance of miscellaneous equipment, piping, and tanks associated with Uranium Settling Pond Nos. 3 and 4 is assumed to be contaminated and will be demolished and disposed at EnergySolutions.
5.5.5 Outdoor Areas, Drains, and Sewers
The sanitary system is assumed to be impacted; therefore, it will require demolition.
The entire process system and portions of the storm water system were assumed to be impacted.
No characterization was performed near subsurface piping systems during the 2009 site characterization due to ongoing production at the site. The determining factor for the storm water system was based on whether or not the piping was located downgradient of an area that had impacts to surface and subsurface soils. If a subsurface piping system was assumed to be impacted, remediation was assumed to consist of removing the piping and associated backfill. A typical cross section (3 feet wide by S feet deep) was used to estimate the removal volume. The disposition of the impacted piping and backfill was assumed to be disposal at an authorized waste disposal facility.
27 Rev. 0

Q ENERCON MTW Decommissioning Cost Estimate January 4, 2019
The drainage swale from Outfall 002 (formerly referred to as "The Discharge Ditch to River" in the
2006 Site Reclamation Cost Estimate Report) is contaminated and will be remediated by removing the ditch
sediments and surrounding impacted soil for disposal at an authorized waste disposal facility. The typical
cross section assumed was a 2-foot-deep trapezoidal-shaped channel with a 3-foot bottom and 2 horizontal
to I vertical side slopes. The total length was estimated to be approximately 2,770 feet. No changes were
made to these assumptions in this update of the DCE.
The other four notable impacts to areas outside the restricted area include east of the Ore Storage Pads,
along River Road, the road to the inactive landfill, and the landfill. The impacts along River Road were
detected approximately 25 feet on either side of the center of River Road over approximately 750 feet. The
impacts east of the Ore Storage Pads were in a drainage swale located east of the Ore Storage Pads. The
typical cross section assumed a I-foot-deep rectangular-shaped channel with a 3-foot-wide bottom.
Approximately 675 feet of drainage swale was assumed to be impacted. The impacts along the road to the
inactive landfill were isolated. Due to limited sampling, which did not allow for extensive delineation, an
area that was assumed to be impacted was used.
The 3 8-acre area on the eastern perimeter west of the eastern rail spur along the Honeywell property line is
known as the Landfill and Kickback area. This location was known to be used by a previous owner for
creosote processing. Additionally, Honeywell used this space as a subsurface disposal area from the late
1950s through to the mid- l 980s.
The process to remediate this area is as follows:
• All known files and historical documents in the public and private domain concerning this area are
to be reviewed.
• A ground penetrating radar survey will be performed to determine the approximate boundaries of
the area in question and to determine the nature of the near-surface materials.
• An electromagnetic survey of the area will be conducted to determine materials that appear to be
below the range of the ground penetrating radar. This technique will allow for evaluation to a depth
of 30 feet if needed. The results of the electromagnetic survey will also be used to assist in the
determination of the nature of landfill materials.
• After an understanding of the boundaries, depth, and subsurface materials present are established,
the next evolution is to begin the excavation of the identified area and to load- the materials into
28 Rev. 0

0 ENERCON MTW Decommissioning Cost Estimate January 4, 2019
suitable containers for transport and disposal. The containers will be staged for sampling and analysis.
• Sampling will occur for each 25 cubic yards of excavated materials. After the sample results are received, the containers can be loaded in suitable transport for disposal.
5.5.6 Final Status Surveys
Final status surveys will be performed using the guidance provided in NUREG-1575, MARSSIM. The surveys will be performed in accordance with specifically developed plans and procedures.
5.5.7 Survey Instrumentation
Selection and use of instrumentation will ensure sensitivities are sufficient to detect the identified nuclides at the minimum detection requirements. A list of typical final status survey instrumentation, radiation detected, and calibration sources is provided in Table 5-1.
Table 5-1: Typical Final Status Survey Instrumentation
,·, :'· .,,; ' ~," "' ·:' :·;;' ,: '.,.··
, Radiation· · . :Calibratiori' ,·: '; ,' ; ', ', Instrument/Detector.: . I>etector Tvbe -_ , - . . /Dete~ted ... :· ,Source·- ;- · " · ,\·Use,.,- , : .-., ,,
Ludlum Model 2350 with Gas-flow proportional Alpha or beta 99Tc (P) Direct alpha and direct 4368, 43-98, 43-94 or (126 cm2
) 230Th (u) beta surveys; Beta 43-106 detector scans on solid surfaces. Ludlum Model 2350/ GM Pipe Detector Alpha or beta 99Tc (P) Direct beta pipe SP- l 133m or SP- l 75-3m 230Th (u) survey. Ludlum Model 2350 with Shielded GM Beta 99Tc (P) Direct beta surveys; 44-40 detector (15.5 cm2
) Beta scans on solid surfaces.
Ludlum Model 2350 with NaI (Tl) Scintillator Gamma 137Cs Gamma exposure rate 44-2 or 44-10 detector and gamma scans. Eberline Teletector Model Ion Chamber Gamma 60Co (y) Gamma exposure rate 6112B Eberline SAC-4 Scaler ZnS scintillator Alpha 230Th (u) Smear counting Counter Eberline BC-4 Scaler Shielded GM Beta 99Tc (P) Smear counting Counter Tennelec1Planchette Shielded Gas-flow Alpha and Beta 99Tc (P), Smear counting Counter or Equal proportional 230Th (u) EG&G NOMAD Gamma HPGe Gamma energy Mixed gamma Nuclide identification Spectrometer or Equal and intensity and quantification of
soil and sand samples.
29 Rev. 0

0 ENERC,ON MTW Decommissioning Cost Estimate January 4, 2019
6.0 REFERENCES
American National Standards Institute, 2012, "Packaging of Uranium Hexafluoride for Transport," ANSI Nl4.l.
Code of Federal Regulations, 10 CFR 20.1402, Radiological Criteria for Unrestricted Use.
Code of Federal Regulations, IO CFR 30, Rules of General Applicability to Domestic Licensing of Byproduct Material.
Code of Federal Regulations, 10 CFR 61, Licensing Requirements for Land Disposal of Radioactive Waste.
Enercon Services, Inc., 2006, Site Reclamation Cost Estimate for Plant Located in Metropolis, Illinois, Revision 0, May 2006.
Enercon Services, Inc., 2009, Historical Site Assessment, Revision 0.
Enercon Services, Inc., 2010, Radiological Characterization Report for Site Soils, Revision 0, January 11, 2010.
Enercon Services, Inc., 2010, Modified DCGLs for the Honeywell Metropolis Works (draft), April 29, 2010.
Enercon Services, Inc., 2010, Decommissioning Cost Estimate for Honeywell Metropolis Works, Revision 1, July 27, 2010.
Enercon Services, Inc., 2011, Radiological Characterization Report of the UF6 Pad for the Honeywell Metropolis Works (UF6PAD-RPT-001), Revision 0, October 31, 2011.
Enercon Services, Inc., 2012, Decommissioning Cost Estimate for Honeywell Metropolis Works, Revision 0, August 15, 2012.
Enercon Services, Inc., 2016, Decommissioning Cost Estimate for Honeywell Metropolis Works, Revision 1, April 20, 2016.
Enercon Services, Inc., 2018, Preconstruction Radiological Survey Report Surface Impoundment Closure, January 25, 2018.
NUREG-1307, 2013, Report on Waste Burial Charges, Revision 15, January 2013.
NUREG-1575, 2000, Rev. 1, Multi-Agency Radiation Survey and Site Investigation Manual (MARSSIM), August 2000.
NUREG-1757, Vol. 1, Rev. 1, Consolidated Decommissioning Guidance Decommissioning Process for Materials Licensees, Table B. l, Acceptable License Termination Screening Values of Common Radionuclides for Building-Surface Contamination.
J
NUREG- I 7 57, Vol. 1, Rev. 1, Consolidated NMSS Decommissioning Guidance Decommissioning Process for Materials Licensees, Table B.2, Screening Values (pCi/g) of Common Radionuclides for Soil Surface Contamination Levels.
30 Rev. 0

0 ENERCON MTW Decommissioning Cost Estimate January 4, 2019
NUREG-1757, Vol. 2, Rev. 1, Consolidated Decommissioning Guidance Characterization, Survey, and Determination of Radiological Criteria, September 2006.
NUREG-1757, Vol. 3, Rev. 1, Consolidated Decommissioning Guidance, Financial Assurance, Recordkeeping, and Timeliness, PART II: Financial Assurance.
NUREG/CR-5512, Volume 2, Residual Radioactive Contamination From Decommissioning: User's Manual DandD Version 2.1," Decontamination and Decommissioning (DandD).
R.S. Means Company, Inc., 2006, Means Building Construction Cost Data, 64th Annual Edition.
R.S. Means Company, Inc., 2015, Site Work & Landscape Cost Data, 34th Annual Edition.
U.S. Nuclear Regulatory Commission, Federal Register, 1981, "Disposal or Onsite Storage of Thorium or Uranium Wastes From Past Operations," Vol. 46, No. 205, Pages 52061-3, October 23, 1981
U.S. Nuclear Regulatory Commission, Policy and Guidance Directive FC 83-23, "Guidelines for Decontamination of Facilities and Equipment Prior to Release for Unrestricted Use or Termination of Byproduct, Source, or Special Nuclear Material Licenses."
31 Rev. 0

' .
APPENDIX A-1
DURATION

Appendix A-1 - Duration
Task Durations Summary Project Name: Honeywell MTW Decommissioning Cost Estimate
WBS# Task Identification Duration (Days) 3.1.1 BD - 1 Administrative Building 45
3.1.10 BD - 10 FPF Area Building 30 3.1.101 BD - 101 Storage Tent 1
3.1.1040 U-1040 and U-1041 Sanitary Treatment System 10 3.1..1052 P-1052 Diesel ComQressor Trailer South of the Power House 5
3.1.11 BD - 11 CAF2 Recovery Area Building 40 3.1.14 BD - 14 Liguid Flourine Facility 5 3.1.15 * BD - 15 Cylinder Wash Building 23 3.1.16 * BD - 16 Pond Muds Calciner Area & Uranium Ponds Eguii:1ment Area 34 3.1.17 * BD-17 lodium Removal and BD-19 Uranium Recovery 34 3.1.18 BD - 18 Ore Storage Building 15 3.1.2 * BD - 2 Laboratory Eguigment Building 67
3.1.20 * BD - 20 KOH Muds Building 12 3.1.21 * BD - 21 Ore Drum Dumi:1er, Washer & Crusher Building 23 3.1.22 BD - 22 Scale House Area BD - 36 10 3.1.23 * BD - 23 {ORE) SamQling Plant 45 3.1.24 Ore Storage Pads 55 3.1.25 BD - 25 CFX Building 15 3.1.26 * BD - 26 RCRA Large Drum Storage Area 12 3.1.27 BD - 27 Switch House Building 5 3.1.28 * BD - 28 Safety Building 12 3.1.29 * BD - 29 Feed Materials Building 357 3.1.3 BD - 3 GF2 South Cell Room and Production Offices 45
3.1.31 Drum Storage Pads 15 3.1.32 BD - 32 SUQQIY Storage Building for BD - 69 5 3.1.33 * BD - 33 Fines Storage Building 67 3.1.34 * BD - 34 Drum Crusher Building 56 3.1.35 BD - 35 GF2 Cell Cond and Maintenance 65 3.1.37 * BD - 37 Ion Exchange and Potassium Removal Building 23 3.1.39 * BD - 39 Sand Blast Building 12 3.1.4 BD - 4 GF2 C Cell Room, ABC South Pad and A&B Rect 50
3.1.41 * BD - 41 Drum Crusher Building 12 3.1.42 BD - 42 STF Area Building 25 3.1.43 BD - 43 and BD - 76 Contractor Security Entrance 15 3.1.44 BD - 44 KPA Bioassembly Lab Urine Analysis Trailer 5 3.1.48 BD - 48 UF6 Cylinder Storage 40 3.1.49 BD - 49 Storage Shed For Cylinder Hauler 5 3.1.5 BD - 5 GF2 North Cell Room, D&E Rect and D&E South Pad 35
3.1.50 BD - 50 Storage Building 5 3.1.52 BD - 52 Control Room Building for HF RailcarOff Loading 5 3.1.58 BD - 58 Learning Resource Center 10 3.1.6 BD - 6 ShoQ and Stores Building 20
3.1.601 Portable Steam SuQQly Trailer East of the Power House 10 3.1.69 BD - 69 Admin - Nuclear ComQliance Trailer 5 3.1.7 BD - 7 Power House Building 70
3.1.79 * BD - 79 Drum Wash Building 12 3.1.8 BD - 8 Paint Building 5
3.1.80 BD-80 Break Room and Shed 12
Honeywell Metropolis Works Page 1 of 2 Revision O

,··
Appendix A-1 - Duration
3.1.83 BD - 83 Liguid Nitrogen Building 5 3.1.84 BD - 84, BD-85, BD-86 and BD-100 Structures 5 3.1.87 BD - 87 Janitorial Storage Building 5 3.1.89 * BD - 89 Feed Materials Building South Pad East Side 23 3.1.9 BD - 9 Dealkalization Building 5
3.1.92 BD - 92 Waste Sorting Building 10 3.1.94 Waste Storage Area 20
3.1.Sub-11 BD - Sub - 11 CIPS Sub Station . 5 3.1.Tank Yard * Tank Yard 67
3.3.1 Parking Lot 10 3.3.24 FMB Post Demolition Concrete Pads Survey 35 3.3.25 Roadways and Ground Areas {P-25) 10 3.3.26 Security Exclusion Area {P-26) 10 3.3.27 2009 Subsurface Soils 120 3.3.28 Outfall 002 15 3.3.29 Non-lmi;1acted Outside Plant Areas 205 3.3.30 Landfill and Kickback Area 275 3.3.31 P-23 Fuel Dei;1ot 5 3.3.32 Land Area P-21 and P-24 60 Prep Prei;1aratory Plans and Procedures 23
Lockdown Lockdown 110 Mob Mobilization 45
Demob Demobilization 23 FSS FSS Sami;1les 40
Report Final Project Rei;1ort 70 PM Project Management 2,560
Honeywell Metropolis Works Page 2 of 2 Revision 0

..
APPENDIX A-2
COST SUMMARY
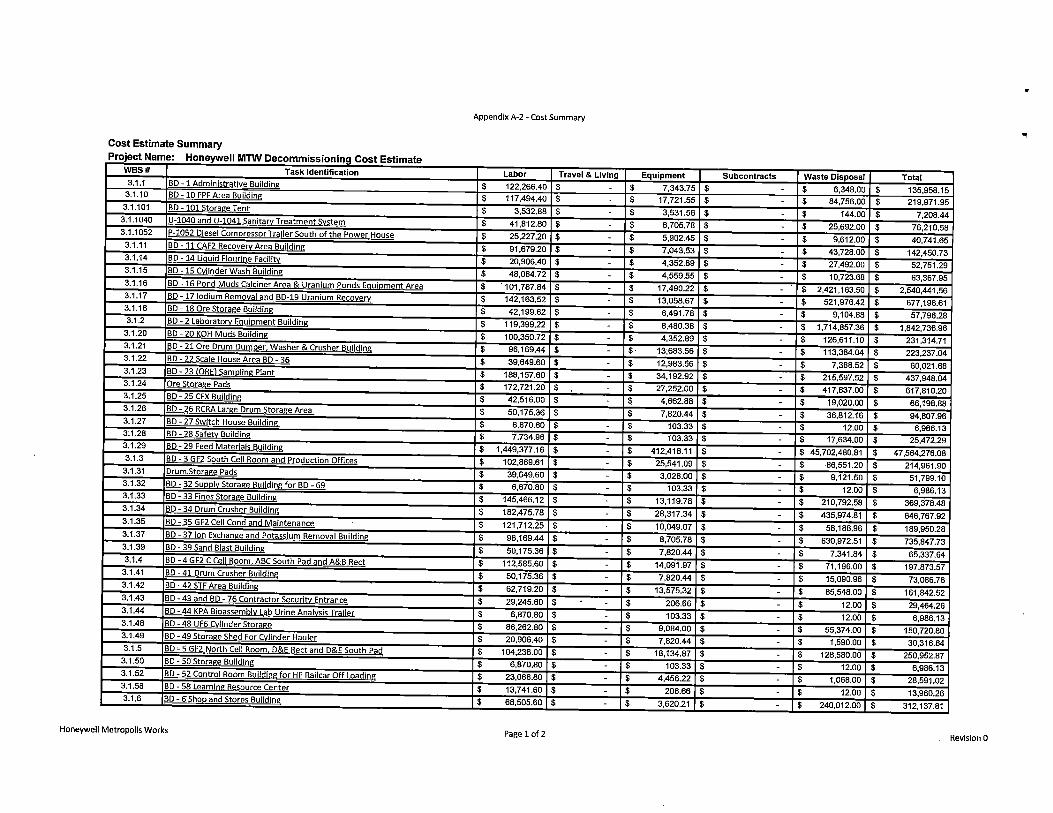
Appendix A-2 - Cost Summary
Cost Estimate Summary Project Name: Honeywell MTW Decommissioning Cost Estimate
WBS# Task Identification Labor Travel & Living Equipment Subcontracts Waste Disposal Total 3.1.1 BD -1 Administrative Building $ 122,266.40 $ - $ 7,343.75 $ - $ 6,348.00 $ 135,958.15 3.1.10 BD -10 FPF Area Building $ 117,494.40 $ - $ 17,721.55 $ - $ 84,756.00 $ 219,971.95
3.1.101 BD - 101 Storage Tent $ 3,532.88 $ - $ 3,531.56 $ - $ 144.00 $ 7,208.44 3.1.1040 U-1040 and U-1041 Sanita[Y Treatment System $ 41,812.80 $ - $ 8,705.78 $ - $ 25,692.00 $ 76,210.58 3.1.1052 P-1052 Diesel Com11ressor Trailer South of the Power House $ 25,227.20 $ - $ 5,902.45 $ - $ 9,612.00 $ 40,741.65 3.1.11 BD - 11 CAF2 Recove[Y Area Building $ 91,679.20 $ - $ 7,043.53 $ - $ 43,728.00 $ 142,450.73 3.1.14 BD - 14 Liguid Flourine Facility $ 20,906.40 $ - $ 4,352.89 $ - $ 27,492.00 $ 52,751.29 3.1.15 BD -15 Cylinder Wash Building $ 48,084.72 $ - $ 4,559.55 $ - $ 10,723.68 $ 63,367.95 3.1.16 BD - 16 Pond Muds Calciner Area & Uranium Ponds Egui11ment Area $ · 101,787.B4 $ - $ 17,490.22 $ - $ 2,421.163.50 $ 2,540,441.56 3.1.17 BD - 17 !odium Removal and BD-19 Uranium Recove[Y $ 142,163.52 $ - $ 13,058.67 $ - $ 521,976.42 $ 677,198.61 3.1.18 BD - 18 Ore Storage Building $ 42,199.62 $ - $ 6,491.78 $ - $ 9,104.88 $ 57,796.28 3.1.2 BD - 2 Laboratory Egui11ment Building $ 119,399.22 $ - $ 8,480.38 $ - $ 1,714,857.36 $ 1,842,736.96 3.1.20 BD - 20 KOH Muds Building $ 100,350.72 $ - $ 4,352.89 $ - $ 126,611.10 $ 231,314.71 3.1.21 BD - 21 Ore Drum Dum11er, Washer & Crusher Building $ 96,169.44 $ - $ 13;683.56 $ - $ 113,384.04 $ 223,237.04 3.1.22 BD - 22 Scale House Area BD - 36 $ 39,649.60 $ - $ 12,983.56 $ - $ 7,38B.52 $ 60,021.68 3.1.23 BD - 23 {ORE} Sam111ing Plant $ 188,157.60 $ - $ 34,192.92 $ - $ 215,597.52 $ 437,948.04 3.1.24 Ore Storage Pads $ 172,721.20 $ - $ 27,252.00 $ - $ 417,837.00 $ 617,810.20 3.1.25 BD - 25 CFX Building $ 42,516.00 $ - $ 4,662.B8 $ - $ 19,020.00 $ 66,198.88 3.1.26 BD - 26 RCRA Large Drum Storage Area $ 50,175.36 $ - $ 7,820.44 $ - $ 36,812.16 $ 94,807.96 3.1.27 BD - 27 Switch House Building $ 6,870.80 $ - $ 103.33 $ - $ 12.00 $ 6,986.13 3.1.28 BD - 28 Safer,, Building $ 7,734.96 $ - $ 103.33 $ - $ 17,634.00 $ 25,472.29 3.1.29 BD - 29 Feed Materials Building $ 1,449,377.16 $ - $ 412,418.11 $ - $ 45,702,480.81 $ 47,564,276.08 3.1.3 BD - 3 GF2 South Cell Room and Production Offices $ 102,869.61 $ - $ 25,541.09 $ - $ ·86,551.20 $ 214,961.90 3.1.31 Drum.Storage Pads $ 39,649.60 $ - $ 3,028.00 $ - $ 9,121.50 $ 51,799.10 3.1.32 BD - 32 Su1111ly Storage Building for BD - 69 $ 6,870.80 $ - $ 103.33 $ - $ 12.00 $ 6,986.13 3.1.33 BD - 33 Fines Storage Building $ 145,466.12 $ - $ 13,119.78 $ - $ 210,792.58 $ 369,378.48 3.1.34 BD - 34 Druni Crusher Building $ 182,475.78 $ - $ 28,317.34 $ - $ 435,974.81 $ 646,767.92 3.1.35 BD - 35 GF2 Cell Cond and Maintenance $ 121,712.25 $ - $ 10,049.07 $ - $ 58,188.96 $ 189,950.28 3.1.37 BD - 37 Ion Exchange and Potassium Removal Building $ 96,169.44 $ - $ 8,705.78 $ - $ 630,972.51 $ 735,847.73 3.1.39 BD - 39 Sand Blast Building $ 50,175.36 $ - $ 7,820.44 $ - $ 7,341.84 $ 65,337.64 3.1.4 BD - 4 GF2 C Cell Room, ABC South Pad and A&B Rect $ 112,585.60 $ - $ 14,091.97 $ - $ 71,196.00 $ 197,873.57
3.1.41 BD - 41 Drum Crusher Building $ 50,175.36 $ - $ 7,820.44 $ - $ 15,090.96 $ 73,086.76 3.1.42 BD - 42 STF Area Building $ 62,719.20 $ - $ 13,575.32 $ - $ 85,548.00 $ 161,842.52 3.1.43 BD - 43 and BD - 76 Contractor Securi!',' Entrance $ 29,245.60 $ - $ 206.66 $ - $ 12.00 $ 29,464.26 3.1.44 BD - 44 KPA Bioassembly Lab Urine Analysis Trailer $ 6,870.80 $ - $ 103.33 $ - $ 12.00 $ 6,986.13 3.1.48 BD - 48 UF6 Cylinder Storage $ 86,262.80 $ - $ 9,084.00 $ - $ 55,374.00 $ 150,720.80 3.1.49 BD - 49 Storage Shed For Cylinder Hauler $ 20,906.40 $ - $ 7,820.44 $ - $ 1,590.00 $ 30,316.84 3.1.5 BD - 5 GF2 North Cell Room, D&E Rect and D&E South Pad $ 104,238.00 $ - $ 18,134.87 $ - $ 128,580.00 $ 250,952.87
3.1.50 BD - SO Storage Building $ 6,870.80 $ - $ 103.33 $ - $ 12.00 $ 6,986.13 3.1.52 BD - 52 Control Room Building for HF Railcar Off Loading $ 23,066.80 $ - $ 4,456.22 $ - $ 1,068.00 $ 28,591.02 3.1.58 BD - 58 Learning Resource Center $ 13,741.60 $ - $ 206.66 $ - $ 12.00 $ 13,960.26 3.1.6 BD- 6 Sholl and Stores Building $ 68,505.60 $ - $ 3,620.21 $ - $ 240,012.00 $ 312,137.81
Honeywell Metropolis Works Page 1 of2 Revision 0

Appendix A-2 - Cost Summary
.. Cost Estimate Summary Project Name: Honeywell MTW Decommissioning Cost Estimate
WBS# Task Identification Labor Travel & Living Equipment Subcontracts Waste Disposal Total 3.1.601 Portable Steam Su1111ll! Trailer East of the Power House $ 34,261.20 $ - $ 4,456.22 $ - $ 10,572.00 $ 49,289.42 3.1.69 BD - 69 Admin - Nuclear Com[lliance Trailer $ 6,870.80 $ - $ 103.33 $ - $ 1,212.00 $ 8,186.13 3.1.7 BD - 7 Power House Building $ 286,943.01 $ - $ 52,648.00 $ - $ 74,382.00 $ 413,973.01 3.1.79 BD - 79 Drum Wash Building $ 11,304.96 $ - $ 103.33 $ - $ 788.16 $ 12,196.45 3.1.8 BD - 8 Paint Building $ 6,870.80 $ - $ 103.33 $ - $ 12.00 $ 6,986.13 3.1.80 BD-80 Break Room and Shed $ 50,448.00 $ - $ 10,776.89 $ - $ 1,876.18 $ 63,101.07 3.1.83 BD - 83 Liguid Nitrogen Building $ 6,870.80 $ - $ 103.33 $ - $ 12.00 $ 6,986.13 3.1.84 BD - 84, BD-85, BD-86 and BD-100 Structures $ 17,664.40 $ - $ 3,310.22 $ - $ 10,572.00 $ 31,546.62 3.1.87 BD - 87 Janitorial Storage Building $ 17,664.40 $ - $ 2,488.89 $ - $ 276.00 $ 20,429.29 3.1.89 BD - 89 Feed Materials Building South Pad East Side $ 96,169.44 $ - $ 6,841.78 $ - $ 143,374.98 $ 2<16,386.20 3.1.9 BD - 9 Dealkalization Building $ 6,870.80 $ - $ 103.33 $ - $ 2.40 $ 6,976.53 3.1.92 BD - 92 Waste Sorting Building $ 13,741.60 $ - $ 206.66 $ - $ 1,212.00 $ 15,160.26 3.1.94 Waste Storage Area $ 52,214.00 $ - $ - $ - $ 419,580.00 $ 471,794.00 3.1.Sub-11 BD - Sub - 11 CIPS Sub Station $ 6,870.80 $ - $ 103.33 $ - $ 12.00 $ 6,986.13 3.1.Tank Yard Tank Yard $ 248,799.59 $ - $ 17,067.75 $ $ 70,332.00 $ 336,199.34 3.3.1 Parking Lot $ 13,741.60 $ - $ - $ - $ - $ 13,741.60 3.3.24 FMB Post Demolition Concrete Pads Survel! $ 134,483.60 $ - $ 16,550.67 $ - $ 2,537,664.00 $ 2,688,698.27 3.3.25 Roadwal!s and Ground Areas {P-25) $ 11,191.60 $ - $ - $ - $ - $ 11,191.60 3.3.26 Securitl! Exclusion Area (P-26) $ 39,662.20 $ - $ 19,155.56 $ - $ 871,689.60 $ 930,507.36 3.3.27 2009 Subsurface Soils $ 544,343.17 $ - $ 187,056.32 $ - $ 26,235,561.60 $ 26,966,961.09 3.3.28 Outfall 002 $ 63,422.40 $ - $ 19,155.56 $ - $ 1,073,649.00 $ 1,156,226.96 3.3.29 Non-lm(!acted Outside Plant Areas $ 458,855.60 $ - $ - $ - $ - $ 458,855.60 3.3.30 Landfill and Kickback Area $ 1,174,678.40 $ - $ 433,777.92 $ - $ 12,929,337.00 $ 14,537,793.32 3.3.31 P-23 Fuel De(!Ot $ 6,870.80 $ - $ - $ - $ - $ 6,870.80 3.3.32 Land Area P-21 and P-24 $ 82,449.60 $ - $ - $ - $ 12.00 $ 82,461.60 Prep Pre11arato['L Plans and Procedures $ 91,554.72 $ - $ - $ - $ - $ 91',554.72 Lockdown Lockdown $ 1,377,927.76 $ - $ - $ - $ - $ 1,377,927.76 Mob Mobilization $ 179,128.80 $ - $ - $ - $ - $ 179,128.80 Demob Demobilization $ 91,554.72 $ - $ - $ - $ - $ 91,554.72 FSS FSS Sam11les $ 65,998.40 $ - $ - $ 364,770.00 $ - $ 430,768.40 Report Final Project Re11ort $ 278,644.80 $ - $ - $ - $ - $ 278,644.80 PM Project Management $ 10,465,853.44 $ 8,687,516.40 $ - $ 1,084,559.73 $ 1,602,000.00 $ 21,839,929.57
- - - -- --- - -Subtotal 20,3o4,1s1 I $ 8,687,516 i $ 1,s12,216 I $ 1,449,330 I $ 99,553,966 I $ 131,567,869 !
TOTAL - BASE COST $ 131,567,869 Regulatory Fees $ 18,000,000
NRCFees $ 1,166,000 Illinois Rad Waste Fee ($3/h 3 J $ 4,045,866
25% Contigency $ 37,683,467 TOTAL ALL COSTS $192,463,202
Honeywell Metropolis Works Page 2 of 2 Revision O

Ir
APPENDIX A-3
WASTE SUMMARY

•
Appendix A-3 - Waste Volume Summary
ENERCON Waste Volume Summary Project Name: Honeywell MTW Decommissioning Cost Estimate
,SI Cl - U) C
g "'C t: :ii nl a., :a ::c Q) Q) :::. 3: ~ =§ =; g 'la E .!I! U) -3: 0 ::9 u Ill -t; .e- .e -- C aj .Q '5 < C :::S a, U) 0 - .Q
ti) C - S' 2: Q) t) .Q :::s ' .Q .Q fl:: WBS# Task Identification U) :::s
< fl:: 3.1.1 BD - 1 Administrative Building 50 26,400 - - -
3.1.10 BD - 10 FPF Area Building 50 182,100 - 171,000 -3.1.101 BD - 101 Storage Tent - 600 - - -3.1.1040 U-1040 and U-1041 Sanitaty Treatment System 50 107,000 - - -3.1.1052 P-1052 Diesel ComQressor Trailer South of the Power House 50 40,000 - - -
3.1.11 BD - 11 CAF2 Recovery Area Building 50 182,150 - - -3.1.14 BD - 14 Liguid Flourine Facility 50 114,500 - - -3.1.15 BD - 15 Cylinder Wash Building 50 44,632 - - -3.1.16 BD - 16 Pond Muds Calciner Area & Uranium Ponds EguiQment Area 50 108,000 - - 1,539,000 3.1.17 BD -17 lodium Removal and BD-19 Uranium Recovery 50 355,036 - - -3.1.18 BD - 18 Ore Storage Building 25 3,537 - 34,375 -3.1.2 BD - 2 Laboratory EguiQment Building 50 685,925 - 6,459,264 -
3.1.20 BD - 20 KOH Muds Building - 86,130 - - -3.1.21 BD - 21 Ore Drum DumQer,Washer &Crusher Building - 77,132 - - -3.1.22 BD - 22 Scale House Area BD - 36 50 4,79B - 25,938 -3.1.23 BD - 23 {ORE) SamQling Plant 50 158,261 - 740,012 -3.1.24 Ore Storage Pads 50 15,000 - 1,725,938 -3.1.25 BD - 25 CFX Building 50 79,200 - - -3.1.26 BD - 26 RCRA Large Drum Storage Area - 153,384 - - -3.1.27 BD - 27 Switch House Building 50 - - - -3.1.28 BD - 28 Safety Building 50 - - 73,425 -3.1.29 BD - 29 Feed Materials Building 1,000 14,382,873 - - 16,706,250 3.1.3 BD - 3 GF2 South Cell Room and Production Offices 50 360,580 - - -
3.1.31 Drum Storage Pads 38 - - 37,969 -3.1.32 BD - 32 SUQQIY Storage Building for BD - 69 50 - - - -3.1.33 BD - 33 Fines Storage Building 40 90,036 - 53,320 -3.1.34 BD - 34 Drum Crusher Building 50 223,469 - 73,063 -3.1.35 BD - 35 GF2 Cell Cond and Maintenance 50 242,404 - - -3.1.37 BD - 37 Ion Exchange and Potassium Removal Building 50 429,183 - - -3.1.39 BD - 39 Sand Blast Building 50 30,541 - - -3.1.4 BD - 4 GF2 C Cell Room, ABC South Pad and A&B Rect 50 296,600 - - -
3.1.41 BD - 41 Drum Crusher Building 25 62,854 - - -3.1.42 BD - 42 STF Area Building 50 356,400 - - -3.1.43 BD - 43 and BD - 76 Contractor Securi!Y Entrance 50 - - - -3.1.44 BD - 44 KPA Bioassembly Lab.Urine Analysis Trailer 50 - - - -3.1.48 BD - 48 UF6 Cylinder Storage 100 - - 230,625 -3.1.49 BD - 49 Storage Shed For Cylinder Hauler 25 6,600 - - -3.1.5 BD - 5 GF2 North Cell Room, D&E Rect and D&E South Pad 50 535,700 I - - -
3.1.50 BD - SO Storage Building 50 - - - -3.1.52 BD - 52 Control Room Building for HF Railcar Off Loading 50 4,400 - - -3.1.58 BD - 58 Learning Resource Center 50 - - - -3.1.6 BD - 6 ShoQ and Stores Building 50 1,000,000 - - -
3.1.601 Portable Steam SuQQly Trailer East of the Power House 50 44,000 - - -3.1.69 BD - 69 Admin - Nuclear ComQliance Trailer 50 5,000 - - -3.1.7 BD - 7 Power House Building 50 309,875 - - -3.1.79 BD - 79 Drum Wash Building 50 3,234 - - -3.1.8 BD - 8 Paint Building 50 - - - -
3.1.80 BD-80 Break Room and Shed 38 7,780 - - -3.1.83 BD - 83 Liguid Nitrogen Building 50 - - - -3.1.84 BD - 84, BD-85, BD-86 and BD-100 Structures 50 44,000 - - -
Honeywell Metropolis Works Page 1 of 2 Revision 0

...
Appendix A-3 - Waste Volume Summary
3.1.87 BD - 87 Janitorial Storage Building 50 1,100 - - -3.1.89 BD - 89 Feed Materials Building South Pad East Side - 87,566 - 9,968 -3.1.9 BD - 9 Dealkalization Building 10 - a - -
3.1.92 BD - 92 Waste Sorting Building 50 5,000 - - -3.1.94 Waste Storage Area - - - - 1,748,250
3.1.Sub-11 BD - Sub - 11 CIPS Sub Station 50 - - - -3.1.Tank Yard Tank Yard 50 293,000 - - -
3.3.1 Parking Lot - - - - -3.3.24 FMB Post Demolition Concrete Pads Survey 100 - - 2,593,500 7,980,000 3.3.25 Roadways and Ground Areas {P-25) - - - - -3.3.26 Security Exclusion Area {P-26) 40 - - - 3,632,000 3.3.27 2009 Subsurface Soils 40 - - - 109,314,800 3.3.28 Outfall 002 38 - - - 4,473,500 3.3.29 Non-Jm12acted Outside Plant Areas - - - - -3.3.30 Landfill and Kickback Area 38 - - - 53,872,200 3.3.31 P-23 Fuel De12ot - - - - -3.3.32 Land Area P-21 and P-24 50 - - - -Prep Pre-Mobilization - - - - -
Lockdown Lockdown - - - - -Mob Mobilization - - - - -
Demob Demobilization - - - - -FSS FSS Sam12les - - - - -
Report Final Project Re12ort - - - - -PM Project Management - - 6,675,000 - -
TOTAL ! 3, 1os j 21,245,980 ! 6,675,000 j 12,228,396 ! 199,266,000 !
Honeywell Metropolis Works Page 2 of 2 Revision 0

.... •·
APPENDIX A-4
LABOR SUMMARY
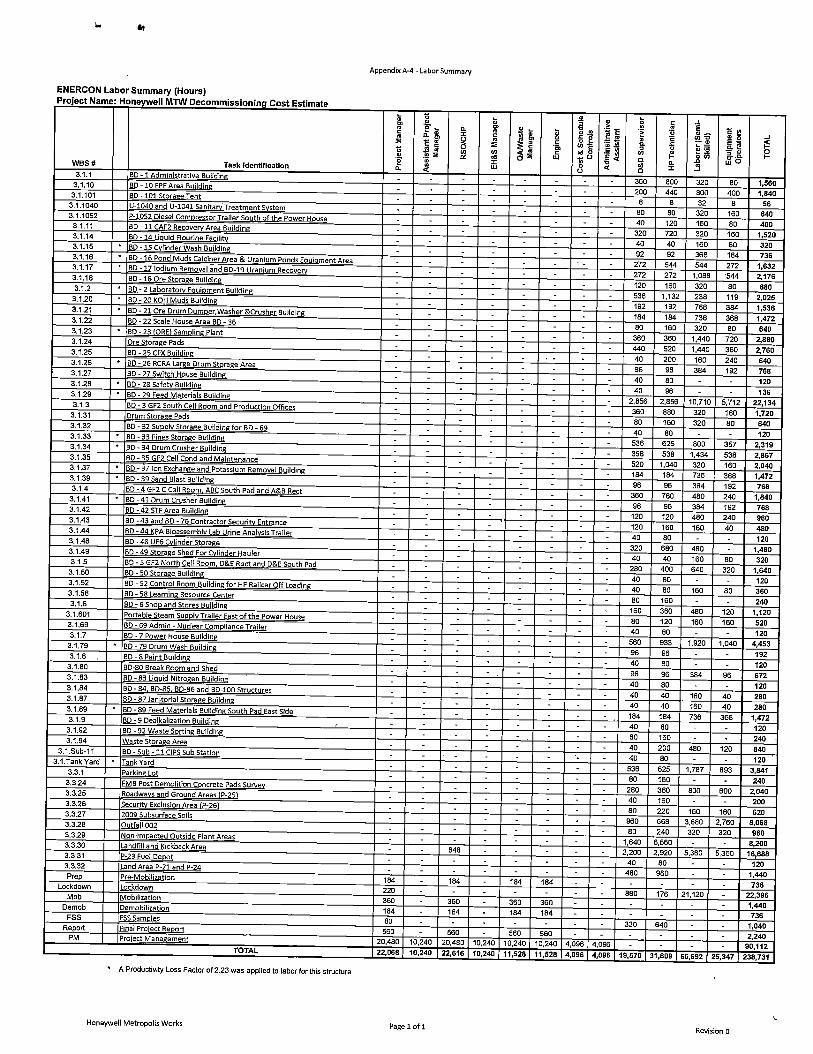
..
ENERCON Labor Summary (Hours) Project Name: Honeywell MlW Decommissioning Cost Estimate
WBS#
3.1.1 3.1.10 3.1.101
3.1.1040 3.1.1052
3.1.11 3.1.14 3.1.15 3.1.16 3.1.17 3.1.18 3.1.2
3.1.20 3.1.21 3.1.22 3.1.23 3.1.24 3.1.25 3.1.26 3.1.27 3.1.28 3.129 3.1.3
3.1.31 3.1.32 3.1.33 3.1.34 3.1.35 3.1.37 3.1.39 3.1.4
3.1.41 3.1.42 3.1.43 3.1.44 3.1.48 3.1.49 3.1.5
3.1.50 3.1.52 3.1.58 3.1.6
3.1.601 3.1.69 3.1.7
3.1.79 3.1.8
3.1.80 3.1.83 3.1.84 3.1.87 3.1.89 3.1.9
3.1.92 3.1.94
3.1.Sub-11 3.1.Tank Yard
3.3.1 3.3.24 3.3.25 3.3.26 3.3.27 3.3.28 3.3.29 3.3.30 3.3.31 3.3.32 Prep
Lockdown
Mob
Demob
FSS Report
PM
Task Identification BO -1 Administrative Building BD -10 FPF Area Building BD - 101 Storage Tent U-1040 and U-1041 Sanitary Treatment System P-1052 Diesel Compressor Trailer South of the Power House BO -11 CAF2 Recovery Area Building BD -14 Liquid Flourine Facility SD -15 Cylinder Wash Building BD -16 Pond Muds Calciner Area & Uranium Ponds Equipment Area BD -17 lodium Removal and BD-19 Uranium Recovery BO -18 Ore Storage Building BO - 2 Laboratory Equipment Building BD - 20 KOH Muds Building BD - 21 Ore Drum Dumper,Washer &Crusher Building SD - 22 Scale House Area BD - 36 BD - 23 (ORE) Sampling Plant Ore Storage Pads SD - 25 CFX Building BO - 26 RCRA Large Drum Storage Area SD - 27 Switch House Building BD - 28 Safety Building BD - 29 Feed Materials Buildine BD - 3 GF2 South Cell Room and Production Offices Orum Storage Pads SD - 32 Supply Storage Building for BO - 69 BO - 33 Fines Storage Building BD - 34 Drum Crusher Building BD - 35 GF2 Cell Cond and Maintenance BO - 37 Ion Exchange and Potassium Removal Building BD - 39 Sand Blast Building BD - 4 GF2 C Cell Room, ABC South Pad and A&B Rect BD - 41 Drum Crusher Building BD -42 STF Area Building BO -43 and BO - 76 Contractor Security Entrance BO -44 KPA Bioassembly lab Urine Analysis Trailer BO -48 UF6 Cylinder Storage SD -49 Storage Shed For Cylinder Hauler BD - 5 GF2 North Cell Room, D&E Rect and D&E South Pad BO - 50 Storage Building BO - 52 Control Room Building for HF Railcar Off Loading SD - 58 Learning Resource Center SD - 6 Shop and Stores Building Portable Steam Supply Trailer East of the Power House BD - 59 Admin - Nuclear Compliance Trailer BO - 7 Power House Building BD - 79 Drum Wash Building BD - 8 Paint Building BD-80 Break Room and Shed BD - 83 liquid Nitrogen Building BD -84, BD-85, BD-86 and BD-100 Structures BD-87 Janitorial Storage Building BO -89 Feed Materials Building South Pad East Side SD - 9 Dealkalization Building BO - 92 Waste Sorting Building Waste Storage Area BD -Sub -11 CIPS Sub Station Tank Yard
FMB Post Demolition Concrete Pads Survey Roadways and Ground Areas tp-25) Security Exclusion Area (P-26) 2009 Subsurface Soils Outfall 002 Non-Impacted Outside Plant Areas Landfill and Kickback Area P-23 Fuel Depot Land Area P-21 and P-24 Pre-Mobilization Lockdown Mobilization
Demobilization
Final Proiect Report Project Management
TOTAL
A Productivity Loss Factor of 2.23 was applied to labor for this structure
Honeywell Metropolis Works
Appendix A-4 - Labor Summary
m
"' .. ; :E 1l ·~ a.
184 220 360 184 80
560 20,480 22,068
1l
·~ ~ Q. "' - .. C C .fl .. .!!! ~ "' "' <(
10,240 10,240
Page 1 of 1
848
184 184
360 360 184 184
184
360 184
.!! :,
-g ..!!! "fie. en c "' 0 _o "' 0 0
~
g 'i: m Q.
ell 0
"' 0
360 200
80 40
320
C: .. ·.; 'E .s:; u ~ Q. :c
800 440 8
BO 120 720
320 800 32
320 160 320
c I!! m o Ee. E ·5 cu CT ,C. wO
80
400 8
160 BO 160
40 40 160 80 92 92 368 184
272 544 544 272 272 272 1,088 ·544 120 160 320 80 536 1,132 238 119 192 192 768 384 184 184 736 368 80 160 320 80
360 360 1,440 720 440 520 1,440 360 40 200 160 240 96 96 384 192 40 80 40 96
2,856 2,856 10,710 5,712 360 880 320 160 80 160 320 80 40 80 536 625 800 357 358 538 1,434 538 520 1,040 320 160 184 184 736 368 96 96 384 192
360 760 480 240 96 96 384 192 120 120 480 240 120 160 160 40 40 80
320 680 480 40 40 160 BO 280 400 640 320 40 80 40 80 160 80 80 160 160 360 480 120 80 120 160 160 40 80
560 933 1,920 1,040 96 96 40 80
96 96 384 96 40 80
40 40 160 40 40 40 160 40 184 184 736 368 40 80 80 160 40 200 480 120 40 80
536 625 1,787 893 80 160
280 360 800 600 40 160 80 220 160 160 960 668 3,680 2,760 80 240 320 320
1,640 6,560 2,200 2,920 5,360 5,360
40 80 480 960
880 176 21,120
320 640
1,560 1,840
56 640
400 1,520 320 736
1,632 2,176 680
2,025 1,536 1,472 640
2,880 2,760 640
768 120 136
22,134 1,720 640 120
2,319 2,867 2,040 1,472 768
1,840 768 960 480 120
1,480 320
1,640 120 360 240
1,120 520 120
4,453 192 120 672 120
280 280
1,472 120 240 840 120
3,841 240
2,040 200 620
8,068 960
8,200 16,688
120 1,440 736
22,396 1,440 736
1,040 560 560 560 2,240
20,480 10,240 10,240 10,240 4,096 4,096 90,112 22,616 10,240 11,528 11,528 4,096 4,096 19,570 31,809 65,592 25,347 238,731
Revision O