Embed Size (px)
Citation preview
UNDERSTANDING CLIMATE CHANGE DRIVEN COASTAL EROSION AND
INUNDATION IMPACTS ON TORRES STRAIT COMMUNITIES AND THE DEVELOPMENT OF ADAPTATION
OPTIONS
METHODOLOGY &
SUMMARY
Prepared for: Department of Climate Change and Energy Efficiency
Commonwealth of Australia &
Torres Strait Island Communities
K.E. Parnell, S.G. Smithers and L. Ischenko
School of Earth and Environmental Sciences James Cook University
Townsville
Folio 352

Funded by the Australian Government represented by the Department of Climate Change and Energy Efficiency
Folio 353

1
1. Introduction
The Commonwealth of Australia, represented by the Department of Climate Change and Energy Efficiency, contracted James Cook University to undertake a study titled: Understanding climate change driven coastal erosion and inundation on Torres Strait communities and the development of adaptation options. The project undertakes an assessment of the risks of climate change driven coastal erosion and inundation of Torres Strait island communities, identifies and assesses specific adaptation options, and documents those options preferred by the communities. The project extends the work of a project completed on the central islands of Masig, Poruma, Warraber and Iama (see details in Section 2). It focuses on the 14 Torres Strait island communities on 13 islands that were not covered in the earlier project (Figure 1). These communities are: Erub (Darnley), Mer (Murray) and Ugar (Stephen) (volcanic islands); Kubin and St. Pauls (on Moa Island), Badu, Mabuiag, Dauan, Waiben (Thursday), Kiriri (Hammond), Muralug (Prince of Wales), Ngurupai (Horn) (continental-type islands); Boigu and Saibai (low muddy islands).
Figure 1.1 – The inhabited coral cay, low muddy, granitic-continental and volcanic islands of Torres Strait. In all communities with the exception of Boigu and Saibai field research was undertaken, the aim of which was to understand the natural and human-influenced processes occurring on beaches adjacent to the communities, and to work with the communities to provide options to manage coastal erosion in ways that worked with, rather than against, the natural coastal processes. This work is broadly similar to the research undertaken to support the coastal management plans previously completed for the central islands of Masig, Poruma, Warraber and Iama (see Section 2).
Folio 354

2
Boigu and Saibai communities have very limited adaptation options available to them. A number of studies including work undertaken by Sel Sultmann (EPA, 2006a; EPA 2006b), the Sustainable Land Use Plans (SLUP, 2010) and the opinions of a range of professionals that have worked in these communities, show that fortification using structures and raising the elevation (both of the land surface and of buildings and infrastructure) are the only real possibilities. The research on these islands consists of cost analyses, where both the cost of replacing all community infrastructure at another location and the cost of elevation of the island surface are considered. The report consists of a methodology and summary document (this document) and a report for each community. The reports have been provided to the following at the conclusion of the research phase of the contract (30 May 2012):
The Torres Strait Regional Authority (TSRA), through the Chairman, the CEO, the members for the island communities studied (in most cases these are the same as the TSIRC councillors), the Manager of the Land and Sea Management Unit (LSMU), the coastal officer, the community liaison officer, and the senior rangers for the communities where the studies were undertaken.
The Torres Strait Island Regional Council (TSIRC) through the Mayor, the
Director of Engineering Services and the divisional managers.
The Torres Shire Council, through the Mayor, with a request for copies to be passed to the appropriate elected representatives and others in his organisation.
The Prescribed Body Corporate for each island, through the current chair
and/or secretary. Electronic copies on CD are being made widely available. The island elected representatives and PBCs are being provided with printed copies. A small number of printed copies will be available at the Council office for consultation. The community reports are deliberately written in a way that makes them accessible to the non-specialist in the community, rather than in the standard scientific report style. This is discussed in more detail in Section 3. Over the course of the next near, a consultation process will be undertaken to assess and prioritise problems and adaptation options. This phase will conclude by 30 June 2013, with a report documenting the outcomes of the consultation process in each project community, documenting community views on preferred adaptation options.
Folio 355
3
2. Background to the study Between 2006 and 2010, James Cook University undertook a project funded by the NHT2 programme, with some extra funding for publication from MTSRF, to study erosion and inundation in the Torres Strait central island group (Masig, Poruma, Warraber and Iama). The results of the study were initially reported in a range of ways to the communities including posters, DVDs, other visual summaries and community meetings. Following an extended period of consultation, Community Coastal Management Plans were produced by each community, setting out the community views, priorities and adaptation plans. The results of these studies were published as:
Duce, S.J, Parnell K.E., Smithers S.G and McNamara K.E. 2010. A synthesis of climate change and coastal science to support adaptation in the communities of the Torres Strait. Synthesis report prepared for the Marine and Tropical Sciences Research Facility (MTSRF). Reef & Rainforest research Centre Limited, Cairns, 64pp., ISBN 978-1-921359-53-8
Parnell K.E., Smithers S.G. and Duce S.J. 2010. Coastal erosion and inundation
in the central island group (Masig, Poruma, Warraber and Iama), Torres Strait: Science supporting adaptation. Unpublished technical report prepared for the Marine and Tropical Sciences Research Facility (MTSRF). Reef & Rainforest Research Centre Limited, Cairns, 141pp.
The study on the four central islands was generally regarded as a success particularly with respect to community consultation (Arthur, 2007), and the results have been used to inform management agencies, particularly TSRA, with respect to planning for and implementing strategies related to erosion, inundation, climate change and climate change adaptation. Following a visit to Torres Strait by Senator Penny Wong, Minister for Climate Change, Energy Efficiency and Water in May 2010, James Cook University was invited to put forward a proposal to extend the central island work to other communities. A contract to undertake the task was signed on 15 October 2010.
Folio 356

4
3. Study methodology Approvals Initially, the support of communities was sought in order to undertake the work. This normally involved making contact with the LSMU which has staff that can assist in the community consultation process. Initially, the approval of the TSRA Board was obtained, through the Coastal Management Committee structure (where a presentation was given). Elected representatives of communities (TSIRC Councillors and TSRA Board Members for the TSIRC communities, and the Mayor of TSC for the inner island communities of Muralug, Waiben and Ngarupai) were then approached. The chair and/or the secretary of the Prescribed Bodies Corporate (PBCs) were also approached for support. This important stage was time consuming, and involved letters, faxes, emails and telephone calls, as well as a number of personal visits. LSMU staff assisted this phase to a very significant degree. Support was given, and approval to undertake the study was obtained, by all those listed above with the exception of the Badu PBC (Mura Badulgal (Torres Strait Islanders) Corporation). Following a change in the office holders of the Mura Badulgal Corporation on 24 February 2011, approval to work on Badu was obtained in March 2011, although the availability of accommodation meant that the first visit did not take place until June 2011. The approval of the Councillor and the PBC was sought before every visit to a community, with the exception of the TSC communities, where a single approval from the PBC and Council was obtained Community consultation On every occasion when visiting a community contact was made if possible with a PBC representative and the Councillor and/or Divisional Manager. In addition, in those communities where ranger programmes were in operation (Mer, Erub, Moa (St Pauls and Kubin), Mabuiag and Badu), visits were coordinated through and with the Rangers and the Ranger supervisors and trainers in LSMU. Rangers very significantly assisted with community liaison and logistics. In almost every case, on the first visit, we were taken on a tour of the coastline around the community (and in some cases further away) by somebody (Councillor, Council officer, Rangers, etc), and issues and sites of significance were pointed out to us. The nature and extent of community consultation was to a large extent directed by the elected officials, the PBCs and Rangers. On some occasions, formal meetings with the Councillor, the PBC chair and/or members and other groups were arranged. There was little enthusiasm for public meetings (which had been an important part of the process in the central islands), but a number of opportunities were offered to address larger groups in the community (such as the AGM of the Mer PBC and a meeting arranged to address the spread of dengue fever in Kubin). On the first visit to each community, multiple copies of posters explaining what we were doing and why were left with the Councillor, the PBC and at the Council office, and also put on community notice boards when we were invited to do so. On Erub, we have appeared on Walter Lui’s radio show on 4DI on three occasions. When necessary, we sought out particular people to ask specific questions. Frequently, it was made known that an individual wished to speak to us, and these approaches were always followed up.
Folio 357

5
Most community consultation occurred when we met community members while undertaking field work. If we passed somebody while working, we would stop and explain what we were doing. Frequently, people approached us to ask what we were doing, particularly when we were seen walking with an RTK-GPS backpack attached. We tried to be around places where community members gathered, and when invited, participate in community events. Torres Strait communities do not appreciate ‘fly-in fly-out’ researchers, and we make every effort to simply spend time in communities, getting to know the people and listening to their concerns and learning from their experiences and knowledge. The result of the formal and informal consultation was an understanding of the areas and issues of particular concern in the communities, which are highlighted in the island reports. These issues and areas of concern will be highlighted for discussion in the consultation phase of the project over the next year, so that the community will be able to consider priority actions. When possible, we arranged visits around, and made special trips to support, events where community members were participating, such as the opening of the cultural festival The Torres Strait Islands: A Celebration held in Brisbane in July 2011, Island Kores held on Thursday Island in July 2011, and the Cairns Indigenous Arts Fair held in August 2011. Field research The dates of research visits to the communities are listed in Table 3.1. Fieldwork on islands always included an RTK-GPS beach survey and taking a set of beach photographs. This enables sediment volume differences to be determined, areas of cut and areas of fill (normally seasonal) to be established, and areas of obvious erosion and deposition to be documented. In addition, for particular research objectives, hydrodynamic data and sediment data were collected. Occasionally, there were problems with field data collection. This was particularly the case when visits were necessarily short (such as on Dauan due to transport limitations) or the requirements of community consultation reducing available field time, and in locations where diurnal tides dominate (where survey times and water levels are very convenient at some times of the year, allowing almost all day to undertake the required work, and almost impossible at other times, with high water levels throughout the day). There was some equipment failure, most significantly when hydrodynamic measurements were lost for the July 2011 fieldwork on Mer.
Folio 358

6
Table 3.1: Island visits
Island 1st visit 2nd visit 3rd visit 4th visit
Badu 31 May - 3 Jun 2011 6-9 Dec 2011
Dauan 21-Feb-2011 9 Dec 2011
Erub 22 - 28 Jan 2011 8 - 16 Jun 2011 15-21 Feb 2012
Kiriri 14 Apr 2011 18 Jul 2011 10 Dec 2011
Kubin 17 - 20 Jan 2011 3 - 8 Jun 2011 27 Jan-1 Feb 2012
Mabuiag 8-11 Dec 2010 11-13 April 2011 6-11 Jul 2011 12-14 Dec 2011
1-6 Feb 2012
Mer 13-15 Dec 2010 16-19 Feb 2011 11 - 16 Jul 2011 8-13 Feb 2012
Muralug 15, 16 April 2011 19 Jul 2011
Ngurupai 11-13 Dec 2011 20 Jul 2011 14 Feb 2012
St Pauls 15 - 17 Dec 2010 3 - 8 Jun 2011 27 Jan-1 Feb 2012
Ugar 27 Jan 2011 14 Jun 2011 18-19 Feb 2012
Waiben 20 Feb 2011 17 Jul 2011 21-22 Nov 2011 14 Feb 2012
Folio 359

7
Boigu and Saibai A different type of analysis is undertaken for Boigu and Saibai. In order to get a comprehensive understanding of the replacement cost of assets in these communities, Black & More, Cairns, was engaged to undertake a desktop study and provide an opinion of probable construction cost to replace existing infrastructure. They also provided an opinion as to the cost of purchasing and transporting large quantities of fill that would be required to elevate the land surface. Black & More have been involved in the delivery of the Major Infrastructure Programme in the Torres Strait, and are uniquely placed to provide the required data. Additional sources of information used in the assessment have come from the Sustainable Land Use Plans (SLUP, 2010), a report by AECOM on Inundation Management on Saibai, Boigu and Iama Islands (AECOM, 2011), and from data in the TSIRC asset database. Other data A range of other data sources were available and were used. These included the following: Images and aerial photographs
Satellite images of the TSRA/TSIRC communities in either Quickbird or IKONAS formats. These were imaged in years 2005-2007.
Schlenker images, commissioned for the Island Coordinating Council in 1998
and taken in 1998 and 1999. These are very high quality, and cover all communities with the exception of Muralug.
Other aerial photographs, available from a range of sources and at different
scales and qualities. Some locations have good coverage whereas other locations have very poor coverage. Locating aerial photographs is a major challenge and there may easily be some that have not been located.
Google Earth images have been used when the quality is reasonable, and the
date of the image can be determined. LIDAR topographic data LIDAR topographic data has been available for Boigu and Saibai since September 2009. LIDAR data for Mabuiag has been available since May 2011. The LIDAR data for all other study communities, with the exception of St Pauls and Kubin were supplied near the completion of this project, in April 2012. St Pauls and Kubin data collection has not been completed, and it is not known if or when these data will be available. There were, and still are, issues with the data quality with respect to the height datums used. These issues are discussed below. Spatial infrastructure Audit For many years there has been a doubt about the accuracy of vertical height datums in Torres Strait. Following a tide level study by Griffith University, and subsequent work by
Folio 360

8
Maritime Safety, Queensland, the Queensland Department of Environment and Resource Management undertook a Spatial Infrastructure Audit. The result was a review of levels and locations of all survey marks, based on the best available information, undertaken under the direction of Peter Todd. . A set of spreadsheets was produced and made available in July 2011 for use by everybody working in Torres Strait. The benchmarks and height datums used in this study, based on the Spatial Infrastructure Audit, are described in Section 4. Reports There have been a number of significant reports completed since the previous study of the central islands that have been of particular value to this project. These are:
The Sustainable Land Use Plans, prepared by CONICS (now RPS group) under the direction of Ian Doust (SLUP 2010). These have been prepared for all the TSIRC island communities.
The Torres Strait Climate Change Strategy 2010-2013, prepared by the Torres
Strait Coastal Management Committee (TSRA, 2010)
The Torres Strait Extreme Water Level Study, prepared by Systems Engineering Australia Pty. Ltd under the direction of Bruce Harper (SEA, 2011).
Observed and Future Climates of the Torres Strait, a report prepared by CSIRO
(Suppia et al, 2010).
Inundation Management on Saibai, Boigu and Iama Islands, a report prepared by AECOM by Stuart Bettington for TSRA (AECOM, 2011).
Limits to adaptation: Limits to climate change adaptation for two low-lying
communities in the Torres Strait, a report prepared by McNamara, Smithers, Westoby and Parnell for the National Climate Change Adaptation Research Facility (McNamara et al., 2011).
Other documents of particular relevance are:
The Queensland Coastal Plan (2012) prepared by DERM, State of Queensland.
Climate Change Risks to Australia’s Coast, prepared by the Department of Climate Change and Energy Efficiency in 2009 (DCCEE, 2009).
Problems and constraints Working in Torres Strait presents a number of significant logistical problems that are not issues in many other places. These are included here, for information, as an indication of things that need to be managed by anybody working in the area. Building relationships, particularly through the LSMU, is imperative to minimise the impact of these problems on the research. Logistic issues (approximately in order of significance for a research project of this type) are:
Folio 361

9
Availability of accommodation in the communities (and to a lesser extent on Thursday Island).
Ground transport in the communities. Weight limits on aircraft (including helicopter, RPT services and fixed wing
charters), when equipment needs to be carried. Managing permissions to visit and conduct research. Availability of members of the community who need to be consulted. Avoiding significant community events, often at short notice (e.g. ‘sorry
business’). Storms in the monsoon season. Diurnal tidal regimes (particularly an issue in western island communities in
summer). Reliability of QANTAS services to Horn Island Transport to islands without airstrips (Dauan and Ugar).
There have been difficulties with visiting Boigu and Saibai. Initially approval to work on Saibai was delayed, due to a view expressed in the community for a period of time that more research on the issues of climate change and community adaptation was not needed. This was resolved for this project during a discussion with the Councillor. Because the work on Boigu and Saibai did not involve significant field work, it normally took lesser precedence than the work on other islands that required significant field time, and therefore was given lesser priority. Accommodation availability meant that some planned visits had to be abandoned. When it appeared that arrangements were close to being finalised, the TSIRC was about to go into caretaker mode before the local government election, and we received advice that it would be best not to visit in the period before the election. Although the Councillors and the PBC have been kept informed of the nature of our work, we will attempt to ensure that the balance is addressed in the consultation phase of the project. Two data products that were expected to be available at the start of, or soon after the start of, this project were delayed. We had available LIDAR for Boigu, Saibai and Mabuiag, although the Boigu and Saibai data were completed to a different height datum. LIDAR data for the other communities, with the exception of St Pauls and Kubin (Moa Island), were not delivered until 13 April 2012, approximately 6 weeks before the project completion. We understand that the collection of data for Moa Island was abandoned due to weather conditions, and that although the St Pauls community area was captured, data processing is not going to take place until the entire island is captured. No date has been set for this to occur, and will probably be done opportunistically. The centre of Dauan was not captured, but this did not affect our work. LIDAR data was to be used in a number of areas of the project, and due to the limited time, this has had to be significantly reduced to essentially providing ‘bathtub’ inundation maps. The Torres Strait Extreme Water Level Study (SEA, 2011) was supposed to use the LIDAR data to produce inundation maps. We were to annotate the maps to provide an inventory of the infrastructure at risk of inundation while we were in the communities for other purposes. The inundation maps were never produced, and we were not able to produce our own equivalent maps for the purpose because of the unavailability of LIDAR data. We understand that TSRA are currently in negotiations with other parties to complete the inundation mapping.
Folio 362

10
Ideally, process-based studies capture data under a wide range of weather conditions. With a large number of communities, and some visits for logistics reasons being short, physical process data was not captured in all locations and/or on all visits. Perhaps most significantly, we did not capture a significant storm event in any of our work. In the previous study on the central islands (Parnell et al., 2010), a small number of high energy events were captured in the data record, and this gives a reasonable understanding of the sorts of conditions likely to be experienced in the communities during SE and NW storm events, and this understanding can be used together with an interpretation of the resulting environmental change, to understand the likely impact of high energy events. Other activities There was provision in the contract with DCCEE to undertake some extra tasks, should aspects of the contract be not able to be undertaken. As a result of being unable to complete some agreed outcomes, extra work, following up from the previous study of the central islands was undertaken on Warraber and Poruma (see Section 7), along with a number of other activities. The other activities undertaken were:
Active participation on the Torres Strait Coastal Management Committee (a group comprising elected TSRA Board members, TSRA staff, and other stakeholders), and the Coastal Working Group (a technical advisory group to TSRA). These committees made progress on the implementation of measures outlined in the Coastal Management Plans prepared for the central island group (Parnell et al., 2010).
Ranger training, by the provision of beach monitoring materials and training in the use of Emery poles for coastal change monitoring (Figure 3.1).
Participation in the LSMU, TSRA, Planning Conference, held in March 2012 Media interviews, as required (frequently arranged by LSMU staff, or by
community members and Councillors). Methodological development, consisting of a study that develops an efficient
strategy for RTK-GPS data collection to monitor beach change. This study provides a methodology that can be applied generally to coastal monitoring using this technology (see Section 7).
Folio 363

11
Figure 3.1: Using Emery poles to undertake a beach profile survey on Badu Reporting As required under the terms of the contract with DCCEE, three progress reports have been completed, dated 31 December 2010, 30 May 2011 and 31 December 2011. While maintaining scientific integrity, and using established methods as outlined in Section 4 below, the community based reports are written with the non-specialist community audience in mind. The style has been determined based on successful methods established during the study of the central island erosion and inundation issues. The result is highly visual, with many fewer words than is perhaps normal in scientific reports. A summary of the main results are provided in Sections 5 and 6 of this report. Data have been archived, and it is likely that formal journal publication of the science will occur in due course. Community reports are provided for the fourteen study communities: Badu Mer (Murray) Boigu Muralug (Prince of Wales) Dauan Erub (Darnley) Kiriri (Hammond) Kubin Mabuiag Ngurupai (Horn) Saibai St Pauls Ugar (Stephen) Waiben (Thursday)
Folio 364

12
4. Scientific methodology Spatial reference All spatial data has been reduced to the Map Grid of Australia (MGA94), based on the Geodetic Datum of Australia (GDA94). The height datum used is the Australian Height Datum (AHD), approximating Mean Sea Level (MSL). Benchmarks used for data reduction were supplied by DERM as part of the Spatial Infrastructure Audit. Table 4.1 lists the benchmarks used in this study. Surprisingly, the most difficult location to find survey marks near the beach was Waiben (Thursday Island). A height based on RM2 on the commercial jetty was established, but there is less confidence in the position used for the established Engineers’ Jetty benchmark. However, relative positions are preserved and are used consistently. The position of the benchmark on Engineers’ Jetty has been used to carry a height to temporary benchmarks on Ngurupai (Horn) and Muralug (Prince of Wales). Photographs of these positions are in Figure 4.1.
BM Ngurupai: Horn Jetty
BM Muralug: South RockBM Waiben: Engineers Jetty
Figure 4.1: Benchmarks established on Waiben, Ngurupai and Muralug.
Folio 365

13
Table 4.1: Benchmarks used in this study
Island BM Zone Easting Northing Height (AHD, Observed
Note
Badu 164065 54 627940.87 8875530.21 2.887
Dauan 177953 54 668875.43 8959287.44 3.374
Erub 146551 54 802999.19 8937865.71 3.332
Kiriri 128510 54 633541.57 8832439.92 2.144
Kubin 128523 54 633055.06 8868253.51 2.925
Mabuiag 89051 54 631597.69 8899717.74 6.401
Mer 164054 55 175507.93 8902582.41 3.689
Mer(Las) 125487 55 177866.10 8902361.60 0.803 Carried from 164054 by RTK-GPS
Muralug South Rock 54 631839.20 8827813.90 1.61 Carried from RM2 on Waiben ( 3.550m) by RTK-GPS
Ngurupai Horn Jetty 54 636345.80 8828756.10 2.351 Carried from RM2 on Waiben ( 3.550m) by RTK-GPS
St Pauls 177961 54 646092.33 8872661.25 3.449
Ugar 164053 54 779615.05 8948265.54 2.595
Waiben Engineers
Jetty 54 633424.9 8829508.40 2.617
Carried from RM2 on Waiben ( 3.550m) by RTK-GPS
.
Folio 366

14
RTK-GPS surveys RTK-GPS surveys were undertaken using a Trimble R7 Base Station and R8 rover unit for all surveys up to and including July 2011. From November 2011, all surveys used a new Trimble R8 capable of using GPS and GLONASS satellites, and two R8 rover units, one of the new series and one of the old. The advantage of the new series of receivers was particularly apparent when trying to survey under light vegetation. The base unit was fixed in a convenient location and a relationship to a benchmark was established. Rover units were attached to purpose-built Trimble survey backpacks and the height of the unit recorded. As a double check, a survey was made to either a permanent or a temporary benchmark, and all height calculations were related to this benchmark. Data were post-processed to the established benchmark positions and heights (Table 4.1). Although RTK-GPS is capable of accuracy to about 0.02m when used in point measurement mode, in continuous topographic mode, an accuracy of about 0.05cm is more likely. Data were processed through either Trimble Geomatics Office (old system) or Trimble Business Center (new system) software, saved as a CSV file and imported into ArcGIS for further analysis.
Figure 4.2: RTK-GPS survey Volume and cut and fill analysis On the basis of the imported XYZ data, point shapefiles were created to enable construction of 3D models. There are two main methods of 3D representation of spatial data, vector-based TINs (triangulated irregular networks) and grid-based rasters, each
Folio 367

15
with certain advantages. In this project, TIN DEMs were mainly used, complemented by operations on TIN surfaces converted to raster. The choice of TIN as the main modelling structure was based on the consideration that TIN models preserve all the spatial and vertical attributes of the input points (Milne and Sear, 1997) and apply the same principles of 3D surface creation (by means of triangles forming planes between data points) no matter what the configuration or distribution of these points is, not requiring interpolation (Andrews et al., 2002). TINs, however, have some limitations, which necessitated their conversion to raster, specifically, for the cut and fill analyses, as TINs within the ArcGIS framework do not allow elevation comparisons that can be graded (only change/no change) (Andrews et al., 2002). The combination of the two modelling methods has been used in other studies (for example, Milne and Sear, 1997) as it makes the best use of GIS modelling and analysis capabilities. The additional error that results from these conversions tends to be very minor (Milne and Sear, 1997). From each collected dataset, a TIN model was constructed. To ensure comparability of time series of TINs of each beach, a set of fixed point data was created and incorporated into every TIN model for that beach. This set included a reef flat line (a roughly shore-parallel line of survey-collected points on the reef flat where level changes were not expected) and a backline (a line running along the back of the beach, consisting of survey collected points, generated points reflecting the height of the adjacent survey points, or LIDAR-derived points). In addition, a study area clip shapefile was applied to each TIN to ensure the same areal extent of the final TINs. In the cases where the level of the lower beach / reef flat varied significantly along the length of the beach, the model was divided into sections (using additional clip shapefiles). TIN volumes were calculated using the “Surface Volume” tool in the 3D-Analyst toolbox of ArcMap, above heights (the lowest point on the reef flat line) which remained constant for all volume calculations for each studied beach. For section TINs, the height of the lowest reef line point in that section was used. For the cut and fill analyses, each TIN was converted to raster at the resolution of 0.5m using the “TIN to Raster” tool in the 3D-Analyst toolbox. Resulting rasters were subtracted one from another (the more recent from the older) using the “Math-Minus” tool in the Spatial Analyst toolbox. The subtraction produced cut and fill shapefiles showing elevation difference in each cell between each pair of input rasters. These shapefiles were subsequently reclassified into 11 classes, to represent the gradation of elevation change between >1m cut and <1m fill in 25cm increments, plus the “no change” class for the cells which experienced change in the range of +/-10cm (which can be considered negligible given the range of a possible errors in the data collection process (up to +/- 5cm) and the highly dynamic sandy beach environment). Finally, a set of maps was produced for each studied beach, including reclassified TIN images (in defined intervals of 20cm) and reclassified elevation change images, for inclusion in the reports.
Folio 368

16
Aerial photographs and satellite images
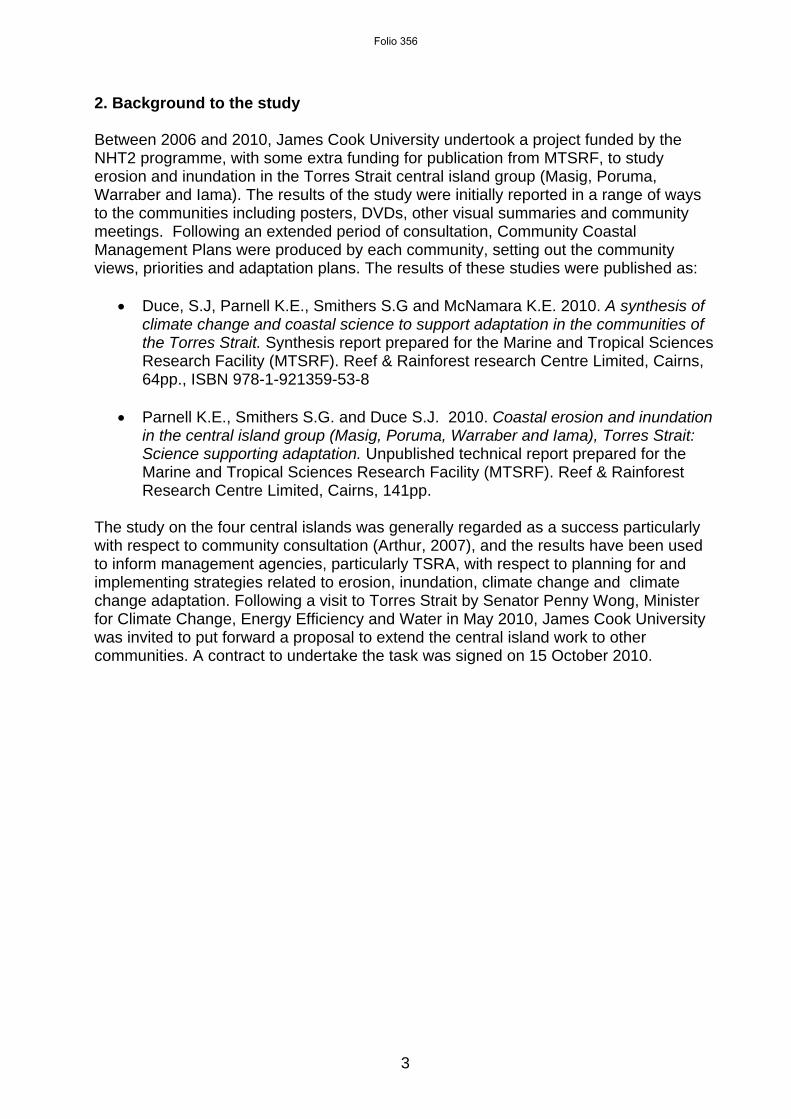
The aerial photograph and satellite image record was searched, and all images at a scale reasonable for analysis were sourced where possible. A number of images identified on flight diagrams were unable to be located by the relevant holding agencies. The acquisition of photos proved to be much more difficult than anticipated based on an understanding of what was available for the study of the central islands. Due to the compact and discrete nature of the coral islands, aerial photographs were always directed at the island, whereas on the larger islands that have communities, photographs were typically at a much smaller scale (and therefore poor resolution). The most important source of imagery was a set of IKONOS and QUICKBIRD satellite series produced for the Queensland Government from 2005-2007. A set of photographs commissioned by the Island Coordinating Council (ICC) from Schlenker Mapping Pty Ltd in the late 1990s was obtained, and have proved invaluable. Unfortunately there was no Schlenker coverage for Muralug. Other aerial photographs were of variable quality and covered a range of dates. Some images were downloaded using Google Earth Pro where quality images were available for periods sufficiently separated from the 2005-2007 satellite series. A list of available images in Table 4.2.
Folio 369
17
Table 4.2. Aerial photos and satellite images available for the study islands.
Island DERM
Brisbane DERM
Townsville Geoscience
Australia Schlenker
Mapping Pty LtdSatellite Imagery
Badu 1987 1981 1974 1999 Quickbird 2006
Dauan 1987 1988 1999 Ikonos 2007
Erub 1987 1998 Ikonos 2007
Google Earth 2011
Kiriri 1987 1998 Quickbird 2006
Kubin 1987 1981 1974 1999 Quickbird 2006
Mabuiag 1987 1999 Quickbird 2006
Mer 1974 1979 1988
1998 Quickbird 2006
Muralug Quickbird 2005
Google Earth 2006
Ngurupai 1989 1974 1998 Quickbird 2006
Google Earth 2007
St Pauls 1987 1981 1974 1998 Quickbird 2006
Ugar 1998 Ikonos 2007
Waiben 1973 1974 1998 Quickbird 2006
Folio 370

18
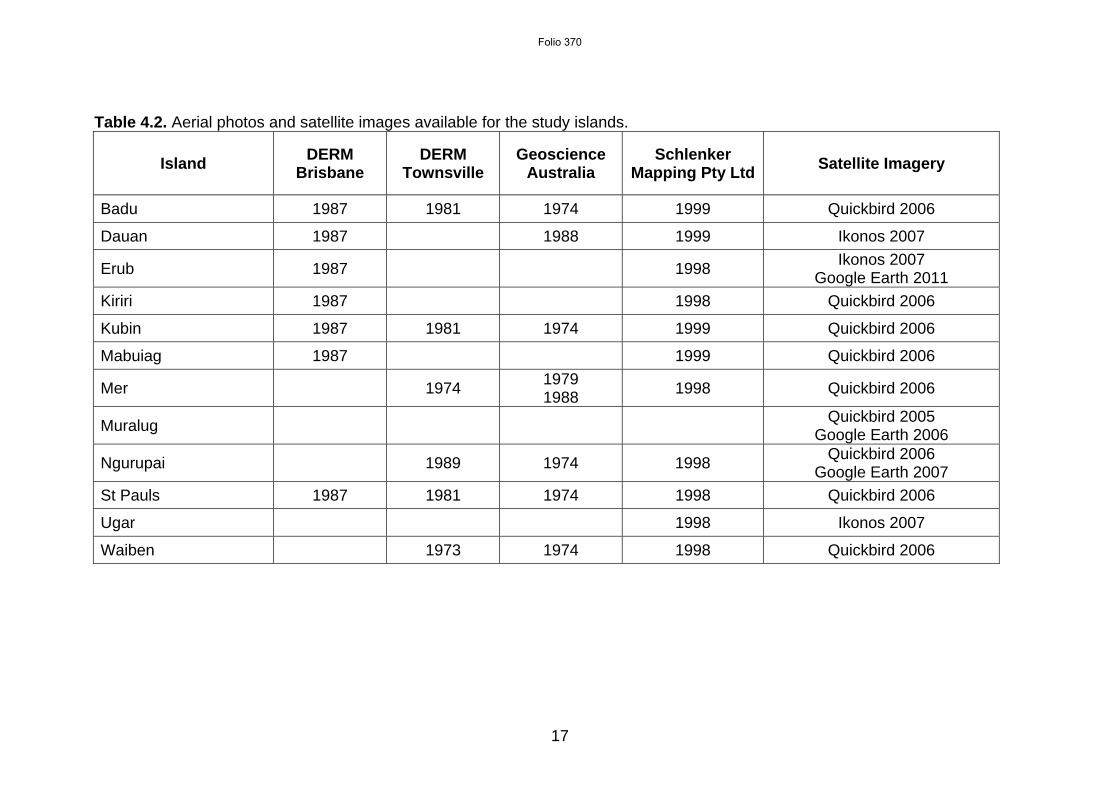
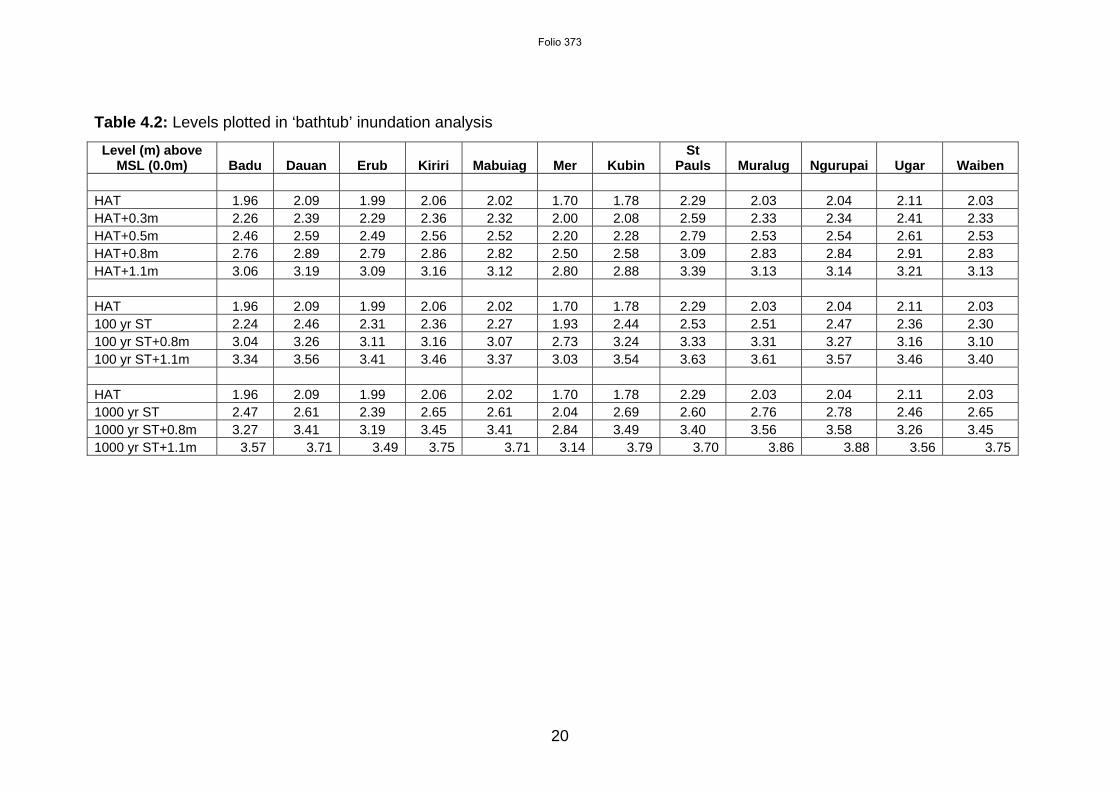
Inundation analysis from LIDAR LIDAR images are used to undertake a simple bathtub analysis of inundation at various sea levels. Definitions are given in Figure 4.3, based on SEA (2011). All levels are based on the analysis presented in SEA (2011). Levels plotted are in three series (Table 4.2) a) HAT, HAT + 0.3m, HAT +0.5m, HAT +0.8m and HAT+1.1m; b) HAT, 100 year storm tide, 100 year storm tide + 0.8m and 100 year storm tide +1.1m; c) HAT, 1000 year storm tide, 1000 year storm tide +0.8m and 1000 year storm tide + 1.1m. The 0.8m level comes from the Queensland State Coastal Plan and the 1.1m level is recommended by the Commonwealth in Department of Climate Change (1999). The storm tide plots are based on current sea-level conditions for 100 year (chance of 1% in any given year) and 1000 year (chance of 0.1% in any given year) return period. Intuitively, these numbers seem quite low, but they incorporate tide levels. The chance of a storm tide occurring at or about HAT is not very high, therefore the 100 year return period levels are often not significantly higher than HAT levels. It is understood that storm tide levels may change under higher sea level conditions, but this cannot be modelled in this study. Also, higher water levels may cause erosion and deposition so that the topographic surface may change. 100 year and 1000 year storm tide levels with 0.8m and 1.1m sea level rises are plotted. For St Pauls and Kubin where LIDAR data are not available, height data derived by Schlenker Mapping using orthophotography are used and corrected by point matching to our data. This is extremely difficult and the resulting analysis must be treated with caution. The data must be re-examined if and when LIDAR data becomes available. TSRA are currently in the process of contracting more extensive mapping of the full extreme water level data as supplied by SEA (2011), based on the LIDAR data. We believe that the height datums used in the LIDAR data, with the exception of Boigu and Saibai, are based on the Spatial Infrastructure Audit AHD heights, although we have not seem that confirmed in writing. Height correlation of the LIDAR data to our data has been undertaken by selecting, for every community with the exception of Boigu and Saibai, a number of points in the study area and undertaking a comparison. For Boigu and Saibai the heights of a number of Permanent Survey Marks (PSMs) were compared to obtain the corrected heights. Corrections were required for four LIDAR data sets. Erub – Add 0.40m to the LIDAR data Mer – Add 0.12m to the LIDAR data Boigu – Subtract 0.58m from the LIDAR data Saibai – Subtract 0.71m from the LIDAR data
Folio 371
19
Expected high tide
Still water level
Wave setup
Mean water level
SurgeHAT
MSL
Storm Tide
Figure 4.3: Definition diagram for inundation mapping.
Folio 372
20
Table 4.2: Levels plotted in ‘bathtub’ inundation analysis
Level (m) above MSL (0.0m) Badu Dauan Erub Kiriri Mabuiag Mer Kubin
St Pauls Muralug Ngurupai Ugar Waiben
HAT 1.96 2.09 1.99 2.06 2.02 1.70 1.78 2.29 2.03 2.04 2.11 2.03 HAT+0.3m 2.26 2.39 2.29 2.36 2.32 2.00 2.08 2.59 2.33 2.34 2.41 2.33 HAT+0.5m 2.46 2.59 2.49 2.56 2.52 2.20 2.28 2.79 2.53 2.54 2.61 2.53 HAT+0.8m 2.76 2.89 2.79 2.86 2.82 2.50 2.58 3.09 2.83 2.84 2.91 2.83 HAT+1.1m 3.06 3.19 3.09 3.16 3.12 2.80 2.88 3.39 3.13 3.14 3.21 3.13 HAT 1.96 2.09 1.99 2.06 2.02 1.70 1.78 2.29 2.03 2.04 2.11 2.03 100 yr ST 2.24 2.46 2.31 2.36 2.27 1.93 2.44 2.53 2.51 2.47 2.36 2.30 100 yr ST+0.8m 3.04 3.26 3.11 3.16 3.07 2.73 3.24 3.33 3.31 3.27 3.16 3.10 100 yr ST+1.1m 3.34 3.56 3.41 3.46 3.37 3.03 3.54 3.63 3.61 3.57 3.46 3.40 HAT 1.96 2.09 1.99 2.06 2.02 1.70 1.78 2.29 2.03 2.04 2.11 2.03 1000 yr ST 2.47 2.61 2.39 2.65 2.61 2.04 2.69 2.60 2.76 2.78 2.46 2.65 1000 yr ST+0.8m 3.27 3.41 3.19 3.45 3.41 2.84 3.49 3.40 3.56 3.58 3.26 3.45 1000 yr ST+1.1m 3.57 3.71 3.49 3.75 3.71 3.14 3.79 3.70 3.86 3.88 3.56 3.75
Folio 373

21
Table 4.3: Levels used for the calculation of sediment volumes needed to raise the community areas and for inundation mapping (Boigu and Saibai). [* In SEA (2010) Saibai HAT is recorded as 3.17. This is clearly a typographical error, the correct value being 2.17].
Level (m) above MSL (0.0m) Boigu Saibai HAT 2.48 2.17* HAT+0.3m 2.78 2.47 HAT+0.5m 2.98 2.67 HAT+0.8m 3.28 2.97 HAT+1.1m 3.58 3.27 HAT 2.48 2.17* 100 year storm tide 2.62 2.26 100 year storm tide + 0.8m 3.42 3.06 100 year storm tide + 1.1m 3.72 3.36 HAT 2.48 2.17* 1000 year storm tide 2.90 2.36 1000 year storm tide + 0.8m 3.70 3.16 1000 year storm tide + 1.1m 4.00 3.46
Folio 374

22
Hydrodynamic measurements Hydrodynamic measurements were made using 2MHz Nortek Acoustic Doppler Current Profilers (ADCP). The instruments were deployed at various positions on the reef flats and lower beaches, with the sites chosen to either generally characteristic the waves and tidal and other currents, or to investigate particular phenomena. The instruments were programmed to record wave parameters and 120 second average current characteristics in 20cm ‘bins’ through the water column. Directions were recorded with respect to magnetic north. Data were processed in Nortek STORM software, with the data being further processed using MATLAB to remove data from periods when the instrument was either exposed or in water too shallow for data to be recorded, to adjust directions to true north, and to output data in a form useful for data interpretation and display.
Figure 4.3: Current meter deployed adjacent to sediment traps. Sediments Sediments were examined in detail at Erub, Mer, Mabuiag and St Pauls. In other places a small number of samples were collected as required. Sediment samples were collected at mid beach level and at a number of other significant locations such as the top of the berm, the toe of beach and on sand fans. These were analysed to determine grain size distribution and calcium carbonate proportion. The grain size distribution was obtained using a rapid sediment analyzer (RSA) where a sediment sub-sample, 10 to 20 grams, is released at the top of a 1.65 high column of water and the time the grains take to reach the bottom measured. The arrival time at the bottom is determined from the output of a balance that weighs the sediment accumulation at the base of the water column. Grains fall at different rates depending on size and density with large dense grains falling fastest, and the fall time can then be related to grain size using known principles. The calcium carbonate proportion of the samples was determined by weighing a sub-sample of 5 to 10 grams and dissolving the calcium carbonate components using hydrochloric acid and reweighing the dried remains. The difference is the calcium carbonate mass and is expressed as a percentage of the starting mass.
Folio 375

23
Photographs On all visits to communities, photographs of the beach area were taken to record features of interest, and systematically record the state of the beach at the time of survey. A selection of the photographs is included in the island reports, highlighting special features and areas of community concern.
Folio 376

24
5. Result summary and adaptation options This document is primarily a summary of methodology. Detailed results are provided in the community reports. However, each community is considered briefly below. Badu Badu has had a seawall along much of the beach for many years. It has provided protection, but has degraded the high tide beach. The seawall is currently in need of repair, particularly in the vicinity of stream mouths. The shoreline is slowly eroding, but only a very few houses are threatened. There are only a few buildings or other infrastructure threatened with inundation, even under the most extreme scenario modelled. There are options presented which relate to the rebuilding of the seawall. There seems to be general acceptance of its benefit to the community. Many of the shoreline problems relate to the seasonal creeks, particularly where they are poorly engineered where they enter the beach. The streams in areas where there is a seawall need to be re-engineered. There are only a few locations where houses are likely to be faced with inundation in the future, and the option to relocate at such time as the houses need replacement is available. Badu is in a relatively strong position with respect to adaptation to climate change. Boigu Boigu is one of the low islands that is already subject to inundation on high tides and during storm events. We did not investigate processes on Boigu as they are well understood. Engineering works have been costed to provide some protection from events that happen now. With respect to the future, asset replacement has been costed, and that can be used to compare relocation of the community to other options. The opinion of probable construction cost totals $103 million. An alternative to relocation is elevating the community or parts of it. Volumes of fill required to elevate the entire community or parts of it have been presented, along with the cost of providing the fill and some discussion of extra costs involved. The cost of providing the fill material (without other rebuilding costs associated with elevation) to raise the community to the 1000year storm tide with 1.1m of sea level rise level is $116 million. An alternative to elevating everything at once is to elevate some of the community, and combine elevation with a change in housing style to provide for a higher population density in a smaller number of well protected areas. Boigu is one of the two most threatened communities with respect to climate change. Although short term options are already being considered and have been costed, longer term adaptation strategies are drastic and need immediate discussion and plans made in the relatively near future.
Folio 377
25
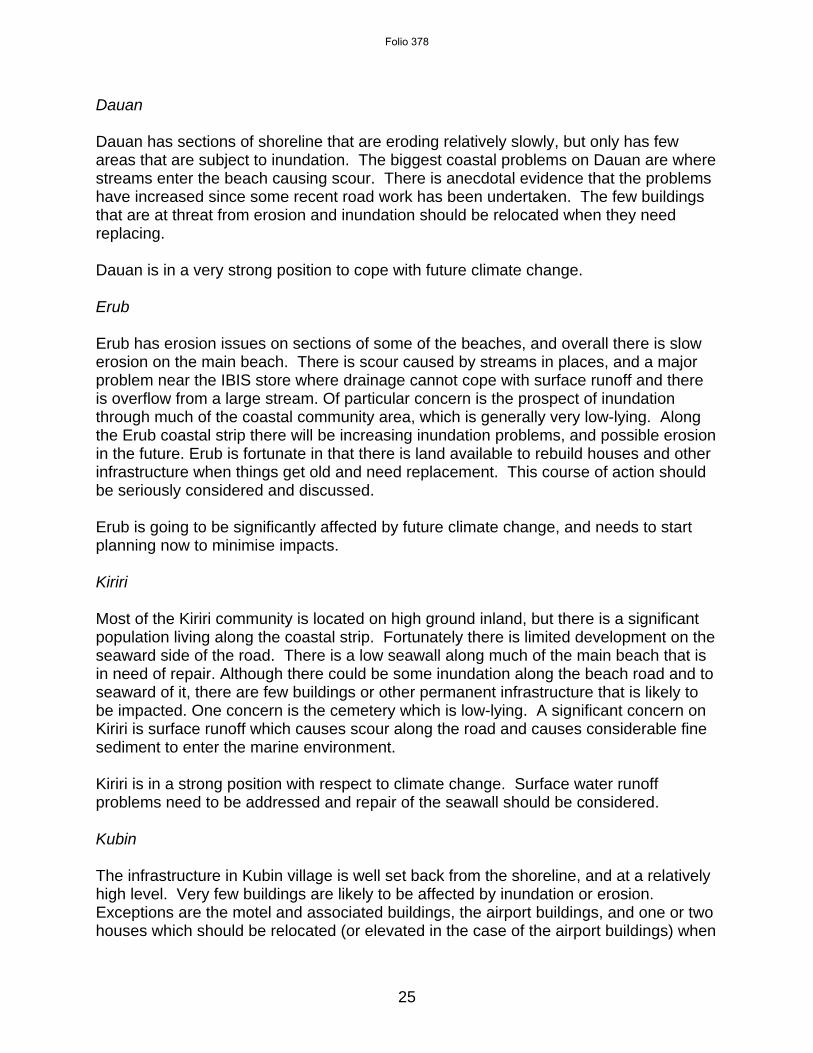
Dauan Dauan has sections of shoreline that are eroding relatively slowly, but only has few areas that are subject to inundation. The biggest coastal problems on Dauan are where streams enter the beach causing scour. There is anecdotal evidence that the problems have increased since some recent road work has been undertaken. The few buildings that are at threat from erosion and inundation should be relocated when they need replacing. Dauan is in a very strong position to cope with future climate change. Erub Erub has erosion issues on sections of some of the beaches, and overall there is slow erosion on the main beach. There is scour caused by streams in places, and a major problem near the IBIS store where drainage cannot cope with surface runoff and there is overflow from a large stream. Of particular concern is the prospect of inundation through much of the coastal community area, which is generally very low-lying. Along the Erub coastal strip there will be increasing inundation problems, and possible erosion in the future. Erub is fortunate in that there is land available to rebuild houses and other infrastructure when things get old and need replacement. This course of action should be seriously considered and discussed. Erub is going to be significantly affected by future climate change, and needs to start planning now to minimise impacts. Kiriri Most of the Kiriri community is located on high ground inland, but there is a significant population living along the coastal strip. Fortunately there is limited development on the seaward side of the road. There is a low seawall along much of the main beach that is in need of repair. Although there could be some inundation along the beach road and to seaward of it, there are few buildings or other permanent infrastructure that is likely to be impacted. One concern is the cemetery which is low-lying. A significant concern on Kiriri is surface runoff which causes scour along the road and causes considerable fine sediment to enter the marine environment. Kiriri is in a strong position with respect to climate change. Surface water runoff problems need to be addressed and repair of the seawall should be considered. Kubin The infrastructure in Kubin village is well set back from the shoreline, and at a relatively high level. Very few buildings are likely to be affected by inundation or erosion. Exceptions are the motel and associated buildings, the airport buildings, and one or two houses which should be relocated (or elevated in the case of the airport buildings) when
Folio 378
26
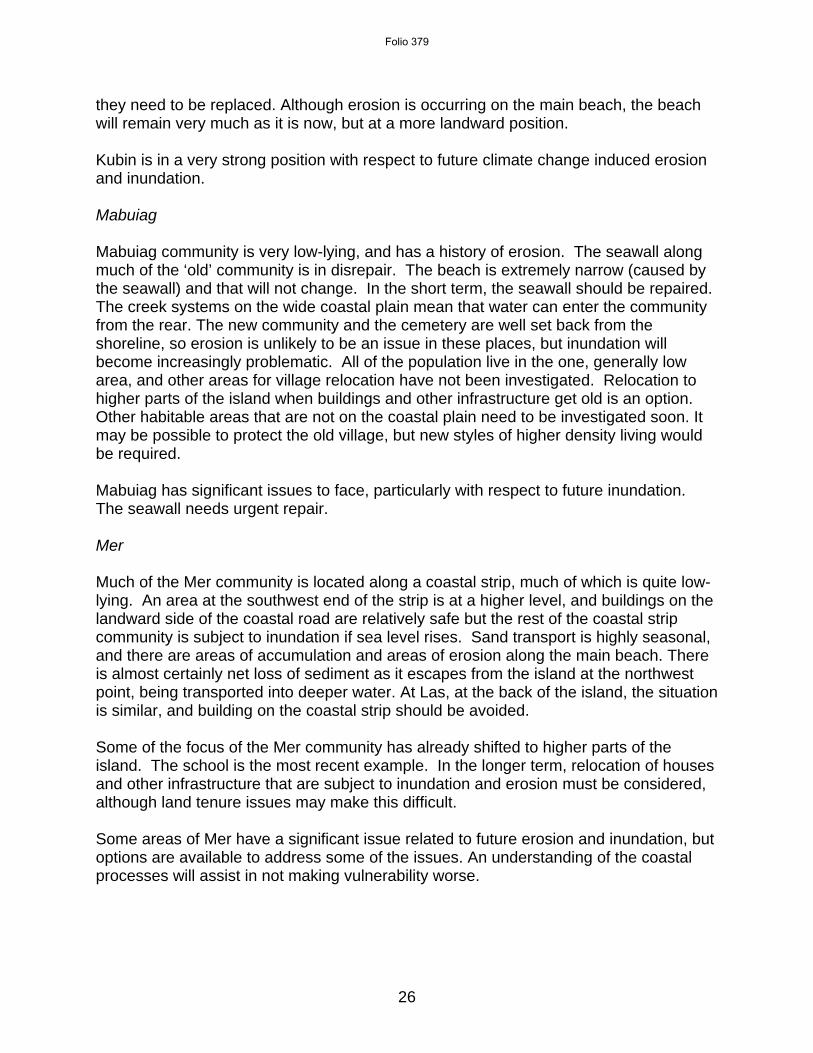
they need to be replaced. Although erosion is occurring on the main beach, the beach will remain very much as it is now, but at a more landward position. Kubin is in a very strong position with respect to future climate change induced erosion and inundation. Mabuiag Mabuiag community is very low-lying, and has a history of erosion. The seawall along much of the ‘old’ community is in disrepair. The beach is extremely narrow (caused by the seawall) and that will not change. In the short term, the seawall should be repaired. The creek systems on the wide coastal plain mean that water can enter the community from the rear. The new community and the cemetery are well set back from the shoreline, so erosion is unlikely to be an issue in these places, but inundation will become increasingly problematic. All of the population live in the one, generally low area, and other areas for village relocation have not been investigated. Relocation to higher parts of the island when buildings and other infrastructure get old is an option. Other habitable areas that are not on the coastal plain need to be investigated soon. It may be possible to protect the old village, but new styles of higher density living would be required. Mabuiag has significant issues to face, particularly with respect to future inundation. The seawall needs urgent repair. Mer Much of the Mer community is located along a coastal strip, much of which is quite low-lying. An area at the southwest end of the strip is at a higher level, and buildings on the landward side of the coastal road are relatively safe but the rest of the coastal strip community is subject to inundation if sea level rises. Sand transport is highly seasonal, and there are areas of accumulation and areas of erosion along the main beach. There is almost certainly net loss of sediment as it escapes from the island at the northwest point, being transported into deeper water. At Las, at the back of the island, the situation is similar, and building on the coastal strip should be avoided. Some of the focus of the Mer community has already shifted to higher parts of the island. The school is the most recent example. In the longer term, relocation of houses and other infrastructure that are subject to inundation and erosion must be considered, although land tenure issues may make this difficult. Some areas of Mer have a significant issue related to future erosion and inundation, but options are available to address some of the issues. An understanding of the coastal processes will assist in not making vulnerability worse.
Folio 379

27
Muralug There are a number of small communities on Muralug, and we only considered the largest of these, Front Beach, in detail. There is little service infrastructure on the island, and most houses are reasonably well set back so that erosion should not be an issue. Only a very few houses, but also a number of undeveloped plots of freehold land, are subject to future inundation, and these should either not be built on, or built in such a way as to minimise inundation impacts in the future. Muralug is a very small community in a good position to withstand climate change impacts. However, the freehold tenure may introduce pressures that are not the case elsewhere. Ngurupai The Ngurupai community is mainly located around the jetty area. There are small beaches on either side of the jetty, and these are relatively stable, being supported in part by their proximity to the jetties. Inundation, however, is an issue for the future, and many of the houses and other infrastructure on the seaward side of Outie Street is at risk. Most of the land is in freehold title so moving when buildings get old is problematic. The jetty area is also a major service area for the entire Torres Strait region, so disruption can have serious flow on effects. Ngurupai has a number of issues associated with future inundation that need to be addressed. Saibai Like Boigu, Saibai is one of the low islands that is subject to inundation on high tides and during storm events now. We did not investigate processes on Saibai as a lot of work has been done previously and the options for adaptation are well understood. Engineering works have been costed to provide some protection from events that happen now. With respect to the future, asset replacement has been costed, and that can be used to compare relocation of the community to other options. The opinion of probable construction cost totals $125 million. An alternative to relocation is elevating the community or parts of it. Volumes of fill required to elevate the entire community or parts of it have been presented, along with the cost of providing the fill and some discussion of extra costs involved. The cost of providing the fill material (without other rebuilding costs associated with elevation) to raise the community to the 1000year storm tide with 1.1m of sea level rise level is $155 million. An alternative to elevating the whole community simultaneously is to elevate sections of the community, and combine elevation with a change in housing style to provide for a higher population density is a smaller number of well protected areas. Saibai is one of the two most threatened communities with respect to climate change. Although short term options are already being considered and have been costed, longer
Folio 380

28
term adaptation strategies are drastic and need immediate discussion and plans made in the relatively near future. St Pauls Erosion is an issue along two areas of the main beach, but in neither case are there buildings likely to be affected. In the case of the northern section of erosion, a beach road is threatened, but there is the possibility of it moving inland to accommodate the erosion. At the southern end of the beach, the erosion problem is caused by excavation behind the dune. The issue is serious, and needs to be addressed, but the solution is relatively simple (restore the previous morphology). There are very few building subject to inundation as most of the community is set on higher ground. A concern is the old part of the cemetery, where inundation will occur. St Pauls community is in a very good position with respect to future climate change related erosion and inundation. Ugar Ugar is a very steep island with only a few areas close to sea level. The area around the jetty (that also has a church and the IBIS store, and a single house) is subject to future inundation, and erosion is of concern to the north of the jetty. There are few issues that need to be addressed on Ugar, but the historic church building is in danger. There are few options available to protect it from inundation, although it could be protected from erosion. On the back beach, there is some concern for a burial area that is already eroding (very slowly) and exposing human remains. Although these could be protected by a wall of some sort, reburial also needs to be considered. Ugar is in a very strong position with respect to future climate change effects Waiben Waiben, or Thursday Island, is the main administrative centre of the region. We concentrated on the main beach and Bayo Beach, immediately to the northwest of the main beach. The main beach is entirely protected by a well maintained seawall. Bayo Beach is natural, is stable, and buildings are well set back. Inundation is already occurring on a small section of Victoria Parade, and this will get worse into the future, with a number of buildings, including offices and hotels, likely to be affected. Inundation protection is possible, but must be designed in conjunction with storm water runoff systems. The Waiben foreshore area will have increased inundation in the future, but the infrastructure already in place is a good basis for future improvements, and the importance of the area and infrastructure means that engineered solutions are likely to be implemented.
Folio 381

29
6. Regional adaptation considerations There are a range of issues that affect all communities to different degrees. These are: Acknowledgement of the problem, and participation in a solution It is very important that the people in the community understand some things about climate change and the future, particularly being a community near the coast. The people of Torres Strait have a specific set of problems, associated with isolation, costs of living in the area, and being a coastal people. However, similar problems are faced by many people in Australia and around the world. All Australians need to be prepared to participate in trying to solve the problem, and every person has a role to play. We encourage people to talk about the things raised in this report, and give feedback to the community leaders and to us. Understanding the problem Talk of climate change related problems often leads to unnecessary fear. Climate change problems do not happen overnight, and not all natural hazards are caused by climate change. We know that storms, floods, tsunami, fires and other hazards happen now. It is possible that some of these things may get more frequent or worse in the future. We have some time to plan and to try to solve some of the problems over the years to come. However, if big decisions are being made, then they need to be made quite soon. We should not panic, but we need to start planning and doing things now. Not building new things in vulnerable places We must avoid whenever possible building new houses or other infrastructure in areas that have been identified as vulnerable, unless they are absolutely essential and we are willing to pay the extra cost to protect them and/or acknowledge that they may only have a short useful life. Replacing infrastructure Before any building or other infrastructure is rebuilt when it gets old and needs replacing, we must think about whether the location is likely to be affected by erosion or inundation. If it is, we must find another place for that building or infrastructure, or have some other plan in place to deal with the issue. Over time, buildings near the beach and in low areas need to be replaced with buildings on higher ground. This is not easy because people may be required to move from family lands, and there will be issues of land ownership and traditional rights that the community will need to work through. These issues can only be worked out in the community.
Folio 382

30
Shoreline management We like beaches that look natural and cared for, and even when a beach is eroding, if we do not put a seawall along it, it will still have dry sand at high tide that people can enjoy. We must manage our natural beaches by preserving vegetation, managing vehicle tracks and not taking sand from the beach. We don’t like seeing beaches erode but where erosion is happening, and nothing is being affected, we need to recognise that that is OK and concentrate our efforts where there is a real problem. Other solutions Occasionally there are other ideas that need to be thought about. In some areas, where there is a good sand supply nearby, beach renourishment (putting sand back on the beaches) is an option. Sand renourishment, if it can be done cost effectively, is almost always a good option as it has few negative consequences. The biggest problem is finding sand that can be used, and covering the cost of getting it to the problem area. Cost of work Unfortunately most actions, particularly those that involve building things like seawalls or elevating ground, cost a lot of money. The people of Torres Strait, and indeed Australia, need to work together to prioritise what needs to be done. There will never be unlimited money to deal with all the problems, so it is important that the community prioritises things that are important to the community, even though everybody might not agree.
Folio 383

31
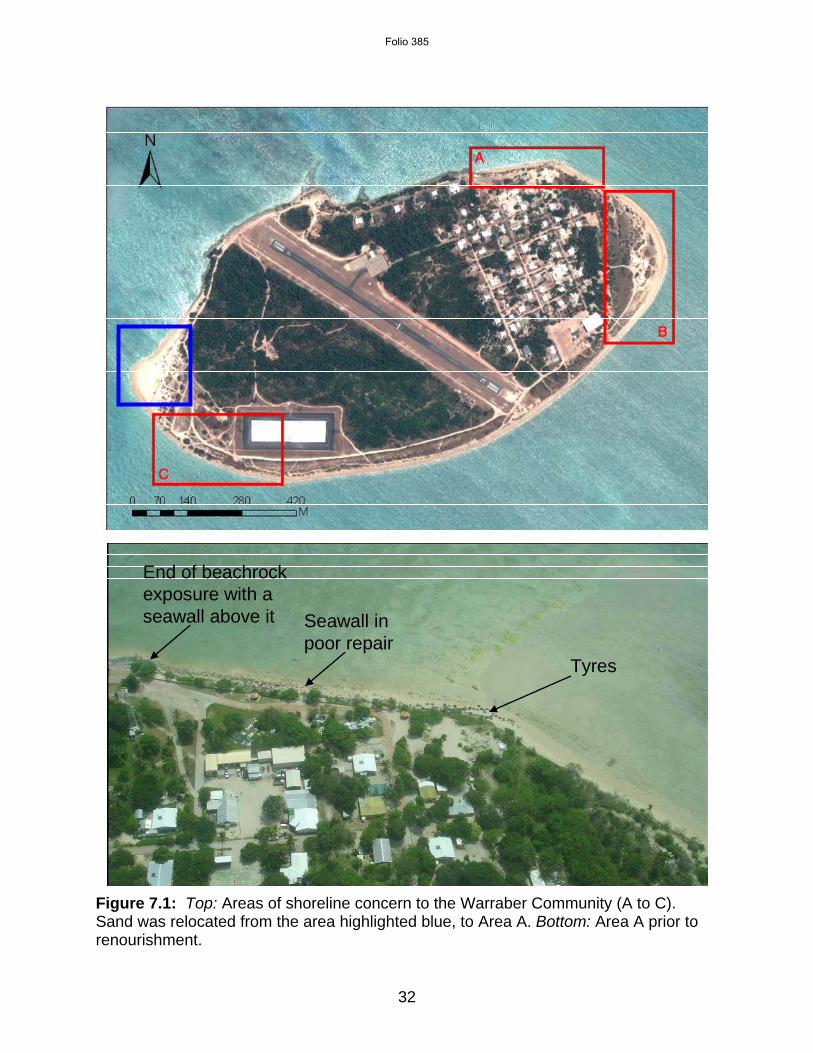
7. Summary of other work undertaken Warraber Prior to the high tides over the period January – March 2011, the Warraber community decided to undertake some limited sand relocation to provide protection to an area near the village (around the proposed new church site) subject to significant inundation and erosion (Area A in Figure 7.1). This area was one of three areas on the island of particular concern to the community. The Warraber Coastal Management Plan noted:
“In relation to Area A (the northeastern corner) the community wishes to build a new higher wall extending from the end of the permanent wall on the beachrock, (at about the height of the wall to the west) around the corner past the tyres, anchoring the wall by taking it inland at the end. In combination with berm maintenance to the east, this would provide protection from flooding. However, it would mean the beach would degrade, and it is likely that there would be little or no dry sand between the wall and the reef flat. Erosion may accelerate, for a period of time, to the east of the end of the wall.”
As a temporary measure, until the desired shoreline projection project is undertaken, the TSIRC provided resources to undertake sand relocation, from the area marked in blue in Figure 7.1, to Area A (figure 7.2). Warraber is, in the long term, rotating clockwise, with areas of sand deposition at the eastern and western extremities, and areas of erosion on the north-eastern and south-western corners of the island. As the northern shore of Warraber consists of beachrock with little sand, and a channel disrupts sand transport along the northern shore from the west, sand extraction from the extraction site would not cause any adverse effects, and it was therefore an excellent location from which to extract sand for the renourishment of eroding areas. The exact amount of sand relocation is not known. Geo-textile cloth was to be placed over the relocated sand to assist to keep it there, but this did not happen due to a supply issue. We were asked by the Councillor and TSRA to inspect the work at a time of high-tides. We visited Warraber from 20-23 January 2011, while sand relocation was still ongoing, particularly to comment on the effects of removing sand from the extraction area. Sand was clearly being removed from the deposit area by natural processes, but there was no doubt that protection to a low lying and vulnerable part of the shoreline was occurring, both with respect to erosion and inundation. The amount of material removed from the extraction area was small in comparison to the accumulation that had occurred over the past decades (see Parnell et al, 2010), and no adverse effects were envisaged. Although the sand relocation was a temporary measure only, it provided some protection over the 2011 high tide period, and, we understand from the community, that it also remained in place over the 2012 summer high tide period.
Folio 384
32
End of beachrock exposure with a seawall above it
Tyres
Seawall in poor repair
Figure 7.1: Top: Areas of shoreline concern to the Warraber Community (A to C). Sand was relocated from the area highlighted blue, to Area A. Bottom: Area A prior to renourishment.
Folio 385

33
Figure 7.2: Warraber sand relocation, receiving area (a,b), extraction area (c,d). Poruma A sewerage scheme is planned to be constructed on Poruma. On 5 April 2011 a community meeting was held to discuss the project and address concerns that had been expressed in the community. Having worked on some of the issues of concern in the past, and being known to most members of the community, Kevin Parnell was asked to attend by the community, the contractor (AECOM) and the TSRA, and provide advice to the meeting as requested. A number of the concerns related to coastal erosion. TSRA used the opportunity to provide a cost estimate to construct the seawall on the southwest shore of the island adjacent to the resort area, in the area of most concern to the community with respect to erosion (Figure 7.3). Kevin Parnell provided advice to the engineer based on a previous study of Poruma. The Poruma Coastal Management Plan noted, in relation to the southern shore by the resort, that the community:
a. Wishes to take action to stop the erosion as soon as possible, and not wait any longer to see if the process of erosion is naturally halted or reversed.
Folio 386

34
b. Believe that beach renourishment from off-reef sand sources should be investigated as an immediate priority to maintain a sandy beach in this area.
c. Recognizes that if beach nourishment from off-reef sand sources proves to be unviable some sort of hard structure (seawall) in the vicinity of the resort may be necessary to stop the erosion in the longer term, and would like:
any structure to be sloping rather than vertical so that access to the beach would be maintained, and
that this structure should extend from the beachrock to the east, around the corner to tie off into the sand spit.
d. Understands that as a consequence of the construction of a seawall there is unlikely to be dry sand in front of a seawall when the tide is above the level of the reef flat.
e. Will undertake a re-vegetation program on the sand spit and NW corner of the island to help stabilize recent to sand accumulation in this area.
A report by AECOM provides possible designs and costs for two options; a 310m long seawall extending from the beachrock to the east, and a shorter 100m option. The 310m long option was preferred.
Folio 387
35
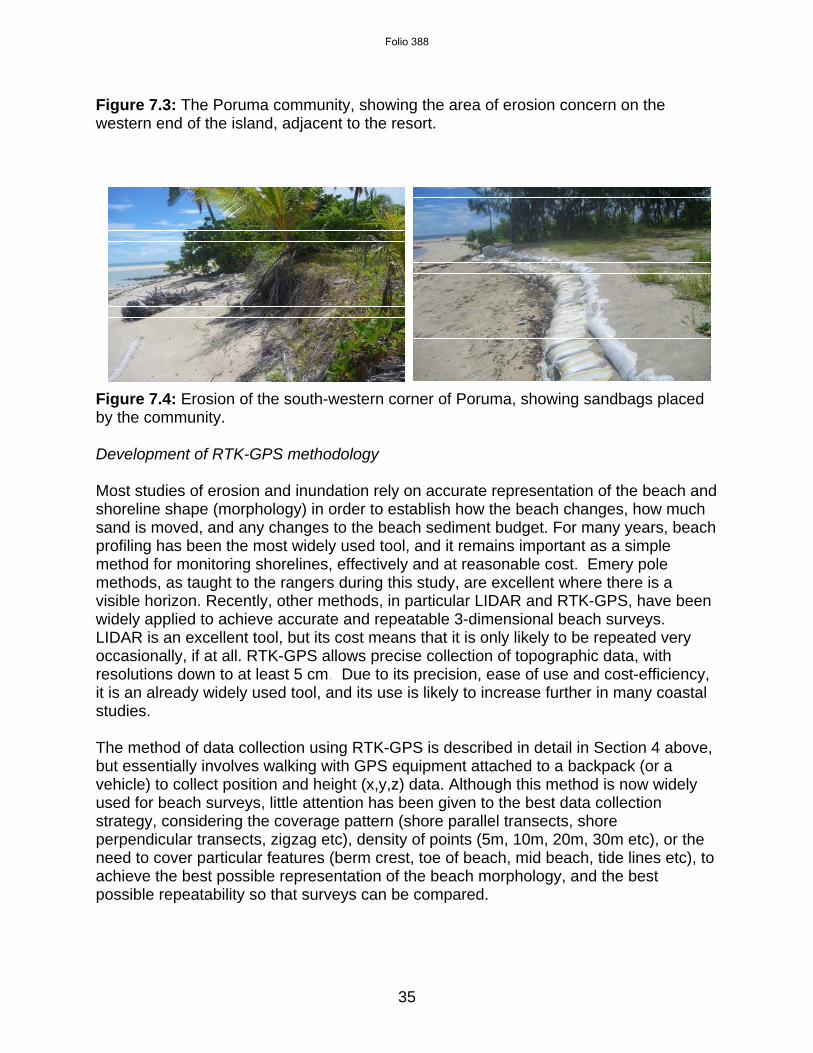
Figure 7.3: The Poruma community, showing the area of erosion concern on the western end of the island, adjacent to the resort.
Figure 7.4: Erosion of the south-western corner of Poruma, showing sandbags placed by the community. Development of RTK-GPS methodology Most studies of erosion and inundation rely on accurate representation of the beach and shoreline shape (morphology) in order to establish how the beach changes, how much sand is moved, and any changes to the beach sediment budget. For many years, beach profiling has been the most widely used tool, and it remains important as a simple method for monitoring shorelines, effectively and at reasonable cost. Emery pole methods, as taught to the rangers during this study, are excellent where there is a visible horizon. Recently, other methods, in particular LIDAR and RTK-GPS, have been widely applied to achieve accurate and repeatable 3-dimensional beach surveys. LIDAR is an excellent tool, but its cost means that it is only likely to be repeated very occasionally, if at all. RTK-GPS allows precise collection of topographic data, with resolutions down to at least 5 cm. Due to its precision, ease of use and cost-efficiency, it is an already widely used tool, and its use is likely to increase further in many coastal studies. The method of data collection using RTK-GPS is described in detail in Section 4 above, but essentially involves walking with GPS equipment attached to a backpack (or a vehicle) to collect position and height (x,y,z) data. Although this method is now widely used for beach surveys, little attention has been given to the best data collection strategy, considering the coverage pattern (shore parallel transects, shore perpendicular transects, zigzag etc), density of points (5m, 10m, 20m, 30m etc), or the need to cover particular features (berm crest, toe of beach, mid beach, tide lines etc), to achieve the best possible representation of the beach morphology, and the best possible repeatability so that surveys can be compared.
Folio 388

36
As part of this project, an experimental study was conducted in order to develop guidelines for representative and efficient beach surveys using this technology. It was based on exploring the relationships between different surveying patterns and the volume and elevation characteristics of the resulting 3D models created in the GIS environment. Over a period of 3 days in July 2011, topographic data was collected at high density (1m transects) using RTK-GPS on a section of the main beach on the island of Mabuiag. The site was selected as it is typical of many beaches in the area, yet morphologically complex, incorporating an intertidal reef flat, a creek mouth and delta (not active at the time of the survey, but retaining some water), an alluvial fan and supratidal berms or low dunes. Overall, 33 386 x,y,z points were collected, covering an area of approximately 2.25 ha. This data was processed and converted into a GIS shapefile (as described in the Methodology section above), then it was interpolated to create a regular point grid at 1m resolution (using the Inverse Distance Weighted (IDW) method, which produced the best accuracy compared to other interpolation methods tested). This 1m grid dataset became the reference dataset for the study. In the next step, a number of experimental datasets were derived from this reference dataset, at a range of coverage patterns (grid, shore-parallel, shore-normal and zigzag) and resolutions (7m, 14m and 21m), with and without the addition of surveyed feature lines representing the main topographic features present in the study site, these being the berm crest, vegetation line and toe of beach. The 14m datasets in all coverage pattern groups also included additional datasets which had only 1 feature line added at a time, to observe the specific effect of adding each individual feature. Also, a separate group of 4 datasets was created on the basis of combination of feature lines (berm crest, vegetation line, toe of beach plus a mid-beach line) to observe the efficiency of a feature-focused approach to data collection. In total, 40 datasets were created. From each dataset, a TIN model was built (clipped to a uniform study area extent), its volume was calculated above a uniform reference height, and compared to the volume of a TIN built from the reference dataset. Further, the TINs were converted to raster (at 1m resolution) and elevation analyses were performed, comparing the resulting 3D surfaces to the raster of the reference dataset. The main conclusion of the study was that achieving an accurate 3D representation of beach topography with RTK-GPS collected data is most dependent on the degree of the topographic detail captured by the survey, particularly with respect to the most important topographic features of the site. While density of data collection has proven to be a critical factor in ensuring an accurate topographic representation, the effectiveness of applying a uniform density over the entire study area is conditioned by the degree of topographic variability present, and whether it is able to adequately represent the most topographically prominent features of the site. In the elevation difference images produced, it is clear that the same density applied throughout the study area does not produce the same elevation outcome everywhere. While the lower, flatter areas of the beach are adequately covered even by the 21m datasets, the areas of greatest topographic variability, along the berm and in the creek mouth area, invariably perform more poorly (and worse with each decrease in density). (Figures 7.5 to 7.7) Therefore, it is not a particular data density per se that ensures accurate representation, but a range
Folio 389

37
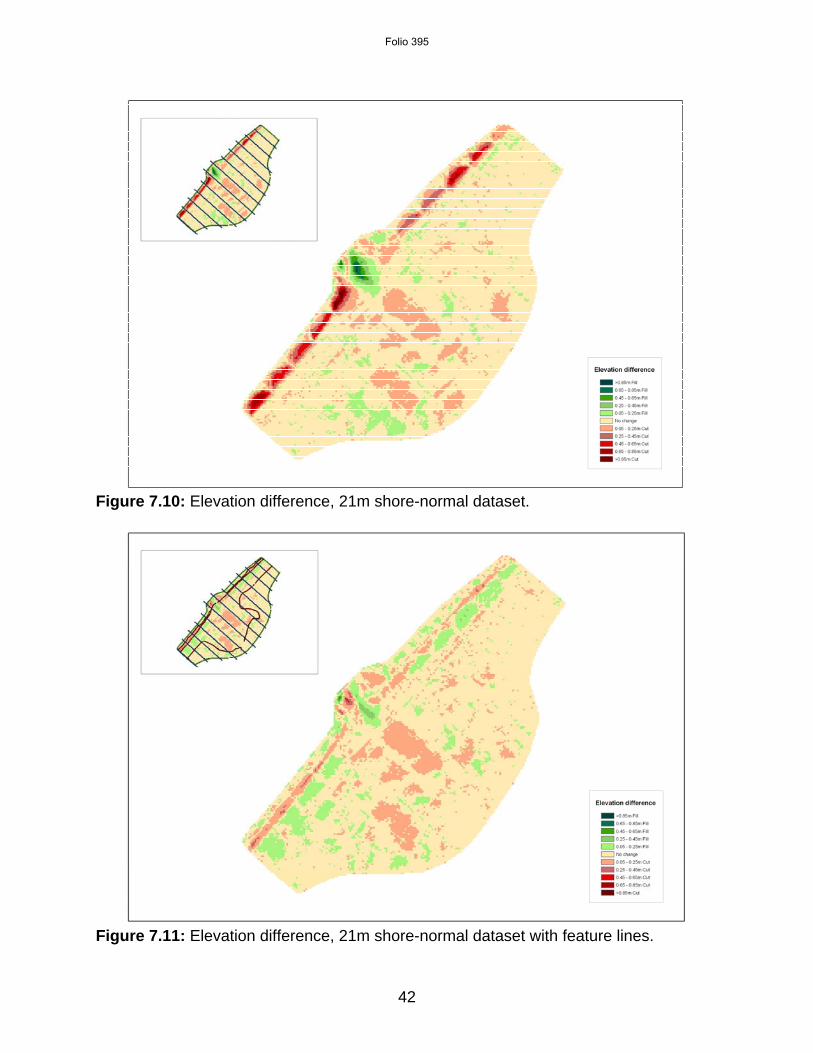
of different data densities devised to capture different levels of topographic variability, and complemented by an appropriate pattern of data collection. The pattern of data collection has also been shown to have an influence on the accuracy of resulting elevation models. While grid patterns that provide both shore-normal and shore-parallel data have the best performance, a satisfactory coverage can be achieved more efficiently with lines or zigzags, provided that their placement, direction and spacing responds to the location and orientation of, and variations present within, the topographic features. The importance of such correspondence was particularly obvious when comparing the performance of shore-parallel and shore-normal datasets. While shore-parallel lines, especially at lower densities of 14 and 21m (Figures .7.6 and 7.7) fail to achieve an adequate articulation of the berm (which, at 21m resolution, falls almost completely between the coverage lines and appears as a continuous strip of severe cut in the elevation difference analysis), the shore-normal lines, running perpendicularly to this feature, manage to maintain the overall berm shape at 7m (Figure 7.8) and 14m (Figure. 7.9) resolution, and even at 21m the distortion in the berm area is not so significant and continuous (Figure 7.10). This better performance is clearly conditioned by the fact that in this particular setting a shore-normal approach to surveying is better suited to capture the specific topographic variation present, and the outcome would have likely been different for a study site with different characteristics, for example, with no pronounced berm but a creek channel crossing the beach, in which case a shore-normal survey, unless it was specifically tailored to capture the channel features, would probably be less efficient than a shore-parallel survey. Depending on the characteristics of study site, a combination of survey layouts may be necessary. However, as density of coverage is reduced, providing both shore-normal and shore-parallel coverage, at least in areas of high topographic variability, is important for achieving accurate 3D representation. Therefore density and pattern of data collection must be considered together when designing a survey that can best respond to, and capture, the topographic features of a particular environment. The best results, however, are obtained by modelling datasets where pattern data is combined with feature line data (berm crest, vegetation line and toe of the beach). Elevation accuracy of these datasets is dramatically improved across all dataset groups compared to the pattern-only datasets. In many cases they produced elevation outcomes comparable to, or even better than, those of pattern-only datasets with higher density within the same group. In the elevation difference analyses, it is obvious that inclusion of the features significantly improved representation of the topography of the site and its most important feature, the berm. The biggest improvement is observed in datasets with lower density, 21m in particular, where the feature lines compensate quite successfully for the sparser coverage (for example, Figure 7.10 compared to Figure 7.11). Additionally, these lines (and their changes over time) also communicate valuable information about beach dynamics, and they are therefore an important part of an efficient survey design for beach monitoring.
Folio 390

38
Based on the findings, the following recommendations for survey design that would enable accurate and repeatable 3D representation of topographically complex, low-relief beach environments (and potentially other landform types) have been developed:
Survey design should consider, and respond to, the topographic characteristics of the site, at the level of detail required by the objectives of the study and the resources available. The density of coverage should be proportionate to the degree of topographic variability, aiming to capture all significant changes in topography. Where topography varies, different data densities can be used, with more focus on topographically varied areas and sparser coverage in other areas. While grid coverage appears to be the most efficient survey pattern, it should be possible to achieve a satisfactory result with less labour and survey time as long as the chosen pattern is tailored to enable a comprehensive representation of the dominant topographic features. For example, if there is a continuous, prominent berm, a survey that goes across the feature (shore-normal) produces a more accurate result at lower densities than a survey that goes that goes along it (shore-parallel). As the overall density of coverage diminishes, the importance of such tailoring becomes more crucial.
Inclusion of feature lines, which capture and preserve the dimensions of the main topographic features, can significantly enhance the accuracy of resulting models. Apart from their clear contribution to elevation and volume accuracy, feature lines and changes in them communicate, in their own right, valuable information about beach dynamics which is important for a meaningful beach monitoring program.
For repeated surveys, maintaining the same 2D extent of the study area is important. This can be achieved by using the same “study area” clip applied to all datasets, and, /or including real or artificial “border” data. This will ensure that datasets from each consecutive survey have the same 2D extent, that elevation changes at the edges of the site are captured, and volume data is not compromised by calculating this derivative over a different area in each survey. Also, particularly when lower density coverage is used, and /or the site exhibits continuous topographic variation, it is advisable to keep the placement of survey lines the same, as varying these even within the same model can lead to a modified elevation representation (and its derivatives) (this effect is demonstrated in Figure 7.12) and distort representation of true topographic change in time-series of models.
Last but not least, an awareness of the characteristics of the GIS modelling method that will be used to create models from the collected data, and understanding of how these characteristics relate to achieving the objectives of a study, are helpful in designing a successful survey. While a detailed analysis of this issue was beyond the scope of this study, it has become obvious in its course that the choice of GIS modelling method has implications for how the collected data is modelled into a 3D surface and therefore for the topographic accuracy of the representation. Although modelling occurs following data collection, understanding how the modelling processes and analyses work in both TIN and raster data environments can inform the survey design with respect
Folio 391

39
to input data density, distribution and other factors so that an optimum result can be achieved in the context of the objectives of a particular study.
As a final step, a number of sample datasets and models were created to demonstrate how the above findings could be incorporated into the design of an efficient survey for the subject site. These topography-tailored approaches yielded satisfactory volume and elevation outcomes. This demonstrated that time spent developing a good data collection strategy for a particular site can reduce the time and effort required for the survey, without reducing the quality of the subsequently modelled products and analyses.
Figure 7.5: Elevation difference, 7m shore-parallel dataset.
Folio 392

40
Figure 7.6: Elevation difference, 14m shore-parallel dataset.
Figure 7.7: Elevation difference, 21m shore-parallel dataset.
Folio 393

41
Figure 7.8: Elevation difference, 7m shore-normal dataset.
Figure 7.9: Elevation difference, 14m shore-normal dataset.
Folio 394
42
Figure 7.10: Elevation difference, 21m shore-normal dataset.
Figure 7.11: Elevation difference, 21m shore-normal dataset with feature lines.
Folio 395

43
Column A Column B Figure 7.12: Variations in raster elevation (top) and resulting elevation difference, compared to the reference dataset (middle), caused by changing placement of survey lines (bottom) for the 21m shore-parallel dataset.
Folio 396

44
8. Conclusion The degree of vulnerability to future climate change driven erosion and inundation varies significantly between the communities. All communities have issues, but some will be affected only to a minor degree. Almost all communities are likely to experience higher rates of erosion, at least in some locations, and although people do not like seeing erosion take place, there is little that can be done, or needs to be done. In some places, seawalls are already in place, with most needing repair. We have found little enthusiasm for removing seawalls and restoring a natural coastline. With respect to inundation, Boigu and Saibai are without doubt the most vulnerable, experiencing significant inundation events now. Others have problematic, but less serious inundation. Other communities, particularly Erub, Mabuiag and Mer are going to be badly affected if sea level rises. It is important to remember that the central island communities of Iama, Poruma, Warraber and Masig have already been studied and Coastal Management Plans already exist for those communities. These communities are also amongst the group of most vulnerable to the effects of climate change. Climate change effects are insidious rather than directly confrontational. Unlike other natural hazards where the effects are immediately obvious, climate change related hazards allow us time to plan. It is important, however, than planning gets under way now, and that we do not leave it too late because the changes we see are gradual, perhaps punctuated by events that remind us that something is happening. It is equally important that we do not panic, because, although people will be inconvenienced by events that may be climate change related, they are not going to be put in immediate danger because of them. We hope that this study will be catalyst for discussion in the communities, and that Coastal Management Plans will be in place for every community by June 2013. .
Folio 397
45
9. References AECOM. 2011. Inundation management on Saibai, Boigu and Iama Islands: Seawalls and drainage. Report prepared for the Torres Strait Regional Authority. Andrews B, Gares P and Colby J. 2002. Techniques for GIS modeling of coastal dunes, Geomorphology 48, 289-308 Arthur B. 2007. An assessment of the CRC Torres Strait. Report prepared for the CRC Torres Strait. Department of Climate Change. 2009. Climate Change Risks to Australia’s Coast: A first pass national assessment, Department of Climate Change, Australian Government, Canberra. Department of Environment and Resource Management. 2012. Queensland Coastal Plan. Queensland Government, Brisbane. Duce SJ, Parnell KE, Smithers SG and McNamara KE. 2010. A synthesis of climate change and coastal science to support adaptation in the communities of the Torres Strait. Synthesis report prepared for the Marine and Tropical Sciences Research Facility (MTSRF). Reef & Rainforest research Centre Limited, Cairns, 64pp., ISBN 978-1-921359-53-8 Environment Protection Agency (EPA). 2006a. Boigu Island: rapid assessment of shoreline erosion and management recommendations. Report prepared for the Torrs Strait Regional Authority. Environment Protection Agency (EPA). 2006b. Saibai Island: rapid assessment of shoreline erosion and management recommendations. Report prepared for the Torrs Strait Regional Authority Gordon A. 2007. Saibai coastal and infrastructure management, including seawall and village inundation McNamara KE, Smithers SG, Westoby R and Parnell KE. 2011. Limits to adaptation: Limits to climate change adaptation for two low-lying communities in the Torres Strait. Final report to the National Climate Change Adaptation Research Facility. Milne JA and Sear DA. 1997. Modelling river channel topography using GIS. International Journal of Geographical Information Science 11(5), 499-515. Parnell KE, Smithers SG and Duce SJ. 2010. Coastal erosion and inundation in the central island group (Masig, Poruma, Warraber and Iama), Torres Strait: Science supporting adaptation. Unpublished technical report prepared for the Marine and Tropical Sciences Research Facility (MTSRF). Reef & Rainforest Research Centre Limited, Cairns, 141pp. Suppiah R, Bathols J, Collier M, Kent D and O’Grady J. 2010. Observed and future climates of the Torres Strait region. CSIRO, Canberra.
Folio 398

46
Sustainable Land Use Plans (SLUP). 2010. Torres Strait sustainable land use plans: 2010 Island Reports. Reports prepared by RPS Group, Cairns. Systems Engineering Australia (SEA). 2011. The Torres Strait Extreme Water Level Study, Report prepared for the Torres Strait Regional Authority Torres Strait Regional Authority. 2010. Torres Strait Climate Change Strategy 2010-2013. Report prepared by the Torres Strait Coastal Management Committee, TSRA.
Folio 399