Embed Size (px)
Citation preview

Overview Saudi Arabia will see 1.2 million barrels per day (mbpd) of new refining capacity come online by 2020. This includes the Satorp refinery, which is already up and running, and the Yasref refinery, which will start up in Q4 2014. This major investment in downstream sector by the Kingdom coincides with a huge growth in modern refineries in countries such as India and China, which will add around 7 mbpd of highly complex capacity globally by the end of the decade. The purpose of this report is to highlight the key trends in the international refining sector and to analyze the impact of these developments on the Saudi refining sector. Summary
The global refining industry has changed in the last decade with a shift in demand growth away from OECD countries to non-OECD ones. The supply of highly complex and modern refineries, as a way of decreasing dependency on imports, has also increased.
India and China have seen a huge growth of refining capacity which has contributed to creating a global surplus, all of which has led to decreasing refining margins and utilization rates. Older and less competitive refineries have therefore been forced to close, with Western Europe being one of the worst affected regions.
With the help of shale oil, the US has transformed itself from being the world’s largest importer of gasoline to a major exporter of diesel, further adding to the supply of high quality refined products available in the global market.
Regardless of the apparent over supply of global refining capacity, a plethora of refining projects will add around 7 mbpd of highly complex capacity between now and 2020. This also includes new refineries from Saudi Arabia, which will make it a net exporter of middle distillates (incl. diesel) by the end of the decade, joined by Russia, China, US and India.
Saudi Arabia will compete in a very tight international market and we believe that in order for it to secure sustainable long term markets for its middle distillate export surplus, there will have to be a re-orientation away from traditional regions, such as Europe, towards ‘new frontiers’ such as Africa and South America.
For comments and queries please contact: Fahad M. Alturki Chief Economist & Head of Research [email protected] Asad Khan Senior Economist [email protected] Head office: Phone +966 11 279-1111 Fax +966 11 279-1571 P.O. Box 60677, Riyadh 11555 Kingdom of Saudi Arabia www.jadwa.com
Focus on the Saudi Refining Sector in a Global Context
1
November 2014 Outlook for Crude Oil Refining
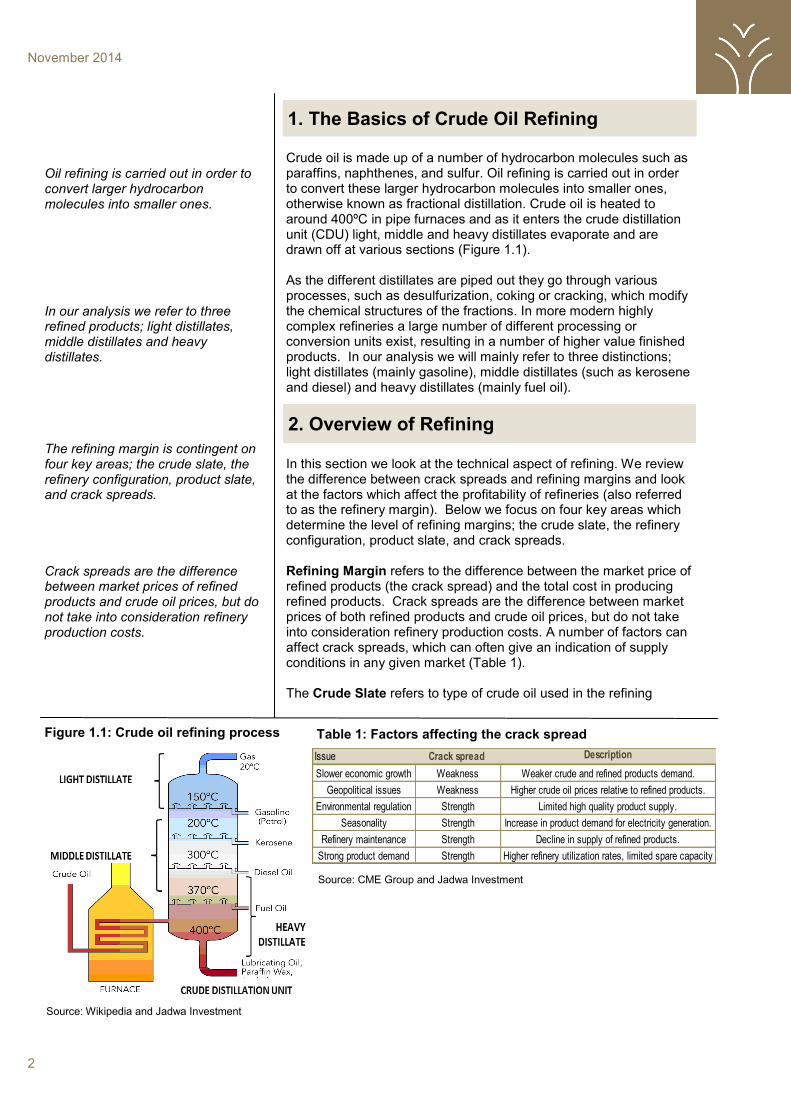
Crude oil is made up of a number of hydrocarbon molecules such as paraffins, naphthenes, and sulfur. Oil refining is carried out in order to convert these larger hydrocarbon molecules into smaller ones, otherwise known as fractional distillation. Crude oil is heated to around 400ºC in pipe furnaces and as it enters the crude distillation unit (CDU) light, middle and heavy distillates evaporate and are drawn off at various sections (Figure 1.1). As the different distillates are piped out they go through various processes, such as desulfurization, coking or cracking, which modify the chemical structures of the fractions. In more modern highly complex refineries a large number of different processing or conversion units exist, resulting in a number of higher value finished products. In our analysis we will mainly refer to three distinctions; light distillates (mainly gasoline), middle distillates (such as kerosene and diesel) and heavy distillates (mainly fuel oil).
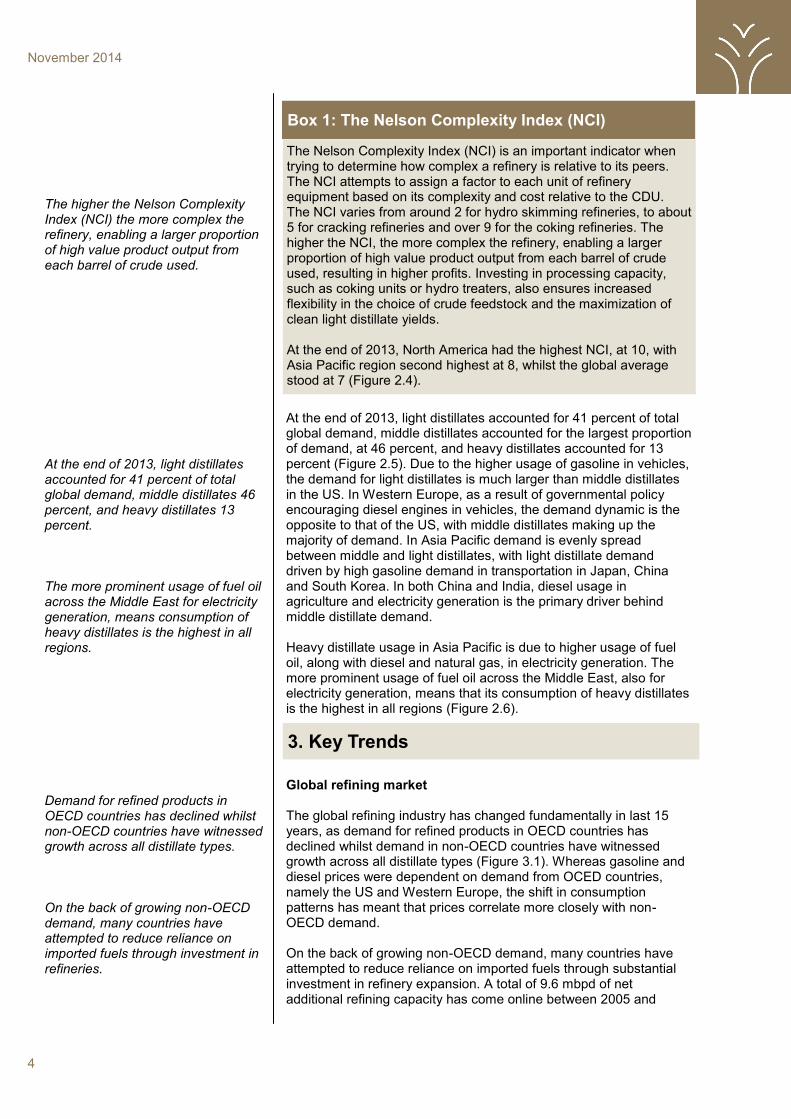
In this section we look at the technical aspect of refining. We review the difference between crack spreads and refining margins and look at the factors which affect the profitability of refineries (also referred to as the refinery margin). Below we focus on four key areas which determine the level of refining margins; the crude slate, the refinery configuration, product slate, and crack spreads. Refining Margin refers to the difference between the market price of refined products (the crack spread) and the total cost in producing refined products. Crack spreads are the difference between market prices of both refined products and crude oil prices, but do not take into consideration refinery production costs. A number of factors can affect crack spreads, which can often give an indication of supply conditions in any given market (Table 1). The Crude Slate refers to type of crude oil used in the refining
2
Oil refining is carried out in order to convert larger hydrocarbon molecules into smaller ones. In our analysis we refer to three refined products; light distillates, middle distillates and heavy distillates. The refining margin is contingent on four key areas; the crude slate, the refinery configuration, product slate, and crack spreads. Crack spreads are the difference between market prices of refined products and crude oil prices, but do not take into consideration refinery production costs.
November 2014
1. The Basics of Crude Oil Refining
2. Overview of Refining
Table 1: Factors affecting the crack spread
Source: CME Group and Jadwa Investment
Issue Crack spread
strength/weakness
Description
Slower economic growth Weakness Weaker crude and refined products demand.
Geopolitical issues Weakness Higher crude oil prices relative to refined products.
Environmental regulation Strength Limited high quality product supply.
Seasonality Strength Increase in product demand for electricity generation.
Refinery maintenance Strength Decline in supply of refined products.
Strong product demand Strength Higher refinery utilization rates, limited spare capacity
Figure 1.1: Crude oil refining process
Source: Wikipedia and Jadwa Investment

process. The two main measurements that differentiate crude types are density and the sulphur content. The American Petroleum Institute (API) gravity indicates whether a crude type is either heavy or light. Heavier crude requires more refining, since it is made up of longer hydrocarbon chains, whereas shorter chains in lighter crude make it easier to process. The lighter the crude, the higher the API gravity. A crude type with less than 0.42 percent sulphur is considered sweet, whereas anything above that level is defined as sour (Figure 2.1). Since each crude type has unique natural qualities, the final output of refined products will be determined by the crude oil used in the refining process. Figure 2.2 shows the product yield for different crude types, ranging from light to heavy and sweet to sour passed through a very simple refinery. It is apparent that the lighter and sweeter the crude type, the higher the proportion of light and middle distillates produced. The installation of certain conversion units at a refinery determines which products will be produced from the crude input; this is referred to a refinery’s configuration. Five main types of conversion units are; topping, hydro skimming, cracking, coking and hydro treating. A topping refinery is a simple refinery, only splitting crude using a CDU, resulting in a higher proportion of output being heavy distillates. A hydro skimming refinery increases the portion of middle and light distillates slightly. Cracking units produce more ultra-low sulphur diesel (ULSD) and high quality gasoline, whilst coking allows for a larger portion of middle and light distillates from heavier crudes (Figure 2.3). International environmental standards on harmful emissions have resulted in increasingly restrictive sulphur limits on transportation fuels in many countries. The process by which finished products are ‘cleaned’ of sulphur is called hydro treating. Refineries which have hydro treaters are able to process more sour crudes. An industry measure used to determine the secondary conversion capacity of a refinery relative to its CDU is called the Nelson complexity index (NCI) (Box 1). The desired quality type of the finished refined product is referred to as the product slate and this will ultimately influence a refinery’s configuration.
3
The crude slate refers to type of crude oil used in the refining process. The final output of refined products will be determined by the crude oil used in the refining process. Conversion units at a refinery determine which products will be produced from crude input; referred to a refinery’s configuration. International environmental standards on harmful emissions have resulted in increasingly restrictive sulphur limits on transportation fuels in many countries.
November 2014
Figure 2.1: API gravity & sulphur content of crudes
Source: EIA and Jadwa Investment
Figure 2.2: Product yield from different crudes
Source: NRCan and Jadwa Investment
0%
20%
40%
60%
80%
100%
Light &Sweet
Light &Sour
Heavy &Sour
V.Heavy &Sour
Heavy Distillate Middle Distillate Light Distillate
Mexico-Maya KSA-
Arab Heavy
Dubai
KSA-Arab Light
FSU-Urals
Ecuador-Oriente
Brent
US-WTI
Nigeria -Bonny Light
Malaysia Tapis
0
0.5
1
1.5
2
2.5
3
3.5
20 30 40 50Heavy API Gravity S
weet
S
ulp
hu
r C
on
ten
tS
our
At the end of 2013, light distillates accounted for 41 percent of total global demand, middle distillates accounted for the largest proportion of demand, at 46 percent, and heavy distillates accounted for 13 percent (Figure 2.5). Due to the higher usage of gasoline in vehicles, the demand for light distillates is much larger than middle distillates in the US. In Western Europe, as a result of governmental policy encouraging diesel engines in vehicles, the demand dynamic is the opposite to that of the US, with middle distillates making up the majority of demand. In Asia Pacific demand is evenly spread between middle and light distillates, with light distillate demand driven by high gasoline demand in transportation in Japan, China and South Korea. In both China and India, diesel usage in agriculture and electricity generation is the primary driver behind middle distillate demand. Heavy distillate usage in Asia Pacific is due to higher usage of fuel oil, along with diesel and natural gas, in electricity generation. The more prominent usage of fuel oil across the Middle East, also for electricity generation, means that its consumption of heavy distillates is the highest in all regions (Figure 2.6).
Global refining market The global refining industry has changed fundamentally in last 15 years, as demand for refined products in OECD countries has declined whilst demand in non-OECD countries have witnessed growth across all distillate types (Figure 3.1). Whereas gasoline and diesel prices were dependent on demand from OCED countries, namely the US and Western Europe, the shift in consumption patterns has meant that prices correlate more closely with non-OECD demand. On the back of growing non-OECD demand, many countries have attempted to reduce reliance on imported fuels through substantial investment in refinery expansion. A total of 9.6 mbpd of net additional refining capacity has come online between 2005 and
4
The higher the Nelson Complexity Index (NCI) the more complex the refinery, enabling a larger proportion of high value product output from each barrel of crude used. At the end of 2013, light distillates accounted for 41 percent of total global demand, middle distillates 46 percent, and heavy distillates 13 percent. The more prominent usage of fuel oil across the Middle East for electricity generation, means consumption of heavy distillates is the highest in all regions.
Demand for refined products in OECD countries has declined whilst non-OECD countries have witnessed growth across all distillate types.
On the back of growing non-OECD demand, many countries have attempted to reduce reliance on imported fuels through investment in refineries.
November 2014
The Nelson Complexity Index (NCI) is an important indicator when trying to determine how complex a refinery is relative to its peers. The NCI attempts to assign a factor to each unit of refinery equipment based on its complexity and cost relative to the CDU. The NCI varies from around 2 for hydro skimming refineries, to about 5 for cracking refineries and over 9 for the coking refineries. The higher the NCI, the more complex the refinery, enabling a larger proportion of high value product output from each barrel of crude used, resulting in higher profits. Investing in processing capacity, such as coking units or hydro treaters, also ensures increased flexibility in the choice of crude feedstock and the maximization of clean light distillate yields. At the end of 2013, North America had the highest NCI, at 10, with Asia Pacific region second highest at 8, whilst the global average stood at 7 (Figure 2.4).
3. Key Trends
Box 1: The Nelson Complexity Index (NCI)

Figure 2.5: Global consumption by distillate type Figure 2.6: Regional consumption by distillate
Figure 2.3: Yield from different refinery types Figure 2.4: Average NCI by region
Figure 3.1: OECD vs. non-OECD product demand Figure 3.2: Global refining capacity and utilization
0%
20%
40%
60%
80%
100%
Topping Hydroskimming
Cracking Coking
Heavy Distillate Middle Distillate Light Distillate0 2 4 6 8 10 12
Africa
M.East
E. Europe
S.America
W. Europe
Asia Pac.
N.America
(NCI)
GlobalNCI average: 7
Light distillates
41%
Middle distillates
47%
Heavy Distillate
12%
0%
20%
40%
60%
80%
100%
Light distillates Middle distillates Heavy Distillate
Source: NRCan and Jadwa Investment Source: Agip and Jadwa Investment
Source: BP and Jadwa Investment Source: BP and Jadwa Investment
Source: BP and Jadwa Investment
0
5
10
15
20
1995 2000 2005 2010 2013
(mil
lio
n b
arr
els
pe
r d
ay)
OECD
Non OECD
OECD
Non OECD
OECD
Non OECD
80
82
84
86
88
90
0
20
40
60
80
100
2000 2003 2006 2010 2013
Non-OECD CapacityOECD CapacityUtilization
(millio
n b
arr
els
per
day)
(perc
en
t)
Source: BP and Jadwa Investment
5
November 2014

2013, with the largest additions coming from the Asia Pacific, namely China and India. Concurrently, a reduction in demand for refined products in OECD countries, especially so after 2008, has led to refinery utilization rates and refining margins dropping (Figures 3.2 & 3.3). As a result, the global refining industry has reacted by progressively closing smaller and less complex refineries. Regional trends US refiner’s success on back of shale oil. A combination of infrastructure bottlenecks and expansion of shale oil output has benefited most US refiners through increased capacity utilization and profitability. Light crude from the Bakken province, heavy crude imported from the Canadian oil sands, increased production of West Texas crude and inadequate pipeline infrastructure resulted in an accelerated accumulation of US commercial oil stocks from 2007 onwards. As a result, WTI crude prices dropped, creating a sizable differential with Brent crude (Figure 3.4). As global prices of refined products did not decline as much as WTI, US refiners were presented with an opportunity to arbitrage through exporting refined products. Until 2006 the US was a net importer of refined products, and the largest gasoline importer in the world, but as oil stocks have built up there has been reversal of product flows, with the US currently a net exporter of products (Figure 3.5). As US refineries exhibit, on average, the most complex configurations globally, surplus produce has been made up of middle distillates, largely diesel, and some light distillates. Whilst most of the diesel has been shipped to Europe, gasoline has been exported to South America. Not all US refiners have benefited from recent developments. Whereas refiners in the Midwest and Gulf Coast region had previously invested in upgrades in order to process different crude slates, East coast refiners did not. This led to falling utilization rates amongst East coast refiners (Figure 3.6) and ultimately led to seven oil refineries closing along the Atlantic coast between 2009 and 2013. European market depressed. Prior to 2008 the European refining sector had enjoyed stable demand for products and solid refining margins. Since the global financial crisis, however, the refining industry saw declining demand in domestic markets, which led to falling utilization rates. This downturn also coincided with opportunities in European refiners’ largest export market, the US, shrinking. Many European refineries were originally designed for arbitrage operations in order to exploit the deficit in gasoline supply into North America but, due to increased gasoline production in the US, exports declined. Furthermore, because of US’s excess production of diesel and the favorable WTI-Brent differential, Europe has now become an export market for US refined products, further eroding European refiners share in their own market. The combination of falling demand and changes in the US market have resulted in the European refining industry enduring some very difficult times, with around 1 mbpd of capacity being shut down from
6
Concurrently, a reduction in demand for refined products in OECD countries has led to refinery utilization rates and margins dropping.
The widening WTI-Brent differential has presented US refiners with an opportunity to arbitrage through exporting refined products.
US refineries exhibit high NCI’s and their surplus produce has been made up of high quality middle and light distillates. Since the global financial crisis, the European refining industry has seen declining demand, leading to falling utilization rates.
Europe has now become an export market for US refined products, further eroding European refiners share in their own market.
November 2014

Figure 3.5: US refined products import and export Figure 3.6: Lower utilization rates in East coast
Figure 3.3: Global refining margins Figure 3.4: US oil stocks & WTI-Brent differential
Source: Thomson Reuters and Jadwa Investment Note: Average of crack and hydro skimming margins
Sources: EIA, Thomson Reuters and Jadwa Investment
Sources: EIA and Jadwa Investment Sources: EIA, Thomson Reuters and Jadwa Investment
0
5
10
15
2005 2008 2011 2014
Rotterdam Singapore US Gulf Coast
($ p
er
barr
el)
260
280
300
320
340
360
380
-5
0
5
10
15
20
2000 2006 2013
WTI-Brentdifferential (LHS)
US Commercialcrude stocks (RHS)
(millio
n b
arr
els
)
($ p
er
barr
el)
-2.0
-1.0
0.0
1.0
2.0
3.0
0.0
0.5
1.0
1.5
2.0
2.5
2000 2003 2006 2009 2013
Middle distillate
Light distillate
Net imports (RHS)
(millio
n b
arr
els
per
day)
(millio
n b
arr
els
per
day)
35
45
55
65
75
85
95
Jun-10 Aug-11 Oct-12 Dec-13East Coast MidwestGulf Coast Rocky MountainsWest Coast
(pe
rcen
t)
Figure 3.7: European utilization rates & margins
Sources: BP, Thomson Reuters, Jadwa Investment
Figure 3.8: China refining capacity & consumption
Source: BP and Jadwa Investment
78
80
82
84
86
88
90
0
2
4
6
8
10
2005 2008 2011 2014
Brent Cracking margins (LHS)
Utilization (RHS)
(perc
en
t)
($ p
er
barr
el)
0
2
4
6
8
10
12
14
1995 2001 2007 2013
Capacity
Consumption
(millio
n b
arr
els
per
day)
7
November 2014
2009 to 2013 with falling margins and utilization rates (Figure 3.7). Large Chinese and Indian additions. China has been expanding its refining capacity in order to meet accelerating growth in domestic demand. Since 1995 the refining sector has undergone both modernization and consolidation, with an average of just over 1 mbpd of net capacity being added per year, with total capacity at 13 mbpd in 2013. China is ranked behind only the US and EU in terms of total installed capacity. In terms of modernization, a number of the newer refineries that have come online are configured to accept all crude slates, allowing Chinese refiners to become strong regional competitors. Modernization has taken place through shutting down of smaller, independent refineries, known as ‘teapot’ refineries. The elimination of these refineries has been instructed by the National Development and Reform Commission (NDRC), which also dictates pricing of domestic petroleum products and grants the issuance of quotas for export of products. Currently, China’s refining capacity surpasses its domestic demand (Figure 3.8), with recent additions having turned the country into an exporter of certain refined products. The NDRC has allowed export quotas on gasoline, diesel and kerosene, due to oversupply of these products domestically (Figure 3.9). Since Chinese refined products are not currently compliant with international fuel standards, such as those seen in the EU and US (Box 2), a majority of these products are shipped to regional markets, such as Singapore and Hong Kong (Figure 3.10).
8
China has been expanding its refining capacity in order to meet accelerating growth in domestic demand.
China’s refining capacity surpasses its domestic demand allowing it to export certain refined products.
In the last two decades a number of countries have set up environmental initiatives to limit the emission of pollutants… ...as a consequence demand for ULSD and high grade gasoline is expected to rise sharply in the coming years.
November 2014
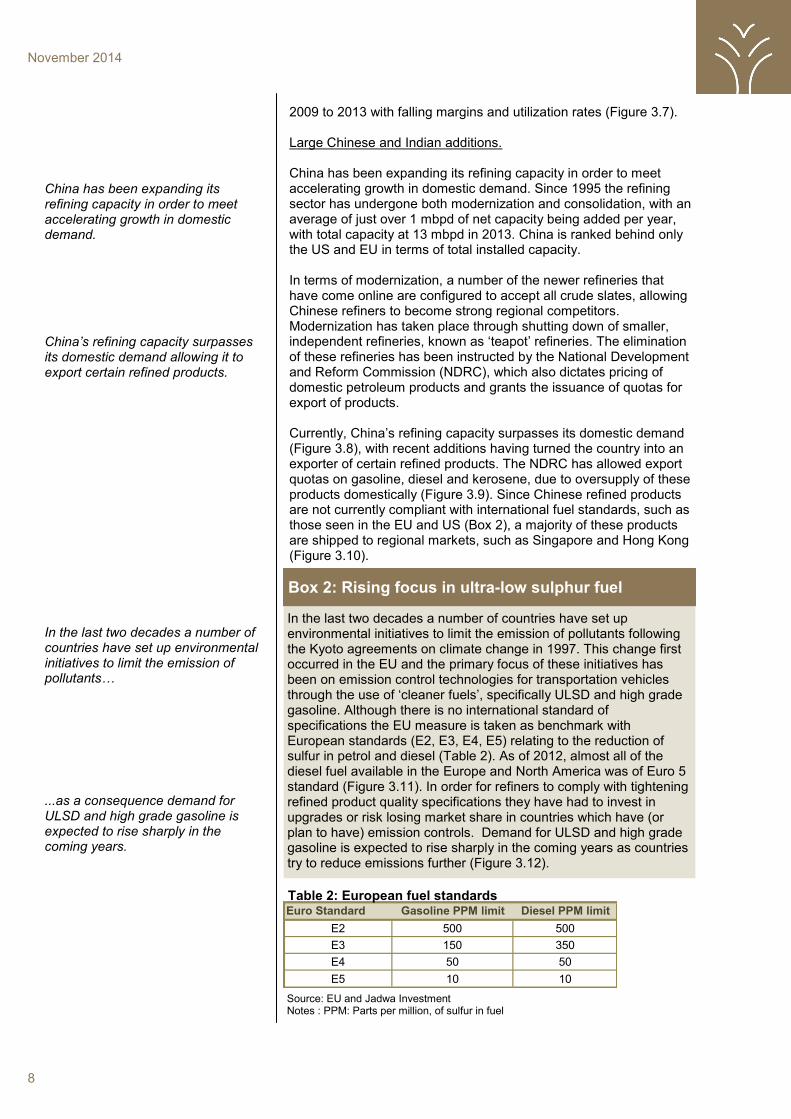
In the last two decades a number of countries have set up environmental initiatives to limit the emission of pollutants following the Kyoto agreements on climate change in 1997. This change first occurred in the EU and the primary focus of these initiatives has been on emission control technologies for transportation vehicles through the use of ‘cleaner fuels’, specifically ULSD and high grade gasoline. Although there is no international standard of specifications the EU measure is taken as benchmark with European standards (E2, E3, E4, E5) relating to the reduction of sulfur in petrol and diesel (Table 2). As of 2012, almost all of the diesel fuel available in the Europe and North America was of Euro 5 standard (Figure 3.11). In order for refiners to comply with tightening refined product quality specifications they have had to invest in upgrades or risk losing market share in countries which have (or plan to have) emission controls. Demand for ULSD and high grade gasoline is expected to rise sharply in the coming years as countries try to reduce emissions further (Figure 3.12).
Box 2: Rising focus in ultra-low sulphur fuel
Source: EU and Jadwa Investment Notes : PPM: Parts per million, of sulfur in fuel
Euro Standard Gasoline PPM limit Diesel PPM limit
E2 500 500
E3 150 350
E4 50 50
E5 10 10
Table 2: European fuel standards

Figure 3.9: Import and export of refined products
Source: Thomson Reuters and Jadwa Investment
Figure 3.10: China’s refined exports by destination
Source: Thomson Reuters and Jadwa Investment
Figure 3.13: Rising capacity, declining utilization
Source: BP and Jadwa Investment
Figure 3.14: Indian refined products export
Source: Indian Ministry of Petroleum and Jadwa Investment
-0.6
-0.4
-0.2
0.0
0.2
0.4
0.6
0.8
1.0
-0.15
-0.05
0.05
0.15
0.25 Light Distillate Export
Middle Distillate Export
Net Imports (RHS)
(millio
n b
arr
els
per
day)
(millio
n b
arr
els
per
day)
Singapore34%
Hong Kong18%
Vietnam12%
Malaysia6%
Myanmar4%
Other26%
60
65
70
75
80
85
90
0
2
4
6
8
10
12
14
1995 2001 2007 2013
Capacity
Utilization (RHS)
(millio
n b
arr
els
per
day)
(perc
en
t)
-0.1
0.8
1.6
2.4
3.2
4.0
4.8
-0.2
0.0
0.2
0.4
0.6
0.8
1.0
1.2
2000 2006 2013
Light Distillate ExportMiddle Distillate ExportHeavy Distillate ExportCapacity (RHS)
(millio
n b
arr
els
per
day)
(millio
n b
arr
els
per
day)
Figure 3.11: Minimum fuel standards by country
Source: UNEP and Jadwa Investment
Figure 3.12: Targeted CO2 reduction in passenger cars
Source: ICCT and Jadwa Investment
0102030405060
(perc
en
t)
9
November 2014
As product demand growth has slowed globally and, to a lesser extent, in China, the accelerated additions in capacity have resulted in falling utilization rates, (Figure 3.13) but this has not translated into a slowdown of planned future capacity, with government policy firmly backing refinery additions, regardless of apparent overcapacity. Much like China, India has gone through a period of growth in its refining sector, with capacity increasing by 44 percent since 2008, totaling 4.3 mbpd at the end of 2013. This rapid expansion has been achieved through a government led policy which has actively encouraged the private sector to invest in refinery infrastructure through the elimination of customs duties on crude oil imports. As a consequence India has been exporting all types of distillates since 2001 and has become a regional exporting hub (Figure 3.14). The growth in exports has been primarily led by highly complex privately owned refineries which have been able to ship products to Europe, whereas state-owned refiners have focused on providing products to domestic customers at regulated prices.
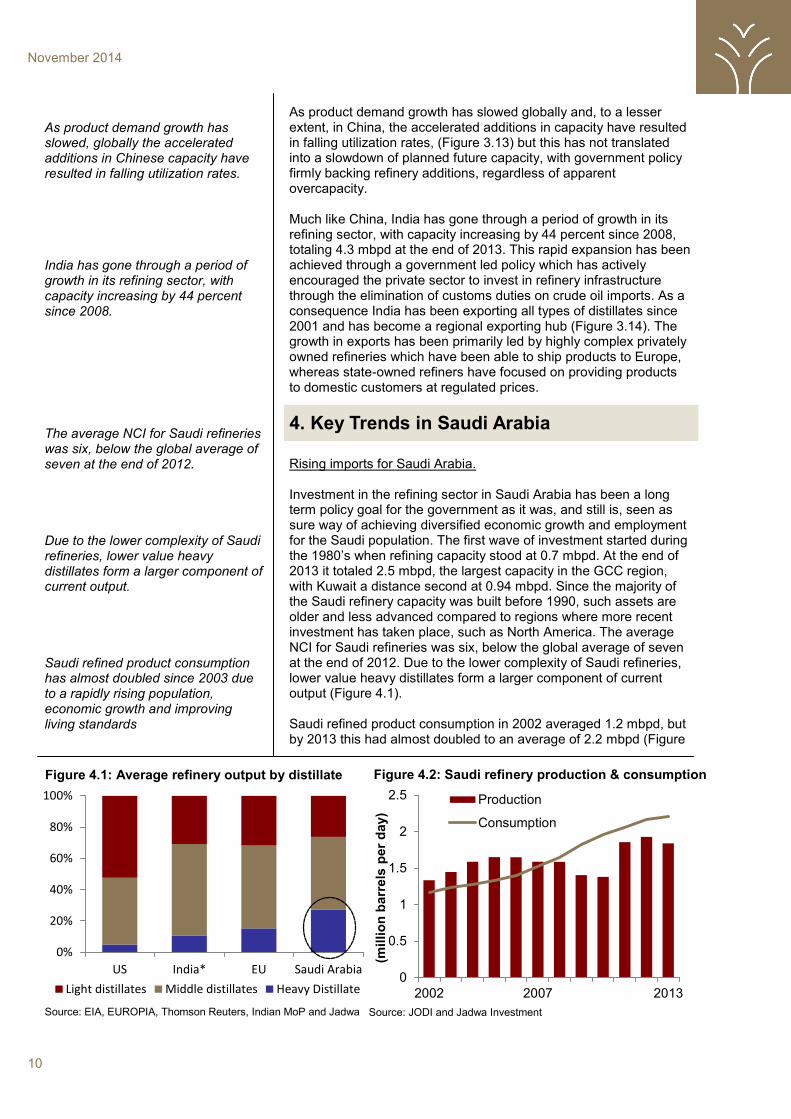
Rising imports for Saudi Arabia. Investment in the refining sector in Saudi Arabia has been a long term policy goal for the government as it was, and still is, seen as sure way of achieving diversified economic growth and employment for the Saudi population. The first wave of investment started during the 1980’s when refining capacity stood at 0.7 mbpd. At the end of 2013 it totaled 2.5 mbpd, the largest capacity in the GCC region, with Kuwait a distance second at 0.94 mbpd. Since the majority of the Saudi refinery capacity was built before 1990, such assets are older and less advanced compared to regions where more recent investment has taken place, such as North America. The average NCI for Saudi refineries was six, below the global average of seven at the end of 2012. Due to the lower complexity of Saudi refineries, lower value heavy distillates form a larger component of current output (Figure 4.1). Saudi refined product consumption in 2002 averaged 1.2 mbpd, but by 2013 this had almost doubled to an average of 2.2 mbpd (Figure
10
As product demand growth has slowed, globally the accelerated additions in Chinese capacity have resulted in falling utilization rates. India has gone through a period of growth in its refining sector, with capacity increasing by 44 percent since 2008.
The average NCI for Saudi refineries was six, below the global average of seven at the end of 2012. Due to the lower complexity of Saudi refineries, lower value heavy distillates form a larger component of current output. Saudi refined product consumption has almost doubled since 2003 due to a rapidly rising population, economic growth and improving living standards
November 2014
Figure 4.2: Saudi refinery production & consumption
Source: JODI and Jadwa Investment
Figure 4.1: Average refinery output by distillate
Source: EIA, EUROPIA, Thomson Reuters, Indian MoP and Jadwa
0
0.5
1
1.5
2
2.5
2002 2007 2013
Production
Consumption
(millio
n b
arr
els
per
day)
0%
20%
40%
60%
80%
100%
US India* EU Saudi Arabia
Light distillates Middle distillates Heavy Distillate
4. Key Trends in Saudi Arabia

4.2). The main factors behind demand growth have been a rapidly rising population, economic growth and improving living standards. The combination of these factors, in turn, have contributed to larger consumption via increasing electricity consumption, higher usage of energy in industry and increased car ownership. Another important factor contributing to rising consumption is the existence of subsidies in the supply of transportation fuel and for electricity generation. Saudi Arabia has one of the lowest priced transportation fuel in the world, with diesel at 6.7 US cents per liter and gasoline at 16 US cents per liter. Furthermore, refined products are also supplied at similar discounted rates to the Saudi Electric Company (SEC), which uses around 200 thousand barrel per day (tbpd) of diesel and 40 tbpd of fuel oil for electricity generation. Due to the combination of rapid expansion in demand and Saudi refineries higher proportion of heavy distillate output, a deficit in light and middle distillate products has developed. In particular, the rise in the consumption of diesel and gasoline has translated to a steadily rising level of imports of both these products in the last few years (Figure 4.3).
Global supply set to expand. Annual increases in new global refining capacity will average around 0.9 mbpd per annum of CDU’s from 2014-2020 (Figure 5.1) with the largest increases coming from the Middle East and Asia Pacific regions. China is set to continue adding refining capacity in order to replace old refineries and ensure a reduction in all types of product imports. For the same reasons, Middle Eastern countries, led by Saudi Arabia will also invest significantly in additional high complex refining capacity with enhanced conversion capacity. In particular, production processes such as hydro cracking units (for production of ULSD), cracking units (for high quality gasoline) and cokers (for refining of heavy crude/distillates) will make up a significant part of this investment. Expansions in Asia Pacific Middle East and South America.
11
The existence of subsidies in the supply of transportation fuel and electricity generation have also added to consumption growth… ...which has contributed to a deficit in light and middle distillate products. Annual increases in new global refining capacity will average around 0.9 mbpd per year from 2014-2020.
November 2014
Figure 4.3: Rising Saudi imports of products Figure 5.1: Global refining additions to 2020
Source: IHS Purvin & Gertz, LUKOIL, Jadwa Investment
-0.20
-0.10
0.00
0.10
0.20
0.30
2002 2007 2013
Light Distillate
Middle Distillate
Heavy Distillate
(millio
nb
arr
els
per
day) Exports
Imports
Source: JODI and Jadwa Investment
0
0.5
1
1.5
2
2014 2015 2016 2017 2018 2019 2020
(millio
n b
arr
els
per
day)
5. Global Outlook
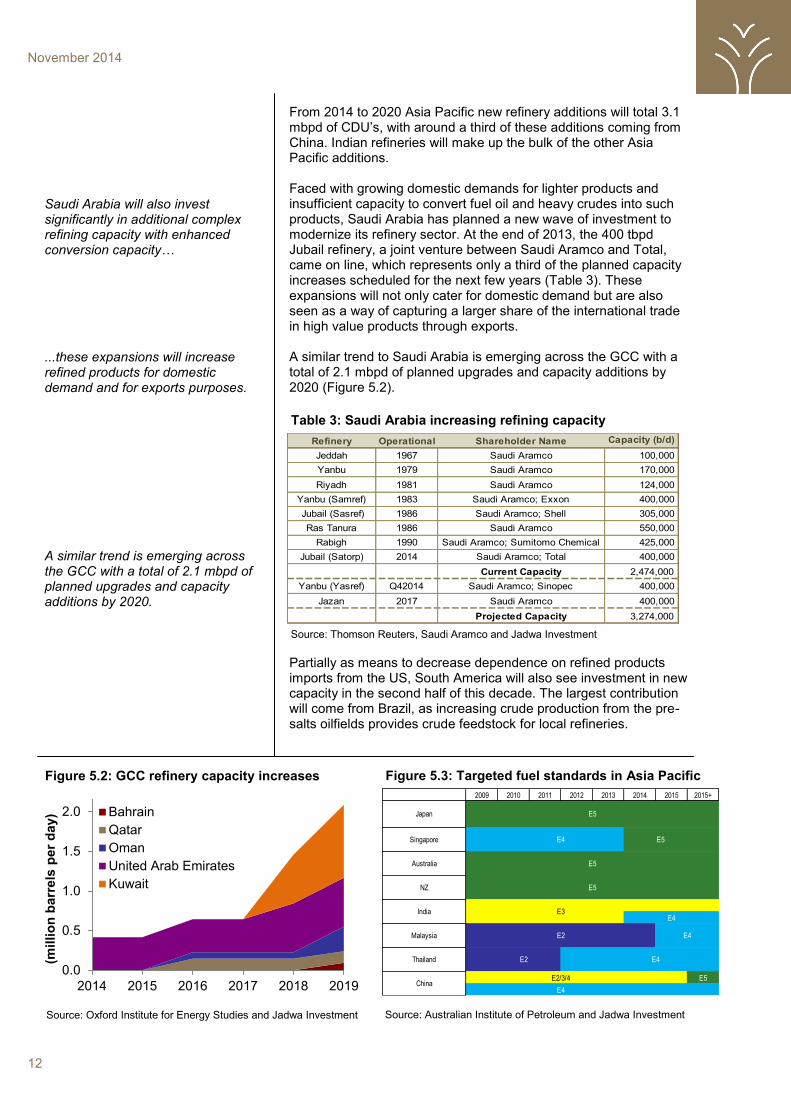
From 2014 to 2020 Asia Pacific new refinery additions will total 3.1 mbpd of CDU’s, with around a third of these additions coming from China. Indian refineries will make up the bulk of the other Asia Pacific additions. Faced with growing domestic demands for lighter products and insufficient capacity to convert fuel oil and heavy crudes into such products, Saudi Arabia has planned a new wave of investment to modernize its refinery sector. At the end of 2013, the 400 tbpd Jubail refinery, a joint venture between Saudi Aramco and Total, came on line, which represents only a third of the planned capacity increases scheduled for the next few years (Table 3). These expansions will not only cater for domestic demand but are also seen as a way of capturing a larger share of the international trade in high value products through exports. A similar trend to Saudi Arabia is emerging across the GCC with a total of 2.1 mbpd of planned upgrades and capacity additions by 2020 (Figure 5.2).
Partially as means to decrease dependence on refined products imports from the US, South America will also see investment in new capacity in the second half of this decade. The largest contribution will come from Brazil, as increasing crude production from the pre-salts oilfields provides crude feedstock for local refineries.
12
Saudi Arabia will also invest significantly in additional complex refining capacity with enhanced conversion capacity… ...these expansions will increase refined products for domestic demand and for exports purposes.
A similar trend is emerging across the GCC with a total of 2.1 mbpd of planned upgrades and capacity additions by 2020.
November 2014
Table 3: Saudi Arabia increasing refining capacity
Source: Thomson Reuters, Saudi Aramco and Jadwa Investment
Refinery Operational Shareholder Name Capacity (b/d)
Jeddah 1967 Saudi Aramco 100,000
Yanbu 1979 Saudi Aramco 170,000
Riyadh 1981 Saudi Aramco 124,000
Yanbu (Samref) 1983 Saudi Aramco; Exxon 400,000
Jubail (Sasref) 1986 Saudi Aramco; Shell 305,000
Ras Tanura 1986 Saudi Aramco 550,000
Rabigh 1990 Saudi Aramco; Sumitomo Chemical 425,000
Jubail (Satorp) 2014 Saudi Aramco; Total 400,000
Current Capacity 2,474,000
Yanbu (Yasref) Q42014 Saudi Aramco; Sinopec 400,000
Jazan 2017 Saudi Aramco 400,000
Projected Capacity 3,274,000
Figure 5.2: GCC refinery capacity increases
0.0
0.5
1.0
1.5
2.0
2014 2015 2016 2017 2018 2019
Bahrain
Qatar
Oman
United Arab Emirates
Kuwait
(millio
n b
arr
els
per
day)
Source: Oxford Institute for Energy Studies and Jadwa Investment
Figure 5.3: Targeted fuel standards in Asia Pacific
Source: Australian Institute of Petroleum and Jadwa Investment
2009 2010 2011 2012 2013 2014 2015 2015+
E4
E5
E2 E4
E4
E2/3/4
E5
E5E4
E5
E5
E3
E2 E4
Thailand
China
Japan
Singapore
Australia
NZ
India
Malaysia

Upgrades adding to global supply. Recent pollution problems in some Chinese cities have prompted the NDRC to adopt stricter product specifications, including lower sulfur emissions for gasoline and diesel. This has been stipulated by a directive instructing refineries to implement Euro 4 standards by the end of 2014 and Euro 5 the end of 2017 (Figure 5.3). If the upgrades are enacted to schedule it will add around 1 mbpd of international standard fuel by 2020, adding to the already 2.1 mbpd of new capacity. In 2011, the Russian government introduced a number of technical regulations requiring the modernization of the refining sector for export purposes. These regulations were enacted through customs taxes which made the production of low quality refined products more expensive whilst incentivizing investment in conversion capacity for the production of Euro 5. The Russian government’s plan in regenerating its refining industry will see output of exportable ULSD increase by 1 mbpd by 2020 (Figure 5.4). Level of refinery complexity to rise. The current wave of global refining expansion is characterized by a higher degree of investment in conversion capacity. Historically, the less complex nature of older refineries resulted in the conversion capacity to CDU ratio being around 50 percent. This ratio is expected to average around 70 percent for the refineries coming online between 2014 and 2020, reflecting higher NCI’s. Out of the total 6.75 mbpd of capacity coming online, around 4.8 mbpd will be conversion units such as crackers and cokers. This is indicative of the push towards quantity and quality in the global refining sector, ultimately resulting in more capacity that can process heavy distillates and crude into light and middle distillates. Desulphurization capacity is also projected to increase, with around 5.4 mbpd of hydro treating capacity planned (Figure 5.5) with both Asia Pac and Middle East regions will see the largest additions, around 60 percent of the total. This underlines the trend towards the consumption of cleaner products in domestic markets and the push to export more high valued ULSD and other higher grade products. Global demand led by China Global refined product consumption is forecast to grow by an average annual rate of 1.2 percent, just under 1 mbpd per year, between 2014 and 2020 (Figure 5.6). Over this period the transportation sector in non-OECD countries will be the main catalyst in product demand growth. China will lead non-OECD growth as vehicle ownership, which is very low compared to some OECD countries, will continue to rise to 2020 (Figure 5.7). Growth of non-OECD vehicle fleet combined with rising emission standards in some of these countries will result in increased demand for light and middle distillate products. In OECD countries, refined product growth will continue to decline. Many OECD countries are approaching maximum vehicle ownership levels and with continuing improvements in fuel economy standards (Figure 5.8) light distillate demand will decline. This downward trend will not be replicated in middle distillates as the
13
If upgrades are enacted to schedule in Asia Pacific it will add around 1 mbpd of international standard fuel by 2020.
The Russian government’s plan in regenerating its refining industry will see output of exportable ULSD increase by 1 mbpd by 2020. The current wave of global refining expansion is characterized by a higher degree of investment in conversion capacity. This underlines the trend towards the consumption of cleaner products and the push to export more high valued products.
Global refined product consumption is forecast to grow by an average annual rate of 1.2 percent, just under 1 mbpd per year, between 2014 and 2020. In OECD countries, refined product growth will continue to decline.
November 2014

Figure 5.4: Forecasted ULSD exports from Russia
Sources: O&G Journal, ESAI Energy and Jadwa Investment
0.0
0.2
0.4
0.6
0.8
1.0
1.2
2012 2014 2016 2018 2020
Other ULSD
(millio
n b
arr
els
per
day)
Figure 5.5: Higher complexity in new refineries
Source: OPEC, Thomson Reuters, and Jadwa Investment
Figure 5.6: Global refined capacity & demand
Source: OPEC World Oil Outlook, and Jadwa Investment
Figure 5.7: Vehicle ownership in China is low
Source: BP and Jadwa Investment
Figure 5.8: Rising transport fuel efficiency to 2020
Source: ICCT and Jadwa Investment
60
70
80
90
100
0
2
4
6
2014 2015 2016 2017 2018 2019 2020
CDU Conversion (RHS)
Hydro treating (RHS)
(millio
n b
arr
els
per
day)
(perc
en
t)0
0.5
1
1.5
2
0
0.5
1
1.5
2
2014 2015 2016 2017 2018 2019 2020
Capacity growth
Demand growth (RHS)
(millio
n b
arr
els
per
day)
(millio
n b
arr
els
per
day)
0
200
400
600
800
1000
US Germany Japan China2000 2015 2020
(Veh
icle
sp
er
1000 c
ap
ita
)
25
35
45
55
2000 2004 2008 2012 2016 2020
EU Japan China
India US
(miles p
er
gaso
lin
e g
allo
n)
Figure 5.9: Demand by distillate type in 2020
Source: BP and Jadwa Investment
0
20
40
60
80
100
2013 2020
Heavy distillates Middle distillatesLight distillates
+7%
+15%
+>1%
(millio
n b
arr
els
per
day)
14
November 2014

stricter application of environmental initiatives into other areas aside from vehicles, such as bunker fuel, will ensure growth. Overall, global demand for middle distillates will grow the fastest among all the products with its share rising from 47 percent at the end of 2013, to 49 percent in 2020. Light distillates will grow at a slower pace making up 40 percent of the total, whilst heavy distillates proportion of total demand will decrease slightly (Figure 5.9). Surplus capacity will persist As result of the continued additions to global refining supply, a surplus in capacity will be maintained and low utilization rates will persist (Figure 5.10). As more complex refineries come online, increasing the supply of light and middle distillate, refining margins will also continue their downward trend. Low utilization and margins will add to intensifying competition in an already over supplied global market and refinery closures will therefore be inevitable. Refineries which exhibit low complexities are one obvious set of losers, but on a regional basis, Western Europe is the most vulnerable. The region has already seen a large amount of closures in the last few years, but with increases in middle distillates supply coming from outside the region will force more Western European refiners out of business (Figure 5.11).
Expansions will lead to middle distillate (diesel) surplus The three new and highly complex refineries totaling 1.2 mbpd will change Saudi Arabia’s refined product balance by 2020, but the degree of this change is dependent on the growth in domestic product demand. As Saudi Arabia’s economy maintains its expansionary phase between now and 2020, on the path to developing into a more diversified advanced economy, we anticipate that growth in refined product demand is likely to grow at an even faster rate than the previous decade. As a result, at the end of 2020, Saudi Arabia will remain a net importer of light distillates. The three new refineries will add a total of 260 tbpd of light distillate capacity from 2014-2020, but demand will grow by a total of 330 tbpd during the same period. With no
15
Overall, global demand for middle distillates will grow the fastest among all the products to 2020.
As result of the continued additions to global refining supply, a surplus in capacity will be maintained and lower utilization rates will persist in 2020.
We anticipate growth in Saudi refined product demand to grow to 2020 at an even faster rate than the previous decade. Product demand will end up exceeding supply of light distillates by 2020… ...but a surplus of middle distillate,
November 2014
6. Outlook of Saudi refining sector
Figure 5.10: Surplus capacity & utilization rates
Source: OPEC World Oil Outlook and Jadwa Investment
60
65
70
75
80
85
90
0
5
10
15
20
2013 2016 2020
Surplus Capacity Utilization (RHS)
(millio
n b
arr
els
per
day)
(perc
en
t)
Figure 5.11: Expected closures by region by 2020
Sources: OPEC and Jadwa Investment
0
0.5
1
1.5
2
2.5
3
(mil
lio
n b
arr
els
pe
r d
ay)
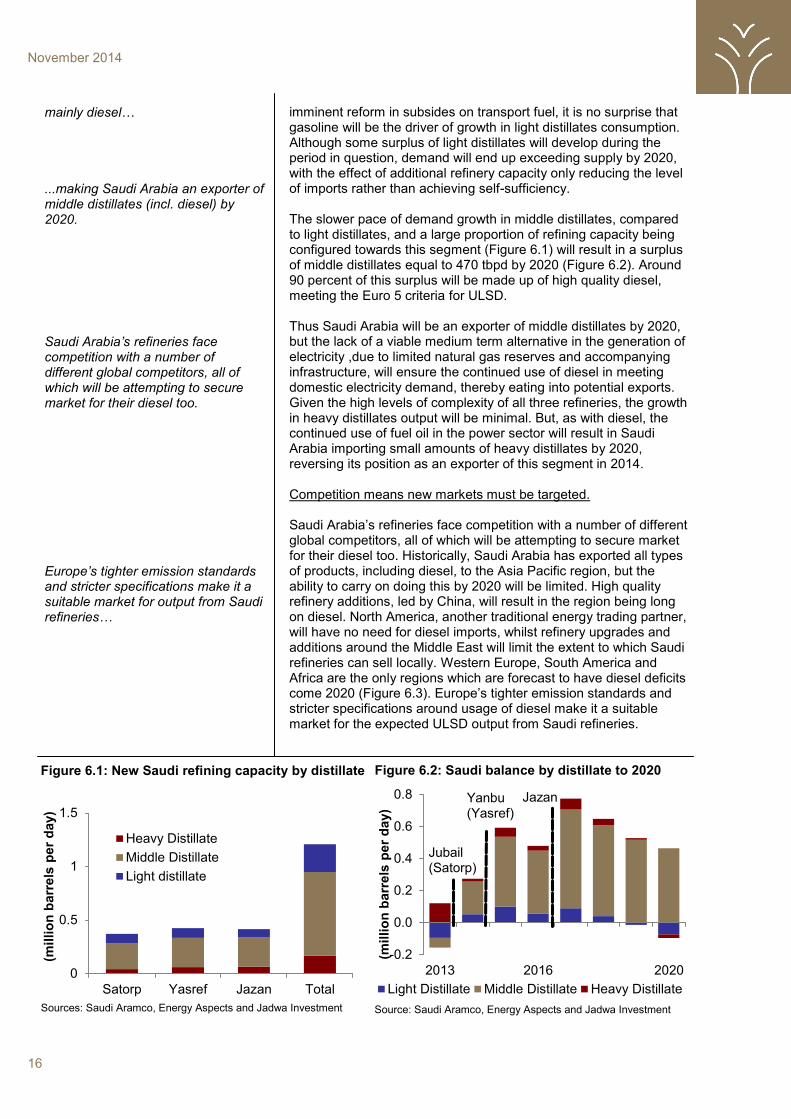
imminent reform in subsides on transport fuel, it is no surprise that gasoline will be the driver of growth in light distillates consumption. Although some surplus of light distillates will develop during the period in question, demand will end up exceeding supply by 2020, with the effect of additional refinery capacity only reducing the level of imports rather than achieving self-sufficiency. The slower pace of demand growth in middle distillates, compared to light distillates, and a large proportion of refining capacity being configured towards this segment (Figure 6.1) will result in a surplus of middle distillates equal to 470 tbpd by 2020 (Figure 6.2). Around 90 percent of this surplus will be made up of high quality diesel, meeting the Euro 5 criteria for ULSD. Thus Saudi Arabia will be an exporter of middle distillates by 2020, but the lack of a viable medium term alternative in the generation of electricity ,due to limited natural gas reserves and accompanying infrastructure, will ensure the continued use of diesel in meeting domestic electricity demand, thereby eating into potential exports. Given the high levels of complexity of all three refineries, the growth in heavy distillates output will be minimal. But, as with diesel, the continued use of fuel oil in the power sector will result in Saudi Arabia importing small amounts of heavy distillates by 2020, reversing its position as an exporter of this segment in 2014. Competition means new markets must be targeted. Saudi Arabia’s refineries face competition with a number of different global competitors, all of which will be attempting to secure market for their diesel too. Historically, Saudi Arabia has exported all types of products, including diesel, to the Asia Pacific region, but the ability to carry on doing this by 2020 will be limited. High quality refinery additions, led by China, will result in the region being long on diesel. North America, another traditional energy trading partner, will have no need for diesel imports, whilst refinery upgrades and additions around the Middle East will limit the extent to which Saudi refineries can sell locally. Western Europe, South America and Africa are the only regions which are forecast to have diesel deficits come 2020 (Figure 6.3). Europe’s tighter emission standards and stricter specifications around usage of diesel make it a suitable market for the expected ULSD output from Saudi refineries.
16
mainly diesel… ...making Saudi Arabia an exporter of middle distillates (incl. diesel) by 2020. Saudi Arabia’s refineries face competition with a number of different global competitors, all of which will be attempting to secure market for their diesel too.
Europe’s tighter emission standards and stricter specifications make it a suitable market for output from Saudi refineries…
November 2014
Figure 6.1: New Saudi refining capacity by distillate
Sources: Saudi Aramco, Energy Aspects and Jadwa Investment
Figure 6.2: Saudi balance by distillate to 2020
Source: Saudi Aramco, Energy Aspects and Jadwa Investment
0
0.5
1
1.5
Satorp Yasref Jazan Total
Heavy Distillate
Middle Distillate
Light distillate
(millio
n b
arr
els
per
day)
-0.2
0.0
0.2
0.4
0.6
0.8
2013 2016 2020
Light Distillate Middle Distillate Heavy Distillate
(millio
n b
arr
els
per
day)
Jubail (Satorp)
Yanbu (Yasref)
Jazan
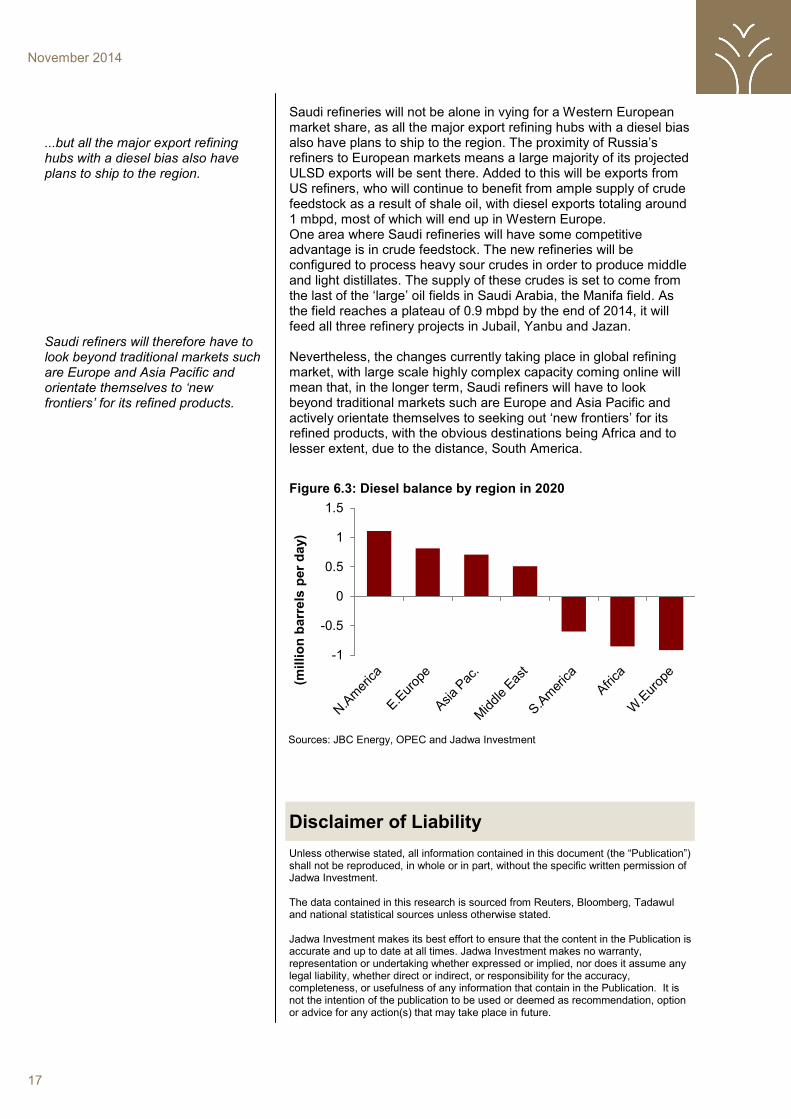
Saudi refineries will not be alone in vying for a Western European market share, as all the major export refining hubs with a diesel bias also have plans to ship to the region. The proximity of Russia’s refiners to European markets means a large majority of its projected ULSD exports will be sent there. Added to this will be exports from US refiners, who will continue to benefit from ample supply of crude feedstock as a result of shale oil, with diesel exports totaling around 1 mbpd, most of which will end up in Western Europe. One area where Saudi refineries will have some competitive advantage is in crude feedstock. The new refineries will be configured to process heavy sour crudes in order to produce middle and light distillates. The supply of these crudes is set to come from the last of the ‘large’ oil fields in Saudi Arabia, the Manifa field. As the field reaches a plateau of 0.9 mbpd by the end of 2014, it will feed all three refinery projects in Jubail, Yanbu and Jazan. Nevertheless, the changes currently taking place in global refining market, with large scale highly complex capacity coming online will mean that, in the longer term, Saudi refiners will have to look beyond traditional markets such are Europe and Asia Pacific and actively orientate themselves to seeking out ‘new frontiers’ for its refined products, with the obvious destinations being Africa and to lesser extent, due to the distance, South America.
17
...but all the major export refining hubs with a diesel bias also have plans to ship to the region. Saudi refiners will therefore have to look beyond traditional markets such are Europe and Asia Pacific and orientate themselves to ‘new frontiers’ for its refined products.
November 2014
Figure 6.3: Diesel balance by region in 2020
Sources: JBC Energy, OPEC and Jadwa Investment
Unless otherwise stated, all information contained in this document (the “Publication”) shall not be reproduced, in whole or in part, without the specific written permission of Jadwa Investment. The data contained in this research is sourced from Reuters, Bloomberg, Tadawul and national statistical sources unless otherwise stated. Jadwa Investment makes its best effort to ensure that the content in the Publication is accurate and up to date at all times. Jadwa Investment makes no warranty, representation or undertaking whether expressed or implied, nor does it assume any legal liability, whether direct or indirect, or responsibility for the accuracy, completeness, or usefulness of any information that contain in the Publication. It is not the intention of the publication to be used or deemed as recommendation, option or advice for any action(s) that may take place in future.
Disclaimer of Liability
-1
-0.5
0
0.5
1
1.5
(millio
n b
arr
els
per
day)