Embed Size (px)
Citation preview

09-122009 - 2012
FOCUS ON ENVIRONMENTAL ENFORCEMENTIN IRELAND

Environmental Protection Agency The Environmental Protection Agency (EPA) is a statutory body responsible for protecting the environment in Ireland. We regulate and police activities that might otherwise cause pollution. We ensure there is solid information on environmental trends so that necessary actions are taken. Our priorities are protecting the Irish environment and ensuring that development is sustainable. The EPA is an independent public body established in July 1993 under the Environmental Protection Agency Act, 1992. Its sponsor in Government is the Department of the Environment, Community and Local Government.
OUR RESPONSIBILITIES
LICENSING We license the following to ensure that their emissions do not endanger human health or harm the environment:
• waste facilities (e.g., landfills, incinerators, waste transfer stations);
• large scale industrial activities (e.g., pharmaceutical manufacturing, cement manufacturing, power plants);
• intensive agriculture;
• the contained use and controlled release of Genetically Modified Organisms (GMOs);
• large petrol storage facilities;
• waste water discharges;
• dumping at sea.
NATIONAL ENVIRONMENTAL ENFORCEMENT • Conducting over 1200 audits and inspections of EPA licensed
facilities every year.
• Overseeing local authorities’ environmental protection responsibilities in the areas of -air, noise, waste, waste-water and water quality.
• Working with local authorities and the Gardá to stamp out illegal waste activity by co-ordinating a national enforcement network, targeting offenders, conducting investigations and overseeing remediation.
• Prosecuting those who flout environmental law and damage the environment as a result of their actions.
MONITORING, ANALYSING AND REPORTING ON THE ENVIRONMENT • Monitoring air quality and the quality of rivers, lakes, tidal
waters and ground waters; measuring water levels and river flows.
• Independent reporting to inform decision making by national and local government.
REGULATING IRELAND’S GREENHOUSE GAS EMISSIONS • Quantifying Ireland’s emissions of greenhouse gases in the
context of our Kyoto commitments.
• Implementing the Emissions Trading Directive, involving over 100 companies who are major generators of carbon dioxide in Ireland.
ENVIRONMENTAL RESEARCH AND DEVELOPMENT • Co-ordinating research on environmental issues (including
air and water quality, climate change, biodiversity, environmental technologies).
STRATEGIC ENVIRONMENTAL ASSESSMENT • Assessing the impact of plans and programmes on the Irish
environment (such as waste management and development plans).
ENVIRONMENTAL PLANNING, EDUCATION AND GUIDANCE • Providing guidance to the public and to industry on various
environmental topics (including licence applications, waste prevention and environmental regulations).
• Generating greater environmental awareness (through environmental television programmes and primary and secondary schools’ resource packs).
PROACTIVE WASTE MANAGEMENT • Promoting waste prevention and minimisation projects
through the co-ordination of the National Waste Prevention Programme, including input into the implementation of Producer Responsibility Initiatives.
• Enforcing Regulations such as Waste Electrical and Electronic Equipment (WEEE) and Restriction of Hazardous Substances (RoHS) and substances that deplete the ozone layer.
• Developing a National Hazardous Waste Management Plan to prevent and manage hazardous waste.
MANAGEMENT AND STRUCTURE OF THE EPA The organisation is managed by a full time Board, consisting of a Director General and four Directors. The work of the EPA is carried out across four offices:
• Office of Climate, Licensing and Resource Use
• Office of Environmental Enforcement
• Office of Environmental Assessment
• Office of Communications and Corporate Services
The EPA is assisted by an Advisory Committee of twelve members who meet several times a year to discuss issues of concern and offer advice to the Board.

Focus on Environmental Enforcement in Ireland 2009 - 2012
The Environmental Protection Agency 2014
ENVIRONMENTAL PROTECTION AGENCY An Ghníomhaireacht um Chaomhnú Comhsaoil
PO Box 3000, Johnstown Castle Estate, Co. Wexford, Ireland
Telephone: +353 53 916 0600 Fax: +353 53 916 0699
Email: [email protected] Website: www.epa.ie
LoCall 1890 33 55 99


© Environmental Protection Agency 2014
All or part of this publication may be reproduced without further permission, provided the source is acknowledged. Although every effort has been made
to ensure the accuracy of the material contained in this publication, complete accuracy cannot be guaranteed. Neither the Environmental Protection Agency
nor the author(s) accept any responsibility whatsoever for loss or damage occasioned or claimed to have been occasioned, in part or in full, as a
consequence of any person acting, or refraining from acting, as a result of a matter contained in this publication.
Published by the Environmental Protection Agency, Ireland
ISBN: xx - xxx - xxxxx 11/09/1000
Focus on Environmental Enforcement in Ireland 2009 - 2012
The Environmental Protection Agency 2014
Price: €25

iiFO
REW
AR
DFocus on Environmental Enforcement in Ireland 2009–2012
Rigorous implementation of environmental policy and legislation is good economic policy. A clean environment promotes and helps to maintain the health and well-being of communities and individuals, consumers, workers and visitors. A clean and well protected environment is required for long-term, sustainable economic growth in Ireland. It is essential that economic growth is based on well regulated industry that helps to maintain and protect water, air and other natural resources for present and future generations.
Many government departments, authorities and agencies in Ireland have a statutory role in protecting the environment, but the principal regulators are the EPA and the 34 local authorities. The EPA and the local authorities, with the support of the Department of Environment, Community and Local Government, An Garda Síochána and other Agencies, have developed the “Network for Ireland’s Environmental Compliance and Enforcement” (NIECE), to provide an integrated national approach to the enforcement of environmental legislation. The NIECE network is acknowledged internationally as a role model for other countries to follow and the EPA, along with its partners in the network, will continue to work together to enhance the ability of the regulatory bodies with environmental protection responsibilities, and in doing so protect and improve Ireland’s environment.
Water management and regulating the waste industry are two issues foremost amongst the current
environmental challenges that now face Ireland’s environmental enforcement professionals. There is a requirement for sustained high level investment in environmental infrastructure to provide clean water and to treat sewage and other waste waters.
Ireland made good progress in improving waste management over the past 15 years, including the closure of large-scale illegal sites, increasing recycling and recovery of waste and reducing the number of landfill sites in use. However, the financial crisis has seen problems with escalating waste crime as witnessed with the increase in metal theft. Waste crime has the potential for very significant environmental impacts, along with substantial costs to the State and to legitimate waste and recycling businesses. We must be vigilant against a re-emergence of illegal waste dumping and the EPA is putting a renewed focus on this and working with other regulators to tackle this national issue.
Gerard O’Leary
Director, Office of Environmental Enforcement
FOREWORDThis report sets out the details of Ireland’s enforcement of environmental law in the period 2009 to 2012 by local authorities and the EPA, and the role of the enforcement network (NIECE1) in improving the effectiveness of enforcing environmental law. The European Commission has identified better implementation of environmental law as a necessity right across the EU.2 A key part of this implementation is a desire to share knowledge across enforcement authorities to assist in making better choices between various approaches to improving compliance. This report is part of the national effort to actively provide information about how EU environmental legislation is being implemented, and the challenge Ireland faces over coming years.
1 Network for Ireland’s Environmental Compliance and Enforcement
2 Improving the delivery of benefits from EU environment measures: Building confidence through better knowledge and responsiveness. COM(2012) 95
final. European Commission, 2012.

iiiForeward
FOR
EWA
RD
KEY STATISTICS The Environmental Protection Agency and the local authority environmental enforcement teams had a combined total of 543 staff at the end of 2012 down approximately 10% since 2009. These enforcement officers and staff are tasked with enforcing over 100 key pieces of environmental legislation as they:
Water 4,400 Regulate 4,400 water pollution licences, relating to 1,300 discharges to surface water licences and 3,100 discharge to sewer licences.
Waste 4,500 Regulate over 4,500 waste authorisations. This includes 600 waste facility permits, 240 ‘recycling bring bank’ permits, over 1,000 waste collection permits, 200 waste licences and 2,500 authorisations covering recycling collection points.
Air 1,200 Regulate 1,200 air pollution authorisations, dealing with 70 industrial type emissions, 200 solvents emission permits, 600 deco paints permits and 350 petrol storage and retail outlets permits.
Complaints 57,000 Receive and investigate approximately 57,000 environmental complaints each year with a close-out rate of 93%. Some sites attract multiple complaints and strong enforcement action is taken where enforcement offices find evidence of environmental crime.
Enforcement 132,000 Carry out approximately 132,000 site inspections on average per annum, of which approximately 115,000 per annum are planned inspections, and the remaining 17,000 per annum are reactive in response to complaints, incidents or investigations.
Waste Inspections: 50,000 per annum (including 2,500 TFS and 1,000 EPA audits)
Water and wastewater pollution: 70,000 per annum
Air and Noise: 3,000 per annum
Producer Responsibility: 4,500 per annum (farm plastics, tyres, plastic bags, electrical goods)
Enforcement activities have resulted, on average, in 900 court prosecution proceedings being brought to court each year and a further 12,000 enforcement actions per annum. Of enforcement actions; 70% related to waste; 10% related to agriculture; 9% related to wastewater; 6% related to air; and 5% related to noise.
European Court of Justice Case 9 There are now 9 open infringement cases against
Ireland, which is a substantial improvement from 2010 when Ireland had 32 open infringements.

ivFO
REW
AR
DFocus on Environmental Enforcement in Ireland 2009–2012
ACHIEVEMENTSBoth the EPA and local authorities have improved how public complaints are dealt with by implementing systematic complaint response systems, national complaints lines, a smartphone App, and online complaint forms. The vast majority of environmental complaints received are now closed out promptly.
Major illegal waste activity has been tackled right across the country including significant action against illegal scrapyards, legal action against a major landfill company in Dublin, and a major illegal waste operation which was detected and thwarted.
The combined enforcement effort has consistently driven an improvement in how waste water is being treated by municipalities and by companies. As a result fifteen food and drink sites installed new or upgraded waste water treatment infrastructure, representing millions of euros of investment in environmental protection infrastructure and a reduced impact on the water environment. There has been a vast improvement in the monitoring of emissions with greater investment directed to where it is needed most, including investment in new municipal and industrial waste water treatment plants, improved operations and maintenance.
Aggregated actions have improved air emissions, and reduced a variety of air emissions such as methane, nitrogen oxides, and sulphur dioxide.
Odour remains one of the most complained of issues. Nuisance odours affect how people can live their lives. By taking strong action, we have consistently reduced the number of people subjected to major odour issues and we are continuing to eliminate nuisance odour from sites right across the country.
The European Court of Justice has the power to impose substantial fines against the State for non-compliance with environmental law, through with environmental infringement cases. There has been a substantial improvement on the number of cases, now down to 9 open infringements, from 32 at the start of 2010. The closure of these cases was a direct result of proactive and prioritised legislation and enforcement.
OUR FOCUS INTO THE FUTUREThere are many environmental issues and enforcement activities occurring right across the spectrum of environmental regulation, but regarding enforcement a particular priority on protecting and improving compliance is being placed on;
➤➤ Clean water: Provide for a holistic approach to water protection and management
➤➤ Better regulation: Combine better regulation activities and risk risk-based approaches
➤➤ Preventing environmental damage: Prevent future environmental damage and drive remediation of contaminated sites.
➤➤ Evidence-based decision making: Continuously improve the timeliness and quality of our environmental data to support evidence-based decision making
➤➤ Working with others: Engage and network with other environmental sectors/organisations
➤➤ Human health: Promote the essential role that protecting the environment plays in improving the health of the population.

vForeward
FOR
EWA
RD
CONTENTS1. ENVIRONMENTAL ENFORCEMENT 1
1. Summary of Ireland’s Enforcement Activity 2
1.1 Responding to Non Compliance with European Legislation 3
1.2 New Initiatives in Enforcement & Implementation 8
2. WASTE CHALLENGES 11
2. Waste Enforcement 12
2.1 Introduction 12
2.2 EPA enforcement activities 13
2.3 Implementation Challenges 32
2.4 Future challenges 34
3. CHALLENGES IN SAFEGUARDING WATER 35
3.1 Introduction 36
3.2 EPA wastewater enforcement 37
3.3 Septic Tanks 40
3.4 Local authority wastewater enforcement 40
3.5 Local authority and Department of Agriculture, Food & Marine farm inspections 42
3.6 Bathing Water Enforcement 44
3.7 Future Challenges 45
4. CHALLENGES IN KEEPING AIR CLEAN 47
4. Implementing Measures to Breathe Cleaner Air 48
4.1 Introduction 48
4.2 Future Implementation Challenges 59
5. LARGE INDUSTRIAL SITES 61
5. Large Industrial Sites 62
5.1 Introduction 62
5.2 EPA IPPC enforcement activities 67
5.3 Future Implementation Challenges 72

viFO
REW
AR
DFocus on Environmental Enforcement in Ireland 2009–2012
ACKNOWLEDGEMENTSThe report was prepared under the direction of Gerard O’Leary, Kieran O’Brien and David Flynn, Office of Environmental Enforcement.
Production of the report involved many people and was managed by Larry Kavanagh and Cormac Mac Gearailt. The Environmental Protection Agency wishes to express its appreciation to the many County and City Council staff (inducing the 34 RMCEI coordinators in each local authority), Department of Environment, Community and Local Government, and EPA staff involved in preparing this report.
Photographs John Doheny, EPA, unless otherwise credited.

01ENVIRONMENTAL ENFORCEMENT

2 Focus on Environmental Enforcement in Ireland 2009–2012
1
ENV
IRO
NM
ENTA
L EN
FOR
CEM
ENT
1. SUMMARY OF IRELAND’S ENFORCEMENT ACTIVITY
The EPA is at the forefront of environmental protection and policing. We ensure that Irelands environment is protected and we monitor changes in environmental trends to detect early warning signs of neglect or deterioration. Protecting the environment is a huge responsibility and we work with a number of organisations that carry out specific environmental functions including 34 local authorities who play a key role alongside the EPA in environmental enforcement, the National Parks and Wildlife Service, An Garda Síochána, Inland Fisheries Ireland , and the Health Service Executive.
The Office of Environmental Enforcement (OEE) is an office within the EPA dedicated to the implementation and enforcement of environmental legislation in Ireland. The core objectives of the Office of Environmental Enforcement are to bring about improved compliance with environmental legislation in Ireland and to ensure that those who flout environmental law and cause environmental pollution as a result of their actions are held to account.
The OEE is directly responsible for enforcing EPA licences granted to waste, industrial and other activities. It also supervises the environmental protection activities of local authorities, through auditing their performance, providing advice and guidance, and, in appropriate cases, issuing binding directions.
Together, the Environmental Protection Agency and the local authorities have the combined responsibility for regulating over 8,100 permits across Ireland and enforcing more than 500 environmental protection requirements contained in more than 100 pieces of legislation. Almost 132,000 site inspections on average each year are conducted. Of these, 115,000 per year are planned and the remaining 17,000 are in response to complaints, incidents or investigations. Our professional environmental specialists also examine emissions monitoring data submitted by licensees and permit holders.
Inspections are focused on the Waste and Water areas, which by their nature require a more intensive enforcement approach. A total of 50,000 waste inspections per year were conducted, including 2,500 inspections of waste exports under trans-frontier shipment regulations and 1,000 EPA audits. In the water emissions and waste water activities, 70,000 pollution inspections per year are conducted.
For air and noise issues, an average of 6,000 inspections per annum in total are carried out. Much reliance is also put on the producer responsibility initiatives, such as farm plastics, tyres, plastic bags, and electrical goods. In these areas, an average of 4,500 inspections per year are carried out.
Investigation and resolution of complaints by members of the public is a significant function for the EPA and local authority environmental enforcement teams. Between the EPA and local authorities about 57,000 environmental complaints each year (with a close-out rate of 93%) are dealt with. Investigations may lead to the taking of an enforcement action, resolving the issue, or requiring no further action. Some sites attract very large numbers of complaints, and where these complaints are upheld by the evidence available, strong enforcement action follows.
EPA and local authorities carry out, on average, 12,000 enforcement actions per annum with 70% related to waste, 9% related to wastewater, 10% related to agriculture, 6% related to air and 5% related to noise. These enforcement activities have resulted in 900 court prosecution proceedings being brought to court each year.

3
1
ENV
IRO
NM
ENTA
L EN
FOR
CEM
ENT
Environmental Enforcement
1.1 RESPONDING TO NON COMPLIANCE WITH EUROPEAN LEGISLATION
The European Court of Justice (ECJ) has the power to impose substantial fines on Member States, for non-compliance with environmental law, through environmental infringement cases. Unresolved infringements not only indicate ongoing environmental problems, but also damage Ireland’s international reputation.
There are now 93 open infringement cases against Ireland, which is a substantial improvement from 2010 when Ireland had 32 open infringements. The closure of these 23 cases, including those relating to Drinking Water quality, Shellfish Waters, Dangerous Substances and Urban Wastewater Discharge Directives was a direct result of proactive and prioritised engagement with the Commission with enforcement of new regulations and provision of guidance.
One significant case regarding waste activities, the landmark ECJ judgement4 (20th April 2005), has resulted in addressing structural and administrative deficiencies as well as site specific cases. In addition, other issues such as unregulated End of Life Vehicles (ELVs) and other illegal sites or orphan sites, such as Irish Ispat Ltd., were subsumed under the case. Many of the measures outlined below are further detailed within this report, and a comprehensive response to the case is available on the Department of Environment, Community and Local Government (DoECLG) website5.
1.1.1. Examples of Structural or Administrative Measures to address Waste ECJ case
➤➤ Addressing waste licensing, permitting of waste collectors and registration of dealers and brokers
➤➤ Increasing landfill capacity and infrastructure
➤➤ Increasing Recovery/recycling rates over a short space of time and improving the capacity situation
➤➤ Setting up an enforcement network (NIECE) to facilitate efficiencies and consistency amongst environmental regulators.
➤➤ Consolidating the TFS (Trans Frontier Shipment of waste) situation with one Competent Authority and thereby improving efficiency
➤➤ Rolling out and continuing to implement a National Environmental Complaints Procedure
➤➤ Developing an enhanced capacity to detect and respond to illegal waste activities
➤➤ Supervision of local authorities environmental obligations by the EPA
3 As of 1 January 2013, the EU legislation in respect of which 12 infringement cases were outstanding against Ireland by the European Commission is as set
out below. Those three infringement cases marked with an asterisk were closed between 1 January and 18 September 2013.
C-158/12:Directive 1996/61/EC ( Integrated Pollution Prevention and Control Directive) - Permitting Arrangements
C-66/06 * :Directive 97/11/EC (Environmental Impact Assessment Directive) - On-Farm Developments
C-188/08 * :Directive 75/442/EEC (Waste Framework Directive) - Inspection of Septic Tanks
C-215/06 Directive 85/337/EEC (Environmental Impact Assessment Directive) - Retention Permission
C-50 /09 *:Directive 85/337/EEC (Environmental Impact Assessment Directive) - Split-Decision Making
C-494/01:Directive 75/442/EEC (Waste Framework Directive) - Waste Disposal Arrangements
C-316/06:Directive 91/271/EEC (Urban Waste Water Directive) - Urban Waste Water Treatment Arrangements
C-418/04:Directive 79 /409/EEC (Wild Birds Directive) - Implementation Issues
2011/0834:Directive 2009/31/EC (Geological Storage of Carbon Dioxide) - Non Transposition
2012/4028:Directive 2003/35/EC (Public Participation in Decision Making and Access to Justice in Environmental Matters) - Implementation Issues
2007/2238:Directive 2000/60 /EC (Water Framework Directive) - Transposition Issues
2010/2161:Directive 92/43/EEC (Habitats Directive) - Enforcement Issues
4 Case C494/01 whereby the European Court of Justice ruled that Ireland had infringed the Waste Framework Directive by generally and persistently failing to
fulfil its obligation to fulfil various articles under that Directive
5 http: / /www.environ.ie /en /Publications /Environment /Waste /FileDownLoad,30458,en.pdf

4 Focus on Environmental Enforcement in Ireland 2009–2012
1
ENV
IRO
NM
ENTA
L EN
FOR
CEM
ENT
Addressing the site-specific cases has involved many measures such as:
➤➤ Removal of historically dumped waste
➤➤ Provision of alternative high-value habitat where waste removal was not feasible
➤➤ Regularisation and licensing of unregulated sites
➤➤ Closure and remediation of sites
Some remaining cases have been progressed, but still remain open e.g. Irish Ispat and a small number of remaining ELV illegal operators. These cases continue to be pursued with the goal of closing the remaining cases completely.
1.1.2. Working Together: NIECE Network
Complex legislation and many different enforcement authorities, often with overlapping jurisdictions results in the need for a high degree of coordination. The national enforcement network (NIECE-the Network for Ireland’s Environmental Compliance and Enforcement) brings key enforcement bodies together within a framework of coordination and cooperation in their enforcement efforts.
The core objective of the network is to improve co-operation and coordination between the various agencies involved in enforcement of environmental legislation so that “a higher and more consistent” standard of environmental protection can be achieved in Ireland. The enforcement network now numbers over 1,000 public sector staff registered from about fifty agencies within Ireland.
1.1.3. NIECE network achievements during 2009 to 2012:
➤➤ Co-ordinated the environmental enforcement activities to tackle national environmental issues, e.g. repatriation of illegal waste from Northern Ireland and follow up criminal investigations; investigation of fuel laundering.
➤➤ Developed and sustained the capacity of enforcement agencies to detect, investigate and prosecute environmental crime, e.g. multiagency checkpoints to detect the movement of unauthorised End of Life Vehicle waste.
➤➤ Developed and maintained a consistent approach to the enforcement of environmental legislation, e.g. Septic tank inspections registration and training.
➤➤ Built capacity in the implementation, application and enforcement of environmental legislation through coaching, mentoring and the use of electronic media, e.g. waste workshops on calculating landfill gate fees; workshops on food waste, outcomes and inspection planning.
➤➤ Promoted the use of best practice by local authorities through the development of guidance for legislation, inspection and prosecution techniques, e.g. waste characterisation guidance, enforcement of vehicle refinisher regulations, odour investigation and battery regulations.
➤➤ Provided a mechanism for feedback to policy makers and legislators on the practical implementation of policies and regulations, e.g. Sewage Sludge, Nitrates and Solvents National Regulations respectively.
Building on earlier experiences, by 2010 the network had developed a systematic approach to enforcement planning for all authorities based on the adoption of risk-based methodologies to determine priorities. The EPA is currently conducting a review of the NIECE strategy and will continue to adjust and improve the network to maintain its relevance and effectiveness.
A core part of the network is the working groups of experienced practitioners from relevant agencies to tackle particular implementation issues. These working groups exchange best-practice and develop plans for tackling illegal dumping of waste, historic landfills, mining regulations, sewage sludge, end of life vehicles, biodegradable municipal waste, food waste, waste tyres, drinking water (water safety plans), wastewater, water quality issues (nitrates, farm inspections, septic tanks), solvents/deco paints, noise and air quality matters (coal bans), and WEEE and battery regulations.
Other valuable functions of the enforcement network include a mechanism to review legislation, and to coordinate

5
1
ENV
IRO
NM
ENTA
L EN
FOR
CEM
ENT
Environmental Enforcement
the production of guidance. The enforcement network facilitated the development and application of: a Code of Practice for the Development of an Enforcement Policy for Unauthorised Waste Activities, Drinking Water Safety Plans, Pollution Release & Transfer Register and a Septic Tank inspection regime. The previously published guidance manual was updated to include the enforcement of battery regulations and vehicle refinisher regulations during 2010. The use of an extranet serves as the knowledge and contact portal for new and existing members and was redeveloped and rebranded in 2011, and launched in 2012.
1.1.4. How others view the NIECE network
A report “Re-Finding Success in Europe: The Challenge for Irish Institutions and Policy” from the National Economic and Social Council (2010) 6 concluded that the NIECE network shows that enforcement is as much about fortifying various organisations’ capacity to implement environmental policy as sanctioning them for not doing so.
Following on from an earlier Organisation for Economic Co-operation and Developments (OECD) 20087 review encouraging Ireland to “exploit agility, informality and openness and reduce duplication of coordination efforts”, the OECD in a 2010 report8 stated that:
“The Environmental Enforcement Network [NIECE]….. provides a mechanism for concentrating resources and promoting co-ordination and coherence across administrative divisions”.
1.1.5. Better Regulation
Better Regulation is a strategic priority of the EPA with the aim of focusing regulatory effort on environmental outcomes, a reduced administrative burden, targeted inspections and effective use of sanctions and other deterrents. During the period from 2009, the EPA has been refining its enforcement approach to better achieve environmental outcomes. We now have a greater focus on using risk-profiling to determine the enforcement effort and a greater emphasis on better regulation. This includes more effort to prevent crime and taking a problem-solving approach to enforcement action. The approach aims to achieve improvements in specific problem areas by applying a focus of resources onto specific problems and priority enforcement areas. The EPA is implementing this methodology and is encouraging, through the enforcement network (NIECE), local authorities to take a similar approach. This form of focused, risk-directed enforcement is gaining international acceptance as representing a best-practice approach to environmental compliance.
1.1.6. EPA’s Supervisory Role of local authorities
The EPA has conducted integrated audits of local authorities to ensure that they are:
➤➤ Implementing their Enforcement Plans;
➤➤ Applying the National Environmental Complaints Procedure, and;
➤➤ Fulfilling local authority Statutory Environmental Functions – focussing on Waste, Water and Air sectors.
Integrated audits provide a forum where issues such as the local authority Enforcement Plan and complaints handling structures can be examined. Up to 8 local authorities are selected per annum for auditing on a risk ranking basis. More specific issues can also be examined by the EPA under the local authority performance complaints process.
6 National Economic and Social Council (NESC) 2010. “Re-finding Success in Europe: The Challenge for Irish Institutions and Policy”
http://www.nesc.ie/dynamic/docs/NESC%20122_Refinding%20Success%20in%20Europe.pdf
7 OECD 2008. OECD Public Management Reviews - Ireland: Towards an Integrated Public Service (http://www.oecd.org/document/31/0,3746,
en_2649_37427_40529119_1_1_1_37427,00.html
8 OECD 2010. Environmental Performance Reviews: Ireland 2010. (http://www.oecd.org/document/42/0,3343,
en_33873108_33873500_45123050_1_1_1_1,00.html?rssChId=33873500 )

6 Focus on Environmental Enforcement in Ireland 2009–2012
1
ENV
IRO
NM
ENTA
L EN
FOR
CEM
ENT
TABLE 1.1 Examples of environmental enforcement issues examined during EPA integrated audits
Issue Findings & Actions Required
Enforcement Policy on Unauthorised Waste Activities (Section 60)
4 In place at all local authorities audited.
Entry of Historic Waste Sites on the Section 22 Register 4 All audited local authorities had completed their Section 22
Registers.
Enforcement of Waste Packaging & Tyre Regulations 4
✚
Enforcement of the Waste Packaging Regulations was generally found to be satisfactory.
The quality of Tyre Regulation inspections varied. EPA providing guidance to local authorities on Waste Tyre Regulation inspections. Will continue to assess in future audits.
Illegal Dumping Line Implementation and Tracking 4 Illegal dumping line complaints were generally found to be handled
in a satisfactory manner.
Implementation of Network Specialist Waste Circulars 4
✚
Network Specialist Waste Circulars were on file at all audited local authorities.
The level of implementation of circulars varied. Recommendations made on gypsum waste inspections and healthcare waste assessment.
Enforcement of Water Pollution Act Licences 4
✚
The Section 4 and 16 Registers were up to date in all bar one case.
Requirement for certain local authorities to ensure enforcement of discharge licence conditions through adequate linkage between monitoring and enforcement.
Enforcement of Solvent Regulations 4
✚
Enforcement of the Solvent Regulations was generally found to be satisfactory.
Repeat minor non-compliances occurring on renewal of certificates. Requirement to ensure repeat minor non-compliances are dealt with at renewal of certificates.
4 = Completed
✚ = Further work required

7
1
ENV
IRO
NM
ENTA
L EN
FOR
CEM
ENT
Environmental Enforcement
1.1.7. Complaints
Improved handling of complaints by local authorities (as illustrated by the data in Table 1.2 i.e. less use of Section 63) has lessened the EPA’s need to rely on its supervisory/legal powers under Section 63 of the EPA Acts. This is an indicator of a more robust national complaint handling system than in previous years. Local authorities now have more consistent investigation and reporting regimes for dealing with complaints from members of the public. There is a need to maintain the continued improvement in complaint response to continue to enhance public confidence and enhance the effectiveness of environmental investigations.
TABLE 1.2: Use of Section 63 and Complaint Referrals to LAs
2006 2007 2008 2009 2010 2011 2012
S63 power used 151 62 19 28 199 13 11
Referrals 253 317 205 179 203 150 141
Total 404 379 224 207 222 163 152
Table 1.3 details the full range and number of complaints handled by local authorities during the reporting period.
TABLE 1.3: Reported total complaints received by local authorities 2009–2012
2009 2010 2011 2012
Waste (non-litter) 10,613 9008 9791 6,644
Water/Wastewater 3,775 5476 6803 3,200
Air/Odour 1,667 1586 1535 1,539
Noise 1,826 1556 1422 1,390
Sub total 17,881 17,626 19,551 12,773
Litter 41,723 40,990 35,749 36,508
Total 59,604 58,616 55,300 49,281
9 Excludes Section 63s (34 No.) issued to each local authority in 2010 on a single ELV related issue. See Chapter 2 - Waste

8 Focus on Environmental Enforcement in Ireland 2009–2012
1
ENV
IRO
NM
ENTA
L EN
FOR
CEM
ENT
1.2 NEW INITIATIVES IN ENFORCEMENT & IMPLEMENTATION
The notion of “smart enforcement” means “using the most appropriate enforcement or compliance tools to address the most significant problems to achieve the best outcomes as quickly and effectively as possible.”10 Learning better ways to implement legislation by its nature involves constantly reviewing and evaluating the effectiveness and mix of various enforcement tools, and makes the case for practitioners to experiment to a degree on complimentary and new ways of mixing the use of enforcement tools. The following initiatives demonstrate that degree of creativity, good use of resources, value for money, and delivery of tangible results.
1.2.1. Sector Based Enforcement
Building on earlier experiences of using risk-based approaches, the EPA is now focusing some of its enforcement effort on problems that are persistent within certain sectors. This determines what is specifically examined during audits, inspections and other interactions with the sector (e.g. the sampling and monitoring of emissions and the investigation of incidents and complaints, sectoral meetings, guidance). Engagement on a sectoral level also delivers relevant information and guidance to operators of similar activities, with common issues, and promotes improved environmental performance across a sector.
1.2.2. On-line Enforcement Management System
The EPA has developed a web-based portal for licensees that allow the EPA and licensees to communicate electronically. This portal eliminates the need for licensees to submit documents by any other means. Reports go directly to the relevant inspector and the progress on issues is visible to the licensee and the EPA in real time.
A new historic landfill application system in 2012 provides for detailed risk assessment based on contemporary geospatial data and known waste details are also available. The system facilitates developing a structured remediation plan and will decrease the time required to issue historic landfill licenses.
The recent implementation of a national septic tank regime has led for the first time to a paperless enforcement system.
1.2.3. National Environmental Complaints Line
The EPA launched the national environmental complaints line in 2006, to encourage reporting of illegal dumping of waste. Since then the line has been expanded to accept calls about all environmental media. Members of the public can report illegal dumping or water pollution etc. via the 24 hour lo-call telephone number 1850 365 121, and local authorities, the Gardaí and the EPA follow up on the information provided by the public, as appropriate. The Illegal Dumping Phone Line was expanded to a National Environmental Complaints Line along with the launch of a phone app in 2012 to handle all types of environmental complaint for all local authorities in Ireland on a 24 hour, seven days a week basis.
10 Corporate Environmental Behavior and the Effectiveness of Government Interventions, Introductory Remarks by M. Stahl, USEPA Director, April 26-27,
2004, Washington DC.

9
1
ENV
IRO
NM
ENTA
L EN
FOR
CEM
ENT
Environmental Enforcement
1.2.4. See it? Say it! Smartphone App
The EPA has produced an App to allow easy submission of environmental complaints. This App makes it easy to report environmental pollution with the Global Positioning System (GPS) location and a photo submitted at the touch of a button. The App can also be used to make a phone call to the National Environmental Complaints Line 1850 365 121.
1.2.5. Fixyourstreet.ie and other shared IT services
The fixyourstreet.ie website facilitates the reporting of non-emergency issues including litter and illegal dumping to County and City Councils all over Ireland. The publicly accessible website also allows citizens to monitor the response and interact with the Council on the issue reported through the system.
1.2.6. Smartphone efficiencies in Roscommon County Council
Roscommon County Council has successfully completed a pilot project using smartphones to improve efficiencies in the completion of household waste surveys. The advantages include real-time update of databases, elimination of paper, increased productivity, ease of task management and integrated GPS and photo data.
From this: To this And this…
5811Household Waste Survey CLOONSHANVILLE
New Accepted In Progress Complete
Map View (Satellite)
+-
➤➤➤

10 Focus on Environmental Enforcement in Ireland 2009–2012
1
ENV
IRO
NM
ENTA
L EN
FOR
CEM
ENT
1.2.7. Future Focus of Environmental Enforcement
➤➤ Environmental legislation is designed to protect the quality of our environment, our health and to our economy – the various enforcement authorities aim to implement the legislation in a consistent and proportionate way.
➤➤ Ireland now has 500 environment protection requirements in 100 pieces of legislation. Engaging with people and businesses to increase their understanding of environmental law is an essential component of enforcement. This helps to prevent non-compliance by helping people to understand what is expected and to make it as straightforward as possible to comply.
➤➤ Ireland has a robust environmental enforcement network founded on a ‘better regulation’ approach to compliance aimed at achieving environmental outcomes. A cornerstone of Ireland’s enforcement approach is the NIECE network that is used to coordinate the resources and priorities of our enforcement teams.
➤➤ EPA and its partners in the NIECE network will be focusing on the priority areas of clean and protected water, preventing environmental damage, protecting human health and stopping illegal waste activity. To achieve this we will put three elements at the centre of our future enforcement strategy;
1. a clear focus on results and delivering value for society;
2. the adoption of a problem-solving approach that identifies risks and patterns of non-compliance to concentrate enforcement resources on the most important environmental risks; and
3. Strengthening enforcement networks to share intelligence, to share expertise and to align enforcement
effort across multiple agencies.

v Continued tackling of illegal waste activities with a renewed, coordinated
focus in this area
v Addressing environmental legacy at closed waste facilities,
and
v Preventing environmentally costly clean-ups, by strengthening the requirements
for financial provisions to be made for environmental liability.
02 WASTE CHALLENGES

12
2
WA
ST
E C
HA
LL
EN
GE
SFocus on Environmental Enforcement in Ireland 2009–2012
2. WASTE ENFORCEMENT
2.1 INTRODUCTIONThe EPA and local authorities together regulate approximately 4,500 waste authorisations. Local authority regulation covers over 600 waste facility permits, 240 ‘recycling bring bank’ permits, and over 1,000 waste collection permits, with EPA regulating 200 waste licences (mainly waste transfer stations) and 2,500 authorisations covered by Certificates of Registration in accordance with the Waste Management (Facility Permit and Registration) Regulations 2007 and 200811.
In the period 2009 to 2012, the primary issue for waste management enforcement has been the effect of the weak economy, and resultant closure of waste management companies some of which have resulted in very large environmental liabilities. The state has taken on the burden of cleaning up the sites posing the most environmental risk. The EPA is putting an increased focus on adequate financial provision for environmental liabilities, closure and aftercare. In this regard, EPA is ensuring financial liabilities /closure arrangements12 are put in place for specific priority sites. A number these arrangements have been completed for certain sites, with the remainder to be progressed in the coming period. Updated guidance and changes to licence requirements regarding financial liabilities /closure arrangements are also being completed. While court action has been taken where deemed appropriate, the EPA has also noted that certain provisions of law regarding this area are unsatisfactory and will be making reform recommendations. This re-focus by EPA reflects a European wide spotlight on environmental liabilities of insolvent companies.
11 Waste Management (Facility Permit and Registration) Regulations 2007 and 2008, S.I. No. 821 of 2007 and 86 of 2008.
12 More specifically, Environmental Liabilities Risk Assessment (ELRA), Closure Restoration and Aftercare Management Plan (CRAMP) and Financial Provisions
(FP)

13
2
WA
ST
E C
HA
LL
EG
NE
S
Waste Challenges
2.2 EPA ENFORCEMENT ACTIVITIES
2.2.1. EPA Waste licensed facilities
Twenty-four facilities (e.g. Arthurstown and Kinsale Road Landfills, Guardian Environmental Services Ltd, and a number of dredging facilities), representing about 20% of overall numbers, closed down, surrendered, or ceased to operate during 2009–2012, indicating a trend that the waste industry is consolidating into a smaller number of larger facilities (see Table 2.1).
TABLE 2.1. Number of EPA waste licences13
Sector Facilities licensed
(excluding surrenders)
Total operational
facilities
Total closed, ceased and under
threshold or not commenced
Total surrendered
in 2009–20111
Landfill sector 80 292 51 0
Hazardous waste transfer stations 21 16 5 1
Non-hazardous waste transfer station 63 54 9 2
Compost sector 16 9 7 1
Dredging and soil recovery sector 6 4 2 3
Civic amenity sites sector 8 5 3 1
Incinerator sector3 33 1 2 0
Contaminated land sector 3 0 3 0
Total 200 118 82 8
1 Not counted as licensed sites once surrendered.
2 Of these 29, 19 accept general municipal waste and the remaining accept various non-municipal waste, including inert waste and peat ash, or are temporarily
closed.
3 This does not include 11 incineration activities associated with non-waste IPPC activities such as pharmaceutical plants incinerating their own waste, and
cement plants co-incinerating waste with fuel. Only one waste-licensed incinerator has commenced operation during 2009–2012.
2.2.2. Landfills
The number of open landfills decreased from over 200 in the mid-1980s, to 48 in 2009 and to 10 in 2013. The 36 open waste-licensed landfills at the end of 2009 consisted of 30 municipal solid waste (MSW), four inert and two mono14 landfills (there were 12 other landfills associated with industrial activities). This reduced to 29 in 2011, and there has been a further significant reduction (to 10 in 2013) in the number of landfills accepting MSW. Considerable uncertainty remains within the waste market.
EPA priority areas for the landfill sector are landfill gas management, leachate management, cover management, diversion of biodegradable
municipal waste (BMW) from landfill, and compliance with Section 53(a)(8) (i.e. determination of landfill gate fees).
13 Beginning 2012
14 Landfills that accept single waste types from a single source.

14
2
WA
ST
E C
HA
LL
EN
GE
SFocus on Environmental Enforcement in Ireland 2009–2012
These waste sectoral plans were notified to and discussed with trade sectoral organisations (e.g. Irish Business and Employers’ Confederation (IBEC), Irish Waste Management Association) as well as directly communicated to all licensees. This approach results in more focused inspections and better tracking of key environmental outcomes.
Infrastructural improvements at landfills continue the trend to reflect national policy15, which previously aimed to have “an integrated network of some 20 or so state-of-the-art facilities incorporating energy recovery and high standards of environmental protection”, and is further evidenced in the current numbers of active landfills and the standard of management at these landfills (see Figure 2.1). This policy has been superseded by the July 2012 Policy16 – ‘A Resource Opportunity ‘- which envisages working to “eliminate our use of landfill for this purpose [disposal] within the next decade”.
A 2010 review of progress indicates the improvements since pre-licensing (Figure 2.1), including full lining, leachate and gas management at all operation landfills.
FIGURE 2.1 Review of landfill infrastructure improvements between 2001 and 201017
Landfillcover
Gas management and odour control
Monitoring (leachate, landfill gas, surface water and groundwater)
Landfilllining
Leachate management
Pre-Licensing˜ 1997
Post-Licensing2010
100% of operating landfills have leachate collection
Cover used at ~30% of landfills
4 with gas management
10–40% carried out some form of monitoring
26% of siteswere lined
33% of sites were collecting leachate
Final capping or temporary capping in 91% of landfills
100% (i.e. all 31) operational and established landfills have gas management
100% of landfills carry out monitoring of leachate, landfill gas, surface water and groundwater
100% of operatinglandfills (which require liners) are lined
91%
100%
100%
100%
100%
13%
10%to
40%
26%
33%
30%
15 Changing our Ways – see http: / /www.environ.ie /en /Environment /Waste /.
16 A Resource Opportunity - Waste Management Policy in Ireland – also at www.environ.ie /en /Environment /Waste /.
17 12010 Focus on Landfill Report – www.epa.ie/pubs/reports/waste/stats/focusonlandfillinginireland.html

15
2
WA
ST
E C
HA
LL
EG
NE
S
Waste Challenges
The last unlined landfill ceased waste acceptance for disposal during 2009, and no waste is currently disposed in unlined landfills in Ireland, mirroring the Landfill Directive18 requirement that landfilling shall only occur in lined facilities.
2.2.3. Energy recovery from Municipal Waste
Ireland’s first municipal waste incinerator, Indaver Ireland Ltd (W0167-02), Duleek, Co. Meath, commenced operation in 2011, under strict EPA supervision involving air monitoring, residue analysis /management and waste acceptance checks (see also Chapter 4). This facility exports electricity to the national grid generated by the incineration activity.
In addition, use of waste-derived fuels (e.g. solid recovered fuel19) for energy generation in cement plants has increased. Three cement plants are currently licensed to use this method (licensed for greater than 250,000T/anum of alternative fuel) with only two currently processing waste. This results in less use of fossil fuels, and diverts waste from landfill. Air monitoring activities at these installations is on-going.
The EPA is also concerned, and taking strong enforcement action, regarding appropriate classification of waste at licensed facilities and the appropriate export of waste for use as RDF/SRF (refuse-derived fuel). This is further discussed later in the chapter.
2.2.4. Repatriation of waste from Northern Ireland
Costing over €4.5 million to date, waste dumped illegally in Northern Ireland from the Republic of Ireland in the period 2001/2004 was repatriated from three sites:
➤➤ 28,000t of waste from sites at Slattinagh, Co. Fermanagh, and near Trillick, Co. Tyrone, were excavated and brought to a licensed landfill in Donegal.
➤➤ Approximately 20,000t of waste and ~500 m3 of leachate from Ballymartin, Kilkeel, Co. Down, were excavated and brought to a landfill/waste water treatment plant (WWTP) in Louth.
Evidence was collected during the operations and made available in both jurisdictions to enable further investigations to be carried out. The Northern Ireland Environment Agency’s Transfrontier Shipment staff continue to work closely with Ireland’s National Transfrontier Shipment Office (NTFSO) on joint enforcement actions. Intelligence is shared on a regular basis. For example, three joint /simultaneous inspections were carried out in 2011, on both sides of the border.
The NTFSO more generally in the enforcement of waste transfer regulations is focusing on 21 of Ireland’s ports, and on the increasing number of registered waste dealers and brokers.
18 Directive 1999/31/EC
19 EN 15359:2011 SRF – Specifications and classes prepared by the CEN defines solid recovered fuel
16
2
WA
ST
E C
HA
LL
EN
GE
SFocus on Environmental Enforcement in Ireland 2009–2012
BOX 2.1. Capacity-building measures undertaken by the EPA to assist operators in understanding and complying with legal/technical waste requirements
Capacity-building measure Type: See www.epa.ie for guidance
Waste characterisation guidance – BMW content calculating tool developed for municipal waste
➡ Online Tool
Enforcement policy guidance – How to produce an enforcement policy for unauthorised waste activities
➡ Guidance – Code of Practice
Landfill gas and cover guidance – Gas emission from landfills and draft guidance on landfill cover
➡ Guidance
Odour impact assessment1 – Guidance assessing odours arising from landfills and other types of operations
➡ Guidance
Landfill gate fees – Gate fee calculator tool ➡ Online Tool
Landfill Conference – Waste workshop ➡ Conference
Legacy landfills
➤➤ An electronic register for legacy landfills
➤➤ A geographic information system (GIS)-based risk assessment tool for legacy landfills2
➤➤ Supplement to the Code of Practice: Environmental Risk Assessment for Unregulated Waste Disposal Sites to guide local authorities
➡➡
➡
Online Register
Online Risk Assessment Tool
Supplementary Guidance: Code of Practice
1 Environmental Protection Agency (2010) Air Guidance Note 5 (AG5) – Odour Impact Assessment Guidance for EPA Licensed Facilities.
2 The potential savings to the public purse are approximately €7m from use of this tool.
2.2.5. EPA Audits and inspections - EPA licensed facilities
The EPA carried out over 1,240 audits and inspections between 2009-2012 (1,029 in the previous 3-year reporting period) with specific attention directed towards more problematic sites (e.g. odour-causing landfills) in the higher enforcement categories (A-sites) – see Table 2.2.
Over 770 water and landfill gas monitoring visits were carried out by the EPA, which is an increase on the previous period.
TABLE 2.2 EPA site based activities summary 2009–2012
2009 2010 2011 2012
Audits & Inspections 341 315 304 285
Water Monitoring 203 207 221 149
Gas Monitoring1 35 52 53 7
1 In addition, 29 surface air emission surveys were carried out at EPA-licensed landfills in 2009, with 30 completed in 2010. These surveys determine the
adequacy of operation and management of the landfill gas control systems at these sites.

17
2
WA
ST
E C
HA
LL
EG
NE
S
Waste Challenges
2.2.6. Product compliance
Regulations20 are in place that restricts the use of certain hazardous substances in products. In certain cases, the enforcement responsibility for these regulations is split between the EPA and the local authorities. Local authorities have a very significant role in this area and are responsible for enforcement of many Producer Responsibility Initiatives (PRIs) (e.g. packaging and WEEE). Inspection details are given in Table 2.3.
TABLE 2.3 Local authority producer responsibility waste inspections 2009–2012
Producer responsibility inspections 2009 2010 2011 2012
WEEE inspections 963 998 823 882
Battery inspections 892 473 816 872
ELV inspections 546 561 352 391
Farm plastics 140 65 92 78
Plastic Bag Levy 1,573 800 683 655
Packaging inspections 2,244 813 1,187 1,078
TOTAL 6,358 3,710 3,953 3,956
The EPA undertakes inspections to monitor compliance under the product compliance requirements for electrical and electronic equipment (EEE), batteries and some paint products. Additionally, during the 2012 Product Compliance Monitoring Campaign, the EPA had six samples of fungicides tested for persistent organic pollutant compliance. These are detailed in Tables 2.4 and 2.5 and are in addition to the inspections undertaken by local authorities.
TABLE 2.4 WEEE/ Batteries enforcement activities by the EPA in 2009–2012
2009 2010 2011 2012
Retailer Inspections 134 215 395 39
Distance seller Inspections 21 20 0 0
Special Investigations 0 0 16 0
Producer audits 52 46 35 45
Trade-exhibition Inspections (events) 4 1 0 0
Prosecutions closed out 2 4 1(Battery
Regulations)
1(combined
WEE and battery)
TABLE 2.5 Product compliance enforcement activities by the EPA in 2009–2012
Samples tested
2009 2010 2011 2012
Electrical and electronic equipment 22 25 25 25
Batteries 22 25 20 20
Paints, varnish and vehicle finishing product – 27 – 20
Packaging – 22 10 20
Fungicide – – – 6
TOTAL 44 99 55 91
20 Restriction on use of hazardous substances – RoHS S.I. No. 341 of 2005

18
2
WA
ST
E C
HA
LL
EN
GE
SFocus on Environmental Enforcement in Ireland 2009–2012
2.2.7. Complaints at EPA licensed waste facilities
Analysis of the total number of complaints at EPA licensed waste facilities clearly indicates that the majority relate to landfill odour (see Figure 2.2).
FIGURE 2.2 Causes of complaints about waste licence facilities during the period
The reduction in odour complaints regarding waste facilities as outlined in Figure 2.3 continues. Over half of the landfills assessed in 2009 (for surface emissions potentially causing odour) showed improvements in terms of reduced emissions when compared with 2008 surveys.
FIGURE 2.3. Trend in waste complaints received, 2004–2012
2,000
1,800
1,600
1,400
1,200
1,000
800
600
400
200
02004 2005 2006 2007 2008 2009 2010 2011 2012
Total Complaints
Odour Complaints
A small number of facilities gave rise to a significant proportion of complaints, and targeted action at landfill facilities improved the overall picture dramatically (see Table 2.6 and Figure 2.4).
Odour
90%
Other
6%Air
Noise
2%
Water<1%
2%

19
2
WA
ST
E C
HA
LL
EG
NE
S
Waste Challenges
TABLE 2.6 The most offending facilities and reasons for odour improvements 2009–2012
Number of complaints
Landfill 2009 2010 2011 2012 Reason for reduction in complaints
W077-02 Corranure1 – Cavan County Council
620 240 <10 <10 Cessation of waste acceptance and improved landfill gas control are the main reasons for the improvement.
W047-02 Kerdiffstown – Neiphin Trading Ltd.
310+ 360+ 120 <10 Complaints mainly relate to odour and an underground fire. Commencement of remediation, extinguishing the fire, beginning of landfill gas and leachate control measures and improved community liaison resulted in improvements and reduced complaints.
1 Prosecuted twice by the EPA.
FIGURE 2.4. Reduction in landfill odour complaints at the two most offending facilities 2009–2012 (size of rectangle indicates number of complaints)
A significant reduction was seen in these odour complaints, which were contributed to by the extensive use of EPA site agents to monitor odours and site practices. Emission surveys were also carried out to contribute to site improvements. The employment of site agents has allowed for prolonged, focused odour assessments at landfill facilities with a history of complaint. It also helps in building trust with communities. A number of problem sites have closed, which will reduce complaints; however, improved gas control, capping and remediation is also vital.
Table 2.7 lists the 10 most complained-about waste facilities. Greater than 80% of complaints are caused by landfills and the vast majority of these are due to odour. Six of the prosecutions taken during the period were targeted at these facilities. Five of these included charges relating to “interference with the environment beyond the facility boundary” – an odour-related licence condition. Indeed, the largest fines issued in relation to odour emissions were issued against Cavan County Council (Corranure Landfill) and Oxigen Environmental Limited. Oxigen Environmental Limited was fined a total of €780,000, and Cavan County Council a total of €260,000 in the case taken by the Director of Public Prosecutions for odour nuisance based on evidence from the EPA.
2009
950
2010
600
2011 >1302012
˜20

20
2
WA
ST
E C
HA
LL
EN
GE
SFocus on Environmental Enforcement in Ireland 2009–2012
TABLE 2.7. Most complained-about waste facilities (totals 2009–2012)
Organisation/Facility Reg. no. Total complaints
% of complaints
Corranure Landfill W0077-02 860+ 19
Kerdiffstown Landfill W0047-02 790+ 17
Knockharley Landfill W0146-01 470+ 10
Ballynagran Residual Landfill W0165-02 270+ 6
East Galway Residual Landfill Ltd W0178-02 250+ 5
Youghal Landfill W0068-03 240+ 5
Ballaghaderreen Landfill W0059-03 240+ 5
Greyhound Recycling and Recovery Transfer Station W0205-01 190+ 4
Oxigen Environmental Ltd Transfer Station W0152-03 130+ 3
Carbury Compost Ltd W0124-01 95+ 2
Total 3,500+ 78% of all waste
complaints
2.2.8. EPA enforcement actions
The EPA issued almost 850 notifications of non-compliance (see Table 2.8) to waste licensees and took a total of 31 waste21 prosecutions (this includes nine prosecutions of non-licensed companies for breaches of WEEE/Battery Regulations and one dumping at sea prosecution) between 2009 and 2012. In addition, almost 25% of IPPC case charges related to poor handling/management of industrial or agricultural waste. In effect approx. half of the cases taken were of waste licensed facilities, or included significant charges relating to waste management issues. Given that only about ¼ of licences are waste licences, this reflects the disproportionate enforcement effort that is required in regulating this sector.
TABLE 2.8. Numbers of notifications of non-compliance (NONCs) issued to waste licensees in 2009–2012
2009 2010 2011 2012
NONCs issued NONCs issued NONCs issued NONCs issued
200+ 220+ 215+ 190+
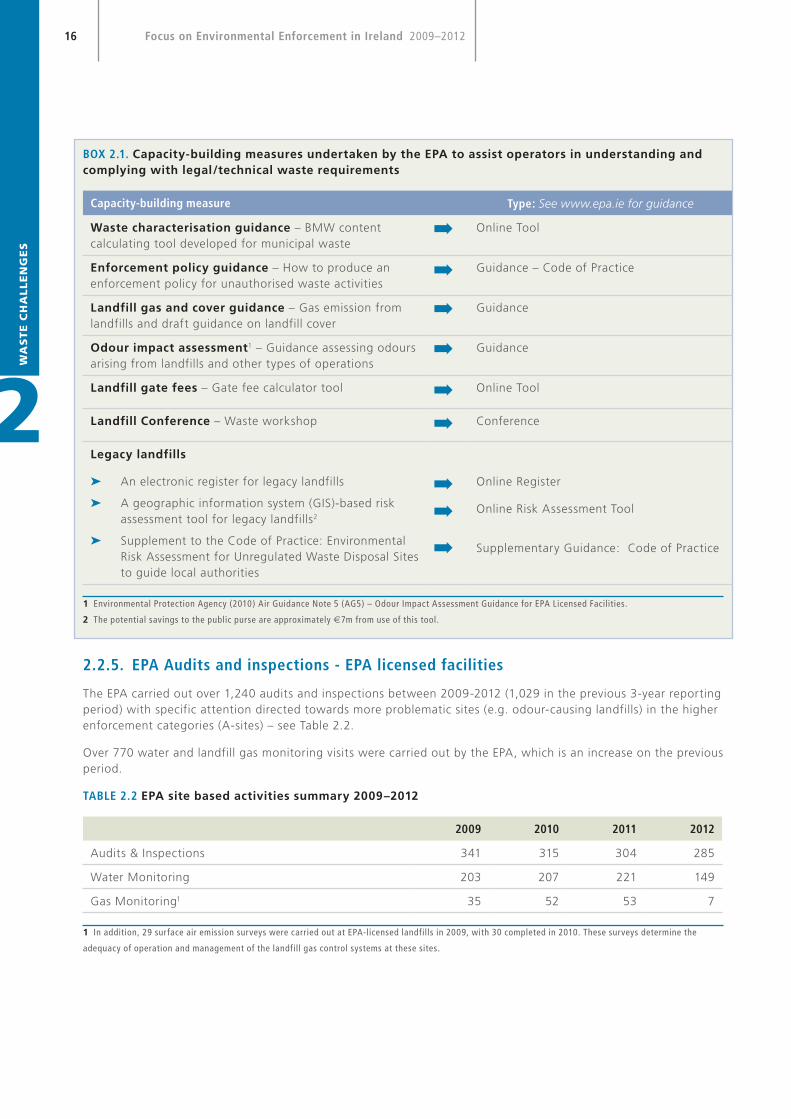
The issues on which prosecutions of waste licensees were taken during the period are outlined in Figure 2.5. There is a roughly equal breakdown between issues of waste handling and tonnage in excess of permitted limits, with the remainder relating to emissions to air/water.
21 one waste-licensed case consisted of 4 related prosecutions
21
2
WA
ST
E C
HA
LL
EG
NE
S
Waste Challenges
FIGURE 2.5 Prosecution issues breakdown for waste-licensed facilities 2009–2012
Emmissions to Air & Water
37% 33% 30%
Materials HandlingFailures
(Bundling/Capping) & Reporting Failures
UnauthorisedWaste transfer
/ tonnage exceeded
2.2.9. Fines
Almost €2.1m in fines and Agency costs were awarded in 2009–2012 in all cases combined, with almost €1.6m relating specifically to Waste-licensed facilities (includes DPP cases). In 2012 alone, almost €1.1 million was awarded against Oxigen Environmental Limited and Cavan County Council in relation to a waste case taken by the DPP. These significant fines display the seriousness with which the courts view such licence breaches.
In July 2009, the courts imposed a fine of E350,000 on South East Recycling Company Limited for exceeding its annual waste tonnage limit. In November 2010 at the Court of Criminal Appeal, the company appealed against the sentence. On hearing the appeal, the Court imposed a fine of €200,000 in its place. These two cases make up a significant proportion of the total fines & costs awarded by the courts in all waste cases combined.
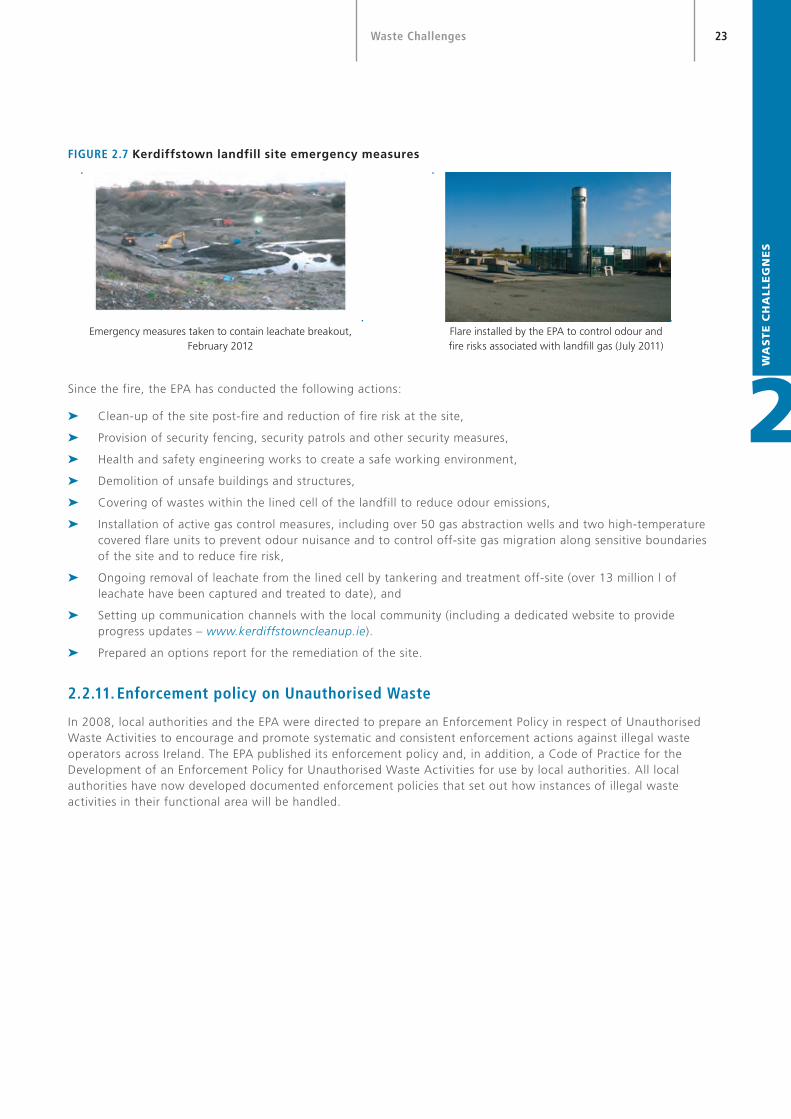
FIGURE 2.6 (a) Number of Waste prosecutions compared to IPPC & others
40 IPPC Licenced facilities prosecuted
(Almost 25% of IPPC prosecutions were waste related)
21 Waste Licenced facilities prosecuted
10 non-Waste Licenced facilities prosecuted
including WEEE and DaS
600Total IPPC Licences
40 200
TotalWaste
Licences
21 10

22
2
WA
ST
E C
HA
LL
EN
GE
SFocus on Environmental Enforcement in Ireland 2009–2012
FIGURE 2.6 (b) Waste and other prosecutions by magnitude of total Fines & costs
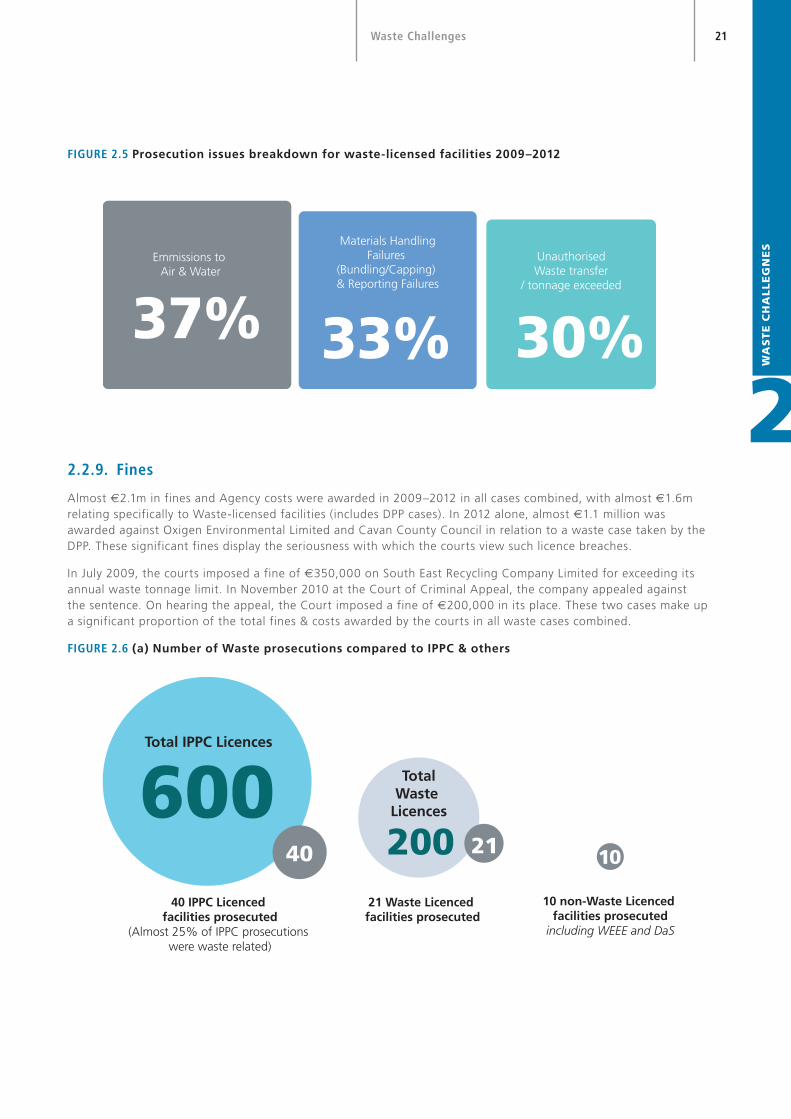
2.2.10. Kerdiffstown Landfill
The facility at Kerdiffstown was operated by Neiphin Trading Limited under a waste licence issued by the EPA in 2003. The licence granted by the EPA provided for excavation and processing/recovery of waste previously illegally deposited at the facility. It also allowed for deposit of non-hazardous and inert residual waste from the recovery process in purpose built lined cells. The site consisted of an extensive recycling facility, now mostly dismantled, an authorised lined landfill which had been partially filled with waste and a large un-lined area in which substantial quantities of waste have been deposited. The presence of such large quantities of waste and the lack of appropriate infrastructure to manage polluting emissions gives rise to the risk of environmental pollution. On EPA request, orders were made by the High Court in 2010 requiring three companies previously involved in the site to clean it up. This has not happened to date and the Agency has taken measures to prevent and limit pollution from the materials on the site.
A fire broke out on Kerdiffstown landfill in early 2011 where significant unauthorised waste had been dumped over a number of years. Kildare Fire Service successfully extinguished the fire with EPA environmental technical support. The EPA is now taking measures at this site to prevent and limit pollution from the site and the number of complaints has reduced dramatically. The EPA set up communication channels with the local community, including a dedicated website to provide updates on clean-up progress (www.kerdiffstowncleanup.ie). Emissions of landfill gas and of leachate have reduced as a proportion of these emissions are now captured for appropriate treatment. This temporary measure will need to be completed into a permanent remediation resolution for the site (Figure 2.7).
Waste Licensed Facility Prosecutions (21)
€1,650k
40 IPPC licenced and non-licensed
facilities prosecuted(includes €200k for
2 DPP cases)
10 non-Waste Licenced facilities prosecuted
€470k€47k
23
2
WA
ST
E C
HA
LL
EG
NE
S
Waste Challenges
FIGURE 2.7 Kerdiffstown landfill site emergency measures
Since the fire, the EPA has conducted the following actions:
➤➤ Clean-up of the site post-fire and reduction of fire risk at the site,
➤➤ Provision of security fencing, security patrols and other security measures,
➤➤ Health and safety engineering works to create a safe working environment,
➤➤ Demolition of unsafe buildings and structures,
➤➤ Covering of wastes within the lined cell of the landfill to reduce odour emissions,
➤➤ Installation of active gas control measures, including over 50 gas abstraction wells and two high-temperature covered flare units to prevent odour nuisance and to control off-site gas migration along sensitive boundaries of the site and to reduce fire risk,
➤➤ Ongoing removal of leachate from the lined cell by tankering and treatment off-site (over 13 million l of leachate have been captured and treated to date), and
➤➤ Setting up communication channels with the local community (including a dedicated website to provide progress updates – www.kerdiffstowncleanup.ie).
➤➤ Prepared an options report for the remediation of the site.
2.2.11. Enforcement policy on Unauthorised Waste
In 2008, local authorities and the EPA were directed to prepare an Enforcement Policy in respect of Unauthorised Waste Activities to encourage and promote systematic and consistent enforcement actions against illegal waste operators across Ireland. The EPA published its enforcement policy and, in addition, a Code of Practice for the Development of an Enforcement Policy for Unauthorised Waste Activities for use by local authorities. All local authorities have now developed documented enforcement policies that set out how instances of illegal waste activities in their functional area will be handled.
Emergency measures taken to contain leachate breakout, February 2012
Flare installed by the EPA to control odour and fire risks associated with landfill gas (July 2011)

24
2
WA
ST
E C
HA
LL
EN
GE
SFocus on Environmental Enforcement in Ireland 2009–2012
2.2.12. Local authority enforcement activities
Local authorities received between 50,000 and 60,000 complaints annually in relation to environmental issues during 2009–2012 with approximately 68% of these related to litter and ~17% related to other waste matters (~10,000/year) (see Figure 2.8).
FIGURE 2.8 Categories of complaints received by local authorities (approx. 50 -60 k/year)
The improvement in local authority handling of environmental complaints seen during the previous period has been maintained. Whereas in 2006–2008, approximately one in three complaints made to the EPA about local authorities’ handling of complaints resulted in the use of legal notices from the EPA, this is now down to one in ten. Nevertheless, almost eighty cases required the issuance of Section 63 notices22 to local authorities over the period. Thirty-four of these cases followed from a single issue – the requirement that unauthorised ELV sites (e.g. car scrapyards) be comprehensively tackled by local authorities.
2.2.13. Control of unauthorised ELV sites (or car scrapyards)
The EPA spent considerable resources during 2011/2012 working with local authorities to target the issue of unauthorised car scrapyards23, resulting in the number of illegal sites falling from 157 to less than 10 in 2013 – a reduction of greater than 90% (see Figure 2.9). A number of multi-agency actions took place during the period, often overcoming difficult operational obstacles. While the majority of remaining sites are small (with significantly less than 100 cars), two large sites remain.
Litter
Waste(non-litter)
17%WaterWaste water
9%
Air/Ordour
Noise
68%
3%
3%
22 Section 63 of the EPA Act 1992 as amended
23 This is an aspect of the 2005 ECJ waste case against Ireland and it is a National Priority to have the illegal sites dealt with so that, among other reasons,
legitimate operators are not undermined.

25
2
WA
ST
E C
HA
LL
EG
NE
S
Waste Challenges
FIGURE 2.9 Reduction in number of unauthorised ELV sites
FIGURE 2.10 Unauthorised ELV site before and after clean-up
Figure 2.10 shows an unauthorised ELV site adjacent to the river Lee in Macroom, Co. Cork. Cork County Council issued a notice to the owner to clean up and remove the almost 140 vehicles held without authorisation or environmental control. This was not carried out and the operator was prosecuted and fined under the Waste Management Acts. Cork County Council subsequently arranged for the removal of the illegally held vehicles.
0
50
100
150
200
250
300
350
400
Q1 2013Q4 2012Q4 2011Q3 2011Q1 2011Q4 2010Q1 2010Q2 2009Q3 2008
329340
225
157138
46 20 11 6

26
2
WA
ST
E C
HA
LL
EN
GE
SFocus on Environmental Enforcement in Ireland 2009–2012
2.2.14. Local authority audits and inspections
Almost 15,000 inspections relating to waste facility permitted sites, waste collection permits, and vehicle checkpoints were completed by local authorities between 2009 and 2012. Excluding litter inspections, local authorities conducted over 105,000 waste inspections during 2009–2012 (see Table 2.9 for further details).
TABLE 2.9 Local authority waste inspections 2009–2012
Type of inspection 2009 2010 2011 2012
Waste-permitted facilities 1,872 1,648 1,347 1,043
Pre-shipment inspections of TFS loads 766 805 809 41
Inspections – waste collection permit holders (offices) 480 834 1,077 645
Inspections of Certificate of Registration sites 1,862 4,588 3,585 3,142
Vehicle checkpoints 328 160 241 213
ECJ/Reasoned Opinion sites inspections 90 114 74 14
Tyre outlet inspections 585 717 594 583
Joint inspections agreed within the Unauthorised Waste Network group
22 6 18 43
Hazardous waste sectoral inspections 289 1,447 234 338
Construction and demolition (C&D) handling inspections at development sites (e.g. Waste Management Plans)
184 116 60 99
Backyard burning inspections 137 268 380 534
Other inspections (not included in above) 1,403 2,655 6,605 7,594
Producer responsibility inspections
WEEE, battery, ELV, farm plastics, plastic bag, packaging (total)
6,358 3,710 3,953 3,956
Non-routine inspections
Waste complaint /incident investigation (non-litter) 7,082 13,254 5,355 7,787
Inspections in relation to waste facility permit activities operating without authorisation
974 796 1,391 983
Litter patrols/inspections
Routine litter patrols /investigations 25,624 29,686 20,178 31,721
Total ~48,000 ~61,000 ~44,000 ~59,000
The NTFSO at Dublin City Council carried out almost 2,500 inspections regarding trans frontier shipment of waste between 2009 and 2011, with over 3,500 inspections carried out in 2012. Additionally, the NTFSO participated in Operation DEMETER24, a World Customs Organisation initiative aimed at preventing the illegal shipment of waste. This served to raise awareness of illegal trans boundary waste shipments and the facilitation of practical co-operation worldwide between Customs administrations and environmental agencies.
24 See www.wcoomd.org.

27
2
WA
ST
E C
HA
LL
EG
NE
S
Waste Challenges
2.2.15. Management of fuel laundering waste
There was a dramatic increase in diesel laundering waste dumping incidents during the reporting period, with 37 incidents recorded in Monaghan alone in 2011. The scale of the dumping incidents can vary from one container to up to 45 intermediate bulk containers ( IBCs)25. Laundering has also been uncovered in Donegal and Louth with laundered fuel seized in many areas, e.g. Galway, Athlone and Dublin.
At a typical diesel laundering dumping incident, a number of bodies are required on-site, such as:
➤➤ Fire brigade personnel
➤➤ Specialist contractors/lifting equipment
➤➤ An Garda Síochána
➤➤ Council plant to transport the waste
➤➤ Council environment staff
➤➤ Customs
Since 2004, it has been estimated that Monaghan County Council has dealt with 276 t of sulphuric acid wash, 360t of contaminated absorbent and 200t of bleaching earth sludge. All of this material was exported to hazardous waste treatment facilities in either Holland or Germany for treatment at a cost of over €1.5 million. In 2011, Louth County Council dealt with over 1,000t of such waste at a cost of over €1 million.
Local authorities have had to take measures to protect watercourses and to temporarily turn off public water supplies/monitor private wells due to dumping close to private dwellings. The waste is a significant health and safety risk because of its acidic nature (see Figure 2.11). Roads can also be left in a very dangerous/slippery condition and must often be cleaned due to the risk of traffic accidents.
FIGURE 2.11 Fuel laundering waste
25 Each IBC container can hold approximately 1,000 l of waste.
Dumped IBCs of fuel laundering waste Dumped IBCs of fuel laundering waste
Trailer of dumped IBCs Dedicated waste facility developed by Louth County Council for handling fuel laundering waste

28
2
WA
ST
E C
HA
LL
EN
GE
SFocus on Environmental Enforcement in Ireland 2009–2012
2.2.16. Unauthorised waste
Local authorities carried out 38,000 inspections specifically in relation to unauthorised waste activities (including vehicle checkpoints, backyard burning, inspections relating to waste complaints, and unauthorised waste facilities). Additionally, over 100,000 routine litter patrols /inspections were carried out between 2009 and 2012.
Examples of other, less routine, types of inspection/enforcement actions are given in Table 2.10 and Figures 2.12 and 2.13.
TABLE 2.10 Other enforcement actions by local authorities
Issue examples Response
Tackling litter and illegal dumping, backyard burning
Extreme measures – Local authorities sometimes have to employ extreme measures to tackle illegal dumping, such as using rope access to clean litter black-spots, see Figure 2.12.
High-tech measures – Use of high-tech equipment in tackling littering is becoming the norm. Indeed, funded by the EPA STRIVE programme1, researchers at NUI Maynooth are working with local authorities to examine and deploy novel and emerging technologies to address litter and illegal dumping.
Fingal County Council installed a CCTV camera at a particular dumping blackspot. This camera is connected to a Garda station which continuously monitors it, along with Fingal County Council Waste Enforcement Officers. Other councils, e.g. North Tipperary County and Waterford City Councils, often use CCTV cameras at bottle banks to prevent dumping and littering.
Innovative measures – Local authorities can invoke the use of community service orders. Persons are sentenced to community service orders throughout the country and councils are ideally placed to identify suitable tasks that would be of benefit to the community. This can include beach clean-ups, litter picks, graffiti removal, etc. The Probation Service provides all necessary training/indemnity/equipment – council involvement can be limited to identifying tasks and confirming that tasks are carried out, but not necessarily supervising. Figure 2.13 shows an example of such work carried out to the benefit of communities in conjunction with Cork County Council.
Limerick County Council has combined resources with the local Fire Authority in relation to the Burning Regulations 2009, and put a plan in place to reduce unauthorised burning (permission procedure in place) and unnecessary fire brigade call-outs.
Unauthorised waste activities – multi-agency co-operation
Local authorities are co-operating with multiple agencies such as the Gardaí, Revenue Commissioners, Customs and Excise and the Dept of Social Welfare in order to better tackle unauthorised waste activities. An example of this by Limerick County and City Council is outlined in Figure 2.14.
Laois County Council carried out a billboard campaign around Portlaoise and Mountrath to highlight illegal dumping and bogus waste collectors. Billboards were run on cycles in June and October.
1 See www.epa.ie /researchandeducation /research /research and www.imws.nuim.ie /eer

29
2
WA
ST
E C
HA
LL
EG
NE
S
Waste Challenges
FIGURE 2.12 Rope access needed for a clean-up of dumped waste from the cliff face at the Céide Fields, Ballycastle, Co. Mayo. Mayo County Council secured a conviction in relation to this dumping, including a fine, costs and a contribution towards the clean-up
FIGURE 2.13 Clean-up of dumped waste/litter in Co. Cork. This work was carried out through community service orders for Cork County Council – see Table 2.10.
BEFORE AFTER

30
2
WA
ST
E C
HA
LL
EN
GE
SFocus on Environmental Enforcement in Ireland 2009–2012
2.2.17. Multi-agency co-operation by NIECE members
Ongoing enforcement efforts in relation to monitoring the unauthorised movement of waste across counties have included regional organisation of enforcement activities. For example, during 2011 nine local authorities organised a concerted regional action programme to tackle unauthorised waste movement. These included:
Council authorities that participated Non-council authorities that participated
1. Cork County Council
2. Cork City Council
3. South Tipperary County Council
4. North Tipperary County Council
5. Waterford County Council
6. Waterford City Council
7. Limerick County Council
8. Limerick City Council
9. Wexford County Council
1. An Garda Síochána
2. Revenue/Customs
3. Special Investigation Unit of the Dept of Social Protection
4. Eircom and ESB
Multi-agency checkpoints were organised across all the aforementioned local authority areas. Information arising from these enforcement activities is being investigated and further joint operations are planned.
What happens during a multi-agency operation?
A multi-agency operation was undertaken and co-ordinated by Cork County Council in 2011. It involved personnel from Customs Enforcement, the Special Investigation Unit of the Dept of Social Protection, An Garda Síochána, the Waste Enforcement (Cork County Council), Planning Enforcement, Dog Wardens and the Housing Section of the Northern Division of Cork County Council. Four sites in the target area were visited, with the following actions taken:
Three truckloads of waste comprising of ELVs and associated parts and other waste were removed off-site
One vehicle was seized for marked mineral-oil (green diesel) offences
A large number of people were interviewed by the Special Investigation Unit of the Dept of Social Protection in relation to social welfare issues
Five horses and two dogs were impounded
Monitoring will continue to ensure that the unauthorised activities do not resume

31
2
WA
ST
E C
HA
LL
EG
NE
S
Waste Challenges
FIGURE 2.14 Action against an unauthorised facility
Figure 2.14 shows an example of an action taken against an unauthorised scrap (end of life vehicles-ELV) Facility. Unauthorised waste collection vehicles were confiscated during a joint intervention by Limerick County and City Council, including the Garda Síochána, Customs, Revenue and the Dept of Social Protection. Nearly 30 vehicles and 90 t of scrap metal, engines and other vehicle parts were removed, along with seven horses and 20 dogs.
2.2.18. Legacy landfills
There are 290 local authority landfills that operated between 1977 and 1997 without specific authorisation. Under the historic landfill regulations26, local authorities are required to identify all closed landfills that operated in this period to carry out a risk assessment, apply to the EPA for a certificate of authorisation, and implement remediation actions as directed.
In 2009, the EPA established an electronic register and a GIS-based risk assessment tool for legacy landfills. Currently, a total of 290 sites that fall under these regulations are entered in the electronic register.
The DECLG is funding a pilot project on environmental risk assessment of legacy landfills. Since this project commenced in 2009, approximately 40 site investigations have been completed. The EPA has provided assistance by developing guidance to ensure site investigations are targeted and avoid potential unnecessary and costly investigations.
26 Waste Management (Certification of Historic Unlicensed Waste Disposal and Recovery Activity) Regulations, 2008 (SI No. 524 of 2008).

32
2
WA
ST
E C
HA
LL
EN
GE
SFocus on Environmental Enforcement in Ireland 2009–2012
2.3 IMPLEMENTATION CHALLENGES
2.3.1. Changing waste policy
Waste management and recycling targets are primarily driven by the Waste Framework Directive27, to bring Ireland closer to a “recycling society”. The objective is to avoid waste generation and to use waste as a resource. The European Commission communication on the “Roadmap to a Resource Efficient Europe28” aims to transform the EU economy onto a resource-efficient path that will bring increased competitiveness and new sources of growth and jobs through cost savings from improved efficiency, commercialisation of innovations and better management of resources over their whole life cycle.
“A Resource Opportunity”, published in July 2012, specifies the measures through which Ireland will make the further progress necessary to become a recycling society. The national policy has a clear focus on resource efficiency and the virtual elimination of landfilling of municipal waste.
Many of the areas covered in the policy have implications for waste enforcement for local authorities and the EPA. The enforcement issues include:
➤➤ Reorganisation of waste planning regions with consequent implications for waste enforcement – the expectation is that 10 existing regions will be reduced to three regions,
➤➤ A strengthened waste collection permitting system, with inspection and enforcement to be increased in this area,
➤➤ A review of producer responsibility initiatives, e.g. packaging, WEEE, etc.,
➤➤ A requirement in law that householders avail of a waste collection service or demonstrate how their waste is being managed,
➤➤ A review of range, level and application of penalties for breaches of waste legislation,
➤➤ Introduction of household Food Waste Regulations regarding separate collection, and
➤➤ Provision of financial guarantees for EPA waste-licensed facilities.
Most significantly, a review of waste enforcement generally, with a particular focus on the role of the EPA and local authorities, is being completed. The establishment, in conjunction with An Garda Síochána, of a team of waste enforcement officers for dealing with cases of serious criminal activity is to be prioritised.
Many of the measures set out in the policy have already commenced, e.g. the multi-agency approach (see Figure 2.14), a dedicated National Waste Collection Permit Office (NWCPO) (Offaly County Council), EPA consultation on Guidance on ‘Assessing and Costing Environmental Liabilities29, and Dublin City Council Bye-laws regarding availing of a waste collection service30. The implementation of the policy will have a significant impact on how enforcement is carried out in Ireland.
2.3.2. EPA licensed facilities
The waste sector consumes a large amount of EPA and local authority enforcement resources and EPA waste licensed activities have overall a relatively poor compliance record. While the review period has seen a 20% reduction in the number of operational EPA waste-licensed facilities it is hoped that the consolidation of the industry will lead to a significant improvement in compliance with environmental law. EPA priorities in this sector include include adequate financial provision for environmental liabilities, proper classification of waste of material exported, regulation of legacy landfills, and meeting future EU targets for both biodegradable waste and recovery of other waste streams.
The EPA Strategic Plan 2013-2015 “Working with Others for a Better Environment” identifies preventing future environmental damage and its cost to the tax payer resulting from the closure of activities. As a priority, waste
27 Directive 2008/98 /EC
28 Resource Efficient Europe (SEC(2011) 1067 final} & {SEC(2011) 1068 final}
29 www.epa.ie /pubs /consultation.
30 Dublin City Council (Storage, Presentation and Collection of Household and Commercial Waste) Bye-Laws 2013

33
2
WA
ST
E C
HA
LL
EG
NE
S
Waste Challenges
31 As defined in ‘EPA viewpoint on EWC classification of mixed municipal waste exiting waste management facilities’– see www.epa.ie /pubs /advice /waste /
municipalwaste
32 Thresholds reduced from 25 to 10 t
33 Member States can choose an alternative target of 85% of WEEE generated.
facilities (particularly landfills) continue to pose an environmental risk after closure, with significant financial provision facilitating proper closure and aftercare required. Accurate costing of environmental liabilities and agreement of financial provision is a priority for enforcement
2.3.3. Refuse-Derived Fuel (RDF31)
With the increase in the landfill levy, there has been a significant increase in the quantity of waste being consigned for export as a fuel to recovery outlets in Europe. EPA waste reports indicate a steep increase in the quantities of waste exported as SRF/RDF or as treated waste for recovery from over 90,000 tonnes in 2010, to over 200,000 Tonnes in 2012. Significant amounts of other waste (such as wood or tyres) are also recovered for use as a fuel (>200,000T in 2012). This underlines the need to ensure that the material in question is appropriately classified as RDF, and is not simply municipal waste that has been subjected to minimal treatment. Strong enforcement by the EPA and local authorities at facilities producing RDF is being carried out and will continue, to ensure that appropriate treatment of material is being carried out and relevant quality standards are being met. In addition, the NTFSO will need to monitor shipments of RDF material. There will also be a need to closely monitor storage of such material, as it can pose a fire risk and must not be stored at unauthorised locations.
2.3.4. Historic waste landfills
Despite investigations carried out on 40 sites, only a handful of applications for Certificates of Authorisation have been made to the EPA by local authorities (to carry out necessary remedial works at historic landfills), of which one has been granted. An online historic waste landfill application tool has been produced to assist in these applications. Focusing on high-risk sites, local authorities should proceed with investigating and reducing the environmental impact of these landfills with greater priority.
2.3.5. Packaging Regulations
Local authorities are responsible for the enforcement of the Packaging Regulations. Regulations introduced in 2007 have brought many more businesses into the obligated producer category32. The EPA identified over 5,000 businesses as potential major producers. While the changing economic circumstances may reduce this number, it represents a significant increase on the 2,100 major producers identified previously. This will require effort by the local authorities to ensure that those subject to the regulations are compliant.
2.3.6. Tyres and End of life vehicle recovery
Tyre and ELV recovery rates have not yet been achieved and remain a challenge. Local authorities have a key role to play in the enforcement and recovery/reduction in these waste streams.
2.3.7. Waste Electrical and Electronic Equipment (WEE) Directive
The recast of the WEEE Directive was published in July 2012 and must be transposed into national law in 2014. One of the more challenging aspects of the recast is the collection target, set at 45% in 2016 and 65%33 from 2019, based on the average weight of EEE placed on the market in the previous 3 years. Current targets are based on collection of WEEE per person – against which Ireland compares favourably (in 2011 - 7.6kg per person versus the minimum target of 4kg). Producers of WEEE (i.e. importers and distributors) are increasing efforts to ensure that we meet these more challenging targets.

34
2
WA
ST
E C
HA
LL
EN
GE
SFocus on Environmental Enforcement in Ireland 2009–2012
34 See www.pcbs.ie or epa.ie for further details and full report.
35 Certain pesticide-related substances and industrial chemicals (e.g. PCBs) and unintentionally produced substances (e.g. dioxins).
36 www.pops.ie.
2.3.8. PCBs34 and POPs35
The EPA has prepared a national inventory/management plan for PCBs. The environmentally sound disposal of some PCB-contaminated electrical equipment started during 2009. The EPA maintains the National PCB Inventory and continues to seek out PCB-contaminated materials for inclusion in the inventory. Over 130t of PCBs were identified in 2012, across almost 360 large and small holdings.
Ireland’s National Implementation Plan for the Stockholm Convention on Persistent Organic Pollutants was prepared in 2012. The Plan36 includes an assessment of POPs in Ireland and details the measures put in place to protect human health and the environment from POPs listed under the Stockholm Convention. The Plan also outlines further activities which will be carried out to support the control of POPs.
2.4 FUTURE CHALLENGES Many significant waste challenges have been tackled in the past number of years with considerable successes including improved recycling and recovery, reduced reliance on landfill and disposal, and complaints reduction, amongst others as detailed in this chapter. The 2013 review of waste enforcement governance in Ireland which involves the Department of the Environment, Community and Local Government, EPA, local authorities, and An Garda Síochána - should lead to a smarter waste enforcement system that is better equipped to tackle serious environmental crime, and result in a significant improvement in the remaining poor compliance rates seen in the waste sector.
2.4.1. Key issues for future enforcement
➤➤ Following the discovery of illegal waste sites in the Dublin areas, EPA is undertaking a renewed, coordinated focus on illegal waste activity including strong action against land-owners that facilitate illegal waste storage on their land.
➤➤ The weak economy, combined with relatively poor or non-compliant operation, has resulted in company failures leaving behind significant environmental liabilities at some waste facilities. The EPA is strengthening the requirements for financial provisions to be made for environmental liability.
➤➤ Companies and their directors have benefited from protections given by existing company law to minimise financial liability for environmental responsibilities. Therefore, there is a further requirement that financial provisions put in place are protected from insolvency, and changes to law will be proposed to ensure this.
➤➤ Closer financial scrutiny of companies operating in the waste sector, to include updated guidance, clear rules on when financial provisions are required, and site-by-site assessments of financial provision requirements for priority sites is being carried out.
➤➤ Continuing to ensure that company directors are fully aware of their personal environmental responsibility when managing companies and prosecuting individuals where necessary to achieve environmental compliance and to prevent the State incurring further clean-up costs.
v Maintaining and restoring water quality (under the Water Framework Directive)
by implementing existing legislation
v Better operation of municipal waste water treatment plants, and significant investment
in wastewater infrastructure
v Improving River Basin District Management (RBDM) of our rivers, lakes, estuaries and coastal
waters.
v Ensuring that 500,000 septic tanks do not act as a diffuse pressure on water.
v Better engagement with the farming community to implement the Nitrates Directive
03 CHALLENGES IN SAFEGUARDING WATER

3
CH
AL
LE
NG
ES
IN
SA
FE
GU
AR
DIN
G W
AT
ER
36 Focus on Environmental Enforcement in Ireland 2009–2012
3. ENFORCEMENT MEASURES TO SAFEGUARD WATER
3.1 INTRODUCTIONIreland has better than average water quality in comparison with other EU Member States. 85% percent of the area of groundwater aquifers is at good status, 71% of river channel is at high or good status, 45% of lake area monitored is at high or good status, and 46% of the area of transitional and coastal waters at high or good status.
The EPA and local authorities regulate 4,400 water pollution licences, relating to 1,300 discharge to surface water licences and 3,100 discharge to sewer licences. The EPA is the enforcement authority of bathing water regulations. Over 275,000 water-related inspections in the period 2009–2012 were conducted. Some of the larger classes of inspections are outlined below.
- WFD National Programme and other groundwater protection montioring ~ 60,000
- Inspections/monitoring of Discharge licences to waters and sewers >35,000
- Inspections/Monitoring of Urban Waste Water Treatment Plants(WWTPs) ~ 32,000
There was a concerted effort by the EPA, local authorities, Inland Fisheries Ireland and the Marine Institute to monitor the quality of rivers, lakes, transitional and coastal waters plus groundwater on a three-year cycle at 2,700 river sites, 208 lakes (covering almost 1,000 km2) and 121 transitional and coastal water bodies (over 4,000 km2).
The extent of serious pollution (See Figure 3.1 below) of rivers in Ireland has decreased significantly in recent years. The EPA has prioritised enforcement on these seriously polluted river stretches and worked closely with the Department of the Environment, Community and Local Government and local authorities to ensure that improvements in water quality are taking place. Evidence of this progress is the reduction in the number of seriously polluted river sites from 39 (in 2004) to 11 (end 2011). Approximately 18 km of river channel remains seriously polluted out of 13,200 km surveyed.
FIGURE 3.1. Suspected causes of pollution at 953 polluted river sites surveyed in 2007–2009 (from a total of 2,500 monitoring sites)
Aquaculture
Engineering Works
Peat HarvestingMiscellaneous
Industrial
Forestry
Municipal
4%
1%1%1%47%
Agriculture
37.5%
4.5%
4%
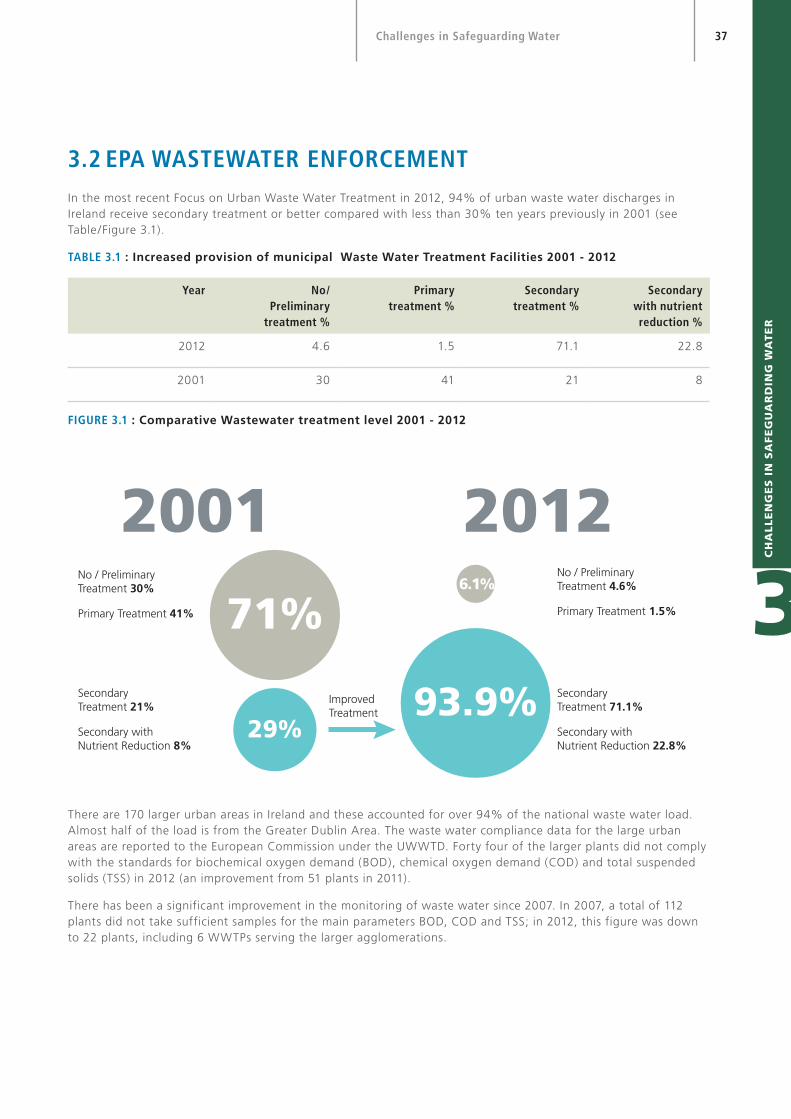
37Challenges in Safeguarding Water
3
CH
AL
LE
NG
ES
IN
SA
FE
GU
AR
DIN
G W
AT
ER
3.2 EPA WASTEWATER ENFORCEMENTIn the most recent Focus on Urban Waste Water Treatment in 2012, 94% of urban waste water discharges in Ireland receive secondary treatment or better compared with less than 30% ten years previously in 2001 (see Table/Figure 3.1).
TABLE 3.1 : Increased provision of municipal Waste Water Treatment Facilities 2001 - 2012
Year No/ Preliminary
treatment %
Primary treatment %
Secondary treatment %
Secondary with nutrient reduction %
2012 4.6 1.5 71.1 22.8
2001 30 41 21 8
FIGURE 3.1 : Comparative Wastewater treatment level 2001 - 2012
There are 170 larger urban areas in Ireland and these accounted for over 94% of the national waste water load. Almost half of the load is from the Greater Dublin Area. The waste water compliance data for the large urban areas are reported to the European Commission under the UWWTD. Forty four of the larger plants did not comply with the standards for biochemical oxygen demand (BOD), chemical oxygen demand (COD) and total suspended solids (TSS) in 2012 (an improvement from 51 plants in 2011).
There has been a significant improvement in the monitoring of waste water since 2007. In 2007, a total of 112 plants did not take sufficient samples for the main parameters BOD, COD and TSS; in 2012, this figure was down to 22 plants, including 6 WWTPs serving the larger agglomerations.
2001 2012
Secondary Treatment 21%
Primary Treatment 41%
Secondary withNutrient Reduction 8%
No / Preliminary Treatment 30%
71%
93.9%29%
6.1%
Primary Treatment 1.5%
No / Preliminary Treatment 4.6%
Secondary Treatment 71.1%
Secondary withNutrient Reduction 22.8%
Improved Treatment

3
CH
AL
LE
NG
ES
IN
SA
FE
GU
AR
DIN
G W
AT
ER
38 Focus on Environmental Enforcement in Ireland 2009–2012
During 2012, the EPA collected approximately 164 effluent samples from secondary treatment plants, primarily during audits of the plants (see Table 3.3). Compliance of these samples with the allowable limits in the licences for the key water quality parameters of biochemical oxygen demand (BOD), chemical oxygen demand (COD), suspended solids, ammonia, total phosphorus, orthophosphate and total nitrogen is shown in Figure 3.2. A total of 69% of plants met all of the standards.
FIGURE 3.2. EPA monitoring results for 2012 showing percentage compliance with allowable limits at plants with secondary treatment or more stringent treatment
Notwithstanding the above improvements, there are still many areas where infrastructural /management improvement is required. Seven large urban areas did not meet the European Union Directive requirement to provide secondary treatment (including Arklow, Cobh and Ringaskiddy). Twenty-eight smaller urban areas have no treatment or just basic screening in place. These must be upgraded to meet the relevant treatment requirements in the Directive. Of the plants that are key pressures on the environment, eight are directly linked with serious water pollution or bathing water failures (see Table 3.2). Due to new bathing water regulations, more plants may be added to the list outlined in Table 3.2 in future.
TABLE 3.2 Wastewater treatment plants linked with serious water pollution or bathing water failures
WWDL Reg. No. Agglomeration Water Services Authority River/ Bathing Area
D0022-01 Waterford City Waterford City Council Johns River
D0342-01 Milford Donegal County Council Maggy’s Burn
D0316-01 Dromcollagher Limerick Ahavarraga Stream
D0212-01 Moville Donegal Bredagh
D0209-01 Raphoe Donegal Swilly Burn
D0116-01 Roscommon Roscommon Jiggy (Hind)
D0092-01 Tubbercurry Sligo Tubbercurry stream
D0198-01 Clifden Galway County Council Clifden Beach
BOD
96
COD
99
SuspendedSolids
96 86 90 94 95
AmmoniaTotal
PhosphorusOrtho-
phospateTotal
Nitrogen
% C
om
pli
an
ce 2
012

39Challenges in Safeguarding Water
3
CH
AL
LE
NG
ES
IN
SA
FE
GU
AR
DIN
G W
AT
ER
The key areas for improvement identified by EPA audits of UWWTPs relate to (a) the provision of a flow meter and composite sampler at the primary discharge; (b) that sampling, analysis and measurements of waste water discharges are carried out in accordance with licence requirements; and (c) that all incidents are reported to the EPA. The number of audits carried out by the EPA is shown in Table 3.3 below.
TABLE 3.3 EPA audits of UWWT plants
2009 2010 2011 2012
EPA audits of UWWTPs (approx.) 24 111 158 200
Indeed, most incidents reported to the EPA are attributed to either issues surrounding the operation and management of waste water treatment plants, or a lack of treatment capacity. Investment is required in infrastructure and a step change is needed in the operation and maintenance of treatment plants in order to reduce incidents. Figure 3.3 shows up to 35% of all incidents are caused by poor management of existing infrastructure.
FIGURE 3.3 Causes of incidents reported to the EPA in 2012
3.2.1. Wastewater enforcement at IPPC/Waste facilities
Discharges to water from industrial, waste and intensive agricultural plants, regulated by IPPC and waste licensing regimes, continue to improve in terms of quality. Examples of environmental outcomes include significant investment in waste water infrastructure to improve compliance and upgraded waste water treatment plants.
Over the period, 2009–2012, the EPA carried out over 2,300 water monitoring visits and over 2,200 inspections of IPPC/waste-licensed facilities.
The EPA took 14 IPPC/Waste prosecutions related specifically to water emissions. Other prosecutions such as of intensive agriculture facilities – while in the first instance related to storage/management of slurry -also ultimately relate to water protection (14 of these were taken also).
35%
Management Issues
34%
Capacity Issues
17%9%
5%
AdverseWeather
Other
Sewer Network Management

3
CH
AL
LE
NG
ES
IN
SA
FE
GU
AR
DIN
G W
AT
ER
40 Focus on Environmental Enforcement in Ireland 2009–2012
3.3 SEPTIC TANKSNew legislation in 201237 required the EPA to put in place a National Inspection Plan for domestic waste water treatment systems, including septic tanks. This work also included a revised code of practice for wastewater treatment and disposal systems in unsewered areas, published for all new-builds in Ireland. The purpose of this is to tackle the issue of approximately 500,000 domestic waste water systems constituting a very large number of small point sources, which may behave as a diffuse pressure on water.
The EPA completed this Plan in January 2013, following a public consultation process in the latter part of 2012. The National Plan addresses the issue in two ways: 1) educating people on the importance to health and the environment of proper maintenance of tanks and 2) the actual inspection process. The inspections will be risk based and will be focused on susceptible environmental receptors in highly sensitive waters, to maximise the outcome. One thousand inspections are to be carried out by local authorities in the first year of the plan.
In 2012, in anticipation of the legislation, the EPA commenced the work of informing and engaging owners on the maintenance of their treatment systems. The EPA now has an extensive web resource which includes general guidance, FAQs and two animations entitled “What you can do to maintain your waste water treatment system” and “What to expect from an inspection”. Information to the public will help owners to maintain their systems and increase the likelihood of their treatment systems passing an inspection - so delivering the best outcome for public health and the environment. Through focussing on owner awareness, the aim is to move to a situation where a majority of homeowners with domestic wastewater treatment systems know what to do to ensure that their systems are well operated and maintained, and act voluntarily to achieve this.
3.4 LOCAL AUTHORITY WASTEWATER ENFORCEMENTLocal authorities conducted 31,800 inspection and monitoring events at UWWTPs (controlled by the local authorities) between 2009 to 2012 and over 35,000 wastewater-related inspections of sites with discharge licences to waters and sewers. An additional 24,300 non-routine water/wastewater inspections in relation to incident investigations were also carried out, with a further 1,200 visits to premises in relation to the control of dangerous substances.
In the period 2009–2012, local authorities issued 2,600 warning letters, 1,257 notices for potential violations of water requirements and 512 prosecution actions.
TABLE 3.4. Local authority inspection and enforcement activities in area of water
Water pollution licences 2009 2010 2011 2012
Discharges to water 1,428 1,486 1,379 1,308
Discharges to sewer 2,183 2110 2,503 3,097
37 Water Services (Amendment) Act 2012

41Challenges in Safeguarding Water
3
CH
AL
LE
NG
ES
IN
SA
FE
GU
AR
DIN
G W
AT
ER
Total licences in force 3,611 3,596 3,882 4,405
LOCAL AUTHORITY INSPECTIONS IN 2009 – 2012
Water/Waste-water-related inspections 2009 2010 2011 2012
Discharge licences to waters and sewers 3,998 5,786 12,673 13,020
Inspections/Monitoring of UWWTPs 8,245 7,698 7,259 8,644
Dangerous Substances Regulations 621 88 498 77
WFD National Monitoring Programme 11,150 8,204 8,686 8,489
Other surface groundwater protection 5,667 4,875 7,055 5,756
Private drinking water schemes 4,700 4,174 6,267 4,069
Local authority drinking water plants 21,172 16,484 21,634 17,768
Farm inspections 4,131 3,835 3,875 4,450
Bathing water 2,913 2,996 2,803 2,188
Subtotal (routine inspections) 62,597 54,140 70,750 64,461
Non routine water/waste water inspections/incident investigations
6,052 5,368 8,026 4,884
Total 68,649 59,508 78,776 69,345
Enforcement notices 2009 2010 2011 2012
Warning letters 815 538 549 757
WATER-RELATED ENFORCEMENT NOTICES ISSUED BY LOCAL AUTHORITIES
Enforcement notices 2009 2010 2011 2012
Section 12 289 161 201 205
Section 16 (unauthorised discharge to a sewer) 3 73 86 3
Section 23 ( request information on water abstraction at discharge of polluting matter)
39 36 28 67
Section 110 (Public Health Act) 5 2 23 31
Section 21 ( Nutrient Management Plan) 1 4 0 0
Total 337 276 338 306
WATER-RELATED PROSECUTIONS BY LOCAL AUTHORITIES
Prosecutions 2009 2010 2011 2012
Section 3 Water Pollution Act 10 3 2 9
Section 4 Water Pollution Act 9 39 8 19
Section 12 Water Pollution Act 17 7 10 19
Section 16 Water Pollution Act 5 84 135 97
Section 23 Water Pollution Act 3 2 0 1
Section 110 Public Health Act 0 3 2 0
Other 5 13 2 8

3
CH
AL
LE
NG
ES
IN
SA
FE
GU
AR
DIN
G W
AT
ER
42 Focus on Environmental Enforcement in Ireland 2009–2012
Total 49 151 159 153
3.5 LOCAL AUTHORITY AND DEPARTMENT OF AGRICULTURE, FOOD & MARINE FARM INSPECTIONS
Local authorities carried out an average of 3,900 farm inspections/annum over the period 2010–2012, with an additional approximately 1,600 inspections conducted by the Department of Agriculture, Food & Marine (DAFM) each year as part of the implementation of the Nitrates Directive and GAP Regulations in Ireland.
Table 3.5 indicates a high average non-compliance rate of 36% arising from DAFM inspections, which is comparable with that found during local authority inspections (34.5%). Additional work is required to develop a suitable regulatory response to improve the overall rate of compliance among the farming community. The number of cross reports from local authorities to the DAFM is low, but is increasing and, in 2012, the number of non-compliances reported to the DAFM was 165.
TABLE 3.5: National summary of local authority inspections and enforcement actions relating to agriculture
Summary 2010 2011 2012
GAP local authority inspections38
No. of individual farm inspections (initial)
(no data available)
2,414 2,295
No. of follow-up inspections (no data available)
1,722 1,734
Total no. of inspections 3,557 4,136 4,029
No. of non-compliant inspections
(no data available)
745 (30%) 886 (39%)
No. cross-reported to the DAFM 48 100 (13%) 165 (19%)
GAP DAFM inspections on behalf of local authorities
No. of inspections 1,368 1,653 1,650
No. of penalties issued 454 (33%) 587 (35%) 661 (40%)
Non-GAP farm related inspections under Water Pollution Act39
No. of individual farm inspections
2,760 3,686 1,794
No. of warning letters 705 976 1,032
No. of Section 12 notices 110 110 115
No. of Section 23 notices 28 20 39
In addition, local authorities carry out a significant number of farm inspections under the Water Pollution Act 1990. These inspections are generally as a result of pollution incidents, complaints or proactive inspections on a catchment basis for the purposes of achieving the objectives of the WFD. The enforcement actions are by means
38 Information provided by SERBD. Data from 2012 incomplete - information not available for 2 local authorities
39 Information from RMCEI returns. 2012 Data has not been verified to date.

43Challenges in Safeguarding Water
3
CH
AL
LE
NG
ES
IN
SA
FE
GU
AR
DIN
G W
AT
ER
of warning letters and notices under Section 12 or 23 of the Water Pollution Act, 1977. Local authorities also conducted over 36,500 visits as part of the WFD National Monitoring Programme and nearly 23,000 more for the purposes of other surface and groundwater protection measures.
Agricultural inspections carried out by the DAFM in the context of cross-compliance arrangements under the Single Payment Scheme represent 1% of all farms on an annual basis. Along with these cross-compliance inspections, a further 1,600 risk-based nitrates inspections are carried out annually by the DAFM on behalf of the local authorities. In addition, 3% of nitrates derogation applicants are also inspected annually.
The DAFM carries out administrative checks on all herd owners to establish if they are adhering to the 170 kg or 250 kg nitrogen per hectare limits as appropriate. This is done by comparing the total nitrogen figures from the Department’s Animal Identification System (AIM) for bovines and other record sources (such as organic manure transfers between farms) against the areas declared under the Single Payment Scheme. Herd owners exceeding these limits are subject to penalties. There is no recording of organic manure from industry imported onto farm holdings i.e. lairage slurry or sludges from industry, municipal sludge, used mushroom compost, etc which could result in increased application over that calculated from animal numbers.
The DAFM has reported that 19% of all non-compliances detected from all inspection regimes in 2010 related to nitrates (see Figure 3.4 for profile of non-compliances).
FIGURE 3.4 Breakdown of non-compliance at farm inspections by reason
40%
Inadequate collectionof manure, org. fertiliserssoiled water and silage effluent
20% 16% 14%
6% 4%
Inadequate managementof storage
Structuraldefects
Failure tominimisesoiled water
Manure stockpilingduring prohibited period
Others

3
CH
AL
LE
NG
ES
IN
SA
FE
GU
AR
DIN
G W
AT
ER
44 Focus on Environmental Enforcement in Ireland 2009–2012
3.6 BATHING WATER ENFORCEMENTThe quality of bathing waters remains high, with 132 of the 136 bathing areas (97.1%) meeting the EU mandatory bathing water quality standards in 2012, and 70% meeting the stricter guide values. This is an increase in compliance with the minimum EU mandatory standards from 93% in 2009.
TABLE 3.6 Comparison of bathing water quality status in the years 2009 to 2012
2009 2010 2011 2012
Number of identified bathing waters 131 131 135 136
Number achieving ‘sufficient’ water quality status 122 127 133 132
% of waters deemed to be of ‘sufficient’ water quality 93.1 96.9 98.5 97.1
Number of bathing water areas achieving ‘good’ water quality 108 118 112 91
% of bathing waters deemed to be of ‘good’ water quality status 82.4 90.0 83.0 66.9
Bathing water quality information is available throughout the bathing season on the EPA ‘Splash’ website www.bathingwater.ie. The Splash site gives as near to real time information as is practicable, on bathing water quality and other related issues that will be of interest to the public.
Local authorities conducted almost 11,000 inspections (including sampling visits) to bathing water sites, with sampling results reported to the EPA during and at the end of each bathing season.
In 2012, just four of the 136 bathing waters failed to achieve sufficient water quality status. Clifden (Co. Galway), Fountainstown (Co. Cork), Rush (Fingal Co. Co.) and Ballyheigue (Co. Kerry). The decrease in beaches achieving ‘good’ status was caused by the significant heavy rainfall noted during summer 2012 (up to 2-3 times normal summer amounts).
45Challenges in Safeguarding Water
3
CH
AL
LE
NG
ES
IN
SA
FE
GU
AR
DIN
G W
AT
ER
3.7 FUTURE CHALLENGESThe Water Framework Directive40 (WFD) was introduced to effect a common approach to safeguarding all water and water-dependent ecosystems (groundwaters, rivers, lakes, transitional waters, coastal waters and wetlands). Ireland has to achieve set water quality targets for 2015, 2021 and 2027.
3.7.1. Key issues for future enforcement:
➤➤ Successful implementation of legislation on drinking water, bathing water, nitrates, waste water treatment, industrial emissions, and priority substances is essential for the achievement of the objectives of maintaining and restoring water quality status in the WFD.
➤➤ A step change in expertise is required in the operation of municipal waste water treatment plants.
➤➤ Improving overall River Basin District Management (RBDM) of our rivers, lakes, estuaries and coastal waters is a significant challenge. A major threat to Ireland’s ability to comply with its WFD obligations derives from continued reliance on an outdated model for water governance, the lack of a common understanding of the problems preventing significant progress, and the need for a shared vision on how to implement and deliver on these obligations.
➤➤ There is a need for significant and continued investment in wastewater infrastructure. Forty four of the 170 large urban areas did not comply with the EU quality standards for wastewater treatment. In addition, sewage from forty two towns and villages is discharged in to the environment untreated. A greater level of investment, along with improved operation of infrastructure is needed to protect our waterways and beaches.
➤➤ Ireland has recently introduced a regulatory system to tackle the issue of approximately 500,000 domestic waste water systems constituting a very large number of small point sources, which may behave as a diffuse pressure on water. The inspections are risk based and will be focused on susceptible environmental receptors in highly sensitive waters, so as to maximise the outcome.
➤➤ The recent progress report on the Nitrates Directive implementation in Ireland points to the need for a different engagement strategy with the farming community. Additionally, increased use of cross reporting by local authorities to the Department of Agriculture is required as part of an overall drive to improve the low compliance rates.
40 www.wfdireland.ie


v While Ireland continues to enjoy good air quality and urban areas benefit from the ban on smoky
coal, continued effective enforcement of existing and new ban areas and/or new fuel types
remains an issue.
v Greater enforcement efforts will be required to reduce fine particulate matter from the air we breathe so that we meet future EU limits and
further improve public health.
v Odour from waste, wastewater and industrial facilities continues to cause problems at some
sites (as further detailed in Chapters 2, 3 and 5).
04 CHALLENGES IN KEEPING AIR CLEAN

4
CH
AL
LE
NG
ES
IN
KE
EP
ING
AIR
CL
EA
N48 Focus on Environmental Enforcement in Ireland 2009–2012
4. IMPLEMENTING MEASURES TO BREATHE CLEANER AIR
4.1 INTRODUCTIONThe EPA and local authorities together regulate 1,200 air pollution authorisations, dealing with almost 70 Industrial type emissions, 200 Solvents emission permits, 600 Deco Paints permits and 350 Petrol Storage and Retail outlets permits. This chapter summarises implementation measures to safeguard our air quality and examines the work of the 34 local authorities and the EPA over 2009–2012 in relation to air quality and noise enforcement issues.
4.1.1. Air and noise enforcement– EPA
Ambient air quality in Ireland has remained among the best in Europe, with only a single breach of the relevant air quality standards noted in 2009 (for NOX
41 at a traffic monitoring site in Dublin). The main sources of the major air pollutants are from transport, industrial activities and static fossil fuel combustion (e.g. power generation or cement production). As an example of recent air quality, Figure 4.1 presents the trend for PM10 for 2002-201142.
FIGURE 4.1. PM10 ambient concentrations trends 2002–2012
5
10
15
20
25
30
Zone DZone C
Zone B traffic
Zone A Background
Zone A traffic
20122011201020092008200720062005200420032002
41 Refers to the mono-nitrogens nitric oxide (NO) (also known as nitrogen monoxide) and nitrogen dioxide (NO2)
42 PM10 are very fine particulates with a diameter of 10 µm or less.

49Challenges in Keeping the Air Clean
4C
HA
LL
EN
GE
S I
N K
EE
PIN
G A
IR C
LE
AN
4.1.2. Controlling national emissions of pollutants
Ireland achieved the national emissions targets for three of the four pollutants (sulphur dioxide – SO2, VOCs and ammonia – NH3) specified in legislation43 . The SO2 data is included as an example in Fig. 4.2. Emissions of oxides of nitrogen (NOX) reduced by 42% between 1990 and 2010, but the 2010 national emission of 72.6 kilotonnes (kt) failed to meet the target value of 65 kt, due mainly to increased road vehicle numbers.
FIGURE 4.2. Trend in SO2 emissions from 1990 to 2010
0
20
40
60
80
100
120
140
160
180
200
Other
Transport
Agriculture & Forestry
Industrial
Residential & Commercial
Power Stations
20122011201020092008200720062005200420032002200120001999199819971996199519941993199219911990
NEC Target
43 National Emissions Ceiling Directive (NEC Directive 2001/81/EC).
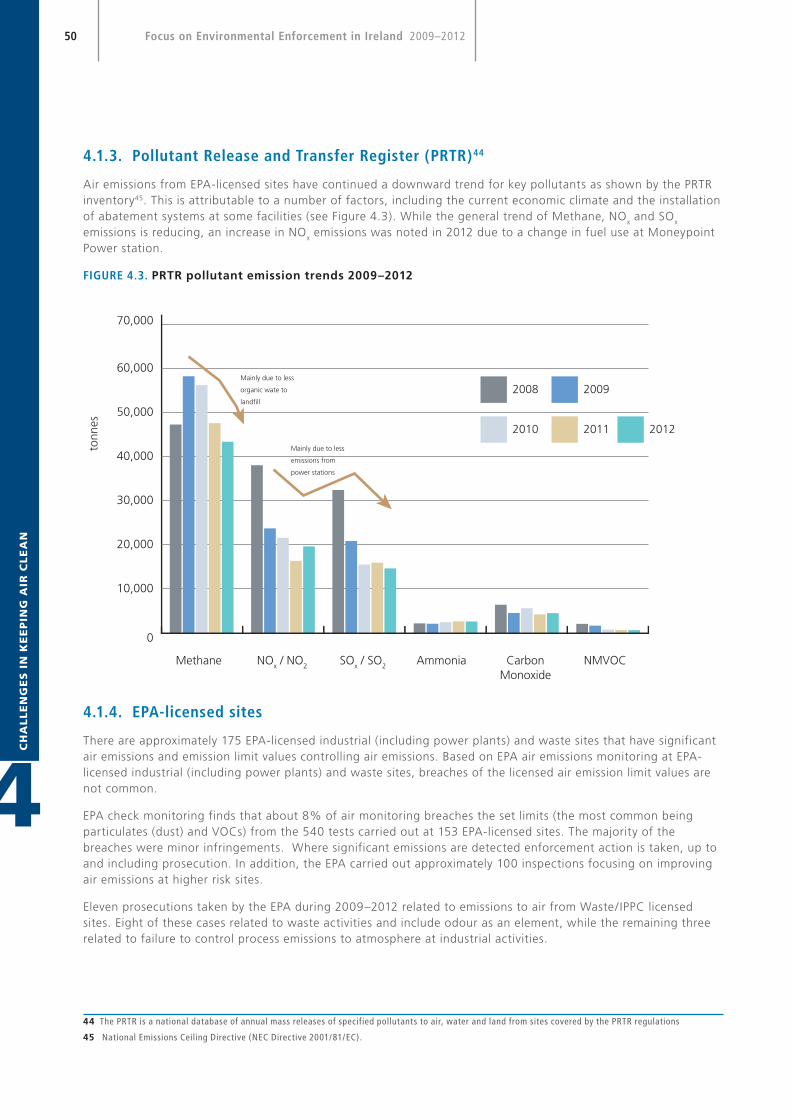
4
CH
AL
LE
NG
ES
IN
KE
EP
ING
AIR
CL
EA
N50 Focus on Environmental Enforcement in Ireland 2009–2012
4.1.3. Pollutant Release and Transfer Register (PRTR)44
Air emissions from EPA-licensed sites have continued a downward trend for key pollutants as shown by the PRTR inventory45. This is attributable to a number of factors, including the current economic climate and the installation of abatement systems at some facilities (see Figure 4.3). While the general trend of Methane, NOx and SOx emissions is reducing, an increase in NOx emissions was noted in 2012 due to a change in fuel use at Moneypoint Power station.
FIGURE 4.3. PRTR pollutant emission trends 2009–2012
4.1.4. EPA-licensed sites
There are approximately 175 EPA-licensed industrial (including power plants) and waste sites that have significant air emissions and emission limit values controlling air emissions. Based on EPA air emissions monitoring at EPA-licensed industrial (including power plants) and waste sites, breaches of the licensed air emission limit values are not common.
EPA check monitoring finds that about 8% of air monitoring breaches the set limits (the most common being particulates (dust) and VOCs) from the 540 tests carried out at 153 EPA-licensed sites. The majority of the breaches were minor infringements. Where significant emissions are detected enforcement action is taken, up to and including prosecution. In addition, the EPA carried out approximately 100 inspections focusing on improving air emissions at higher risk sites.
Eleven prosecutions taken by the EPA during 2009–2012 related to emissions to air from Waste/ IPPC licensed sites. Eight of these cases related to waste activities and include odour as an element, while the remaining three related to failure to control process emissions to atmosphere at industrial activities.
0
10,000
20,000
30,000
40,000
50,000
60,000
201220112010
20092008
Methane NOx / NO2 SOx / SO2 Ammonia CarbonMonoxide
NMVOC
Mainly due to less
emissions from
power stations
Mainly due to less
organic wate to
landfill
70,000
tonn
es
44 The PRTR is a national database of annual mass releases of specified pollutants to air, water and land from sites covered by the PRTR regulations
45 National Emissions Ceiling Directive (NEC Directive 2001/81/EC).
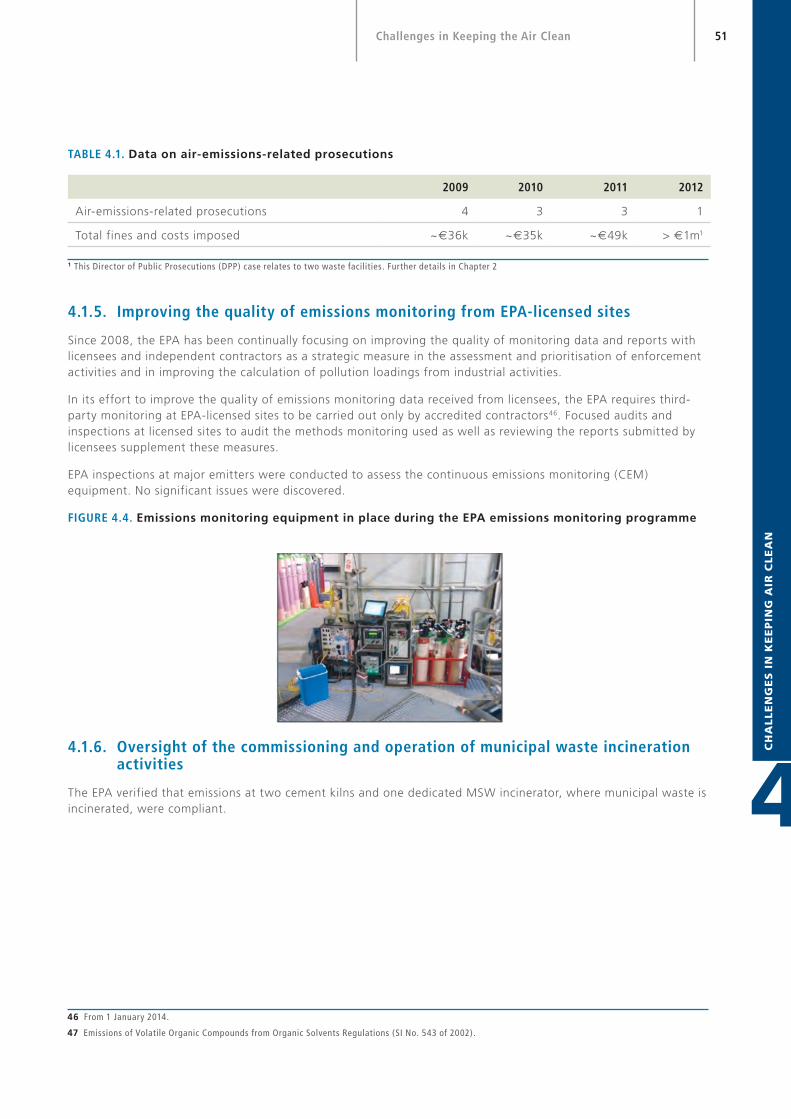
51Challenges in Keeping the Air Clean
4C
HA
LL
EN
GE
S I
N K
EE
PIN
G A
IR C
LE
AN
TABLE 4.1. Data on air-emissions-related prosecutions
2009 2010 2011 2012
Air-emissions-related prosecutions 4 3 3 1
Total fines and costs imposed ~€36k ~€35k ~€49k > €1m1
1 This Director of Public Prosecutions (DPP) case relates to two waste facilities. Further details in Chapter 2
4.1.5. Improving the quality of emissions monitoring from EPA-licensed sites
Since 2008, the EPA has been continually focusing on improving the quality of monitoring data and reports with licensees and independent contractors as a strategic measure in the assessment and prioritisation of enforcement activities and in improving the calculation of pollution loadings from industrial activities.
In its effort to improve the quality of emissions monitoring data received from licensees, the EPA requires third-party monitoring at EPA-licensed sites to be carried out only by accredited contractors46. Focused audits and inspections at licensed sites to audit the methods monitoring used as well as reviewing the reports submitted by licensees supplement these measures.
EPA inspections at major emitters were conducted to assess the continuous emissions monitoring (CEM) equipment. No significant issues were discovered.
FIGURE 4.4. Emissions monitoring equipment in place during the EPA emissions monitoring programme
4.1.6. Oversight of the commissioning and operation of municipal waste incineration activities
The EPA verified that emissions at two cement kilns and one dedicated MSW incinerator, where municipal waste is incinerated, were compliant.
46 From 1 January 2014.
47 Emissions of Volatile Organic Compounds from Organic Solvents Regulations (SI No. 543 of 2002).
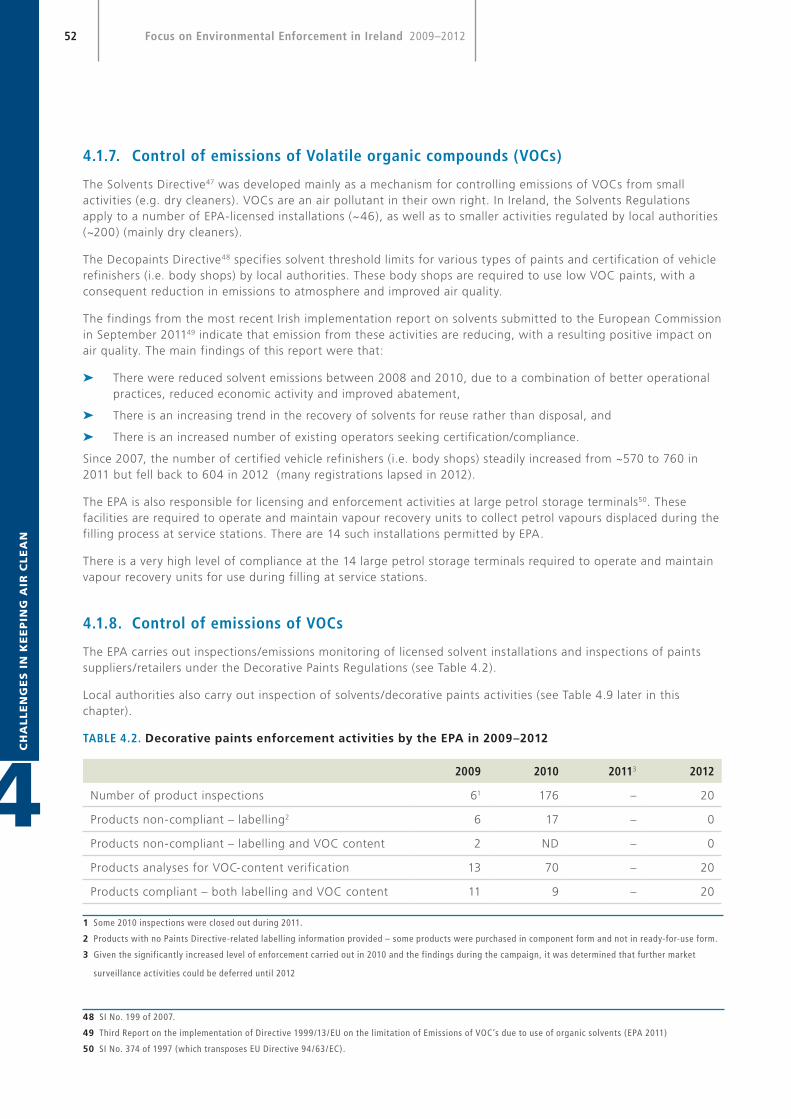
4
CH
AL
LE
NG
ES
IN
KE
EP
ING
AIR
CL
EA
N52 Focus on Environmental Enforcement in Ireland 2009–2012
4.1.7. Control of emissions of Volatile organic compounds (VOCs)
The Solvents Directive47 was developed mainly as a mechanism for controlling emissions of VOCs from small activities (e.g. dry cleaners). VOCs are an air pollutant in their own right. In Ireland, the Solvents Regulations apply to a number of EPA-licensed installations (~46), as well as to smaller activities regulated by local authorities (~200) (mainly dry cleaners).
The Decopaints Directive48 specifies solvent threshold limits for various types of paints and certification of vehicle refinishers (i.e. body shops) by local authorities. These body shops are required to use low VOC paints, with a consequent reduction in emissions to atmosphere and improved air quality.
The findings from the most recent Irish implementation report on solvents submitted to the European Commission in September 201149 indicate that emission from these activities are reducing, with a resulting positive impact on air quality. The main findings of this report were that:
➤➤ There were reduced solvent emissions between 2008 and 2010, due to a combination of better operational practices, reduced economic activity and improved abatement,
➤➤ There is an increasing trend in the recovery of solvents for reuse rather than disposal, and
➤➤ There is an increased number of existing operators seeking certification/compliance.
Since 2007, the number of certified vehicle refinishers (i.e. body shops) steadily increased from ~570 to 760 in 2011 but fell back to 604 in 2012 (many registrations lapsed in 2012).
The EPA is also responsible for licensing and enforcement activities at large petrol storage terminals50. These facilities are required to operate and maintain vapour recovery units to collect petrol vapours displaced during the filling process at service stations. There are 14 such installations permitted by EPA.
There is a very high level of compliance at the 14 large petrol storage terminals required to operate and maintain vapour recovery units for use during filling at service stations.
4.1.8. Control of emissions of VOCs
The EPA carries out inspections/emissions monitoring of licensed solvent installations and inspections of paints suppliers /retailers under the Decorative Paints Regulations (see Table 4.2).
Local authorities also carry out inspection of solvents/decorative paints activities (see Table 4.9 later in this chapter).
TABLE 4.2. Decorative paints enforcement activities by the EPA in 2009–2012
2009 2010 20113 2012
Number of product inspections 61 176 – 20
Products non-compliant – labelling2 6 17 – 0
Products non-compliant – labelling and VOC content 2 ND – 0
Products analyses for VOC-content verification 13 70 – 20
Products compliant – both labelling and VOC content 11 9 – 20
1 Some 2010 inspections were closed out during 2011.
2 Products with no Paints Directive-related labelling information provided – some products were purchased in component form and not in ready-for-use form.
3 Given the significantly increased level of enforcement carried out in 2010 and the findings during the campaign, it was determined that further market
surveillance activities could be deferred until 2012
48 SI No. 199 of 2007.
49 Third Report on the implementation of Directive 1999/13/EU on the limitation of Emissions of VOC’s due to use of organic solvents (EPA 2011)
50 SI No. 374 of 1997 (which transposes EU Directive 94/63/EC).

53Challenges in Keeping the Air Clean
4C
HA
LL
EN
GE
S I
N K
EE
PIN
G A
IR C
LE
AN
4.1.9. Control of ozone-depleting substances (ODS) and fluorinated greenhouse gases (F-gases)
The Montreal Protocol on Substances that Deplete the Ozone Layer is an international initiative to protect the ozone layer from depletion by certain man-made chemicals. The global consumption of ODS has reduced by around 98% as a result of the Protocol. European regulations have been developed that apply (and exceed the requirements of) the protocol51. F-gases have replaced ODS in many applications. Although they do not have ozone-depleting potential, they have significant global warming potential and are also regulated by European and Irish legislation52. The implementation of these regulations does not impact directly on local air quality. However, at a European and global level it is vital to control emissions of these pollutants to prevent further depletion of the ozone layer and negative climate impacts. The European Commission has taken action to strengthen efforts to reduce emissions of F-gases by two-thirds of today’s levels by 2030. A legislative proposal was published by the Commission in November 2012.
Over 200 inspections were carried out by or on behalf of the EPA of operators and contractors in the refrigeration and air-conditioning and fire protection sectors, as summarised in Table 4.3.
TABLE 4.3. ODS and F-gas inspections
Sector 2009 2010 2011 2012
Operators Retail 9 20 10 9
Offices and public buildings 14 12 6 6
Hospitality and leisure 10 14 10 11
Industrial 16 7 7 4
Halon critical users 2 2 3 15
Contractors Refrigeration and air conditioning – 35 16 17
Heat pump – – 5 –
Mobile air conditioning – – 5 4
Fire protection – – 5 9
Total 51 90 67 75
F-gas Registration Ltd (www.fgasregistration.ie) was established in 2011 for the certification of companies involved in the recovery of F-gases and installation, maintenance and servicing of refrigeration and air-conditioning and fire protection equipment containing F-gases. This assists operators with compliance by allowing them to check which contractors are certified. F-gas Registration Ltd organised a number of industry awareness seminars for contractors and operators in 2010 and 2011, with EPA and DOECLG involvement.
51 Regulation (EC) No. 1005/2009 & SI No. 465 of 2011.
52 Regulation (EC) No. 842/2006, SI 278 of 2011 and SI 279 of 2011.

4
CH
AL
LE
NG
ES
IN
KE
EP
ING
AIR
CL
EA
N54 Focus on Environmental Enforcement in Ireland 2009–2012
4.1.10. Emissions trading scheme (ETS) enforcement
Trading of Greenhouse gas emission allowances under the EU ETS began in 2005 and the EPA is responsible for its enforcement. The EPA’s fundamental task is to ensure in relation to Irish administered operators that carbon market integrity is preserved, i.e., that a tonne of CO2 measured in Ireland is equivalent to a tonne measured anywhere else in the EU.
There are 99 currently active Greenhouse gas (GHG) permitted stationary installations enforced by the EPA. The EU ETS Directive was amended in 2008 to include the aviation sector, encompassing both large commercial airlines and small non-commercial jets.
Enforcement in the ETS is both desk based (by assessing monitoring plans and pre-verified annual installation emission reports) and uses on-site based inspections. In the period 2009-2012, there were 64 site inspections carried out at 53 stationary installations. Inspections focussed on the emission sources, emission points, fuel /materials metering and on site procedures used for the monitoring and reporting of greenhouse gases and assessed compliance with the GHG Permit and the approved Monitoring and Reporting Plan.
Many aviation operators are not based in Ireland and therefore site visits focussed on the major Irish based airlines, while a “virtual” site visit with one large North American operation was carried out by teleconference. Site inspections focussed on the aircraft on-board measurement systems, and on paper and electronic recording systems (see Table 4.4).
TABLE 4.4. Breakdown of the number of site inspections 2009-12
Year 2009 2010 2011 2012
Stationary installations 26 26 8 4
Aircraft operators 5 3 0 1
Total inspections 31 29 8 5
All operators are required to submit an annual installation emissions report which has been verified by an independent, accredited verifier. In the period 2009-2012, 403 Annual Installation Emissions Reports (AIERs), 206 Aviation Sector Reports and 54 Aviation Tonne-kilometre reports were assessed by the EPA.
TABLE 4.5 Annual installation emissions reports reviewed
Year Reported
(Emissions Year)
Stationary installation AIERs
Reports Reviewed
Aviation Sector Reports Reviewed
Aviation Tonne-kilometre (TKM)
Reports Reviewed
2009 104 - -
2010 100 - 54
2011 100 109 -
2012 99 97 -

55Challenges in Keeping the Air Clean
4C
HA
LL
EN
GE
S I
N K
EE
PIN
G A
IR C
LE
AN
4.1.11. Genetically modified organisms (GMOs)
While GMO enforcement is not specifically related to Air & Noise enforcement, nevertheless the enforcement of these controls are important and are detailed below.
GMO enforcement is performed in order to ensure that registered users of GMOs comply with the legislative requirements and the consent conditions issued in respect of their respective activities.
TABLE 4.6. EPA Inspections regarding GMOs
Inspections 2009 2010 2011 2012
Inspections of GMO and Class 1 to Class 3 GMM* 14 17 16 9
*Genetically modified micro-organisms
Fifty-six (56) site inspections were carried out during the period 2009 – 2012 covering GMO and Class 1 to Class 3 GMM related research activities performed in universities, hospitals affiliated to universities, public research facilities as well as large scale manufacturing facilities where GMOs/GMMs are used for manufacturing purposes.
To date, the routine practice has been to inspect all GMO/GMM facilities within a three year period. However, owing to diminishing resources the inspection plan for 2013 will be prioritised based on length of time since last inspection followed by class of activity. Class 1 GMM activities will be inspected once every 6 years owing to the very low risk they pose. All other activities will continue to be inspected every 3 years.
4.1.12. Noise Enforcement & EPA Licensees
EPA-licensed sites are required to measure the noise impact of their activity typically on an annual basis. Noise complaints and noise issues in relation to EPA-licensed sites have remained low, with only 60 complaints received in relation to licensed sites over the period 2009–2011 (50% of which related to three sites).
While the EPA is supportive of the use of renewable energy sources once any related impacts have been adequately assessed and mitigated and, specifically in relation to wind turbines, the Agency has published guidance53 for licensees to avoid adverse noise impact from any planned turbine installation.
4.1.13. Air and noise enforcement activities – local authorities
A number of smaller operators remain under the control of local authorities via the air pollution licensing system54. The number of such licences has reduced to 68 (from 100 in 2008).
Local authorities receive and investigate a significant number of complaints from the general public in relation to air and odour issues, (over 6,000 complaints between 2009 and 2012). These were typically issues such as smoke, odours and gaseous emissions from a range of sources, including domestic, commercial and industrial activities.
Under the Air Pollution Act, 1987, local authorities are empowered to issue notices for offences. The principal notices are Section 16 and Section 26 (see Table 4.7).
53 NG3 – Assessment of noise impact from installation of wind turbines at EPA-licensed sites.
54 Air Pollution Act, 1987.

4
CH
AL
LE
NG
ES
IN
KE
EP
ING
AIR
CL
EA
N56 Focus on Environmental Enforcement in Ireland 2009–2012
TABLE 4.7. Statutory notices issued by local authorities in 2009–2012
2009 2010 2011 2012
Air warning letters 477 597 306 941
Section 16 (requesting information) -Air 10 9 13 4
Section 26 (limit or prevent pollution) -Air 25 7 25 3
Section 110 notices – Public Health Act-Air 8 3 3 0
Noise warning letters issued 577 621 463 458
Section 107 (measures to reduce noise) 14 26 15 23
Note: A significant number of local authorities do not report/issue statistics on warning letters.
A significant increase in the number of air warning letters issued was noted in 2008 (662 issued) and the level of issued letters has continued to remain at a relatively high level during 2009–2012. However, data from 24 local authorities report no warning letters being issued in 2010.
A significant number of noise nuisance complaints are received by local authorities on an annual basis (typically ~1,500/annum), the majority of these being resolved directly by local authorities. These include issues such as noise from neighbours, from local businesses or from temporary construction activities
The number of letters issued in relation to noise warning is higher than the 2008 figure of 471, though the number of Section 10755 notices has reduced significantly from the 2006–2008 total of 166. This may be due to local authorities requesting the public to take such cases directly under Section 108 of the EPA Act. Section 108 of the EPA Act provides for the public to bring a noise nuisance case directly to the District Court.
General local authority air and noise related prosecutions are detailed in Table 4.8, while prosecutions taken under the Solvents/Decorative Paints Regulations are outlined in Table 4.9.
TABLE 4.8. Air and noise prosecutions initiated by local authorities in 2009–2012
2009 2010 2011 2012
Section 16 (requesting information) -Air 0 0 4 1
Section 26 (to limit /prevent pollution) -Air 2 1 1 0
Failure to comply with Section 107 notice- Noise 3 7 3 0
Failure to comply with Section 108 notice - Noise 0 1 0 1
Other 7 6 1 7
55 Under Section 107 of the EPA Act the local authority can take action by issuing a noise enforcement notice

57Challenges in Keeping the Air Clean
4C
HA
LL
EN
GE
S I
N K
EE
PIN
G A
IR C
LE
AN
TABLE 4.9. Local authority actions under Solvents, Decorative Paints and Petroleum Vapour Regulations
Inspections 2009 2010 2011 2012
Inspections of Decorative Paints Regulations sites 703 531 425 293
Inspection of sites under Solvents Regulations 423 236 203 166
Inspection of Petroleum Vapour Regulations sites 178 199 190 181
Prosecutions
Prosecutions under SI 199 of 2007 No data 2 1 4
Prosecutions under SI 543 of 2002 No data 5 2 5
Other enforcement actions
Warning letters under the Solvents Regulations No data 119 157 109
Warning letters under Decorative Paints Regulations No data 174 299 303
Note: No data available in relation to enforcement actions and prosecutions under SI 375 of 1997.
4.1.14. Protecting Human Health and Air Quality through Enforcement of the Prohibition on burning Bituminous Coal(smoky coal ban).
Coal remains a popular home heating fuel in Ireland, particularly in areas where there is no piped natural gas. The economic downturn has also moved people towards using coal for heating as it can be purchased in small quantities and allows for easier management of expenditure. The new bituminous coal ban, which regulates the sale and use of ‘smoky coal’ is implemented by local authorities.
The ban on the sale of smoky coal in certain areas, provided for under the ‘smoky coal regulations56, is resulting in very significant improvement in local air quality in ‘ban’ areas. In Dublin alone, it is estimated that this improvement has avoided 350 deaths per annum since its introduction in 1990.
2012 saw the introduction of a prohibition on the burning of bituminous coal within 27 currently designated urban areas (with a population greater than 15,000).
Inspections by local authorities has increased over the previous years (Table 4.10), and is a welcome development as part of the implementation strategy, as the effective implementation of these regulations has been shown to result in improved local air quality within these ban areas.
TABLE 4.10. Local authority inspections in relation to enforcement of the smoky coal regulations
2009 2010 2011 2012
Total number of inspections 275 381 688 567
Warning letters under smoky coal regulations 14 5 56 331
Note: No data available on prosecutions under the smoky coal regulations.
During 2011, the EPA commenced registration of coal-bagging operations and solid fuel wholesalers, and obligated solid fuel suppliers to register57.
56 Air Pollution Act (Marketing, Sale, Distribution & Burning of Specified Fuels) Regulations 2012. SI No. 326 of 2012.
57 For lists of registered operators see www.epa.ie /whatwedo/licensing /coalbaggingregistrations.

4
CH
AL
LE
NG
ES
IN
KE
EP
ING
AIR
CL
EA
N58 Focus on Environmental Enforcement in Ireland 2009–2012
4.1.15. Maintaining a good-quality noise environment
The EPA updated and reviewed the existing noise monitoring guidance documents, with a consolidated noise monitoring guidance note being issued in 201158.
The Environmental Noise Regulations 200659 relate to the assessment and management of environmental noise and provide a common framework to avoid, prevent or reduce, on a prioritised basis, the harmful effects of exposure to environmental noise – from transport activities, including rail, roads and airports. They also include industrial noise sources within agglomerations. The EPA has prepared the required reports for the European Commission. Noise mapping is carried out by a number of parties, including local authorities, the National Roads Authority (NRA), the Airport Authority, Irish Rail and the Railway Procurement Agency. The preparation of the resulting noise action plans is the responsibility of the relevant local authority, and this work will be completed in 2013.
FIGURE 4.5. Dublin City Council noise map 2012
58 NG4 – Revision of existing guidance notes on noise monitoring surveys and assessments.
59 SI No. 140 of 2006 transposes EU Directive 2002/49 /EC.

59Challenges in Keeping the Air Clean
4C
HA
LL
EN
GE
S I
N K
EE
PIN
G A
IR C
LE
AN
4.2 FUTURE IMPLEMENTATION CHALLENGES
4.2.1. Protecting ambient air quality
The Clean Air For Europe (CAFE) Directive60 requires Ireland to reduce the levels of PM2.5 particles in our ambient air by 10% before 2020. In addition, a new National Emissions Ceiling (NEC) Directive is under preparation, which is expected to include new ceiling values in 2020 for existing pollutants as well as adding a ceiling for PM2.5. This indicates the increasing environmental concerns in relation to fine particulate matter, and also indicates that further emphasis must be placed on ensuring that measures are in place to control emissions of PM2.5. As such, an integrated strategy should be put in place to meet the revised emission targets, with associated positive impacts in terms of local and national air quality.
The European Commission has a review presently underway to assess the effectiveness of existing policy and plan for a future EU Thematic Strategy on Air Pollution61. The review recognises the need for further reductions in emissions to air within Europe, with a greater focus on key pollutants such as PM2.5, where reduced ambient levels will result in health benefits. The current indications are that the Commission will not seek to make any immediate changes to ambient air quality standards but will focus on some specific areas where real and cost-effective reductions in emissions of air pollutants can be achieved, including:
1. Road transport:- effective implementation of the latest ‘Euro 6’ vehicle emission standards;
2. Small/medium combustion plants (< 50 MW):- better regulation/control of emissions;
3. Agriculture:- reduction in emissions of nitrogenous compounds (e.g. ammonia) from agricultural activities through measures such as improved management, storage and spreading of manure/slurry;
4. Shipping:- introduction of measures such as the extension of existing sulphur and NOX emission control areas and the introduction of particulate emission controls;
5. Non-road mobile machinery:- introduction of new emissions standards and/or the extension of existing standards to additional types of machinery.
In addition to these EU-wide measures, local air quality in Ireland can be significant impacted by domestic burning of bituminous coal. The introduction of a ban on the sale and burning of bituminous coal in larger towns and cities across the country (27 areas in total) has resulted in air quality improvements in these areas and the EPA is supportive of the government proposals to introduce a nationwide ban over the next 3 – 4 years. However, the impact of switching to other fuel types for domestic heating (such as wood or smokeless coal) will require appropriate abatement, as they present other air quality challenges on a local level, particularly in the scenario of increased use of wood (as PM2.5 emissions from biomass burning are particularly high).
On-going enforcement of the Emission Trading Scheme requires continual awareness raising by the EPA amongst the regulated community, and a level of uncertainty of the number of foreign operators covered by the EU ETS will require adequate enforcement to ensure the integrity of the scheme.
Another important area identified during the review process is the challenge to generate more engagement with the public, particularly the use of IT-related innovations. Greater public access to data and information should result in an increased ‘ownership’ of air quality by the public and subsequent driving of policy from the bottom up. The EPA recently launched the ‘Air Quality Index for Health’ (AQIH). The index uses an interactive map to provide real-time information on air quality across the country. The index is a number from one to 10 which tells you what the air quality currently is in your region and whether or not this might affect the health of you or your child. In addition the EPA is also carrying out a research project on the development of an air quality forecast model for Ireland which will complement the AQIH.
60 Directive 2008/50 /EC on ambient air quality and cleaner air for Europe (CAFE Directive).
61 http://ec.europa.eu/environment/air/review_air_policy.htm

4
CH
AL
LE
NG
ES
IN
KE
EP
ING
AIR
CL
EA
N60 Focus on Environmental Enforcement in Ireland 2009–2012
4.2.2. Key Issues for future enforcement
➤➤ Even though Ireland continues to enjoy good air quality and urban areas benefit from the ban on smoky coal, effective enforcement of existing and new ban areas and/or new fuel types remains an issue.
➤➤ Greater enforcement efforts will be required to reduce fine particulate matter from the air we breathe so that we meet future EU limits and further improve public health.
➤➤ Odour from waste, wastewater and industrial facilities continues to cause problems at some sites (as further detailed in Chapters 2, 3 and 5).

v Further reduction in risks to the environment, and improving environmental performance
on licensed sites through the implementation of the requirements of the
Industrial Emissions Directive (IED).
v Applying sectoral priorities as part of EPA’s annual enforcement plan.
v Continued use of risk-based approaches to concentrate enforcement resources on the most
important environmental risks.
05 LARGE INDUSTRIAL
SITES

LAR
GE
IND
UST
RIA
L SI
TES
62
5
Focus on Environmental Enforcement in Ireland 2009–2012
5. LARGE INDUSTRIAL SITES
5.1 INTRODUCTIONThis chapter focuses on enforcement at larger industrial activities regulated by EPA licences. The total number of integrated pollution prevention and control ( IPPC) licences for enforcement under the EPA Acts 1992–2003 increased from 550 at the end of 2008 to 587 at the start of 2012 of which 481 are currently operational. This increase in licensed (and operational) sites is mainly due to more intensive agriculture sites being licensed. Table 5.1 summarises the EPA-licensed industrial activities.
TABLE 5.1. Breakdown of IPPC facilities by sector in 2012
Facilities LIcensed
(exclusing surrenders)
Total operational
facilities
Total closed/ceased and under
threshold/not commenced
Total surrendered
in 2009–2011
1. Mineral and other materials 14 14 0 0
2. Energy 23 17 6 2
3. Metals 33 24 9 3
4. Mineral fibres and glass 5 2 3 1
5. Chemicals 90 75 15 9
6. Intensive agriculture 161 159 2 1
7. Food and drink 98 82 16 2
8. Wood, paper, textiles , leather 61 41 27 7
9. Fossil fuels 3 2 1 0
10. Cement 4 4 0 0
11. Surface coatings 81 51 30 13
12. Other activities 14 10 4 3
Totals 587 481 113 41
Figure 5.1 shows the broad distribution of IPPC sites between enforcement categories assigned to these sites by the EPA. The most complex or highest risk sites are labelled enforcement category ‘A’, reducing complexity or risk designated ’B’ and lower risk sites designated ‘C’ category. All intensive agriculture sites are given the same categorisation ‘P’, a relatively low risk category. There is an uneven distribution, with most sites falling into the lower (C) or intensive agriculture (P) categories.
5.1.1. Surrenders, closures and remediation plans
Almost 50 facilities surrendered their IPPC licences in 2009–2012. Upon closure, full licence surrender is an important environmental milestone. A licence may not be surrendered if the site poses a significant environmental risk. Galmoy lead/zinc mine (P517-01), while not surrendered, has ceased operations and phased rehabilitation has commenced under supervision by the EPA.

63Large Industrial Sites
5
LAR
GE
IND
UST
RIA
L SI
TES
FIGURE 5.1. Distribution of IPPC facilities within the various enforcement categories
5.1.2. Reduction of environmental risk
There was an overall reduction62 in the aggregated enforcement categories (or environmental footprint) for IPPC and waste licensed facilities as a result of the reduction of activities, increase in compliance and reduction in overall complaints .
The rigours of managing a site under an IPPC licence often lead to cost reductions or at least avoidance of more costly clean-ups. The IPPC licensing system can provide additional value to a business, arising from the reduced probability of a site covered by IPPC having hidden environmental liabilities or issues63.
5.1.3. Long-term reduction in industry (IPPC) complaints
The trend in complaints is largely static in recent years but shows an overall decline since the beginning of IPPC licensing (Figure 5.2). The majority of the remaining complaints are caused by a handful of facilities – primarily odour complaints against the food and drink sector (e.g. odour emissions from rendering activities or food and drink process/WWTP emissions).
FIGURE 5.2. IPPC complaints 1998–2012
Low enforcement categoryC/P Sites(Approx 50:50 C:P)
310+
Medium enforcement categoryB Sites
110 High enforcement category
50+
A Sites
0
200
400
600
800
1000
1200
2011 20122010200920082007200620052004200320022001200019991998
62 4% reduction over 3 years across a common sample of 478 facilities.
63 Emissions form IPPC Industry: Quantifying Pollution Trends & Regulatory Effectiveness, ERC Report 16 - David Styles and Michael B. Jones (see epa.ie)

LAR
GE
IND
UST
RIA
L SI
TES
64
5
Focus on Environmental Enforcement in Ireland 2009–2012
The principal causes of complaints over the period are detailed in Figure 5.3. Air and/or odour continue(s) to be the root cause of approximately 75% of complaints. This is a similar pattern to recent years.
FIGURE 5.3. Causes of complaints about IPPC facilities
Table 5.2 outlines the IPPC facilities that have recorded the highest numbers of complaints received by the EPA during 2012. The majority of these complaints are odour/air related. These facilities constituted approximately 43% of all IPPC-related complaints received during 2012 – with the first-placed facility accounting for over a third of all complaints received. All of these facilities are receiving particular enforcement attention and some are prioritised for enforcement.
TABLE 5.2. Most complained-about IPPC-licensed facilities during 2012
Organisation/Facility Reg. No Complaints % of total complaints
Arrow Group Limited1 P0812-01 130+ 35
College Proteins P0037-03 20 - 30 8
Total 160+ ~43%
1 Arrow is a priority enforcement site.
Three IPPC facilities on the Top 5 list in the previous report64 have fallen from the list in 2012: Kepak Athleague P0168-01, Kildare Chilling Company P0170-01 and Premier Proteins Limited P045-03. As an example, there was significant investment in a new waste water treatment infrastructure at the Kildare Chilling P0170-01 facility. This resulted in improved quality of waste water emissions and a reduction in odours from the facility. Odour control infrastructure is being installed at the Kepak Athleague P0168-01 facility. The licence for the Premier Proteins P045-05 facility was revoked and licensed activities have ceased.
Odour
70%
14%
Noise Air
7%
Other
6%
Water
3%
64 Focus on Environmental Enforcement in Ireland 2006–2008.

65Large Industrial Sites
5
LAR
GE
IND
UST
RIA
L SI
TES
5.1.4. Capacity building for industry
To ensure that those sectors regulated by the EPA know how to comply and are encouraged to do so, the Agency has undertaken innovations and prepared technical guidance and advice for licensees on a range of issues as outlined in Box 5.1. The provision of guidance and innovations allows EPA licensees to better achieve the terms of their licence and in particular to bring about environmental improvements.
BOX 5.1. Environmental guidance and capacity-building measures
Capacity-building measures
See www.epa.ie for guidance
Reporting Innovation – PRTR
A national (PRTR) website was launched during the period (www.prtr.ie).
Reporting Innovation – Extractive Industries Register
A national register of extractive industries for use by local authorities and the public.
Noise Guidance Notes (NG3 & NG4 – revised)
Noise guidance to assist licensed sites with assessment of noise impact/to determine if their sites are suitable for wind turbine development.
Guidance Note on Noise Assessment of Wind Turbine Operations at
EPA Licensed Sites (NG3)
Environmental Protection Agency Office of Environmental Enforcement (OEE)
Guidance Note for Noise: Licence Applications, Surveys and
Assessments in Relation to Scheduled Activities (NG4)
Also refer to FAQ’s on NG4 http://www.epa.ie/downloads/advice/noise/
April 2012

LAR
GE
IND
UST
RIA
L SI
TES
66
5
Focus on Environmental Enforcement in Ireland 2009–2012
Capacity-building measures
See www.epa.ie for guidance
Solvents Directive Reporting
The Third Report1 on the Implementation of the Solvents Directive submitted to the EU Commission (2008–2010).
Other Innovations:
LEMA. This IT project is focusing on moving many of the EPA licensing, enforcement and monitoring duties onto an automated electronic platform.
More efficient control/management of organic fertiliser. EPA worked with the DAFM to agree a new more efficient approach for the control /management of organic fertiliser at IPPC-licensed installations. The DaS reporting system is now in place.
Other Guidance:
Environmental Liability Regulations. Guidance for operators, regulatory authorities and the public in relation to the Environmental Liability Directive Regulation 2008 was published.
Guidance - Air – Site Safety (AG1). AG1 describes the facilities and work practices that must be in place for the safe and effective monitoring of air emissions.
Guidance – Air Monitoring. Air monitoring of stack emissions at EPA-licensed sites. This is considered to be the standard for IPPC/waste licence competency requirements for emissions monitoring.
Guidance – Water Monitoring Compliance Analysis. Requirements for aqueous analysis, including report generation, assessment tools, methods, and good laboratory management. Targeted at the food and drink sector but relevant to all who carry out aqueous analysis.
Guidance – Surrender Process. EPA published guidance for licensees on the surrender process.
1 Third Report on the implementation of Directive 1999/13/EC on the limitation of emissions of volatile organic compounds due to the use of organic solvents
in certain activities and installations in Ireland.
Third Report on the implementation of Directive 1999/13/EC on the limitation of emissions of volatile organic compounds due to
the use of organic solvents in certain activities and installations in Ireland
For the reporting period:
1 January 2008 – 31 December 2010
In accordance with the questionnaire for Member States contained in Commission Decision 2007/531/EC
Report date: September 2011
ENVIRONMENTAL PROTECTION AGENCY
An Ghníomhaireacht um Chaomhnú Comhshaol PO Box 3000, Johnstown Castle Estate, Co. Wexford, Ireland
Telephone: +353-53-9160600; Fax: +353-53-9160699
E-mail: [email protected] Website: www.epa.ie
Lo Call: 1890 335599
© Environmental Protection Agency

67Large Industrial Sites
5
LAR
GE
IND
UST
RIA
L SI
TES
5.2 EPA IPPC ENFORCEMENT ACTIVITIESEPA resources are managed and directed to focus the enforcement effort to where the risks or potential risks are highest and a combination of enforcement tools are used to bring about changes in environmental performance. While overall numbers of inspections and audits are slightly reduced compared to 2009, this is due to a continuing focus on a smaller number of sites which pose a higher environmental risk.
TABLE 5.3. Inspections/Monitoring of IPPC facilities in 2009–2012
2009 2010 2011 2012
Audits and inspections 631 570 571 527
Water monitoring 710 659 627 355
Air monitoring 148 169 155 116
Breaches of EPA licence conditions resulted in almost 2,000 administrative warning letters (notice of non-compliance with required corrective action), with summary details presented in Table 5.4 and Figure 5.4. The numbers of non-compliances detected and the types of non-compliance vary from sector to sector. It is common that a number of non-compliances detected during an audit /inspection will be contained within a single ‘notice of non-compliance’ – hence NONCs issued are always less than NONCs detected.
TABLE 5.4. Summary of non-compliances enforcement notices issued against IPPC facilities in 2009–2012
2009 2010 2011 2012
NONCs issued NONCs issued NONCs issued NONCs issued
520+ 500+ 500+ 470+
Figure 5.4 provides a profile of the non-compliances issued by the EPA arising from audits and inspections. These are the main issues identified for corrective action in audits and inspections. Materials storage and handling, inadequate procedures, and exceeding limit values constitute two-thirds of detected non-compliances. This is reflected in the compliance issues noted within the sectoral descriptions, and is a primary criterion for determining priority sites and the focus of the sectoral enforcement groups.

LAR
GE
IND
UST
RIA
L SI
TES
68
5
Focus on Environmental Enforcement in Ireland 2009–2012
FIGURE 5.4. Reasons for non-compliances with IPPC licences detected
5.2.1. EPA licensed facility prosecutions
The non-compliances seen in Figure 5.4 are consistent with the issues addressed through the prosecutions taken by the EPA of IPPC facilities (see Figure 5.5). This demonstrates a consistency in what non-compliances are looked for (i.e. search for the important non-compliances), what non-compliances are detected, and what are enforced through prosecutions.
The EPA took 40 IPPC related prosecutions (1 case was in relation to a non-licensed facility handling waste from a licensed facility) during the reporting period. 2011 saw the highest number of District Court cases (14) processed by the Agency in a single year. The reason prosecutions were taken varied from sector to sector.
FIGURE 5.5. IPPC prosecutions breakdown of issues (2009-2012)
ELV Exceedance
40%
15%
6%
Documentation& Procedures
Bunding &MaterialsHandling
12%
Miscellaneous 8%
Monitoring
7%
OutstandingReports
WasteManagement
5%
Non-Notificationof Incidents
3%
MonitoringReporting Failure
41%12%
10%
6%
21%
Emissionsto air
Emissionsto water
Materials handling failures (bunding/capping)
Unauthorised Waste transfer
tonnage exceeded
10%
Landspreadingslurry
handling

69Large Industrial Sites
5
LAR
GE
IND
UST
RIA
L SI
TES
The subject of each individual prosecution often covers a number of issues (i.e. a single prosecution might include a number of charges covering such issues as discharges to water, non-reporting and poor materials handling).
The main prosecutions were in the following areas:
➤➤ Pig and poultry facilities – unlicensed (ten prosecutions) – there was a particular focus on prosecuting pig and poultry facilities that were operating without an IPPC licence. Of 41 installations determined in 2009 as potentially operating in excess of the IPPC threshold, 19 have either been licensed by the EPA or applications are currently under assessment, while 17 were determined as not licensable (under the threshold or not operational). A further five were found to be operating above the threshold without a licence. Prosecutions in the majority of cases, resulted in either cessation of activities or application for an IPPC licence.
➤➤ Pig and poultry facilities – poor operation (eight prosecutions) – other intensive agriculture prosecutions (seven) related to poor handling of slurry, improper storage of organic wastes and failure to maintain a Slurry/Manure Register at licensed sites. In addition, the Agency secured a perpetual injunction against the owners and operators of a piggery in Co. Cork for poor slurry management and control, and emissions to the environment.
FIGURE 5.6. Inadequate (overloaded) storage of effluent
➤➤ Food and drink sector (e.g. slaughtering/food processing plants) (10 prosecutions) – related to non-compliant emissions to water, or non-monitoring of emissions to water and waste handling.
FIGURE 5.7. Poor-quality waste water effluent

LAR
GE
IND
UST
RIA
L SI
TES
70
5
Focus on Environmental Enforcement in Ireland 2009–2012
➤➤ Timber treatment, pharma-chem facilities, metals and solvent users constituted the other ten prosecutions and these related to air emissions, waste/materials handling and the protection of surface waters and groundwaters.
DPP cases➤➤ The EPA secured criminal convictions against Chemifloc Ltd (fines & costs €10,000) and Finsa Forest Products
(fines & costs €22,248).
➤➤ A DPP case was taken against an IPPC-licensed facility, Wyeth Medica and Cara Environmental Technology Ireland Ltd (not IPPC licensed), for handling related waste material, and they were convicted with fines & costs of €200,000 applied.
➤➤ The Agency also secured a perpetual injunction during 2011 against an unlicensed turf cutter in Co. Tipperary to cease peat extraction and ensure that no further drainage works would take place.
5.2.2. Sectoral enforcement
The specific sectors and principal focus area are outlined in Table 5.5.
TABLE 5.5. Specific sectors highlighted for attention through sectoral enforcement plans
Sector Main area of focus
Intensive agriculture Waste control and water protection
Food and drink Wastewater Treatment Plant operation and quality of monitoring
Metals Prevention of run-off and water contamination
Energy, incineration and co-incineration Air and waste monitoring
Pharma-chem and solvents Quality of air and water monitoring, and prevention of incidents
FIGURE 5.8. Dosing chemical storage at a treatment plant

71Large Industrial Sites
5
LAR
GE
IND
UST
RIA
L SI
TES
The EPA also prioritised certain individual sites due to specific environmental issues, and focuses particular attention on these sites as outlined earlier.
FIGURE 5.9. Unbunded/Uncontained chemical storage
5.2.3. Key Sector Outcomes
The EPA is concentrating on the sites that are causing the greatest pollution or risk of pollution in order to protect and improve the quality of Ireland’s environment. The Agency will continue its risk based approach to enforcement for IPPC sites in order to apply resources where the need is greatest. Allied to this is the use of the sector enforcement model which provides a better understanding of activities and issues, and their associated environmental risks and impacts across that sector. This in turn leads to a consistent and focused enforcement of issues. Engagement on a sector level also provides relevant and focused information and guidance to operators of similar activities, with common issues. This engagement promotes improved environmental performance across a sector. A few key sector outcomes include;
➤➤ Fifteen food and drink sites installed new or upgraded waste water treatment infrastructure representing millions of euros of investment in environmental protection infrastructure and reduced impact on the water environment.
➤➤ Contaminated land being cleaned up or monitored attenuation programmes in place at a number of facilities.
➤➤ Concentrated enforcement efforts have reduced odour impact from rendering sites including revoking a licence for one site that was causing persistent episodes of nuisance odours.
➤➤ Enforcement action resulted in the upgrade of site infrastructure at a metal site to eliminate excess dioxin emissions to atmosphere.
➤➤ Prosecution of six unlicensed operators, who have all now applied for an EPA IPPC licence.
➤➤ Nutrient management planning at intensive pig agriculture sites improved from 34% to 81% compliance.
➤➤ Long-term reduction in industry (IPPC) complaints and environmental risk as detailed earlier in the chapter.

LAR
GE
IND
UST
RIA
L SI
TES
72
5
Focus on Environmental Enforcement in Ireland 2009–2012
5.3 FUTURE IMPLEMENTATION CHALLENGESThe Industrial Emissions Directive 2010/75/EU ( IED) was transposed into Irish legislation in 2013. Along with revising and merging seven separate existing directives into one, the directive will bring significant health and environmental benefits and create a better level playing field for industry across the EU.
The IED introduces minimum provisions on environmental inspections of installations, review and update of permits, and reporting of compliance. It also provides incentives for the development and promotion of environmentally-friendly technologies. Under Article 8 of the IED, Member States are required to take the necessary measures to ensure that the permit conditions are complied with. In the event of a breach of the permit conditions that poses an immediate danger to human health or threatens to cause an immediate significant adverse effect on the environment, the operation of the installation, combustion plant, waste incineration plant, waste co-incineration plant or relevant part thereof must be suspended. The IED lays down more specific provisions to ensure more effective implementation and enforcement and as such in Articles 7 and 8 it introduces a requirement for operators to report incidents, accidents and non-compliance with permit conditions to the competent authority.
In Article 23, the IED introduces a requirement for Member States to provide a system of environmental inspection. All installations will be covered by an inspection plan which must be regularly reviewed and, where appropriate, updated. Such a plan provides for routine and non-routine inspections. It defines an ‘environmental inspection’ as meaning all actions, including site visits, monitoring of emissions and checks of internal reports and follow-up documents, verification of self-monitoring, checking of the techniques used and adequacy of the environment management of the installation. These can be undertaken by or on behalf of the competent authority to check and promote compliance of installations with their permit conditions and, where necessary, to monitor their environmental impact.
5.3.1. Key issues for future enforcement
➤➤ The principal focus of industrial enforcement in the coming years will be to further reduce risk to the environment, and improve environmental performance on licensed sites through the implementation of the requirements of IED.
➤➤ Sectoral priorities will be developed as part of EPA’s annual enforcement plan, and to satisfy the requirements of IED. The main focus of the sectoral plans (see examples in Table 5.5) will be re-evaluated on a yearly basis by the EPA.
➤➤ Implementation of a risk-based outcomes focussed approach to concentrate enforcement resources on the most important environmental risks will continue.

An Ghníomhaireacht um Chaomhnú Comhshaoil Is í an Gníomhaireacht um Chaomhnú Comhshaoil (EPA) comhlachta reachtúil a chosnaíonn an comhshaol do mhuintir na tíre go léir. Rialaímid agus déanaimid maoirsiú ar ghníomhaíochtaí a d’fhéadfadh truailliú a chruthú murach sin. Cinntímid go bhfuil eolas cruinn ann ar threochtaí comhshaoil ionas go nglactar aon chéim is gá. Is iad na príomh-nithe a bhfuilimid gníomhach leo ná comhshaol na hÉireann a chosaint agus cinntiú go bhfuil forbairt inbhuanaithe. Is comhlacht poiblí neamhspleách í an Ghníomhaireacht um Chaomhnú Comhshaoil (EPA) a bunaíodh i mí Iúil 1993 faoin Acht fán nGníomhaireacht um Chaomhnú Comhshaoil 1992. Ó thaobh an Rialtais, is í an Roinn Comhshaoil, Pobal agus Rialtais Áitiúil.
ÁR bhFREAGRACHTAÍ
CEADÚNÚ • Bíonn ceadúnais á n-eisiúint againn i gcomhair na nithe seo
a leanas chun a chinntiú nach mbíonn astuithe uathu ag cur sláinte an phobail ná an comhshaol i mbaol:
• áiseanna dramhaíola (m.sh., líonadh talún, loisceoirí, stáisiúin aistrithe dramhaíola);
• gníomhaíochtaí tionsclaíocha ar scála mór (m.sh., déantúsaíocht cógaisíochta, déantúsaíocht stroighne, stáisiúin chumhachta);
• diantalmhaíocht;
• úsáid faoi shrian agus scaoileadh smachtaithe Orgánach Géinathraithe (GMO);
• mór-áiseanna stórais peitreail.
• scardadh dramhuisce
• dumpáil mara
FEIDHMIÚ COMHSHAOIL NÁISIÚNTA • Stiúradh os cionn 2,000 iniúchadh agus cigireacht de
áiseanna a fuair ceadúnas ón nGníomhaireacht gach bliain.
• Maoirsiú freagrachtaí cosanta comhshaoil údarás áitiúla thar sé earnáil aer, fuaim, dramhaíl, dramhuisce agus caighdeán uisce.
• Obair le húdaráis áitiúla agus leis na Gardaí chun stop a chur le gníomhaíocht mhídhleathach dramhaíola trí comhordú a dhéanamh ar líonra forfheidhmithe náisiúnta, díriú isteach ar chiontóirí, stiúradh fiosrúcháin agus maoirsiú leigheas na bhfadhbanna.
• An dlí a chur orthu siúd a bhriseann dlí comhshaoil agus a dhéanann dochar don chomhshaol mar thoradh ar a ngníomhaíochtaí.
MONATÓIREACHT, ANAILÍS AGUS TUAIRISCIÚ AR AN GCOMHSHAOL • Monatóireacht ar chaighdeán aeir agus caighdeáin
aibhneacha, locha, uiscí taoide agus uiscí talaimh; leibhéil agus sruth aibhneacha a thomhas.
• Tuairisciú neamhspleách chun cabhrú le rialtais náisiúnta agus áitiúla cinntí a dhéanamh.
RIALÚ ASTUITHE GÁIS CEAPTHA TEASA NA HÉIREANN • Cainníochtú astuithe gáis ceaptha teasa na hÉireann i
gcomhthéacs ár dtiomantas Kyoto.
• Cur i bhfeidhm na Treorach um Thrádáil Astuithe, a bhfuil baint aige le hos cionn 100 cuideachta atá ina mór-ghineadóirí dé-ocsaíd charbóin in Éirinn.
TAIGHDE AGUS FORBAIRT COMHSHAOIL • Taighde ar shaincheisteanna comhshaoil a chomhordú (cosúil
le caighdéan aeir agus uisce, athrú aeráide, bithéagsúlacht, teicneolaíochtaí comhshaoil).
MEASÚNÚ STRAITÉISEACH COMHSHAOIL • Ag déanamh measúnú ar thionchar phleananna agus
chláracha ar chomhshaol na hÉireann (cosúil le pleananna bainistíochta dramhaíola agus forbartha).
PLEANÁIL, OIDEACHAS AGUS TREOIR CHOMHSHAOIL • Treoir a thabhairt don phobal agus do thionscal ar cheisteanna
comhshaoil éagsúla (m.sh., iarratais ar cheadúnais, seachaint dramhaíola agus rialacháin chomhshaoil).
• Eolas níos fearr ar an gcomhshaol a scaipeadh (trí cláracha teilifíse comhshaoil agus pacáistí acmhainne do bhunscoileanna agus do mheánscoileanna).
BAINISTÍOCHT DRAMHAÍOLA FHORGHNÍOMHACH • Cur chun cinn seachaint agus laghdú dramhaíola trí
chomhordú An Chláir Náisiúnta um Chosc Dramhaíola, lena n-áirítear cur i bhfeidhm na dTionscnamh Freagrachta Táirgeoirí.
• Cur i bhfeidhm Rialachán ar nós na treoracha maidir le Trealamh Leictreach agus Leictreonach Caite agus le Srianadh Substaintí Guaiseacha agus substaintí a dhéanann ídiú ar an gcrios ózóin.
• Plean Náisiúnta Bainistíochta um Dramhaíl Ghuaiseach a fhorbairt chun dramhaíl ghuaiseach a sheachaint agus a bhainistiú.
STRUCHTÚR NA GNÍOMHAIREACHTA Bunaíodh an Ghníomhaireacht i 1993 chun comhshaol na hÉireann a chosaint. Tá an eagraíocht á bhainistiú ag Bord lánaimseartha, ar a bhfuil Príomhstiúrthóir agus ceithre Stiúrthóir. Tá obair na Gníomhaireachta ar siúl trí ceithre Oifig:
• An Oifig Aeráide, Ceadúnaithe agus Úsáide Acmhainní
• An Oifig um Fhorfheidhmiúchán Comhshaoil
• An Oifig um Measúnacht Comhshaoil
• An Oifig Cumarsáide agus Seirbhísí Corparáide
Tá Coiste Comhairleach ag an nGníomhaireacht le cabhrú léi. Tá dáréag ball air agus tagann siad le chéile cúpla uair in aghaidh na bliana le plé a dhéanamh ar cheisteanna ar ábhar imní iad agus le comhairle a thabhairt don Bhord.

Headquarters and South East Region
Environmental Protection Agency PO Box 3000, Johnstown Castle Estate County Wexford, Ireland
Bosca Poist 3000, Eastát Chaisleán Bhaile Sheáin Contae Loch Garman, Éire
T: +353 53 916 0600 F: +353 53 916 0699
South/South West Region
Inniscarra, County Cork, Ireland
Inis Cara, Contae Chorcaí, Éire
T: +353 21 487 5540 F: +353 21 487 5545
Seville Lodge, Callan Road, Kilkenny.
Lóiste Sevilla, Bóthar Challain, Cill Chainnigh, Éire
T +353 56 779 6700 F +353 56 779 6798
East/North East Region
McCumiskey House, Richview Clonskeagh Road, Dublin 14, Ireland
Teach Mhic Chumascaigh Dea-Radharc, Bóthar Cluain Sceach Baile Átha Cliath 14, Éire
T: +353 1 268 0100 F: +353 1 268 0199
West/North West Region
John Moore Road Castlebar, County Mayo, Ireland
Bóthar Sheán de Mórdha Caisleán an Bharraigh, Contae Mhaigh Eo, Éire
T: +353 94 904 8400 F: +353 94 904 8499
E: [email protected] W: www.epa.ie LoCall: 1890 33 55 99
Printed on environmentally friendly paper stock